
Transcriptome analysis of Pseudomonas aeruginosa PAO1 grown at both body and elevated temperatures
- Published
- Accepted
- Received
- Academic Editor
- Ugo Bastolla
- Subject Areas
- Bioinformatics, Genomics, Microbiology
- Keywords
- Heat shock, RNA sequencing, Pseudomonas aeruginosa PAO1, Transcriptome, Gene expression
- Copyright
- © 2016 Chan et al.
- Licence
- This is an open access article distributed under the terms of the Creative Commons Attribution License, which permits unrestricted use, distribution, reproduction and adaptation in any medium and for any purpose provided that it is properly attributed. For attribution, the original author(s), title, publication source (PeerJ) and either DOI or URL of the article must be cited.
- Cite this article
- 2016. Transcriptome analysis of Pseudomonas aeruginosa PAO1 grown at both body and elevated temperatures. PeerJ 4:e2223 https://doi.org/10.7717/peerj.2223
Abstract
Functional genomics research can give us valuable insights into bacterial gene function. RNA Sequencing (RNA-seq) can generate information on transcript abundance in bacteria following abiotic stress treatments. In this study, we used the RNA-seq technique to study the transcriptomes of the opportunistic nosocomial pathogen Pseudomonas aeruginosa PAO1 following heat shock. Samples were grown at both the human body temperature (37 °C) and an arbitrarily-selected temperature of 46 °C. In this work using RNA-seq, we identified 133 genes that are differentially expressed at 46 °C compared to the human body temperature. Our work identifies some key P. aeruginosa PAO1 genes whose products have importance in both environmental adaptation as well as in vivo infection in febrile hosts. More importantly, our transcriptomic results show that many genes are only expressed when subjected to heat shock. Because the RNA-seq can generate high throughput gene expression profiles, our work reveals many unanticipated genes with further work to be done exploring such genes products.
Introduction
Pseudomonas aeruginosa is an opportunistic nosocomial pathogen which is a threat to public health (Lyczak, Cannon & Pier, 2000). Its success as a pathogen is due to being well adapted to changes in environmental factors (Cheng et al., 2014; Livermore, 2002). Due to this versatility, its virulence determinants and host factors P. aeruginosa is the known causal agent in a myriad of human diseases (Cheng et al., 2014).
P. aeruginosa has previously been shown to thrive in hostile environments and has a rapid response and adaptation to abiotic stresses such as elevated and reduced temperature (Farrell & Rose, 1968; Schurr et al., 1995). This rapid adaptation of P. aeruginosa is accompanied by changes in its genomic regulatory network modulating the global expression and activities of genes essential for their survival (Burrowes et al., 2006; Schuster et al., 2003). In one of the earliest studies conducted on heat shock response of P. aeruginosa, it was observed that the syntheses of 17 proteins was enhanced following the transfer of cells from 30 to 45 °C (Allan et al., 1988). It was later discovered that the principle sigma factor, σ, encoded by rpoDA, was among the proteins expressed upon elevation of temperature from 30 to 42 °C (Fujita et al., 1993). Furthermore, the synthesis of rpoH and groEL mRNA are also induced following heat shock, suggesting that the transcription of these genes is regulated by heat shock RNA polymerases as well as by the principle RNA polymerase. The findings were further supported by the discovery of sequences for the polymerases in the upstream promoter region of the genes (Fujita et al., 1993; Fujita, Amemura & Aramaki, 1998). When bacterial cells are exposed to elevated temperatures, the transcription shifts from σ70 to σ32. This enables the RNA polymerases to recognise the heat shock genes which are crucial for its adaptation in the drastic change in the surrounding environment (Straus, Walter & Gross, 1990).
A more recent study carried out on P. aeruginosa isolated from cystic fibrosis (CF) patients small heat shock proteins (sHSPs), namely Hp25 and Hp18, were discovered. These sHSPs were highly expressed under both standard laboratory conditions and conditions that mimicked the sputum-like environment of the CF patients. The authors suggest that the discovery of the sHSPs in both conditions was due to the proteins acting as molecular chaperones helping with the adaptability of P. aeruginosa to diverse environments (Sriramulu, 2009). Under stressful conditions, these sHSPs interact with affected proteins, preventing their aggregation, with the process continuing with the aid of chaperone proteins (Wang & Spector, 2000).
In order to understand the heat shock response of Pseudomonas, several studies on other species in the Pseudomonas genus have been carried out. A study conducted on Pseudomonas syringae shows that the expression of dnaK increased significantly when cells that were initially incubated at 18 °C were transferred to 35 °C. However, the results indicated that although P. syringae responded by producing DnaK, it did not help in adjusting to the gradual change to an elevated temperature (Keith, Partridge & Bender, 1999). In another study in Pseudomonas putida KT2442, the role of several molecular chaperones, namely ClpB, DnaJ, CbpA, and DjlA, were elucidated. The increase in the expression heat shock proteins (Hsps) mentioned was not significant when transferred from 30 to 33 °C. However, when shifted to 35 °C the expression of the DnaJ, GroEL, HtpG, and ClpB was increased. At larger temperature shifts up to 42 °C, expression of these Hsps was increased further. At a more elevated temperature of 45 °C, expression of DnaK, GroEL, and HtpG increased only during the first 10 min while the expression of ClpB continued to increase (Ito et al., 2014).
Next Generation sequencing (NGS) has been proven to be an invaluable technology to study bacteria genomes (Chan, Yin & Lim, 2014; Chan et al., 2013; Chan et al., 2012; Forde et al., 2014; Lau, Yin & Chan, 2014; Tan, Yin & Chan, 2014). In particular RNA-seq can provide a complete coverage of protein-coding genes, intergenic regions and non-coding RNA and small, regulatory RNA populations in a given genome (Wang, Gerstein & Snyder, 2009). Over the past decade, the heat stress responses of other Pseudomonas species have been extensively studied. Not much work has been done to investigate the transcriptional response of P. aeruginosa PAO1 to elevated temperature using NGS methodologies. To address this, we have used the RNA-seq technique to look at changes in the transcriptome of P. aeruginosa PAO1 exposed to heat shock. Previous heat shock studies have shown that a temperature difference of at least 15 °C between the normal and elevated growth temperature provides the best information (Ito et al., 2014). With reference to that study, we chose to grow P. aeruginosa PAO1 at 37 and 46 °C.
Materials and Methods
Culture conditions and growth study
Growth of P. aeruginosa PAO1 was determined at 37 and 46 °C. Briefly, P. aeruginosa PAO1 was cultured for 18 h at 37 °C. The overnight grown culture was adjusted to OD600 of 0.01. Aliquots of cells (200 μL) were then dispensed into wells of a sterile 96-well microtitre plate (Priya, Yin & Chan, 2013; Tan, Yin & Chan, 2013) and incubated at 37 and 46 °C, respectively. The OD600 was measured at intervals of 4 h for 24 h using a microplate reader (Tecan Infinite M200, Mannerdorf, Switzerland). The growth of P. aeruginosa at 37 and 46 °C was also determined by looking at its colony forming unit (CFU). The CFU count at the stipulated temperature was determined at desired time points. Briefly, 100 μL of the cultures grown at 37 and 46 °C were serially diluted and 100 μL diluted cultures were plated on Luria-Bertani Agar (LB). The plates were incubated at 37 °C for 18 h before the determination of CFU per mL.
Heat shock treatment of P. aeruginosa PAO1
P. aeruginosa PAO1 cells were taken from −80 °C stock cultures and grown on LB agar in order to obtain pure colonies. These were subsequently inoculated into fresh sterile LB broth for 18 h at 37 °C with shaking at 220 rpm. Overnight seed cultures were then sub-cultured (1 mL) into 100 mL of fresh, sterile LB broth and grown to mid-exponential phase (OD600 = 0.5) at 37 °C. The 10 mL of culture was then transferred into sterile tube (50 mL volume tube) pre-warmed at 37 and 46 °C, respectively, and immediately exposed to heat shock for 30 min (with shaking) by incubating in water baths pre-heated to 37 and 46 °C, respectively. This was followed immediately by RNA extraction. Experiments were performed in triplicate.
RNA extraction and cDNA synthesis
Total RNA was extracted using MasterPure™ RNA Purification Kit (Epicentre, WI, USA) as per the manufacturer’s instructions. Precipitated RNA samples were resuspended in sterile RNase-free water. Purity of RNA samples was assessed using a NanoDrop 2000 Spectrophotometer (Thermo Scientific, MA, USA) and only samples with A260/A280 and A260/A230 values > 2.0 were chosen for further work. The quality of the extracted RNA samples was also determined using an Agilent Bioanalyzer-RNA 6000 Pico Kit (Agilent Technologies, CA, USA). RNA samples with RNA Integrity Numbers (RIN) of value > 7.5 were chosen for rRNA depletion using Ribo-Zero™ rRNA Removal Kits (Bacteria) (Epicentre, WI, USA) prior to cDNA synthesis. Samples were then checked for the loss of intact rRNA using Agilent Bioanalyzer. Synthesis of cDNA was performed using the protocols of ScriptSeq™ v2 RNA-seq Library Preparation Kit (Epicentre, WI, USA). The quality of the RNA-seq cDNA library was confirmed using Agilent Bioanalyzer-High Sensitivity DNA Chip.
cDNA library preparation and RNA-seq
Quantification of the RNA-seq transcriptome library was performed using a Qubit® dsDNA High Sensitivity (HS) Assay Kit (Life Technologies, CA, USA) and normalised to a concentration of 4 nM. Normalised samples were denatured with 0.2 N NaOH and diluted 20 pM using pre-chilled Hybridisation Buffer (HT1) (Illumina, CA, USA). The 20 pM transcriptome libraries were further diluted to 10 pM with pre-chilled HT1 buffer and combined with 1% denatured and diluted PhiX control prior to sequencing using MiSeq platform.
All resulting nucleotide sequence accession number is available in public databases. The DNA sequences from this transcriptomics project has been deposited at Sequence Read Archive (NCBI/SRA) under the accession number SRP066875. The transcriptome data have been deposited in BioProject in GenBank via Bioproject number PRJNA304652.
Validation of RNA-seq using real time-PCR (RT-PCR)
RT-PCR was performed to quantify and validate the level of P. aeruginosa PAO1 gene expression that were affected when exposed to an elevated temperature. P. aeruginosa PAO1 cells were subjected to heat shock and their RNA was extracted once again as an independent experiment to determine the reproducibility of the data. One microgram of RNA was reverse transcribed into cDNA using the QuantiTect Reverse Transcription Kit (Qiagen, USA). For the quantitative RT-PCR, the amplification was performed using the KAPA SYBR® FAST qPCR Kit Master Mix Universal (Kapa Biosystems, USA) on the Bio-Rad CFX96 real-time system (Bio-Rad, CA, USA). Genes from the upregulated and downregulated gene list obtained from RNA-seq result were selected and the primers for the genes were designed using Primer 3 version 0.4.0 (http://bioinfo.ut.ee/primer3-0.4.0/). The RT-PCR condition used was as follows: initial denaturation at 95 °C for 3 min, followed by a 40 cycles of denaturation at 95 °C for 3 s and annealing/extension at 55.7 °C for 30 s. The fluorescent signals were quantified at the end of each cycle. Data obtained were analysed using the Bio-Rad CFX Manager™ Software version 1.6. Reference genes with expression stability values (M value) of less than 0.7 were selected as reference genes for normalisation. The selected reference genes were cheZ, proC, recA, rpoB, gyrB, oprL, and plsY (Matthijs et al., 2013; Savli et al., 2003). Upregulated genes: clpB, dnaJ, dnaK and grpE and downregulated genes: tssG1, hsiC2 and pilA were selected.
Differential expression analysis
RNA-seq read quality assessment was done using FastQC (version 0.11.2) (Andrews, 2010; Babraham Bioinformatics, Cambridge, UK). The dataset was analyzed using tuxedo suite protocol for differential gene expression analysis (Trapnell et al., 2012). Tophat (version 2.0.11) was used to align the paired end reads against P. aeruginosa PAO1 reference genome (GenBank accession number AE004091). Cuffdiff2 (version 2.2.0), one of the subprograms in cufflinks package was used for differential expression purpose (p corrected value/q ≤ 0.05) [18]. Fold change of the expression profile was measured using log2 FPKM (Fragments per Kilobase of transcript per Million mapped reads). For QC and generation of plots expression, we used Volcano, Box, Scv, Density, Scatter plot, PCA and heat map as available in the R package cummeRbund (version 2.6.1) based on output from cuffdiff2. For RNA-seq analysis, the total number of reads per gene between samples was normalized using FPKM (Trapnell et al., 2010).
Results
Survival studies
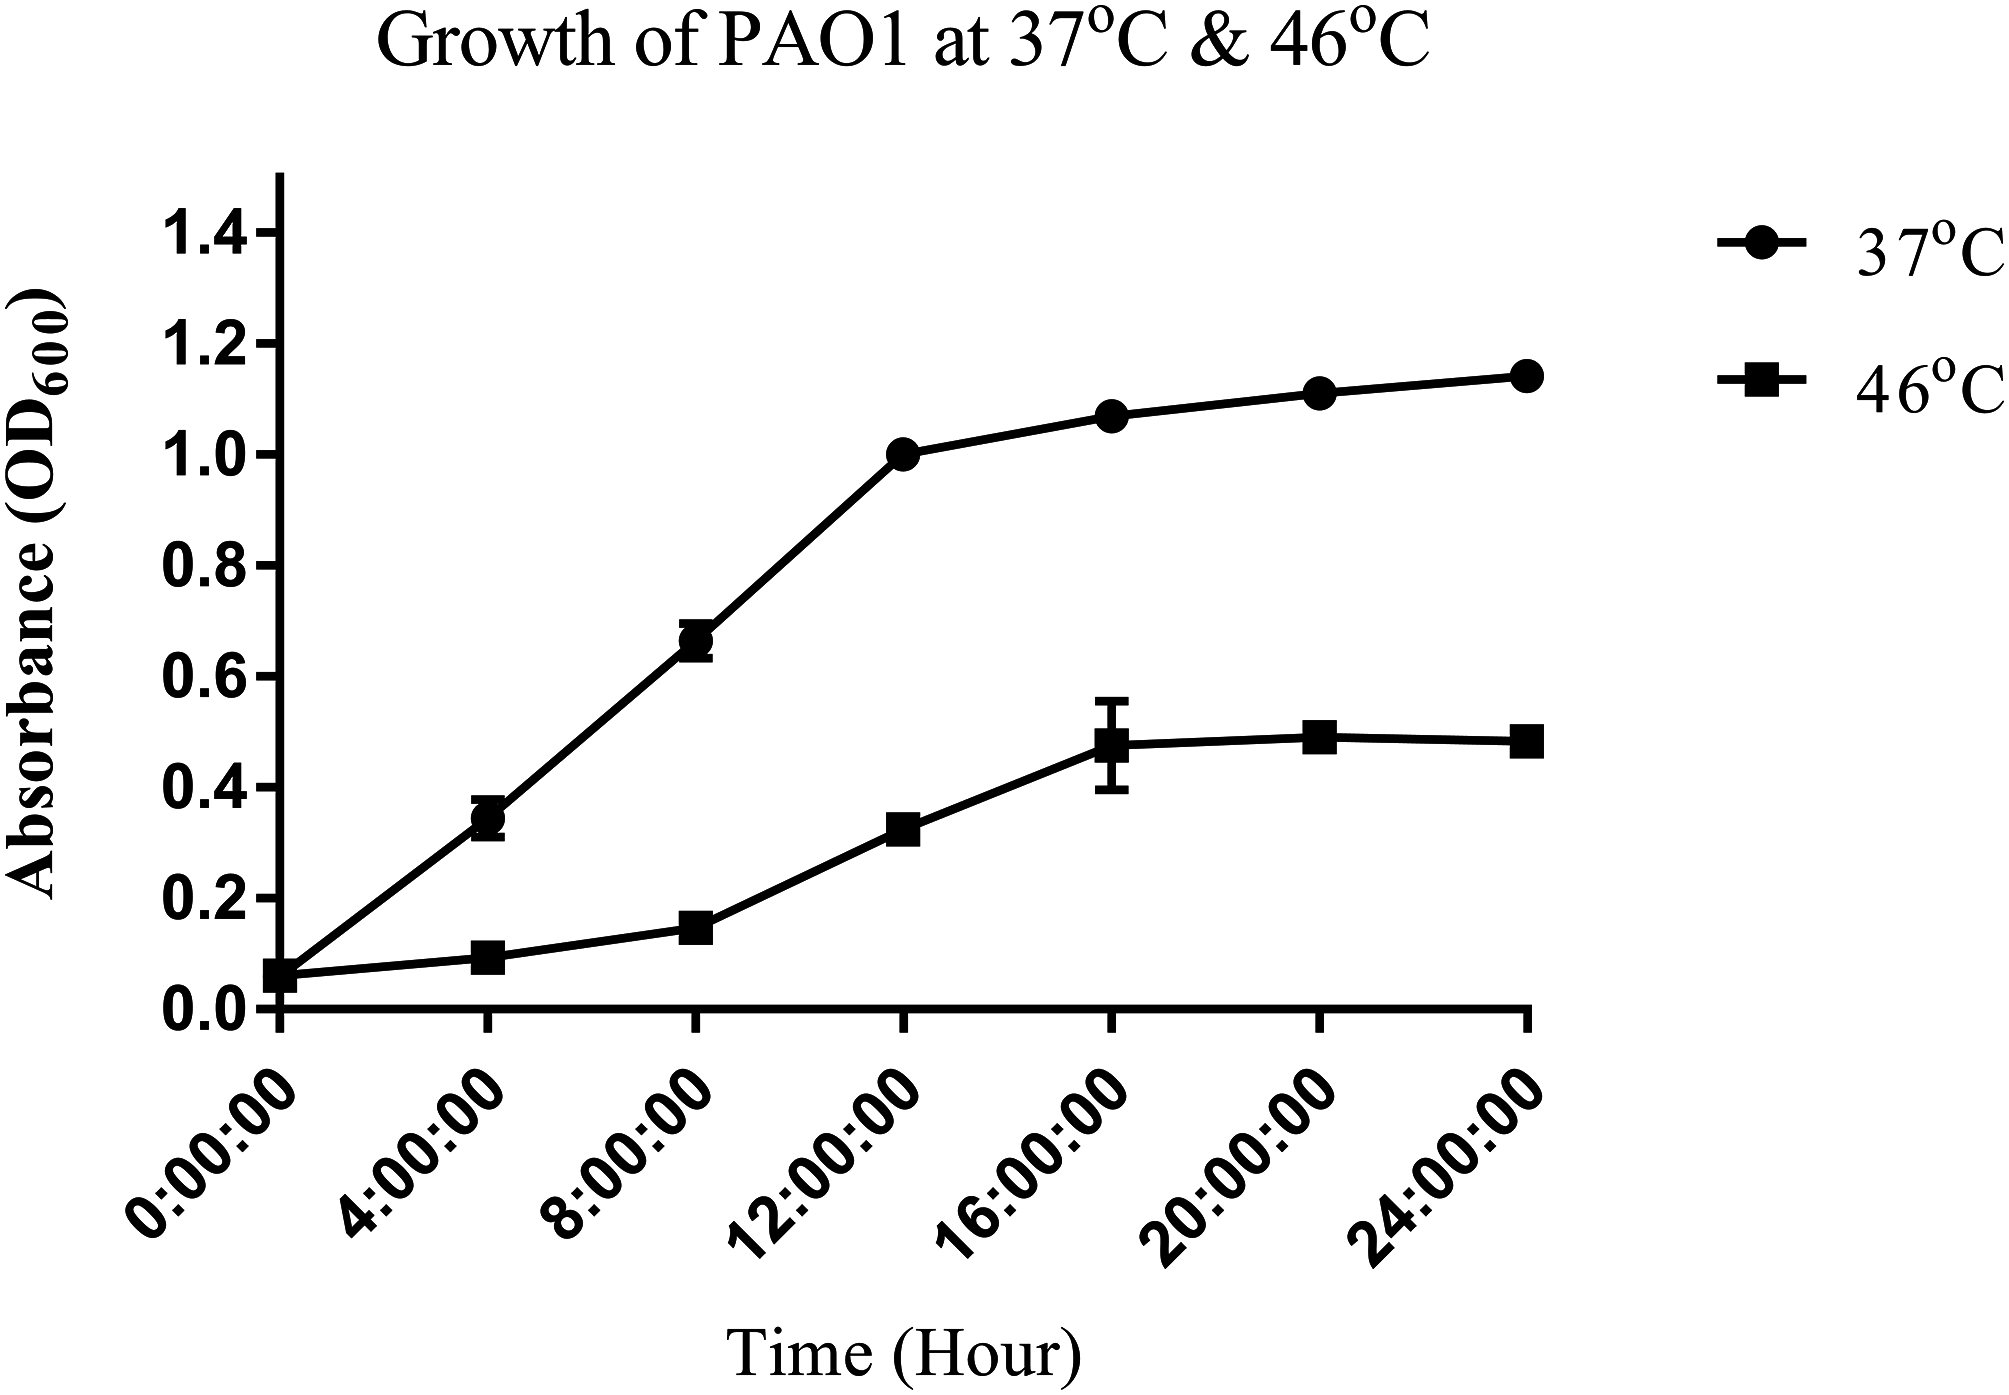
To study the heat shock response of the nosocomial pathogen P. aeruginosa PAO1, we first determined the growth of P. aeruginosa PAO1 at 37 and 46 °C (Fig. 1). Growth curve studies revealed that P. aeruginosa PAO1 could adapt to temperature at 46 °C (Fig. 1). Following a 30 min heat shock, the CFU count for P. aeruginosa PAO1 at 37 and 46 °C were 1.37 × 10⁸ and 1.33 × 10⁸, respectively. The growth rate of P. aeruginosa PAO1 grown at 37 and 46 °C declined over 24 h and it appears that 46 °C has adverse effect on the growth of P. aeruginosa PAO1 (Table 1).
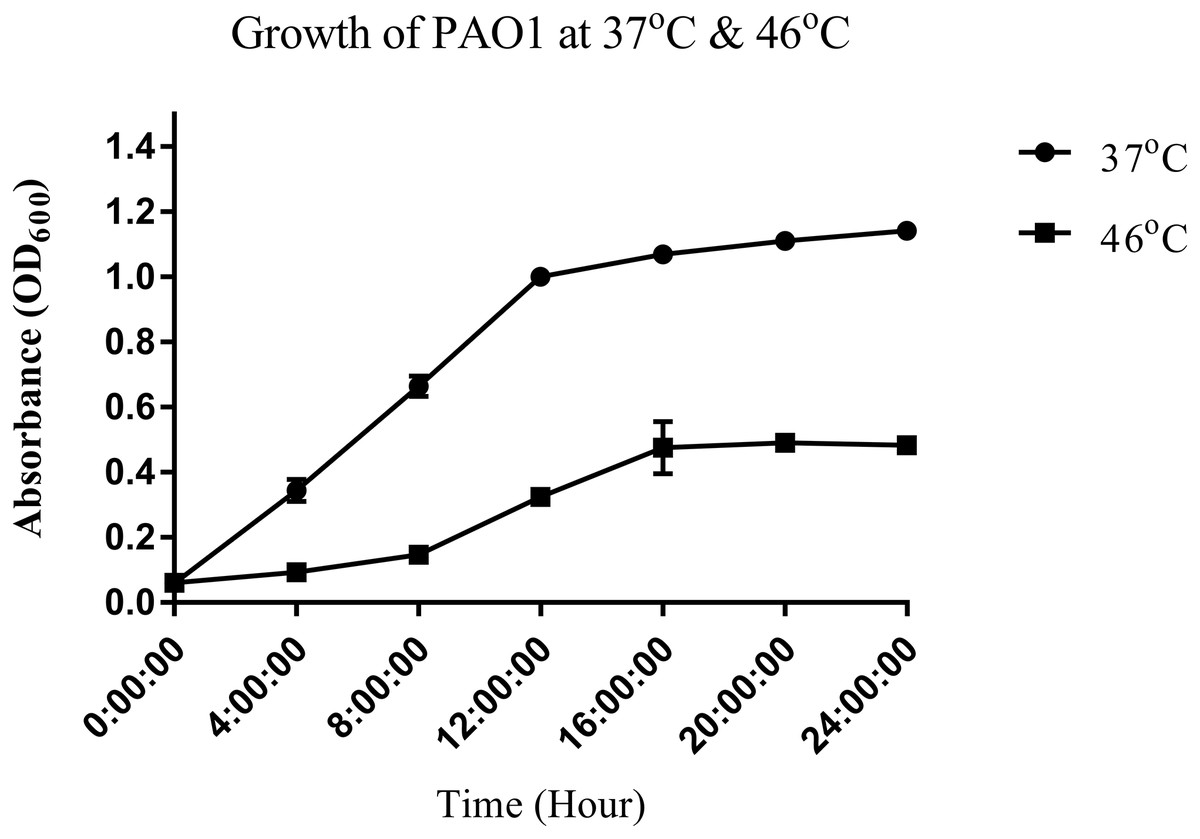
Figure 1: Growth curve of P. aeruginosa PAO1 incubated at 37 °C (circle) and 46 °C (square).
| Time (h) | 37 °C (CFU/mL) | 46 °C (CFU/mL) |
|---|---|---|
| 6 | 7.43 ± 0.78 × 10⁶ | 7.90 ± 0.71 × 10⁴ |
| 12 | 1.32 ± 0.08 × 10⁹ | 1.08 ± 0.11 × 10⁵ |
| 18 | 1.76 ± 0.05 × 10⁹ | 2.03 ± 0.05 × 10⁵ |
| 24 | 2.19 ± 0.17 × 10⁹ | 2.52 ± 0.28 × 10⁵ |
In order to understand the cellular response of P. aeruginosa PAO1 to heat shock, we utilised an RNA-seq approach to study transcriptome changes. Experiments were carried out in triplicate with cells grown at 37 °C followed by heat shock at 46 °C for 30 min. More than 90% of all trimmed RNA-seq reads aligned to coding regions of the P. aeruginosa genome (Table 2). Overall expression levels in the triplicate samples of both control and heat shock samples were similar to each other (Fig. 2). The significant level whether it is highly similar is made based on figures generated with p corrected value ≤ 0.05. The RNA-seq data obtained therefore have sufficient quality for further transcriptome analysis.
| Label | Total reads | Overall read mapping rate |
|---|---|---|
| Control_1 | 5,220,526 | 91.00% |
| Control_2 | 4,203,880 | 91.30% |
| Control_3 | 2,989,148 | 92.20% |
| Heat_1 | 4,537,188 | 89.90% |
| Heat_2 | 4,613,056 | 90.20% |
| Heat_3 | 7,639,516 | 90.80% |
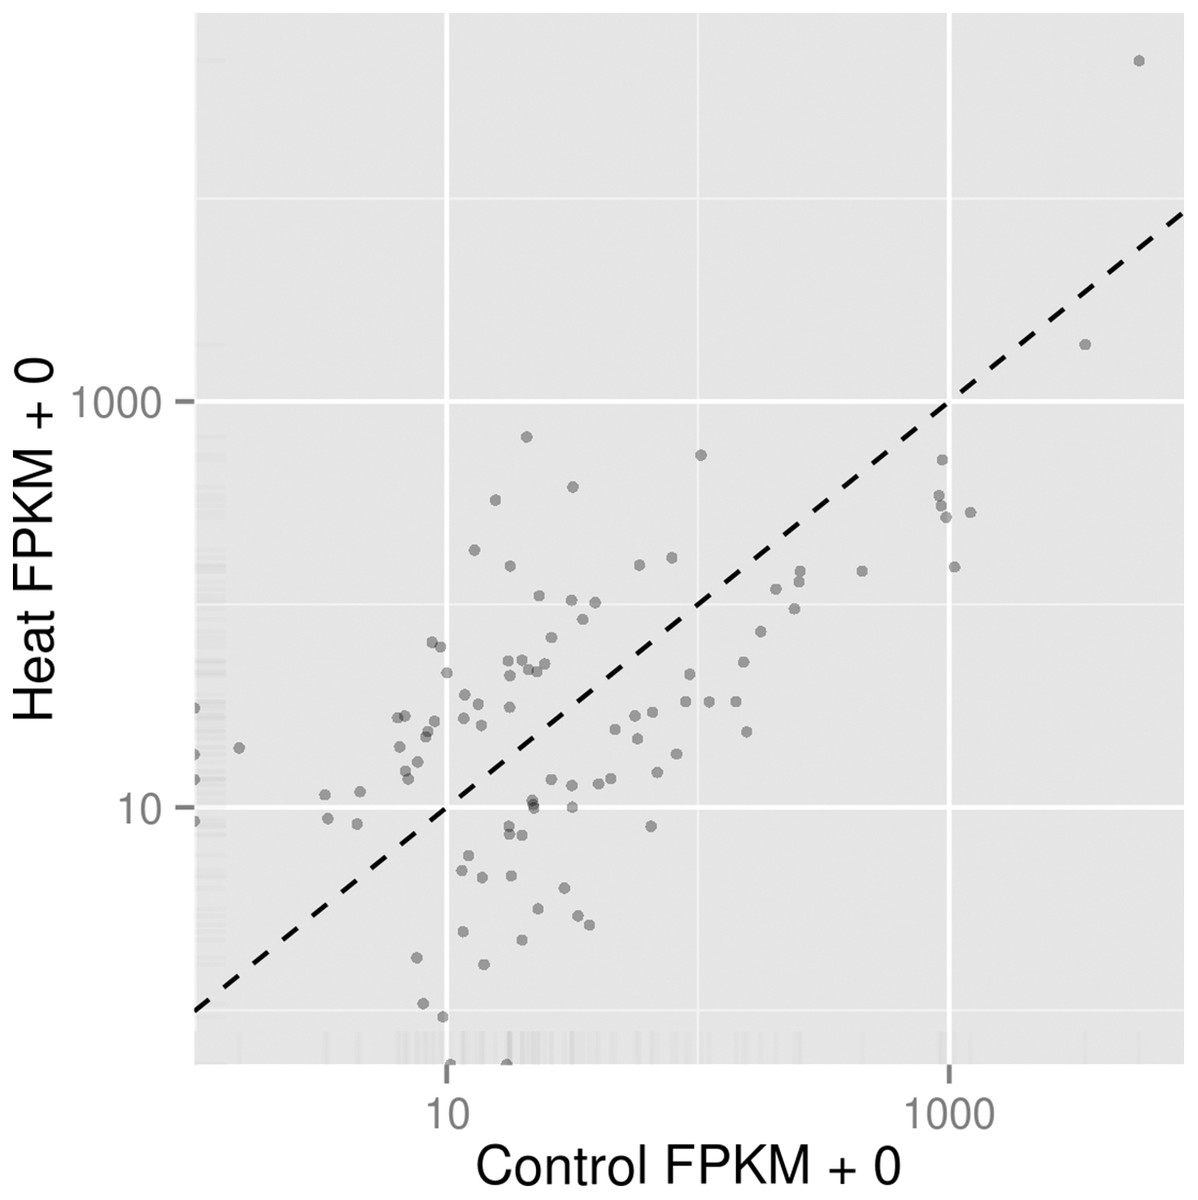
Figure 2: Comparison of significant gene expression between P. aeruginosa PAO1 samples with (Heat) and without heat shock (Control).
The significant level whether it is highly similar is made based on figures generated with p corrected value ≤ 0.05.
Further analysis among the triplicates of each heat treatment experiments at 37 and 46 °C showed that the RNA-seq datasets from similar treatments clustered together, as depicted in the PCA plot (Fig. 3). The significant level whether it is clear profile separation is made based on figures generated with p corrected value ≤ 0.05. This indicates that experimental replication was good and there was little variation among the triplicates of the same treatment.
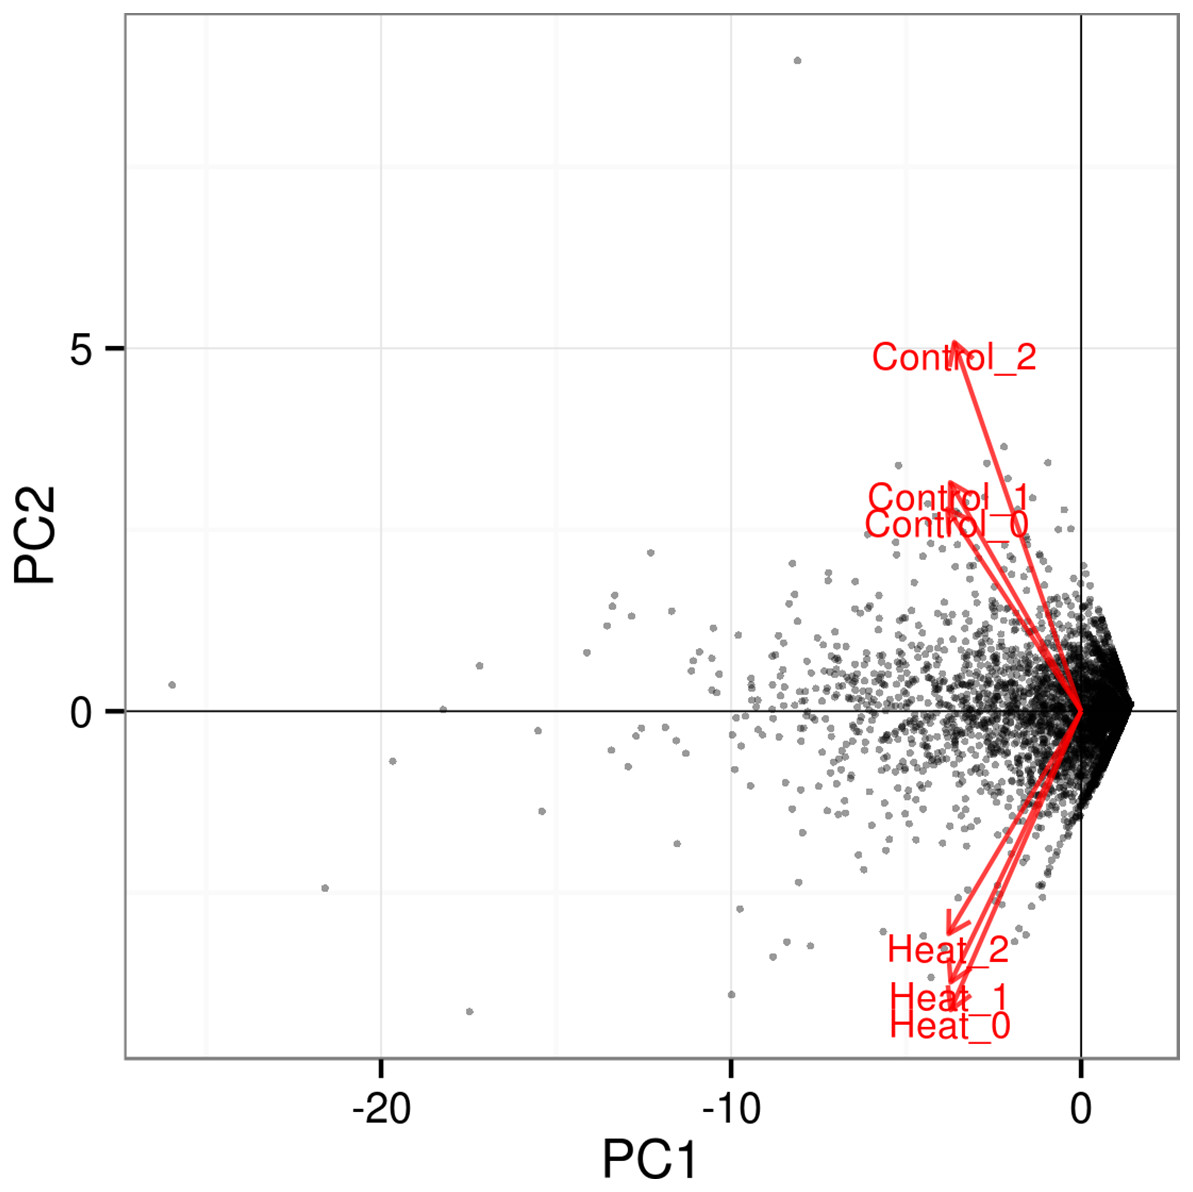
Figure 3: PCA plot for triplicates of each heat treatment.
All three samples of each heat treatment, 37 and 46 °C are clustered together, indicating good replication among samples. The significant level whether it is a clear profile separation is made based on figures generated with p corrected value ≤ 0.05.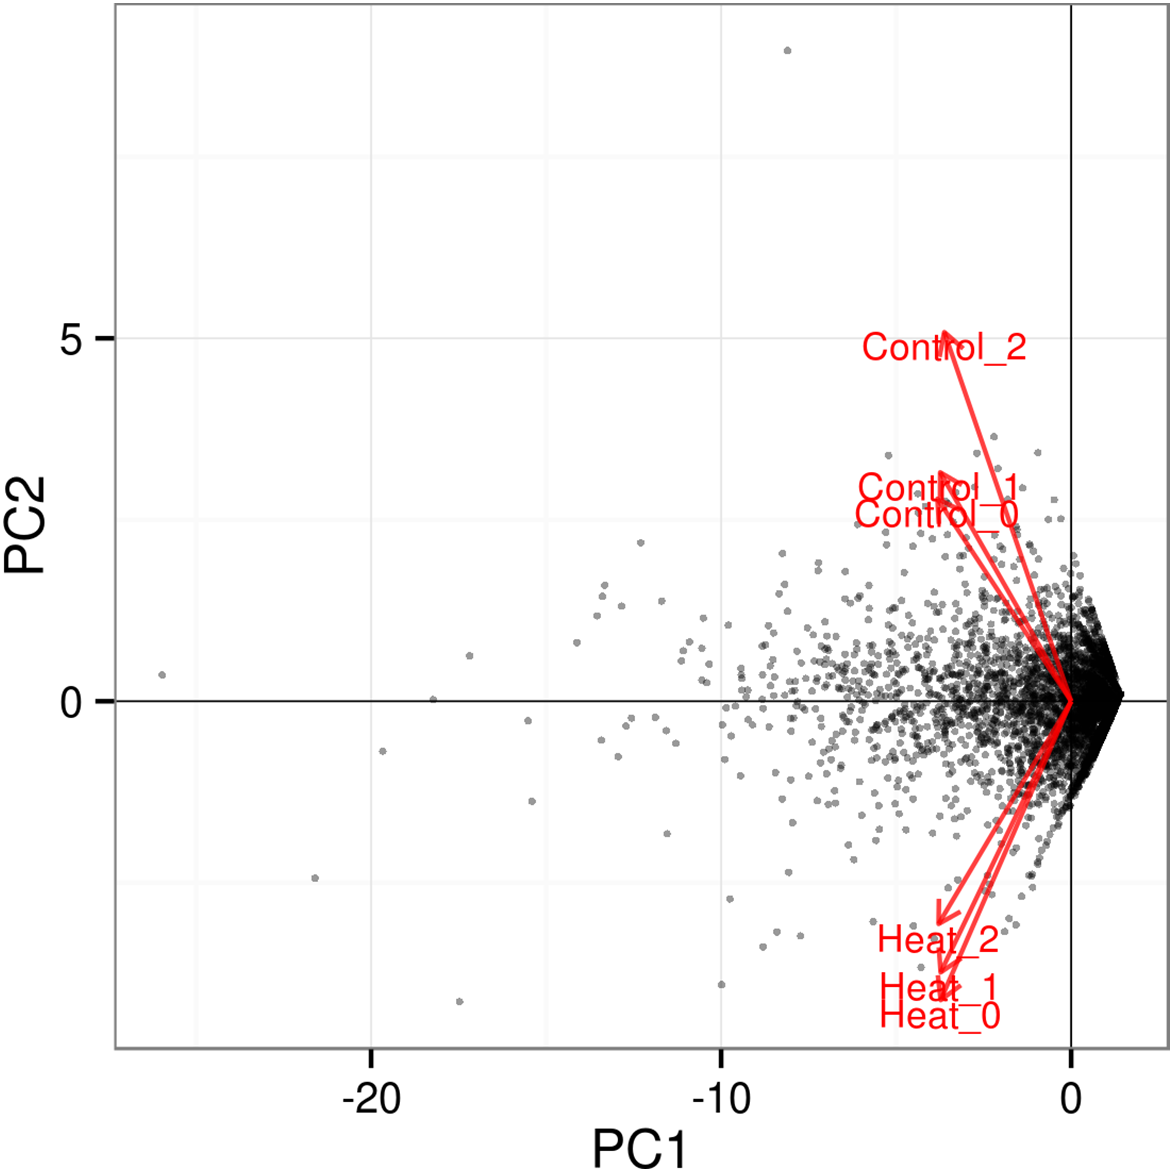
In total 133 genes were significantly differentially expressed when P. aeruginosa PAO1 cells were grown under heat shock at 46 °C (Data S1). Tables 3 and 4 show the list of the significant up- and downregulated genes with a cut-off value of q < 0.05. The volcano plot (Fig. 4) indicates the genes affected by the heat shock at 46 °C. The red dots in the volcano plot represents the 133 significant genes (q ≤ 0.05) while the black dots represent 5,545 non-significant genes.
| Gene ID | Gene name | Value 1 | Value 2 | log2 (fold change) | Test statistics | p value | q value |
|---|---|---|---|---|---|---|---|
| gene4634 | clpB | 21.5321 | 641.183 | 4.89618 | 10.3745 | 5e-05 | 0.00069884 |
| gene791 | asrA | 16.2477 | 308.424 | 4.24661 | 8.52567 | 5e-05 | 0.00069884 |
| gene4562 | PA4474 | 1.57511 | 19.704 | 3.64497 | 3.83695 | 0.00325 | 0.0224511 |
| gene4873 | dnaK | 31.4943 | 360.251 | 3.51584 | 7.06391 | 5e-05 | 0.00069884 |
| gene4874 | grpE | 16.8391 | 184.341 | 3.45249 | 5.52579 | 5e-05 | 0.00069884 |
| gene583 | dnaG | 4.13693 | 35.1505 | 3.08691 | 5.14367 | 5e-05 | 0.00069884 |
| gene4872 | dnaJ | 18.0378 | 149.49 | 3.05095 | 5.85741 | 5e-05 | 0.00069884 |
| gene4983 | PA4870 | 6.29367 | 50.96 | 3.01739 | 2.55899 | 0.0056 | 0.0323615 |
| gene1625 | htpG | 8.62707 | 61.2625 | 2.82806 | 5.19305 | 5e-05 | 0.00069884 |
| gene4871 | dapB | 1.20712 | 8.33066 | 2.78687 | 1.4514 | 0.00925 | 0.0448327 |
| gene920 | rsmA | 3626.1 | 22,913.4 | 2.6597 | 5.64019 | 5e-05 | 0.00069884 |
| gene5125 | waaG | 1.80622 | 10.3941 | 2.52472 | 2.08787 | 0.0063 | 0.0346941 |
| gene1439 | PA1414 | 8.59171 | 47.2851 | 2.46037 | 2.24087 | 0.00385 | 0.0247286 |
| gene5168 | hslV | 6.10316 | 32.0818 | 2.39413 | 2.24884 | 0.00475 | 0.0282649 |
| gene4470 | groEL | 100.754 | 519.342 | 2.36584 | 4.78994 | 5e-05 | 0.00069884 |
| gene582 | rpoD | 23.8147 | 118.195 | 2.31124 | 4.5964 | 5e-05 | 0.00069884 |
| gene4132 | PA4061 | 8.92965 | 42.6481 | 2.25581 | 3.53421 | 5e-05 | 0.00069884 |
| gene3889 | PA3819 | 12.7016 | 59.714 | 2.23305 | 3.08932 | 0.0001 | 0.00130652 |
| gene5058 | PA4943 | 6.4703 | 27.5441 | 2.08984 | 3.39868 | 5e-05 | 0.00069884 |
| gene775 | mucA | 31.219 | 126.381 | 2.01728 | 3.61801 | 5e-05 | 0.00069884 |
| gene3881 | hscB | 6.52321 | 25.7193 | 1.9792 | 2.02124 | 0.00635 | 0.0346941 |
| gene5169 | hslU | 6.96398 | 26.8164 | 1.94513 | 3.28447 | 5e-05 | 0.00069884 |
| gene2624 | gacA | 6.74877 | 21.7267 | 1.68678 | 2.04244 | 0.00395 | 0.0247286 |
| gene672 | tyrZ | 12.4244 | 39.5589 | 1.67082 | 2.95304 | 5e-05 | 0.00069884 |
| gene1839 | lon | 32.829 | 101.139 | 1.6233 | 3.26832 | 5e-05 | 0.00069884 |
| gene1803 | cmaX | 3.33028 | 10.2239 | 1.61823 | 1.72921 | 0.00745 | 0.0385256 |
| gene5020 | PA4907 | 9.76191 | 26.8597 | 1.46021 | 2.09157 | 0.0021 | 0.0159759 |
| gene5057 | hflK | 17.8262 | 48.4164 | 1.4415 | 2.40358 | 0.00015 | 0.001803 |
| gene3216 | PA3157 | 9.87412 | 26.4346 | 1.4207 | 2.17387 | 0.00065 | 0.00630081 |
| gene1838 | clpX | 55.3485 | 145.186 | 1.39129 | 2.83085 | 5e-05 | 0.00069884 |
| gene1119 | fleQ | 4.1866 | 10.8754 | 1.37722 | 2.0293 | 0.00275 | 0.0196756 |
| gene379 | rpoH | 16.6811 | 41.6596 | 1.32043 | 2.35423 | 0.00015 | 0.001803 |
| gene1202 | oprH | 40.6783 | 99.4149 | 1.2892 | 2.48325 | 5e-05 | 0.00069884 |
| gene846 | PA0833 | 8.50343 | 20.6183 | 1.27781 | 1.71387 | 0.00785 | 0.0396458 |
| gene5120 | PA5005 | 5.17934 | 12.4491 | 1.2652 | 1.94415 | 0.0015 | 0.01202 |
| gene4832 | cbrB | 3.4025 | 8.14844 | 1.25993 | 1.6656 | 0.0091 | 0.0444642 |
| gene770 | PA0758 | 8.55784 | 20.1953 | 1.2387 | 1.80381 | 0.0042 | 0.0257571 |
| gene2622 | pgsA | 12.2261 | 28.4189 | 1.21689 | 1.6504 | 0.01045 | 0.049066 |
| gene3062 | topA | 8.7912 | 20.359 | 1.21153 | 2.36625 | 5e-05 | 0.00069884 |
| gene1075 | PA1053 | 41.8306 | 93.3374 | 1.15789 | 2.02782 | 0.00105 | 0.00970846 |
| gene2772 | PA2735 | 30.8456 | 66.7609 | 1.11394 | 2.22459 | 0.0002 | 0.00231154 |
| gene5358 | rho | 12.316 | 26.3594 | 1.09778 | 2.00644 | 0.00085 | 0.00810873 |
| gene4882 | lldP | 4.00184 | 8.55432 | 1.09599 | 1.60525 | 0.00815 | 0.0408179 |
| gene5562 | PA5436 | 7.08683 | 14.5432 | 1.03713 | 1.71082 | 0.00505 | 0.0294665 |
| gene3027 | rne | 24.3393 | 49.8051 | 1.03301 | 2.10105 | 0.00025 | 0.00268304 |
| gene3884 | iscS | 24.603 | 48.5117 | 0.9795 | 1.92781 | 0.00175 | 0.0136591 |
| gene4784 | hitA | 10.4753 | 20.2269 | 0.949286 | 1.53913 | 0.00885 | 0.0435971 |
| gene727 | PA0716 | 82.3112 | 157.32 | 0.934543 | 1.88924 | 0.0009 | 0.00845156 |
| gene1554 | zipA | 24.8322 | 45.7464 | 0.881446 | 1.65677 | 0.0039 | 0.0247286 |
| gene3946 | narG | 4.40154 | 8.07275 | 0.875052 | 1.61398 | 0.0061 | 0.0345435 |
| gene4349 | nusG | 33.143 | 60.2758 | 0.862876 | 1.51907 | 0.01085 | 0.0497775 |
| gene5050 | rnr | 7.88061 | 13.4832 | 0.774781 | 1.48185 | 0.01055 | 0.0491516 |
| gene4862 | ftsH | 18.7479 | 30.9454 | 0.722993 | 1.46642 | 0.00975 | 0.046506 |
| gene2520 | PA2486 | 0 | 14.7402 | inf | -nan | 0.00145 | 0.0119377 |
| gene4941 | PA4828 | 0 | 12.6143 | inf | -nan | 5e-05 | 0.00069884 |
Note:
inf, not define; -nan, not available.
| Gene ID | Gene name | Value 1 | Value 2 | log2 (fold change) | Test statistics | p value | q value |
|---|---|---|---|---|---|---|---|
| gene1688 | hsiC2 | 22.6564 | 0.992143 | −4.51323 | −4.66897 | 0.0091 | 0.0463781 |
| gene1117 | PA1095 | 129.204 | 7.21324 | −4.16286 | −3.14279 | 0.00265 | 0.0191886 |
| gene4346 | PA4272.1 | 890.17 | 76.9649 | −3.53181 | −3.9605 | 5.00E-05 | 0.00069884 |
| gene3798 | PA3729 | 35.579 | 3.10911 | −3.51645 | −5.52012 | 5.00E-05 | 0.00069884 |
| gene1686 | hsiA2 | 19.5494 | 2.11828 | −3.20616 | −3.53665 | 0.0001 | 0.00130652 |
| gene3555 | tli5 | 72.136 | 8.88402 | −3.02143 | −5.06997 | 5.00E-05 | 0.00069884 |
| gene5286 | arcD | 399.882 | 49.9991 | −2.9996 | −4.93225 | 5.00E-05 | 0.00069884 |
| gene2724 | vgrG4 | 13.6866 | 1.84111 | −2.89412 | −3.80312 | 5.00E-05 | 0.00069884 |
| gene96 | PA0095 | 8.16707 | 1.10164 | −2.89017 | −2.76659 | 0.00135 | 0.0114275 |
| gene982 | dps | 142.736 | 19.455 | −2.87514 | −4.35522 | 5.00E-05 | 0.00069884 |
| gene4614 | pilA | 49.0763 | 6.75242 | −2.86155 | −2.53313 | 0.01025 | 0.0485059 |
| gene85 | tssC1 | 24.7043 | 3.69094 | −2.7427 | −4.03767 | 5.00E-05 | 0.00069884 |
| gene3101 | rmf | 78.8232 | 12.3991 | −2.66838 | −1.41941 | 0.0094 | 0.0451952 |
| gene100 | PA0099 | 29.7865 | 4.74403 | −2.65048 | −3.77489 | 5.00E-05 | 0.00069884 |
| gene5140 | metY | 10.9322 | 1.89052 | −2.53173 | −2.42142 | 0.00025 | 0.00268304 |
| gene4330 | rplV | 73.7324 | 13.723 | −2.4257 | −2.23755 | 0.0036 | 0.0243101 |
| gene568 | PA0563 | 74.2912 | 14.1381 | −2.39361 | −2.52297 | 0.00425 | 0.0258005 |
| gene4663 | PA4571 | 13.6487 | 2.62789 | −2.37679 | −3.4702 | 5.00E-05 | 0.00069884 |
| gene4324 | rplX | 126.547 | 24.3781 | −2.37602 | −2.89574 | 0.0001 | 0.00130652 |
| gene4331 | rpsS | 993.38 | 192.891 | −2.36456 | −3.71984 | 5.00E-05 | 0.00069884 |
| gene5030 | PA4917 | 16.1805 | 3.2644 | −2.30937 | −1.6795 | 0.0033 | 0.0225375 |
| gene1784 | cysB | 63.673 | 13.7047 | −2.21601 | −3.32536 | 5.00E-05 | 0.00069884 |
| gene3692 | PA3623 | 14.5214 | 3.13913 | −2.20975 | −2.07658 | 0.0063 | 0.0346941 |
| gene4615 | pilB | 7.14771 | 1.56705 | −2.18943 | −2.087 | 0.0085 | 0.042219 |
| gene5048 | rpsF | 48.1814 | 10.7881 | −2.15903 | −2.29553 | 0.00685 | 0.0367576 |
| gene90 | tssG1 | 2.89407 | 0.709339 | −2.02855 | −2.53313 | 0.01025 | 0.0485059 |
| gene1091 | PA1069 | 7.53594 | 1.91221 | −1.97854 | −2.60782 | 0.00025 | 0.00268304 |
| gene4828 | dksA | 933.27 | 242.762 | −1.94275 | −3.83989 | 5.00E-05 | 0.00069884 |
| gene1394 | PA1369 | 104.664 | 30.1285 | −1.79656 | −3.47606 | 5.00E-05 | 0.00069884 |
| gene4551 | PA4463 | 768.625 | 225.296 | −1.77046 | −3.50993 | 5.00E-05 | 0.00069884 |
| gene1586 | ccoN2 | 14.3183 | 4.55088 | −1.65364 | −2.45509 | 0.00045 | 0.0045839 |
| gene1583 | ccoP2 | 16.7355 | 5.37344 | −1.63899 | −2.09732 | 0.0037 | 0.0247078 |
| gene5683 | atpH | 37.3157 | 12.1271 | −1.62154 | −2.24178 | 0.0014 | 0.0116861 |
| gene411 | pilG | 43.3645 | 14.2223 | −1.60836 | −1.88132 | 0.0048 | 0.0282824 |
| gene5288 | arcB | 458.603 | 150.822 | −1.6044 | −3.12551 | 5.00E-05 | 0.00069884 |
| gene1004 | pyoS5 | 52.8453 | 17.5083 | −1.59374 | −3.17122 | 5.00E-05 | 0.00069884 |
| gene1456 | rsaL | 627.92 | 209.122 | −1.58624 | −2.86187 | 5.00E-05 | 0.00069884 |
| gene292 | oprE | 20.563 | 6.97732 | −1.5593 | −2.60418 | 5.00E-05 | 0.00069884 |
| gene4352 | tufB | 29.6318 | 10.2742 | −1.52813 | −2.49072 | 5.00E-05 | 0.00069884 |
| gene547 | PA0542 | 65.1469 | 22.9895 | −1.50272 | −2.22129 | 0.0011 | 0.0100167 |
| gene4138 | oprG | 27.1767 | 9.75134 | −1.4787 | −2.06861 | 0.0021 | 0.015976 |
| gene5233 | glnA | 83.3418 | 30.4831 | −1.45103 | −2.97103 | 5.00E-05 | 0.00069884 |
| gene3389 | clpP2 | 23.5314 | 8.74695 | −1.42774 | −1.8175 | 0.007 | 0.0372301 |
| gene3722 | frr | 271.131 | 103.065 | −1.39543 | −2.83483 | 5.00E-05 | 0.00069884 |
| gene308 | PA0306a | 39.0824 | 15.5097 | −1.33335 | −1.82724 | 0.00395 | 0.0247286 |
| gene5035 | azu | 166.858 | 66.2508 | −1.33261 | −2.52071 | 5.00E-05 | 0.00069884 |
| gene2673 | aceA | 17.8349 | 7.20472 | −1.30769 | −2.22915 | 0.00055 | 0.00541885 |
| gene1560 | PA1533 | 104.495 | 42.4434 | −1.29983 | −2.00187 | 0.00245 | 0.0179567 |
| gene5680 | atpD | 29.3639 | 12.0031 | −1.29064 | −2.40291 | 5.00E-05 | 0.00069884 |
| gene5623 | nrdJa | 8.16542 | 3.36928 | −1.27709 | −1.95924 | 0.0016 | 0.0126526 |
| gene1176 | imm2 | 134.36 | 56.4069 | −1.25216 | −1.83929 | 0.0038 | 0.0247286 |
| gene4588 | PA4500 | 8.97191 | 3.82949 | −1.22826 | −1.72289 | 0.00615 | 0.0345435 |
| gene833 | PA0820 | 25.8366 | 11.1948 | −1.20659 | −1.74814 | 0.0039 | 0.0247286 |
| gene1535 | Tli4 | 22.776 | 9.92586 | −1.19825 | −1.80905 | 0.00295 | 0.0206157 |
| gene1457 | lasI | 62.0684 | 27.0521 | −1.19812 | −2.10094 | 0.0005 | 0.00500833 |
| gene3201 | wbpM | 21.5844 | 9.88673 | −1.12643 | −2.13953 | 0.00015 | 0.001803 |
| gene3907 | PA3836 | 16.2993 | 7.47594 | −1.12448 | −1.65887 | 0.0072 | 0.0379579 |
| gene656 | vfr | 25.6241 | 11.8251 | −1.11565 | −1.55319 | 0.0107 | 0.0494669 |
| gene4399 | mvaT | 1,061.23 | 491.469 | −1.11057 | −2.22426 | 0.00025 | 0.00268304 |
| gene414 | pilJ | 13.8071 | 6.57893 | −1.06948 | −1.91188 | 0.0015 | 0.01202 |
| gene3801 | PA3732 | 230.837 | 111.46 | −1.05035 | −2.14155 | 0.0002 | 0.00231154 |
| gene3598 | bfrB | 3,320.52 | 1,612.16 | −1.04241 | −2.13433 | 0.00035 | 0.00369035 |
| gene5682 | atpA | 96.9071 | 47.1674 | −1.03881 | −2.14129 | 0.0004 | 0.00414483 |
| gene1116 | fliD | 13.5333 | 6.6493 | −1.02524 | −1.65814 | 0.0066 | 0.0357351 |
| gene1976 | PA1939 | 8.32965 | 4.10377 | −1.0213 | −1.59073 | 0.0075 | 0.0385256 |
| gene523 | nirS | 48.272 | 24.8277 | −0.959236 | −1.94776 | 0.0012 | 0.0106059 |
| gene5157 | pilO | 108.242 | 55.8768 | −0.953941 | −1.64711 | 0.0042 | 0.0257571 |
| gene4451 | sodB | 285.132 | 147.322 | −0.952659 | −1.96854 | 0.00115 | 0.0103157 |
| gene4680 | ccpR | 20.1423 | 10.4282 | −0.949741 | −1.57754 | 0.0077 | 0.0392178 |
| gene5155 | pilQ | 12.2848 | 6.43035 | −0.9339 | −1.68001 | 0.00445 | 0.0267445 |
| gene1613 | sdhB | 252.039 | 134.811 | −0.902714 | −1.85065 | 0.00135 | 0.0114275 |
| gene1179 | nrdB | 63.8121 | 34.8794 | −0.871454 | −1.77239 | 0.0023 | 0.0172787 |
| gene978 | oprD | 27.184 | 14.9777 | −0.859943 | −1.61922 | 0.0059 | 0.0337705 |
| gene1175 | pys2 | 96.6484 | 53.9177 | −0.841987 | −1.70527 | 0.0024 | 0.0178074 |
| gene3937 | PA3866 | 57.9267 | 32.6472 | −0.827268 | −1.70364 | 0.00285 | 0.0201512 |
| gene5362 | hemB | 44.5942 | 25.3888 | −0.812662 | −1.57048 | 0.00735 | 0.0384117 |
| gene2595 | PA2560 | 11.782 | 0 | -inf | -nan | 0.00015 | 0.001803 |
| gene2851 | PA2805 | 7.48308 | 0 | -inf | -nan | 0.00135 | 0.0114275 |
Note:
-inf, not define; -nan, not available.
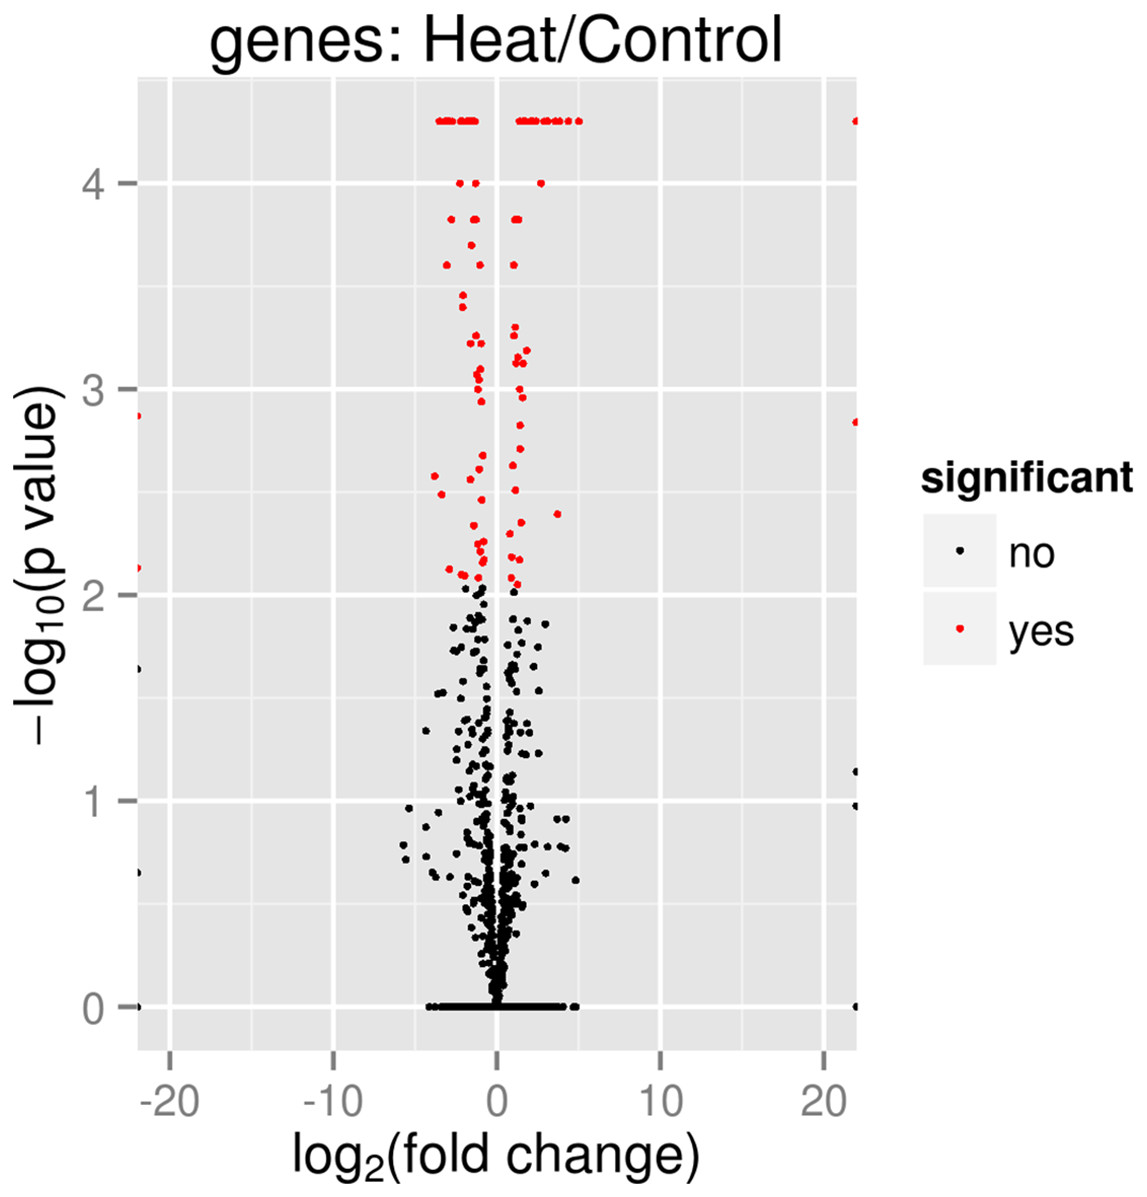
Figure 4: Volcano plot of P. aeruginosa PAO1 gene expression pattern.
In the volcano plot, the red dot shows significant genes below or at alpha = 0.05; Control: exposure to 37 °C; Heat: exposure to 46 °C.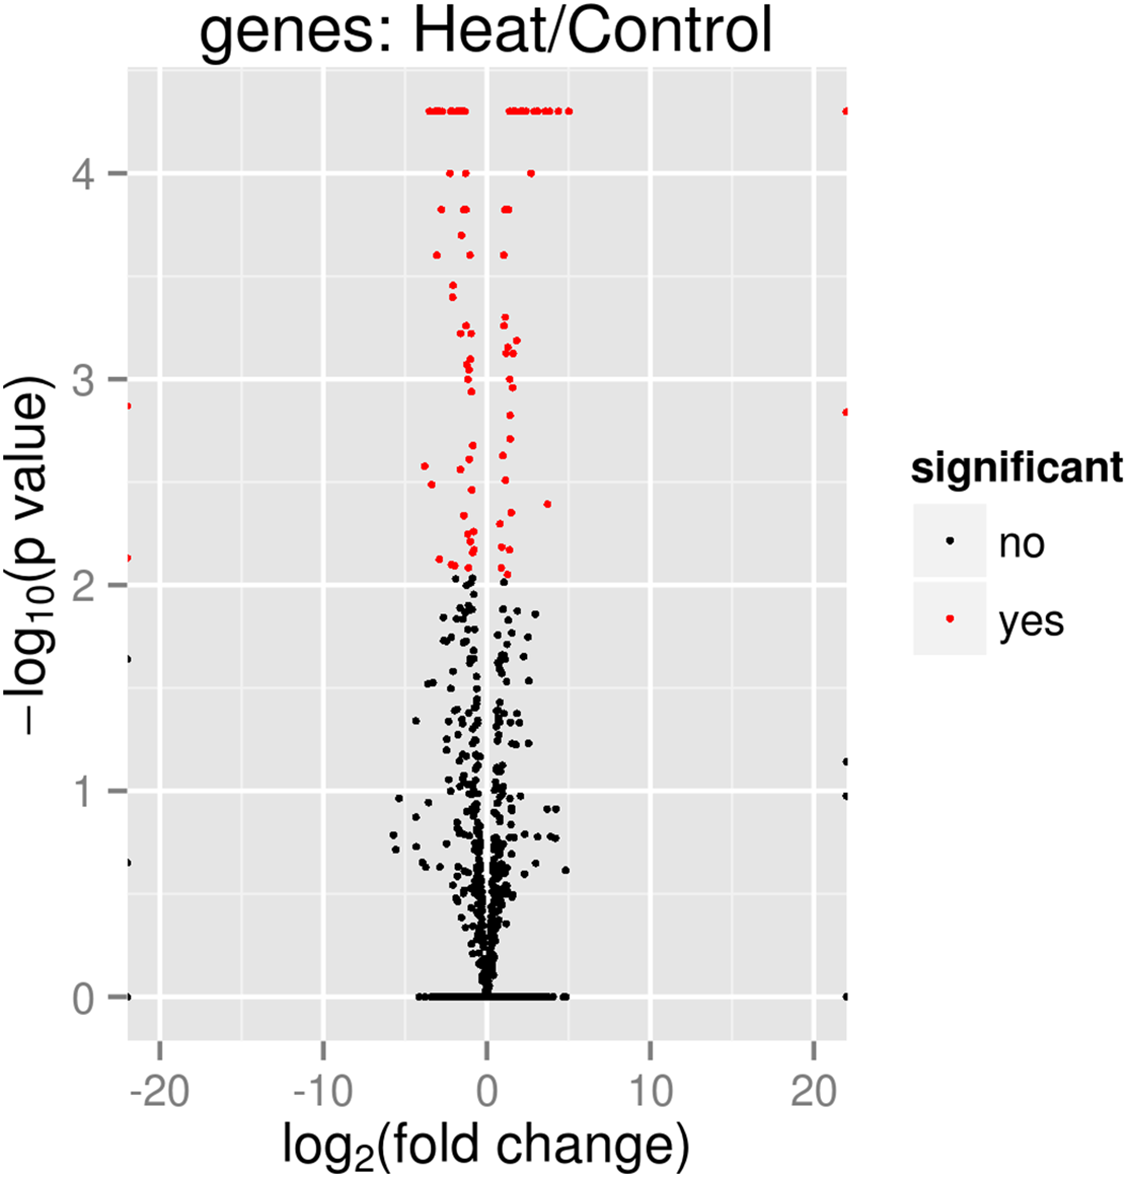
The Box plot (Fig. 5) shows that P. aeruginosa PAO1 gene global expression at 37 °C is slightly lower than at 46 °C suggesting that when exposed to elevated temperature. P. aeruginosa PAO1 cells respond to heat very quickly (within 30 min). There is a large variance in the response of P. aeruginosa PAO1 genes to heat shock at 46 °C, as evidenced by the large scatter of values along the vertical axis in Fig. 5. Nonetheless, the median for gene expression values is still higher in P. aeruginosa PAO1 cells subjected to heat shock at 46 °C compared to 37 °C. Our transcriptome analysis therefore shows that several genes in P. aeruginosa PAO1 are temperature-dependent (Fig. S1).
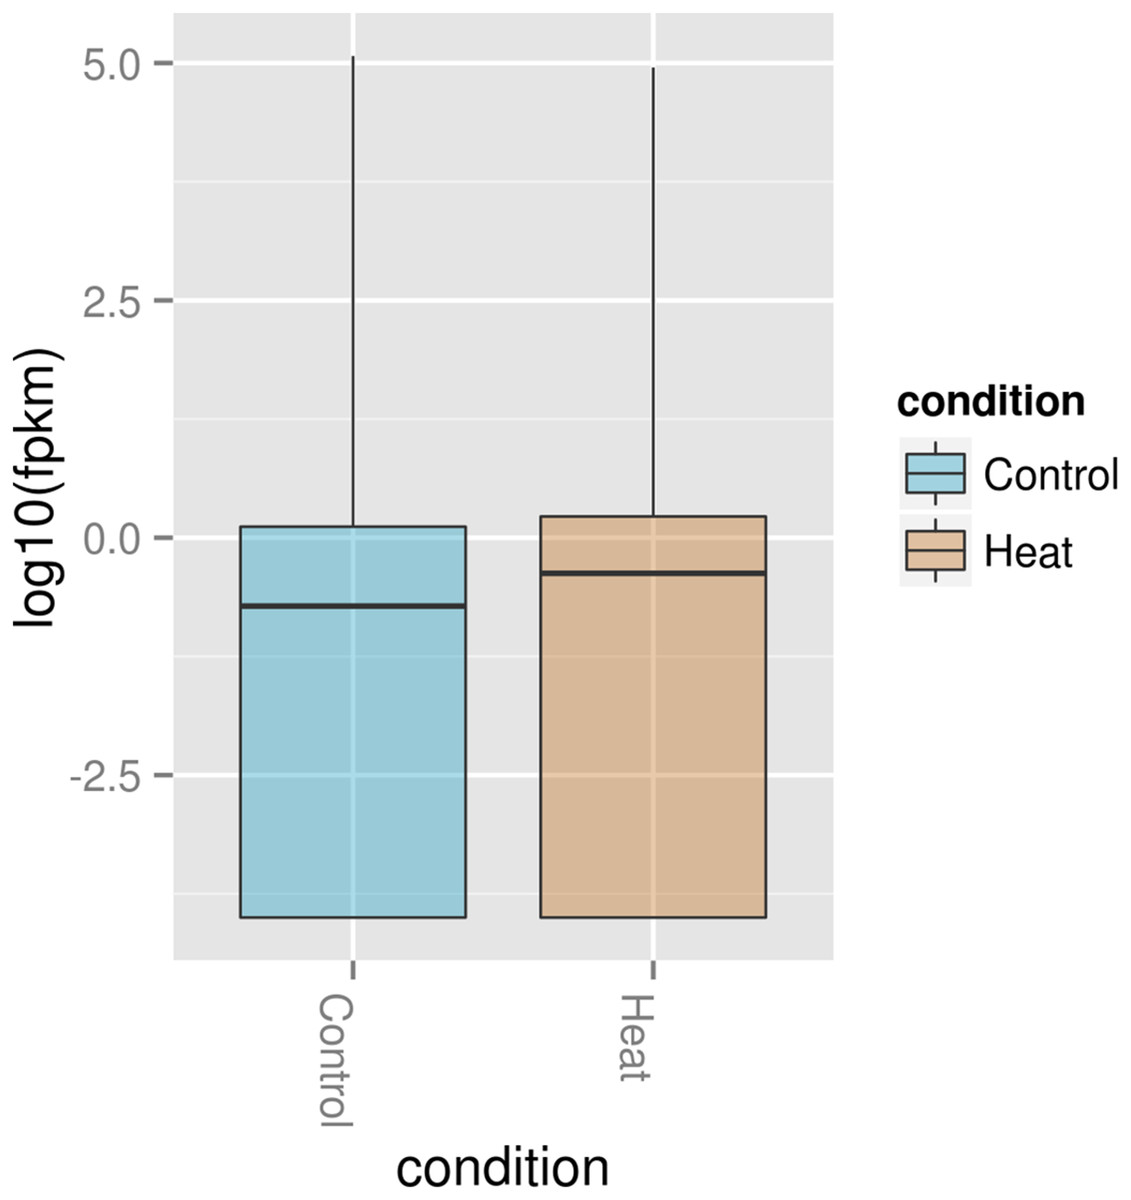
Figure 5: Box plot of normalized expression values of RNA in P. aeruginosa PAO1 exposed to 37 and 46 °C.
The Box plot shows that how log2 transformed values of the expressed genes in P. aeruginosa PAO1 when grown at 37 °C (Control) and 46 °C (Heat). A Box plot of gene expression distribution is shown for genes falling into each bin. The bottom and top of the Box are the first and last quartiles and the line within the box is the 50th percentile [the median] of the points in the group. The Box plot median shows that expression at 37 °C (Control) is slightly lower than 46 °C (Heat).
A number of P. aeruginosa PAO1 genes are regulated by temperature
Of the 133 differentially expressed genes identified (q ≤ 0.05 fixed as the cut-off values), 55 genes were upregulated (Table 3) and 78 genes were downregulated (Table 4). The gene most upregulated under our 30 min heat shock experiment at 46 °C was clpB. ClpB is a well-known heat shock gene in bacteria. In our study, its expression was much higher than all other heat shock genes (log2 fold change of 4.896). Another highly upregulated gene was one of unknown function. Therefore, its role in heat shock response needs to be further investigated.
Figure 6 depicts the expression of selected genes quantified using RT-PCR. Expression levels of the genes tested were closely correlated with the data obtained from RNA-seq experiment. Notably, clpB, dnaJ, dnaK, and grpE genes were upregulated while tssG1, hsiC2, and pilA genes were downregulated. However, the expression values obtained by RT-PCR were slightly higher compared to the RNA-seq expression value. This could be due to the use of gene specific primers in the RT-PCR compared to the RNA-seq, which used universal PCR primers for the cDNA amplification step. Additionally, the samples used for RT-PCR were from an independent heat shock experiment, which may account for the slight variation in the overall gene expression values.
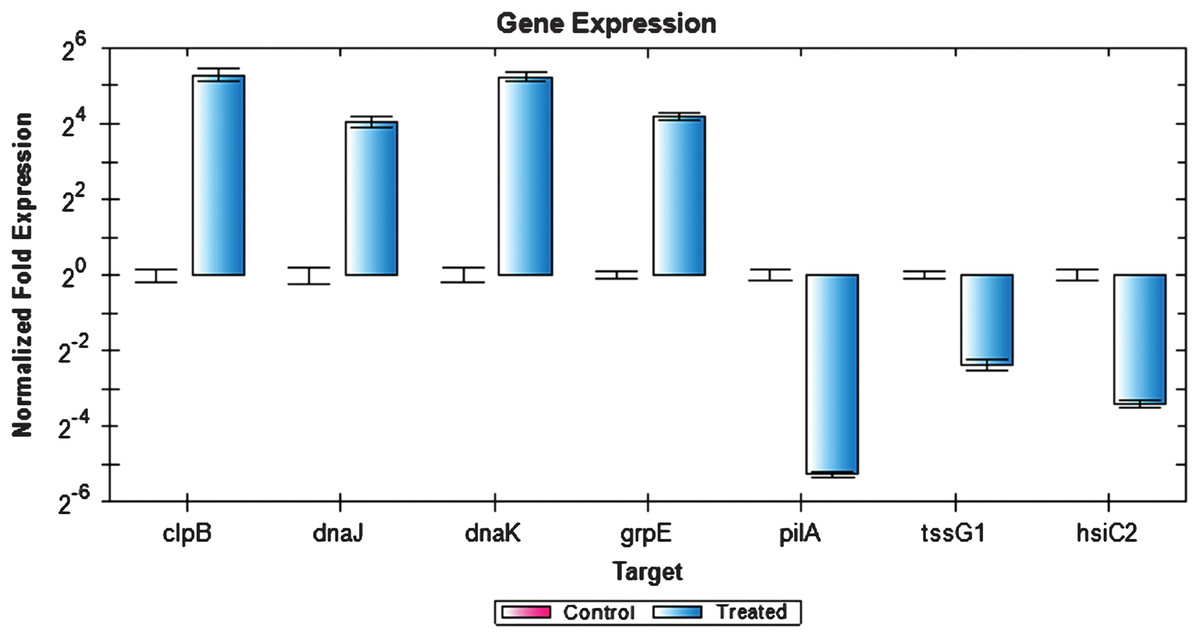
Figure 6: Expression analysis of P. aeruginosa PAO1 genes using RT-PCR.
The expression values of four upregulated (clpB, dnaJ, dnaK and grpE) and three downregulated (pilA, tssG1, and hsiC2) genes as analyzed by RT-PCR. Rreference genes cheZ, proC, recA, rpoB, gyrB, oprL, and plsY, with an M value of less than 0.7 were selected.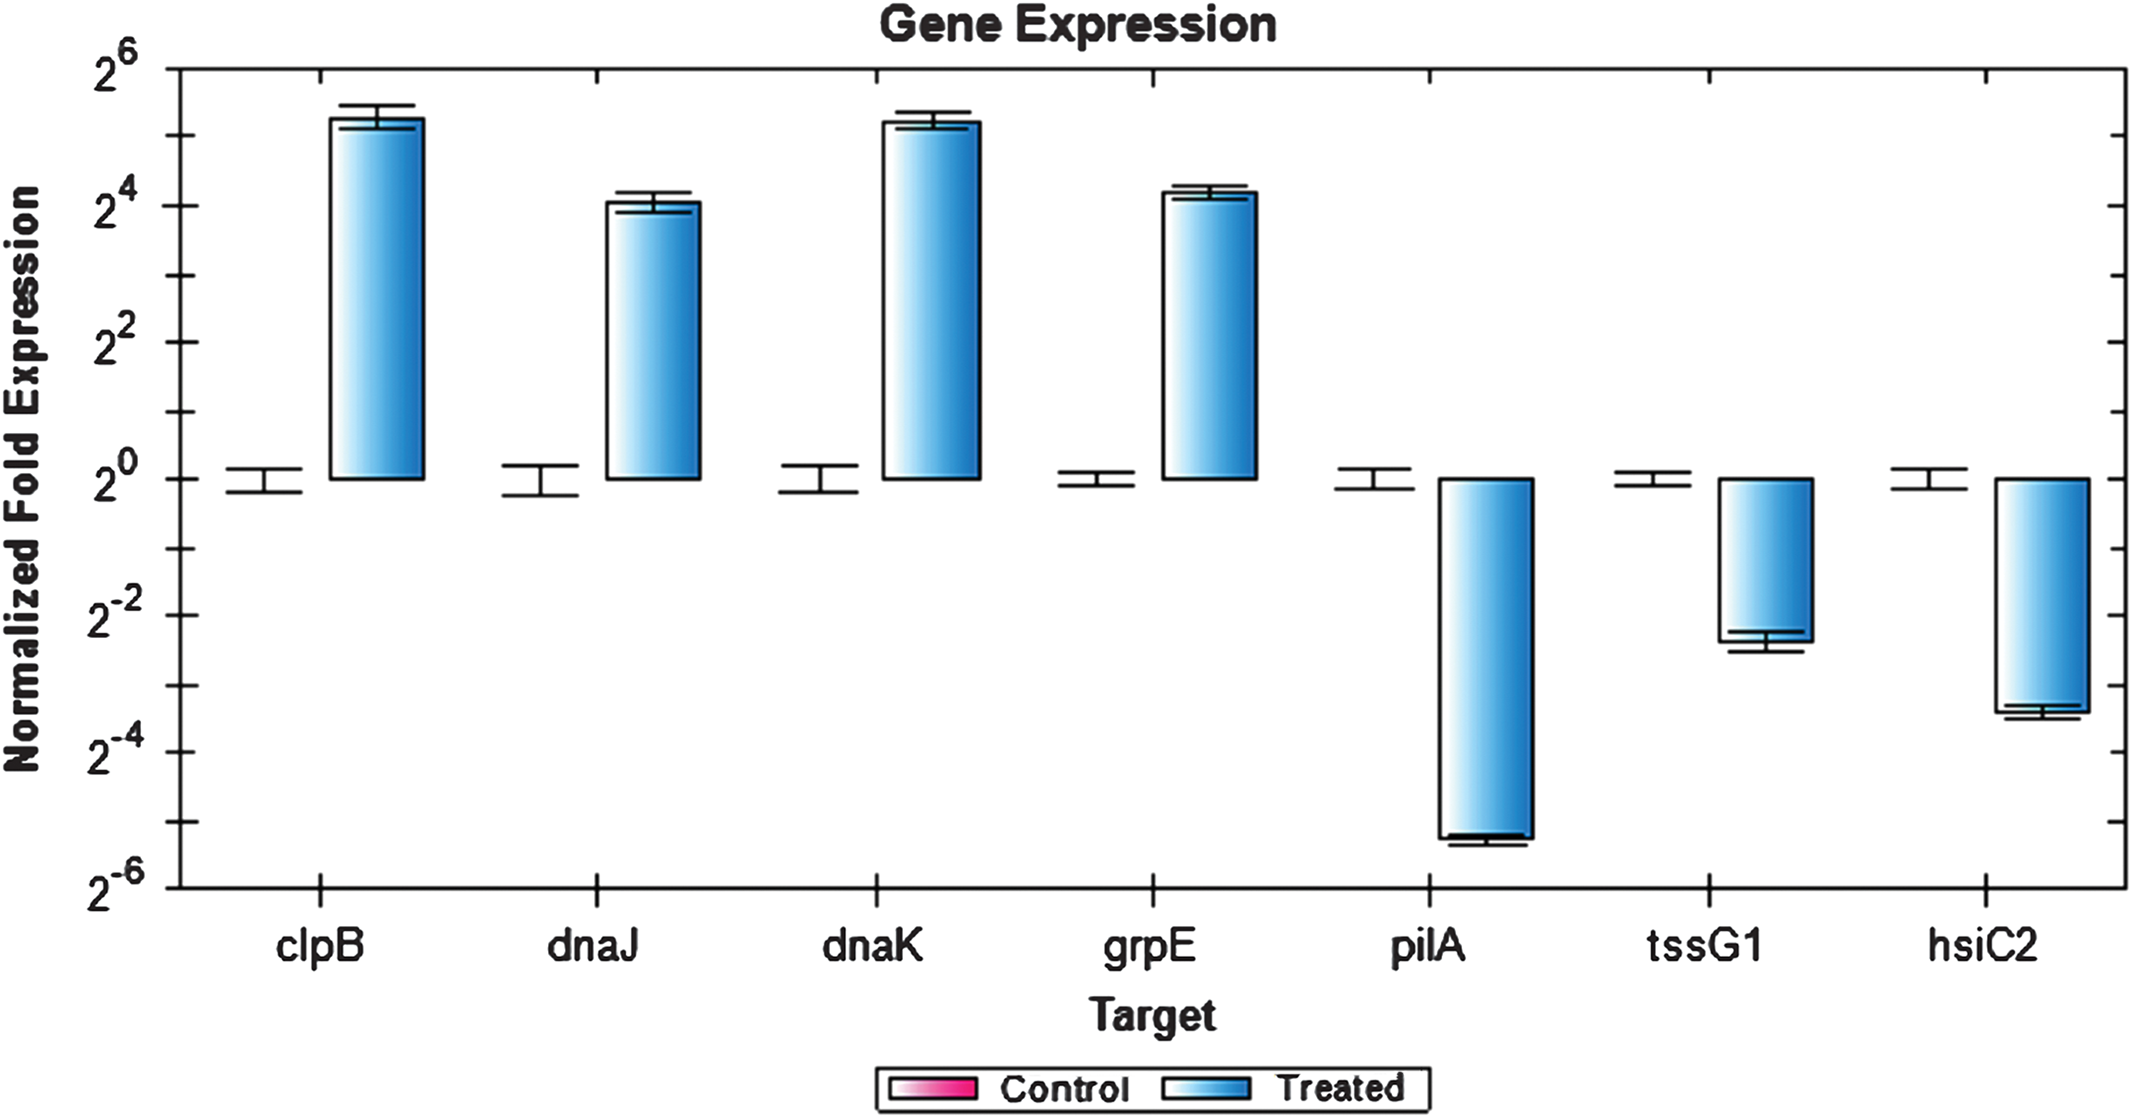
Discussion
It is anticipated that bacteria are subject to many abiotic changes in both the external environment and in a mammalian host. One of the frequent abiotic stresses that many pathogens such as P. aeruginosa PAO1 will encounter is elevated temperature. In order to study the P. aeruginosa PAO1 heat shock response, we used RNA-seq coupled with NGS. We performed a global transcriptional analysis of gene expression after exposing this opportunistic pathogen to heat shock.
The gene most upregulated under our 30 min heat shock experiment was clpB. It has previously been documented that ClpB plays a vital role in the bacterial heat shock response and adaptation to elevated temperatures, being responsible for breaking down massive bacterial protein aggregates (Schirmer et al., 1996). The levels of ClpB and other chaperones, such as DnaKJ, GrpE, and GroESL, need to be in balance (Kedzierska & Matuszewska, 2001). In this work, dnaK, dnaJ, groEL were expressed in that descending order, which is in agreement with the work of Kedzierska & Matuszewska (2001). Another group of genes classified as being involved in damage control and repair were also significantly upregulated. Among these were the genes groEL, grpE and hslU which could potentially provide more protection against the damage caused by heat shock (Mogk et al., 1999; Motohashi et al., 1999; Zolkiewski, 1999).
The second most highly over expressed gene in the heat shock experiment was PA0779 (asrA gene). Overexpression of asrA has previously been reported to lead to the induction of the heat shock response in P. aeruginosa (Kindrachuk et al., 2011). Our transcriptome data are there for comparable to the work of Kindrachuk et al. (2011) from two perspectives: (i) The heat shock genes htpG, groES, clpB, dnaJ and hslV but not ibpA gene were induced by overexpression of asrA gene, and (ii) the known heat shock sigma factor rpoH is involved in mediating P. aeruginosa stress response to tobramycin and heat shock through asrA. In the transcriptome of P. aeruginosa PAO1 cells subject to heat shock we observed the upregulation of rpoH, a well-coordinated phenomenon related to the upregulation of PA0779 (asrA gene). It has been reported that the function of AsrA protein goes beyond simply the heat shock response and that it is also a key mediator of tobramycin antibiotic response (Kindrachuk et al., 2011).
Another interesting finding in our P. aeruginosa PAO1 heat shock experiments is the upregulation of RsmA (Regulator of secondary metabolism > 2-fold). RsmA or CsrA (carbon storage regulator) is a RNA-binding protein that acts as a posttranscriptional regulatory protein in P. aeruginosa. RsmA has been implicated in a number of processes such as the regulation of secondary metabolism, and the expression of several genes related to quorum sensing, motility and virulence determinants (Kay et al., 2006).
In P. aeruginosa, RsmA has been shown to negatively control the expression of several virulent genes and quorum sensing (Pessi et al., 2001). RsmA has also been shown to exert positive effects on swarming motility, lipase and rhamnolipid (Heurlier et al., 2004). In our work, the quorum sensing gene lasI is significantly downregulated, which is in agreement with the reported work of Pessi et al. (2001). The flagella cap protein gene fliD was also downregulated in our study. As flagella is one of the required features for swarming in P. aeruginosa (Kohler et al., 2000) it is postulated that motility could be affected by elevated heat.
RsmA coordinates its regulation with a small non-coding regulatory RNA molecule, RsmZ (RsmB) (Timmermans & Van Melderen, 2010). In this work, rsmZ was downregulated. It has been reported that both positive and negative effects of RsmA are found to be antagonized by RsmZ (Heurlier et al., 2004). In the light of this finding, it is postulated that several virulence genes can be affected by heat shock. Although the effects of RsmA regulation could be minimised due to the downregulation of rsmZ. Also, in P. aeruginosa, RsmY but not RsmZ, can be bound and stabilized by the RNA chaperone protein Hfq effectively blocking the action of RsmA (Sorger-Domenigg et al., 2007). In our work, neither RsmY nor Hfq were detected, implying that Hfq is irrelevant in the response of P. aeruginosa PAO1 to elevated temperature.
The major structural component of bacterial cells is the cell wall, which provides physical protection against environmental stresses such as heat shock. Lipopolysaccharide biosynthesis is an important endotoxin and key component of the bacterial cell wall and membrane. In our work, another gene significantly upregulated was waaG, which is responsible for lipopolysaccharide biosynthesis. Suggesting that when exposed to high temperature, P. aeruginosa PAO1 upregulates endotoxin production.
The gene (wbpD) responsible for N-acetyltransferases which is important for O-antigen or O-polysaccharide biosynthesis in P. aeruginosa PAO1 (Wenzel et al., 2005), and it is this region which confers serum resistance to this pathogen (Rocchetta, Burrows & Lam, 1999). Our data imply that when exposed to high temperature such as fever condition in the host being infected by P. aeruginosa PAO1, upregulation of genes important for lipopolysaccharide and O-polysaccharide biosynthesis confers endotoxin production and resistant to serum killing, thus providing a means to overcome the host defence. This result also suggests a molecular sensing and response of P. aeruginosa PAO1 on the changes from the environment to the mammalian host and fever condition.
One of the major effects of heat shock in bacteria is a loss of genome integrity. Three major processes, namely DNA replication, DNA recombination, and DNA repair can help to combat this (Klein & Kreuzer, 2002) but these processes can also be affected by heat changes (López-García & Forterre, 2000). Our work showed the upregulation of dnaG, a primase that synthesizes a primer that is essential for DNA replication. We postulate that during heat shock, DNA replication is upregulated, facilitated in part by the dnaG gene. The increase in DNA content helping to maintain genome stability, fidelity and integrity under high heat in this pathogen.
We also found that the RNA polymerase core enzyme gene rpoD was upregulated during heat shock. This is in agreement with previously reported work of Aramaki & Fujita (1999). The expression of rpoD, together with other sigma factors such as rpoH and rpoB have been well-documented for their role in the fitness of species such as E. coli (Barrick et al., 2010) and P. aeruginosa (MacLean & Buckling, 2009). The upregulation of rpoB in our work leads us to speculate that this will increase survival fitness enabling P. aeruginosa PAO1 to withstand the deleterious effect of exposure to increased temperature.
The majority of the significantly downregulated genes identified in this study are of unknown functions and will require further analysis. However, some of the top downregulated genes were discovered to be part of the P. aeruginosa type VI secretion system (T6SS). Secretion systems in many prokaryotes vary in terms of their complexity, however these systems incorporate the usage of a single polypeptide to build their path across bacterial cell envelopes (Filloux, Hachani & Bleves, 2008). We therefore speculate that T6SS is involved in interactions with eukaryotic cells possibly contributing to bacterial pathogenesis. However, the precise roles of the proteins produced by the genes in this system are currently unknown. Two genes belonging to this system tssG1 and hsiC2 were under-expressed. Down regulation of these genes may help P. aeruginosa PAO1 to conserve energy enabling them to produce proteins that protect them at such elevated temperature.
Surprisingly, amongst the genes significantly downregulated in P. aeruginosa PAO1, are those of type IV pili genes. pilA, pilB, pilJ, pilO, pilQ (in ascending order) were all downregulated. P. aeruginosa expresses polar type IV pili for adhesion to various materials and twitching motility (Chiang, Habash & Burrows, 2005). It has been reported that in dispersed P. aeruginosa PAO1 under nutrient-limiting conditions, biofilm dispersion is associated with a decreased expression of pilus (pilA) genes cells (Sauer et al., 2004). In light of this, it appears that biofilm dispersion could be affected by elevated heat, as judged by the reduction in the expression of a myriad of type IV pili genes. In order to avoid the deleterious effect of heat shock P. aeruginosa PAO1 may disperse from the static biofilm and convert to planktonic cells which are free to escape the heated site.
To conclude, heat shock has a profound impact in the opportunistic pathogen P. aeruginosa PAO1. It affects a number of key genes related to a number of processes. Chief amongst these are chaperones, heat shock proteins, proteases, heat shock-related sigma factor, and posttranscriptional regulatory proteins (regulating secondary metabolism and the expression of virulence). In addition, genes involved in regulating quorum sensing, motility and membrane and pili and biofilm formation are also differentially regulated by heat shock. We believe that transcriptome analysis using RNA-seq technology can be a very useful approach to study gene expression profiling and further understand the mechanism employed by pathogens, especially in establishing an infection.
Supplemental Information
Heat map of P. aeruginosa PAO1 genes expression of all regulated genes at 37 and 46 °C.
Overview of genes heat map profile at alpha = 0.05 significant level.