
Association between myosteatosis and survival of patients with esophageal and gastro-esophageal junction cancer: a meta-analysis
- Published
- Accepted
- Received
- Academic Editor
- Faiza Farhan
- Subject Areas
- Evidence Based Medicine, Oncology, Pathology, Radiology and Medical Imaging, Metabolic Sciences
- Keywords
- Esophageal cancer, Gastroesophageal junction cancer, Myosteatosis, Progression, Survival
- Copyright
- © 2026 Wang et al.
- Licence
- This is an open access article distributed under the terms of the Creative Commons Attribution License, which permits using, remixing, and building upon the work non-commercially, as long as it is properly attributed. For attribution, the original author(s), title, publication source (PeerJ) and either DOI or URL of the article must be cited.
- Cite this article
- 2026. Association between myosteatosis and survival of patients with esophageal and gastro-esophageal junction cancer: a meta-analysis. PeerJ 14:e20825 https://doi.org/10.7717/peerj.20825
Abstract
Background
Myosteatosis, a marker of fatty infiltration in skeletal muscle, has emerged as a potential prognostic factor in various cancers. However, its association with survival in patients with esophageal cancer (EC) or gastro-esophageal junction cancer (GEC) remains uncertain. This meta-analysis aimed to evaluate the predictive value of myosteatosis for survival of this patient population.
Methods
A systematic search of PubMed, Embase, and Web of Science was conducted through May 14, 2025. Studies reporting overall survival (OS) and/or progression-free survival (PFS) in patients with EC or GEC, with outcomes stratified by baseline myosteatosis status, were eligible for inclusion. To account for inter-study variability, pooled hazard ratios (HRs) and corresponding 95% confidence intervals (CIs) were estimated using random-effects models.
Results
Eleven cohort studies comprising 1,810 patients with EC or GEC were included. Myosteatosis was significantly associated with poorer OS (HR = 1.46, 95% CI [1.13–1.88], p = 0.004; I2 = 76%). Subgroup analyses indicated consistent associations across study design, cancer type, age, sex, treatment modality, and analytic models (p for subgroup differences > 0.05). A stronger effect was observed when myosteatosis was assessed using intramuscular adipose tissue content rather than muscle attenuation (HR = 2.29 vs. 1.30; p for subgroup difference = 0.02). Myosteatosis was not significantly associated with PFS (HR = 1.29, 95% CI [0.77–2.18], p = 0.34; I2 = 82%).
Conclusion
Baseline myosteatosis is associated with poorer OS in patients with EC or GEC. Muscle quality assessment may improve prognostic stratification in this population.
Introduction
Esophageal cancer (EC) continues to pose a major public health challenge globally, currently ranking as the eighth most commonly diagnosed cancer and the sixth leading cause of cancer-related deaths worldwide (Liu et al., 2023a; Siegel et al., 2025). The disease is typically diagnosed at an advanced stage, contributing to its dismal prognosis, with 5-year overall survival rates ranging from 15% to 25% despite advances in multimodal therapies including surgery, chemotherapy, and radiotherapy (Cummings et al., 2021). Given the close anatomical location, overlapping biological behavior, and similar treatment approaches, gastro-esophageal junction cancer (GEC) is often grouped with EC in clinical studies (Cellini et al., 2014). Accurate prognostic stratification is crucial for guiding therapeutic decision-making and optimizing outcomes. While traditional tumor-related factors such as stage, histology, and lymph node involvement are well-established predictors of prognosis in patients with EC and GEC, they do not fully account for the variability in clinical outcomes among patients with comparable tumor characteristics (Marom, 2022; Yang et al., 2024a). As a result, increasing attention has been given to host-related factors, particularly body composition abnormalities, as potential prognostic indicators in EC and GEC (Boshier et al., 2018).
Myosteatosis, characterized by abnormal fat accumulation in skeletal muscle, has emerged as a novel indicator of impaired muscle quality and disrupted metabolic function (Kim & Kim, 2021; Wang, Valencak & Shan, 2024). It is typically assessed using computed tomography (CT) or magnetic resonance imaging (MRI), either by measuring skeletal muscle attenuation (MA, in Hounsfield units) at the third or fourth lumbar vertebrae or by calculating indices such as intramuscular adipose content (IMAC) or modified IMAC (mIMAC) (Garcia-Diez et al., 2024; Kim et al., 2020). Unlike sarcopenia, which reflects reduced muscle mass, myosteatosis captures qualitative changes in muscle tissue that may reflect systemic inflammation, insulin resistance, and metabolic dysfunction (Aleixo et al., 2020; Correa-de Araujo et al., 2020)—factors that can impair tolerance to treatment and promote tumor progression. MA, expressed in Hounsfield units on computed tomography, reflects overall muscle density and serves as an indirect proxy of lipid infiltration within muscle tissue (Aubrey et al., 2014). In contrast, IMAC quantifies fat deposition within muscle fibers, whereas intermuscular fat represents adipose tissue located between muscle groups and constitutes a distinct anatomical compartment (Liu et al., 2023b). Patients with EC and GEC are particularly prone to malnutrition, systemic inflammation, and treatment-related metabolic stress, which may disproportionately affect skeletal muscle quality and clinical outcomes (Jordan et al., 2018). Although several observational studies have examined the prognostic significance of myosteatosis in this population, their findings have been inconsistent, likely owing to differences in study design, patient characteristics, treatment modalities, and methods used to assess muscle quality (Dijksterhuis et al., 2019; Gabiatti et al., 2019; Ichinohe et al., 2023; Ito et al., 2023; Kitajima et al., 2023; Park et al., 2024; Srpcic et al., 2020; Tamandl et al., 2016; West et al., 2021; Yang et al., 2024b; Zhou et al., 2020). Moreover, to our knowledge, no prior meta-analysis has specifically quantified the association between baseline myosteatosis and survival outcomes in this patient population. Therefore, we conducted this meta-analysis to systematically evaluate the prognostic value of myosteatosis for overall and progression-free survival in patients with EC or GEC.
Materials & Methods
The study was conducted in accordance with the PRISMA 2020 guidelines and the Cochrane Handbook (Higgins et al., 2021; Page et al., 2021) for Systematic Reviews of Interventions, ensuring methodological rigor in study selection, data extraction, statistical analysis, and result interpretation. The protocol was prospectively registered with PROSPERO (ID: CRD420251081339).
Literature search
A comprehensive literature search was performed in PubMed, Embase, and Web of Science, utilizing a broad set of search terms that integrated the following keywords and concepts: (1) “myosteatosis” OR “muscle density” OR “muscle attenuation” OR “intramuscular adipose tissue content” OR “intramuscular adipose tissue infiltration” OR “intramuscular adipose tissue deposition” OR “intramuscular fat content” OR “intramuscular fat infiltration” OR “intramuscular fat deposition”; (2) “esophageal” OR “esophagus” OR “oesophageal” OR “oesophagus” OR “gastro-esophageal junction” OR “gastro-esophageal junction”; and (3) “carcinoma” OR “adenocarcinoma” OR “cancer” OR “tumor” OR “malignancy” OR “malignant” OR “neoplasm”. The search was limited to human studies and included only full-text articles published in English in peer-reviewed journals. To ensure completeness, we also manually screened the reference lists of relevant original and review articles for additional eligible studies. The search covered all publications from database inception up to May 14, 2025.
Study eligible criteria
We applied the PICOS framework to define the inclusion criteria:
P (Population): Adults with a confirmed diagnosis of EC or GEC, regardless of histological type, stage, or primary treatment;
I (Exposure): Patients with myosteatosis, as evidenced by CT/MRI according to the criteria of the original studies;
C (Comparison): Patients without myosteatosis;
O (outcome): The outcomes of interest were overall survival (OS) and/or progression-free survival (PFS), compared between patients with and without baseline myosteatosis. OS was typically defined as the duration from the initiation of treatment to death from any cause, whereas PFS referred to the time from treatment commencement to either disease progression or death.
S (study design): Eligible study designs included longitudinal observational studies, such as cohort studies, nested case-control studies, and post hoc analyses derived from clinical trials.
Studies were excluded if they were reviews, editorials, meta-analyses, preclinical investigations, did not involve patients with EC or GEC, did not assess myosteatosis as an exposure, or did not report survival outcomes. In cases of overlapping populations, only the study with the largest sample size was included in the meta-analysis.
Study quality evaluation
Wu Wang and Jinbiao Xie independently conducted the literature search, screened studies, assessed methodological quality, and extracted data. Any discrepancies were resolved through consultation with the corresponding author. The quality of included studies was evaluated using the Newcastle–Ottawa Scale (NOS) (Wells et al., 2010), which examines study selection, control of confounding variables, and outcome assessment. The NOS assigns scores from 1 to 9, with 8 or higher indicating high methodological quality.
Data collection
The data collected for the meta-analysis included study details (author, year, country, and design), patient characteristics (diagnosis, number of patients in each study, mean age, sex distribution, cancer stage, and primary treatment), exposure details (methods and parameters for evaluating myosteatosis, diagnostic criteria for myosteatosis in each study, and number of patients with myosteatosis at baseline), median follow-up durations, outcomes reported, and covariates adjusted for in the regression models.
Statistical analysis
We used hazard ratios (HRs) and 95% confidence intervals (CIs) to assess the association between myosteatosis and survival outcomes in patients with EC or GEC. HRs and their standard errors were either directly extracted or derived from reported 95% confidence intervals or p-values, followed by logarithmic transformation to stabilize variance and achieve a normal distribution (Higgins et al., 2021). If multiple HRs were reported from different models, we used the one with the most complete adjustment. Heterogeneity was assessed using the Cochrane Q test and the I2 statistic (Higgins & Thompson, 2002), with a p-value <0.10 indicating significant heterogeneity and I2 values of <25%, 25–75%, and >75% indicating low, moderate, and high heterogeneity, respectively. A random-effects model was applied to synthesize the data, allowing for variability across studies (Higgins et al., 2021). Sensitivity analyses were conducted using a leave-one-out approach, whereby each dataset was sequentially removed to assess the influence of individual studies on the pooled effect estimate. For outcomes involving at least ten datasets, predefined subgroup analyses were conducted based on study design (prospective vs. retrospective), type of cancer (EC only vs. EC and GEC), mean age of patients, proportion of men, primary anticancer treatment (surgical vs. nonsurgical), parameters for evaluating myosteatosis (MA vs. IMAC), follow-up duration, and analytic model (univariate vs. multivariate). Subgroup analyses were stratified using the median values of continuous variables to ensure balanced groupings. Publication bias was evaluated using funnel plots and assessed for asymmetry using Egger’s regression test (Egger et al., 1997). All analyses were performed using RevMan (Version 5.1; Cochrane Collaboration, Oxford, UK) and Stata (Version 12.0; Stata Corporation, College Station, TX, USA).
Results
Study inclusion
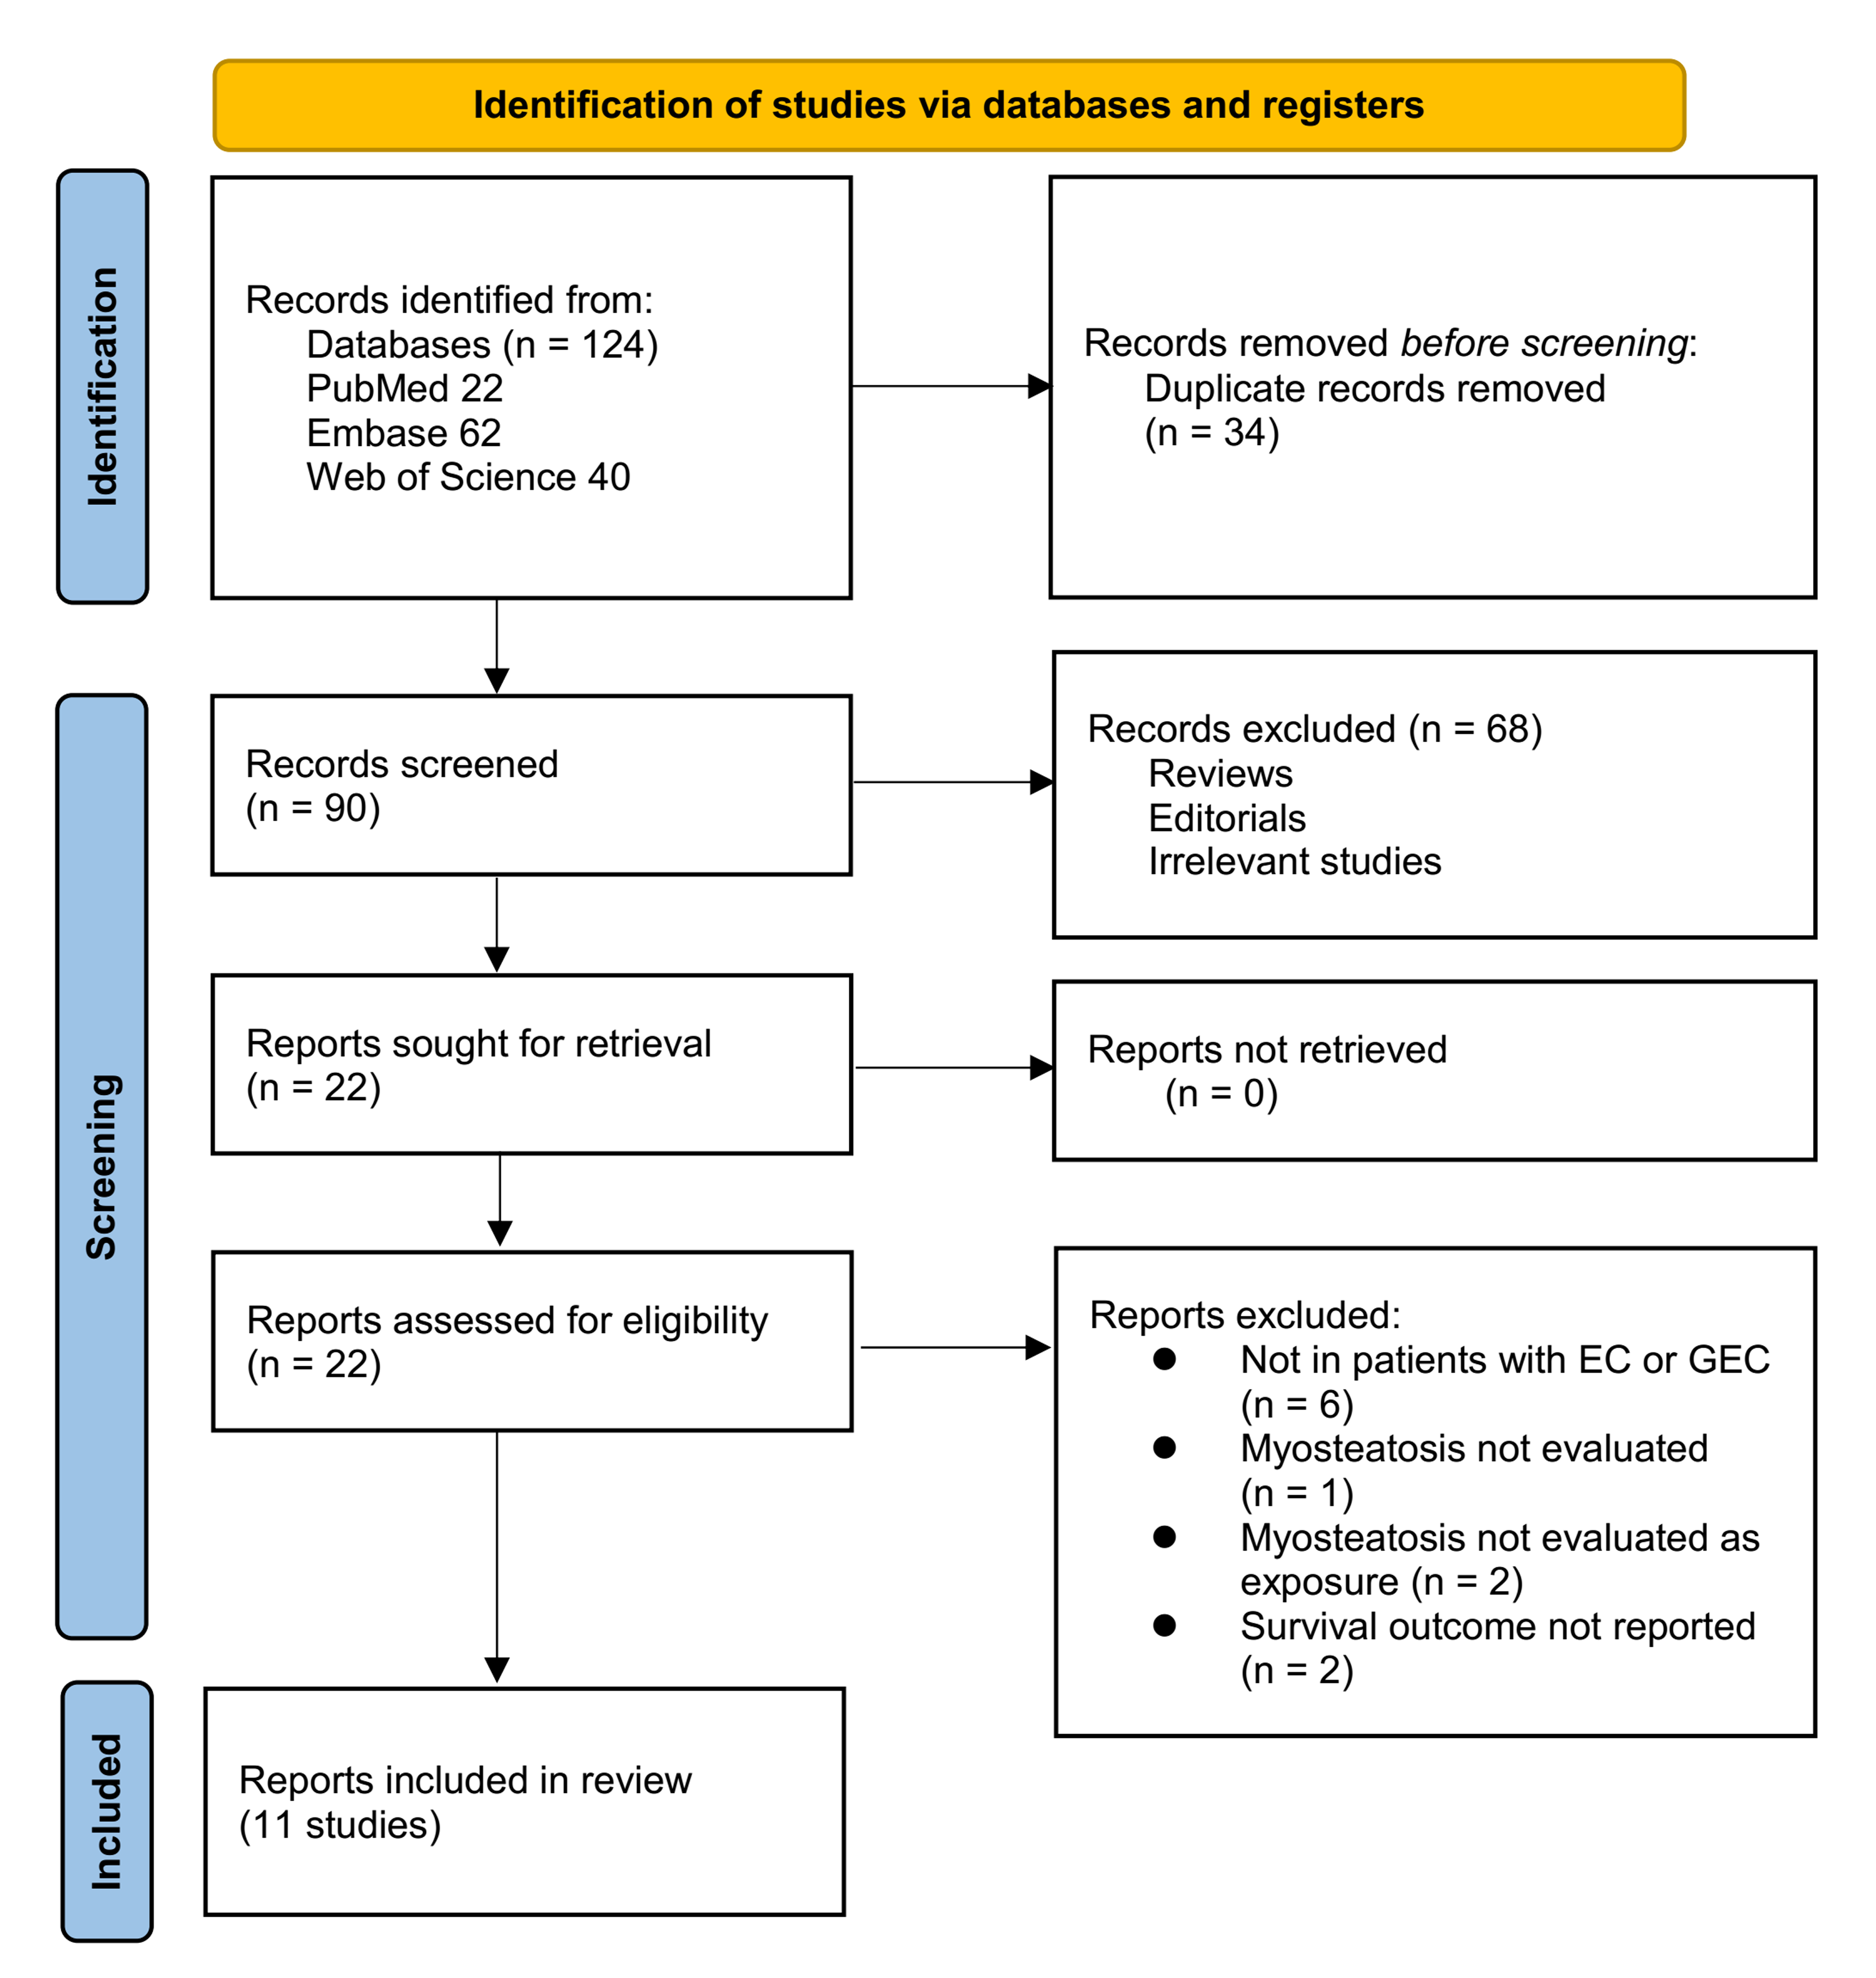
The study selection process is shown in Fig. 1. We first identified 124 records from the three databases. After removing 34 duplicate records, 90 articles underwent title and abstract screening. Of these, 68 were excluded because they did not align with the objectives of the meta-analysis. The remaining 22 full-text articles were independently assessed by two reviewers, leading to the exclusion of 11 studies for reasons detailed in Fig. 1. At last, 11 studies were included in the subsequent analysis (Dijksterhuis et al., 2019; Gabiatti et al., 2019; Ichinohe et al., 2023; Ito et al., 2023; Kitajima et al., 2023; Park et al., 2024; Srpcic et al., 2020; Tamandl et al., 2016; West et al., 2021; Yang et al., 2024b; Zhou et al., 2020).
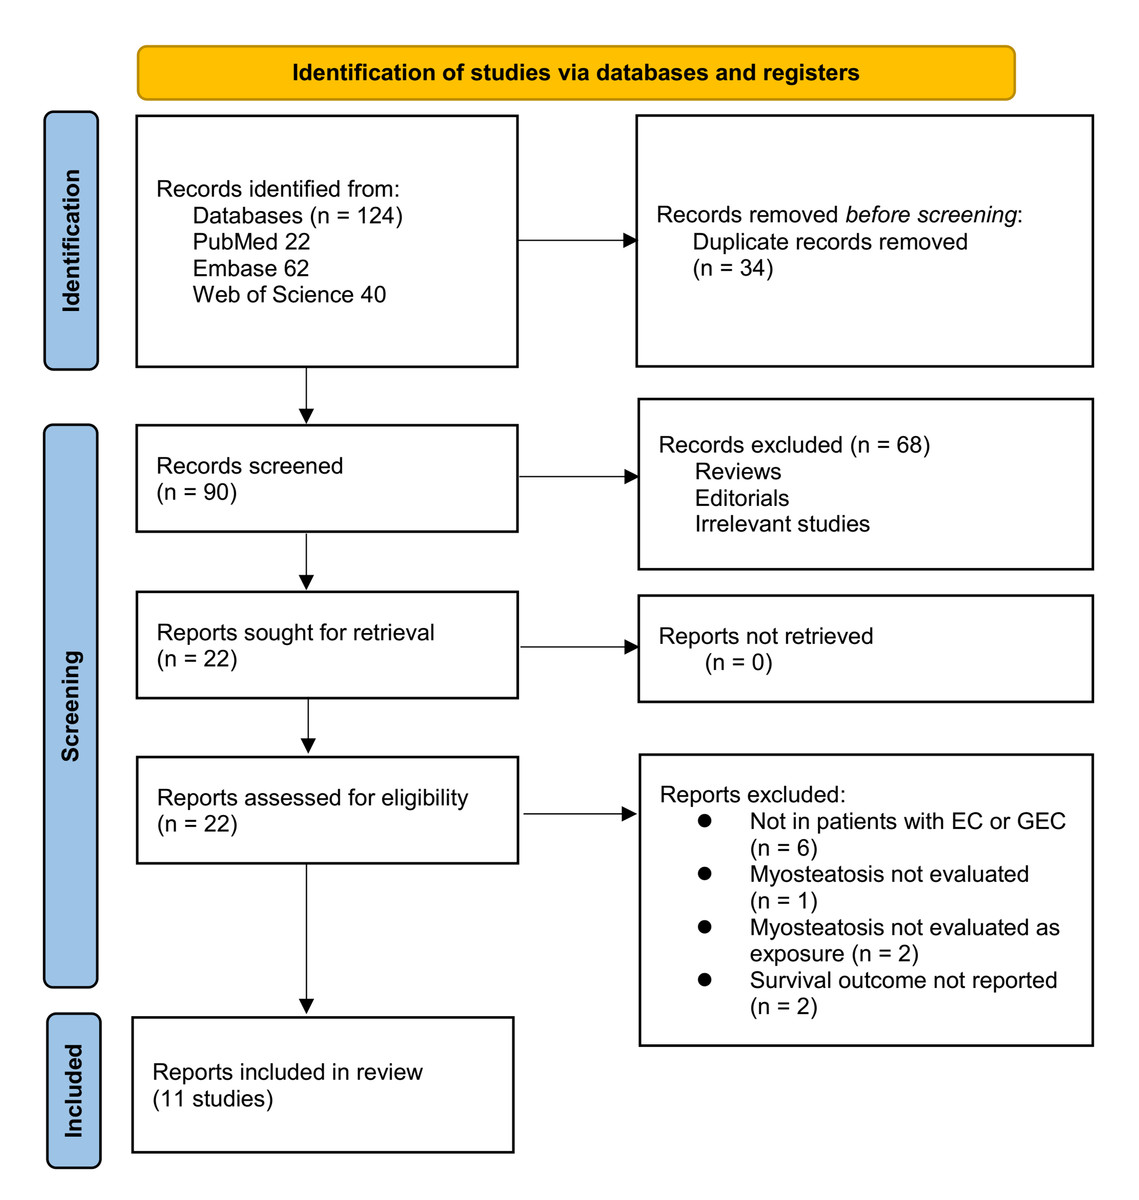
Figure 1: Flowchart of database search and study inclusion.
Summary of study characteristics
The main features of the 11 studies included in this meta-analysis are outlined in Table 1. These studies collectively enrolled 1,810 patients with EC or GEC. These studies were conducted across a range of countries, including Austria, Brazil, the Netherlands, the United States, Slovenia, the United Kingdom, Japan, Australia, and China, and were published between 2016 and 2024. Most studies (n = 9) employed retrospective cohort designs (Dijksterhuis et al., 2019; Gabiatti et al., 2019; Ichinohe et al., 2023; Ito et al., 2023; Kitajima et al., 2023; Park et al., 2024; Tamandl et al., 2016; Yang et al., 2024b; Zhou et al., 2020), with two being prospective (Srpcic et al., 2020; West et al., 2021). The mean age of participants ranged from 59.3 to 69.0 years, and the proportion of male participants ranged from 72.0% to 91.6%. Cancer stage at diagnosis spanned I to IV, and patients underwent various treatments, including surgery (with or without neoadjuvant therapy), definitive chemoradiotherapy, palliative chemotherapy, and radiotherapy. Myosteatosis was predominantly assessed via CT at the L3 (Dijksterhuis et al., 2019; Gabiatti et al., 2019; Ichinohe et al., 2023; Ito et al., 2023; Park et al., 2024; Srpcic et al., 2020; Tamandl et al., 2016; West et al., 2021; Yang et al., 2024b) or L4 (Kitajima et al., 2023; Zhou et al., 2020) vertebral level, using MA (Dijksterhuis et al., 2019; Gabiatti et al., 2019; Park et al., 2024; Srpcic et al., 2020; Tamandl et al., 2016; West et al., 2021; Yang et al., 2024b; Zhou et al., 2020) (14-19, 23, 24), IMAC (Ichinohe et al., 2023; Ito et al., 2023), or modified IMAC (mIMAC) (Kitajima et al., 2023) as the primary parameter, with diverse cutoff values. Follow-up durations ranged from 10.1 to 72.0 months. OS was reported in all 11 studies (Dijksterhuis et al., 2019; Gabiatti et al., 2019; Ichinohe et al., 2023; Ito et al., 2023; Kitajima et al., 2023; Park et al., 2024; Srpcic et al., 2020; Tamandl et al., 2016; West et al., 2021; Yang et al., 2024b; Zhou et al., 2020), whereas five studies also reported PFS (Dijksterhuis et al., 2019; Gabiatti et al., 2019; Ichinohe et al., 2023; Kitajima et al., 2023; Park et al., 2024). Most studies (n = 8) adjusted for key confounders such as age, body mass index (BMI), tumor stage, and performance status to varying degrees (Dijksterhuis et al., 2019; Gabiatti et al., 2019; Ichinohe et al., 2023; Ito et al., 2023; Kitajima et al., 2023; West et al., 2021; Yang et al., 2024b; Zhou et al., 2020), whereas three studies did not report any adjustment (Park et al., 2024; Srpcic et al., 2020; Tamandl et al., 2016).
| Study | Location | Study design | Diagnosis | Sample size | Mean age (years) | Men (%) | Cancer stage | Main treatment | Methods and parameters for myosteatosis evaluation | Cutoff values of myosteatosis parameters | No. of patients with myosteatosis | Median follow-up duration (months) | Survival outcomes reported | Covariates adjusted |
|---|---|---|---|---|---|---|---|---|---|---|---|---|---|---|
| Tamandl et al. (2016) | Austria | RC | EC and GEC | 200 | 63.9 | 75.5 | I–III | Surgery with or without neoadjuvant chemotherapy | CT, L3, MA | MA ≤40 HU | NR | 35.1 | OS | None |
| Gabiatti et al. (2019) | Brazil | RC | Locally advanced EC | 123 | 59.3 | 87.7 | II–III | Definitive chemoradiotherapy | CT, L3, MA | MA <41 HU (BMI <25 kg/m2) or MA <33 HU (BMI≥25 kg/m2) | 72 | 10.1 | OS and PFS | Age, weight loss, BMI, and ECOG PS |
| Dijksterhuis et al. (2019) | The Netherlands | RC | Advanced EC and GEC | 88 | 63 | 75 | IV | Palliative chemotherapy | CT, L3, MA | MA <41 HU (BMI <25 kg/m2) or <33 HU (BMI ≥25) | 44 | 10.1 | OS and PFS | Age, sex, WHO performance status, metastatic sites, histology |
| Zhou et al. (2020) | USA | RC | EC | 59 | 61.7 | 86.4 | I–IV | Chemotherapy, radiotherapy, and surgery | CT, L4, MA | MA ≤47.9 HU (median) | 29 | 15 | OS | Age, BMI, diabetes, and in-hospital status |
| Srpcic et al. (2020) | Slovenia | PC | EC and GEC | 139 | 63.9 | 84.2 | I–IV | Surgery with or without neoadjuvant chemoradiotherapy | CT, L3, MA | MA <30.9 HU (men), <24.8 HU (women) | 72 | 18.1 | OS | None |
| West et al. (2021) | UK | PC | EC and GEC | 100 | 67 | 72 | I–IV | Surgical resection and neoadjuvant therapy | CT, L3, MA | MA <41 HU (BMI <25 kg/m2) or MA <33 HU (BMI ≥25 kg/m2) | 36 | 24 | OS | Age, pathological stage, type of surgery, resection margin status |
| Kitajima et al. (2023) | Japan | RC | EC | 150 | 69 | 84.7 | I–IV | Surgery with or without neoadjuvant therapy | CT, L4, mIMAC | Men: mIMAC≤138.06; Women: mIMAC ≤112.92 | 80 | 30 | OS and PFS | Age, sex, neoadjuvant therapy, tumor size, T classification, vessel invasion, lymphovascular invasion, lymph node metastasis, distant metastasis |
| Ito et al. (2023) | Japan | RC | EC | 100 | 65 | 84 | II-III | Surgery and neoadjuvant chemotherapy | CT, L3, IMAC | Men: IMAC >−0.375; Women: IMAC >−0.216 | 23 | 72 | OS | Age, sex, BMI, PNI, PMI, ASA-PS score, tumor stage |
| Ichinohe et al. (2023) | Japan | RC | EC | 131 | 64 | 91.6 | II–III | Surgery and neoadjuvant chemotherapy | CT, L3, IMAC | IMAC≥−0.36 | 17 | 60.9 | OS and PFS | Age, BMI, tumor stage, and PMI |
| Park et al. (2024) | Australia | RC | EC and GEC | 462 | 67 | 78.4 | I–IV | Surgery and neoadjuvant chemoradiotherapy | CT, L3, MA | MA <41 HU (BMI <25 kg/m2) or MA <33 HU (BMI≥25 kg/m2) | 353 | 30 | OS and PFS | None |
| Yang et al. (2024b) | China | RC | EC | 258 | 62.8 | 79.8 | I–IV | Radiotherapy | CT, L3, MA | MA <30.9 HU (men), MA <24.8 HU (women) | 104 | 54.6 | OS | Age, tumor length, TNM stage, SMI, and BMI |
Notes:
- EC
-
esophageal cancer
- GEC
-
gastro-esophageal junction cancer
- RC
-
retrospective cohort
- PC
-
prospective cohort
- CT
-
computed tomography
- L3
-
third lumbar vertebra
- L4
-
fourth lumbar vertebra
- MA
-
muscle attenuation
- IMAC
-
intramuscular adipose tissue content
- mIMAC
-
modified intramuscular adipose tissue content
- HU
-
Hounsfield unit
- BMI
-
body mass index
- ECOG PS
-
Eastern Cooperative Oncology Group performance status
- WHO
-
World Health Organization
- PNI
-
prognostic nutritional index
- PMI
-
psoas muscle index
- ASA-PS
-
American Society of Anesthesiologists physical status classification
- SMI
-
skeletal muscle index
- TNM
-
tumor-node-metastasis
- OS
-
overall survival
- PFS
-
progression-free survival
- NR
-
not reported
Study quality was evaluated using the NOS, with total scores ranging from 6 to 9, reflecting moderate to high methodological quality (Table 2). Eight studies scored ≥ 8 (Dijksterhuis et al., 2019; Gabiatti et al., 2019; Ichinohe et al., 2023; Ito et al., 2023; Kitajima et al., 2023; West et al., 2021; Yang et al., 2024b; Zhou et al., 2020), indicating good quality with well-defined exposure and outcome assessments and adequate follow-up duration. The remaining three studies scored 6–7 because of limitations in adjusting for confounders or in cohort representativeness (Park et al., 2024; Srpcic et al., 2020; Tamandl et al., 2016). All studies demonstrated robust ascertainment of exposure and survival outcomes, supporting the reliability of the findings synthesized in this meta-analysis.
| Study | Representativeness of the exposed cohort | Selection of the non-exposed cohort | Ascertainment of exposure | Outcome not present at baseline | Control for age | Control for other confounding factors | Assessment of outcome | Enough long follow-up duration | Adequacy of follow-up of cohorts | Total |
|---|---|---|---|---|---|---|---|---|---|---|
| Tamandl et al. (2016) | 1 | 1 | 1 | 1 | 0 | 0 | 1 | 1 | 1 | 7 |
| Gabiatti et al. (2019) | 1 | 1 | 1 | 1 | 1 | 1 | 1 | 0 | 1 | 8 |
| Dijksterhuis et al. (2019) | 1 | 1 | 1 | 1 | 1 | 1 | 1 | 0 | 1 | 8 |
| Zhou et al. (2020) | 1 | 1 | 1 | 1 | 1 | 1 | 1 | 0 | 1 | 8 |
| Srpcic et al. (2020) | 1 | 1 | 1 | 1 | 0 | 0 | 1 | 0 | 1 | 6 |
| West et al. (2021) | 1 | 1 | 1 | 1 | 1 | 1 | 1 | 1 | 1 | 9 |
| Kitajima et al. (2023) | 1 | 1 | 1 | 1 | 1 | 1 | 1 | 1 | 1 | 9 |
| Ito et al. (2023) | 1 | 1 | 1 | 1 | 1 | 1 | 1 | 1 | 1 | 9 |
| Ichinohe et al. (2023) | 1 | 1 | 1 | 1 | 1 | 1 | 1 | 1 | 1 | 9 |
| Park et al. (2024) | 1 | 1 | 1 | 1 | 0 | 0 | 1 | 1 | 1 | 7 |
| Yang et al. (2024b) | 1 | 1 | 1 | 1 | 1 | 1 | 1 | 1 | 1 | 9 |
Association between myosteatosis and OS
A total of 11 cohort studies (Dijksterhuis et al., 2019; Gabiatti et al., 2019; Ichinohe et al., 2023; Ito et al., 2023; Kitajima et al., 2023; Park et al., 2024; Srpcic et al., 2020; Tamandl et al., 2016; West et al., 2021; Yang et al., 2024b; Zhou et al., 2020) reported the association between myosteatosis and OS in patients with EC or GEC. Significant heterogeneity was observed (p for the Cochrane Q test < 0.001; I2 = 76%). Pooled results from a random-effects model showed that, overall, myosteatosis was associated with poorer OS in patients with EC or GEC (HR: 1.46, 95% CI [1.13–1.88], p = 0.004; Fig. 2A). In leave-one-out sensitivity analyses, sequential exclusion of individual datasets did not materially alter the pooled association between myosteatosis and overall survival, with HRs ranging from 1.39 to 1.60, and all analyses remaining statistically significant (p < 0.05). The consistency of effect estimates across leave-one-out sensitivity analyses supports the robustness of the observed association and suggests that no single study drove the pooled result. In addition, a sensitivity analysis limited to high-quality studies with NOS ≥ 8 (Dijksterhuis et al., 2019; Gabiatti et al., 2019; Ichinohe et al., 2023; Ito et al., 2023; Kitajima et al., 2023; West et al., 2021; Yang et al., 2024b; Zhou et al., 2020) showed consistent results (HR: 1.49, 95% CI [1.05–2.11], p = 0.03; I2 = 80%).
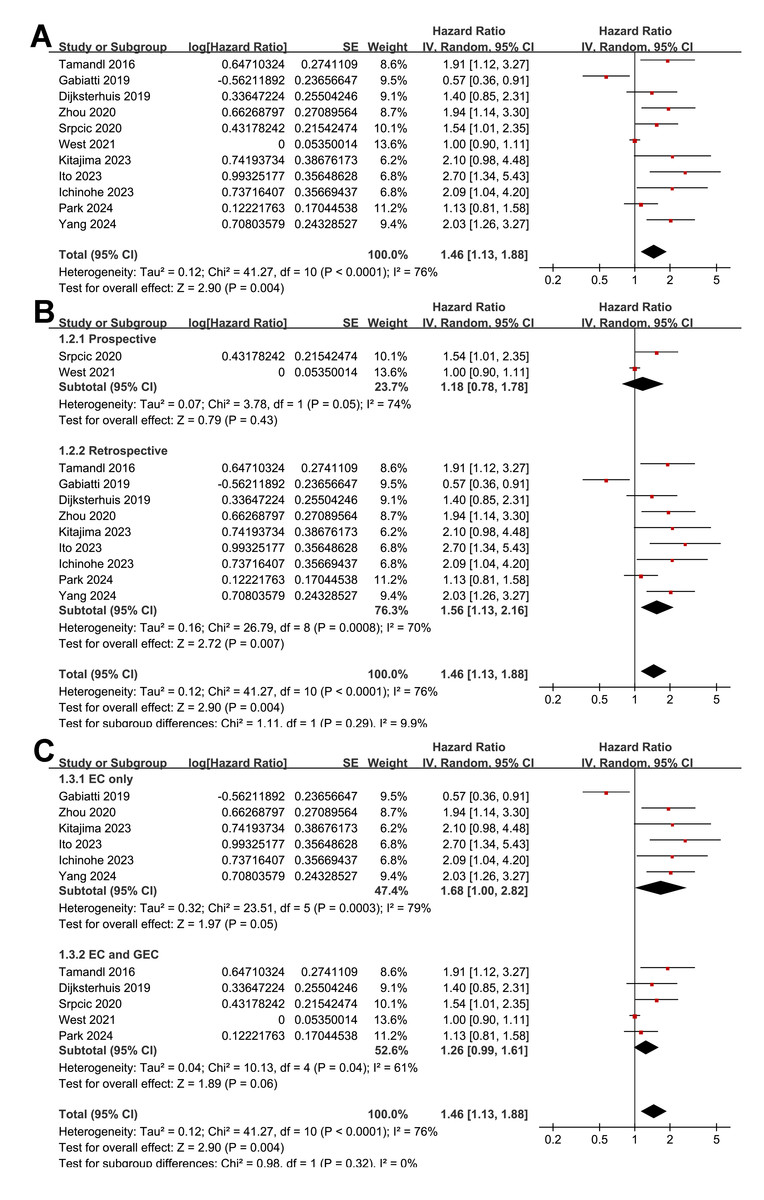
Figure 2: Forest plots for the meta-analysis of the association between myosteatosis and OS of patients EC and GEC.
(A) Overall meta-analysis; (B) subgroup analysis according to study design; and (C) subgroup analysis according to the types of cancer.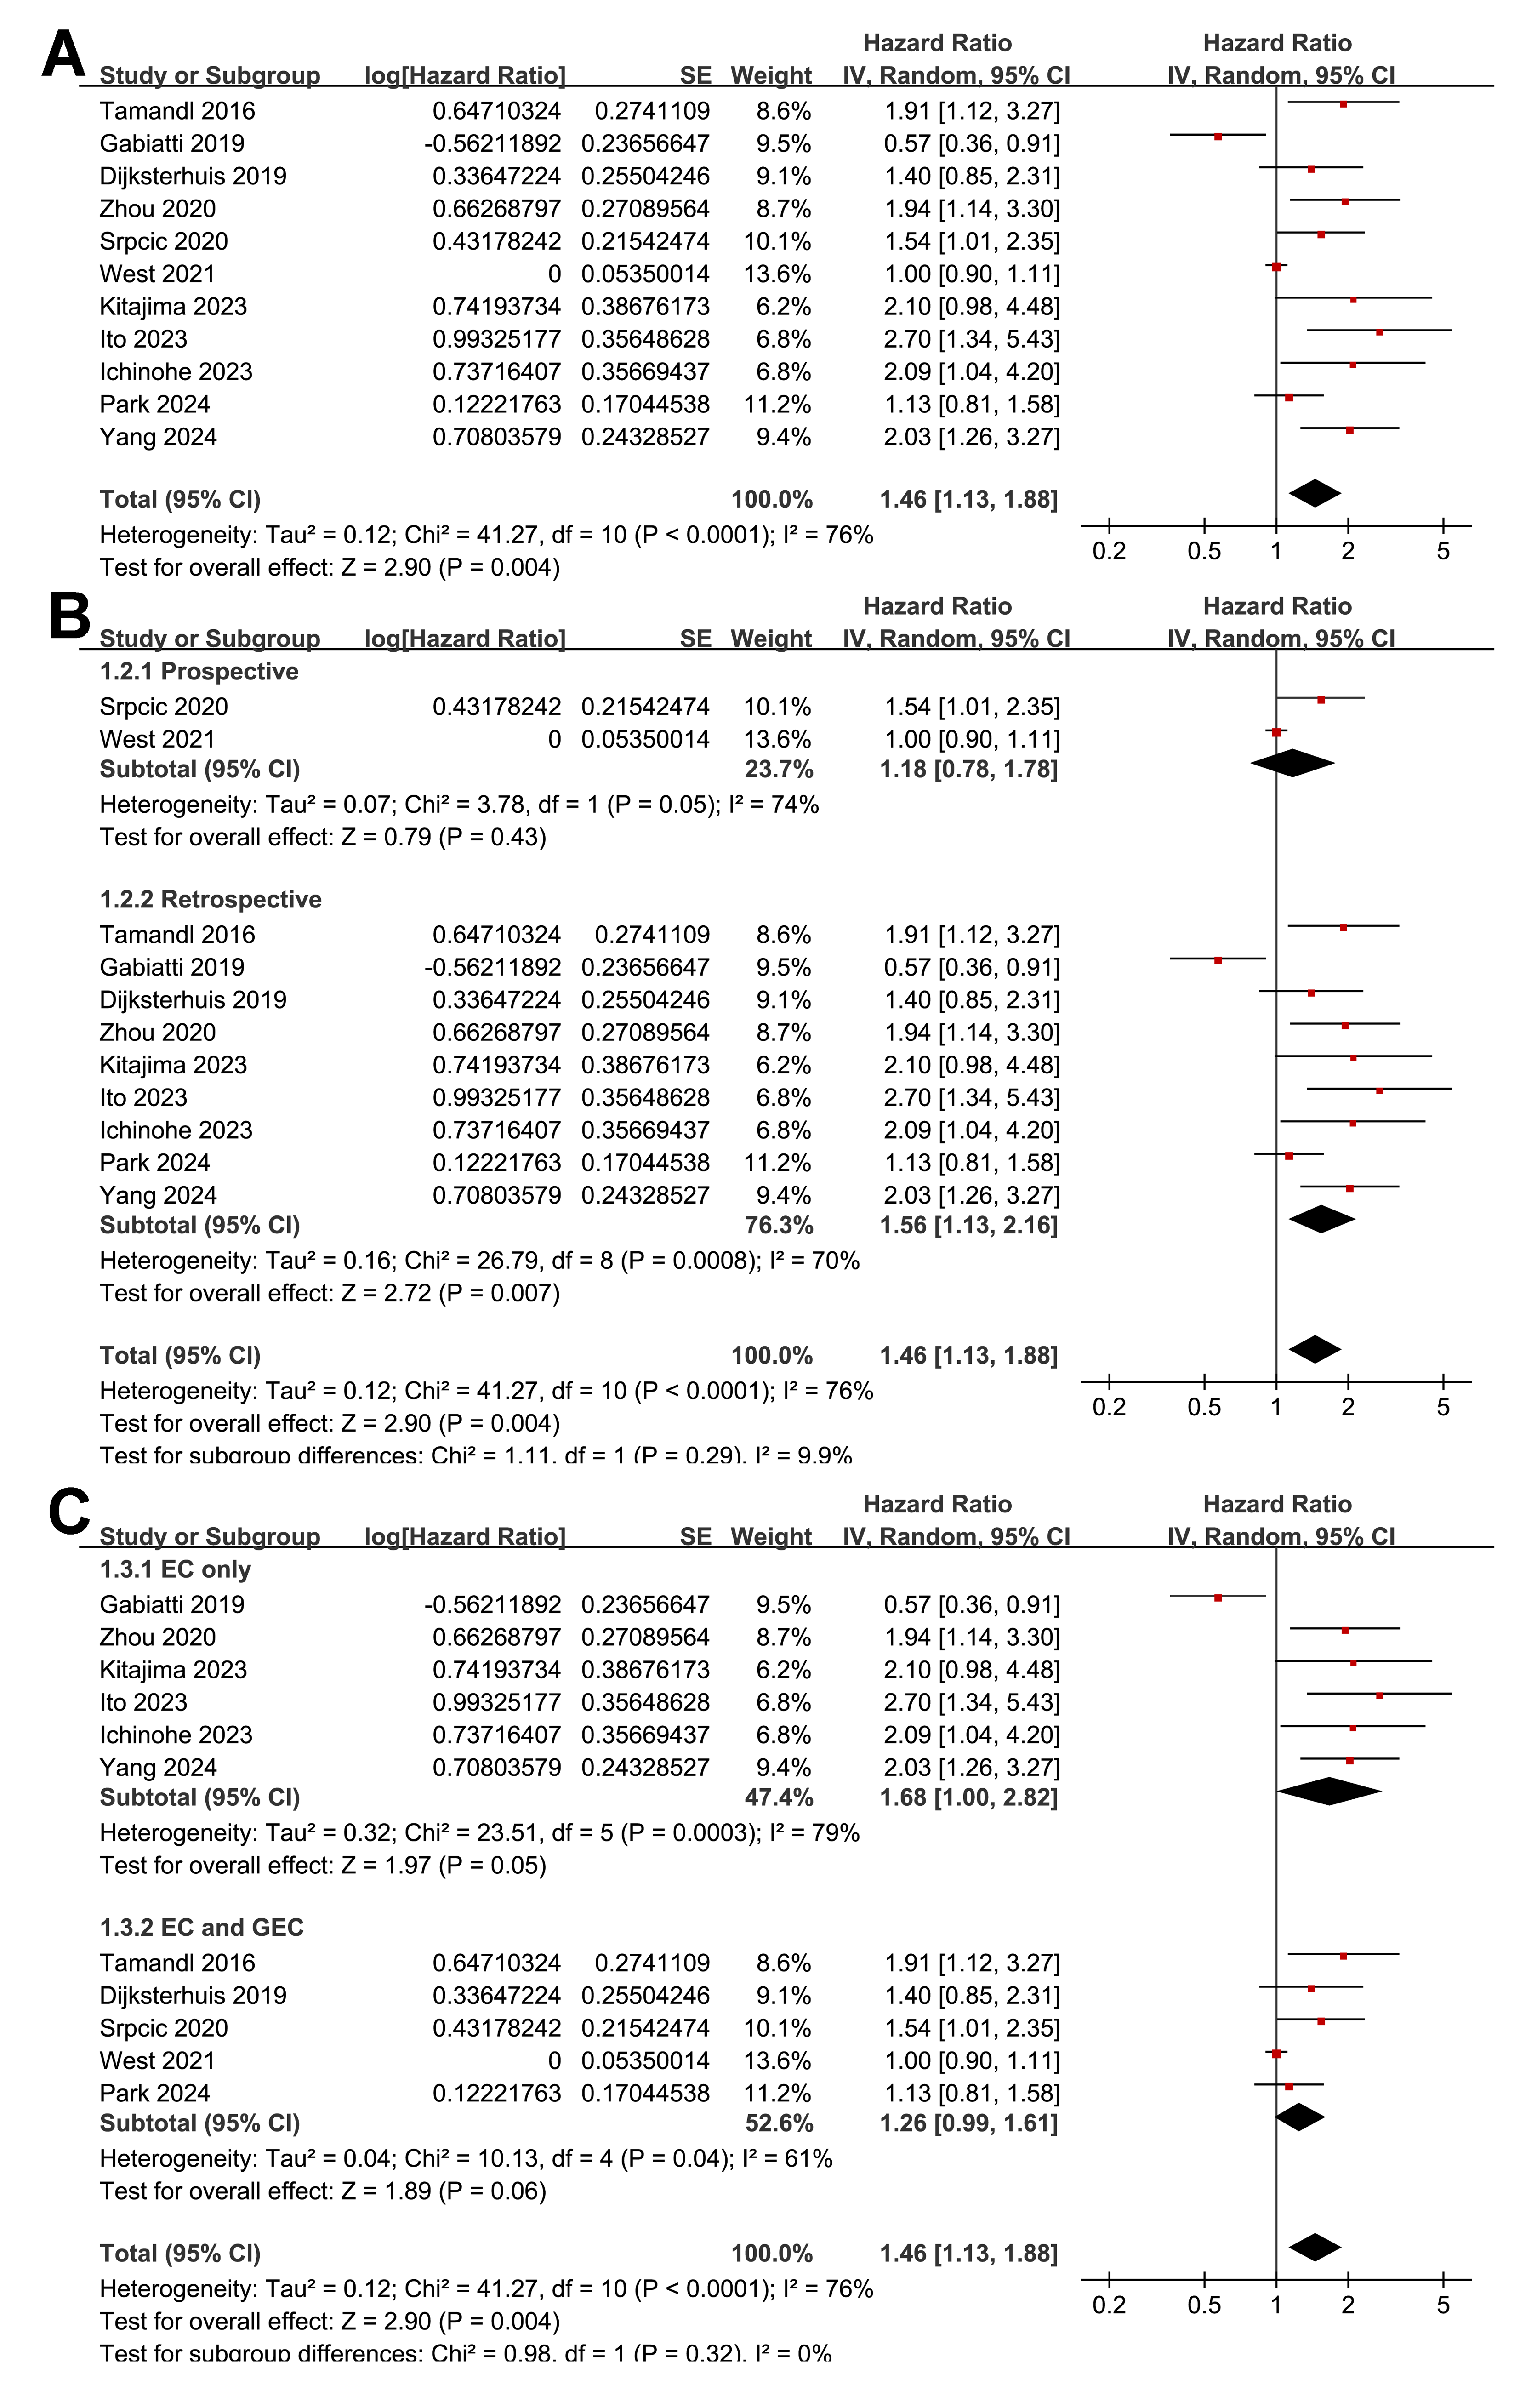
Further subgroup analyses indicated that the association between myosteatosis and poorer OS did not differ significantly between prospective and retrospective studies (HR: 1.18 vs. 1.56, p for subgroup difference = 0.29; Fig. 2B). Similar results were observed between studies including only patients with EC and those including patients with EC and GEC (HR: 1.68 vs. 1.26; p for subgroup difference = 0.32; Fig. 2C), among patients with mean ages <or ≥ 64 years (HR: 1.44 vs. 1.47; p for subgroup difference = 0.93; Fig. 3A), among populations with men <or ≥ 80% (HR: 1.35 vs. 1.59, p for subgroup difference = 0.57; Fig. 3B), and among patients receiving surgical vs. nonsurgical treatments (HR: 1.58 vs. 1.17, p for subgroup difference = 0.47; Fig. 3C).
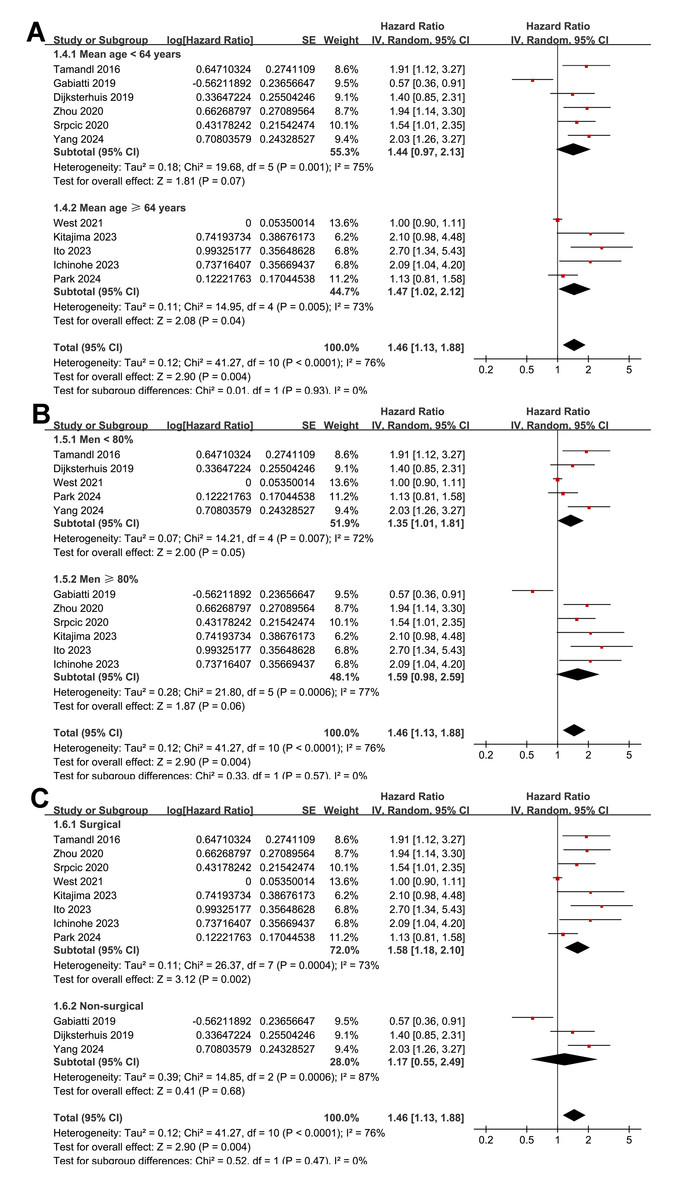
Figure 3: Forest plots for the subgroup analyses of the association between myosteatosis and OS of patients EC and GEC.
(A) Subgroup analysis according to mean ages of the patients; (B) subgroup analysis according to proportions of men; and (C) subgroup analysis according to the main anticancer treatments.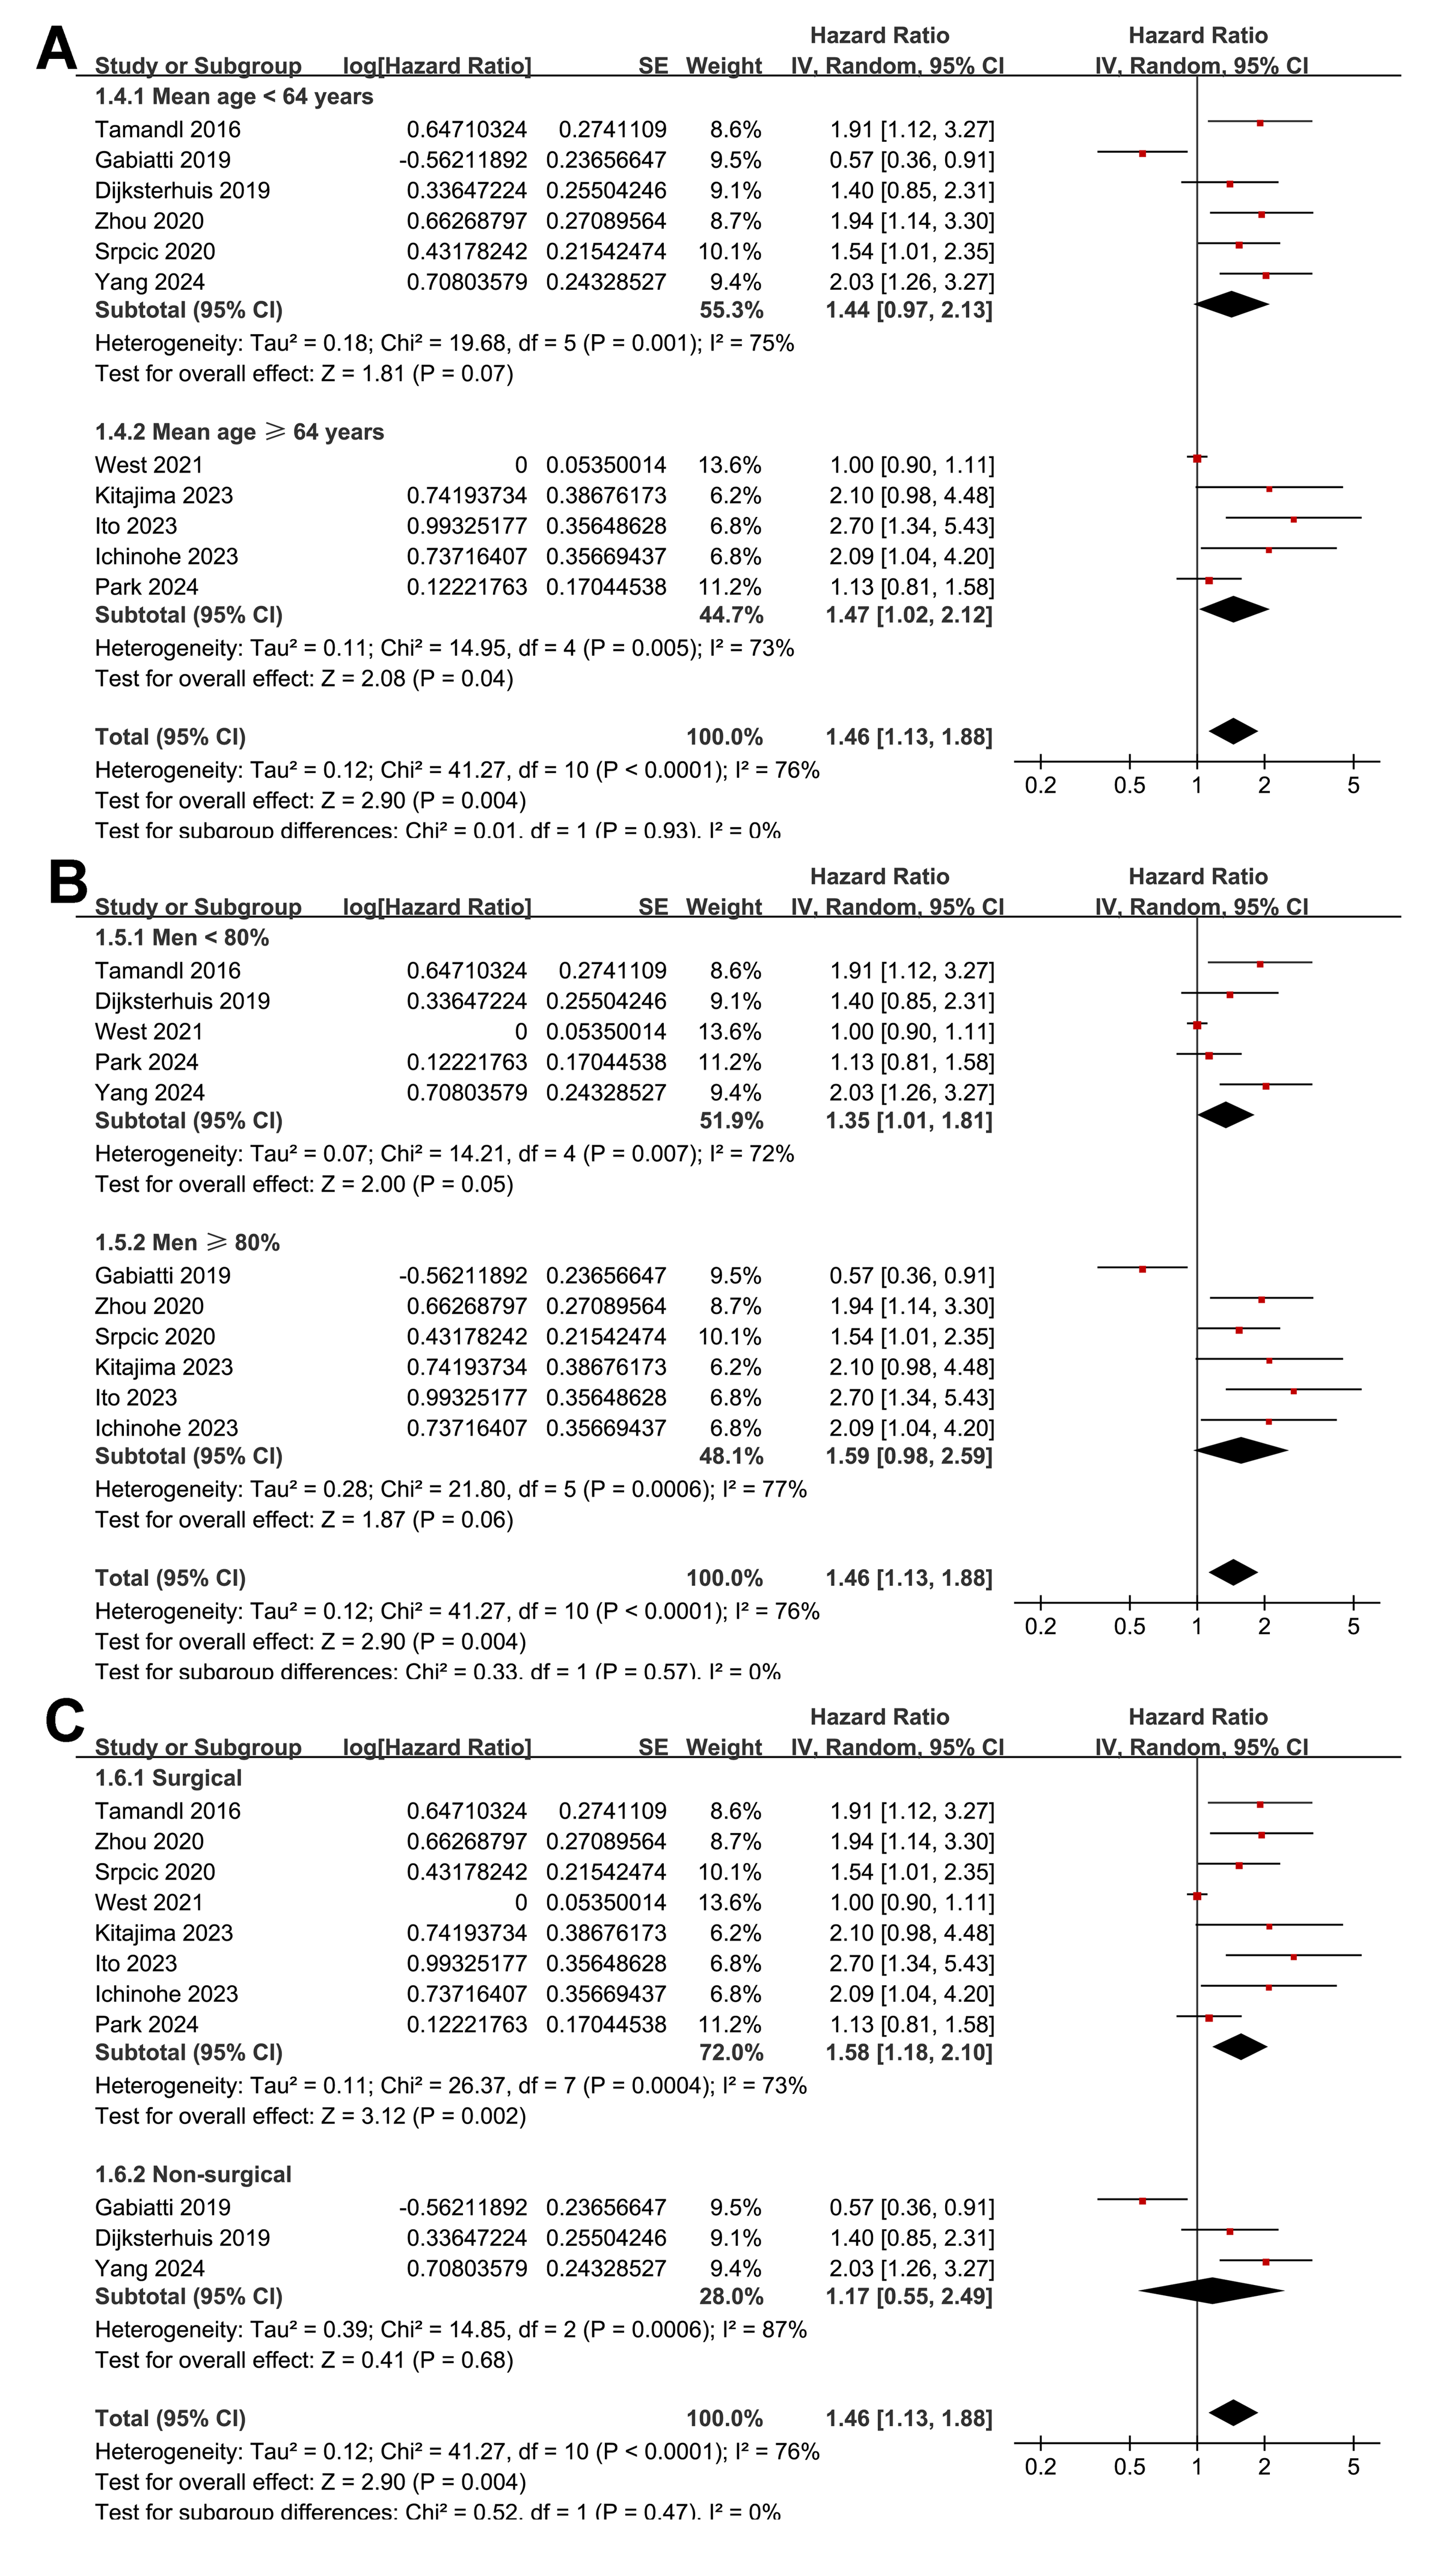
Interestingly, a stronger association between myosteatosis and poor OS was observed in studies evaluating myosteatosis with IMAC or mIMAC than with MA (HR: 2.29 vs. 1.30; p for subgroup difference = 0.02; Fig. 4A). The association also appeared stronger in studies with follow-up durations of ≥ 30 months than those of <30 months (HR: 1.79 vs. 1.16), although the difference was not statistically significant (p for subgroup difference = 0.06; Fig. 4B). Finally, consistent results were observed in studies using univariate and multivariate analyses (HR: 1.41 vs. 1.49; p for subgroup difference = 0.83; Fig. 4C).
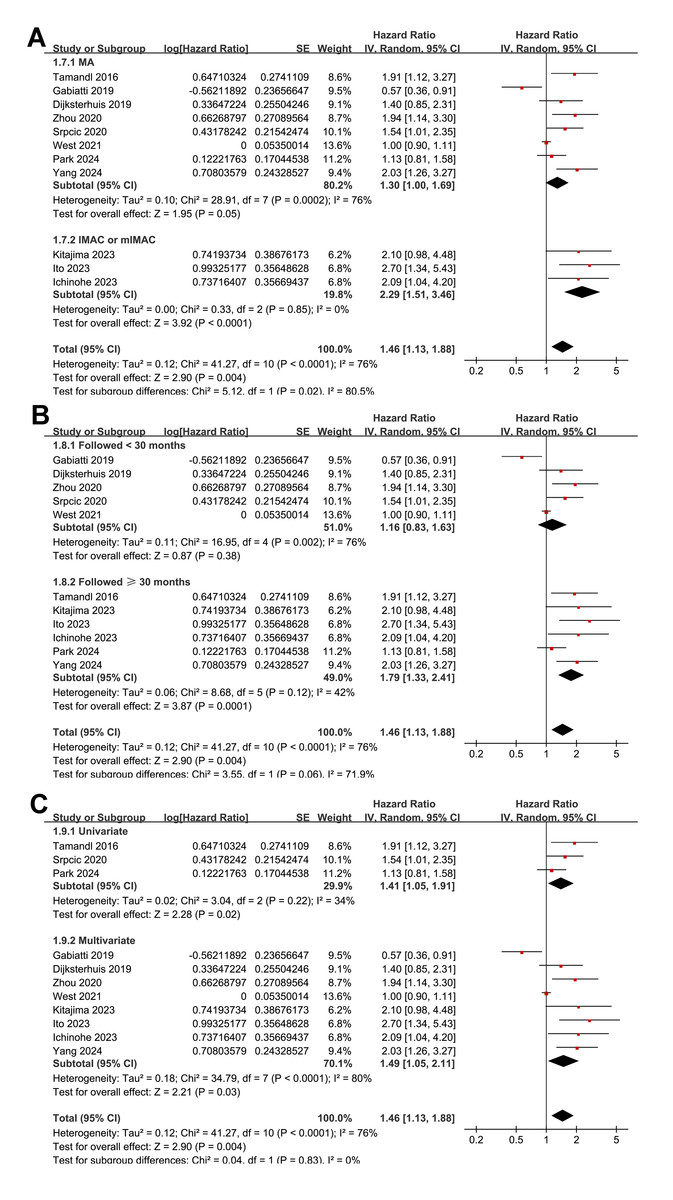
Figure 4: Forest plots for the subgroup analyses of the association between myosteatosis and OS of patients EC and GEC.
(A) Subgroup analysis according to parameters for evaluating myosteatosis; (B) subgroup analysis according to follow-up durations; and (C) subgroup analysis according to the analytic models.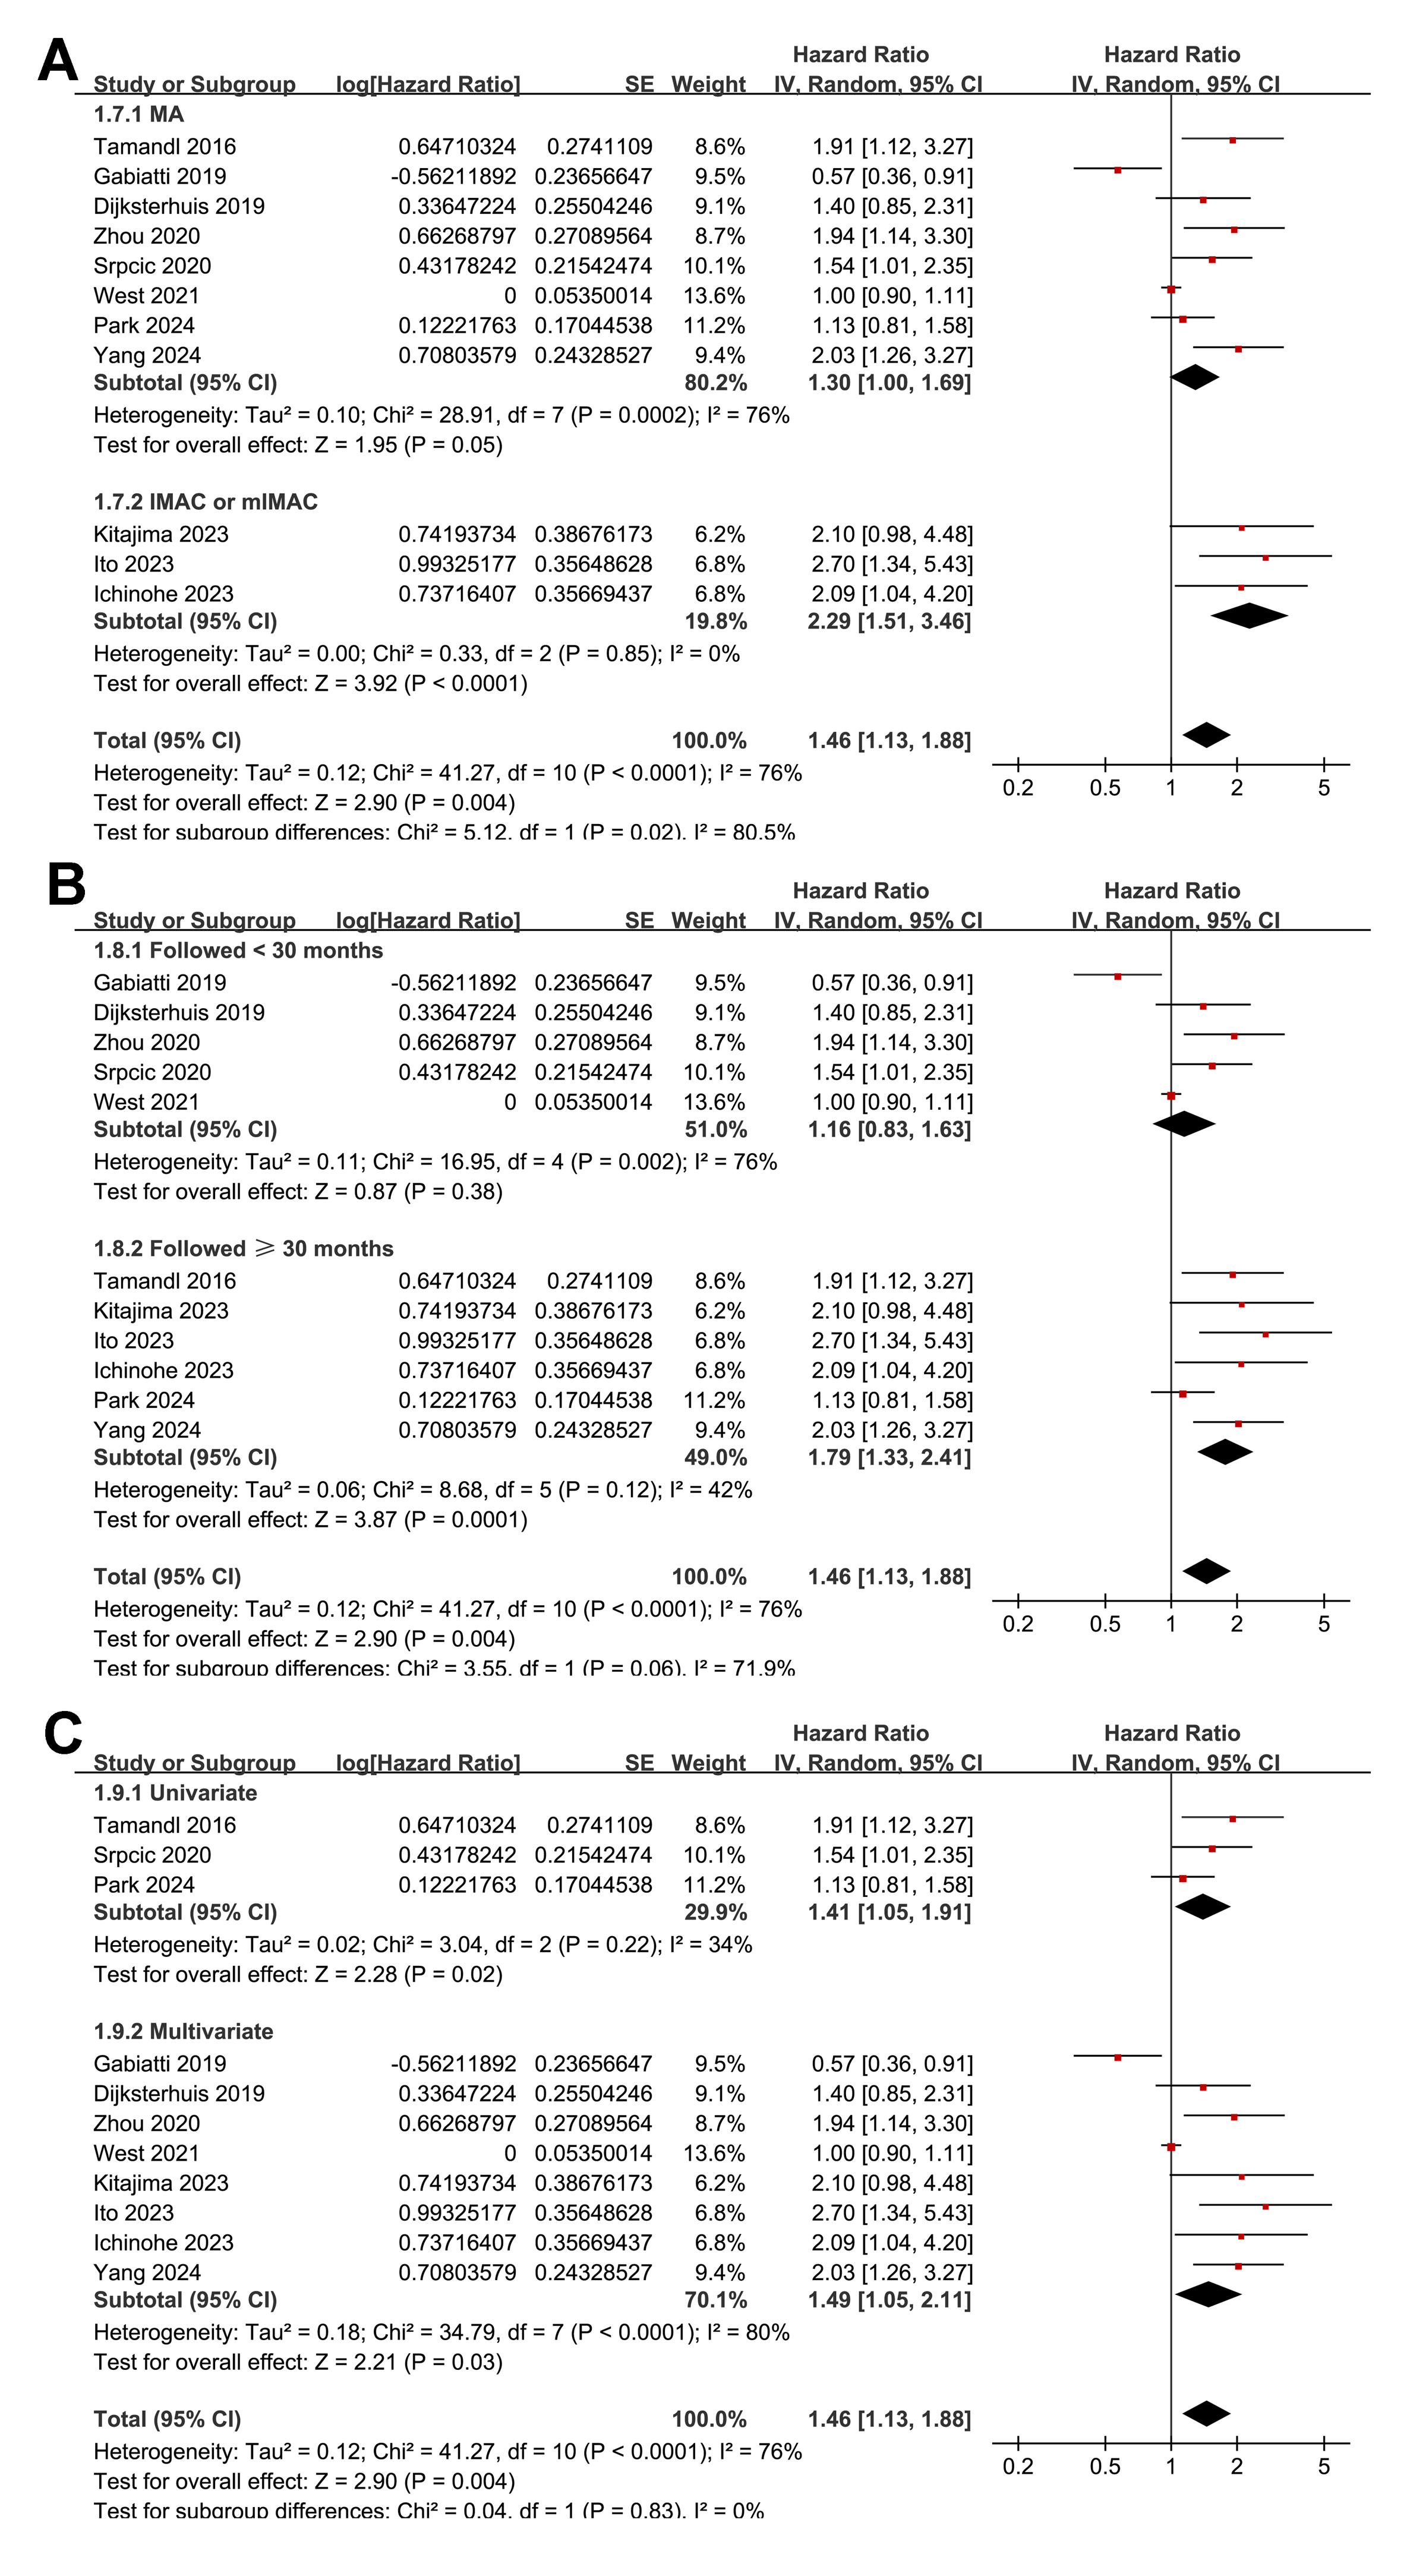
Association between myosteatosis and PFS
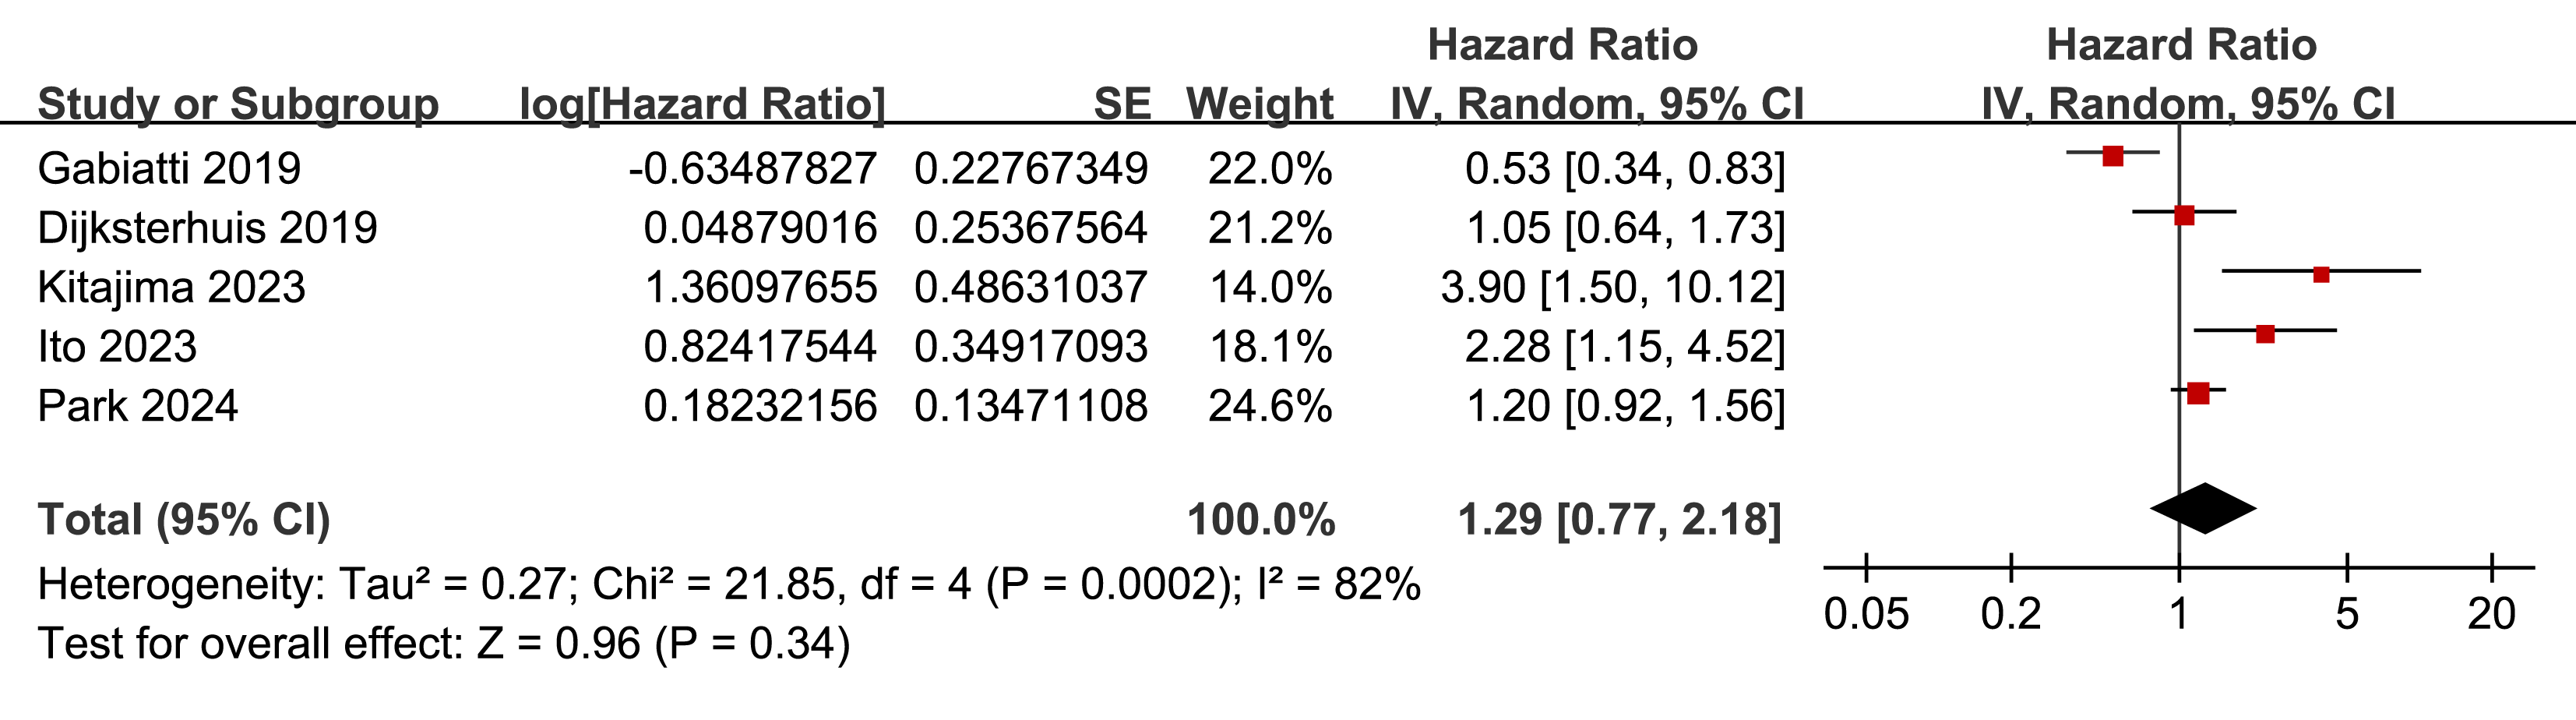
Further meta-analysis of five studies (Dijksterhuis et al., 2019; Gabiatti et al., 2019; Ichinohe et al., 2023; Kitajima et al., 2023; Park et al., 2024) showed that myosteatosis was not significantly associated with poorer PFS in patients with EC or GEC (HR: 1.29, 95% CI [0.77–2.18], p = 0.34; Fig. 5) with significant heterogeneity (p for the Cochrane Q test < 0.001; I2 = 82%). Sensitivity analyses excluding one study at a time did not materially change the results (HR: 1.07–1.58, p all > 0.05).
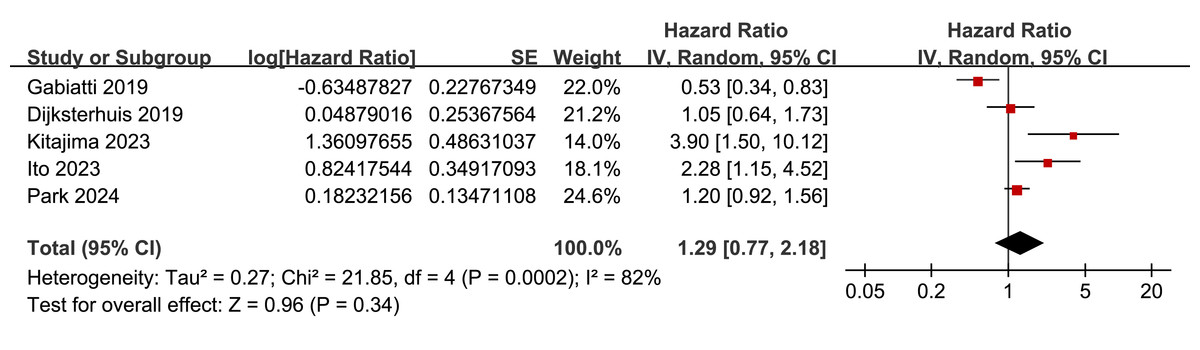
Figure 5: Forest plots for the meta-analysis of the association between myosteatosis and PFS of patients EC and GEC.
Publication bias
Funnel plots assessing the association between myosteatosis and OS/PFS in patients with EC or GEC are presented in Figs. 6A–6B. The visual symmetry of the plots suggests a low likelihood of publication bias. In the OS analysis, Egger’s test showed no significant publication bias (p = 0.41). Egger’s test was not conducted for the PFS analysis due to the limited number of studies (n = 5).
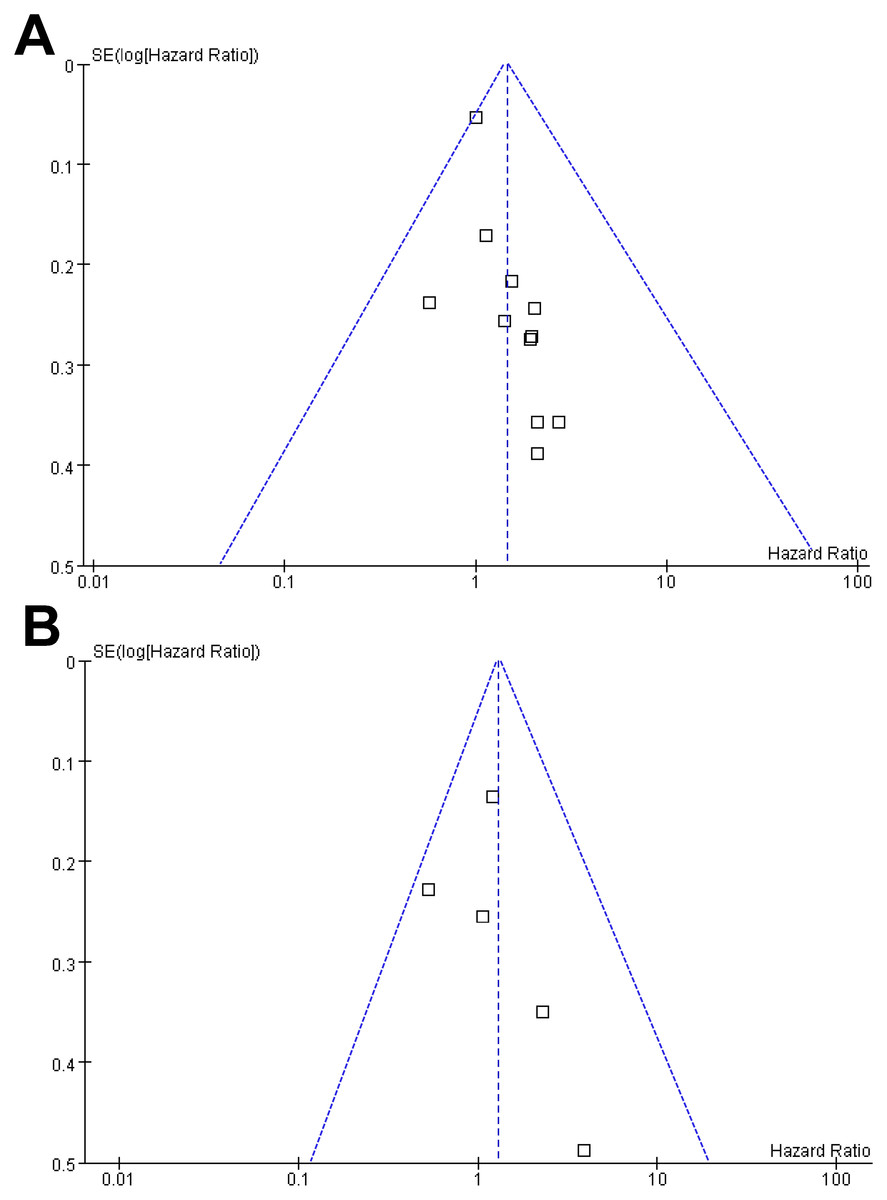
Figure 6: Funnel plots for estimating the potential publication biases underlying the meta-analyses of the association between myosteatosis and survival outcomes of patients EC and GEC.
(A) Funnel plots for the meta-analysis of the association between myosteatosis and OS; and (B) funnel plots for the meta-analysis of the association between myosteatosis and PFS.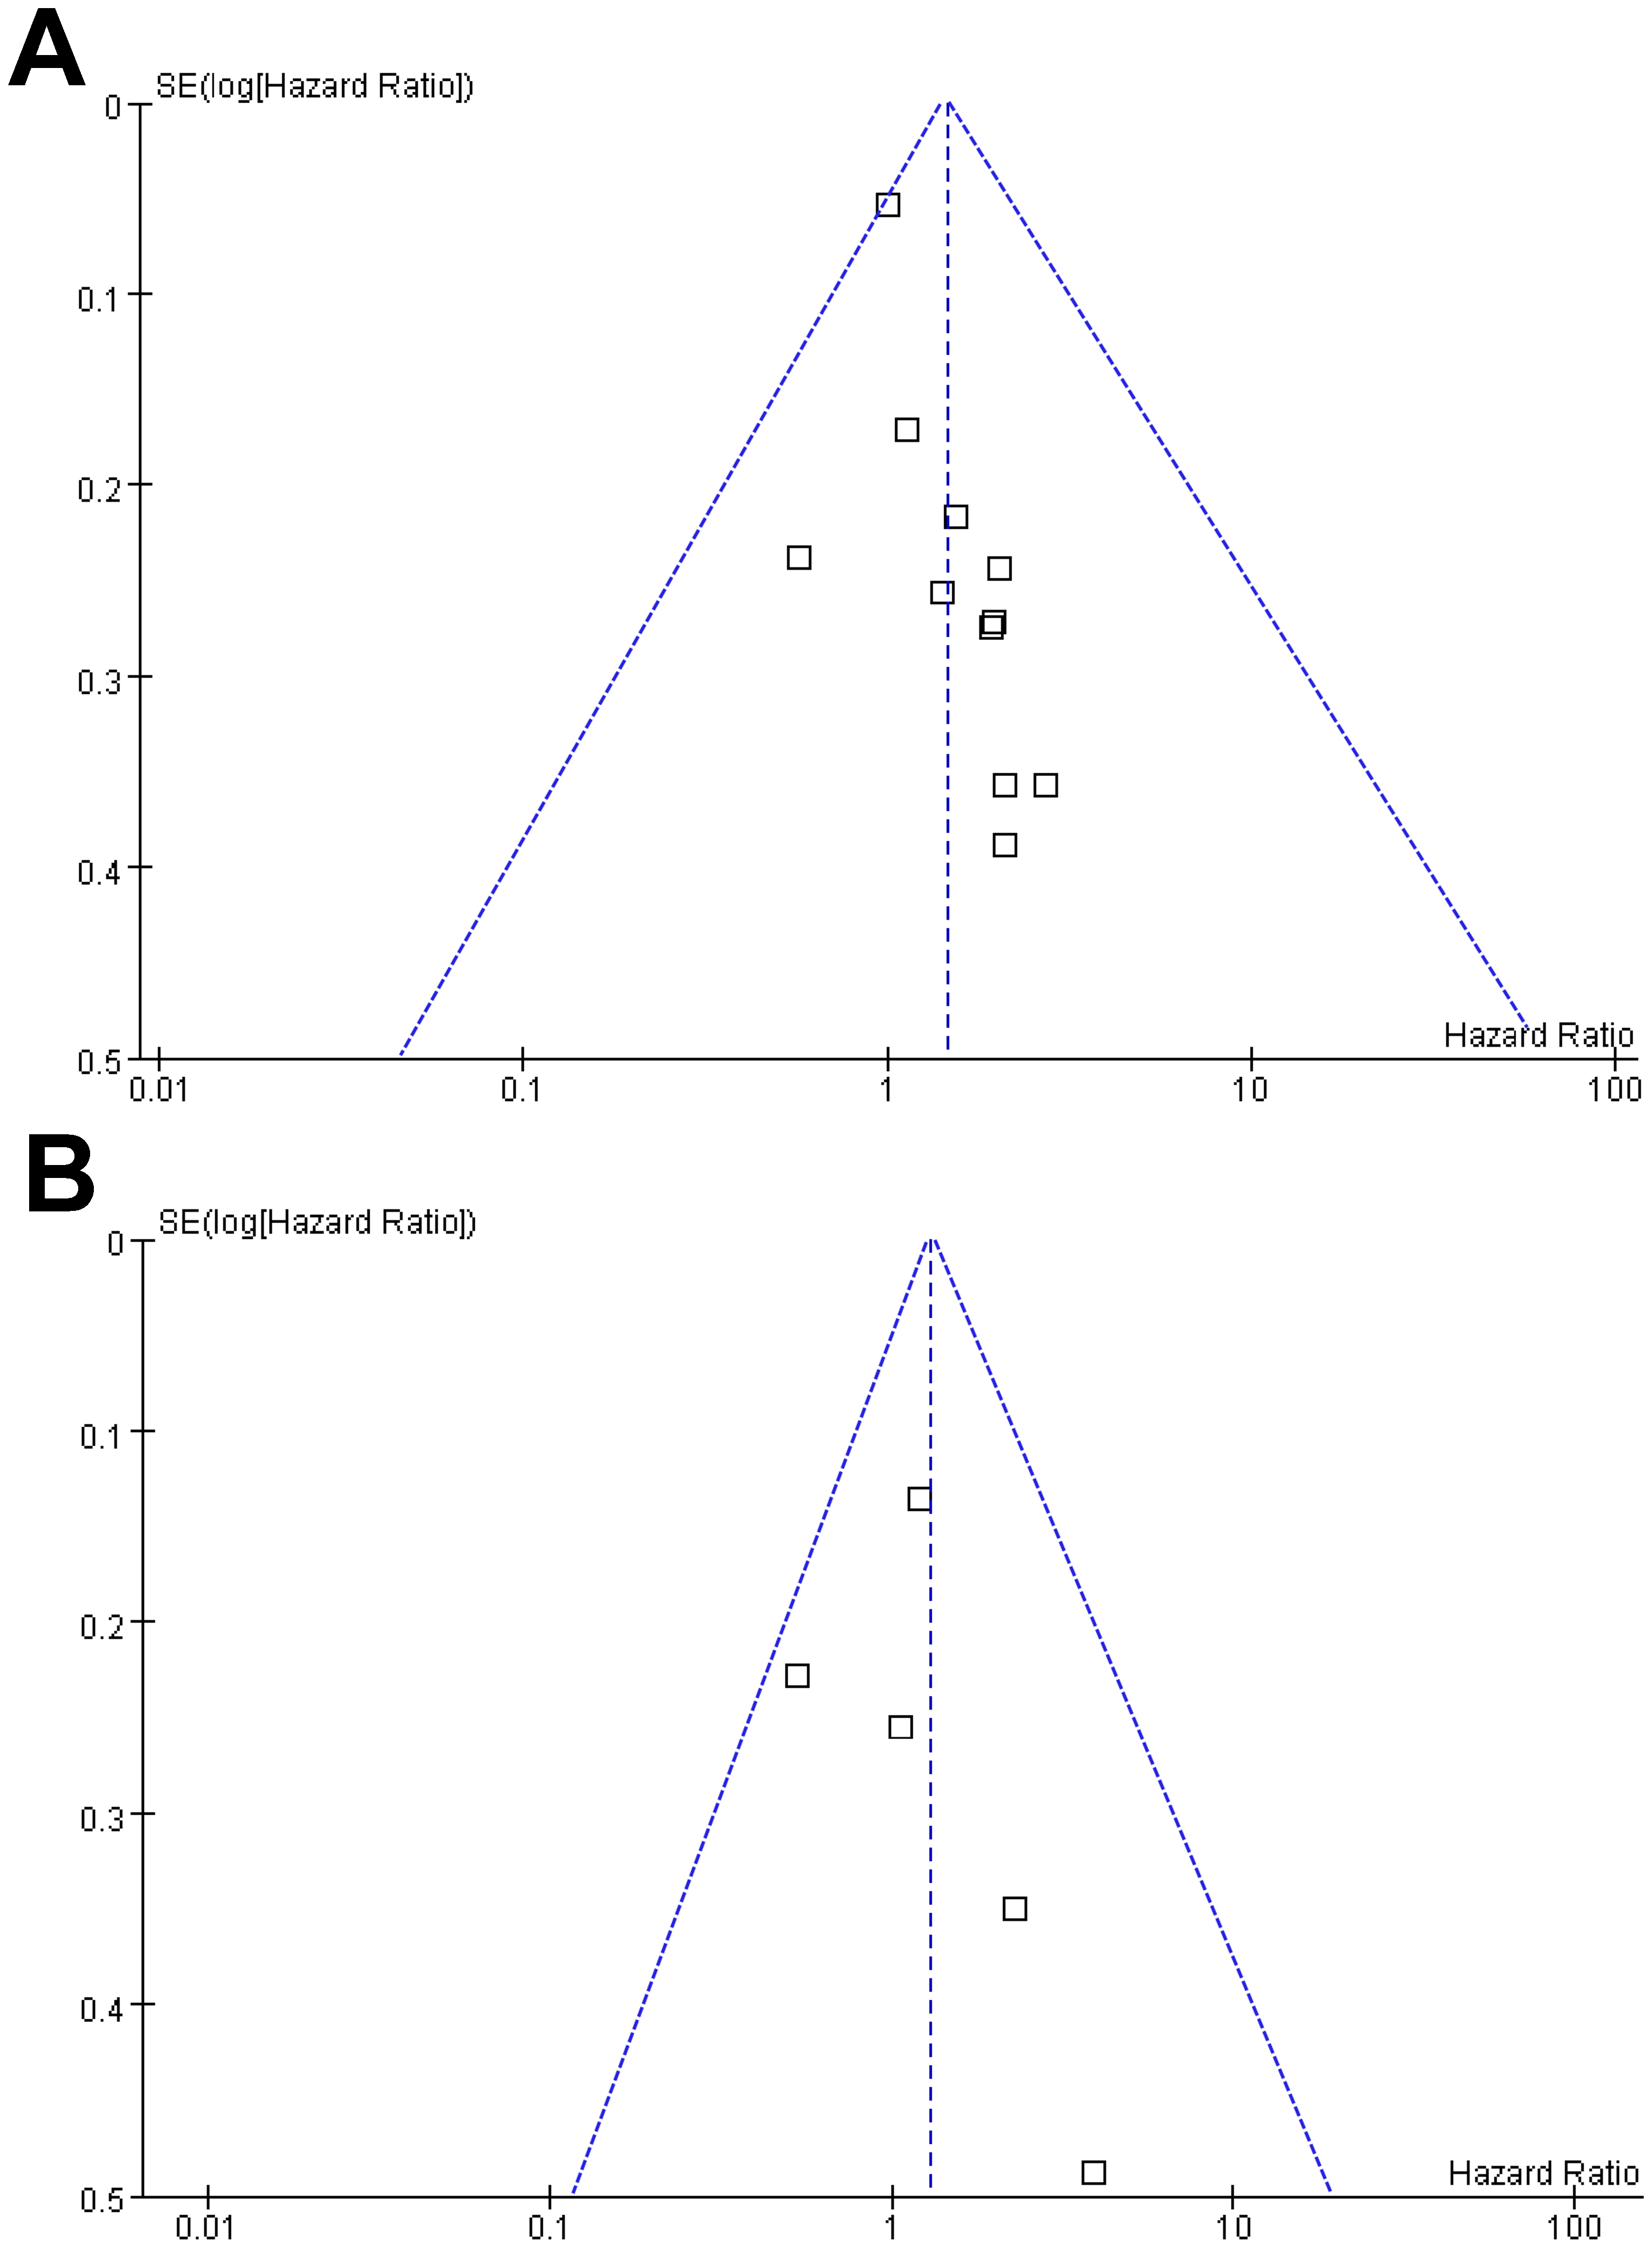
Discussion
This meta-analysis found that baseline myosteatosis was significantly linked to reduced OS in patients with EC or GEC, reinforcing its potential as a negative prognostic indicator. The association remained consistent across subgroup analyses that varied by study design, tumor type, patient age, sex, treatment approach, and statistical adjustment methods. Interestingly, studies employing IMAC or mIMAC to assess myosteatosis showed a stronger effect than those using MA. In contrast, the relationship between myosteatosis and PFS was not statistically significant, which may reflect the small number of included studies and variability in how progression was defined and measured. This study represents the first meta-analysis to comprehensively evaluate the association between baseline myosteatosis and survival outcomes in patients with EC and GEC. By synthesizing available evidence, our findings demonstrate that myosteatosis is consistently associated with poorer overall survival, supporting the clinical relevance of muscle quality assessment beyond traditional tumor-related prognostic factors.
The adverse prognostic impact of myosteatosis in EC/GEC likely reflects a combination of pathophysiological and clinical mechanisms. Biologically, fat infiltration into skeletal muscle is associated with systemic inflammation, mitochondrial dysfunction, insulin resistance, and impaired anabolic signaling pathways (Li et al., 2024; Wang, Valencak & Shan, 2024; Zhu et al., 2024). These metabolic disturbances may exacerbate cancer-related cachexia, reduce physical resilience, and adversely affect the immune microenvironment, thereby promoting tumor progression (Cole et al., 2018; Webster et al., 2020). Clinically, patients with myosteatosis may have reduced performance status (Nachit et al., 2023), diminished tolerance to chemotherapy and radiotherapy (Findlay et al., 2020; Perrier et al., 2025), and increased postoperative complication rates (Aro et al., 2020). These factors can compromise the efficacy and continuity of treatment, ultimately leading to poorer survival outcomes. However, tumor-specific in vitro models directly examining the induction of myosteatosis in EC or GEC are currently lacking, and mechanistic insights in this context remain largely inferential. Further research is warranted to clarify the molecular mechanisms linking myosteatosis to reduced overall survival in patients with EC or GEC.
The subgroup findings offer further insight into potential sources of heterogeneity. Although MA, measured in Hounsfield units, is a well-established surrogate for intramuscular fat infiltration, our subgroup analysis showed a stronger association with overall survival in studies using IMAC or mIMAC compared with those using MA. This difference likely reflects variations in methodological sensitivity rather than a fundamental biological distinction, as IMAC-based metrics may capture intramuscular lipid infiltration more directly, whereas MA can be influenced by technical factors such as CT acquisition parameters and muscle hydration status (Guo et al., 2025). These findings should therefore be interpreted as indicative of measurement heterogeneity rather than superiority of one biological construct over another. On the other hand, the largest effect estimates were observed in the three studies using IMAC or modified IMAC (Ichinohe et al., 2023; Ito et al., 2023; Kitajima et al., 2023), which quantify intramuscular fat infiltration by normalizing muscle radiodensity to subcutaneous fat. Although these indices have been applied in several oncological and surgical cohorts, they are methodologically distinct from conventional muscle attenuation and remain less widely standardized. The stronger associations observed in IMAC/mIMAC-based studies may therefore reflect differences in measurement sensitivity, cohort characteristics, or analytic approaches rather than an accurate biological amplification of risk. Consequently, the contribution of these studies to the overall pooled effect should be interpreted with caution. Another notable finding was the trend toward a stronger prognostic effect in studies with longer follow-up durations (≥ 30 months). Although the subgroup difference did not reach statistical significance, this trend may indicate that the impact of myosteatosis on survival becomes more evident over time, potentially through its influence on long-term treatment tolerance, cancer recurrence, and overall physiological decline. Conversely, the absence of a significant association with PFS may be due to insufficient statistical power, as only five studies reported PFS data. Moreover, definitions of progression and imaging follow-up intervals may differ across studies, contributing to heterogeneity and reducing the precision of pooled estimates.
Several strengths enhance the robustness of this meta-analysis. We conducted a comprehensive, up-to-date literature search across three major databases, included a relatively large total sample size, and applied consistent inclusion criteria using the PICOS framework. Quality assessment using the NOS confirmed that most studies had moderate to high methodological quality, and multiple subgroup and sensitivity analyses were performed to assess and confirm the stability of the findings. Nevertheless, several limitations must be considered. The majority of included studies were retrospective, making them susceptible to selection bias and residual confounding due to incomplete adjustment (Talari & Goyal, 2020). The cutoff values used to define myosteatosis varied across studies, with some using BMI-stratified thresholds for MA and others using median-based or sex-specific IMAC values, limiting comparability. Moreover, myosteatosis was uniformly assessed at the L3 or L4 vertebral level in the included studies. Data correlating the extent of myosteatosis with BMI or with fat infiltration in other skeletal muscle regions (e.g., thigh muscles) were unavailable, precluding further exploratory analyses. In addition, important prognostic factors, such as tumor stage, treatment regimen, and nutritional status, could not be uniformly assessed because individual patient data (IPD) were unavailable, preventing the evaluation of potential effect modification or interaction with these variables. Several other clinically relevant subgroup analyses, including those stratified by performance status or treatment line, could not be performed because most included studies did not report survival outcomes according to these variables, and IPD were unavailable. Consequently, all subgroup analyses were restricted to study-level characteristics. Moreover, although esophageal squamous cell carcinoma and adenocarcinoma differ in tumor biology and microenvironmental features (Baek et al., 2025; Lyu et al., 2025), histology-specific survival data were not consistently available across studies, precluding stratified analyses by histological subtype. Several studies did not adjust for potential confounders such as dietary intake, systemic inflammation, or comorbidities, which may have biased the observed associations. Finally, as with all meta-analyses of observational data, causality cannot be inferred from our findings.
These results have relevant clinical implications. First, myosteatosis is readily assessable using routine pre-treatment CT imaging and could serve as a noninvasive biomarker to improve prognostic stratification in patients with EC/GEC. Identifying patients with myosteatosis before treatment may help clinicians recognize those at higher risk of poor outcomes and tailor management strategies accordingly. For instance, such patients may benefit from closer surveillance, early nutritional or physical-rehabilitation interventions, or modified treatment protocols to enhance treatment tolerance. Furthermore, integrating myosteatosis assessment into clinical trials may help refine patient selection and enable more personalized approaches to cancer care. MA, measured in Hounsfield units on routine staging CT, is the most widely adopted and standardized approach, offering ease of implementation and comparability across studies (Aubrey et al., 2014). In contrast, IMAC or modified IMAC quantify intramuscular fat infiltration by normalizing muscle radiodensity to subcutaneous fat and may capture subtle changes in muscle quality. However, these methods are less commonly used, lack uniform cutoff definitions, and may be more sensitive to cohort- or protocol-specific factors (Norris et al., 2024). Accordingly, while alternative indices may enhance prognostic discrimination in selected populations, MA currently represents the most practical metric for risk stratification, and further studies are needed to harmonize assessment methods and validate clinically meaningful thresholds. Future research should aim to validate these findings in prospective studies and to develop standardized diagnostic criteria for myosteatosis in oncology. Studies with access to IPD could evaluate the joint prognostic impact of myosteatosis, sarcopenia, systemic inflammation, and nutritional status in greater detail. Clinical trials should also test whether early interventions targeting muscle quality (e.g., exercise, nutritional support, anti-inflammatory strategies) can modify the prognostic impact of myosteatosis in patients with EC or GEC (Lawson et al., 2021). The absence of dedicated in vitro or translational models linking tumor-derived factors to intramuscular adipocyte accumulation highlights an important knowledge gap and reveals the need for mechanistic studies to clarify how cancer-related inflammation and metabolic dysregulation drive myosteatosis. Furthermore, mechanistic studies are necessary to further elucidate the biological pathways linking intramuscular fat accumulation to cancer progression and treatment response. Interestingly, composite biomarkers integrating muscle quality and nutritional status have been recently proposed. In this context, the albumin–myosteatosis gauge (AMG), which combines skeletal muscle radiodensity with serum albumin, has shown independent prognostic value in patients with colorectal cancer (de Luis et al., 2025) and in those receiving immune checkpoint inhibitors (Sahin et al., 2025), likely reflecting the combined burden of myosteatosis, systemic inflammation, and malnutrition. These findings support the biological plausibility of our results and suggest that integrating muscle quality with nutritional markers may further refine risk stratification in EC/GEC.
Conclusions
This meta-analysis demonstrates that baseline myosteatosis is associated with significantly poorer OS in patients with EC or GEC. Although the association with PFS was not statistically significant, the consistent subgroup findings in the meta-analysis of OS support the clinical relevance of muscle quality as a prognostic factor. Routine evaluation of myosteatosis using imaging-based methods may provide an additional tool for risk stratification and help inform personalized care strategies in this high-risk population.