
Aging-related CD8+ T cell alterations and calcium/calmodulin dependent protein kinase 1D activation in the pathogenesis of diabetic kidney disease
- Published
- Accepted
- Received
- Academic Editor
- Faiza Farhan
- Subject Areas
- Molecular Biology, Geriatrics, Immunology, Nephrology, Medical Genetics
- Keywords
- Diabetic kidney disease, Aging, Single-cell RNA sequencing, CAMK1D, CD8+ T cell, Mendelian randomization
- Copyright
- © 2026 Zhu et al.
- Licence
- This is an open access article distributed under the terms of the Creative Commons Attribution License, which permits using, remixing, and building upon the work non-commercially, as long as it is properly attributed. For attribution, the original author(s), title, publication source (PeerJ) and either DOI or URL of the article must be cited.
- Cite this article
- 2026. Aging-related CD8+ T cell alterations and calcium/calmodulin dependent protein kinase 1D activation in the pathogenesis of diabetic kidney disease. PeerJ 14:e20762 https://doi.org/10.7717/peerj.20762
Abstract
Background
Diabetic kidney disease (DKD) is a leading cause of end-stage renal disease (ESRD), accelerates age-related decline in estimated glomerular filtration rate (eGFR), leading to a markedly increased prevalence of DKD among elderly diabetic patients. Recent studies suggest that immune dysregulation plays a pivotal role in DKD progression; however, the cellular and molecular mechanisms linking aging, immune infiltration, and DKD remain unclear.
Methods
We used single-cell RNA sequencing (scRNA-seq) analysis to characterize immune cell dynamics between the young, the elderly and DKD patients. Based on the scRNA-seq analysis, Mendelian randomization (MR) analysis of differentially expressed genes (DEGs) in CD8+ T cells were conducted to explore the casual relationship between DEGs and DKD.
Results
The CD8+ T cell cluster was the predominant T cell subtype, but its proportion gradually declined from young individuals to elderly subjects and DKD patients. MR analysis of DEGs in CD8+ T cells suggested that calcium/calmodulin dependent protein kinase 1D (CAMK1D) exhibited strongest causal relationship with DKD. CAMK1D was upregulated in DKD kidney tissues, and its expression was localized to CD8+ T cells, as confirmed by immunofluorescence staining. Functional analysis indicated that CAMK1D+ CD8+ T cells engaged in pro-inflammatory and pro-fibrotic signaling with various renal cell types and showed enrichment in metabolic pathways related to DKD.
Conclusion
Our results highlighted the important role of CD8+ T cell in shaping the renal immune microenvironment in both DKD and aging. CAMK1D may serve as a shared molecular risk factor linking aging and diabetic renal injury.
Introduction
Diabetic kidney disease (DKD), one of the most severe microvascular complications of diabetes, has become the leading cause of end-stage renal disease (ESRD) globally (Cheng et al., 2021). Approximately 30% of patients with type 1 diabetes mellitus (T1DM) will develop DKD within 10 years of disease onset, while individuals with type 2 diabetes mellitus (T2DM) may already present with DKD at the time of diagnosis (Kato & Natarajan, 2019). In the early stages of DKD, symptoms are often not apparent, presenting primarily as mild proteinuria. As the condition progresses, long-term hyperglycemia leads to metabolic disturbance (Wu et al., 2025) and hemodynamic abnormalities, which activated pro-inflammatory and pro-fibrotic pathways within the kidney, resulting in the development of significant proteinuria and renal dysfunction (Elwakiel, Mathew & Isermann, 2024; Reidy et al., 2014).
Estimated glomerular filtration rate (eGFR) is a key biomarker for evaluating renal function in DKD. In healthy kidney donors, eGFR declines by approximately 6.3 mL/min/1.73 m2 per decade, with an even more obvious decline in older adults (Denic, Glassock & Rule, 2016). Diabetes, a major risk factor for chronic kidney disease (CKD), further accelerates this age-related decline in eGFR, leading to a markedly increased prevalence of DKD among elderly diabetic patients (Solini et al., 2013; Tracey et al., 2016). The ZODIAC-24 study (Drion et al., 2012) reported that 42% of patients with T2DM aged over 75 had reduced eGFR, and 52% exhibited proteinuria. These clinical findings suggest that aging is a critical factor that exacerbates DKD progression. Consistent patterns have also been observed in the underlying pathophysiological mechanisms (Denic, Glassock & Rule, 2016). Despite ongoing advancements in DKD therapies, their efficacy in elderly patients remains limited. This therapeutic gap reflects the complex interplay between age-related physiological changes, comorbidities, and the unique pathophysiological features of DKD in older adults. Consequently, managing DKD in the elderly remains a considerable challenge, highlighting the urgent need to elucidate its pathogenesis and develop age-adapted treatment strategies.
In recent years, accumulating evidence suggests that, in addition to metabolic and hemodynamic disturbances, DKD is closely linked to aberrant immune activation. Age-related immunosenescence further exacerbates renal injury in elderly patients. Under physiological conditions, senescent cells are cleared by the immune system. However, in chronic pathological conditions such as DKD, they persist and release pro-inflammatory and pro-fibrotic factors that drive disease progression. In aged individuals, dysfunctional macrophages and T cells accumulate in the renal parenchyma and secrete inflammatory cytokines, such as interleukin-6 (IL-6) and tumor necrosis factor-alpha (TNF-α), which promote glomerular basement membrane thickening, mesangial expansion, and tubulointerstitial fibrosis. Hyperglycemia further activates inflammatory pathways and induces oxidative stress and the accumulation of advanced glycation end products (AGEs), which amplify renal inflammation and fibrosis (Prantner, Nallar & Vogel, 2020). Together, these immune-related processes and metabolic insults synergistically heighten renal stress and hasten DKD progression in older adults.
Against this background, T cells—particularly CD8+ and CD4+ subsets—are recognized as important contributors to immune dysregulation in DKD. As renal function declines, patients exhibit reduced CD3+ and CD4+ T-cell counts, along with a shift of CD8+ T cells toward more differentiated and proinflammatory CD28− and CD57+ phenotypes. Thus, abnormal T-cell activation and senescence have become fundamental to understanding the immune mechanisms underlying DKD, yet the molecular mediators that link these aging-related immune alterations to renal injury remain unclear. CD8+ T cells, in particular, represent an immunologically dynamic subset susceptible to age-associated functional decline, but the regulators driving their dysfunction in DKD have not been identified. To address this gap, the present study integrates single-cell transcriptomic data from the Gene Expression Omnibus (GEO) database with Mendelian randomization (MR) analysis to identify potential causal mediators connecting immune aging, CD8+ T-cell dysregulation, and DKD pathogenesis.
Methods
Single-cell RNA sequencing data analysis
Single-cell RNA sequencing (scRNA-seq) analysis was conducted using two publicly available CKD datasets from the GEO database: GSE183276 and GSE211785. GSE183276 comprises 14 DKD patients and 20 controls, while GSE211785 consists of 13 DKD patients and 26 negative controls. Six DKD patients, six young individuals, and six elderly individuals were selected from these datasets for integrated and analysis (details provided in Table S1). Data quality control was performed using Seurat (version 5.1.0), applying filtering criteria that included genes expressed in each cell ranging between 500 and 4,000, and mitochondrial content less than 10%. Standardization and normalization were then performed, followed by dimensionality reduction and clustering based on the top 2,000 highly variable genes. Doublets were removed, and cell annotation was carried out using the sc-Type method (Ianevski, Giri & Aittokallio, 2022). Batch-effect correction was applied using Harmony (version 1.2.1).
Sc-type cell type annotation
To annotate cell types for different cell clusters (p), given an scRNA-seq dataset (X) with m genes and n cells, Sc-Type first normalizes the expression profile of each gene as a z-score across all cells. Subsequently, it compares only the positive and negative marker genes corresponding to distinct cell types within the specified tissue (immune cell subtype markers were obtained from the ScType database, details provided in Table S2) (Lake et al., 2023). Next, the expression level of each gene is then multiplied by its cell-type-specific score (): where X′ represents the scRNA-seq expression matrix for n cells and Mt denotes the vector of marker genes for all cell types in tissue t. Z denotes the z-score transformation. The transformed expression values for each specific cell type (c) in the tissue are aggregated into a cell-type-specific marker enrichment score: -. Here, χ′ represents the unique column of X′ corresponding to a single cell; i and j are indices for positive marker genes of a given cell type, whereas k and l are indices for negative marker genes not expected to be expressed in the cell type. This transformation results in a normalized expression matrix of dimensions c×n, where each row corresponds to a cell type and each column corresponds to a cell. Finally, for each specific cluster p, values across the corresponding row (cell type) are summed to calculate the group-level enrichment score (ScType score): ScType score. The cell type with the highest ScType score is assigned to the respective p cluster.
Bulk RNA sequencing data acquisition
Bulk RNA sequencing (bulk RNA-seq) data for DKD were retrieved from the GEO database. By using the keyword “Diabetic nephropathy” and specifying Homo sapiens as the organism, the dataset GSE166239 was identified, which includes six DKD samples and six healthy controls.
Mendelian randomization analysis of key genes
Differentially expressed genes (DEGs) specific to naive CD8+ T cells were identified by comparison with other cell subpopulations. Gene ID conversion was performed using the ‘clusterProfiler’ and ‘org.Hs.eg.db’ R packages. Two-sample MR analysis was conducted to investigate the potential causal relationship between these genes and DKD. Summary-level MR data were retrieved from the IEU Open GWAS database (https://gwas.mrcieu.ac.uk/). The training dataset was ebi-a-GCST90018832, and the validation dataset was finn-b-DM_NEPHROPATHY. These GWAS datasets were selected based on their inclusion of large European-ancestry cohorts with well-characterized DKD phenotypes, providing adequate statistical power and population comparability to the transcriptomic datasets derived primarily from Caucasian donors in the GEO database. MR analysis was conducted using ‘TwoSampleMR’ R package (version 0.6.8) and ‘ieugwasr’ R package (version 1.0.1) ensuring that selected single nucleotide polymorphisms (SNPs) met the following three assumptions: (i) relevance assumption: genetic instruments must be associated with exposure; (ii) independence assumption: genetic instruments must be independent of confounding factors; and (iii) exclusion restriction assumption: genetic instruments must influence the outcome only through exposure. SNPs strongly associated with exposure (p < 5 × 10⁻⁸) were selected as instrumental variables (IVs), with R2 < 0.1 and kb = 10,000 applied to remove linkage disequilibrium effects. An F-statistic > 10 was was used to exclude weak instrument bias (Larsson, Butterworth & Burgess, 2023; Palmer et al., 2012). Five distinct MR methods were applied: inverse variance weighted (IVW) as the primary method, with MR Egger, weighted median (WM) simple mode, and weighted mode as Supplementary Methods. Sensitivity analyses were also performed, including Cochran’s Q test for heterogeneity, the MR-Egger intercept for pleiotropy, and a leave-one-out analysis to detect and correct potential biases or influential outliers.
Reverse mendelian randomization analysis
To assess whether DKD has a causal effect on the expression of key genes, a reverse MR analysis was conducted using the TwoSampleMR (version 0.6.8). In this analysis, DKD-associated SNPs were used as IVs, while the identified key genes were treated as outcome variables.
Clinical tissue samples
Human kidney tissues were obtained from patients with biopsy-confirmed DKD at different pathological stages (II, III, and IV), classified according to the Renal Pathology Society (Tervaert et al., 2010) criteria. All specimens were collected at the Affiliated Hospital of Nanjing University of Chinese Medicine (Jiangsu Province Hospital of Chinese Medicine). Each sample represented one disease stage and was used to access the expression and localization of CAMK1D in DKD renal tissue. Because kidney biopsy is rarely performed in healthy individuals, normal control samples were not available. Clinical and laboratory data at the time of biopsy, including eGFR, urinary albumin-to-creatinine ratio (UACR), and glycated hemoglobin (HbA1c), are summarized in Table S3. This study was approved by the Ethics Committee of Affiliated Hospital of Nanjing University of Chinese Medicine, Jiangsu Province Hospital of Chinese Medicine. All patients provided written informed consent (Ethical Application Ref: 2024NL-120-02).
Double immunofluorescence staining
Paraffin-embedded tissue sections were deparaffinized and underwent antigen retrieval using EDTA antigen buffer (Servicebio, Beijing, China). After blocking with 3% BSA for 30 min, a mixture of CAMK1D and CD8 primary antibodies was applied, followed by overnight incubation at 4 °C. Secondary antibodies were added and incubated at room temperature for 50 min, after which DAPI staining was performed for 10 min. An autofluorescence quencher (Servicebio, Beijing, China) was applied before mounting with an anti-fluorescence quenching mounting medium. Fluorescent images were captured using a fluorescence microscope (Nikon, Tokyo, Japan). Details of the primary antibodies are provided in Table 1.
Results
scRNA-seq analysis of DKD, young, and elderly kidney tissues
A flow chart of the study design is presented in Fig. 1. scRNA-seq data were retrieved from the GEO datasets GSE211785 and GSE183276, from which kidney samples were selected from six DKD patients, six young healthy individuals, and six elderly healthy individuals (Table S1). In total, 48,980 single kidney cells were analyzed, comprising 20,905 from DKD patients, 9,160 from young controls, and 18,915 from elderly controls (Table 2). As these single-cell data sets originated from distinct datasets, batch effects were corrected using the “Harmony” algorithm. After initial quality control, 24 major cell clusters were identified at a resolution of 0.8. After doublet removal, a total of 26,041 cells were included for downstream scRNA-seq analysis, comprising 10,667 cells from DKD patients, 4,870 from young individuals, and 10,504 from elderly individuals (Table 3, Figs. S1A–SH). A total of 19 major cell clusters were identified and annotated using the “ScType” algorithm (Fig. S2A). These clusters were classified into nine distinct kidney cell populations: connecting tubule cells, endothelial cells, intercalated cells, pericytes, podocytes, principal cells, proximal tubule cells, thick ascending limb cells, and immune cells (Figs. 2A, 2B). Notably, immune cell infiltration was significantly increased in both DKD and elderly individuals, suggesting that immune activation is a common feature of both DKD and age-associated renal alterations.
Immune cell subpopulation analysis in DKD, young, and elderly kidney tissues
Numerous studies have demonstrated that immune cell infiltration and associated signaling pathways play essential roles in the progression of DKD (Fu et al., 2022; Guo et al., 2022; Peng et al., 2024; Tang & Yiu, 2020). In our data, immune cells accounted for a significantly greater proportion in DKD kidney tissues compared to healthy kidneys from young and elderly individuals (Fig. 2B). Immune cell clusters were extracted and subjected to batch correction and dimensionality reduction, resulting in 18 distinct clusters (Figs. S2B–SD). These clusters were re-annotated using the ScType method, and five primiary immune cell subtypes were identified: natural killer T cells, neutrophils, non-classical monocytes, plasma cells, and T cells (Fig. 2C). Among these, T cells were the most abundant immune cell type in DKD samples, followed by those from elderly individuals, and were least abundant in the young cohort (Fig. 2C). However, analysis of the relative proportion of T cells within the total immune cell compartment revealed a decreasing trend from young individuals to elderly individuals and DKD patients (Fig. 2D). These results indicate that although the absolute number of T cells increases, their relative abundance within the immune microenvironment declines with aging and disease, suggesting that T cells may play a progressively active yet tightly regulated role in DKD.
| Primary antibody | Catalog number | Manufactures | Species | Dilution ratio | Secondary antibody |
|---|---|---|---|---|---|
| CAMK1D | ab172618 | Abcam | Rabbit | 1:100 | Alexa Fluor 488 Goat anti-rabbit IgG |
| CD8 | Gb12068 | Servicebio | Mouse | 1:1000 | CY3 Goat anti-rabbit mouse IgG |
To further investigate T cell, their clusters were reanalyzed after batch effect correction and dimensionality reduction. A total of nine major T cell clusters were identified (Figs. S2E—SG), and three distinct T cell subtypes were annotated using ScType: CD8+ T cells, CD4+ T cells, and γδ T cells (Fig. 2E). The total number of CD8+ T cells followed the same increasing trend as total T cells across the three groups. However, the proportion of CD8+ T cells within the T cell population was highest in DKD, followed by the young group, and lowest in the elderly group, which differed from the proportion of T cells observed at the immune cell level (Fig. 2F). In DKD, both the absolute number and proportion of CD8+ T cells were the highest among all groups, indicating that CD8+ T cells represent the most prominently altered T cell subpopulation within the DKD immune microenvironment and may be involved in the pathogenesis of the disease.
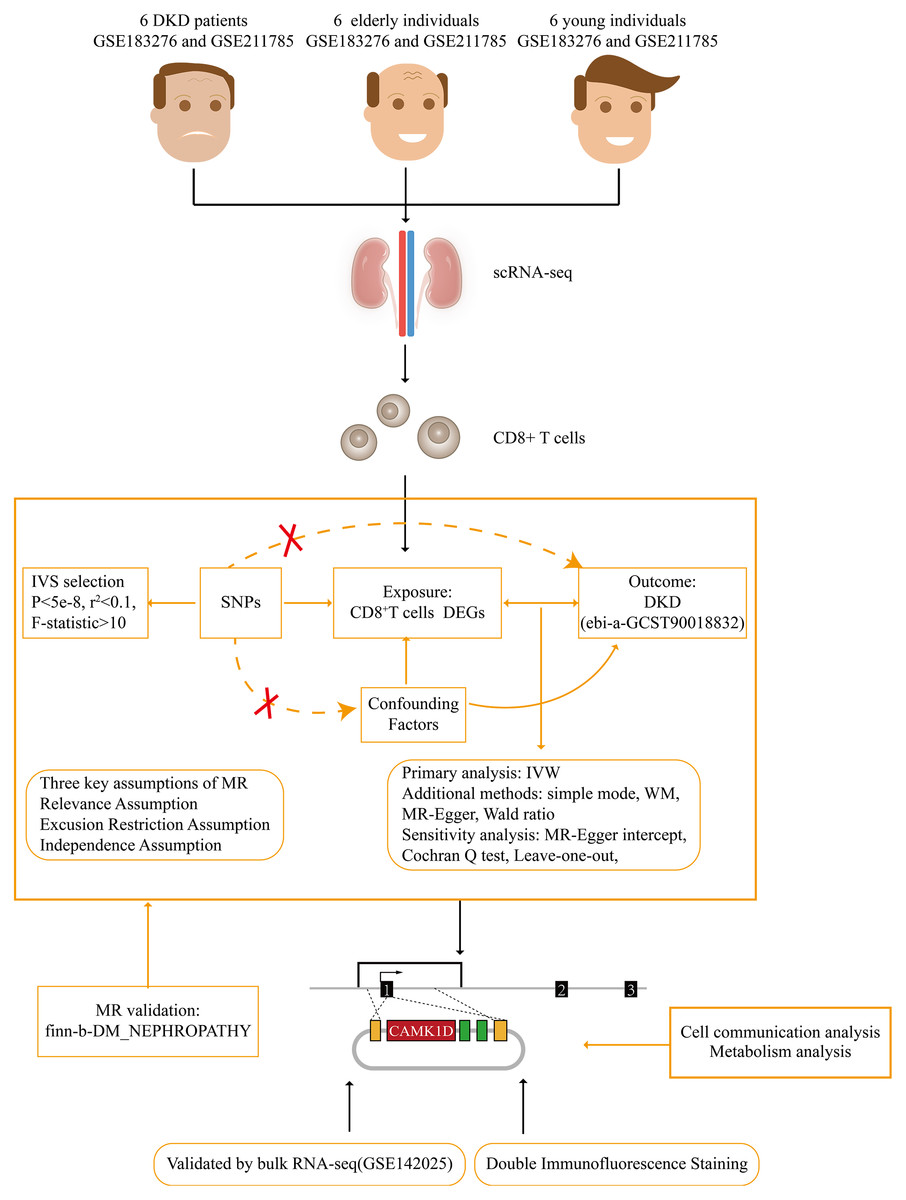
Figure 1: Flow chart of this study.
DKD, diabetic kidney disease; MR, Mendelian randomization; IVW, inverse variance weighted; WM, weighted median.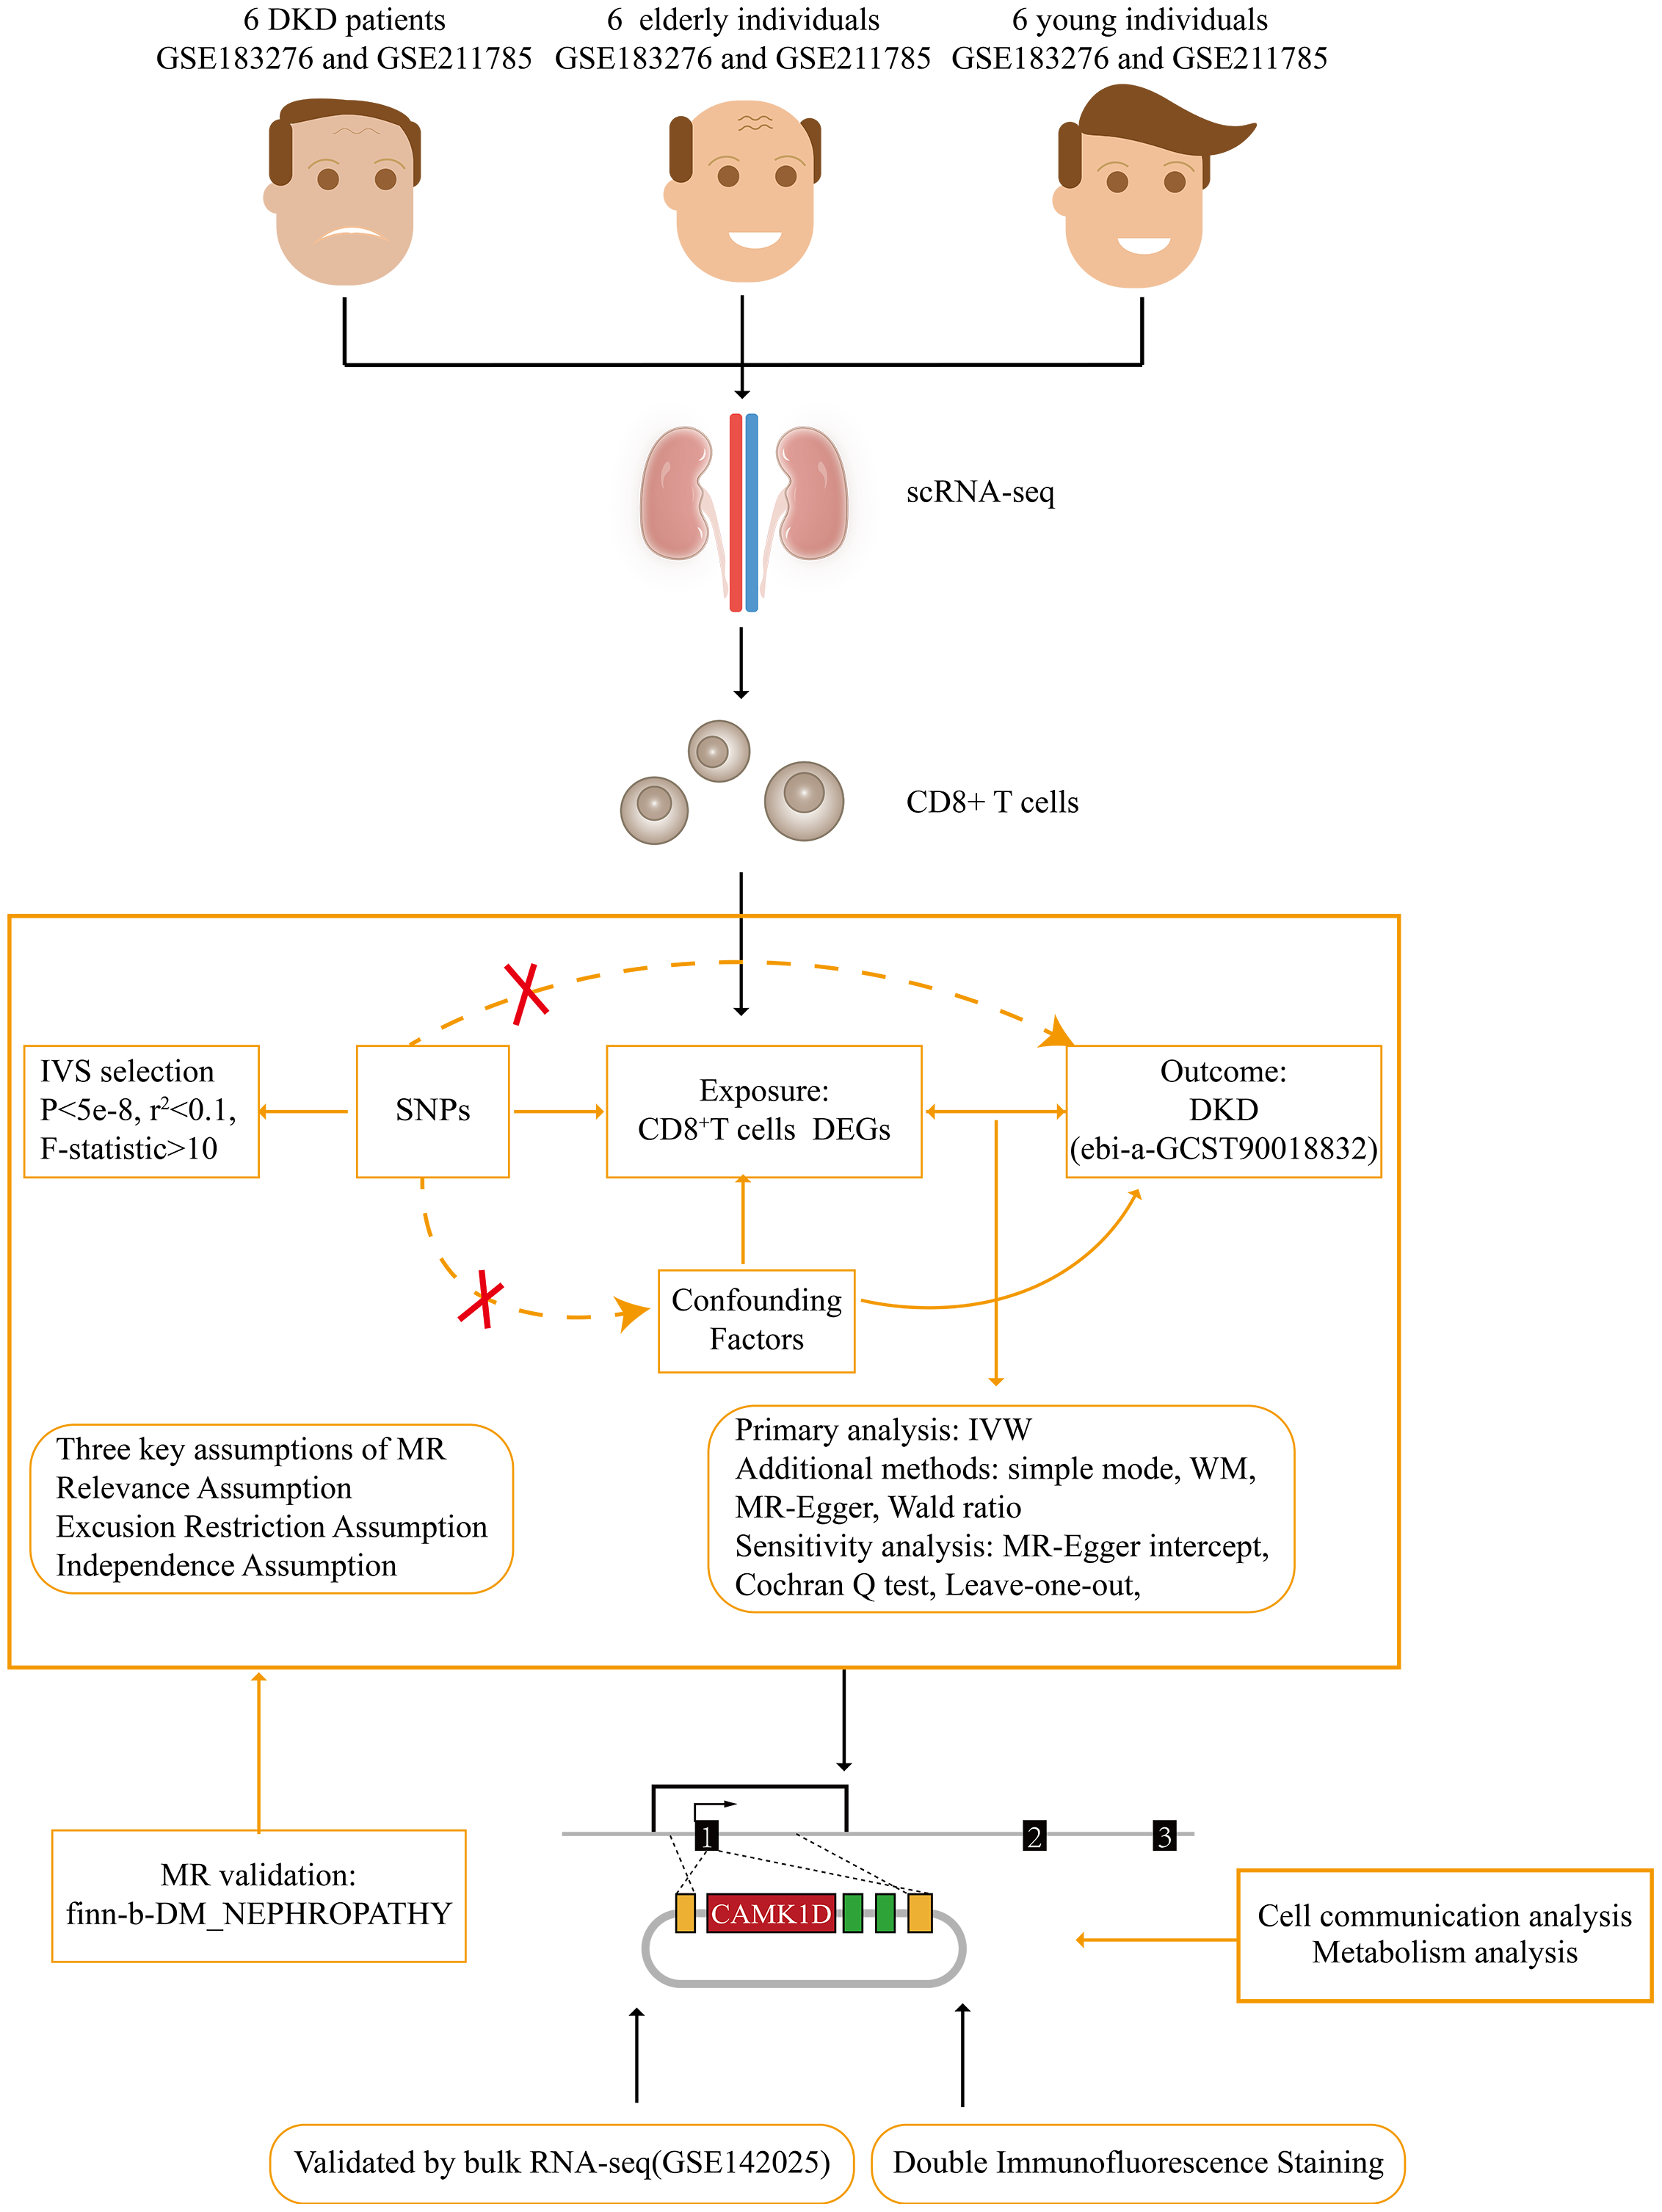
Cell communication between CD8+ T cells and other cell types in DKD and aging microenvironments
To investigate potential connections between DKD and aging, we analyzed intercellular communication between CD8+ T cells and other cell types in both DKD and elderly kidney tissues using the CellChat package. In elderly kidney samples, CD8+T cells primarily interacted with podocytes, non-classical monocytes, and γδ T cells, via signaling pathways including MIF–(CD74+CD44), GZMA–F2R, and ANXA1–FPR1. In DKD samples, CD8+ T cells communicated with collecting duct cells and non-classical monocytes mainly via the ANXA1–FPR1 signaling axis (Figs. 3A–3D). These findings indicate that CD8+ T cells engage in ANXA1–FPR1-mediated intercellular crosstalk with non-classical monocytes in both aged and DKD kidney tissues.
| ID | Cell counts | Percentage (%) |
|---|---|---|
| DKD | 20,905 | 21.22 |
| YOUNG | 9,160 | 6.92 |
| OLD | 18,915 | 6.47 |
Notes:
- DKD
-
diabetic kidney disease
- YOUNG
-
young healthy individuals
- OLD
-
old healthy individuals
| ID | Cell counts | Percentage (%) |
|---|---|---|
| DKD | 10,667 | 21.81 |
| YOUNG | 4,870 | 6.79 |
| OLD | 10,504 | 6.05 |
Notes:
- DKD
-
diabetic kidney disease
- YOUNG
-
young healthy individuals
- OLD
-
old healthy individuals
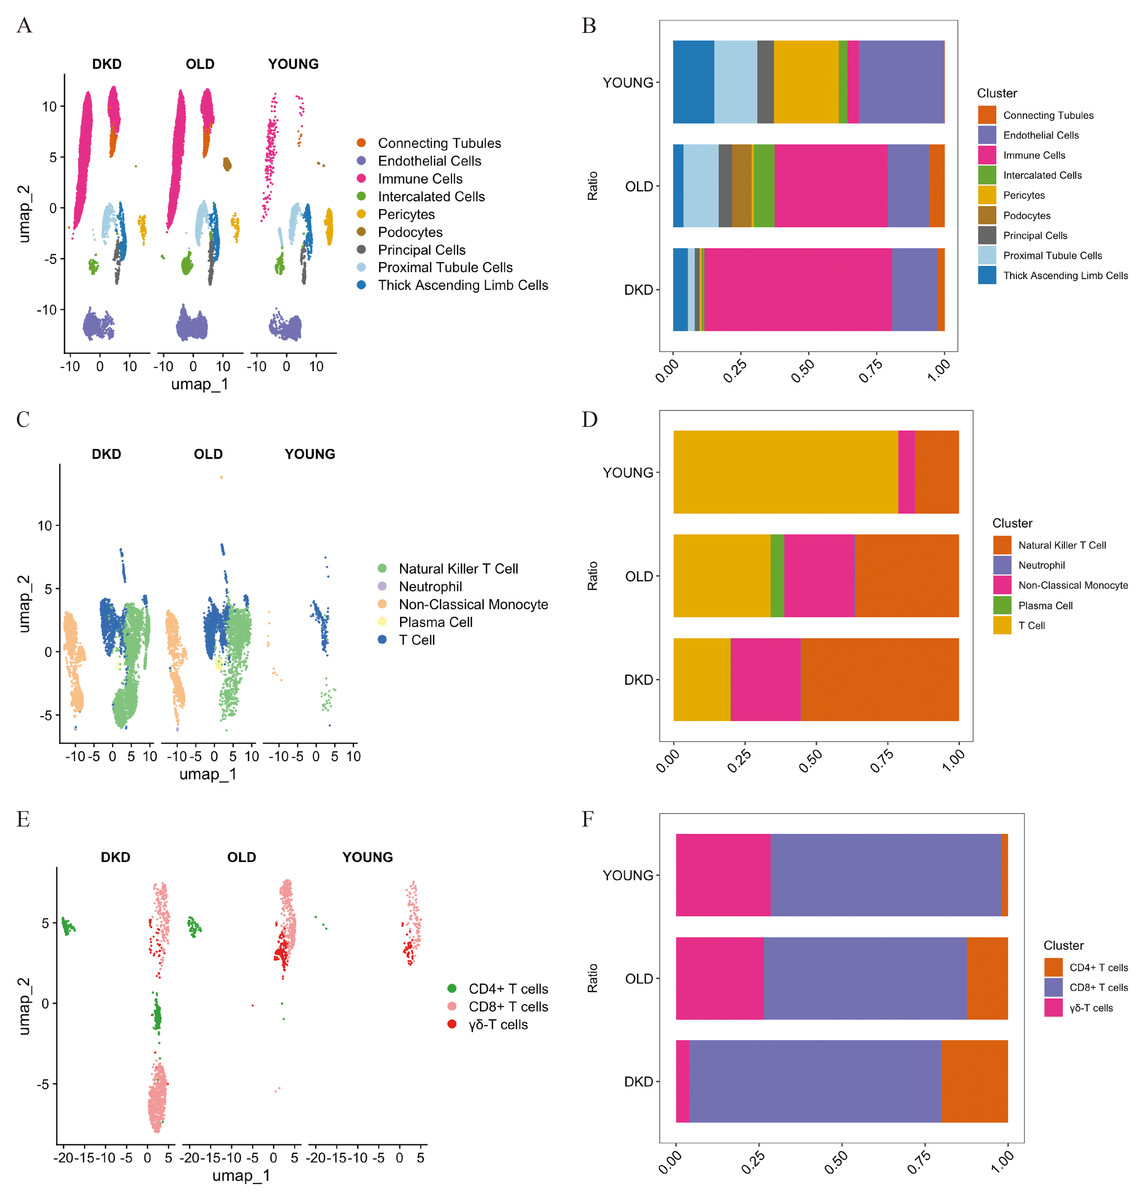
Figure 2: Single-cell transcriptional landscape of kidney tissue samples from DKD patients, young, and elderly individuals.
(A) The spatial distribution of cell clusters in kidney from different subjects is named and visualized by UMAP plot. (B) Bar plot displayed the percentage of cell clusters in kidney from different subjects. Blocks represented distinct subjects, and the cell quantity was in proportion to the block height. (C) Visualization of immune cell subsets by UMAP plot. (D) Bar plot displayed the percentage of immune cell subsets from different subjects. (E) Visualization of T cell subsets by UMAP plot. (F) Bar plot displayed the percentage of T cell subsets from different subjects. DKD, diabetic kidney disease; UMAP, uniform manifold approximation and projection.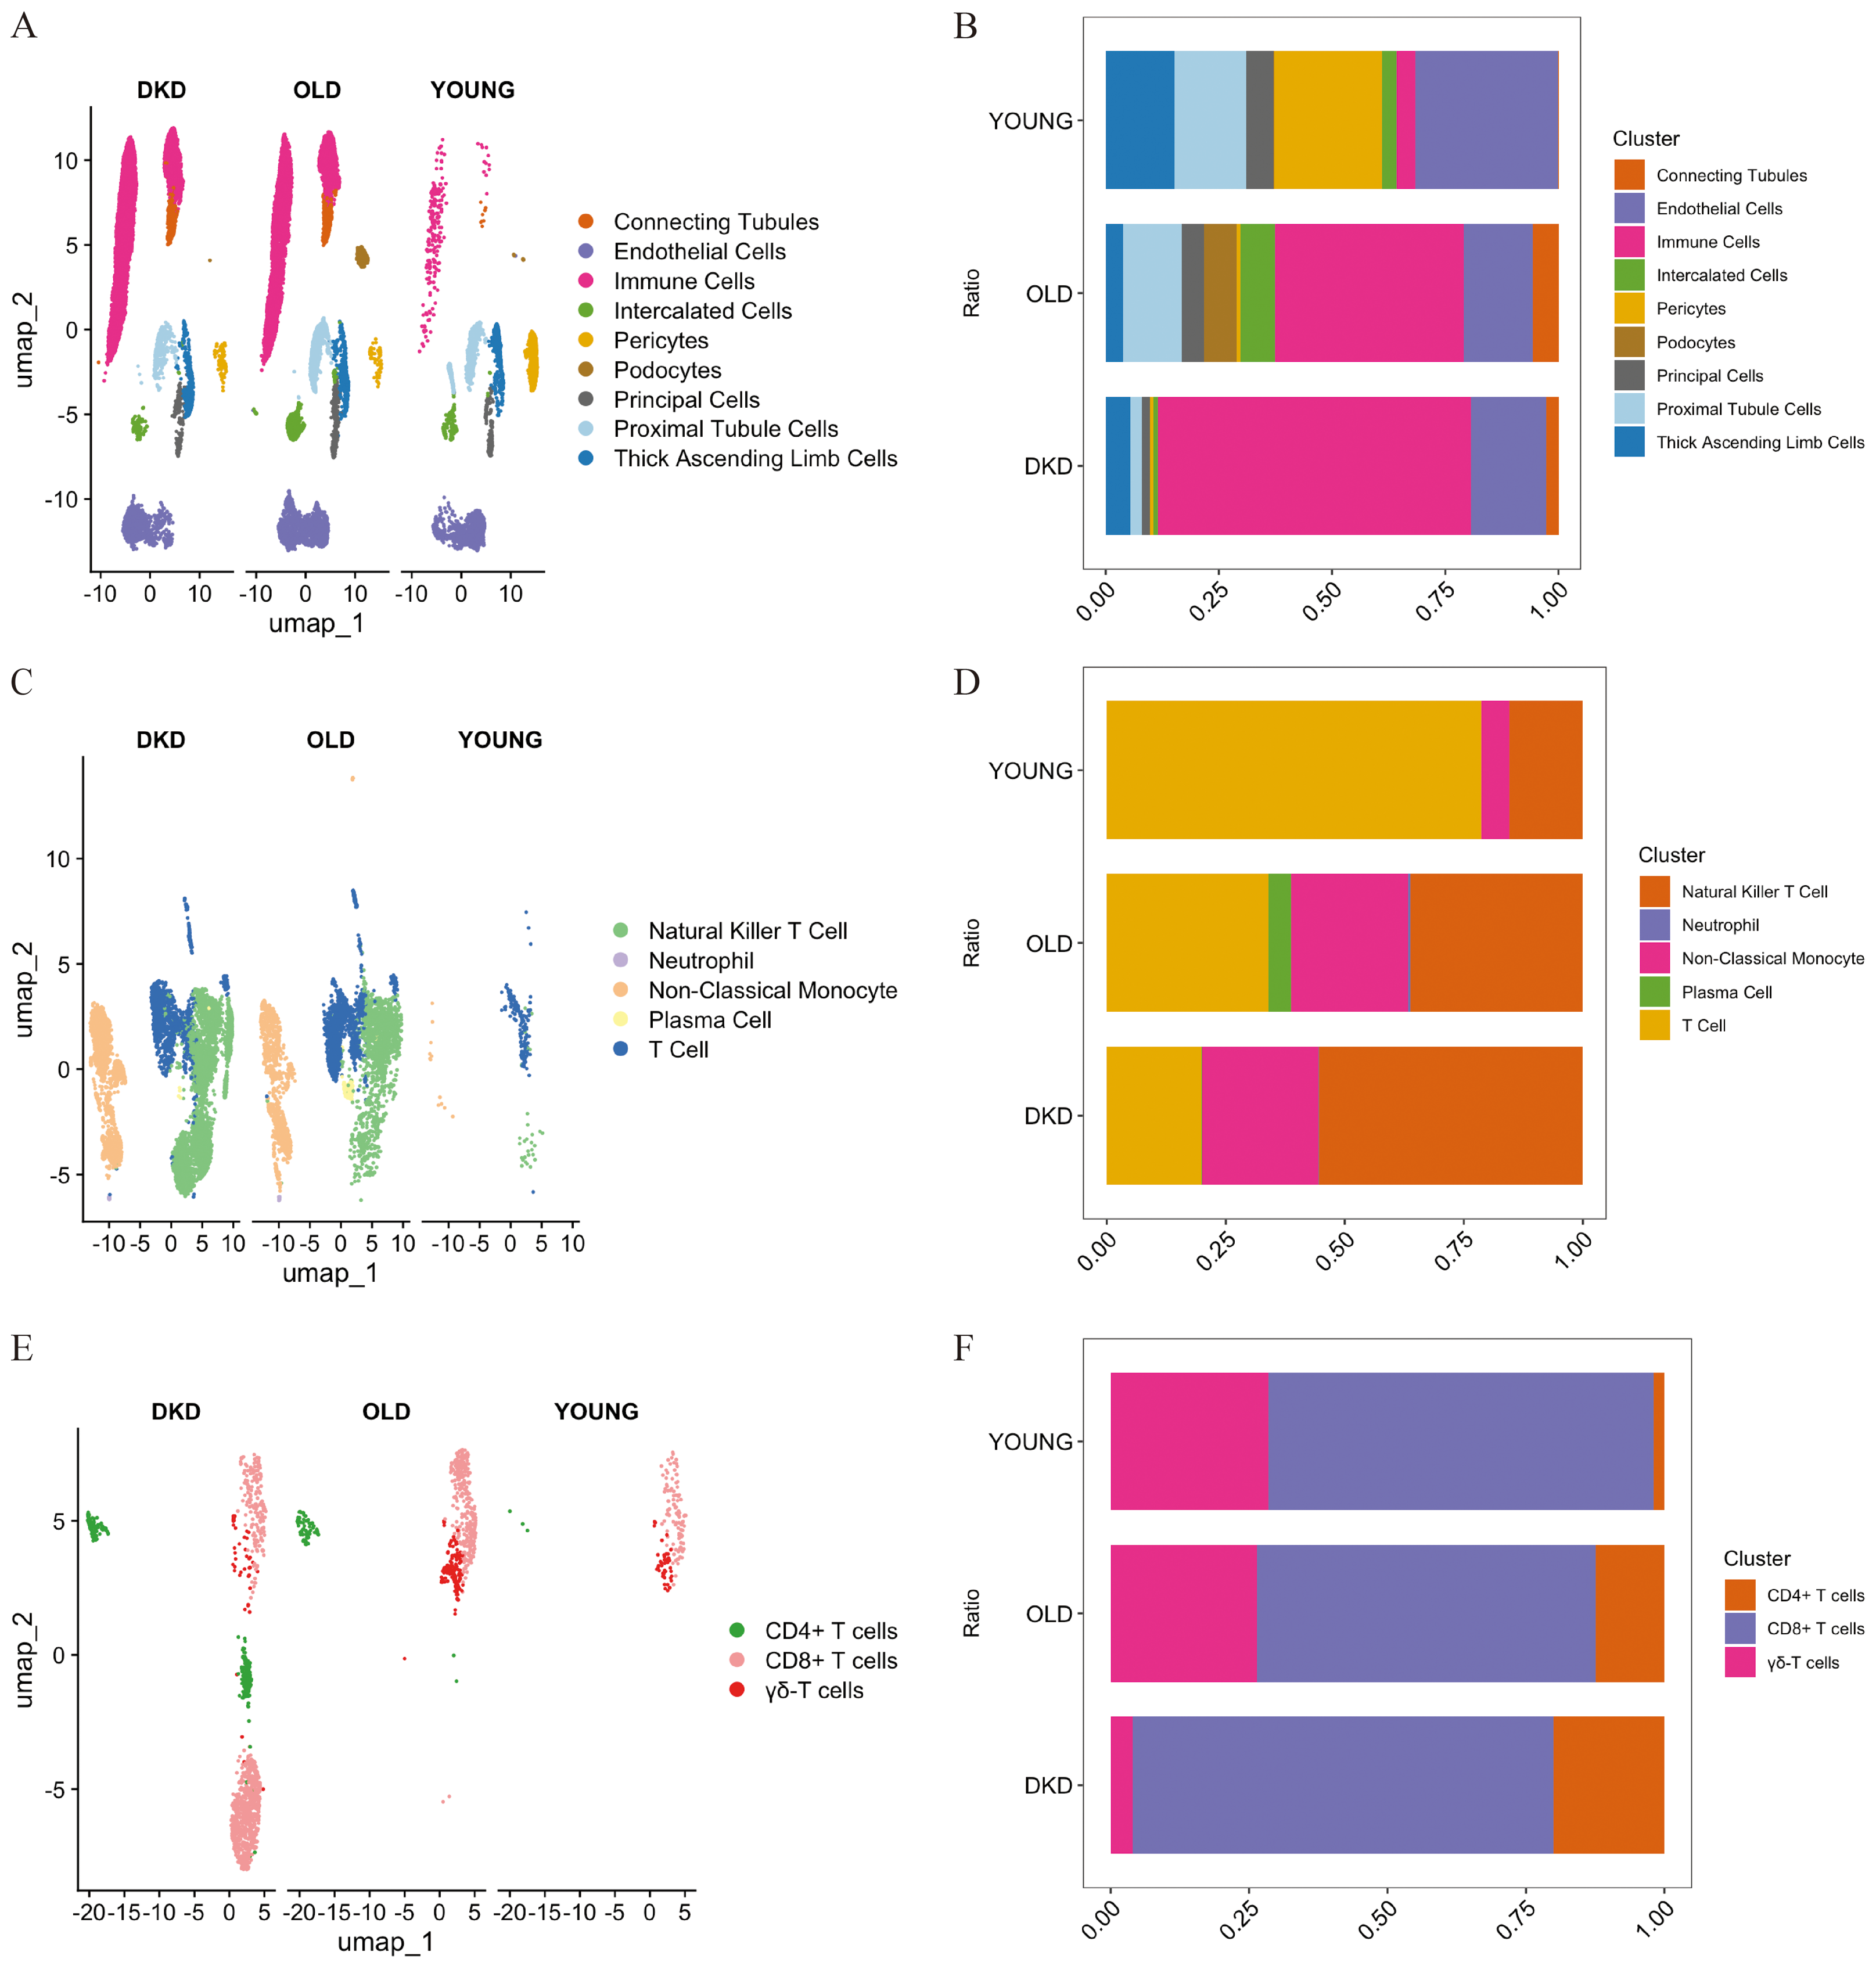
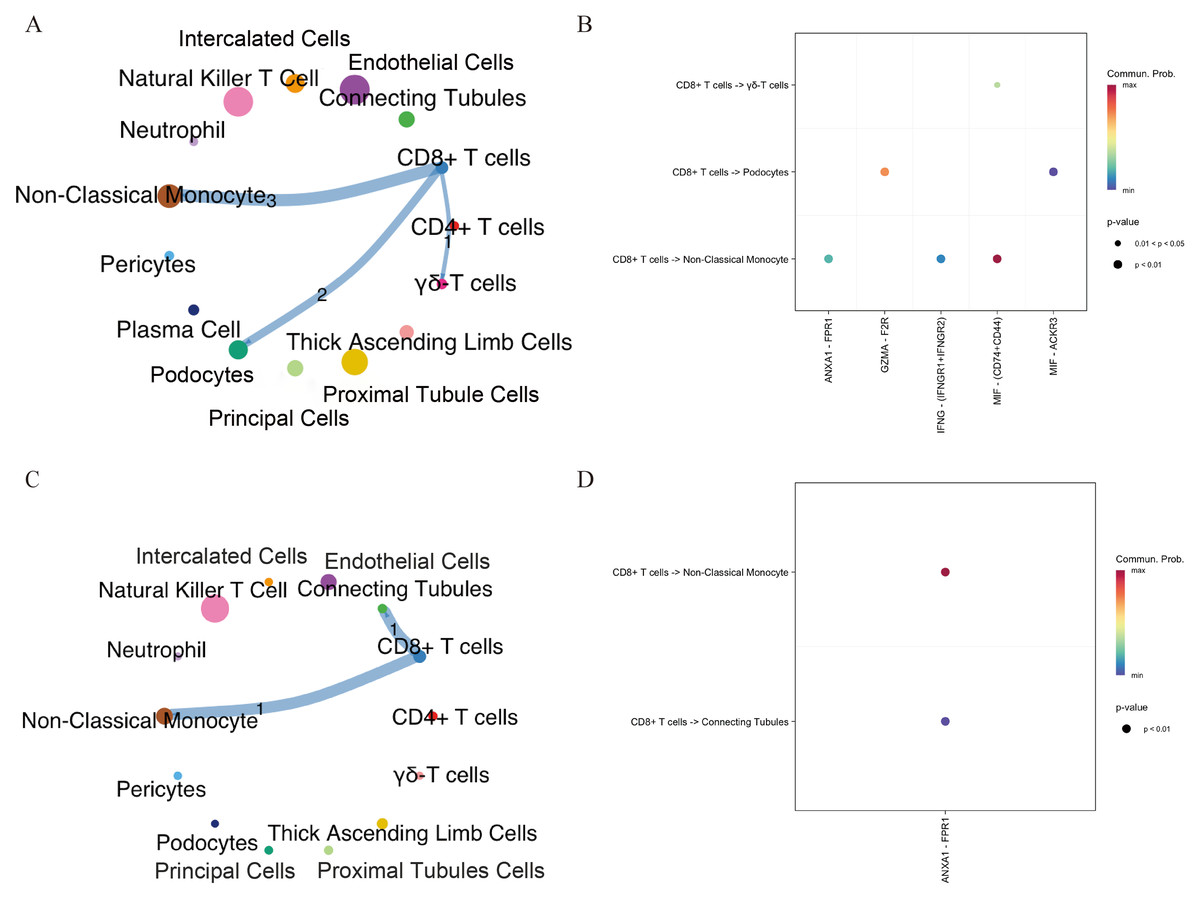
Figure 3: Intercellular communication networks illustrating the number of receptor–ligand interactions between CD8+ T cells and other cell subsets in aging and DKD.
(A, B) Networks showing receptor–ligand pairings between CD8+ T cells and aging-associated cell subsets. (C, D) Networks showing receptor–ligand pairings between CD8+ T cells and DKD-associated cell subsets. The line thickness indicates the number of pairs. The number of significant ligand–receptor pairs between any two cell population. DKD, diabetic kidney disease.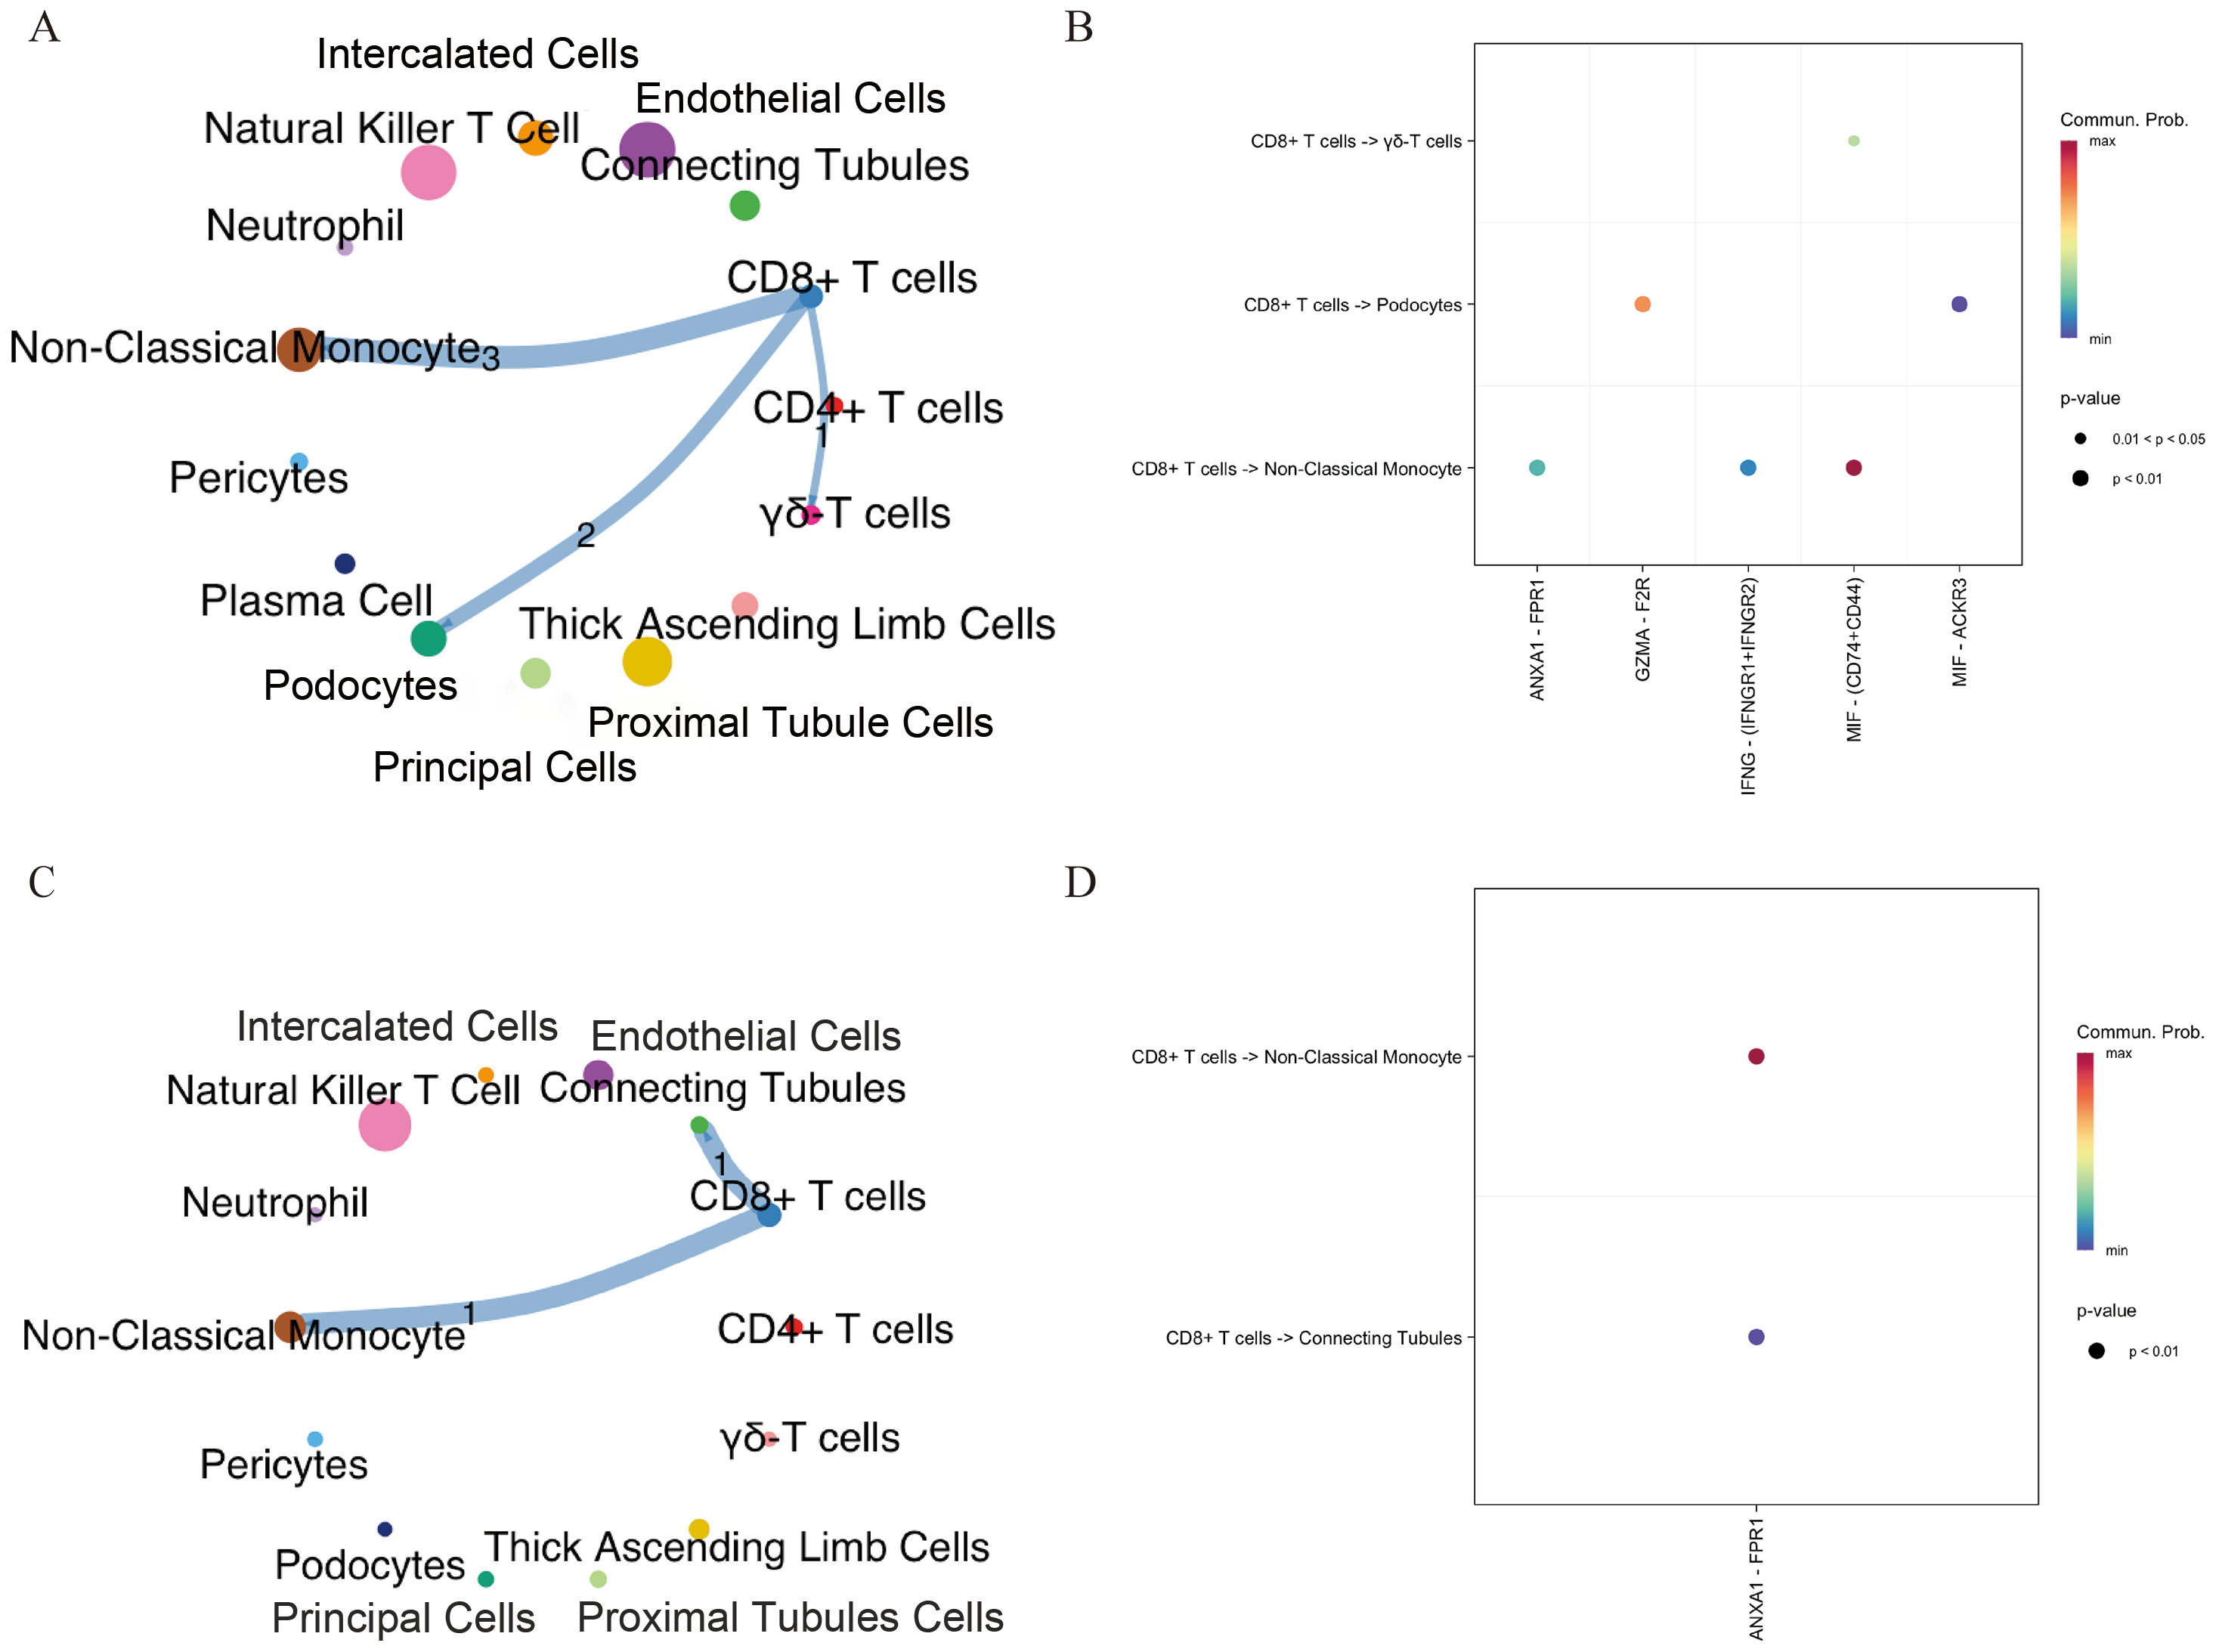
Identification of hub genes associated with DKD and aging via scRNA-seq and MR
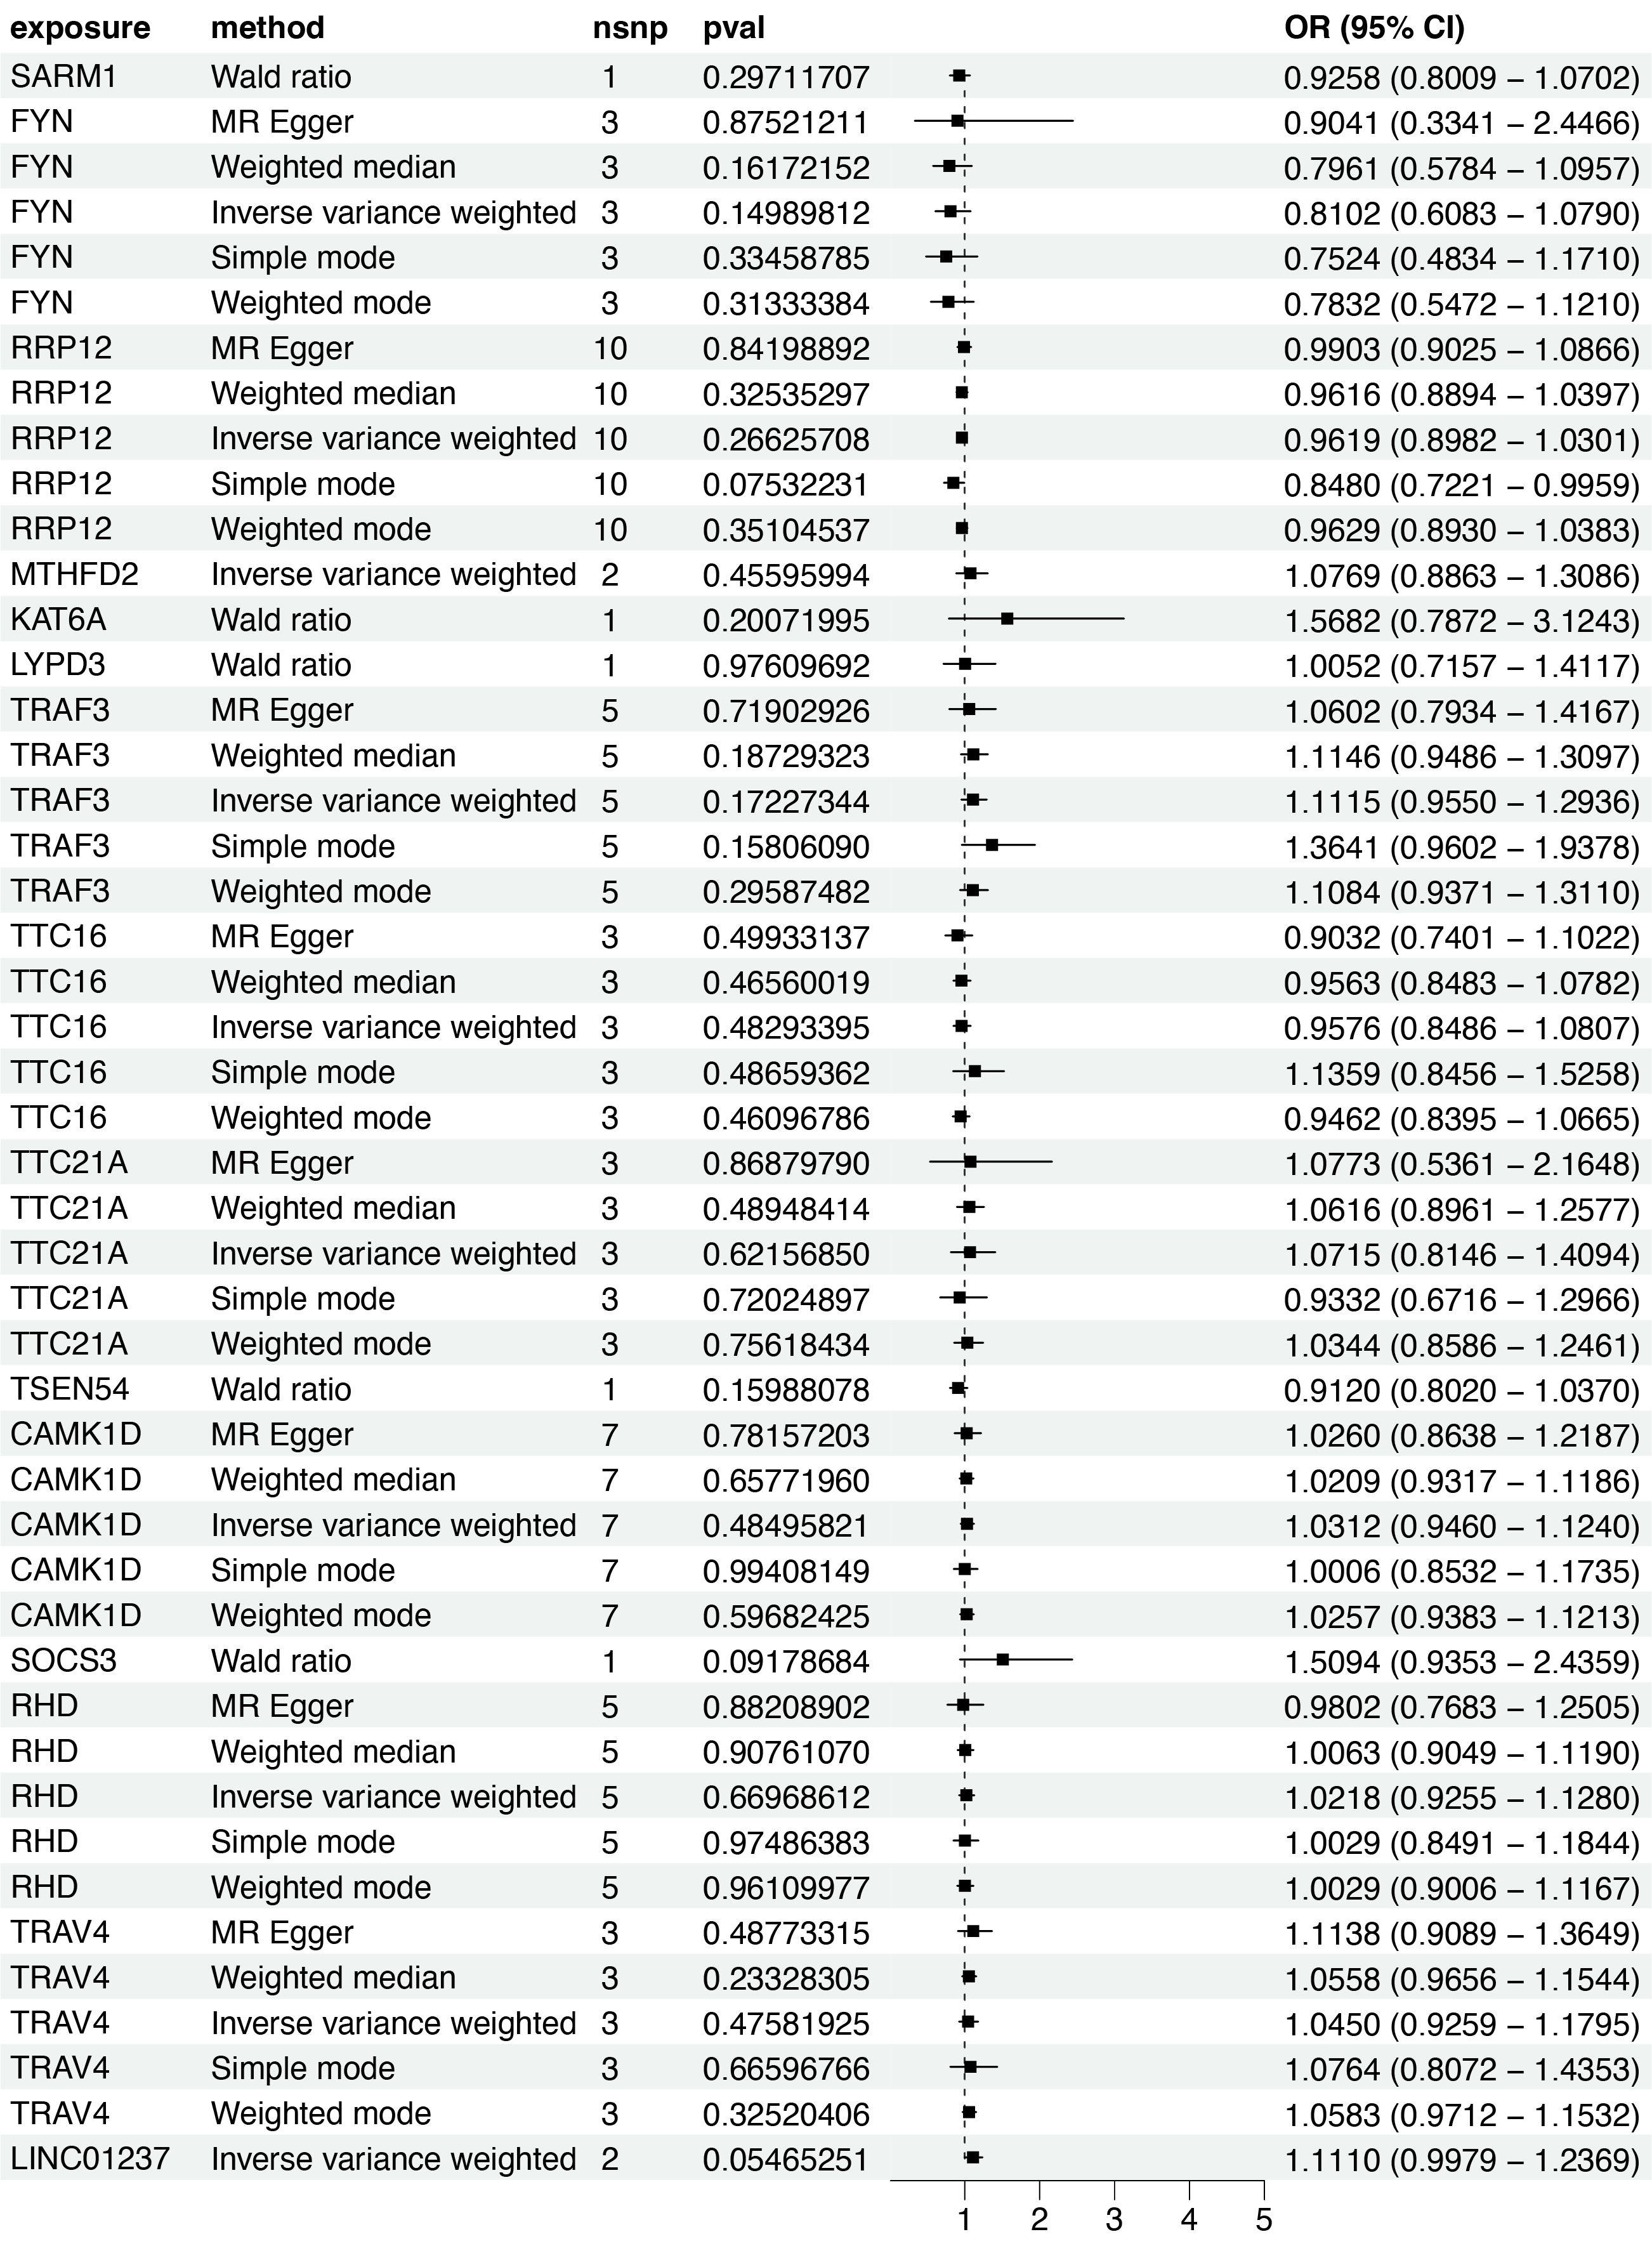
Based on the scRNA-seq analysis, DEGs in CD8+ T cells were identified through comparison with renal and other immune cell populations (Table S4). These DEGs were subsequently mapped to SNP-based exposure data using the “TwoSampleMR” and “ieugwasr” R packages. DKD-associated Genome-wide association studies (GWAS) summary statistics were retrieved from the IEU Open GWAS repository, with the dataset ebi-a-GCST90018832 used as the outcome variable. A total of 680 cis-acting SNPs were initially selected as IVs (Table S5). After linkage disequilibrium (LD) pruning (F > 10, R2 < 0.1), 15 independent DEGs were retained for analysis (Table S6), and IVW analysis identified 10 of them as having significant causal associations with DKD (P < 0.05), including eight positive and two negative associations (Figs. 4–5A). Among these, RRP12, TRAF3, TTC21A, CAMK1D, and TRAV4 remained significant according to WM method. However, TRAF3, TTC21A, and TRAV4 did not show consistent results across simple mode, MR-Egger, and Wald ratio tests (P > 0.05), and RRP12 exhibited an opposing effect direction in the simple mode method. Taken together, only CAMK1D exhibited a consistently significant causal association with DKD and was therefore selected for further analysis.
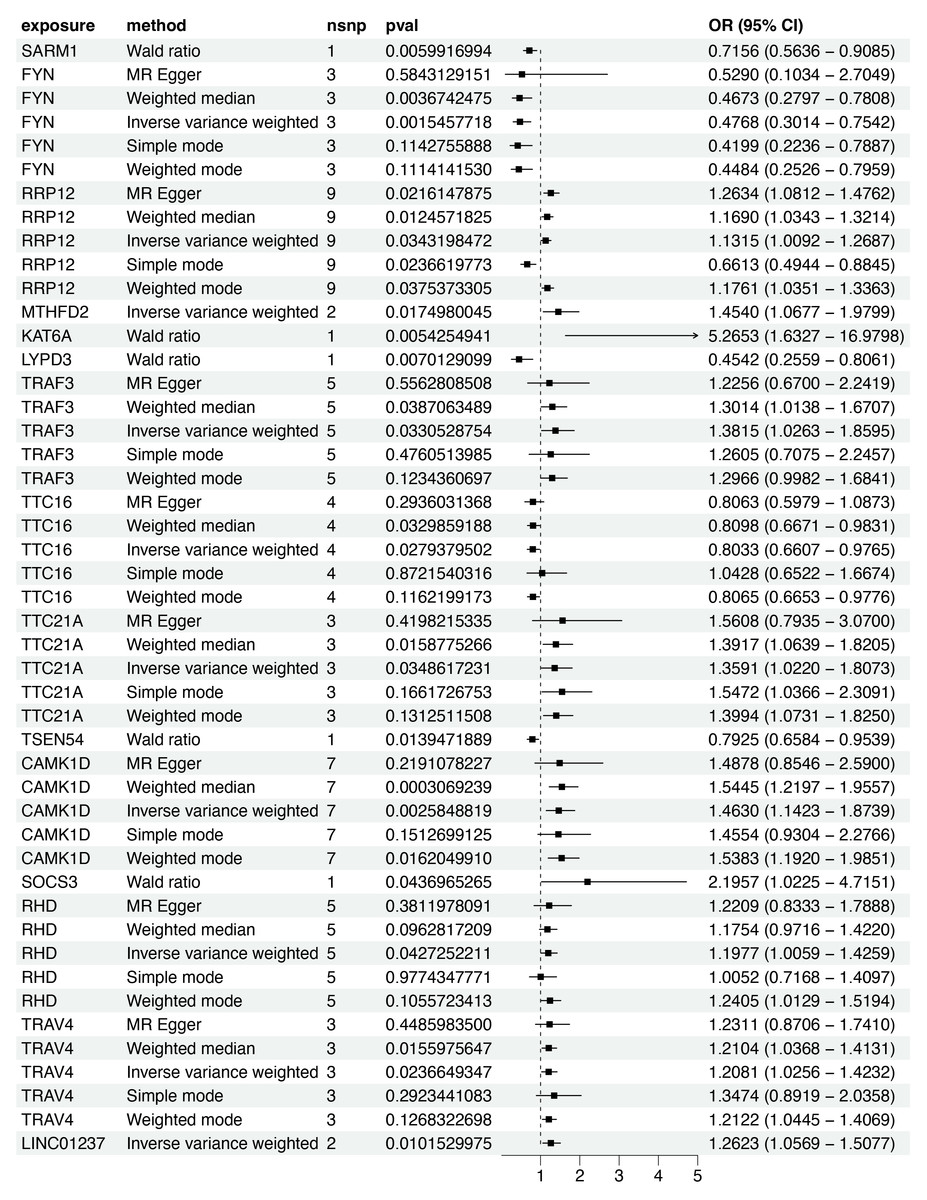
Figure 4: Forest plot of five MR model results for the 15 markers (ebi-a-GCST90018832).
MR, mendelian randomization.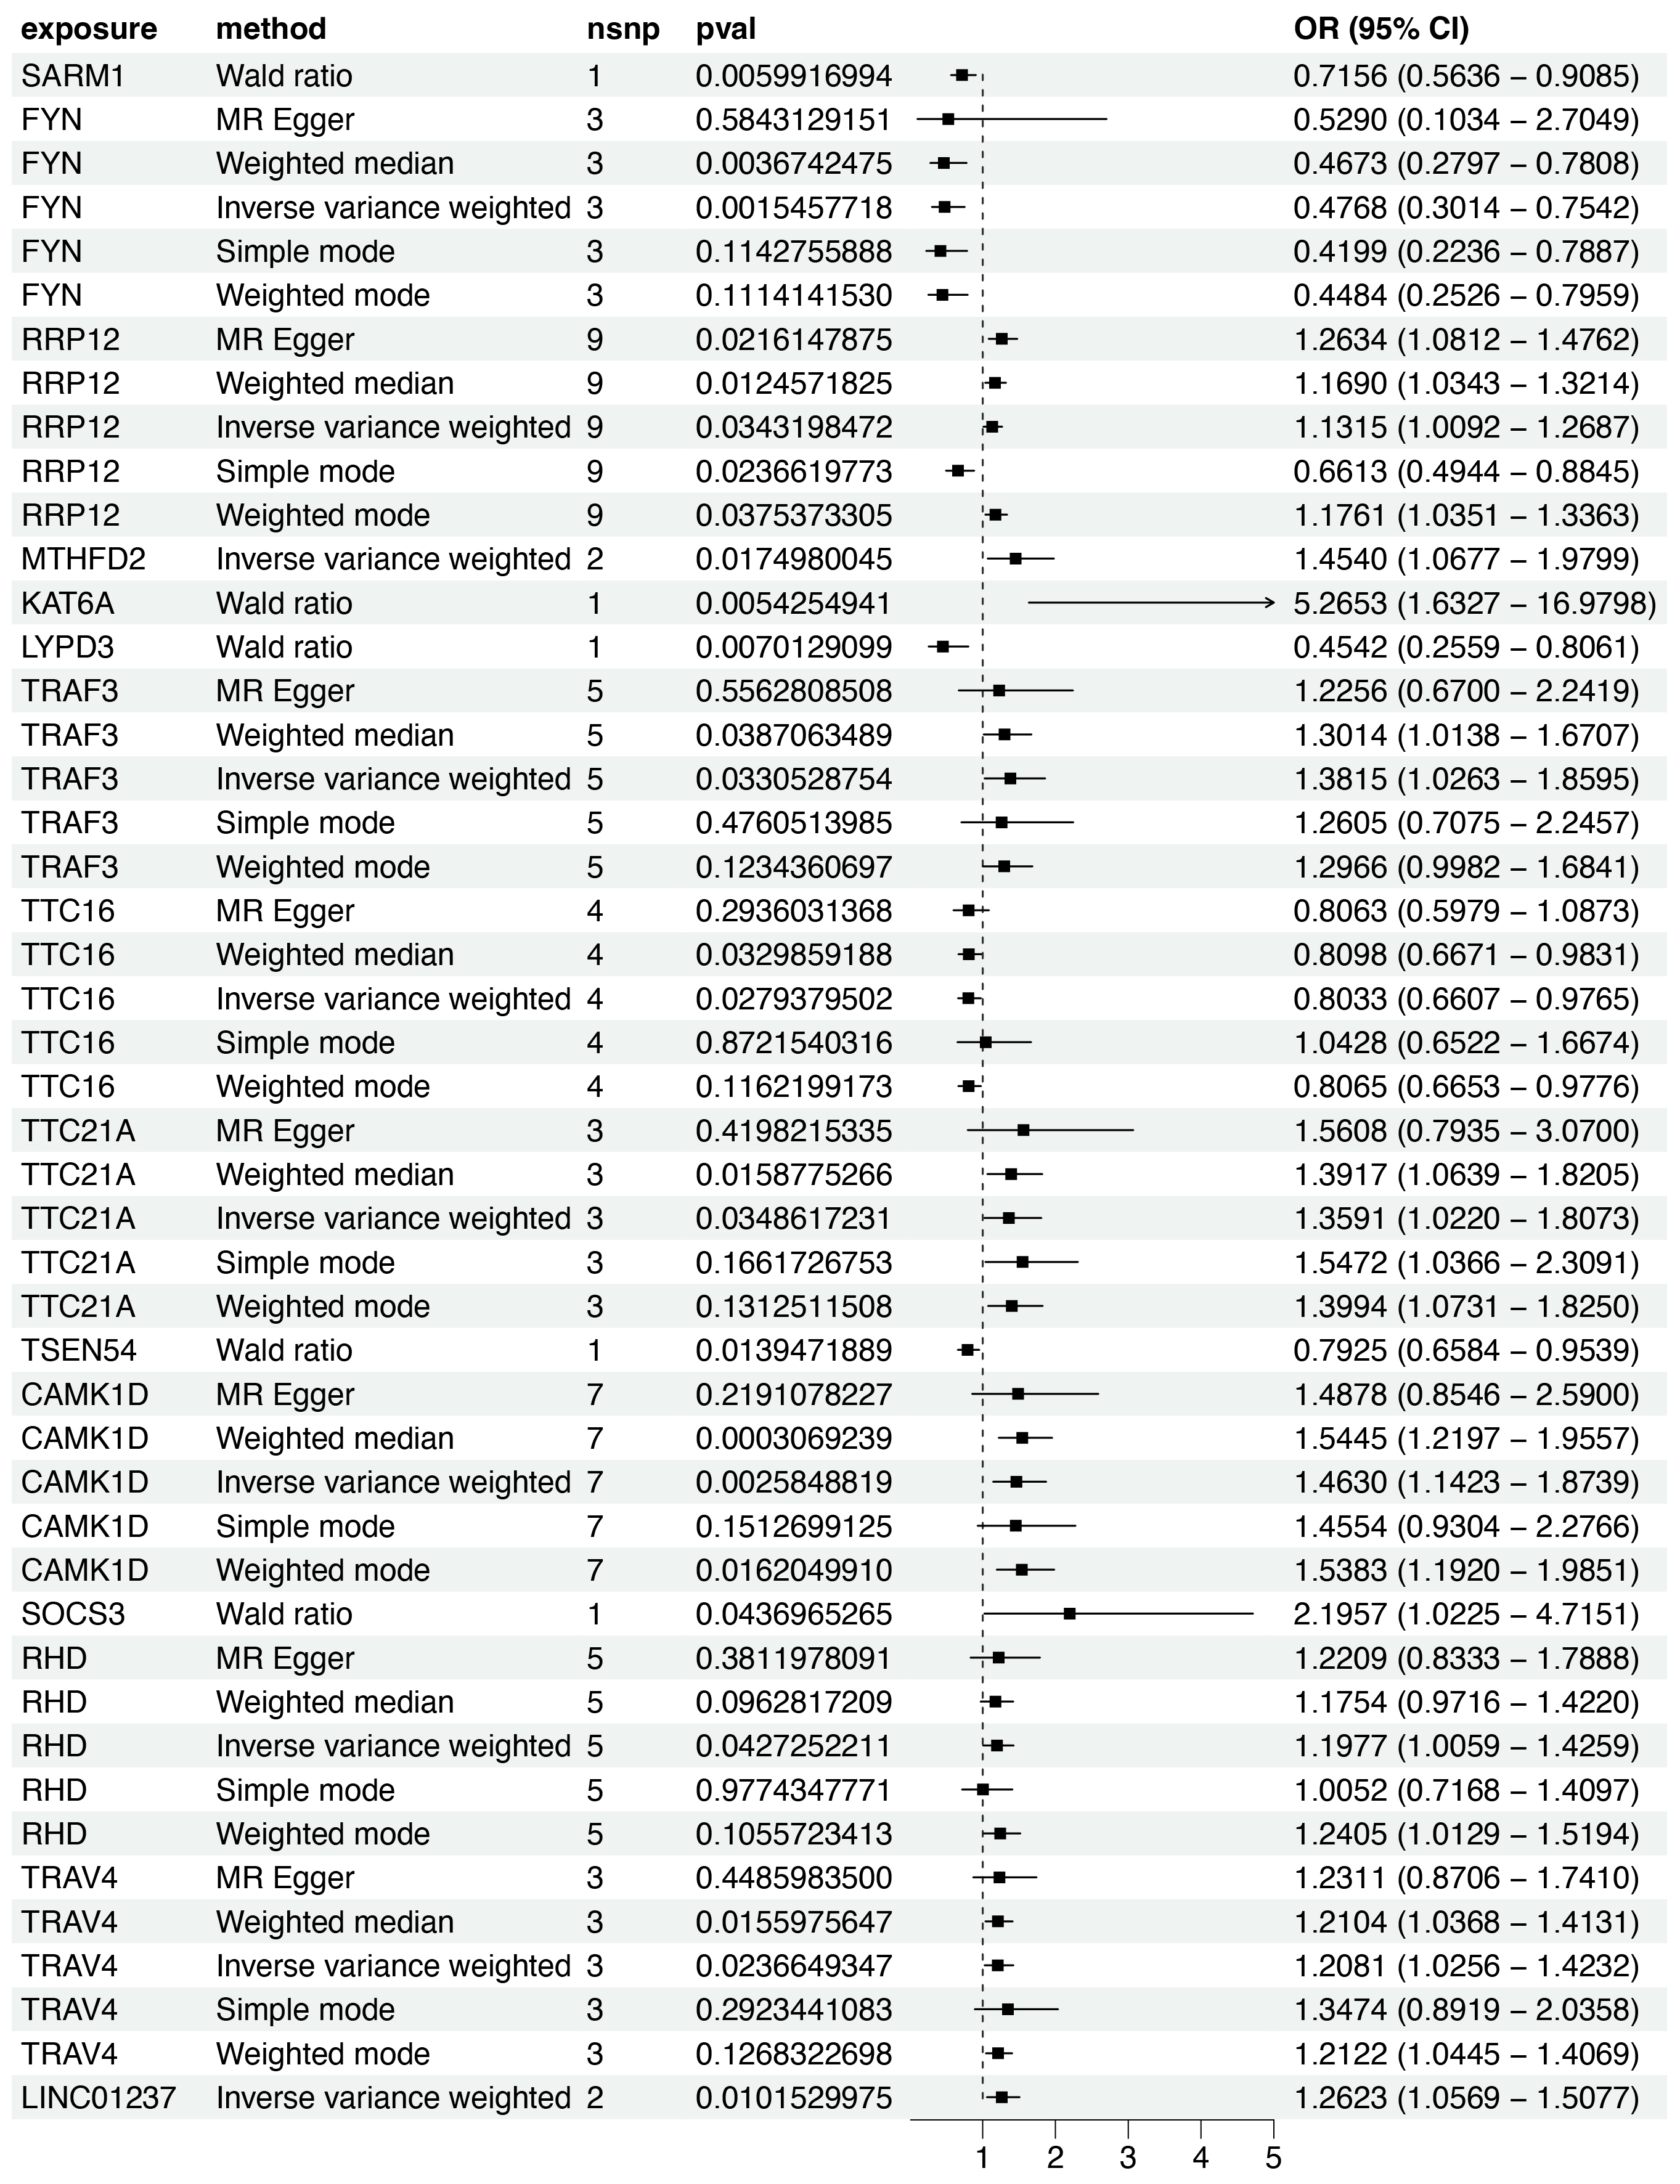
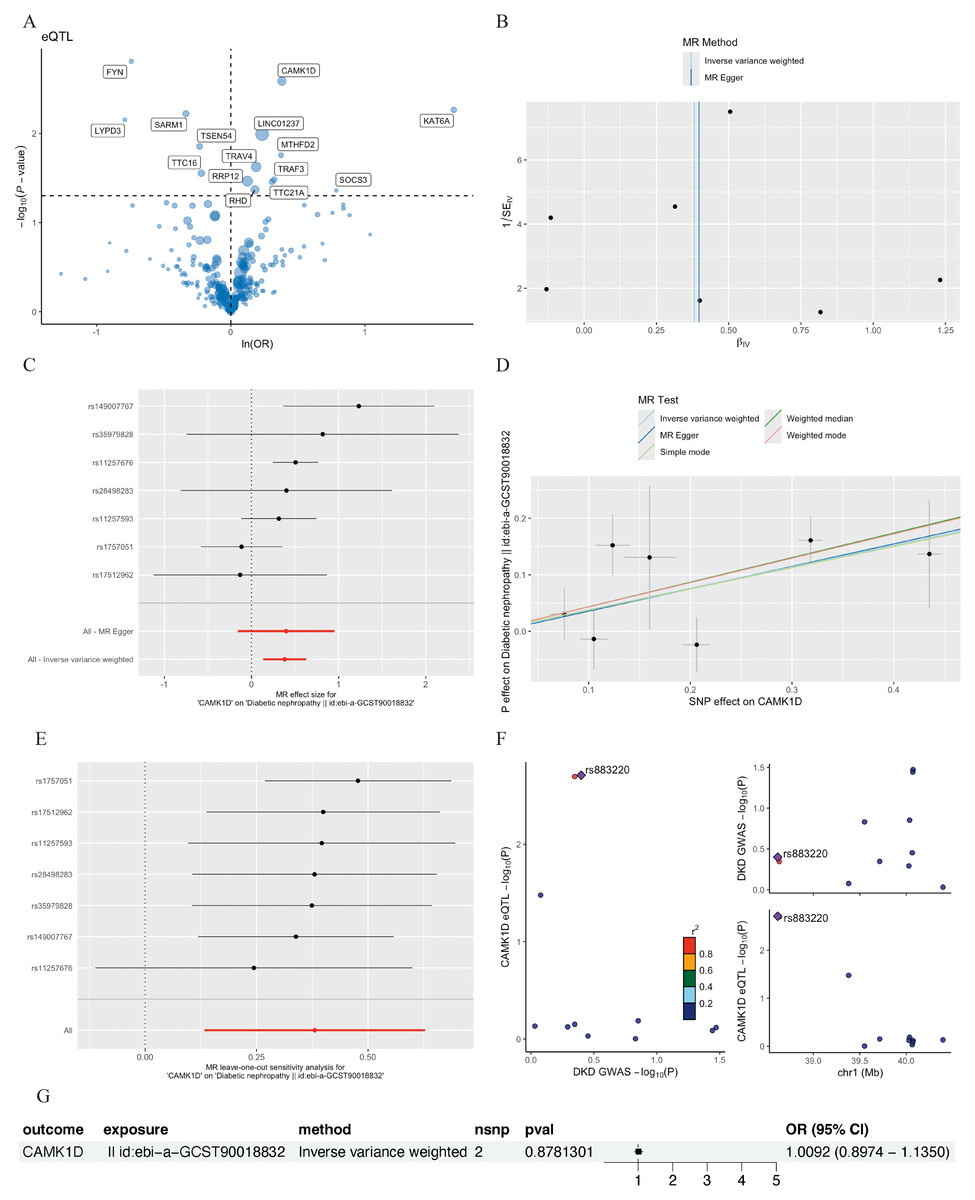
Figure 5: MR analysis of CD8+ T cluster markers and DKD.
(A) Volcano plot of the MR results for 15 markers and the risk of DKD determined using the IVW method. (B) Funnel plot of three SNPs on MR analysis. (C) Forest plot of MR analysis results for single SNP estimation of CAMK1D. The red line represents the pooled results for all SNPs. (D) Scatter plots of the five MR models. Each point represents an IV, the line on each point represents the 95% CI, the ordinate shows the effect of the SNP on the outcome, and the abscissa shows the effect of the SNP on exposure. (E) MR sensitivity results for CAMK1D after removing SNPs using the leave-one-out method. The red line represents the pooled results for all SNPs. (F) Regional association plot of GWAS results and marker-eQTLs at the marker, CAMK1D and CAMK1D locus. SNPs are colored based on LD (r 2) with the lead marker-eQTL (rs883220). Purple diamonds represent the lowest p-value for each locus. (G) Forest plot of reverse MR analysis. MR, mendelian randomization; DKD, diabetic kidney disease; IVW, inverse variance weighted; SNP, single nucleotide polymorphisms; IV, instrumental variables; CI, Confidence Interval; GWAS, Genome-wide association studies; eQTL, expression quantitative trait locus; LD, linkage disequilibrium.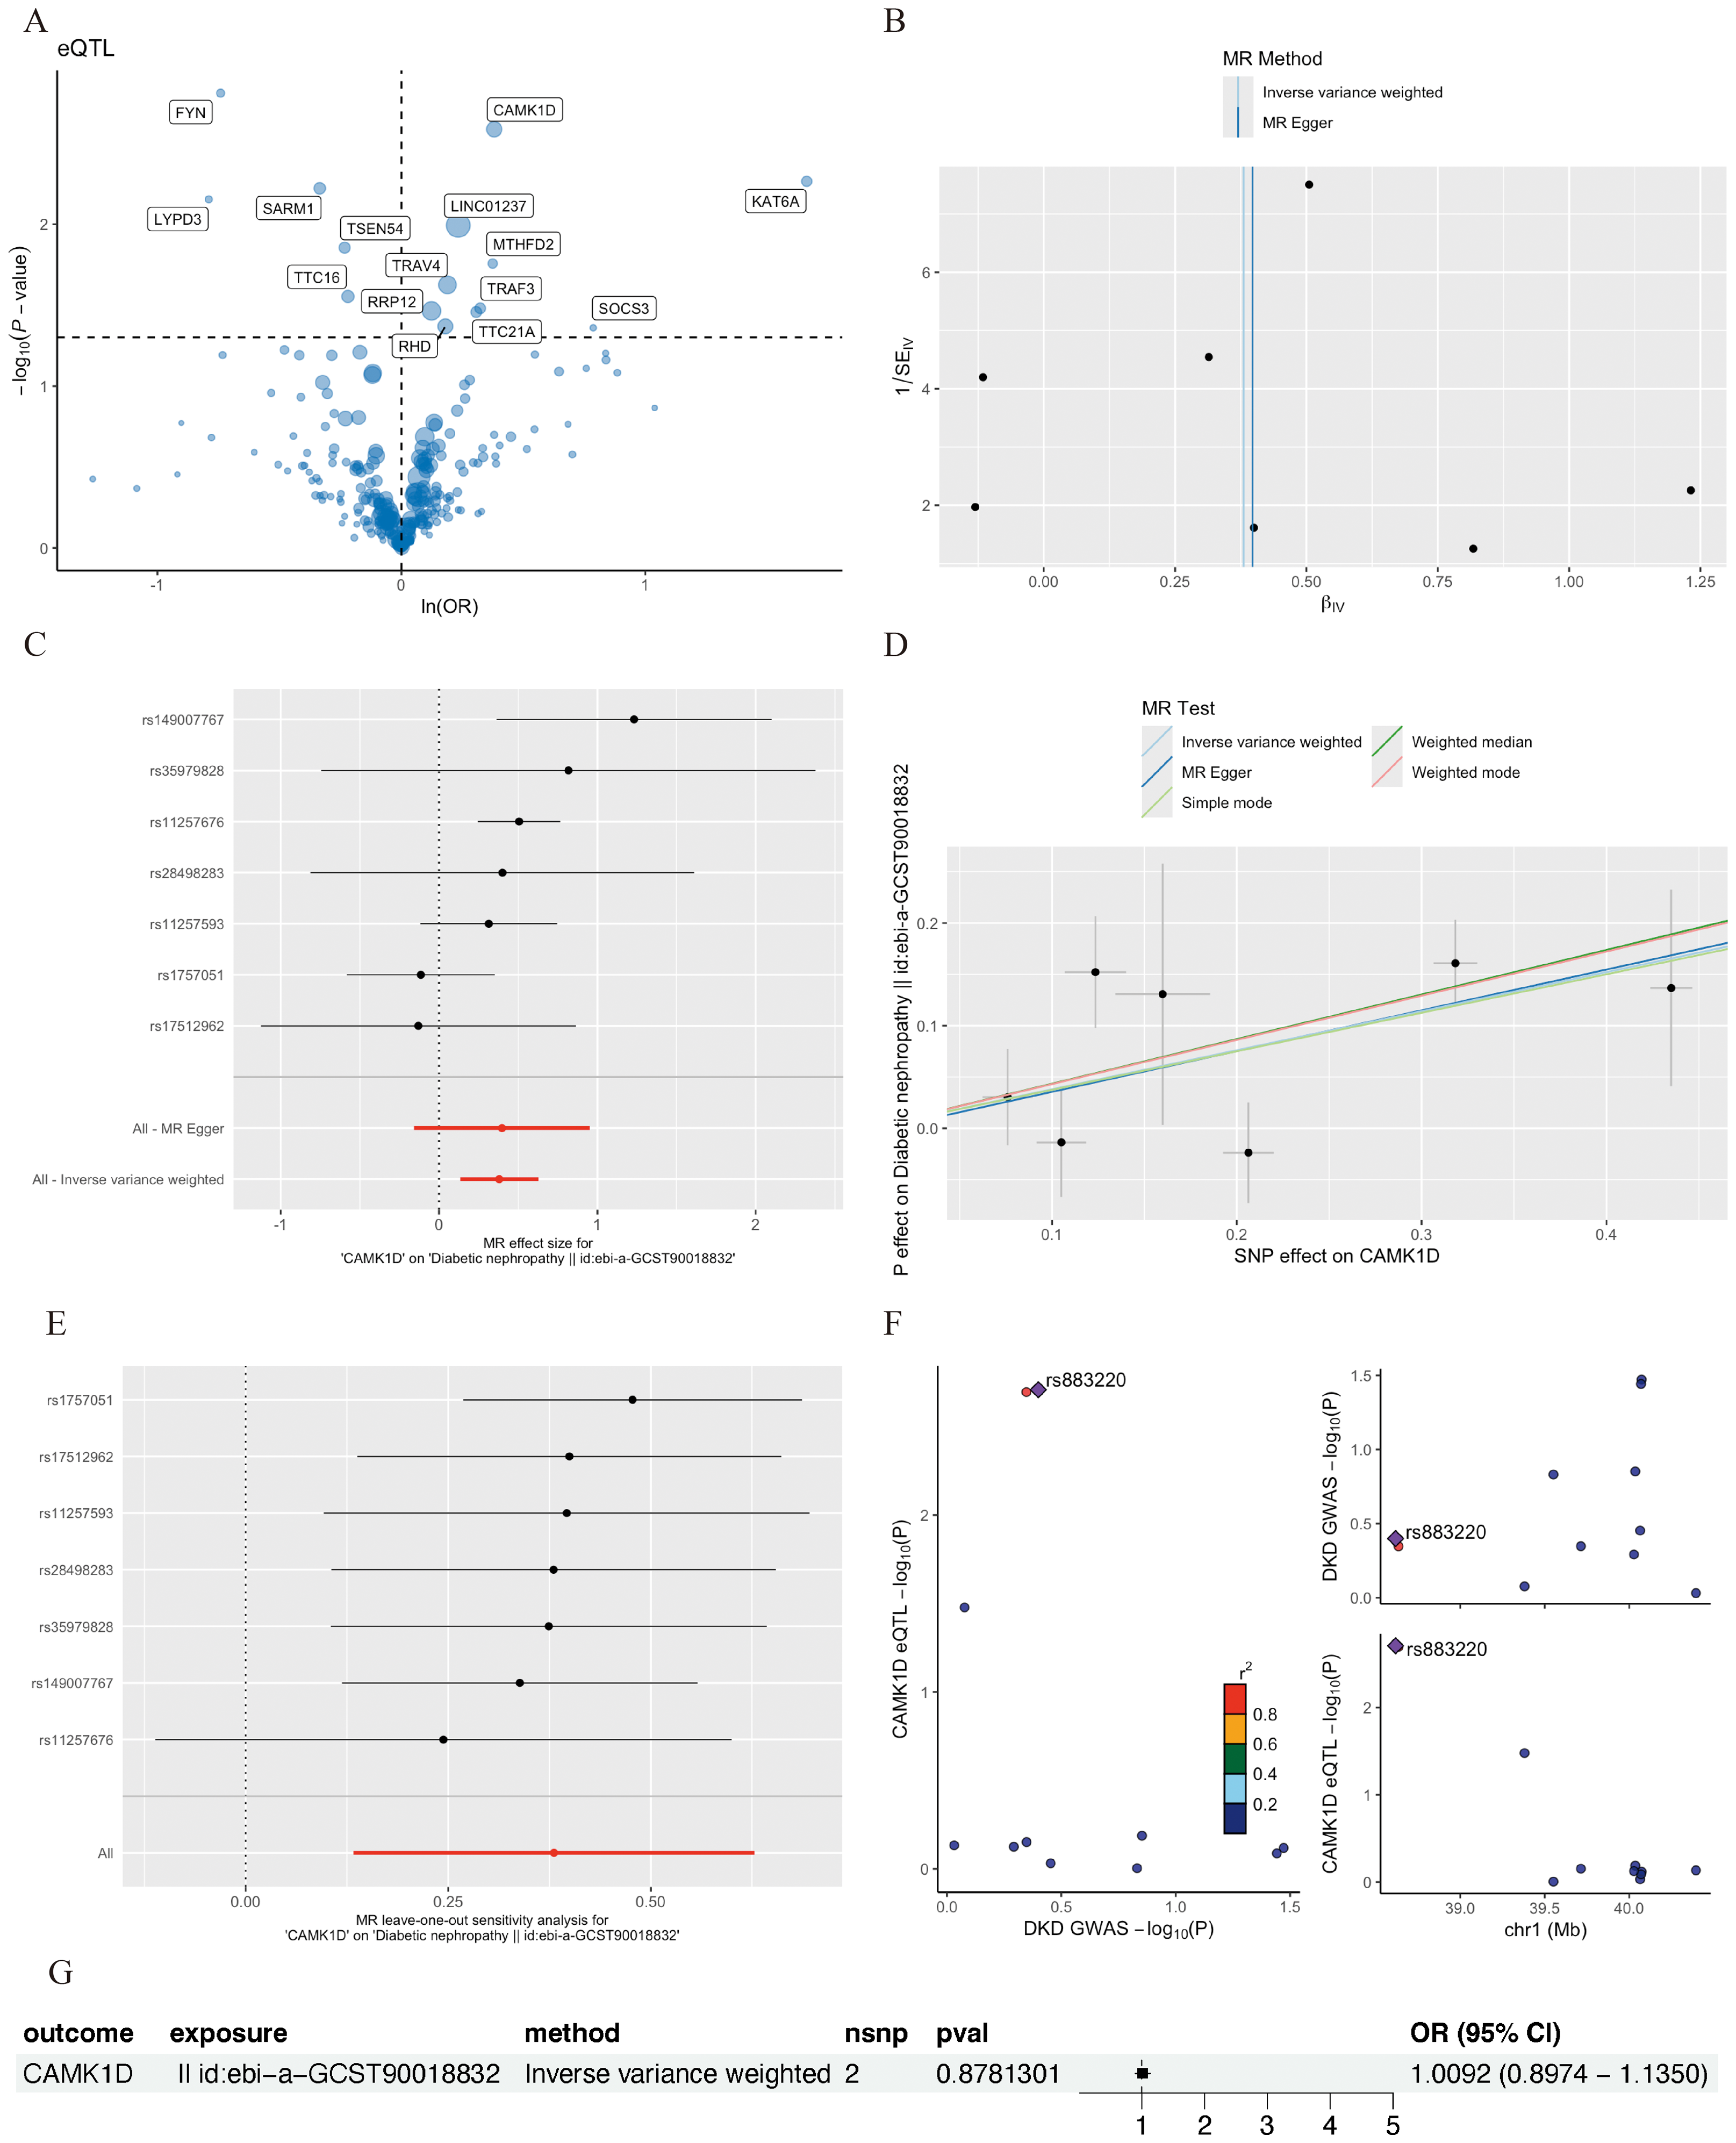
Sensitivity analyses of CAMK1D revealed no significant heterogeneity by Cochran’s Q test (P > 0.05), supporting the stability of the MR results (Table S7, Table 4). To further validate the reliability of the results, funnel plots and forest plots were constructed (Figs. 5B, 5C). The MR-Egger regression intercept suggested no evidence of pleiotropy for CAMK1D (P > 0.05) (Table S8, Table 4, Fig. 5D). Leave-one-out sensitivity analysis confirmed that the causal association between CAMK1D and DKD was stable and not attributable to any single SNP (Fig. 5E).
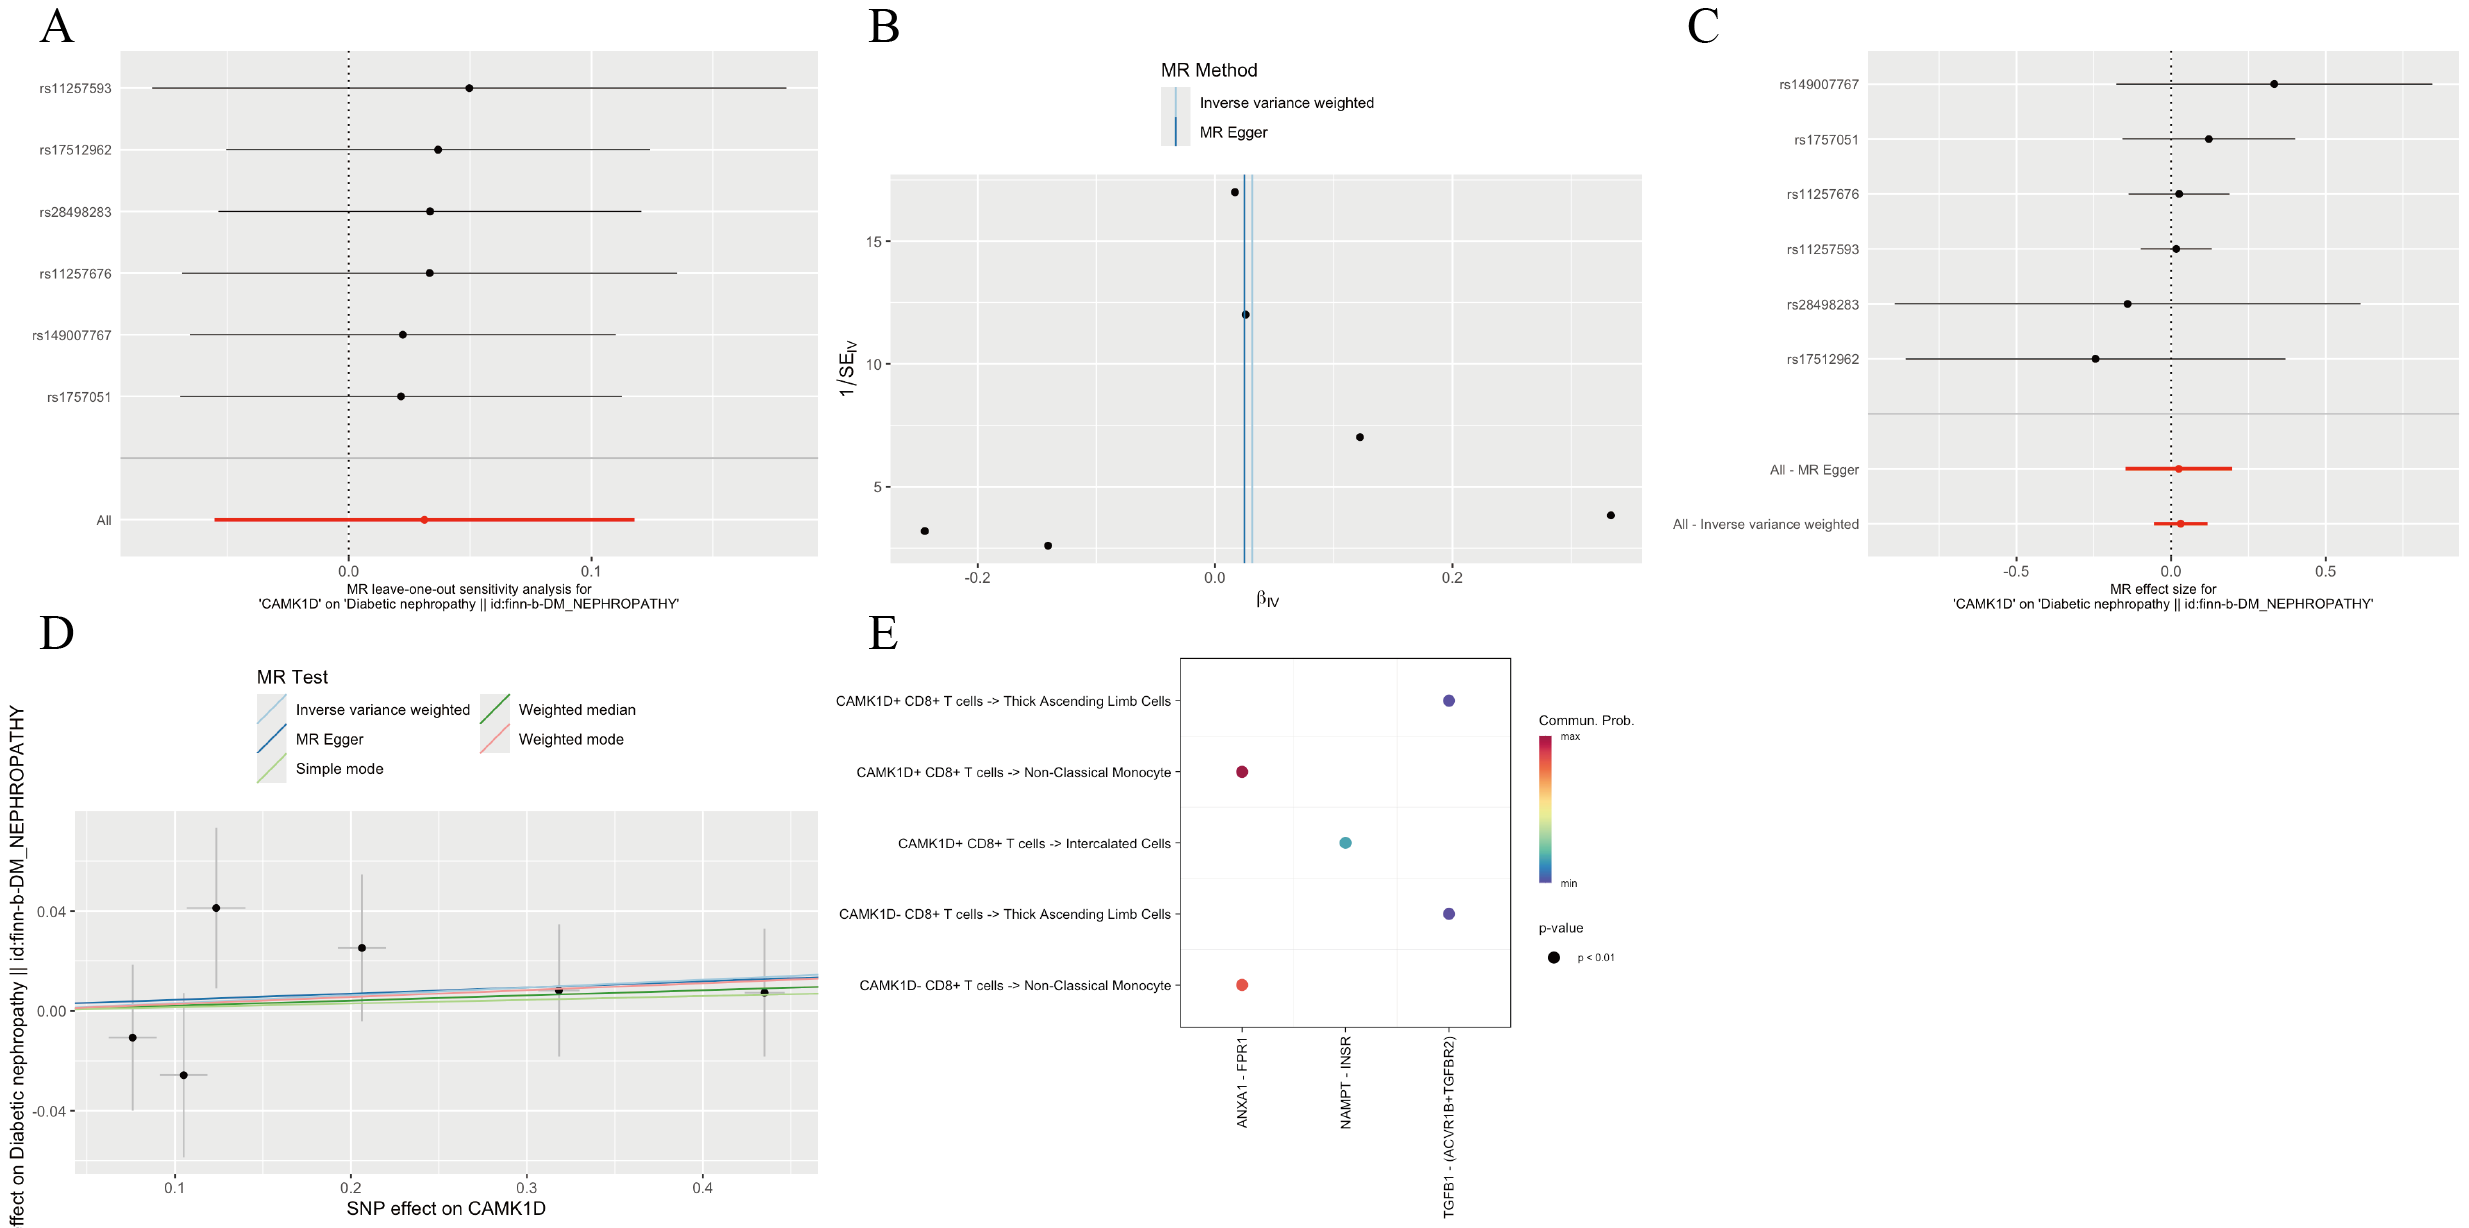
Furthermore, validation using an independent GWAS dataset (finn-b-DM_NEPHROPATHY) further supported the association between CAMK1D and DKD (Figs. S3A–S3D, S4). Reverse two-sample MR analysis revealed no evidence of a causal effect of DKD on CAMK1D expression (Fig. 5G). The SNP rs883220, located within the CAMK1D locus, emerged as a lead signal significantly associated with DKD, with other SNPs in strong LD potentially contributing collectively to the observed genetic association (Fig. 5F).
Cell–cell communication profiles of CAMK1D+/- CD8+ T cells in the renal microenvironment
To elucidate the functional role of CAMK1D within the immune microenvironment, the expression profiles of 15 candidate genes were mapped onto the single-cell dataset. CAMK1D expression was enriched in podocytes, connecting tubule cells, endothelial cells, and immune cells (Figs. 6A, 6B). Within the immune compartment, CAMK1D expression was particularly enriched in neutrophils, T cells, and non-classical monocytes (Figs. 6C, 6D). Stratification of T cells revealed that CAMK1D expression was predominantly localized in CD8+ T cells (Figs. 6E, 6F), consistent with the prior findings.
Cell–cell communication analysis was performed on CD8+ T cells stratified by CAMK1D expression status (positive vs. negative). As shown in Fig. 7A, both CAMK1D + and CAMK1D- CD8+ T cells engaged in ANXA1–FPR1-mediated communication with non-classical monocytes. Additionally, CAMK1D + CD8+ T cells exhibited interactions with thick ascending limb (TAL) cells through the TGFB1–(ACVR1B+TGFBR2) signaling axis and with intercalated cells via the NAMPT–INSR pathway (Fig. S3E).
| Exposure | Outcome | Method | Q | P (Heterogeneity) | P (Pleiotropy) |
|---|---|---|---|---|---|
| CAMK1D | DKD (ebi-a-GCST90018832) | Inverse variance weighted | 10.32 | 0.11 | – |
| CAMK1D | DKD (ebi-a-GCST90018832) | MR Egger | 10.31 | 0.07 | 0.95 |
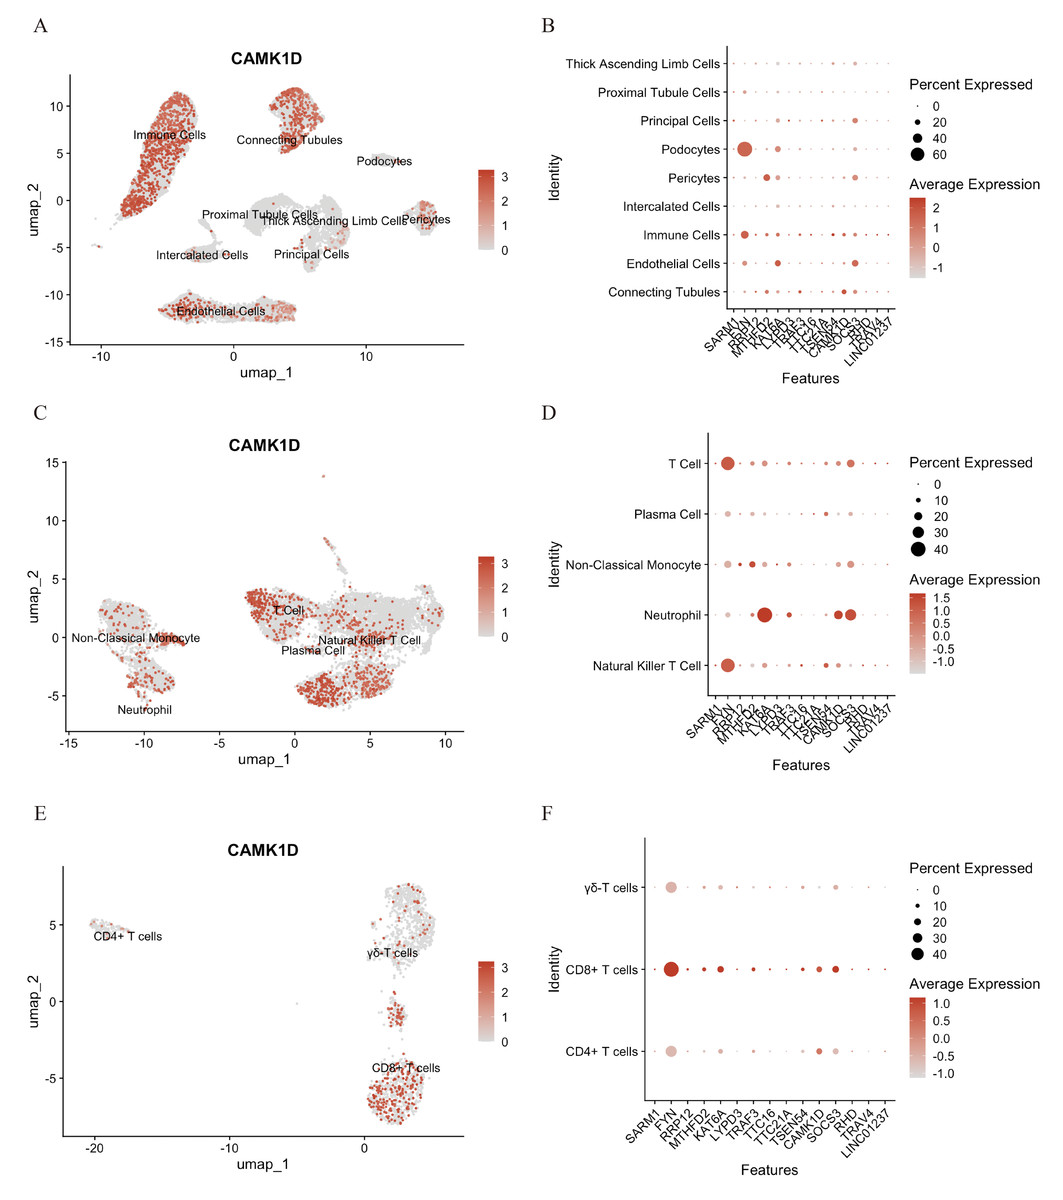
Figure 6: Functional analysis of CD8+ T cluster core markers in CAMK1D.
(A, B) The spatial distribution of marker expression in kidney cell. (C, D) The spatial distribution of marker expression within immune cell subset. (E, F) The spatial distribution of marker expression within T cell subset.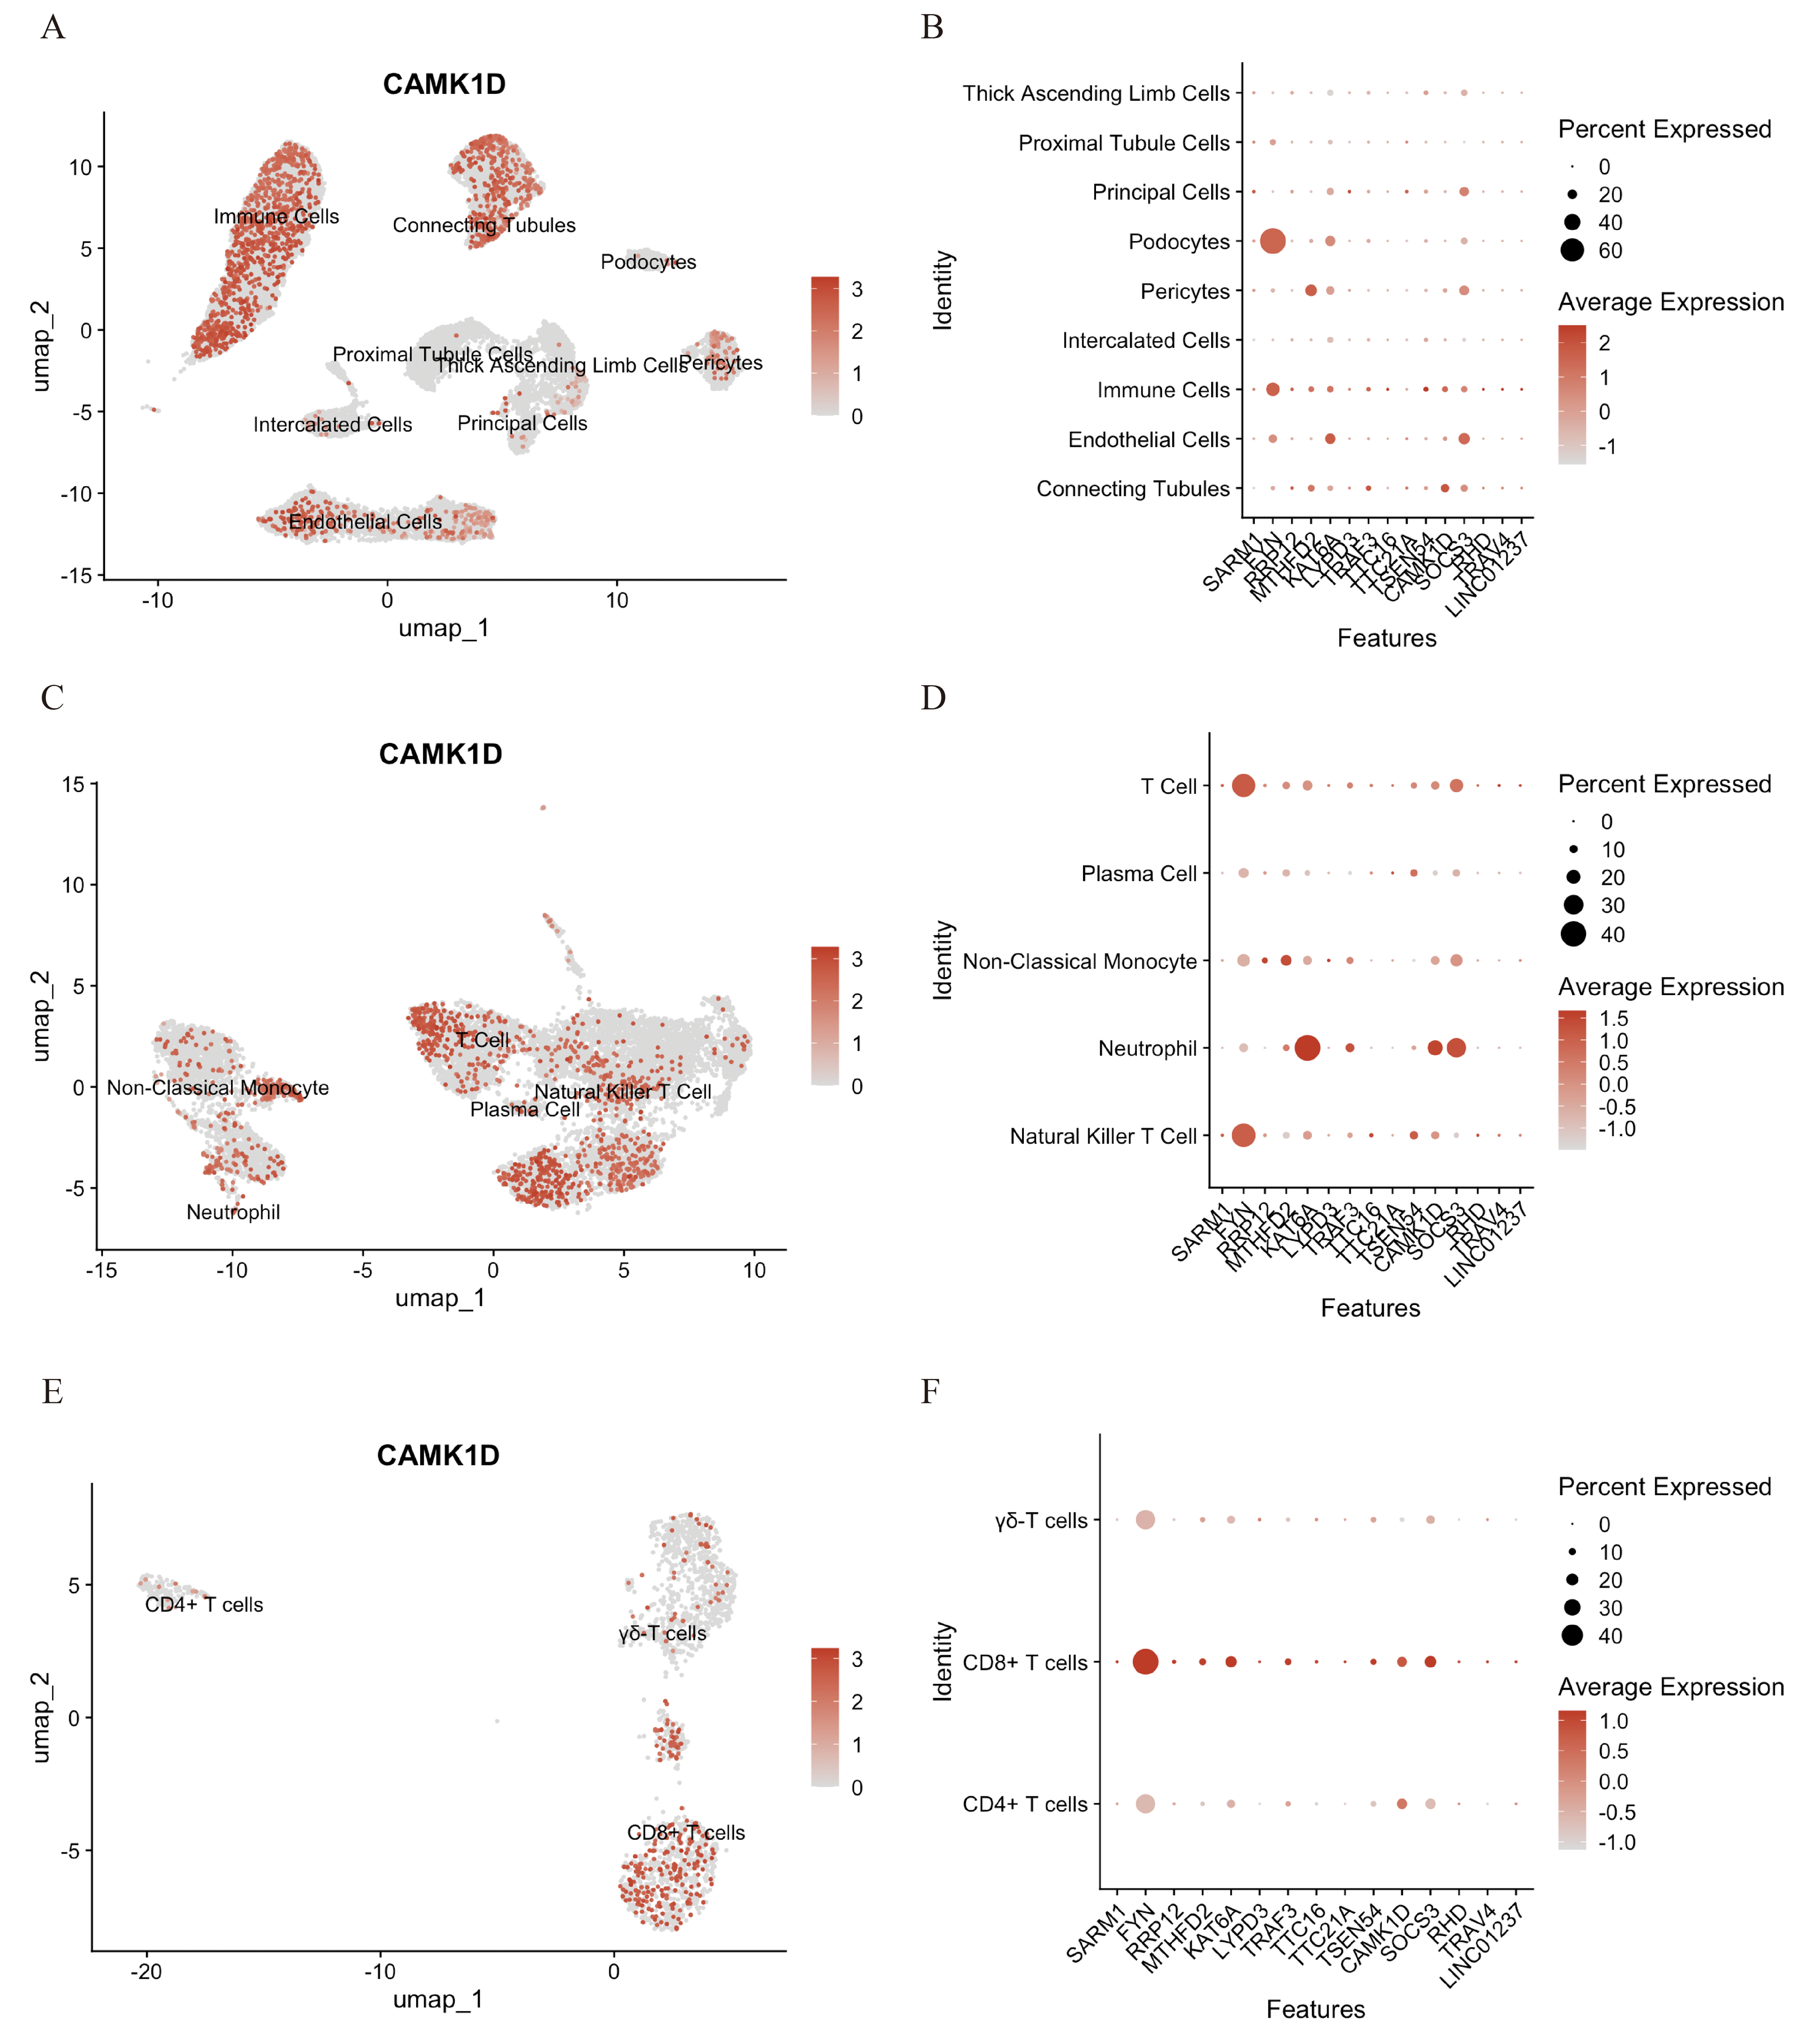
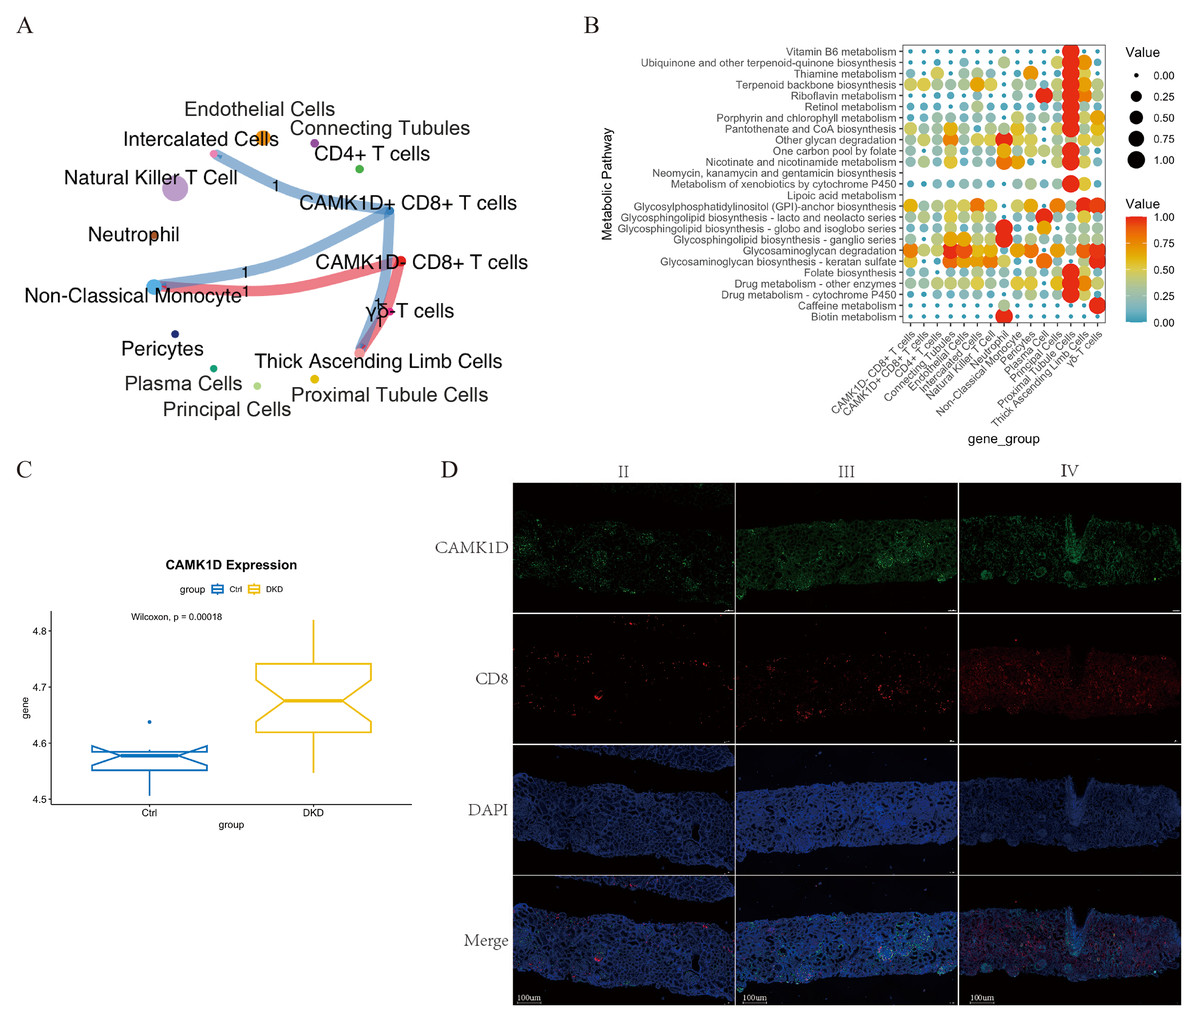
Figure 7: Integrated characterization of CAMK1D-associated intercellular communication, metabolic pathway alterations, and renal tissue expression in DKD.
(A) Cell–cell communication network showing ligand–receptor interactions between CAMK1D-positive and -negative CD8+ T cells and other cell subsets. The thickness of each line represents the number of pairings. (B) Enrichment of metabolic pathways by a bubble diagram founded on differential metabolites between marker-positive and -negative CD8+ T cells. Each bubble denotes a single metabolic pathway. The number of involved metabolites and the p-value are listed on the right. CAMK1D expression in RNA-seq data and DKD patient kidney tissues. (C) The mRNA expression level of CAMK1D in DKD samples compared to healthy controls. (D) Double immunofluorescence staining revealed CAMK1D expression in the DKD kidney tissues. DKD, diabetic kidney disease.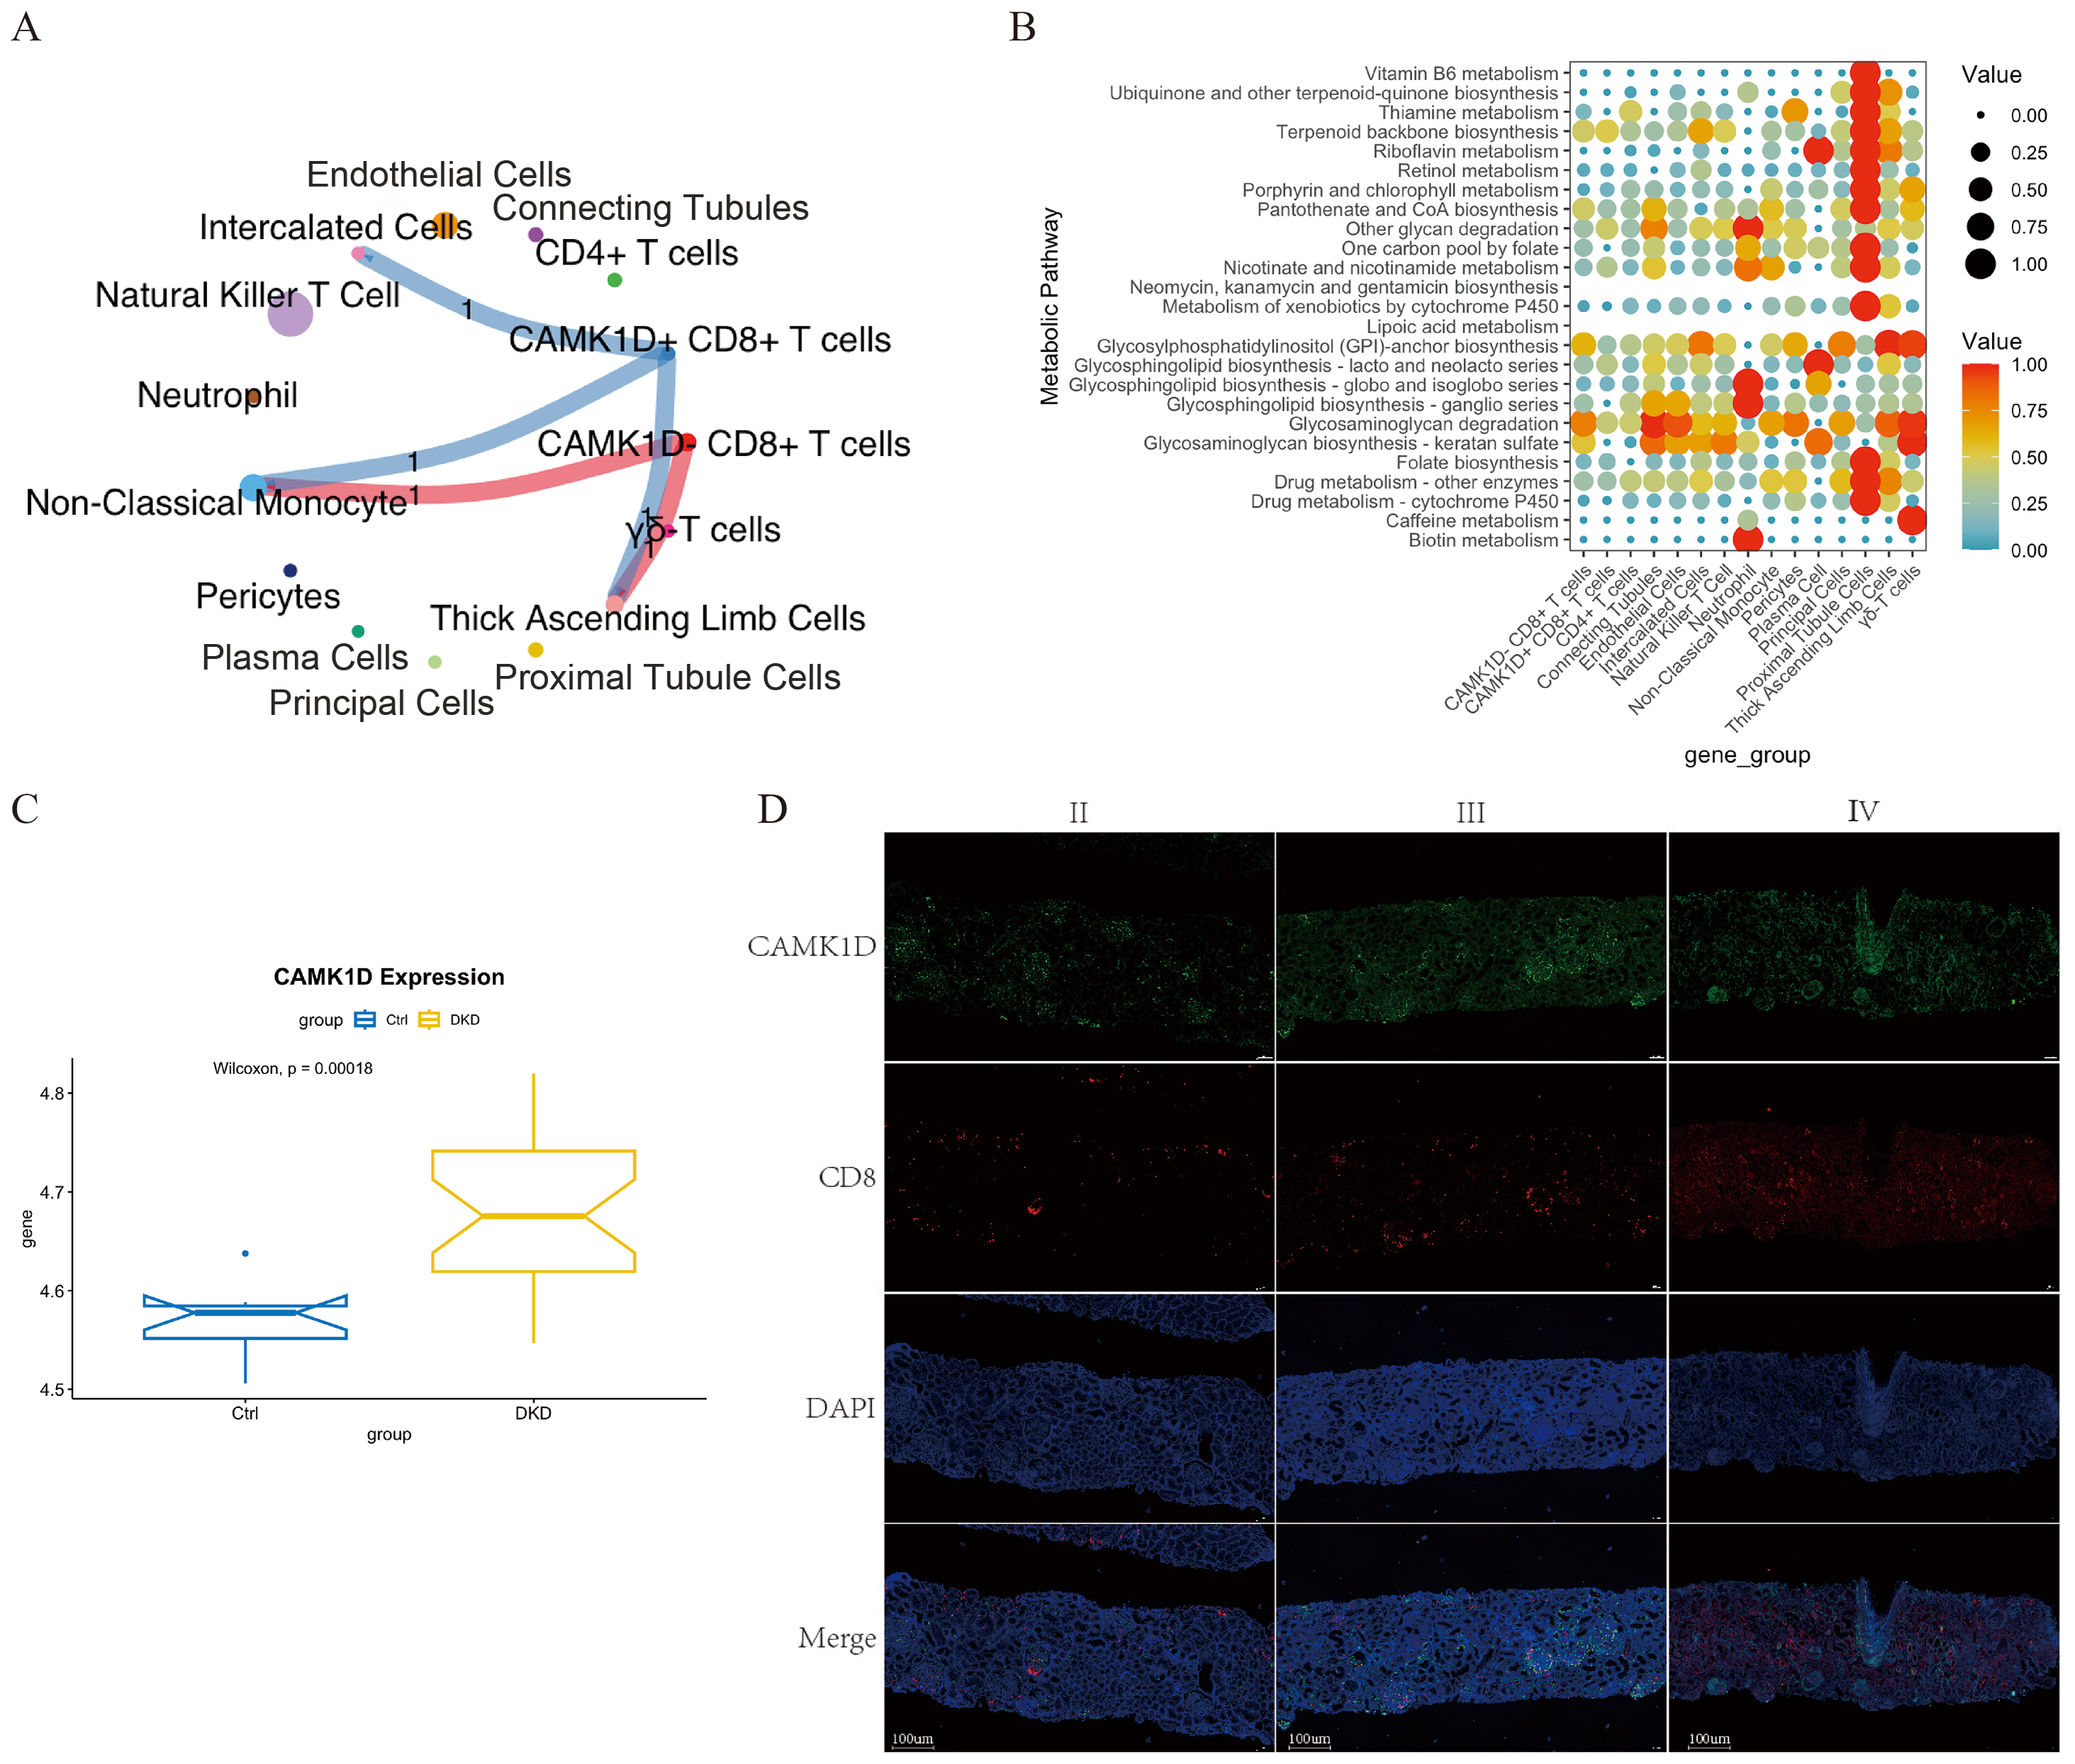
Metabolic pathways enrichment analysis of CAMK1D + CD8+ T cells in DKD patients revealed selective upregulation of terpenoid backbone biosynthesis, glycosphingolipid biosynthesis (lacto and neolacto series), and glycosaminoglycan degradation (Fig. 7B).
CAMK1D expression in RNA-seq data and DKD patient kidney tissues
Using the GSE142025 dataset, we analyzed renal gene expression profiles from healthy individuals and DKD patients. The mRNA expression level of CAMK1D was significantly elevated in DKD samples compared to healthy controls (P < 0.05) (Fig. 7C). This finding is consistent with the results of both MR and scRNA-seq analyses, further reinforcing the role of CAMK1D in DKD.
To further validate the involvement of CAMK1D in DKD, kidney biopsy samples were collected from three patients with a confirmed diagnosis of DKD at Jiangsu Provincial Hospital of Chinese Medicine in 2024. Double immunofluorescence staining revealed that both CAMK1D and CD8+T cell were expressed in the glomeruli and renal tubules of DKD kidneys, with partial co-localization observed (Fig. 7D).
Discussion
Aging is a major contributor to the development of DKD, which remains the leading cause of ESRD worldwide. However, the heterogeneity of DKD pathogenesis and the lack of effective diagnostic biomarkers pose major challenges to early detection and clinical intervention. As a result, many patients fail to receive intervention during the optimal therapeutic window, leading to irreversible disease progression. Therefore, identifying robust biomarkers for the diagnosis and treatment of DKD, especially in elderly individuals, remains a critical priority.
In this study, we integrated two scRNA-seq datasets from human kidney tissue, including samples from DKD patients, healthy young and elderly individuals (n = 6 per group). Both the number and proportion of immune cells were significantly increased in DKD and aging kidneys compared to young controls, suggesting that immune cell infiltration is closely associated with aging and DKD pathogenesis (Yang & Mou, 2017; Zheng & Zheng, 2016). The emergence of senescent immune phenotypes during aging may contribute to a chronic pro-inflammatory state that accelerates renal fibrosis, potentially explaining why elderly individuals are particularly vulnerable to DKD. In recent years, growing attention has focused on the role of the immune microenvironment in DKD. Studies have shown that elevated levels of T cells and their activation markers in patient serum are associated with progressive renal function decline (Liu et al., 2023), and aberrant T cell infiltration has been observed in DKD kidney tissue (Palmer et al., 2015; Wu et al., 2011). In DKD mouse models, T cell senescence contributes to chronic inflammation and accelerates fibrosis (Pan et al., 2021), while aging M1 macrophages secrete more pro-inflammatory cytokines, further aggravating renal injury (Lv et al., 2017).
Further dimensionality reduction and clustering of immune cell subpopulations revealed that the changes in T cell numbers—particularly CD8+ T cells—closely mirrored trends observed in total immune cells, with increased infiltration in both DKD and elderly kidney tissues. CD8+ T cells, also known as cytotoxic T lymphocytes (CTLs), are primarily responsible for recognizing and eliminating damaged or infected cells. In DKD, CD8+ T cells infiltrate the renal tubules and activate tubular epithelial cells, leading to the release of injury-related molecules such as Kidney injury molecule 1(KIM-1), thereby aggravating renal injury. Moreover, CD8+ T cells secrete pro-inflammatory cytokines including interferon-γ (IFN-γ) and TNF-α, thereby promoting a sustained inflammatory response that further damages kidney tissue. Chronic inflammation also upregulates Transforming Growth Factor 1(TGF-β1), a key driver of renal fibrosis and progressive decline in renal function. In kidney biopsies from DKD patients, Th1, Th17, CD4+, CD8+, and CD20+ T cells all exhibit varying degrees of infiltration (Moon et al., 2012), with CD8+ T cell abundance positively correlating with histopathological damage and renal function decline. In mouse models of DKD, increased CD8+ T cell infiltration aggravates podocyte injury and promotes glomerulosclerosis (Li et al., 2022), while functional inhibition of CD8+ T cells significantly attenuates renal pathology, highlighting the pivotal role of CD8+ T cell in DKD progression (Liu et al., 2023).
Notably, CD8+ T cell infiltration was evident in the kidney tissue of elderly individuals. This finding may reflect the effects of immunosenescence and chronic low-grade inflammation associated with aging, which could promote the abnormal retention of CD8+ T cells in peripheral organs such as the kidney (He et al., 2022). The accumulation of CD8+ T cells in the peripheral blood of of elderly individuals has likewise been reported—a phenomenon that not only increases susceptibility to infections but may also compromise the immune clearance of senescent cells. Through secretion of senescence-associated secretory phenotype (SASP) factors, these cells may exacerbate systemic aging and contribute to the progression of age-related disorders (Martínez-Zamudio et al., 2021). These findings suggest that CD8+ T cells are involved not only in DKD pathogenesis but also in the age-related vulnerability to DKD.
Interestingly, in our study, the proportion of T cells among total immune cells, and that of CD8+ T cells within the T cell compartment, was relatively higher in young individuals, despite their lower absolute T cell counts. This seemingly paradoxical trend may be explained by the lower immune cell diversity observed in the young group, whereas the DKD and elderly groups displayed a broader spectrum of immune populations, including natural killer T (NKT) cells, non-classical monocytes, plasma cells, and neutrophils. The relative expansion of these populations could have indirectly reduced the proportional representation of T cells and CD8+ T cells. Nonetheless, in terms of absolute numbers, CD8+ T cells remained more abundant in both DKD and elderly individuals, reinforcing their central role in the immune landscape of both DKD and aging.
Moreover, both DKD and elderly kidney tissues exhibited CD8+ T cell–non-classical monocyte interactions mediated through the ANXA1–FPR1 signaling axis. CD8+ T cells may secrete Annexin A1(ANXA1), which binds to the Recombinant Formyl Peptide Receptor 1(FPR1) receptor on non-classical monocytes, thereby modulating their immune function. ANXA1 is an anti-inflammatory mediator expressed by various immune cells and plays a regulatory role in the resolution of inflammation. Loss of ANXA1 has been shown to upregulate aging-associated proteins and exacerbate tissue damage (You et al., 2024). Wu et al. (2021) reported that ANXA1 expression was significantly upregulated in both the glomeruli and renal interstitium of DKD kidneys, and was positively correlated with serum creatinine, 24-hour urinary protein, and tubulointerstitial inflammation. These findings suggest that the ANXA1–FPR1 axis may constitute a key communication pathway linking CD8+ T cells and non-classical monocytes during renal inflammation in both DKD and aging.
To further identify key genes potentially involved in both DKD and aging, we performed genome-wide MR analysis using DEGs from CD8+ T cells—in comparison to other renal and immune subpopulations—as exposure variables, and DKD GWAS summary statistics (ebi-a-GCST90018832) as the outcome. This analysis identified 15 candidate genes with significant associations with DKD (FDR < 0.05), among which CAMK1D exhibited the strongest causal relationship. Validation using the GSE142025 RNA-seq dataset confirmed that CAMK1D expression was significantly upregulated in DKD kidney tissue relative to controls (P < 0.05), consistent with our MR findings.
CAMK1D is a member of the calcium/calmodulin-dependent kinase (CaMK) family, which includes CaMK1, CaMK2, CaMK4, and CaMKK, and which participate in calcium signaling pathways that regulate a wide range of cellular processes. GWAS on T2DM have shown that SNPs in the CAMK1D locus are significantly associated with increased susceptibility to T2DM (Fromont et al., 2020; Kooner et al., 2011; Zeggini et al., 2008) and cardiovascular complications (Chen et al., 2013). However, findings in DKD animal models have been inconsistent. Yuan et al. (2024) observed downregulation of CAMK1D in both DKD patients and streptozotocin-induced diabetic mice, while Gujarati et al. (2024) found that CAMK1D expression increased with the severity of fibrosis in a KLF6-PODTA mouse model and was particularly enriched in proximal tubules. In both models, inhibition of CAMK1D exacerbated mitochondrial dysfunction and renal injury by promoting mitochondrial fission. Our MR analysis demonstrated a positive causal association between CAMK1D expression in CD8+ T cells and DKD risk. Immunofluorescence staining of DKD kidney biopsies revealed CAMK1D expression in both glomeruli and tubules, partially co-localizing with CD8+ T cells. Notably, CAMK1D expression was higher in advanced-stage DKD, aligning with human genetic evidence but contrasting with some animal model findings. These discrepancies may reflect interspecies differences or stage-specific pathological features. Mouse models typically emphasize fibrosis, whereas early-stage human DKD is characterized by glomerular basement membrane thickening and mesangial expansion. CAMK1D may be enriched in glomeruli in early DKD, where it could modulate CD8+ T cell–mediated immune responses, including ANXA1–FPR1 signaling. In later stages, CAMK1D accumulation in renal tubules may help preserve mitochondrial function by regulation of dynamin-related protein 1(DRP1), thus slowing fibrosis progression.
To further investigate the functional heterogeneity of CAMK1D+ CD8+ T cells, we stratified CD8+ T cells based on CAMK1D expression and analyzed their cell–cell communication profiles. Both CAMK1D+ and CAMK1D− CD8+ T cells exhibited ANXA1–FPR1-mediated interactions with non-classical monocytes. CAMK1D may enhance ANXA1 secretion in CD8+ T cells, thereby activating FPR1 receptors on non-classical monocytes and thereby amplifying renal inflammation. In addition, CAMK1D+ CD8+ T cells interacted with TAL cells via the TGFB1–(ACVR1B+TGFBR2) axis. TGF-β1 is a well-characterized pro-fibrotic cytokine implicated in the progression of chronic kidney disease (Meng, Nikolic-Paterson & Lan, 2016). Its receptors, ACVR1B and TGFBR2, play essential roles in both canonical (Smad-dependent) and non-canonical signaling pathways (Liu et al., 2024). Through interaction with TGFBR2, TGF-β1 recruits and activates TGFBR1, which in turn phosphorylates Smad2/3, initiating transcriptional programs that drive fibrosis. Alternatively, TGF-β1 may bind ACVR1B to activate PI3K/AKT signaling, promoting epithelial–mesenchymal transition (EMT) in renal tubular epithelial cells (Liu et al., 2024). Whether similar pro-fibrotic signaling is triggered in TAL cells remains to be determined. CAMK1D+ CD8+ T cells also engaged in NAMPT–INSR–mediated communication with intercalated cells. Nicotinamide Phosphoribosyl transferase (NAMPT) is a critical enzyme in the NAD+ salvage pathway and regulates immune metabolism and inflammatory responses in both CD4+ and CD8+ T cells (Li et al., 2023). In DKD, NAMPT may contribute to insulin resistance by reducing SIRT1 activity (Chung et al., 2015), downregulating INSR expression and impairing T cell function. This NAMPT–INSR axis may therefore link metabolic dysfunction to immune dysregulation in DKD. Additionally, our study is the first, to our knowledge, to suggest that CAMK1D+ CD8+ T cells may be enriched in several metabolic pathways, including terpenoid backbone biosynthesis, glycosphingolipid biosynthesis (lacto and neolacto series), and glycosaminoglycan (GAG) degradation. The glycosphingolipid biosynthesis–lacto and neolacto series pathway has been associated with the pathogenesis of diabetic cataracts (Han et al., 2022), while GAGs represent essential components of the glomerular anionic filtration barrier. In diabetes, decreased GAG levels in the glomerular basement membrane contributed to protein leakage and DKD development (Parthasarathy & Spiro, 1982). Clinically, increased urinary GAG excretion in DKD patients is positively correlated with disease progression (Popławska-Kita et al., 2008). Moreover, exogenous GAGs—such as those derived from Andrias davidianus skin extracts—have been shown to promote macrophage polarization toward an anti-inflammatory and pro-regenerative phenotype (CD206+/Arg1+) by modulating glycolipid metabolism. This process helps suppress excessive inflammation and facilitates tissue repair in diabetic models (Yang et al., 2025). Collectively, these findings highlight the potential relevance of glycosphingolipid and GAG-related pathways in DKD immunometabolism, raising the possibility that CAMK1D may influence disease progression through these metabolic mechanisms that warrant further functional investigation.
In summary, this study integrated DKD-related scRNA-seq and GWAS datasets to provide a comprehensive exploration of the genetic and immunological landscape of DKD. We identified a causal relationship between CAMK1D and DKD through MR analysis and confirmed its upregulation in an independent RNA-seq dataset (GSE142025). Reverse MR analysis and multiple sensitivity tests suggested a low likelihood of confounding bias, providing preliminary evidence to support CAMK1D as a potential therapeutic target. Notably, CAMK1D was specifically enriched in CD8+ T cells, suggesting it may contribute to disease progression via T cell–mediated immune amplification. This finding is consistent with recent studies in tumor immunology, where CAMK1D has been associated with T cell exhaustion. Despite these insights, several limitations must be acknowledged. First, the number of single-cell samples was limited (n = 6 per group), which may affect the robustness of cell clustering and the reliability of DEG detection. In scRNA-seq analysis, limited biological replicates can reduce statistical power and increase susceptibility to sample-specific variation, potentially compromising cluster stability and underrepresenting cell types. Similarly, DEG detection under small-sample conditions may be influenced by inter-sample variability and batch effects, leading to false negatives or exaggerated differences. Furthermore, the five immune cell subtypes identified may have been influenced by sequencing depth and dataset quality. Second, DKD pathological stages were not distinguished, which may have obscured staged-specific changes during disease progression. Third, while CellChat analysis suggested possible interactions involving CAMK1D+ CD8+ T cells (e.g., ANXA1 and TGFB1 signaling), these results remain predictive. No direct experimental evidence confirms that CAMK1D+ CD8+ T cells secrete these ligands or mediate functional effects, which should be addressed in future validation studies. Moreover, while MR analysis suggests a potential causal association between CAMK1D and DKD, further in vitro and in vivo experiments manipulating CAMK1D expression in CD8+ T cells are needed to clarify its specific role in T cell activation and kidney injury mechanisms. Finally, in our study, immunofluorescence analysis revealed CAMK1D expression and partial co-localization with CD8+ T cells in DKD renal tissue. Some previous studies have reported conflicting results regarding CAMK1D expression. These discrepancies may stem from disease stage, interspecies variation, or the limited sample size and cross-sectional design. Further validation in larger and more diverse patient cohorts, together with mechanistic studies investigating the role of CAMK1D in T cell activation and renal injury, is warranted to better elucidate its contribution to DKD progression. Together, these findings provide preliminary but valuable insights into the potential immunometabolic role of CAMK1D in DKD, laying the groundwork for future functional and translational investigations.
Conclusion
This study highlights the pivotal role of CD8+ T cells in shaping the renal immune microenvironment in both DKD and aging. MR analysis revealed a significant causal association between elevated CAMK1D expression and DKD risk, suggesting that CAMK1D may serve as a shared molecular risk factor linking aging and diabetic renal injury.
Supplemental Information
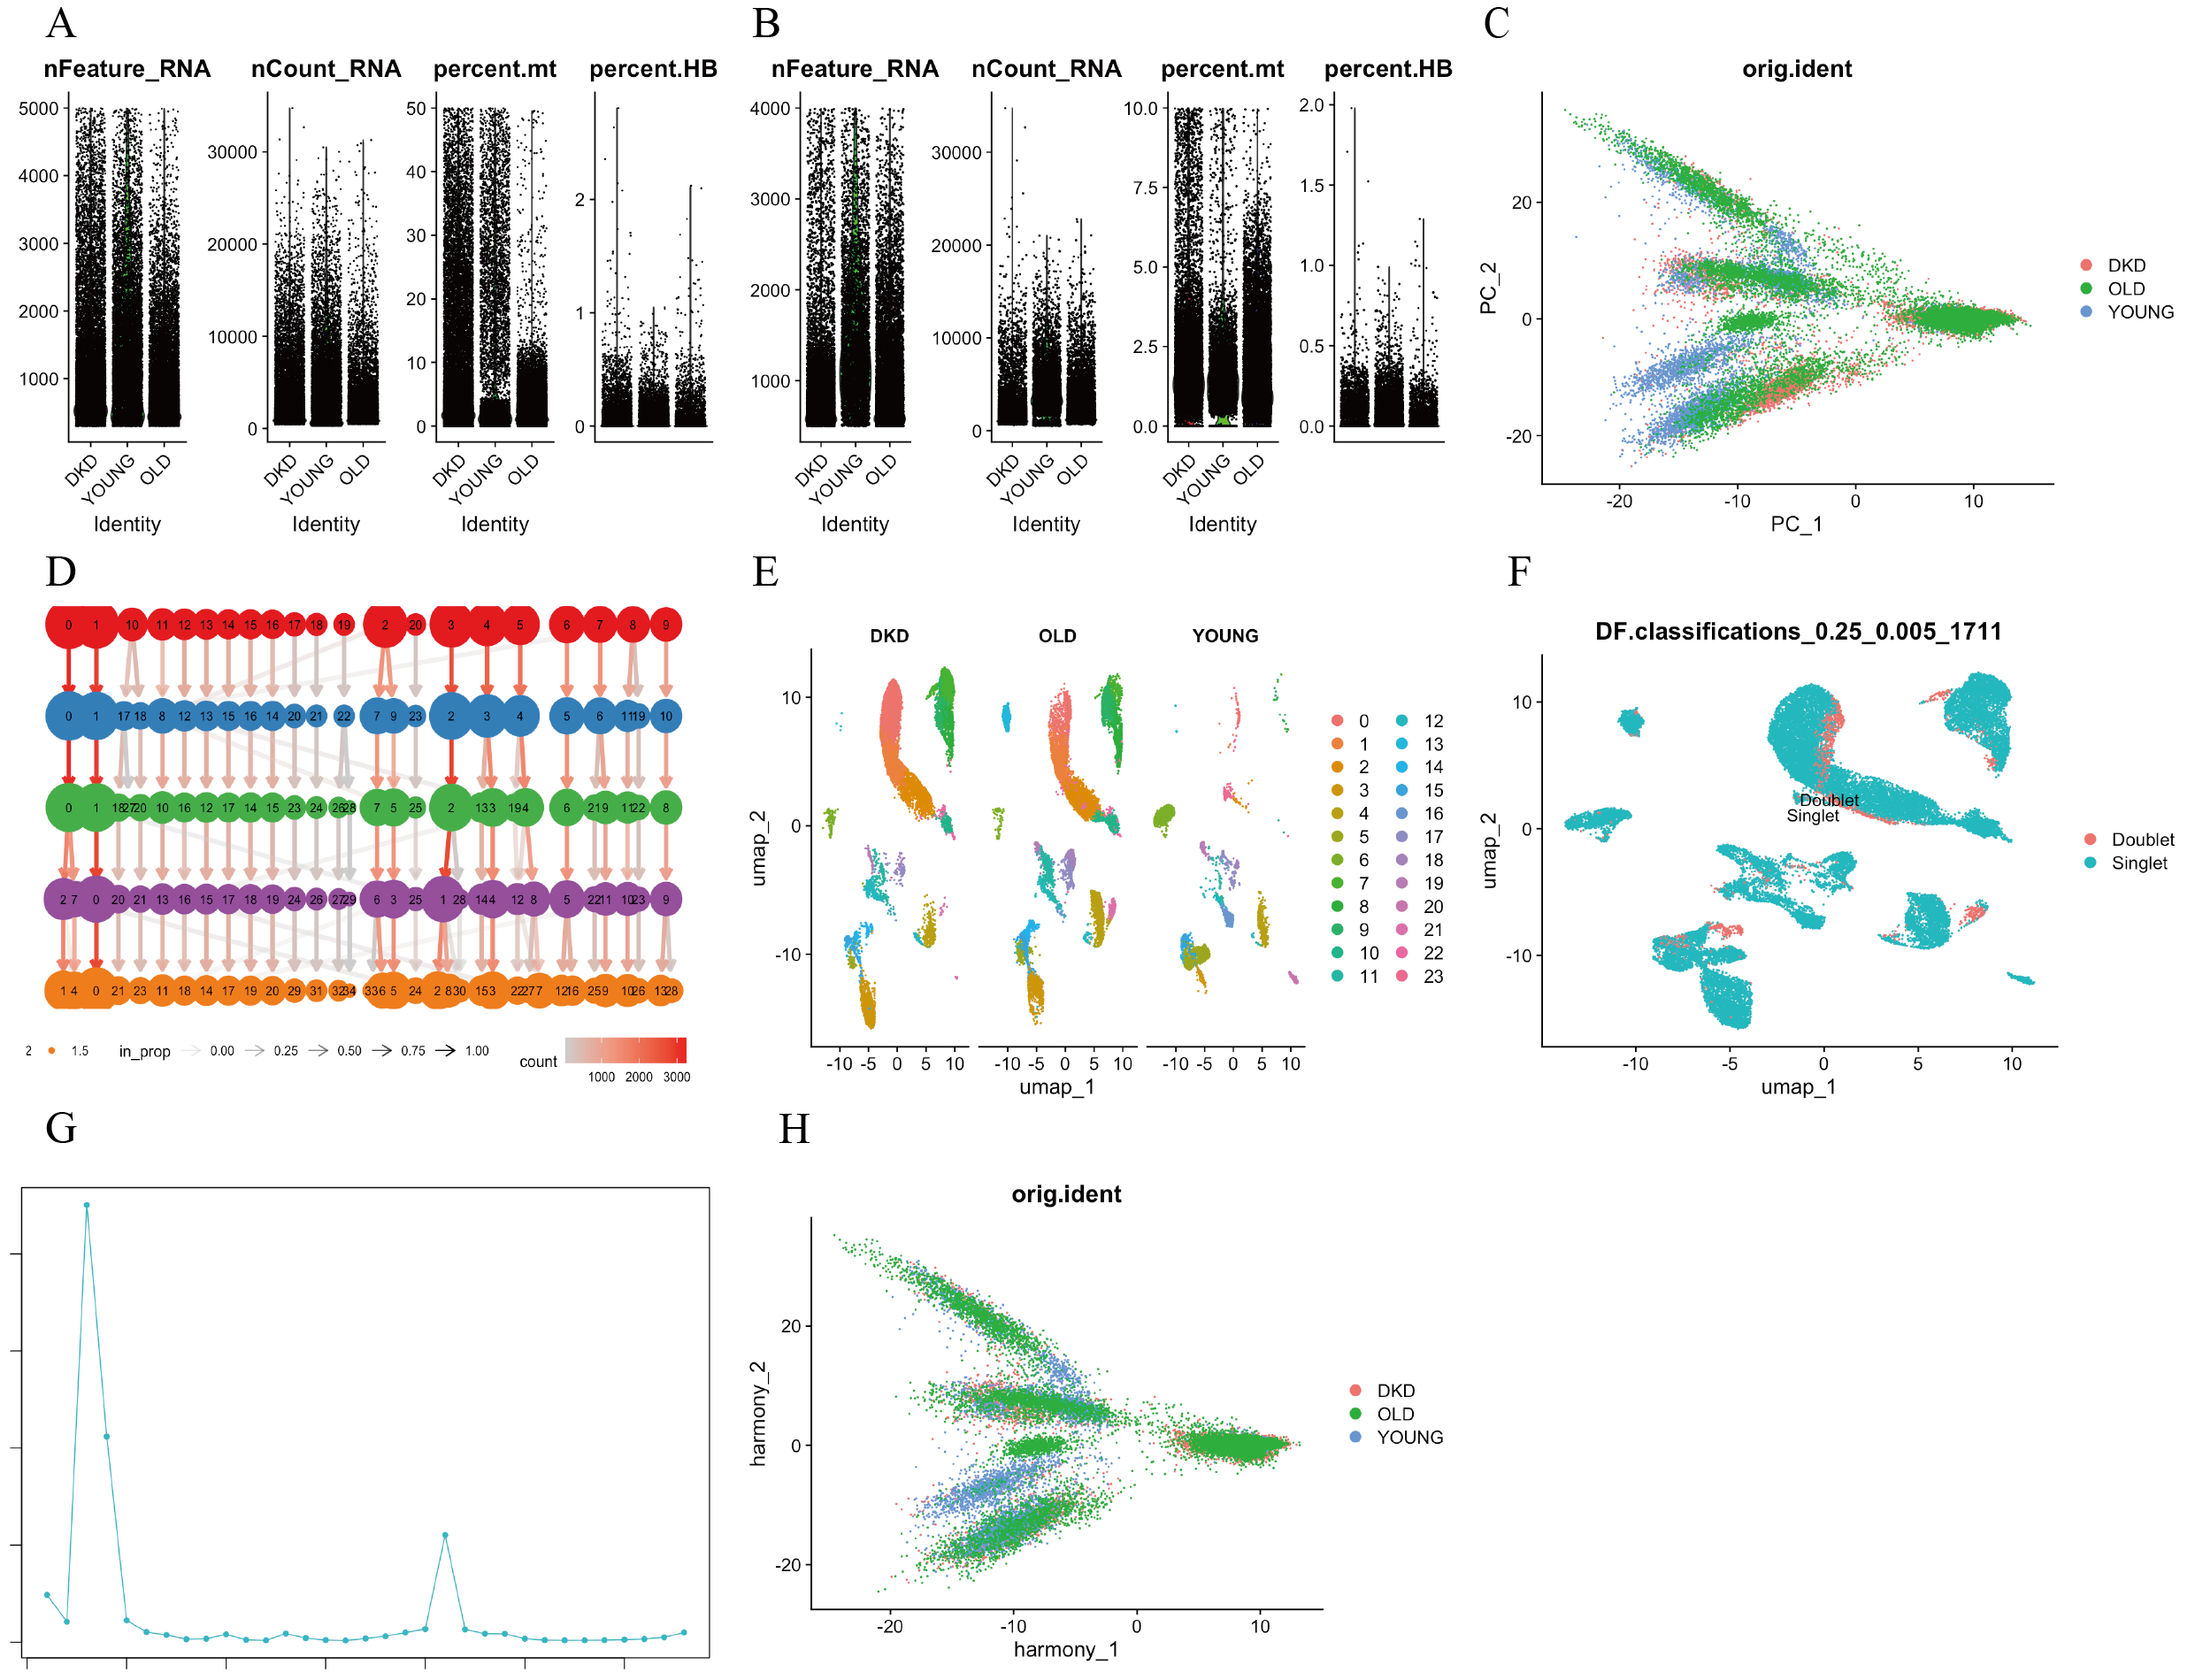
Single-cell transcriptional landscape and quality control of kidney tissue samples from DKD patients, young, and elderly individuals
(A,B) Quality control analysis of single-cell RNA sequencing, including the number of detected genes (nFeature.RNA), total UMI counts (nCount.RNA), mitochondrial gene percentage (percent.mt), and hemoglobin gene percentage (percent.HB) in each cell of kidney tissue. (C) PCA plot showing the degree of correlation between DKD, young, and aging kidney cells before batch correction. (D) Shared nearest neighbor (SNN) clustering at a resolution of 0.8. (E) UMAP visualization of cell clusters. (F, G) Identification and removal of doublets using DoubletFinder (pN = 0.25). (H) PCA plot showing the degree of correlation between DKD, young, and aging kidney cells after batch correction. DKD, diabetic kidney disease; SNN, shared nearest neighbor; UMAP, uniform manifold approximation and projection; PCA, principal component analysis.
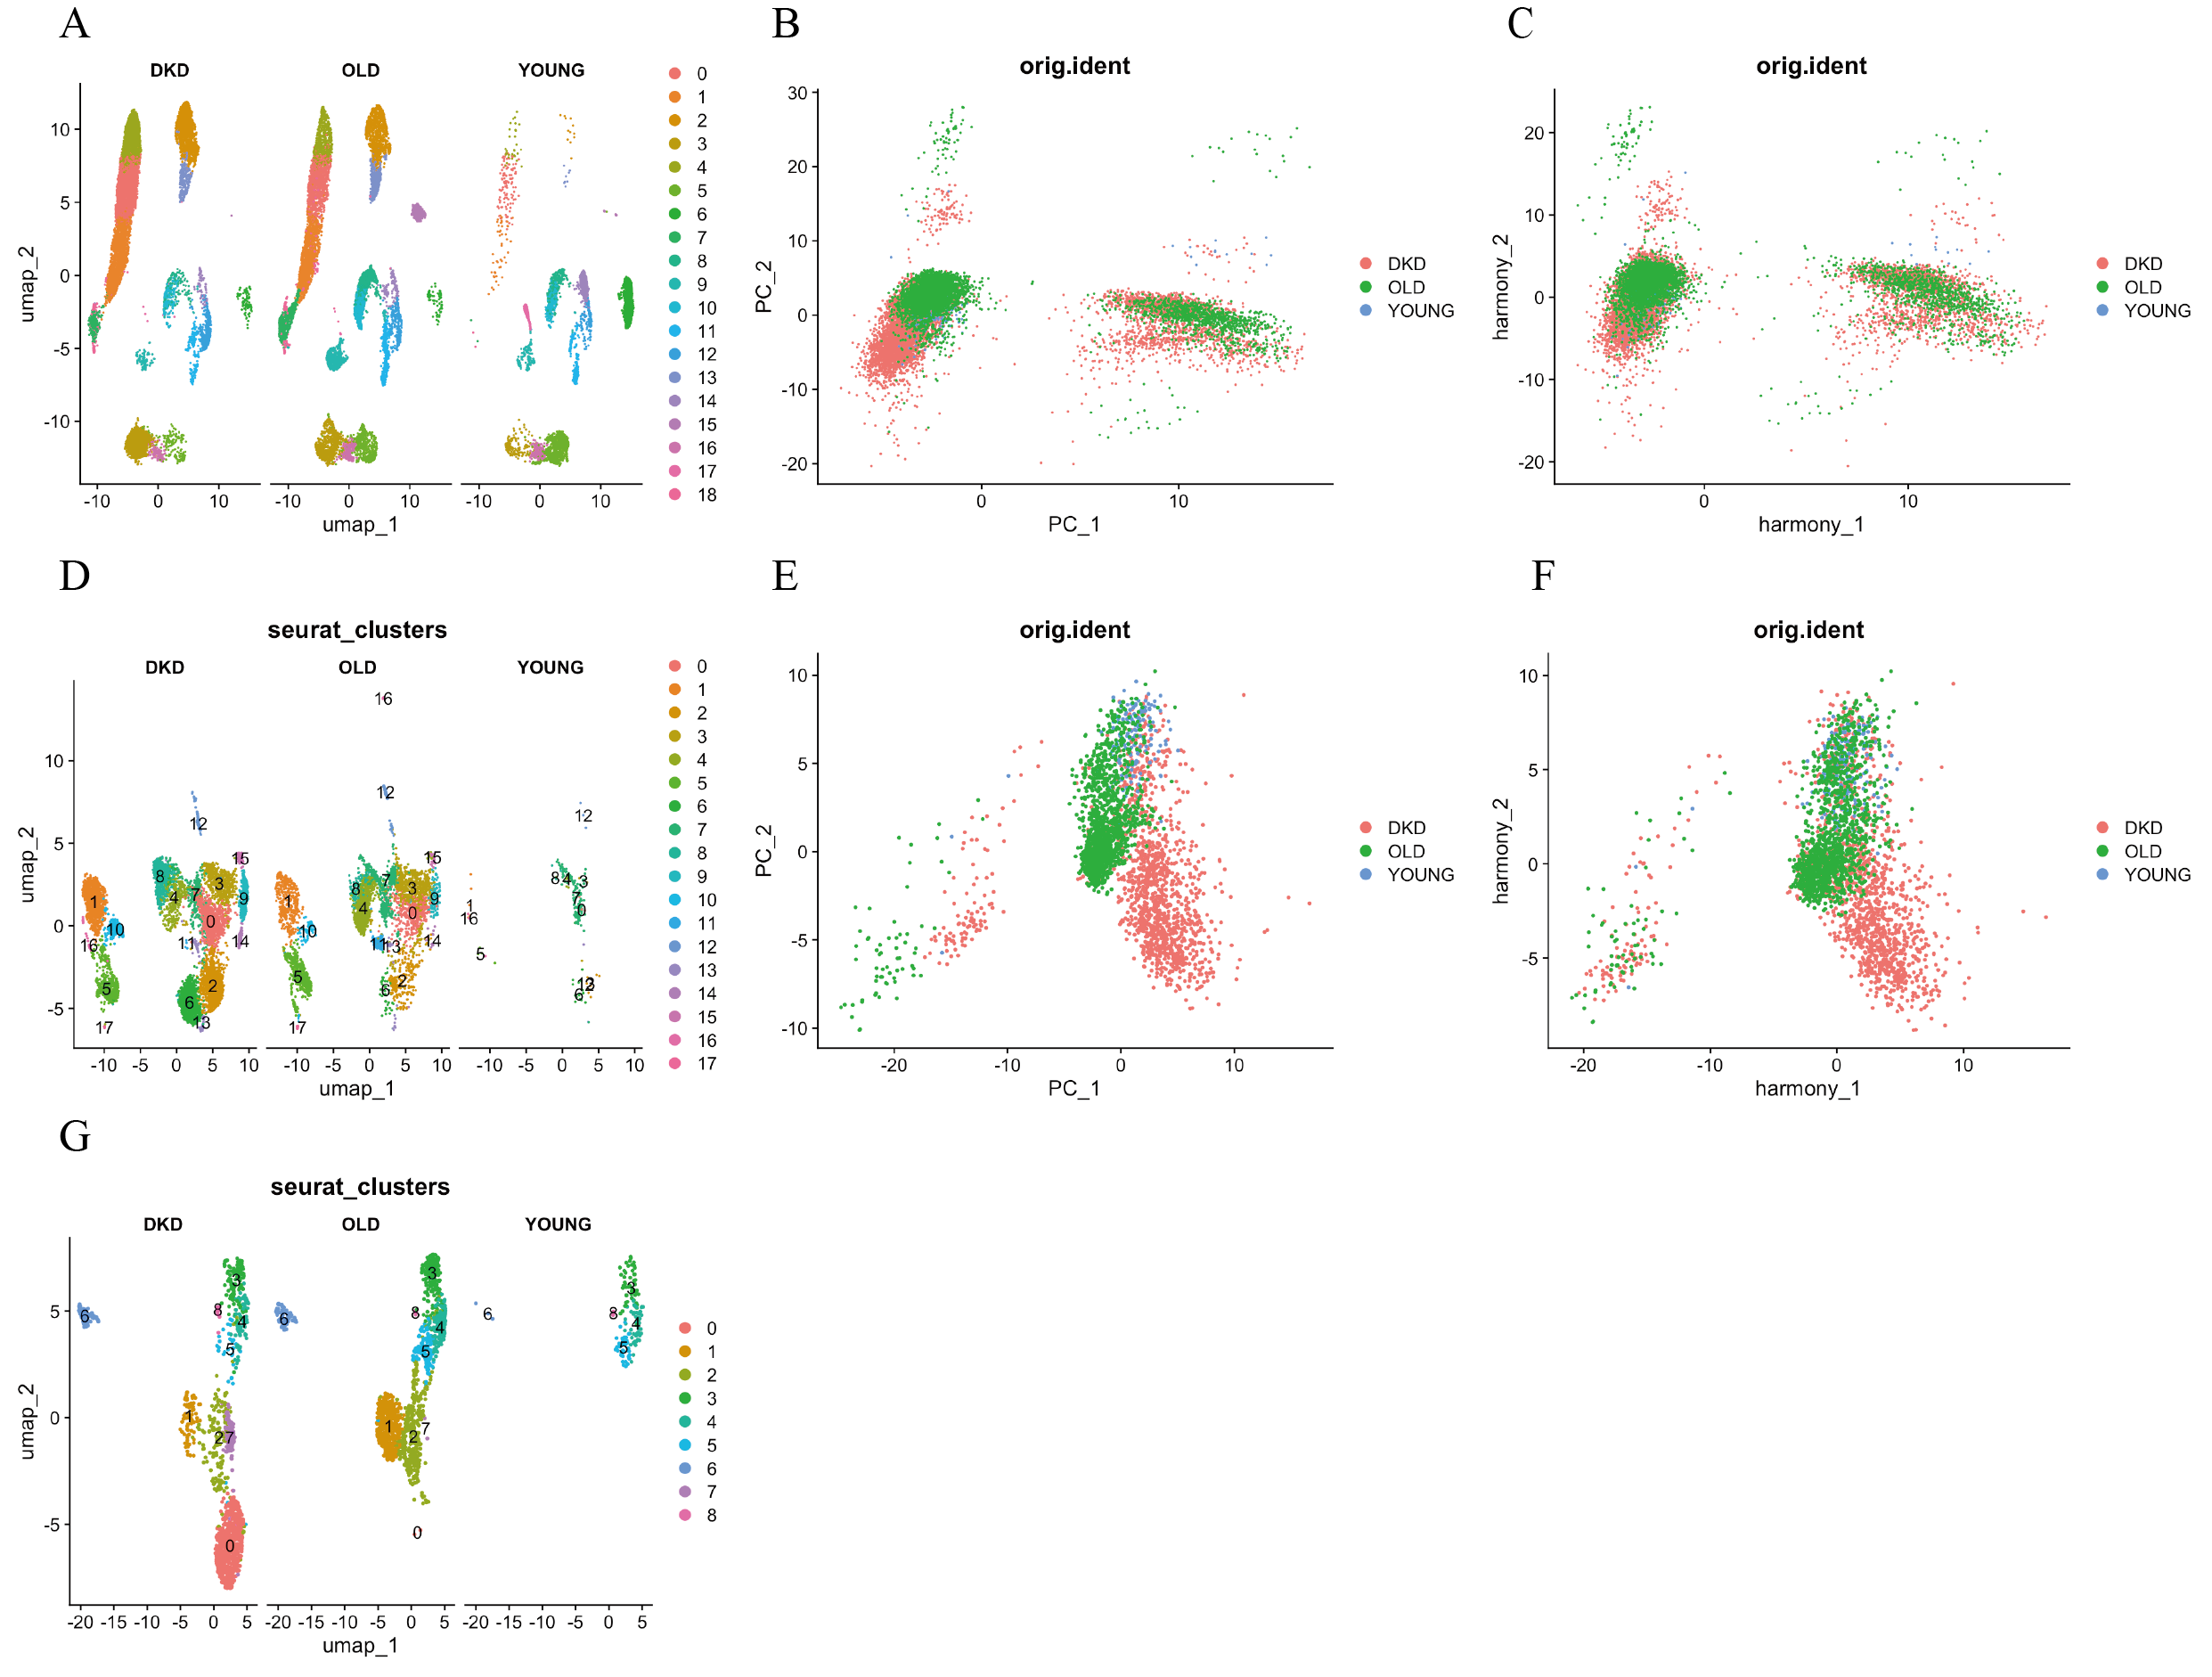
Identification and batch correction of immune and T cell subsets in kidney tissue
(A) UMAP visualization of kidney cell subsets. (B, C) PCA plots showing correlation among DKD, young, and aging immune cell clusters before and after batch correction. (D) UMAP showing spatial distribution and annotation of each immune cell subset. (E–F) PCA plots showing correlation among DKD, young, and aging T cell subsets before and after batch correction. (G) UMAP showing spatial distribution and annotation of each T cell subset. DKD: diabetic kidney disease; UMAP: uniform manifold approximation and projection; PCA: principal components analysis.
Validation MR analysis of CAMK1D and DKD
(A) Cell–cell communication network showing the number of ligand–receptor interactions between CAMK1D-positive and CAMK1D-negative CD8+ T cells and other T-cell subsets. (B-E) Validation MR analysis of CAMK1D and DKD. (B) Funnel plot of three SNPs on MR analysis. Funnel plot illustrating the distribution of causal estimates from individual SNPs . (C) Forest plot presenting MR estimates for each SNP and overall effects obtained using the IVW and MR-Egger methods. (D) Scatter plot showing the associations between SNP effects on CAMK1D expression (x-axis) and DKD risk (y-axis) across five MR models. Each point represents an IV, and the error bars indicate 95% CIs. (E) Leave-one-out sensitivity analysis evaluating the robustness of the causal estimates by iteratively excluding one SNP at a time. MR: mendelian randomization; DKD: diabetic kidney disease; IVW: nverse variance weighted; SNP: single nucleotide polymorphisms; IV: instrumental variables; CI: Confidence Interval.