
Identification and validation of a glutamine metabolism-related gene signature as a diagnostic and therapeutic target in osteoarthritis through integrated multi-omics analysis
- Published
- Accepted
- Received
- Academic Editor
- Vladimir Uversky
- Subject Areas
- Bioinformatics, Genomics, Orthopedics, Rheumatology, Metabolic Sciences
- Keywords
- Osteoarthritis, Glutamine metabolism, Multi-omics analysis, Diagnostic biomarkers, Metabolic reprogramming
- Copyright
- © 2026 Lu et al.
- Licence
- This is an open access article distributed under the terms of the Creative Commons Attribution License, which permits using, remixing, and building upon the work non-commercially, as long as it is properly attributed. For attribution, the original author(s), title, publication source (PeerJ) and either DOI or URL of the article must be cited.
- Cite this article
- 2026. Identification and validation of a glutamine metabolism-related gene signature as a diagnostic and therapeutic target in osteoarthritis through integrated multi-omics analysis. PeerJ 14:e20701 https://doi.org/10.7717/peerj.20701
Abstract
Background
The understanding of the pathogenesis of osteoarthritis (OA) is often fragmented, with studies focusing on individual tissues. A holistic view integrating multi-tissue molecular changes with systemic metabolic shifts is urgently needed. Glutamine metabolism, a central bioenergetic and biosynthetic hub, represents a critical but largely unexplored nexus in this disease network. This study leverages a multi-omics, multi-tissue approach to deconstruct the role of glutamine metabolism in OA and identify a robust, blood-based signature for potential diagnostic use.
Methods
We conducted a comprehensive bioinformatic investigation by integrating multiple GEO transcriptomic datasets from cartilage, synovium, subchondral bone, and peripheral blood. A machine learning pipeline, incorporating weighted gene co-expression network analysis (WGCNA) and least absolute shrinkage and selection operator (LASSO) regression, was employed to identify a signature of glutamine metabolism-related genes (GMRGs). The signature’s clinical relevance was then validated in an independent cohort of 62 subjects (31 OA patients vs. 31 healthy controls) using RT-qPCR on peripheral blood samples and plasma metabolomics. Furthermore, we computationally explored its potential regulatory mechanisms and predicted candidate therapeutic compounds.
Results
Our multi-layered analysis identified a core three-gene signature (F13A1, IRS2, RELA). Functional analysis linked this signature to pathways essential for OA pathogenesis, including mechanical stress, metabolic regulation, and inflammatory responses. Clinical validation in an independent cohort confirmed significant downregulation of all three genes in OA peripheral blood (P < 0.001) and revealed distinct regulatory patterns, including disease-specific activation of RELA and a metabolic regulatory reversal of IRS2, as well as negative correlations with disease severity and alterations in circulating glutamine-related metabolites. The resulting diagnostic model showed strong discriminatory performance across both training and validation datasets. Plasma creatine emerged as an independent predictor of disease severity. Finally, exploratory analyses suggested potential epigenetic regulation and identified several candidate drugs capable of modulating the signature.
Conclusions
This study identifies a blood-based, multi-omics-derived gene signature that links localized joint pathology with systemic metabolic dysfunction in osteoarthritis. The signature offers a robust non-invasive diagnostic marker and reveals new opportunities for patient stratification and therapeutic development.
Introduction
Osteoarthritis (OA) is a systemic whole-joint disorder characterized by progressive articular cartilage degradation, subchondral bone sclerosis, synovitis, and pathological alterations in periarticular tissues including the meniscus and infrapatellar fat pad (Tang et al., 2025). This study focuses on knee osteoarthritis (KOA), the most common form of OA, which represents a leading cause of global disability (Tong et al., 2022). Epidemiological studies indicate that OA affected 7.6% of the global population in 2020 (595 million individuals), with prevalence projected to increase by 60–100% by 2050, imposing substantial socioeconomic burdens on healthcare systems (Courties et al., 2024). The etiology of KOA is multifactorial, with key risk factors including advanced age, obesity, joint trauma, and genetic susceptibility (Courties et al., 2024). Although cartilage destruction is a hallmark, it is now recognized that inflammatory mediators (e.g., cytokines, adipokines) secreted by the synovium and infrapatellar fat pad are crucial drivers of pathogenesis. These molecules promote the expression of matrix-degrading enzymes in chondrocytes, leading to extracellular matrix breakdown, altered metabolic activity, and compromised chondrocyte biomechanical behavior (Yue et al., 2024). Despite advances in understanding OA pathogenesis, the precise molecular mechanisms remain incompletely defined, and effective early diagnostic biomarkers and disease-modifying therapeutics are still lacking.
Recent evidence has identified metabolic reprogramming as a pivotal mechanism in OA pathogenesis (Adam et al., 2024). During disease progression, articular chondrocytes undergo profound metabolic shifts, including impaired oxidative phosphorylation, upregulated glycolysis, and dysregulated lipid metabolism (Zheng et al., 2021). Glutamine serves as a key metabolic substrate that regulates cellular bioenergetics, drives nucleotide synthesis, and maintains redox homeostasis in chondrocytes (Yue et al., 2022). In articular cartilage, glutamine supplies energy substrates to chondrocytes and protects against oxidative stress through the provision of glutathione precursors (Arra et al., 2022). Furthermore, glutamine contributes to the epigenetic regulation of cartilage homeostasis by influencing histone modifications that control the expression of matrix-related genes (Stegen et al., 2020). Despite this, the specific contribution of glutamine metabolic reprogramming to the systemic pathology of OA remains underinvestigated.
Emerging research highlights glutamine metabolic signaling in maintaining cartilage integrity and homeostatic balance (Zhou et al., 2019). Wu et al. (2022) documented that osteoarthritic chondrocytes exhibit dysregulated energy metabolism characterized by enhanced glycolytic activity and elevated lactate production compared to non-osteoarthritic chondrocytes. These metabolic changes were associated with decreased mitochondrial respiratory rates and reduced ATP production, suggesting that altered glucose metabolism may exacerbate chondrocyte dysfunction through enhanced glycolytic pathway activation (Wu et al., 2022). Moreover, Zhong et al. (2022) demonstrated the protective effects of glutamine against IL-1β-triggered cartilage matrix breakdown and chondrocyte death. However, these investigations have largely focused on individual metabolites or enzymes in local joint tissues, leaving the regulatory networks of glutamine metabolism-related genes (GMRGs) in OA poorly understood. It remains unclear how GMRGs collectively regulate OA progression and whether they can serve as robust non-invasive biomarkers or putative therapeutic targets.
Multi-omics approaches enable comprehensive elucidation of disease-related molecular networks and regulatory mechanisms by integrating transcriptomic, metabolomic, and other multi-dimensional data. In OA research, this methodology has been applied to identify disease subtypes and discover novel molecular markers (Angelini et al., 2022), but has not yet been utilized for systematic analysis of glutamine metabolic networks. Recently, Ge et al. (2021) leveraged systematic network analysis to decipher distinctive molecular patterns between osteoarthritis and rheumatoid arthritis, identifying crucial regulatory nodes. However, their research focus was on mechanistic comparisons between OA and RA, without specific focus on glutamine metabolism. The systematic review by Mobasheri et al. (2021) emphasized the significant value of multi-omics integration in OA mechanistic research, but lacked focused analysis of specific metabolic pathways. Based on these considerations, we designed a rigorous multi-omics integration analytical workflow, combined with clinical sample validation, to systematically explore the expression changes, molecular functions, and clinical significance of GMRGs in OA.
This investigation aimed to identify key GMRGs associated with OA through integrated bioinformatics analyses, to construct a diagnostic model for OA, and to evaluate its clinical value. Additionally, we integrated clinical phenotyping with metabolomic profiling to elucidate glutamine-mediated regulatory networks in OA pathogenesis, establishing connections between molecular signatures and disease progression. This work not only contributes to deepening our understanding of OA molecular pathology but also provides theoretical foundations for developing glutamine metabolism-based diagnostic and therapeutic strategies.
Materials and methods
Data acquisition and analysis strategy
We implemented a multi-stage integrative strategy, comprising four main phases: (1) identification of glutamine metabolism-related differentially expressed genes; (2) functional analysis of candidate genes and diagnostic model construction; (3) mechanistic exploration of diagnostic genes; and (4) experimental validation using independent clinical samples. The detailed study design workflow is illustrated in Fig. 1.
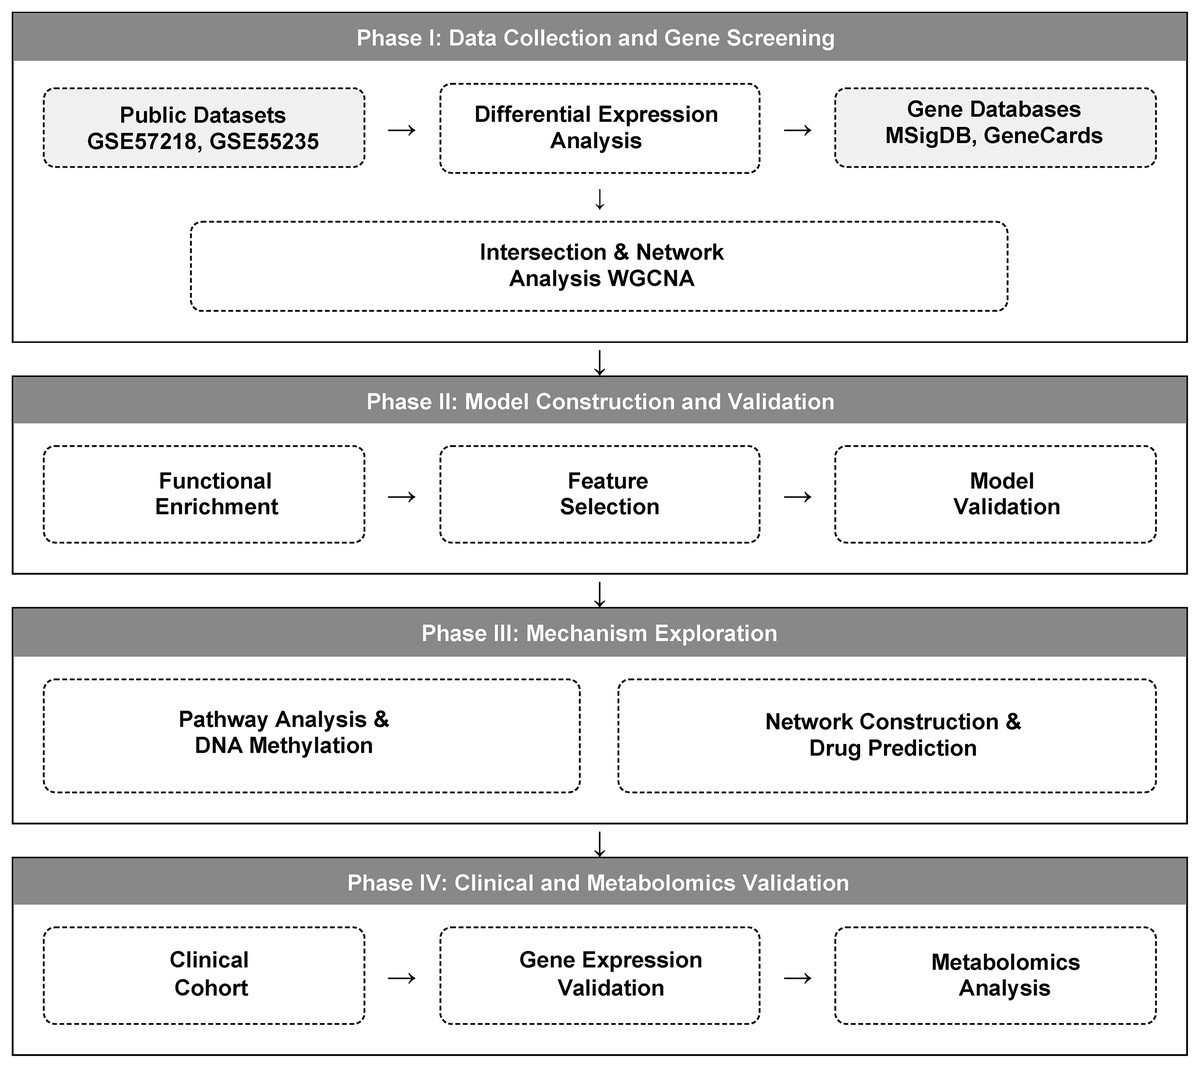
Figure 1: A multi-omics workflow outlines the analytical approach used to study osteoarthritis (OA).
The analytical workflow of this study. Glutamine metabolism-related genes (GMRGs) were curated and integrated with GEO transcriptomic datasets. Differential expression analysis and Weighted Gene Co-expression Network Analysis (WGCNA) were performed to identify metabolism-associated modules. Subsequent analyses included GO/KEGG enrichment, ceRNA network construction, DNA methylation profiling, and drug-gene interaction prediction. Least Absolute Shrinkage and Selection Operator (LASSO) regression identified core diagnostic genes, which were incorporated into a three-gene diagnostic model using multivariable logistic regression (LR). Final validation was carried out in an independent clinical cohort using peripheral-blood RT-qPCR and targeted metabolomics profiling.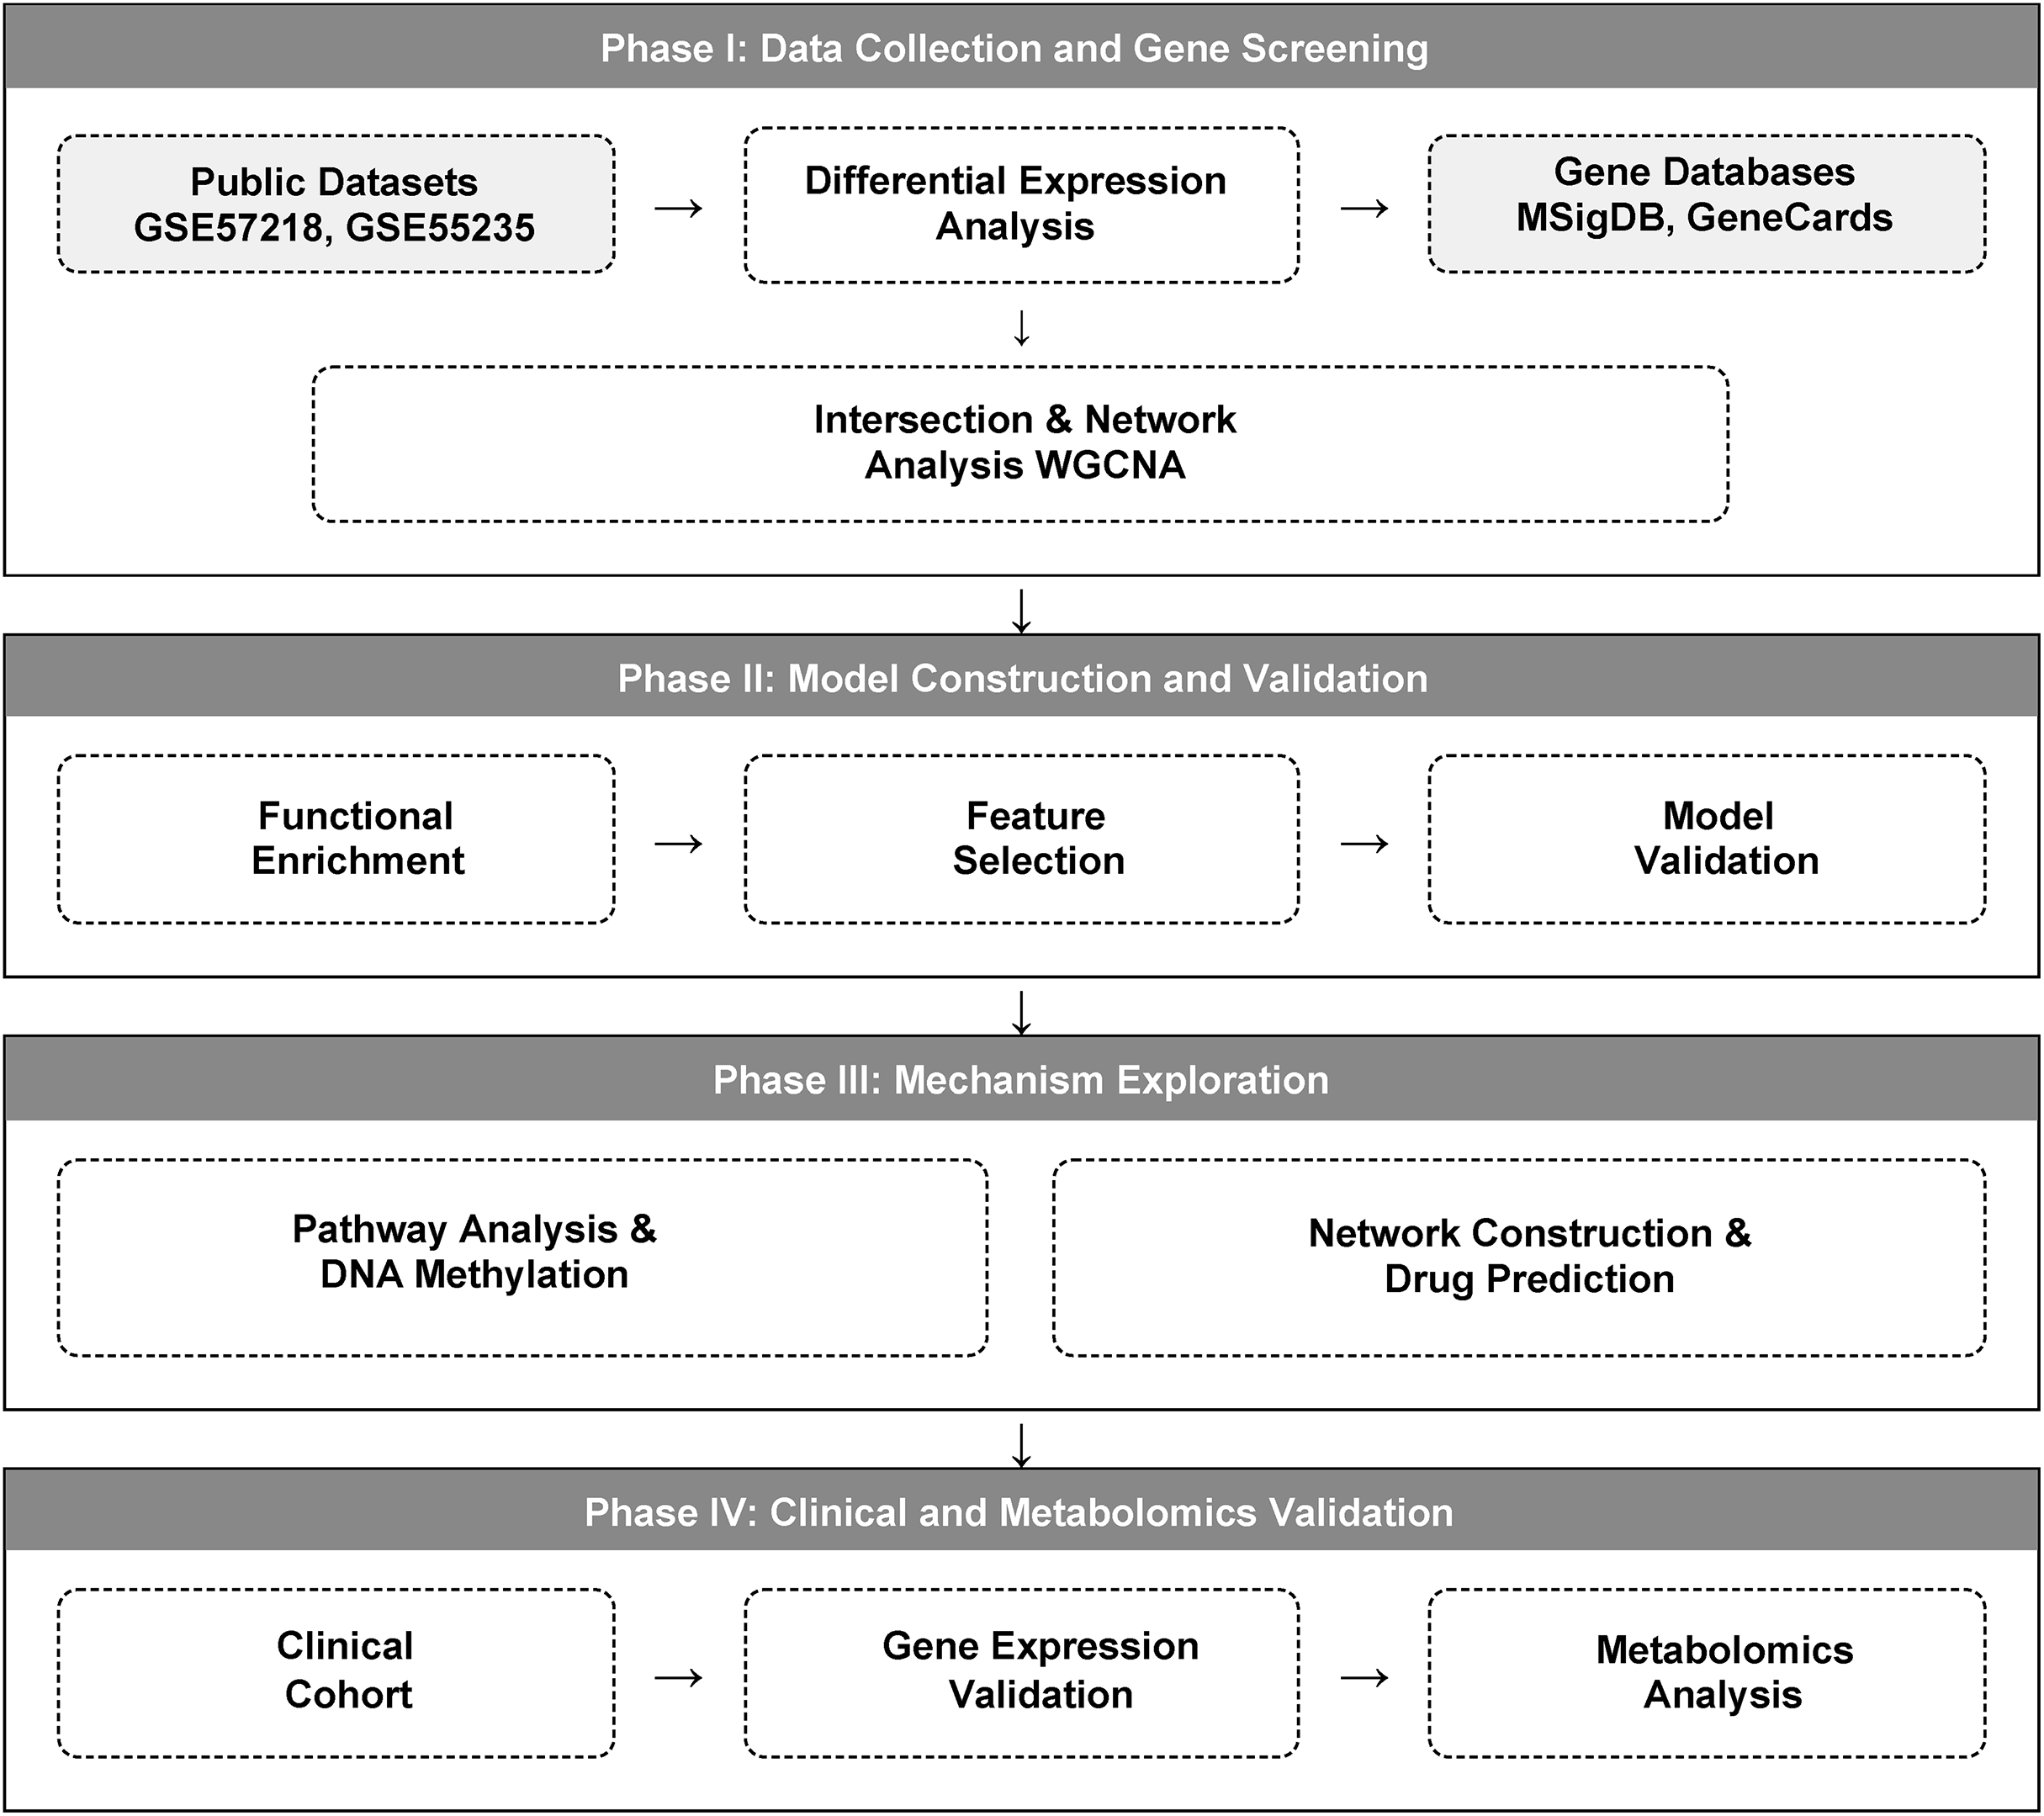
Dataset selection was based on the following criteria to ensure quality and relevance: (i) Inclusion of transcriptomic or epigenomic data from both OA patients and healthy controls. While multiple joint types were considered, priority was given to datasets focusing on knee joint pathology; (ii) Availability of complete raw data from key joint-related tissues, specifically articular cartilage, synovium, subchondral bone, meniscus, or peripheral blood components; (iii) Availability of clear clinical annotations, including but not limited to Kellgren-Lawrence (K-L) radiographic grading for all included knee OA samples; and (iv) sufficient sample size for statistical analyses.
Exclusion criteria included: (i) absence of healthy or non-OA control group; (ii) insufficient methodological descriptions necessary for data reprocessing; and (iii) use of non-standardized platforms or tissues irrelevant to joint pathology. Public data from GEO (https://www.ncbi.nlm.nih.gov/geo/) are summarized in Table S1, including the corresponding tissue type, joint anatomical location, and the analytical purpose assigned to each dataset within this study.
Clinical sample collection
To experimentally validate our bioinformatics findings, we prospectively recruited an independent clinical cohort for RT-qPCR and metabolomics analyses. The study protocol received formal approval from the Institutional Review Board at Chongqing Hospital of Traditional Chinese Medicine (CQTCM, Approval No. 2022-KY-YJS-LY) and adhered to the Declaration of Helsinki principles. All participants provided written informed consent before their inclusion in the study.
A priori power analysis (G*Power) indicated that a minimum of 30 samples per group was required to detect an effect size of 0.6 with 80% power at α = 0.05, based on prior OA biomarker studies demonstrating the utility of power analysis in this field (Attur et al., 2020). Informed by this analysis, we prospectively recruited a cohort comprising 31 patients with primary KOA and 31 demographically matched healthy volunteers between November 2022 and March 2024. Inclusion was based on American College of Rheumatology (ACR) criteria (Altman et al., 1986) with a Kellgren-Lawrence (K-L) radiographic grade ≥2. Exclusion criteria comprised secondary OA, inflammatory arthropathies, intra-articular injections within the past 6 months, and major systemic/immune disorders.
Following an overnight fast (≥8 h), 10 mL of venous blood was collected from each participant into EDTA-containing vacutainer tubes for subsequent RT-qPCR and metabolomic analyses. Peripheral blood mononuclear cells (PBMCs) were isolated immediately via density gradient centrifugation using Ficoll-Paque PLUS (GE Healthcare, Chicago, IL, USA), washed twice with phosphate-buffered saline (PBS), and either processed directly or cryopreserved at −80 °C for ≤6 months prior to RNA extraction. Key clinical parameters, including age, sex, BMI, symptom duration, Visual Analog Scale (VAS) pain scores, Western Ontario and McMaster Universities Osteoarthritis Index (WOMAC) scores, and K-L radiographic grades, were systematically recorded for all subjects. Any samples with missing clinical or metabolomic data (>5%) were excluded from the final analysis.
Data preprocessing and differential expression analysis
Raw expression data were normalized using R (version 4.1.2). Microarray datasets were processed via Robust Multi-array Average (RMA) algorithm (Fang, Li & Xu, 2021) for background correction, quantile normalization, and log2 transformation. RNA-seq data were normalized using the TMM method. To ensure data integrity, missing values were inspected and handled using gene-wise filtering, whereby probes or genes with excessive missingness were removed, and sporadic missing entries were imputed using k-nearest-neighbor (kNN) imputation, a widely adopted approach for high-dimensional transcriptomic data (Troyanskaya et al., 2001). Outlier samples were identified through boxplot inspection and PCA-based multivariate distance analysis. Pre-analysis quality control also included assessment of batch effects using principal component analysis (PCA). To mitigate batch-associated variation across datasets, batch correction was performed using the ComBat algorithm from the sva package (v3.42.0) (Tran et al., 2020). The effectiveness of ComBat adjustment was confirmed by comparing PCA distributions before and after correction. Differential expression analysis was conducted using limma (v3.48.3) (Smyth, 2004) with thresholds of raw P < 0.05 and |log2FC| > 0.5, adopting raw P-values to maximize sensitivity. Data visualization was performed using the pheatmap and ggplot2 packages.
Identification of glutamine metabolism-related genes
Glutamine metabolism-related genes were collected through an integrated analysis of gene sets from the MSigDB database (KEGG_GLUTAMINE_METABOLISM); (Liberzon et al., 2015) and the GeneCards database (keyword: “glutamine metabolism”, relevance score ≥5). GeneCards relevance scores were used as described in the database’s documentation. The collected GMRGs were subsequently cross-referenced with differentially expressed genes (DEGs) to derive a candidate list of glutamine metabolism-associated differentially expressed genes (DE-GMRGs). A multi-step sensitivity analysis was then performed on this candidate gene list. This analysis involved: (i) cross-referencing with core gene sets from REACTOME (REACTOME_GLUTAMATE_AND_GLUTAMINE_METABOLISM.v2025.1.Hs.gmt) and KEGG (hsa00250) databases; (ii) varying the GeneCards relevance scores (from 3 to 10) and using alternative source databases; and (iii) applying different |log₂FC| thresholds (from 0.3 to 1.0) for the identification of DEGs.
Weighted gene co-expression network analysis
Weighted gene co-expression network analysis (WGCNA) was performed using the WGCNA R package (v1.70-3) (Langfelder & Horvath, 2008) on the GSE57218 dataset. Sample quality was first assessed by average linkage hierarchical clustering, and one outlier sample (GSM1380887) was removed to improve network stability. To determine the optimal network construction parameters, a soft-thresholding power was selected by evaluating scale-free topology fit across powers 1–20. A power of 10 was chosen, as it achieved a scale-free topology model fit (R2 ≈ 0.87) while maintaining adequate mean connectivity. A signed co-expression network was then constructed, and gene modules were identified using dynamic tree cutting (deepSplit = 2, minModuleSize = 30). Module eigengenes (MEs) were calculated, and their correlations with the OA phenotype were assessed using Pearson correlation to identify disease-associated modules.
Functional enrichment and network analysis
Gene Ontology (GO) and Kyoto Encyclopedia of Genes and Genomes (KEGG) pathway enrichment analyses were performed using clusterProfiler (v4.0.5) (Wu et al., 2021). Multiple testing correction was applied using the Benjamini-Hochberg method, and terms or pathways with adjusted P-value < 0.05 were considered significant. For completeness, enrichment terms with 0.05 ≤ adjusted P-value < 0.10 were also reported as trend-level findings. Within the Gene Ontology framework, three primary domains were analyzed: biological processes (BP), cellular components (CC), and molecular functions (MF).
Gene functional similarity was calculated using GOSemSim (v2.20.0) (Yu et al., 2010) with the Wang metric and Best-Match Average (BMA) aggregation. Pairwise GO-based semantic similarity scores were then computed for the 13-WGCNA-derived DE-GMRGs to generate a similarity matrix, and each gene’s overall similarity was obtained by averaging its scores across all others. Genes with higher cumulative similarity were considered more functionally central (“Friends”), whereas those with lower similarity were regarded as functionally distinct.
Diagnostic model construction and evaluation
We developed and validated a diagnostic signature using a two-stage workflow integrating WGCNA-derived candidate genes, LASSO-based feature selection, and multivariable logistic regression (LR). First, hub genes identified by WGCNA from glutamine metabolism-associated differentially expressed genes were subjected to LASSO logistic regression (glmnet R package) (Tibshirani, 1996) for feature selection, using an independent GEO dataset for discovery (GSE57218: n = 40). A fixed random seed (set.seed (12345)) was used for reproducibility. The regularization parameter (λ) was selected via 10-fold cross-validation by choosing λmin that minimized the mean cross-validated binomial deviance; genes with non-zero coefficients at λmin were retained as candidate features. Second, the selected genes were used to train a multivariable LR model on an independent cohort (GSE48556: n = 139). Internal performance was evaluated on GSE48556 by: (i) discrimination using ROC/AUC with 95% CIs estimated by the DeLong method; (ii) calibration using bootstrap calibration curves with 1,000 resamples; (iii) clinical utility using Decision Curve Analysis (DCA); and (iv) clinical visualization via a nomogram (rms package). A decision threshold was derived from the training cohort using Youden’s index and kept fixed thereafter. For external validation, the trained LR model and the predetermined threshold were applied—without parameter retraining—to multiple independent GEO cohorts (GSE55457, GSE114007, GSE51588, and GSE29746), using the same preprocessing and normalization/scaling procedures as in the training dataset.
Integrated analysis of diagnostic gene mechanisms
DNA methylation data from the GSE73626 (n =18) dataset were analyzed using β-values downloaded from GEO. Differential methylation analysis between OA and control samples was performed using the limma package (v1.40.0) in R. For each CpG site, linear modeling and empirical Bayes moderation were applied, and differentially methylated positions (DMPs) were identified using thresholds of P < 0.05 and |Δβ| > 0.2 (Campagna et al., 2021). CpG sites were annotated to corresponding genes using the UCSC hg19 reference, allowing multiple CpG sites to map to the same gene. DMPs located within diagnostic genes were extracted, and their β-values were visualized to assess methylation alterations at the gene level.
To identify biological pathways associated with each diagnostic gene, we performed correlation-based GSEA using clusterProfiler (v4.0.5). For each diagnostic gene, Spearman correlation coefficients between its expression and all other genes in the GSE57218 dataset were calculated to generate ranked gene lists. This approach identifies genes whose expression patterns co-vary with the diagnostic gene, and may reflect shared regulatory mechanisms. The ranked lists were subjected to GSEA against MSigDB gene sets (v7.5.1), including GO terms (c5.all) and KEGG pathways (c2.cp.kegg). Pathways with an FDR <0.05 and |normalized enrichment score (NES)| >1 were considered significantly enriched (Subramanian et al., 2005).
Potential therapeutic compounds targeting the diagnostic genes were identified using the Comparative Toxicogenomics Database (CTD, accessed November 2023) and the Drug-Gene Interaction Database (DGIdb v4.2.0). From CTD, we extracted curated chemical-gene interactions with interaction scores >5 limited to Homo sapiens. From DGIdb, we retrieved interactions classified as “inhibitor,” “agonist,” “antagonist,” or “modulator” with evidence from at least two independent sources. Overlapping drugs identified by both databases were prioritized, and the drug-gene interaction network was visualized using Cytoscape (v3.8.2).
ceRNA regulatory network construction
We constructed a ceRNA regulatory network integrating the three diagnostic genes (F13A1, IRS2, RELA) with miRNAs and circRNAs based on the competing endogenous RNA hypothesis (Salmena et al., 2011). Potential miRNA binding sites on diagnostic gene 3′UTRs were predicted using miRWalk v3.0 (Sticht et al., 2018). To balance prediction sensitivity and specificity, miRNA–mRNA pairs were retained when predicted by ≥8/12 algorithms and exhibiting minimum free binding energy ΔG <−25 kcal/mol, consistent with established rules for miRNA–target interactions (Kertesz et al., 2007).
To ensure biological relevance, predicted miRNAs were filtered against the GSE105027 miRNA-expression dataset using limma with thresholds of raw P < 0.05 and |log2FC| >0.5, retaining only dysregulated miRNAs likely to participate in pathological ceRNA interactions.
For each differentially expressed miRNA, upstream circRNA sponges were predicted using StarBase v3.0 (Li et al., 2014). To increase reliability, circRNAs supported by chipExpNum >30 were retained, in accordance with the experimental evidence filtering strategy of StarBase. This criterion matches the computational pipeline used in the original analysis (Bosson, Zamudio & Sharp, 2014).
Predicted circRNAs were further compared with circRNA expression profiles in GSE175959. Because the dataset contains only 3 OA and 3 control samples, raw P < 0.05 and |log2FC| >0.5 were applied as hypothesis-generating thresholds, consistent with exploratory ceRNA analysis.
The final integrated circRNA–miRNA–mRNA network was visualized with Cytoscape (v3.8.2) (Shannon et al., 2003), where node shapes represent molecular classes and node size reflects degree centrality. We note that this ceRNA network represents computational predictions requiring experimental validation.
RNA extraction and RT-qPCR
Total RNA was extracted from approximately 2 × 10⁶ PBMCs using a TRIzol-based reagent (SparkJade, Shandong, China) and subsequently treated with DNase I. RNA quality was verified by spectrophotometry (A260/A280 ratio 1.8–2.0; A260/A230 >1.8) and by observing intact 18S/28S rRNA bands on a 1.5% agarose gel. One microgram of qualified RNA was reverse-transcribed into cDNA in a 20 μL reaction using the 2×SPARKscript II All-in-One RT SuperMix (SparkJade, Shandong, China), following the thermal profile: 25 °C for 5 min, 42 °C for 15 min, and 85°C for 5 s. Quantitative PCR was performed on an ABI 7500 System using SPARKscript II Master Mix (SYBR Green), with each 20 μL reaction containing two μL of 1:10 diluted cDNA and 400 nM of each primer (Shanghai Bioengineering, Shanghai, China; Table S2). The amplification program consisted of 95 °C for 2 min, followed by 40 cycles of 95 °C for 15 s, 60 °C for 30 s, and 72 °C for 30 s. All reactions were run in triplicate, and product specificity was confirmed by melt curve analysis; no-template and no-reverse-transcriptase controls showed no amplification (Cq > 38). Relative gene expression was calculated using the 2−ΔΔCT method, for which primer efficiencies were confirmed to be 95–105% via standard curve analysis. To identify suitable reference genes, a panel of six candidates (GAPDH, B2M, YWHAZ, ACTB, RPL13A, and TBP) was selected based on literature precedent (Pombo-Suarez et al., 2008). These genes were chosen to represent diverse biological pathways to minimize the risk of co-regulation. Their expression stability was evaluated across all experimental groups using the geNorm algorithm (Vandesompele et al., 2002), which identified B2M and YWHAZ as the most stable pair (M-value < 0.5) (Table S3). Consequently, normalization was performed against the geometric mean of B2M and YWHAZ. All RT-qPCR experiments were MIQE-compliant, as detailed in Supplemental File MIQE Checklist.
Metabolomics analysis
Plasma samples (100 μL) were thawed on ice and proteins were precipitated with 400 μL of pre-chilled methanol/water (80:20, v/v). The mixture was vortexed (2 min) and centrifuged (12,000 rpm, 10 min, 4 °C). The resulting supernatant was diluted with ultrapure water to a final methanol concentration of 53% to match the initial mobile phase, and then transferred to LC-MS vials. A pooled quality control (QC) sample, prepared by mixing equal aliquots from each sample, and blank samples (extraction solvent) were analyzed periodically throughout the sequence to monitor system stability (Broadhurst et al., 2018).
Metabolomic analysis was performed on a Vanquish UHPLC system coupled to a Q Exactive™ HF-X mass spectrometer (Thermo Fisher Scientific, Waltham, MA, USA) with a heated electrospray ionization (HESI) source. A 2 µL aliquot was injected onto a Hypersil Gold C18 column (2.1 × 100 mm, 1.9 μm) maintained at 40 °C. Chromatographic separation was achieved using a mobile phase of (A) 0.1% formic acid in water and (B) 0.1% formic acid in acetonitrile at a flow rate of 0.3 mL/min. The gradient was: 0–2 min, 5% B; 2–12 min, 5–95% B; 12–14 min, 95% B; 14–14.1 min, 95–5% B; 14.1–16 min, 5% B. The mass spectrometer operated in data-dependent acquisition (DDA) mode with polarity switching. Full MS scans were acquired from m/z 100–1,500 at 60,000 resolution (AGC target: 3 × 10⁶, max IT: 100 ms). MS/MS scans for the top 10 most abundant ions were acquired at 15,000 resolution (AGC target: 1e5, max IT: 50 ms) with a 1.0 m/z isolation window and stepped Normalized Collision Energy (NCE) of 20, 30, and 40 eV. Source parameters included a spray voltage of 3.5 kV (positive)/−2.8 kV (negative) and a capillary temperature of 320 °C.
Raw data were processed using Compound Discoverer™ 3.1 software and custom R scripts. The workflow included peak picking, retention time alignment, and normalization. Features with a coefficient of variation (CV) >30% in QC samples were excluded (Schiffman et al., 2019). Metabolite annotation was based on matching accurate mass (<5 ppm tolerance) and MS/MS fragmentation patterns against public (KEGG, HMDB) and in-house spectral libraries (Wishart et al., 2007; Zhou, Wang & Ressom, 2012).
Statistical analysis
Data processing utilized IBM SPSS Statistics (Version 25.0) and R (V4.1.2), initiating with Shapiro–Wilk normality testing to determine analytic pathways. Normally distributed continuous variables were expressed as mean ± SD (independent t-tests), non-normal data as median (IQR) (Mann–Whitney U tests), and categorical variables analyzed by χ2 test or Fisher’s exact test. Correlation analyses employed Pearson’s r (parametric) or Spearman’s ρ (non-parametric), categorized as weak (|r/ρ| <0.3), moderate (0.3–0.7), or strong (≥0.7).
For metabolomics data, we initially employed multivariate pattern recognition methods, including Partial Least Squares Discriminant Analysis (PLS-DA) and Orthogonal PLS-DA (OPLS-DA) (Worley & Powers, 2012), to maximize the separation between groups. Differential metabolites were identified using a combination of criteria: a Variable Importance in Projection (VIP) score >1 and a P-value < 0.05 from an independent samples t-test (Wold, Sjöström & Eriksson, 2001). Multiple group comparisons used ANOVA (Bonferroni post-hoc) or Kruskal–Wallis tests. Multivariate linear regression modeled metabolite-clinical relationships with age/sex/BMI adjustment.
All tests were two-tailed with a significance threshold of P < 0.05. For omics analyses involving multiple testing, the Benjamini–Hochberg method was applied to control the false discovery rate. Differential expression analyses used an adjusted P-value (adj. P) < 0.05 as the significance threshold, while pathway enrichment analyses employed a more lenient exploratory threshold of FDR < 0.1 for hypothesis generation.
Results
Identification of glutamine-related differentially expressed genes
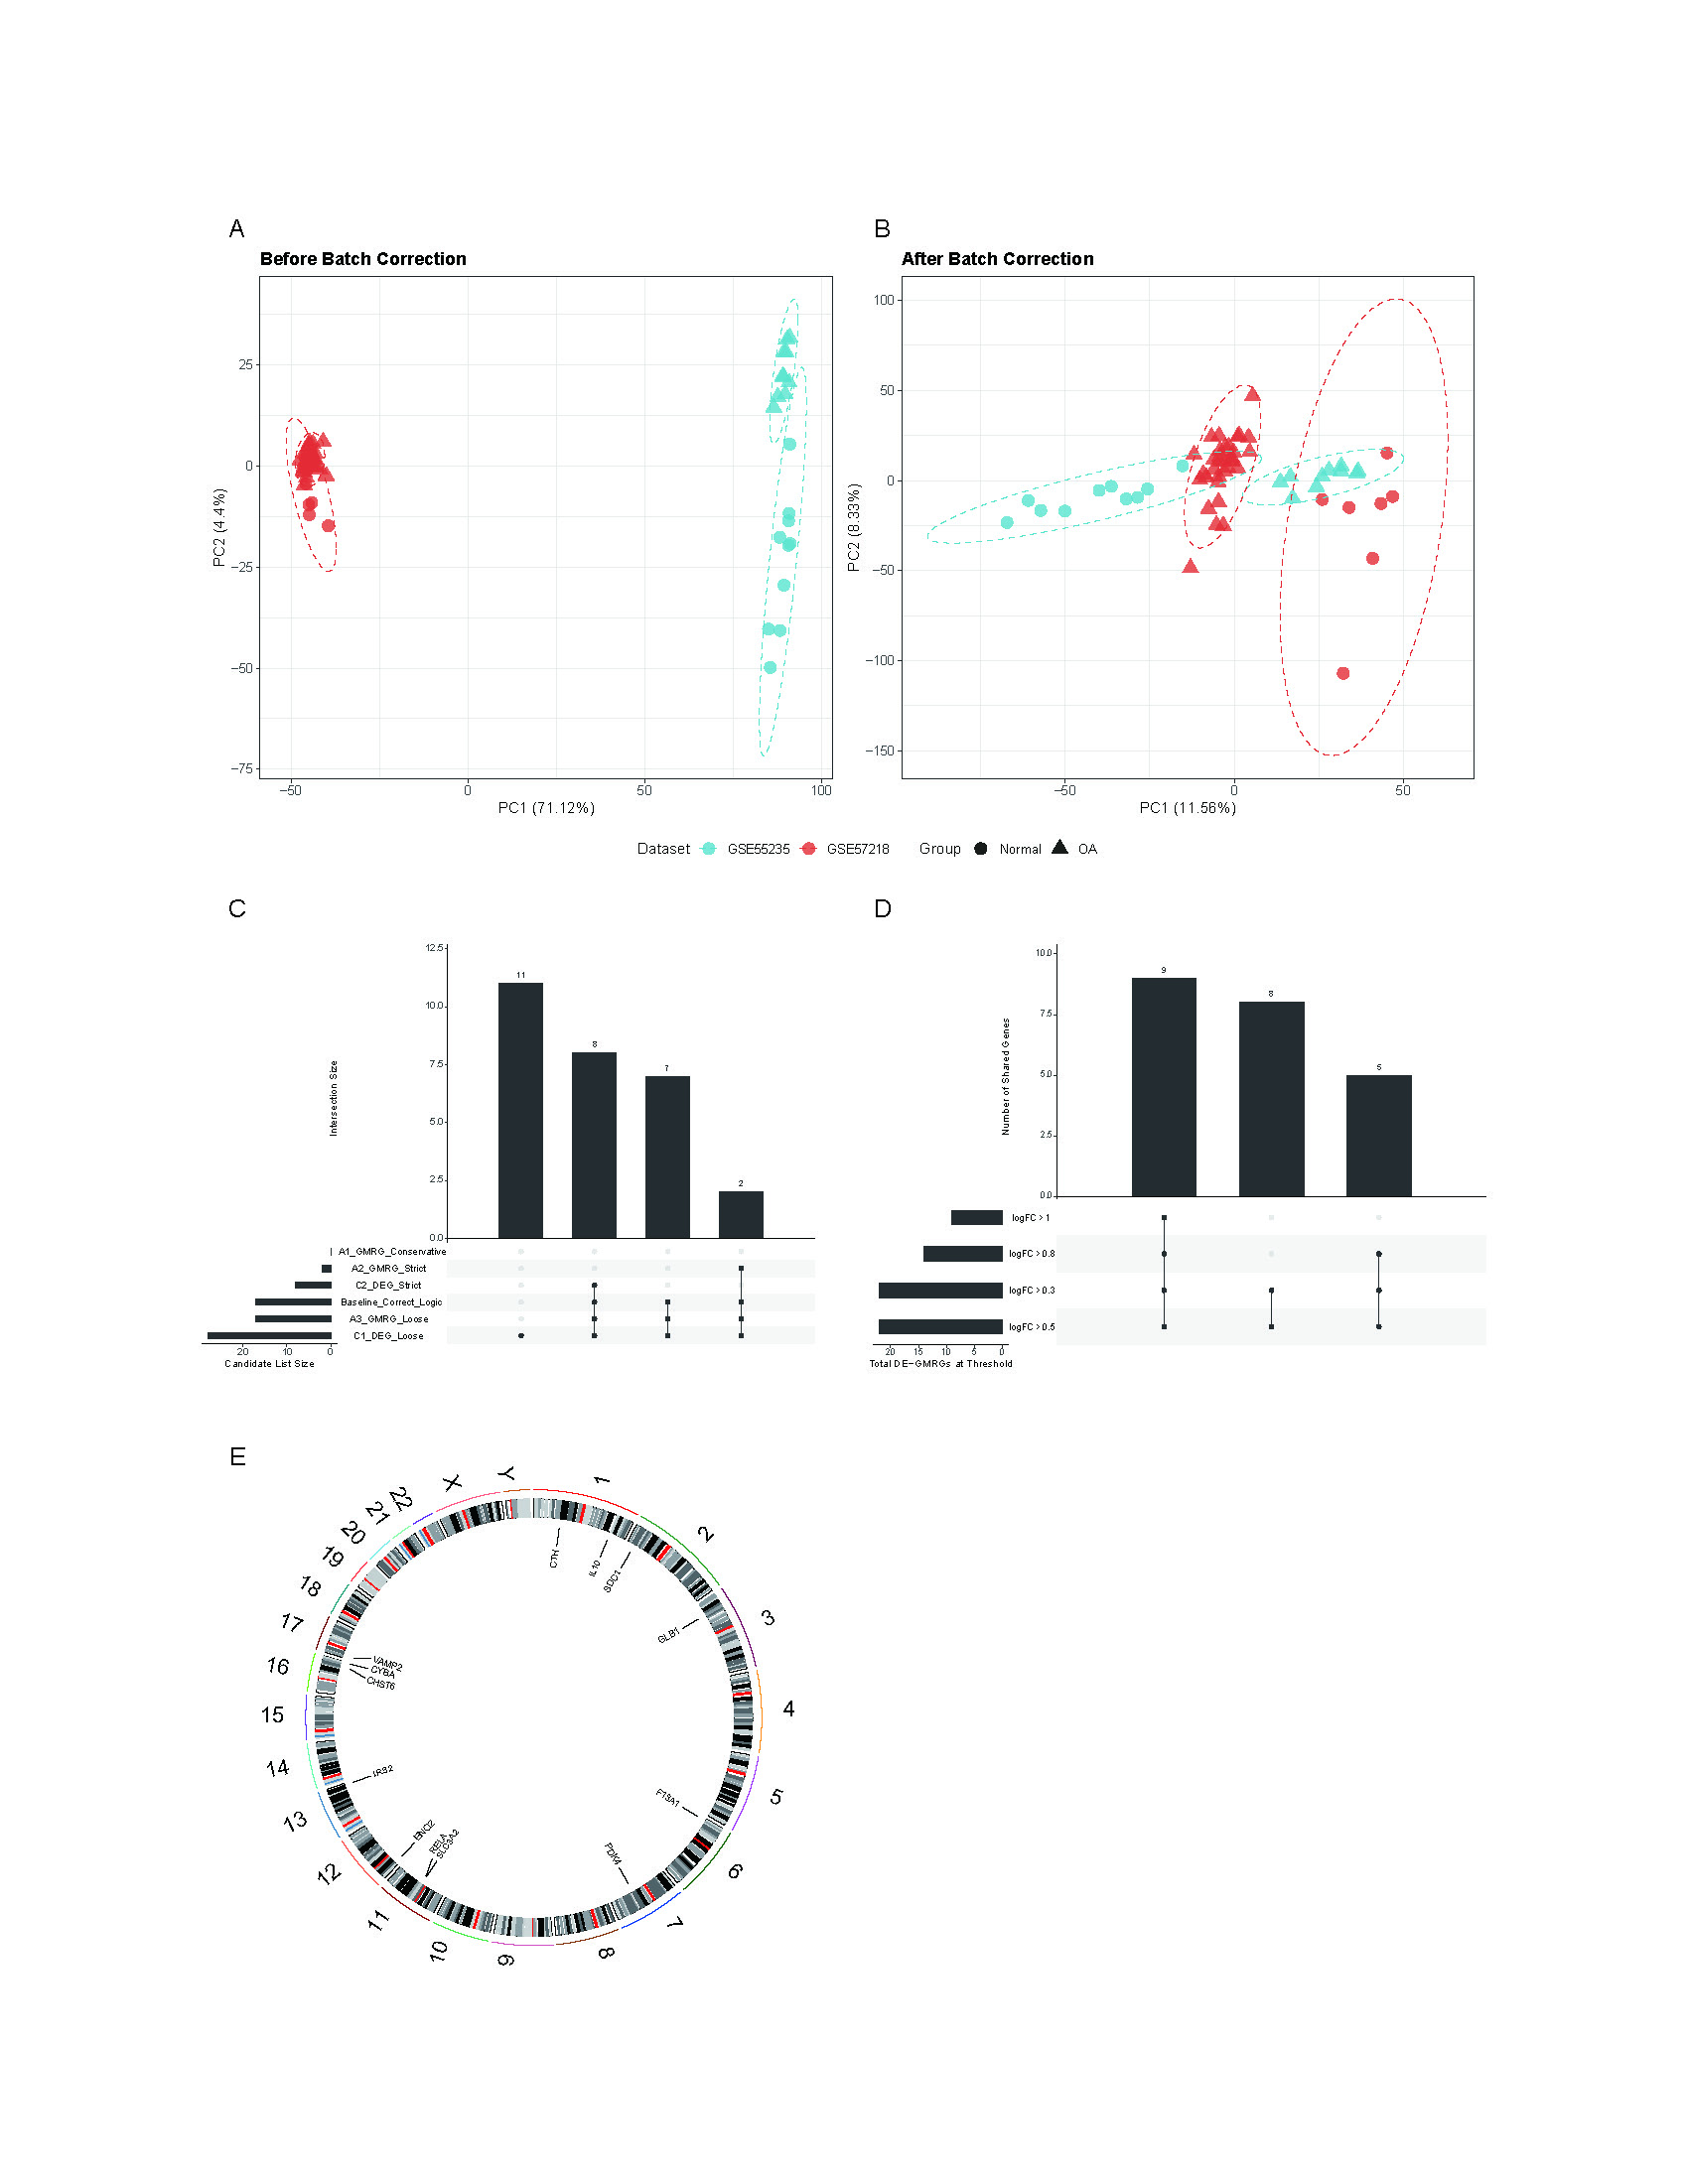
To ensure robust data integration, we first performed principal component analysis (PCA) to assess potential batch effects between the GSE57218 and GSE55235 datasets. The application of the ComBat algorithm effectively removed these variations, ensuring reliable comparability between cohorts (Figs. S1A and S1B). Following quality control, analysis of the GSE57218 dataset identified 1,597 DEGs (Fig. 2A), while the GSE55235 dataset yielded 2,279 DEGs (Fig. 2B). Hierarchical clustering demonstrated clear segregation of expression patterns in both datasets (Figs. 2C and 2D). Integration of MSigDB and GeneCards databases yielded 1,190 GMRGs. By intersecting these GMRGs with DEGs from both datasets, we identified a core set of 22 DE-GMRGs (Table S4).
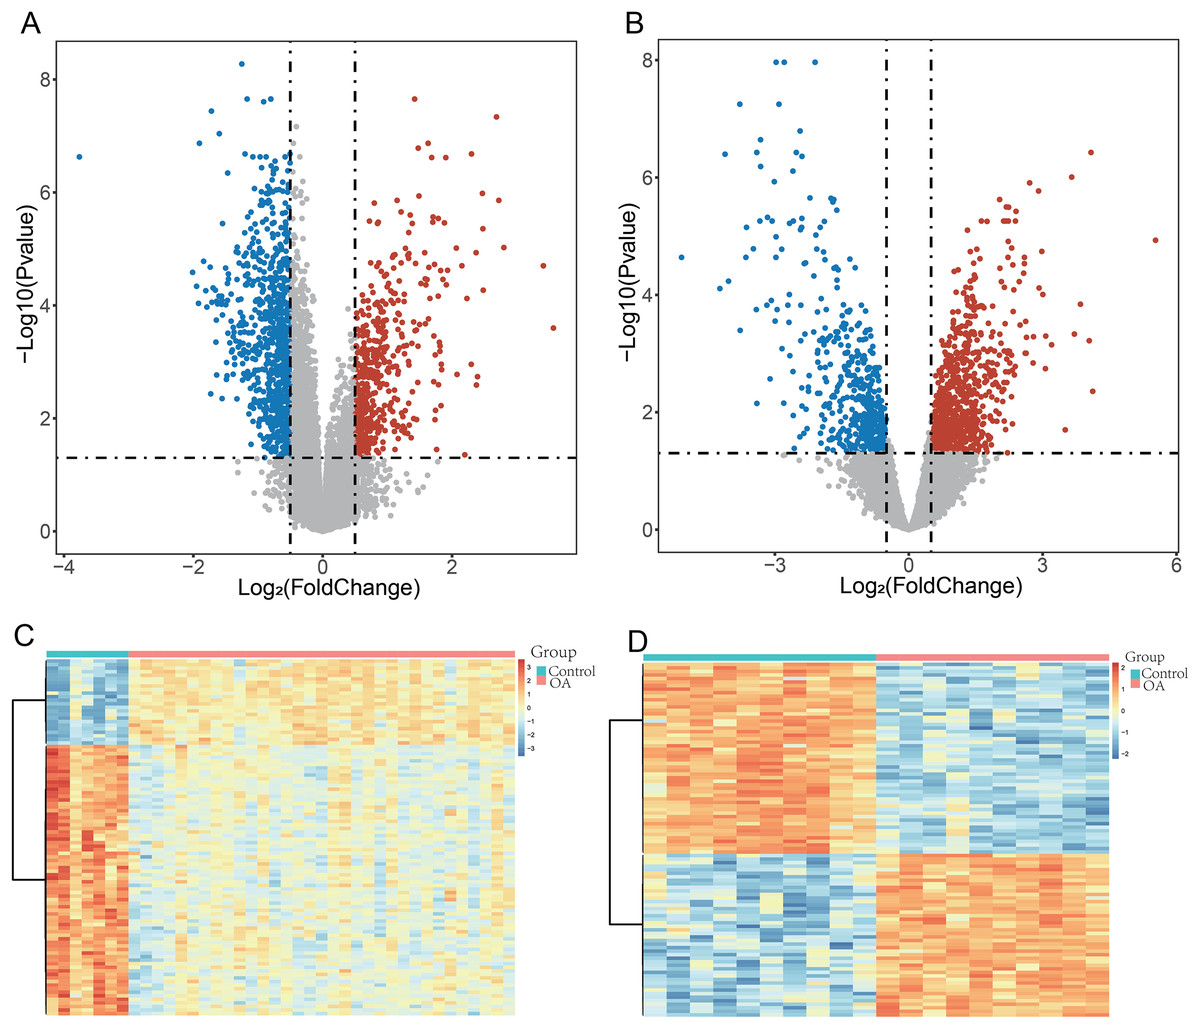
Figure 2: Identification of differentially expressed genes (DEGs) in OA datasets.
(A and B) Volcano plots showing differentially expressed genes (DEGs) identified using the limma package in GSE57218 (A) and GSE55235 (B). The y-axis represents −log10 (P-value). Upregulated genes are shown in red, downregulated genes in blue, and non-significant genes in gray. (C and D) Heatmaps illustrating hierarchical clustering of DEGs in GSE57218 (C) and GSE55235 (D), demonstrating clear separation between OA and Control samples.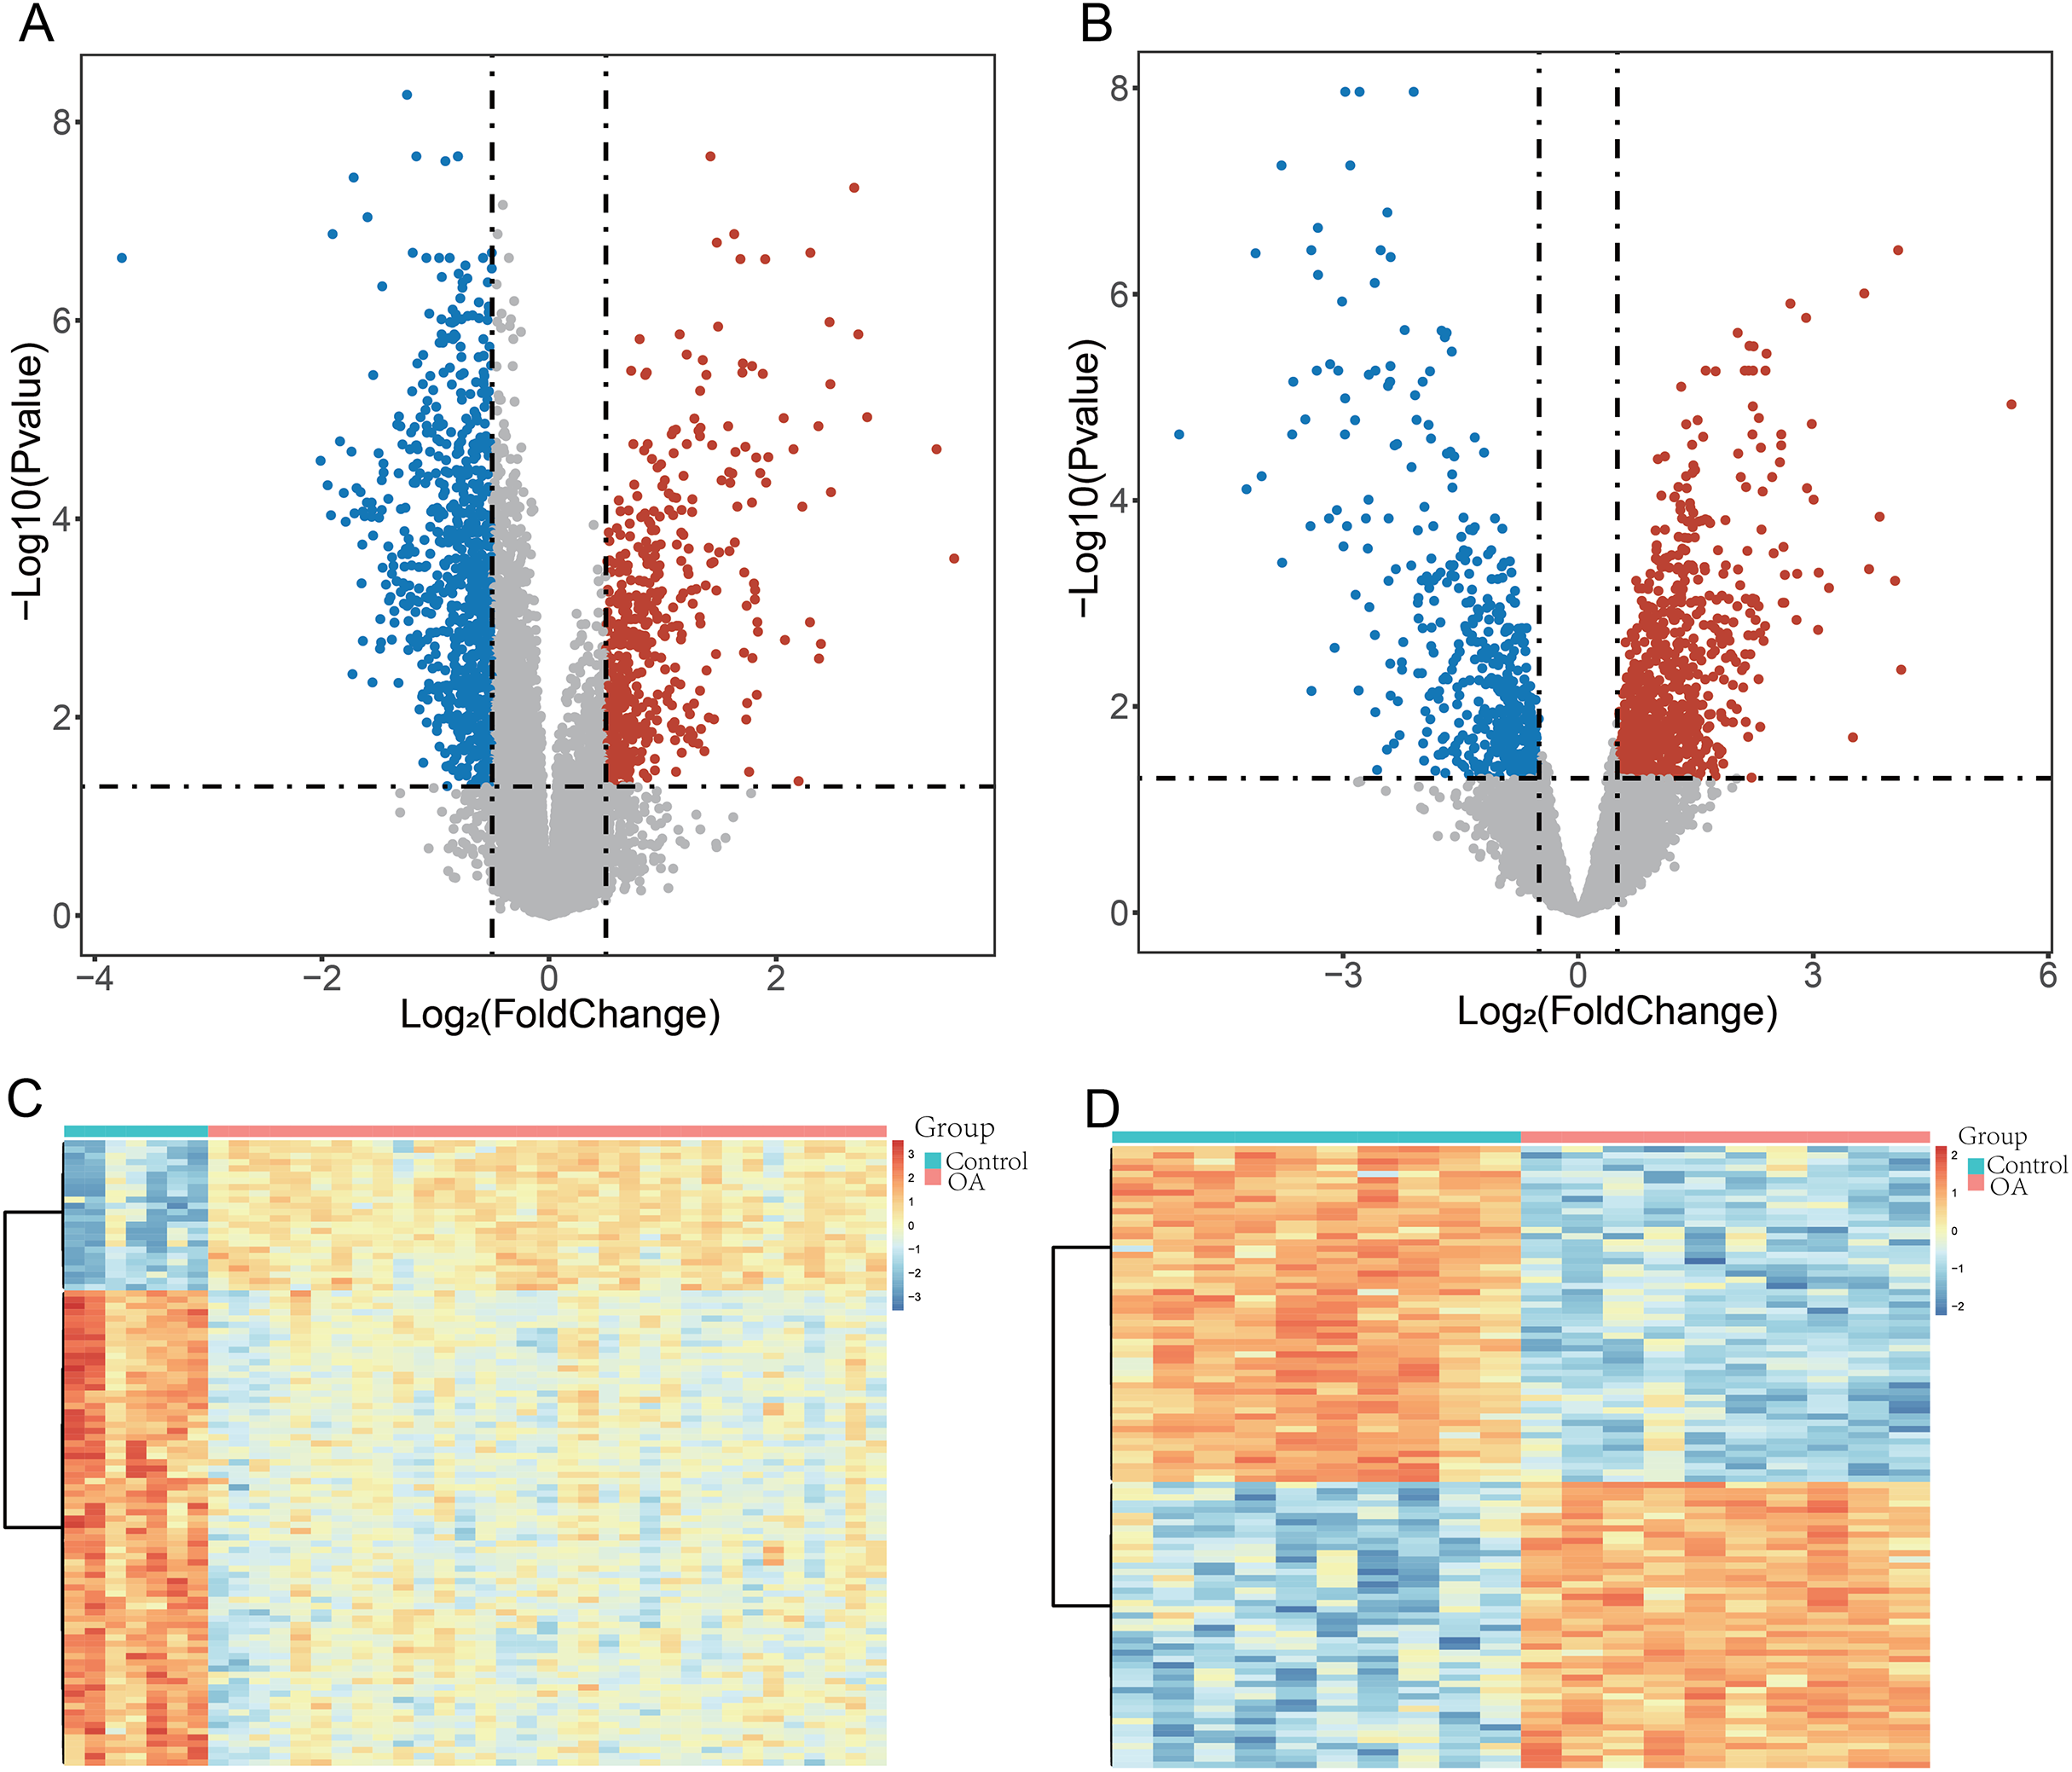
To assess the robustness of this intersection strategy, we performed a supplementary differential analysis on the merged, batch-corrected expression matrix. This joint analysis identified 74 significant genes (Table S4). Notably, all 22 DE-GMRGs identified by our intersection approach were contained within this expanded set, confirming that our strategy successfully captured the stable core gene signature while minimizing false positives. Finally, a comprehensive sensitivity analysis was conducted. The candidate signature remained highly stable across various gene-set definitions and statistical thresholds (Figs. S1C and S1D), demonstrating the robustness of our selection process.
WGCNA was performed to identify co-expression modules associated with OA. A soft-thresholding power of 10 was selected based on scale-free topology fit (R2 ≈ 0.87) and mean connectivity (Fig. 3A). Dynamic tree cutting identified 12 co-expression modules (Fig. 3B), among which three modules (magenta: r = −0.45, P = 0.004; blue: r = −0.79, P < 0.001; red: r = −0.58, P < 0.001) showed significant negative correlations with the OA phenotype (Fig. 3C). These modules contained 3,099 genes in total. Intersection of the 22 DE-GMRGs (Figs. 4A and 4B; Table S4) with the 3,099 WGCNA-derived genes yielded 13 candidate genes: F13A1, IL10, CTH, PDK4, IRS2, SLC3A2, ENO2, RELA, VAMP2, GLB1, CYBA, CHST6, and SDC1 (Fig. 4C). Chromosomal localization of these genes is shown in Fig. S1E. All 13 genes exhibited significant differential expression between OA and control samples (Fig. 4D), with F13A1 and RELA showing the most pronounced downregulation in OA.
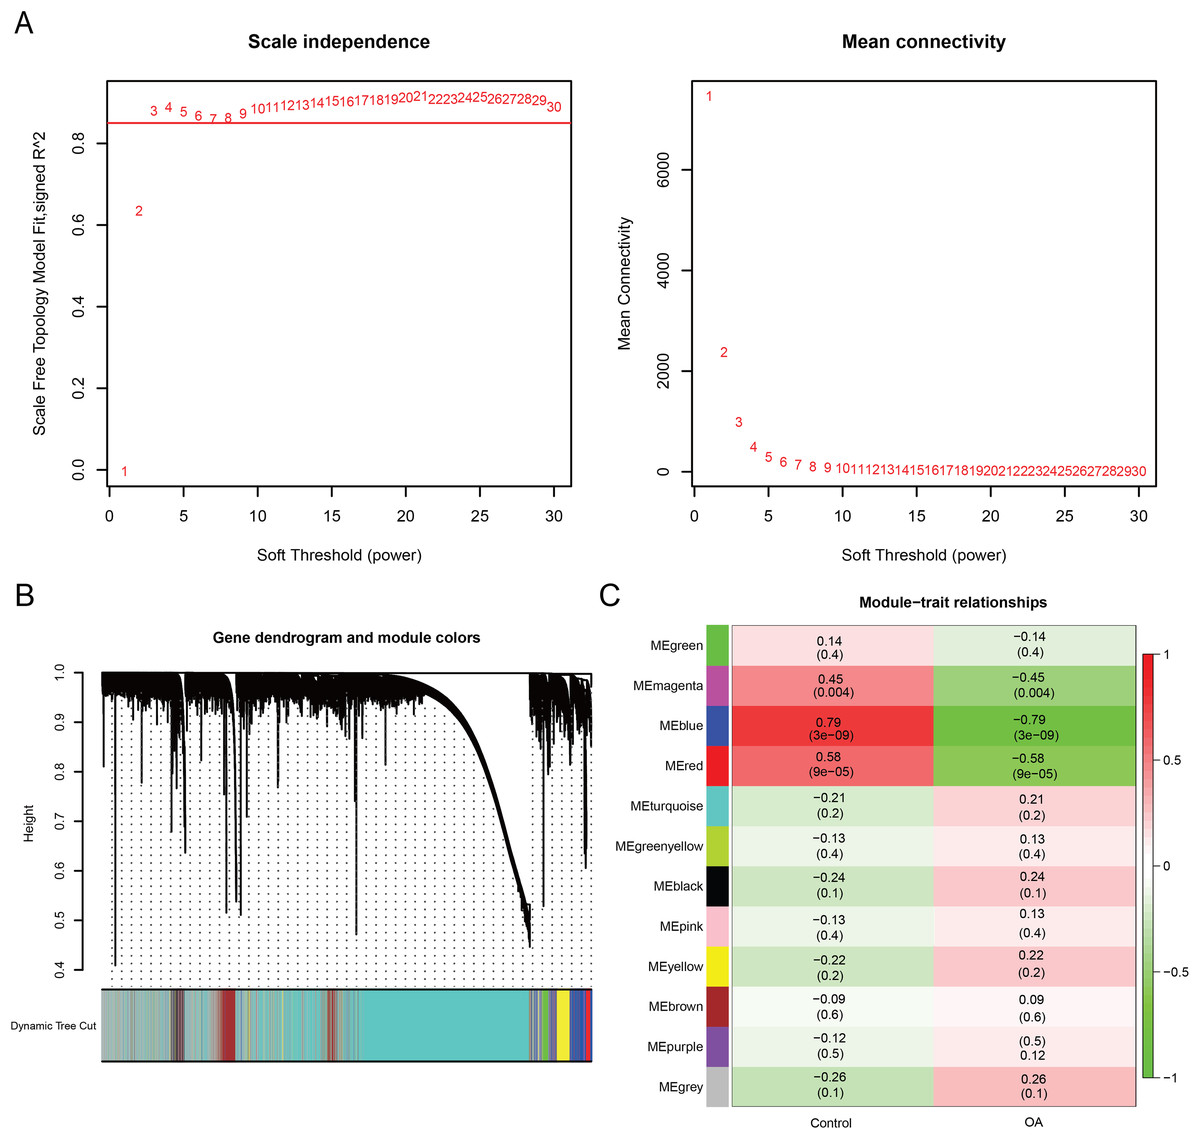
Figure 3: Weighted gene co-expression network analysis reveals key OA-related gene modules and candidate biomarkers.
(A) Network topology analysis across soft-thresholding powers. Power = 10 was selected based on a scale-free fit index of R2 ≈ 0.87. (B) Hierarchical clustering dendrogram of genes with corresponding module assignments. (C) Module–trait relationship heatmap showing three modules (magenta, blue, red) significantly correlated with the OA phenotype (P < 0.01).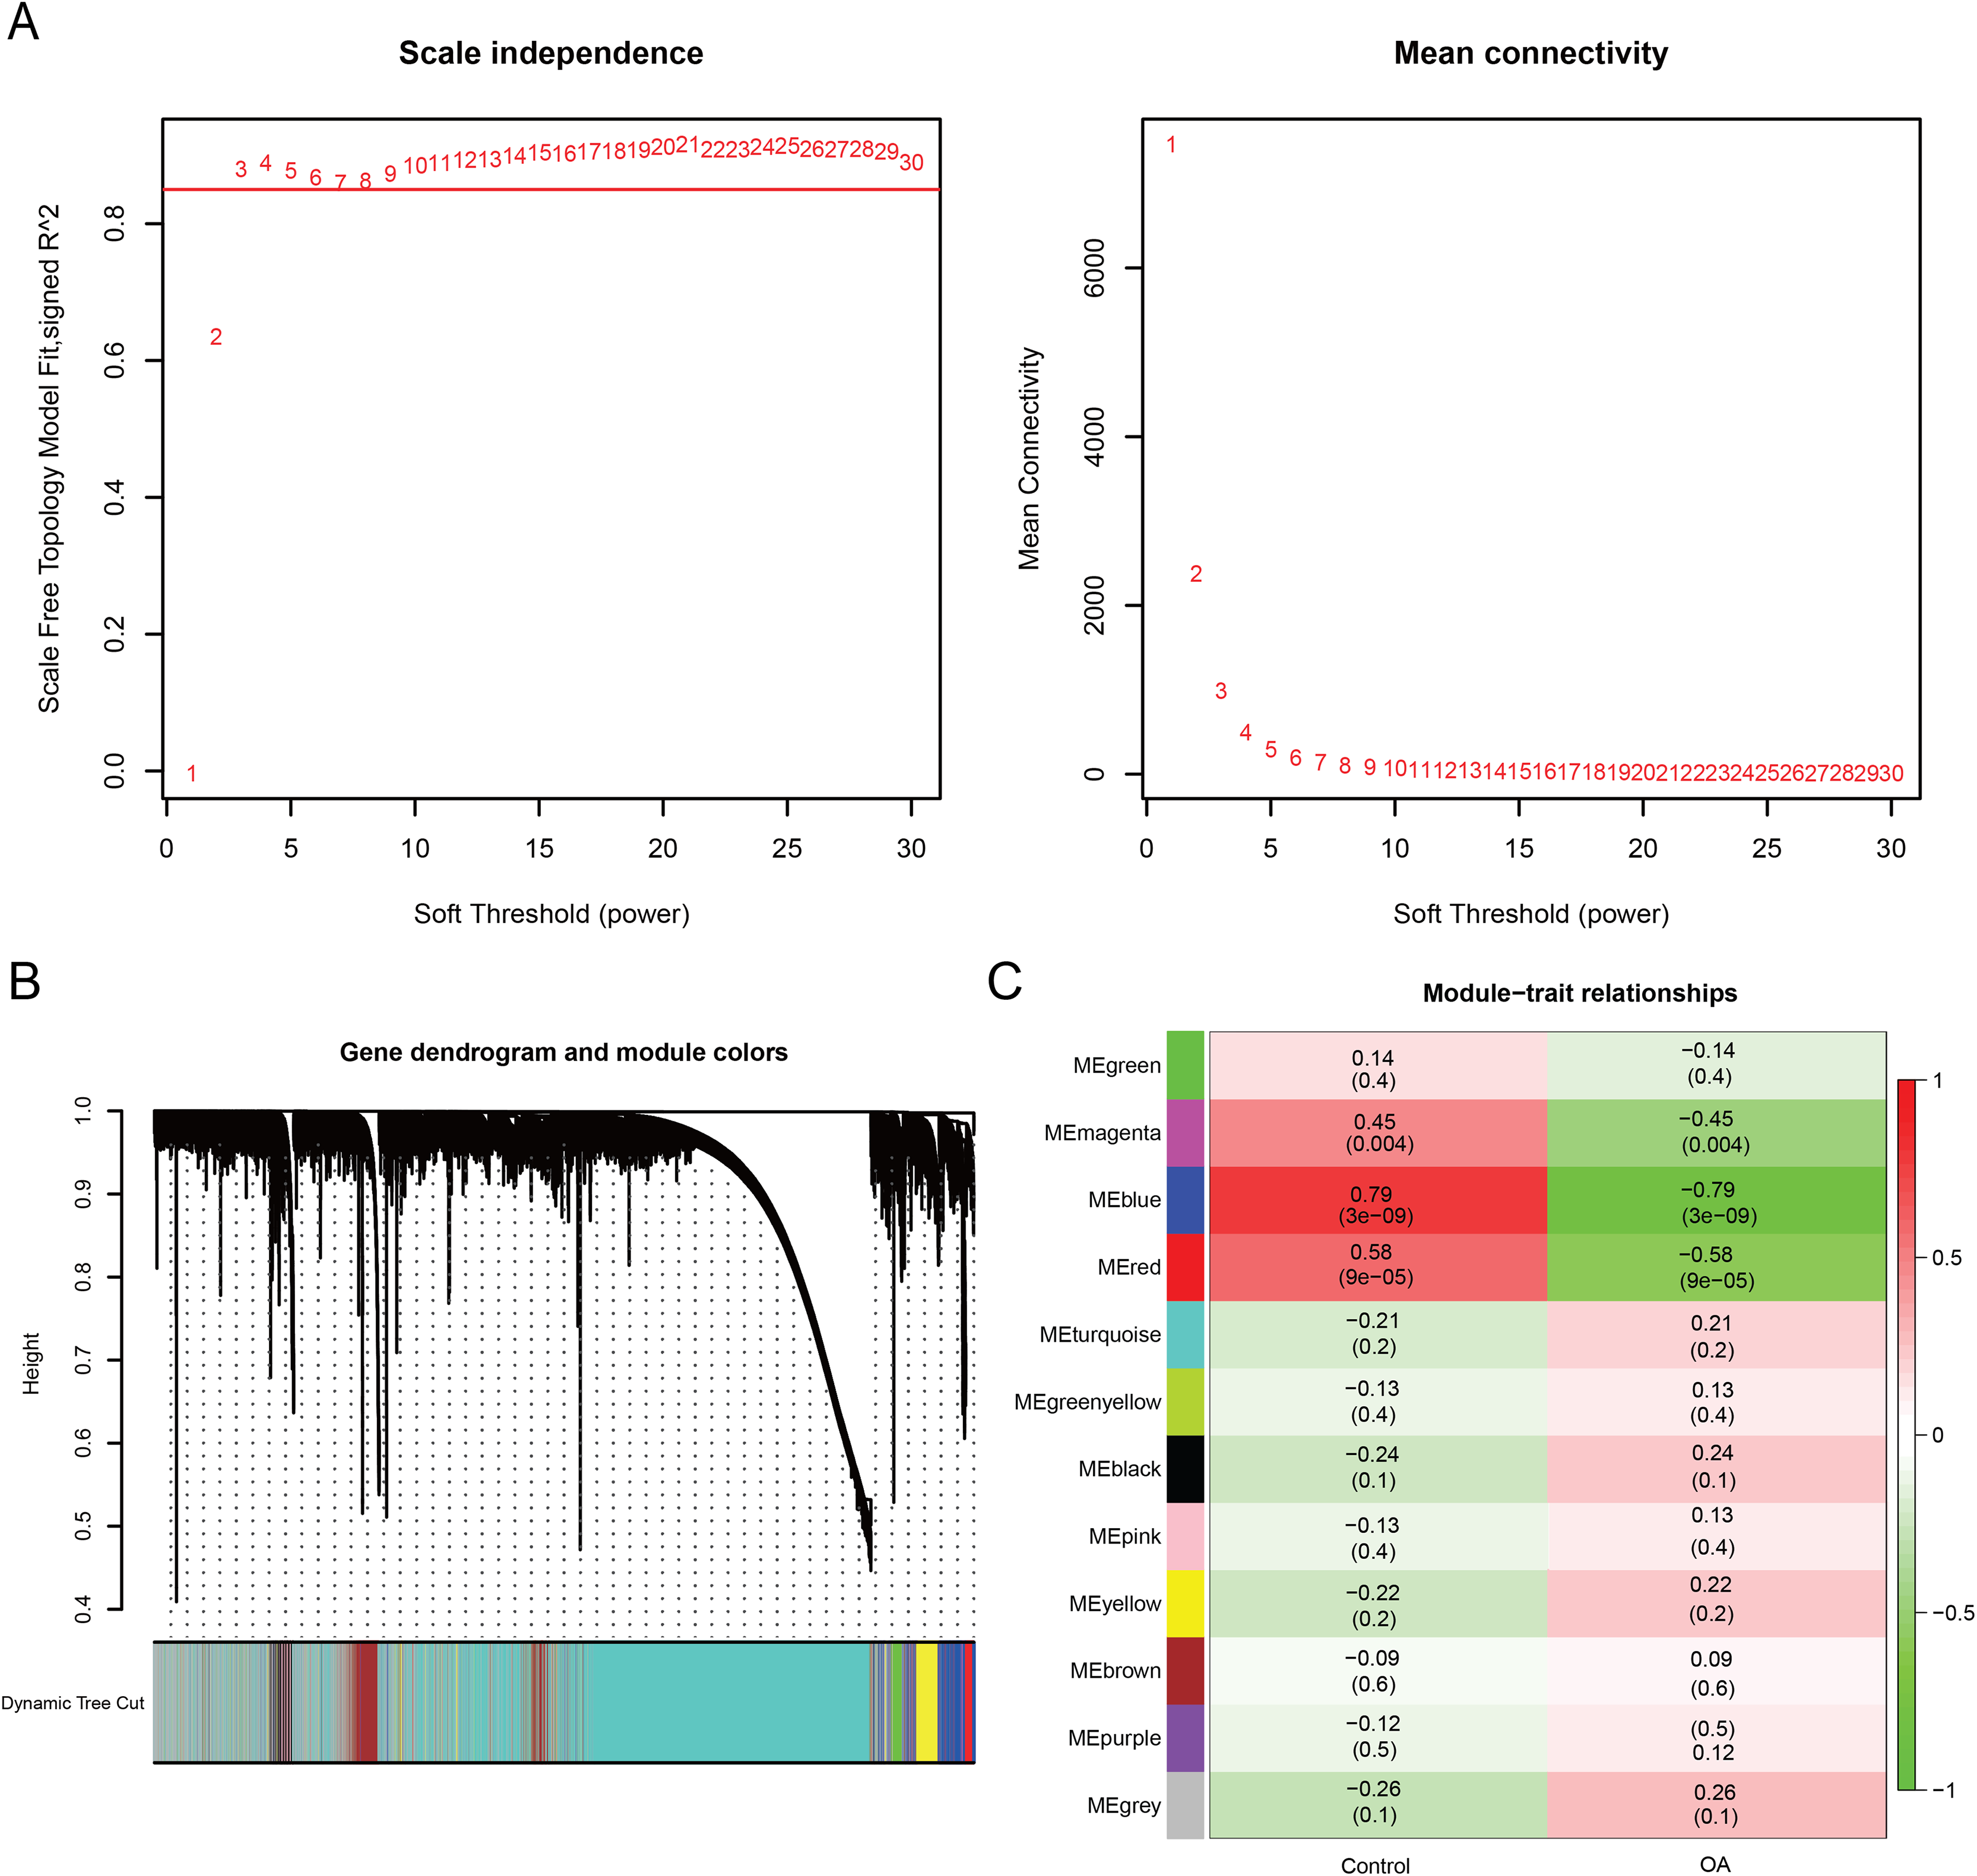
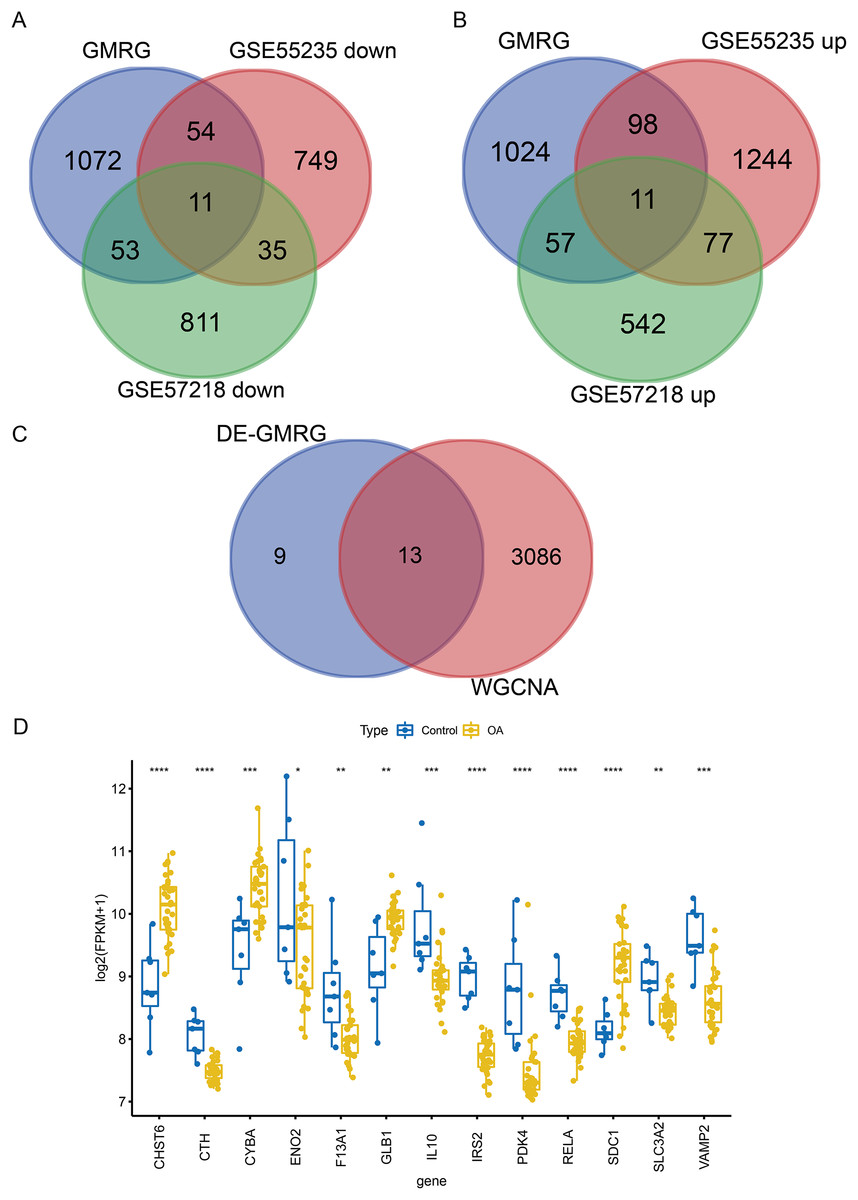
Figure 4: Screening and expression analysis of candidate GMRGs in OA.
(A) Venn diagrams intersecting GMRGs with downregulated (left) and upregulated (right) DEGs, identifying 22 differentially expressed GMRGs. (B) Venn diagram illustrating the overlap between DE-GMRGs and module genes, identifying 13 candidate genes. (C) Differential expression of the 13 genes in OA (blue) vs. Control (yellow) samples. Statistical significance was assessed using two-sided Wilcoxon rank-sum tests. Significance: *P < 0.05, **P < 0.01, ***P < 0.001, ****P < 0.0001.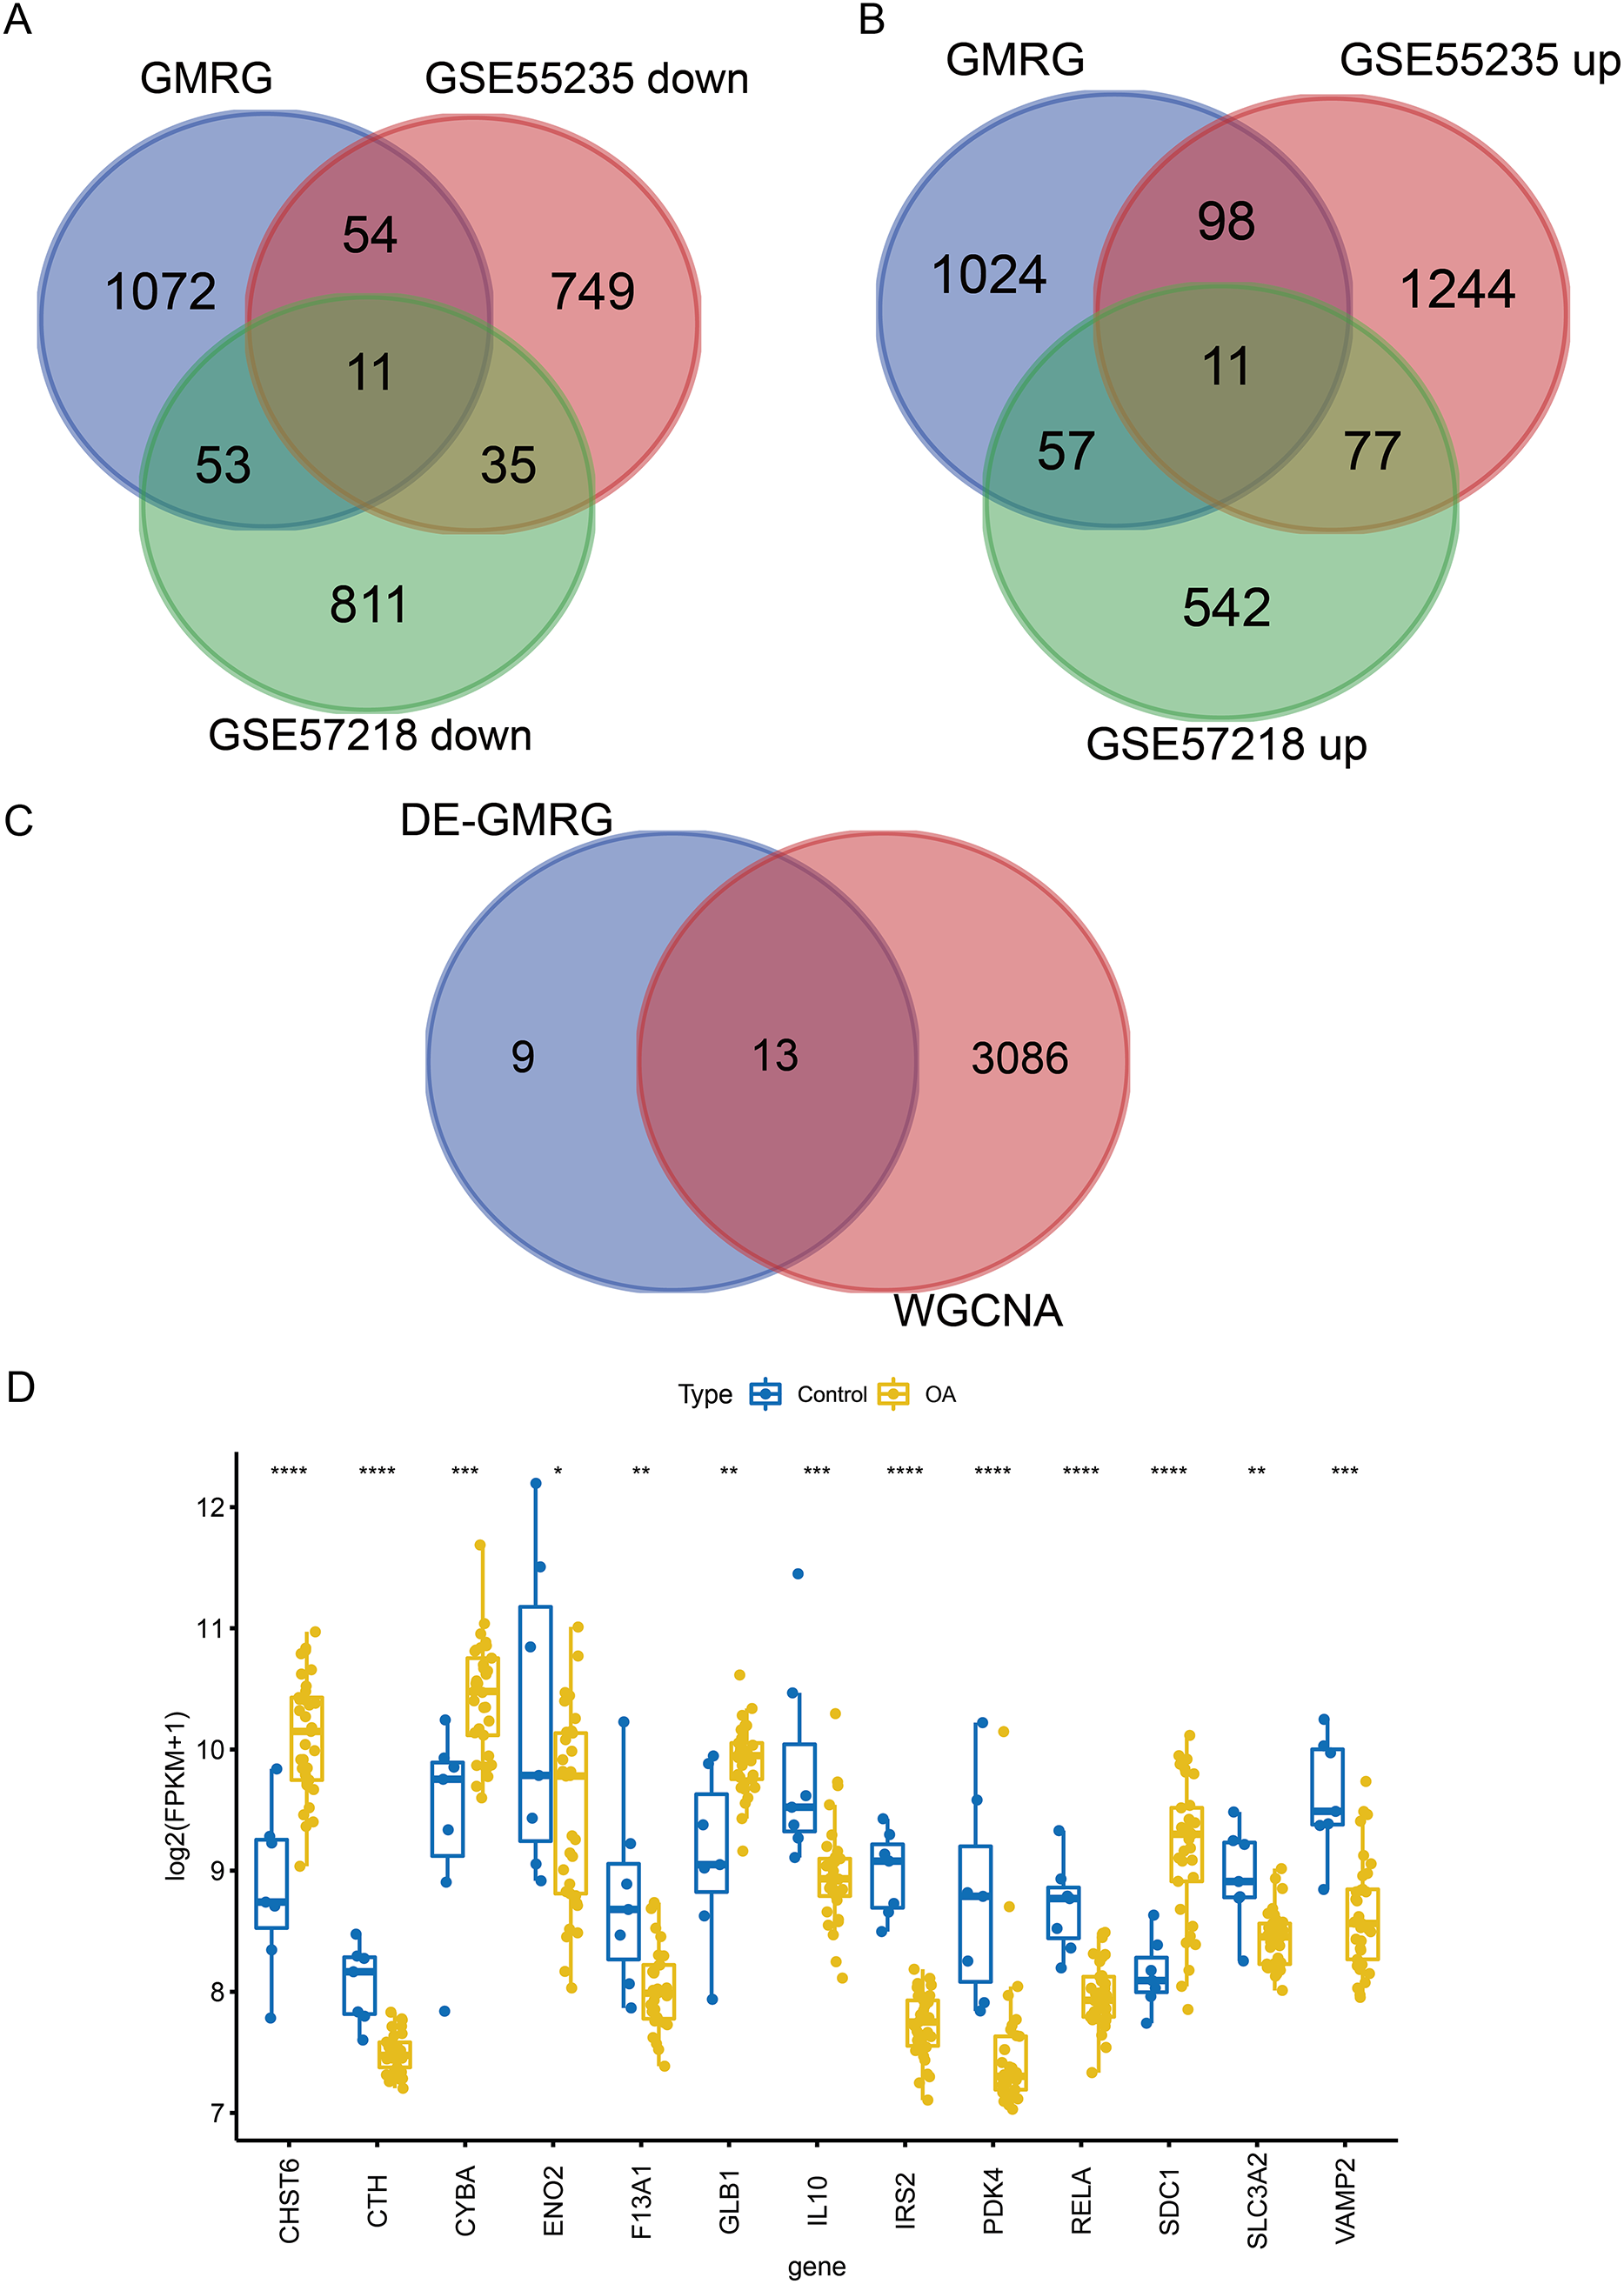
Functional analysis of candidate genes
Spearman correlation analysis revealed significant co-expression relationships among the 13 candidate genes (Fig. 5A), with the strongest positive correlations observed between IRS2 and PDK4 (ρ = 0.72, P < 0.001), and a notable correlation between RELA and SLC3A2 (ρ = 0.54, P = 0.002). Functional enrichment analysis demonstrated that the 13 candidate genes converge on several biological processes relevant to OA.
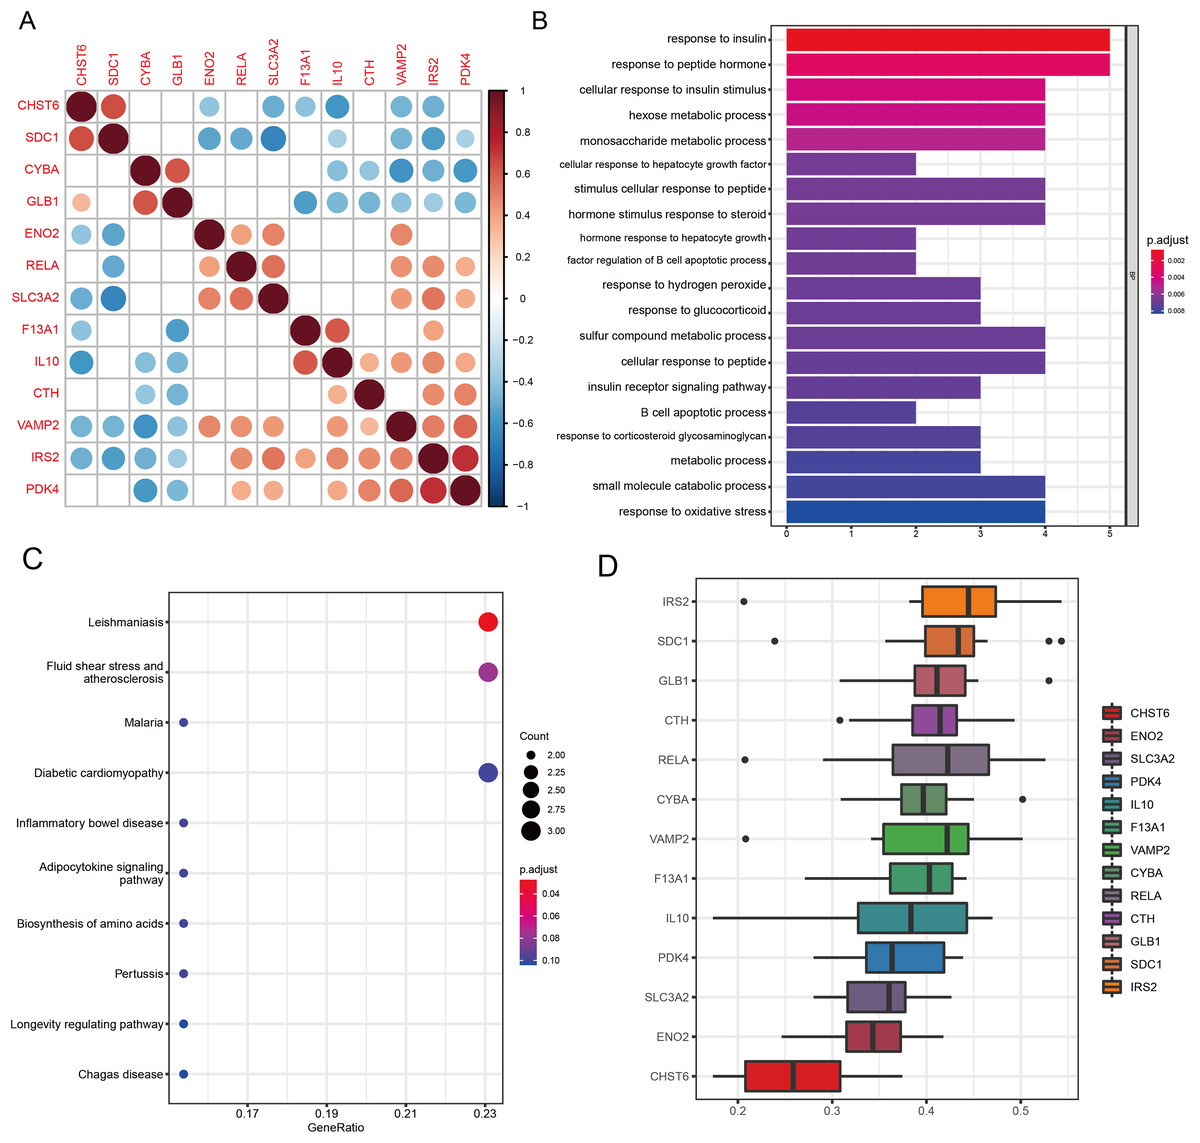
Figure 5: Functional analyses characterize the biological roles of candidate GMRGs in OA.
(A) Spearman correlation matrix showing pairwise correlations among the 13 candidate genes. Red indicates positive correlations and blue indicates negative correlations; darker colors represent stronger correlation coefficients. (B) GO Biological Process enrichment results, with bar length representing −log10 (adjusted P-value). (C) KEGG pathway enrichment analysis. Bubble size corresponds to gene count, and bubble color represents adjusted P-value (P adjust). Representative pathways include inflammatory and metabolic signaling pathways. (D) GO semantic similarity (“Friends”) analysis of the 13 genes. The heatmap depicts pairwise semantic similarity scores; warmer colors indicate stronger functional similarity. Average similarity scores highlight IRS2 as the most functionally central gene and CHST6 as the most functionally distinct.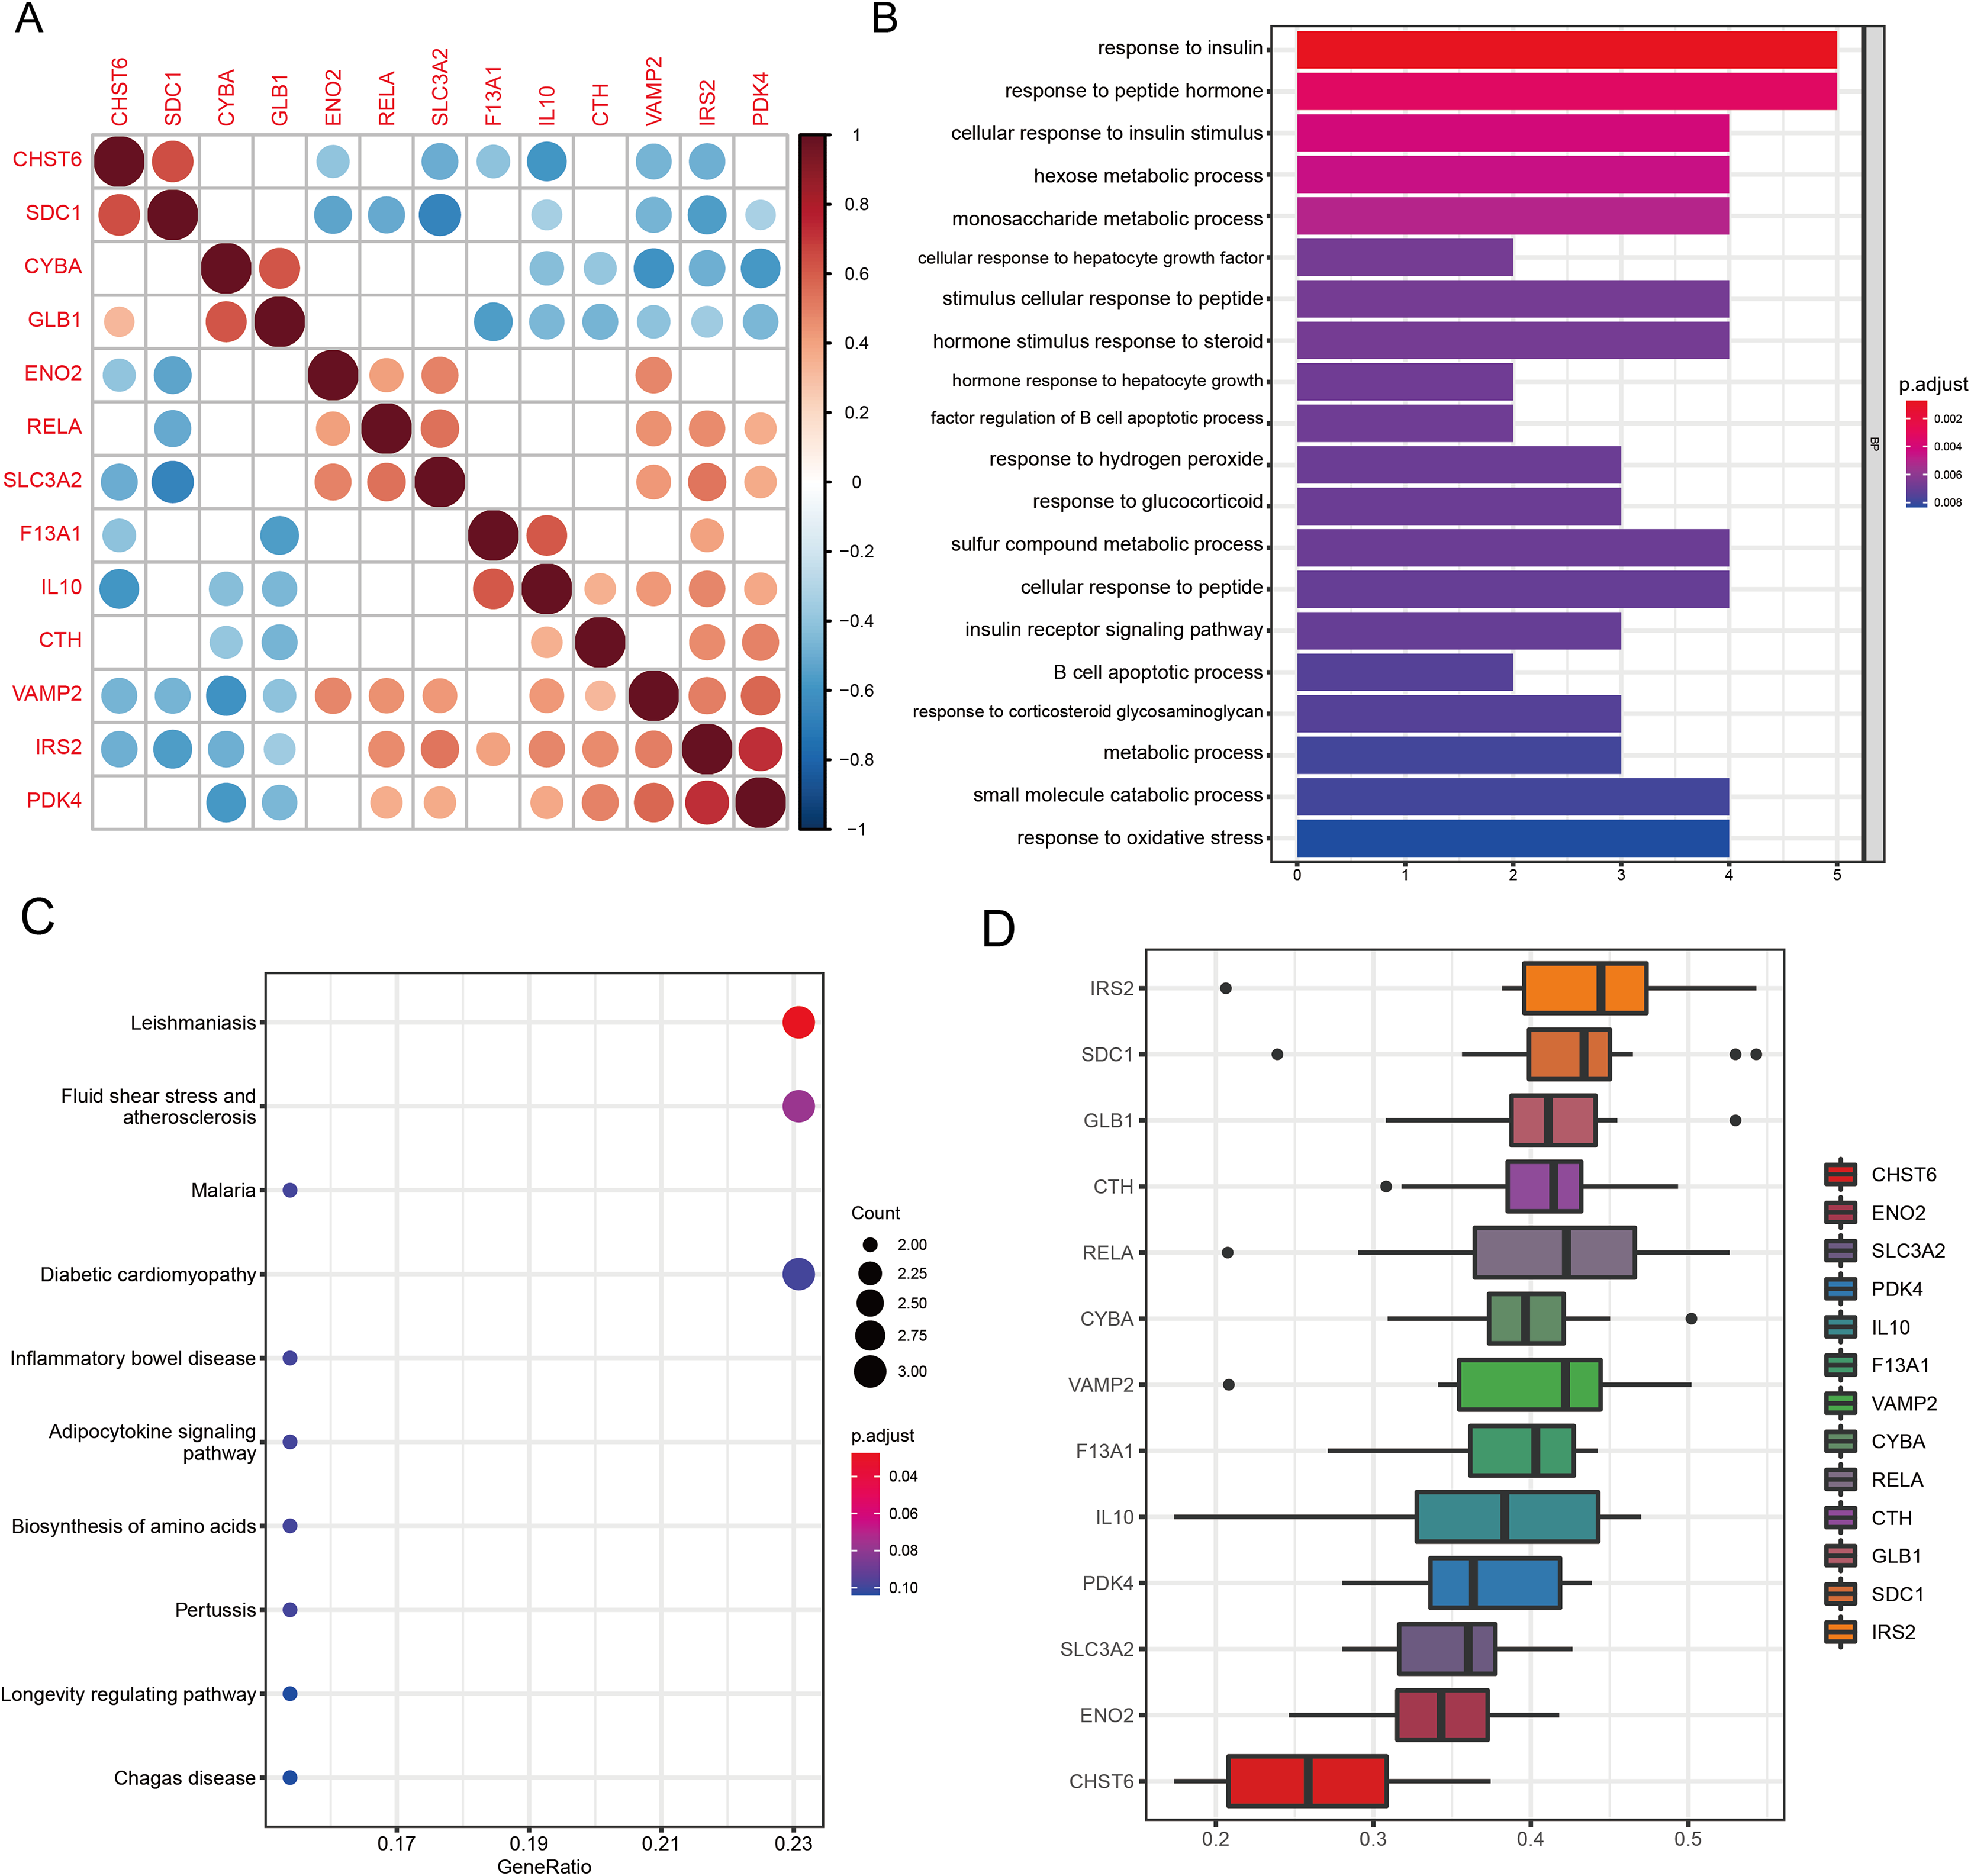
GO analysis revealed significant enrichment in pathways related to amino acid metabolism, energy metabolism, peptide hormone response, inflammatory signaling, and oxidative stress regulation (all q < 0.05; Fig. 5B). Key enriched terms included response to insulin (P = 7.8 × 10⁻⁷, q = 3.6 × 10⁻⁴), response to peptide hormone (P = 7.0 × 10⁻⁶, q = 1.6 × 10⁻³), and response to oxidative stress (P = 1.8 × 10⁻⁴, q = 0.0041), highlighting the metabolic and inflammatory features of OA. KEGG pathway analysis revealed significant enrichment of the Leishmaniasis pathway (P = 2.17 × 10⁻⁴, q = 0.021), reflecting immune-related signaling processes relevant to OA inflammation (Fig. 5C). Several additional pathways demonstrated strong nominal enrichment and trend-level significance (0.05 < q < 0.10), suggesting potential biological relevance. Among these, fluid shear stress and atherosclerosis (P = 1.23 × 10⁻³, q = 0.060) and the adipocytokine signaling pathway (P = 5.19 × 10⁻³, q = 0.077) were closely associated with chondrocyte mechanotransduction and metabolic regulation in OA. Pathways related to hypoxia- and stress-response mechanisms, including HIF-1 signaling (P = 1.26 × 10⁻², q = 0.104) and FoxO signaling (P = 1.78 × 10⁻², q = 0.125), also showed suggestive enrichment. Collectively, these pathways highlight the involvement of immune activation, mechanical stress responses, metabolic imbalance, and hypoxia-associated signaling in OA pathogenesis.
GO-based functional similarity analysis revealed distinct patterns of functional relatedness among the 13 WGCNA-derived DE-GMRGs (Fig. 5D). The similarity matrix showed substantial heterogeneity, with several genes clustering tightly together while others remained more isolated. By averaging similarity scores across all pairwise comparisons, IRS2 emerged as the most functionally central gene, displaying the highest cumulative similarity to its peers. In contrast, CHST6 exhibited the lowest similarity, indicating a more functionally distinct role within the gene set. These findings highlight IRS2 as a key functional hub within the shared GO landscape.
Diagnostic model construction and validation
In the GSE57218 discovery cohort, LASSO logistic regression was applied to 13 WGCNA-derived candidate DE-GMRGs. Ten-fold cross-validation identified λmin = 2.1 × 10⁻⁴ (minimum binomial deviance) and λ1se = 2.9 × 10⁻³ (most regularized model) (Fig. 6A). At lambda.min, only three genes, F13A1, IRS2, and RELA, retained non-zero coefficients (Fig. 6B) and were selected as the final diagnostic features.
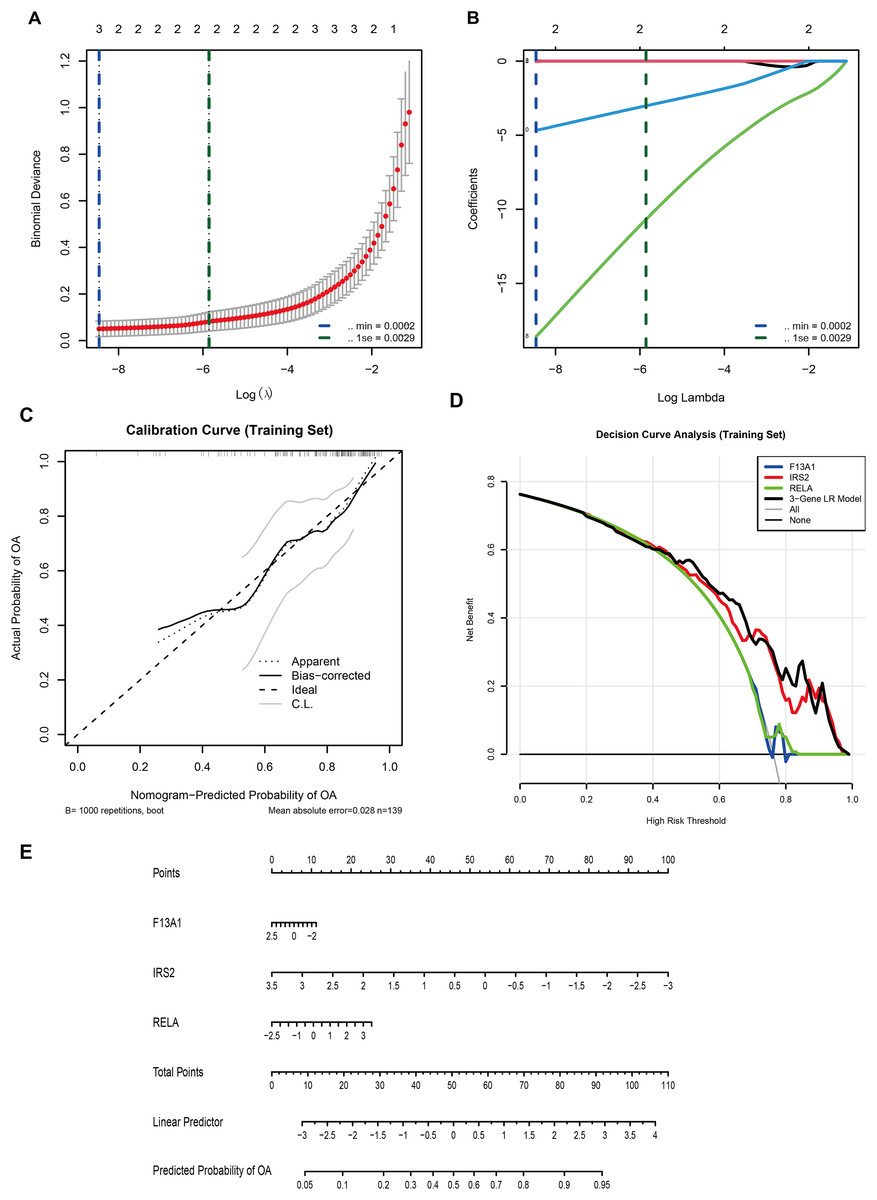
Figure 6: A three-gene diagnostic model for is developed and validated across multiple cohorts.
(A) LASSO regression showing binomial deviance vs. log(λ). Vertical dashed lines indicate λmin (2.1 × 10⁻⁴) and λ1se (2.9 × 10⁻³). (B) LASSO coefficient profiles, with three genes (F13A1, IRS2, RELA) retained at the optimal λ. (C) Calibration curve (training set; bootstrap B = 1,000) showing agreement between predicted and observed probabilities (mean absolute error = 0.028). (D) Decision curve analysis comparing the net benefit of the three-gene logistic regression model with individual genes. (E) Nomogram predicting OA risk based on the three-gene signature.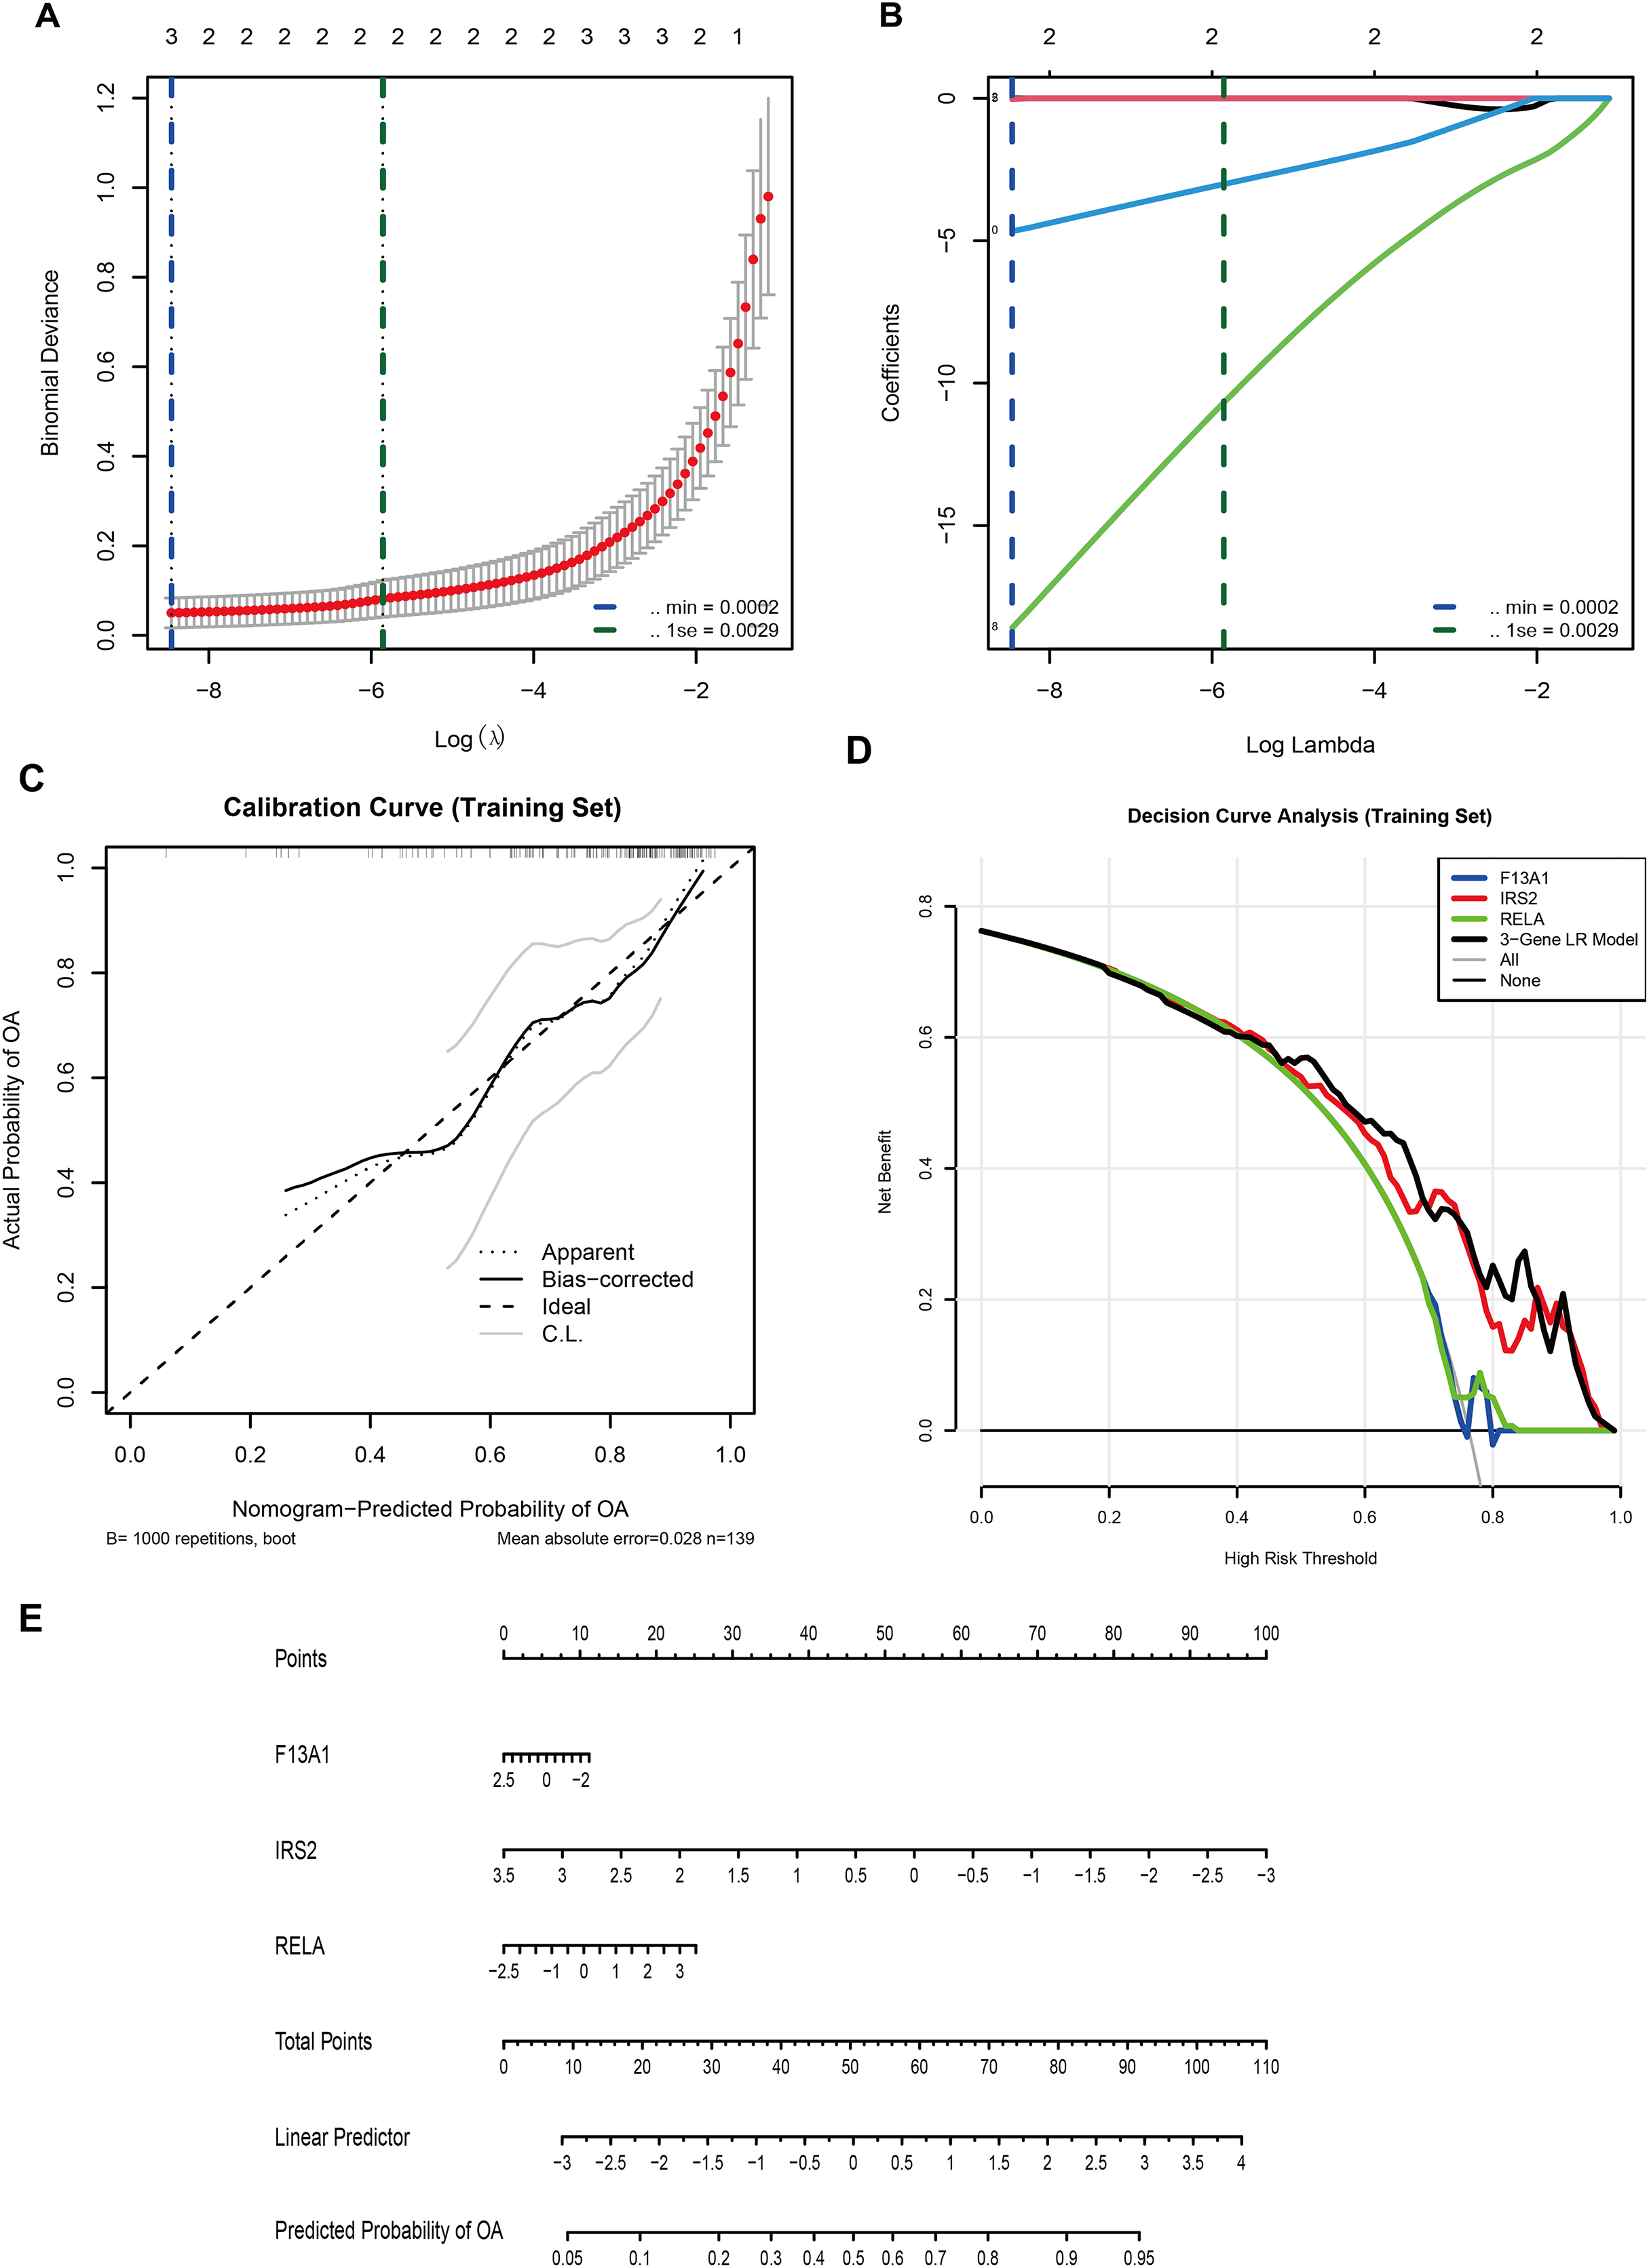
A multivariable logistic regression (LR) model based on F13A1, IRS2, and RELA was then trained in an independent cohort (GSE48556, n = 139). A nomogram was constructed to visualize the model and facilitate individual risk estimation (Fig. 6E). In this nomogram, each gene contributes a point score according to its expression level, and the total points are mapped to a linear predictor and a predicted probability of OA, which ranges from approximately 0.05 to 0.95 across the observed score range. Internal validation in GSE48556 showed good calibration and discrimination. Bootstrap-corrected calibration curves (1,000 resamples) demonstrated close agreement between predicted and observed OA probabilities, with a mean absolute calibration error of 0.028 (Fig. 6C). Decision curve analysis indicated that the three-gene LR model provided a higher net benefit than any single gene, as well as the “treat-all” and “treat-none” strategies, across almost the entire range of threshold probabilities (0–1) (Fig. 6D).
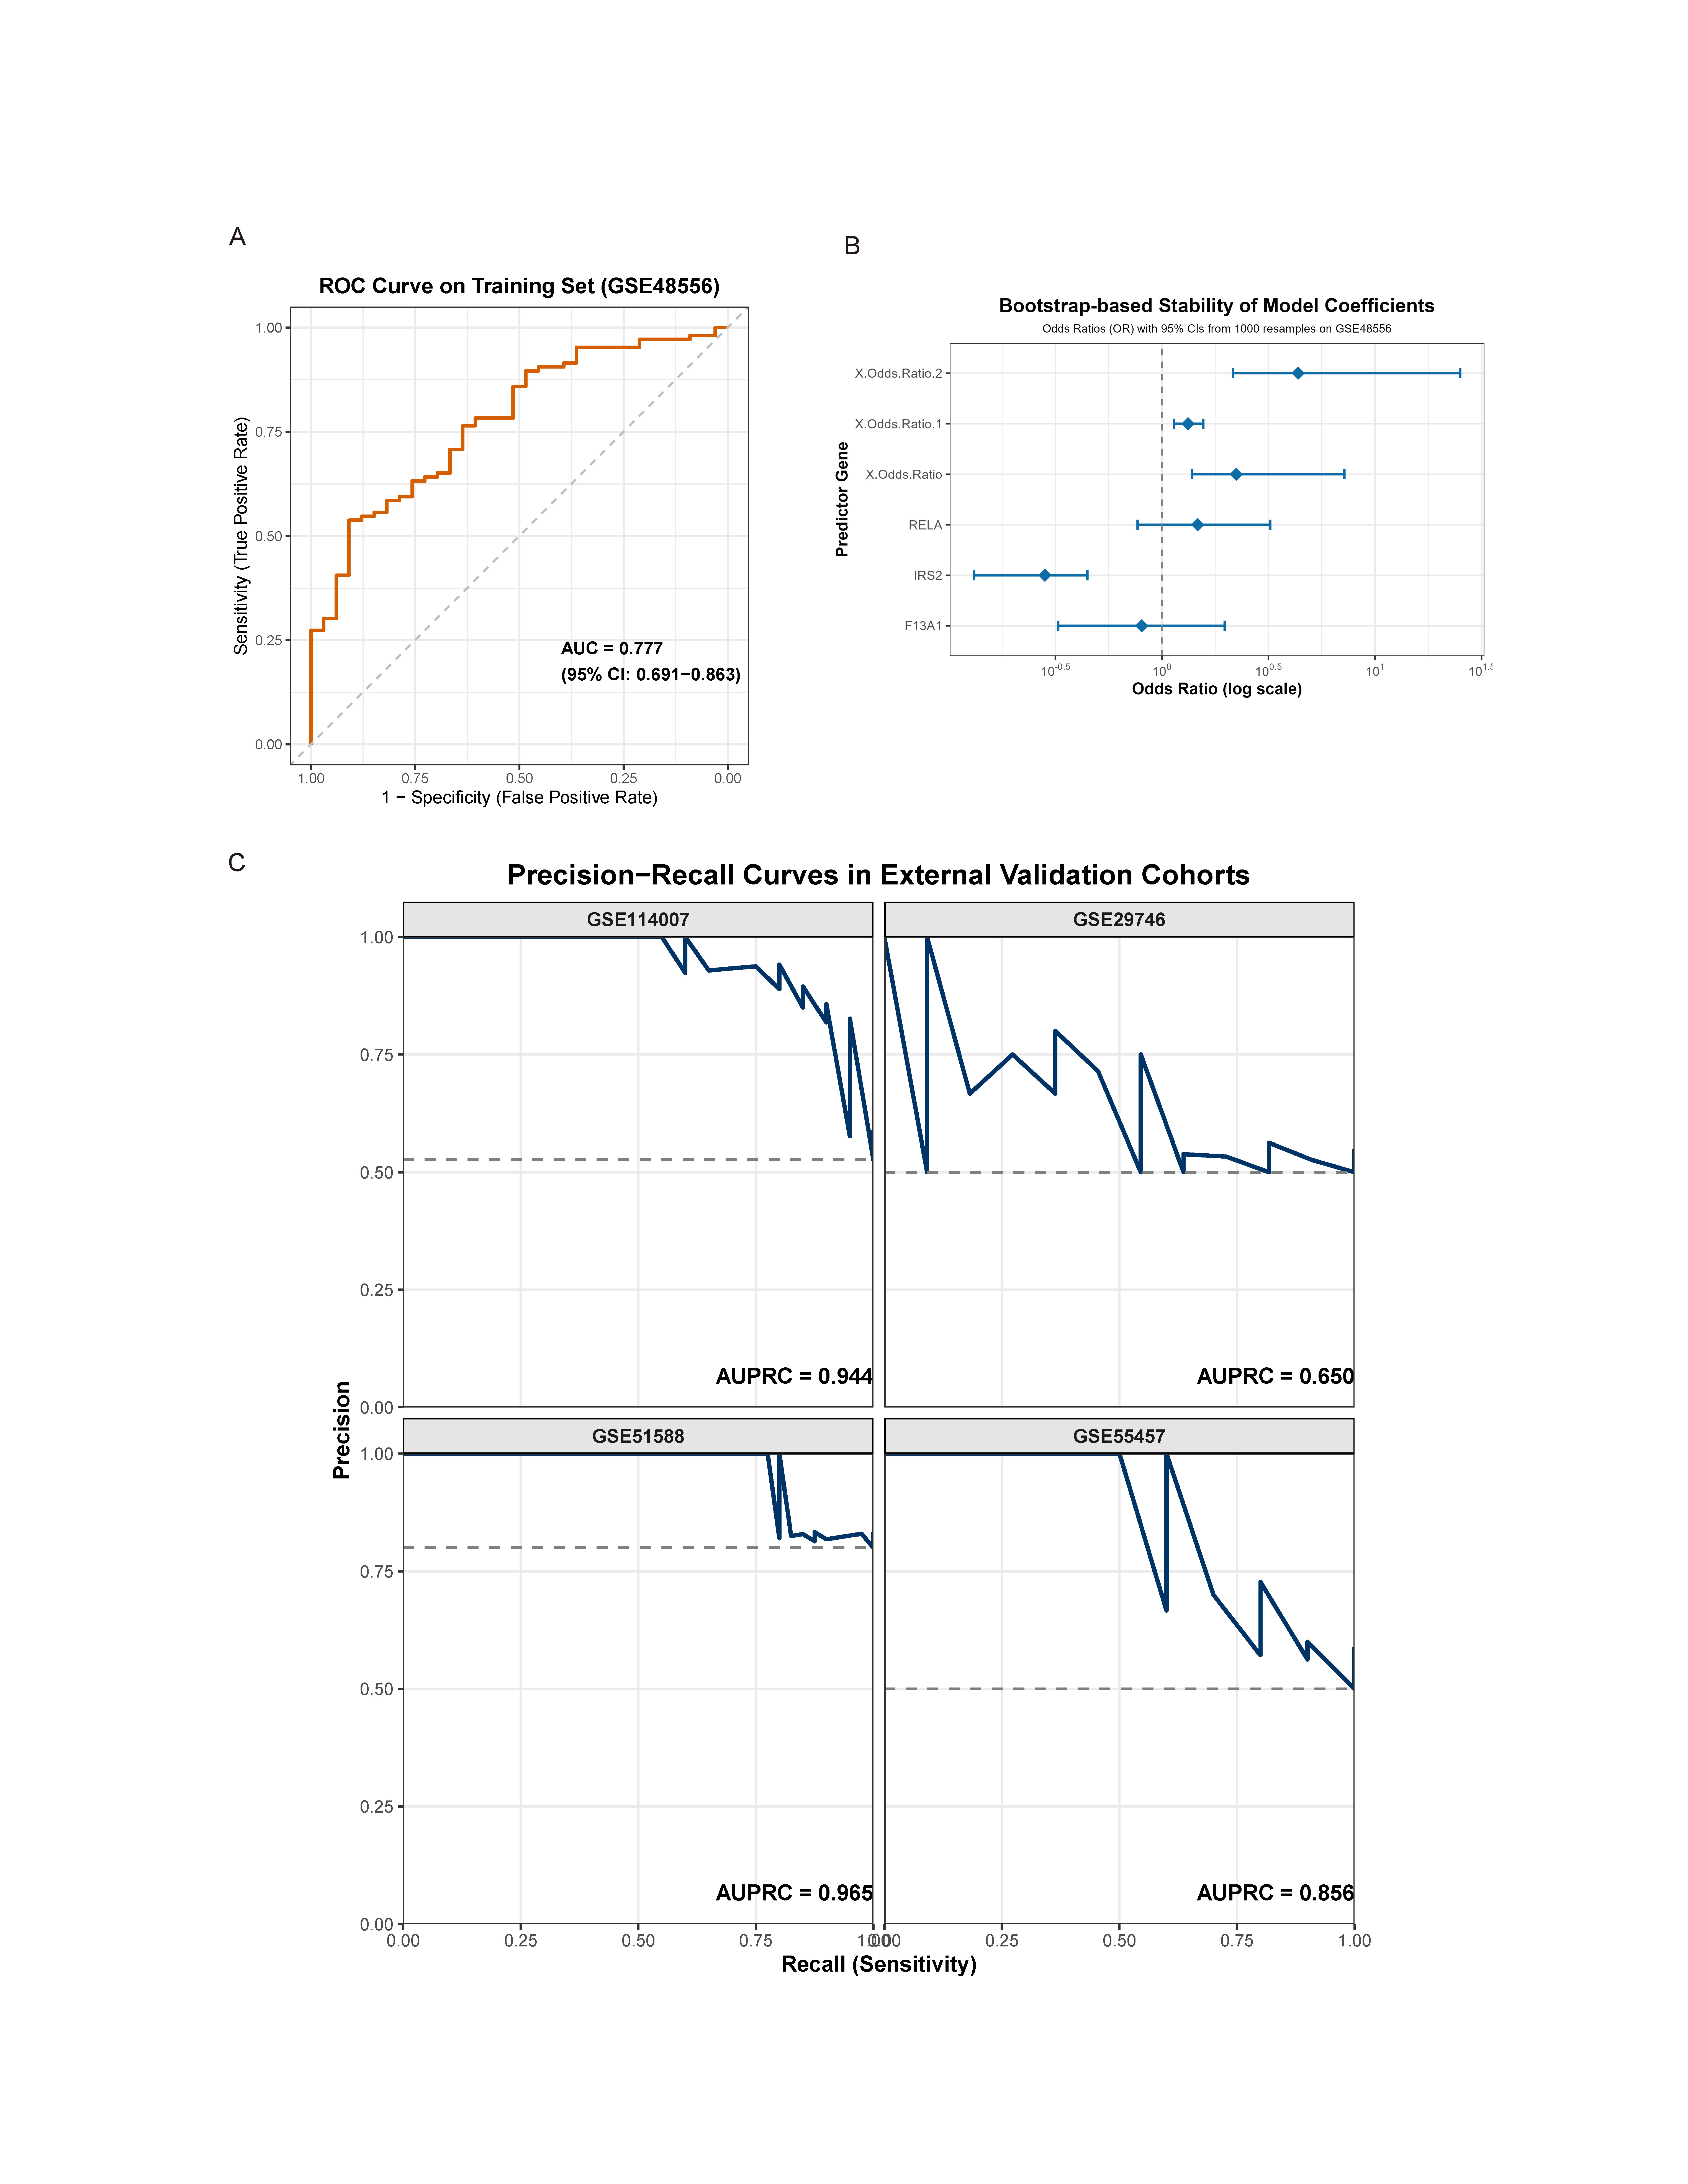
In terms of discrimination, the model achieved an AUC of 0.777 (95% CI [0.691–0.863]) in the training set (Fig. S2A). To assess the stability of model coefficients, we performed 1,000 bootstrap resamples. The bootstrap-based forest plot showed that the odds ratios and 95% confidence intervals for F13A1, IRS2, and RELA consistently deviated from the null line, indicating relatively stable contributions of these three genes to the model (Fig. S2B).
External validation across multiple independent cohorts confirmed the generalizability of the model. In GSE55457, GSE114007, GSE51588, and GSE29746, the LR model yielded AUCs of 0.810 (95% CI [0.612–1.000]), 0.925 (95% CI [0.836–1.000]), 0.848 (95% CI [0.738–0.957]), and 0.628 (95% CI [0.381–0.875]), respectively (Fig. 7A). A performance heatmap further indicated that, at a fixed decision threshold, the model maintained generally high sensitivity, specificity, accuracy, positive predictive value (PPV), and negative predictive value (NPV) in each dataset (Fig. 7B). A forest plot of corrected AUCs showed a summary AUC of 0.827 across these validation cohorts (Fig. 7C). Given the varying case–control ratios across validation cohorts, we additionally evaluated precision–recall performance. Faceted precision–recall curves showed that the areas under the precision–recall curve (AUPRC) in GSE51588, GSE55457, GSE114007, and GSE29746 were 0.944, 0.965, 0.650, and 0.856, respectively, all exceeding the baseline expected under random classification (Fig. S2C). Detailed classification performance at the pre-specified decision threshold, including sensitivity, specificity, accuracy, PPV, and NPV for each cohort, is summarized in Table S5.
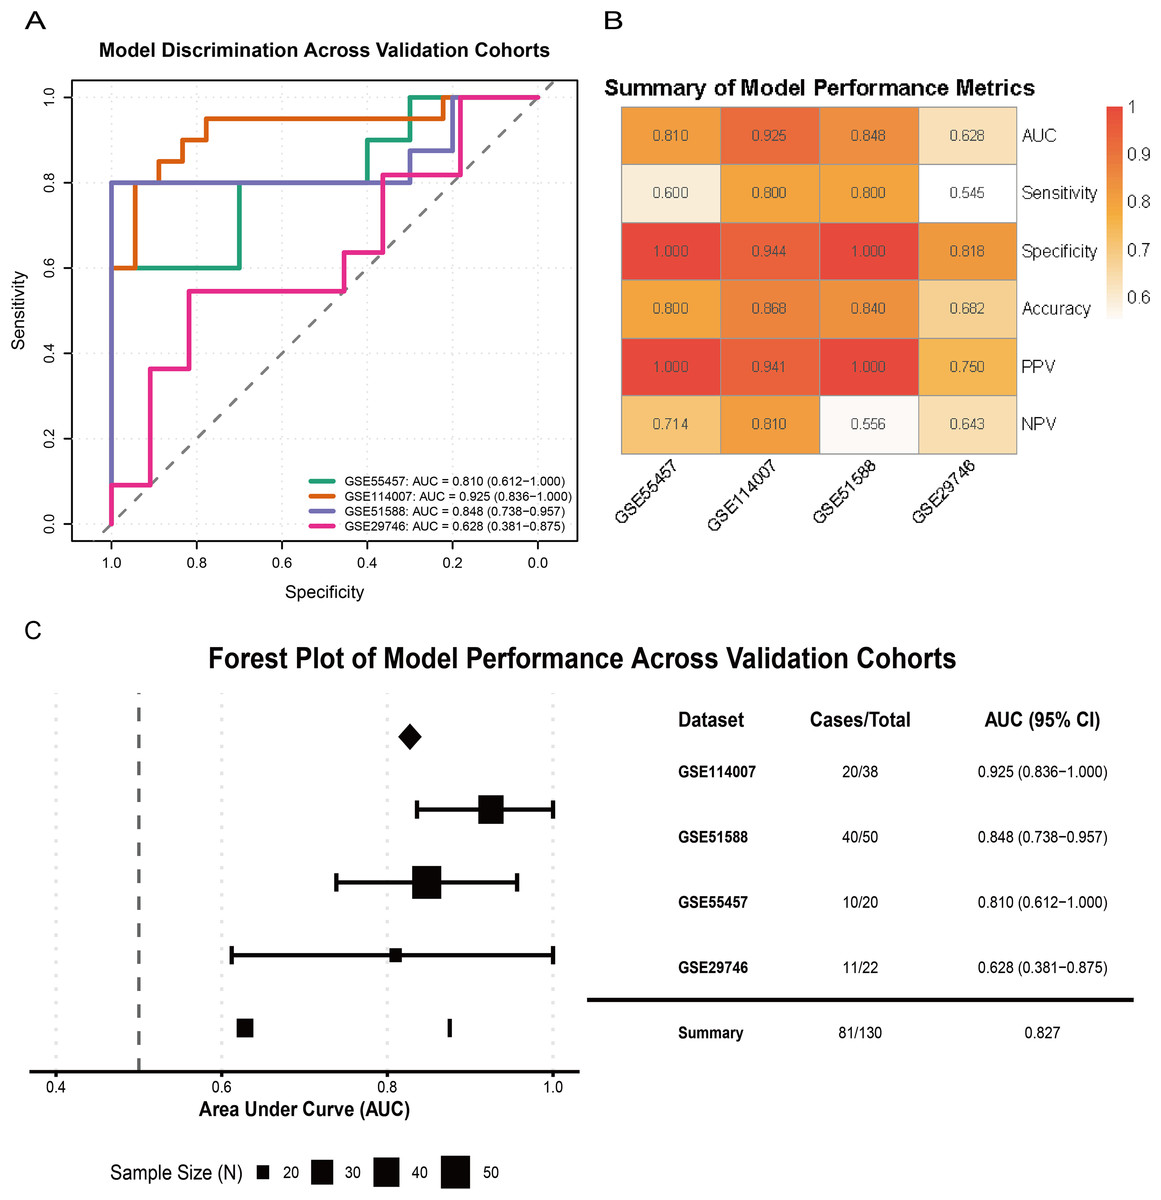
Figure 7: Validation of model performance and generalizability across external cohorts.
(A) ROC curves showing model discrimination performance across external validation cohorts. (B) Heatmap summarizing performance metrics (sensitivity, specificity, accuracy, PPV, NPV) across four external cohorts at the pre-specified decision threshold. (C) Forest plot showing AUC values and 95% CIs across validation cohorts, indicating strong model generalizability.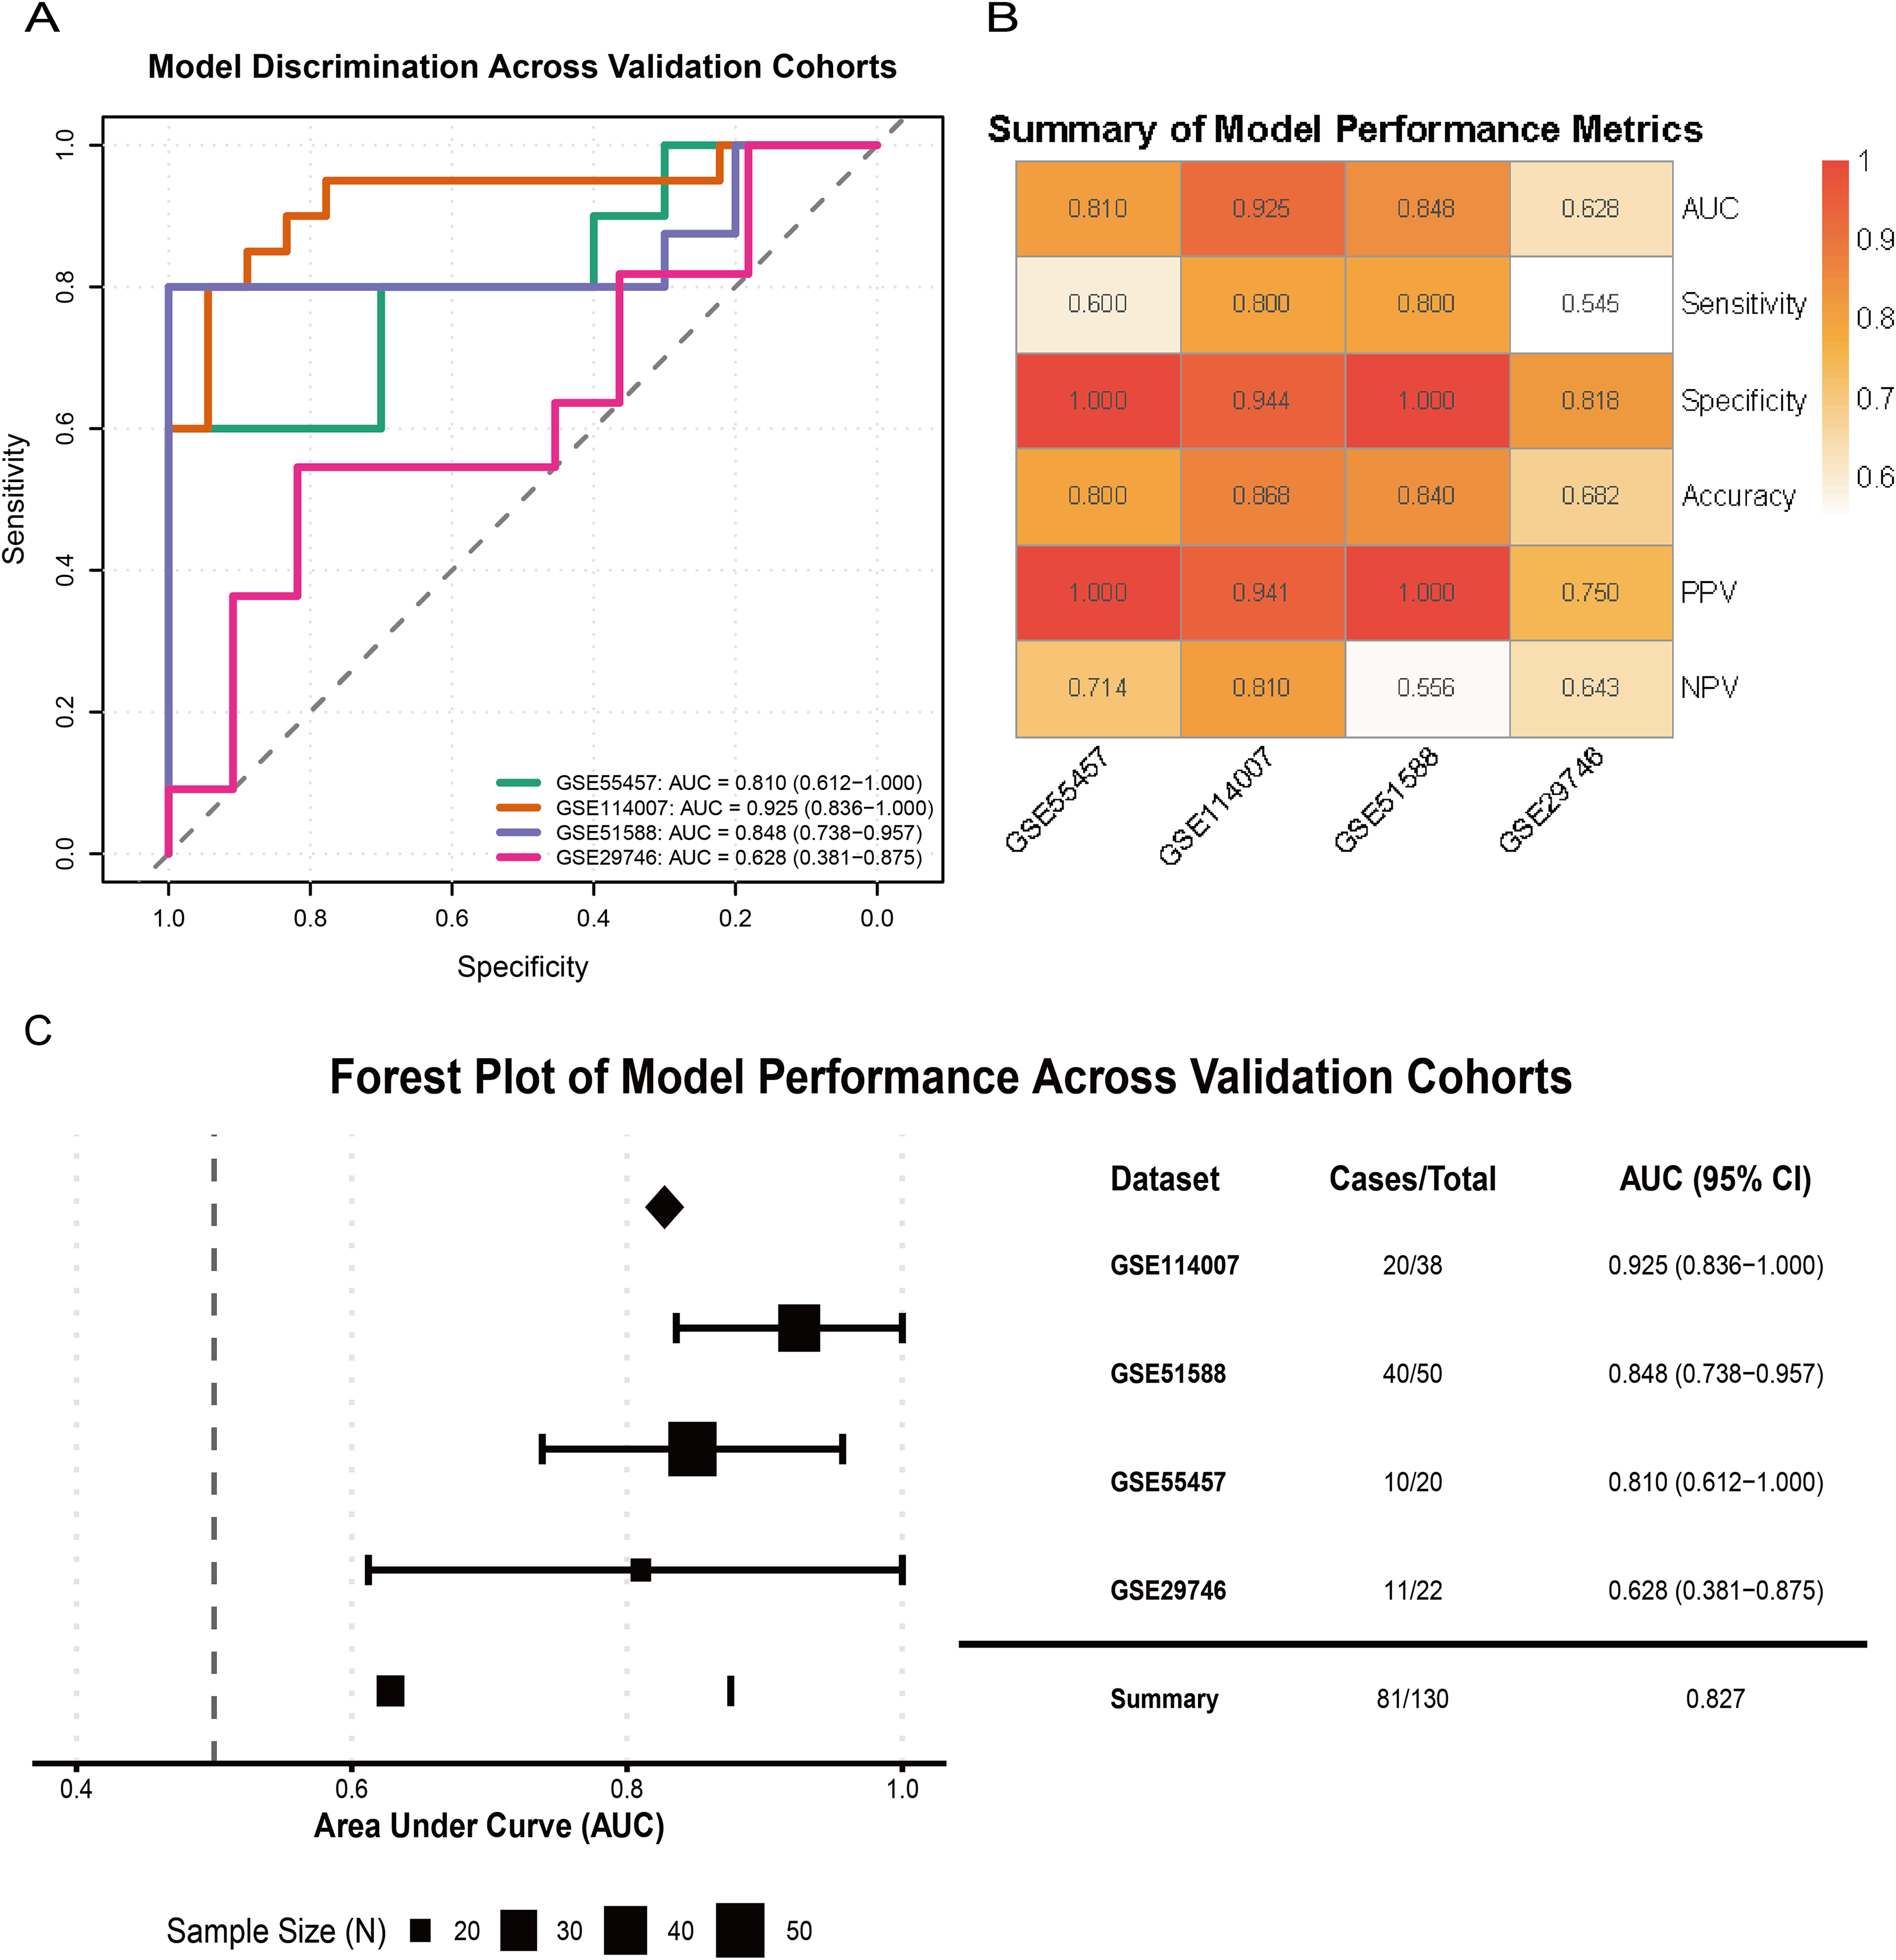
Overall, these results indicate that the three-gene glutamine metabolism-based LR model has favorable discrimination, calibration, and clinical net benefit, and shows robust diagnostic performance across multiple independent OA cohorts.
Mechanistic insights into diagnostic genes
Single gene GSEA enrichment analysis results revealed that F13A1 was mainly enriched in extracellular matrix-related pathways, such as Focal Adhesion (NES = −1.73, FDR = 1.21 × 10⁻³), and showed strong negative enrichment in the ECM-receptor interaction pathway (NES = −2.20, FDR = 2.56 × 10⁻⁵) (Fig. 8A). IRS2 was associated with RNA metabolic processes, as evidenced by its positive enrichment in the Spliceosome pathway (NES = 1.75, FDR = 3.96 × 10⁻³) (Fig. 8B). RELA was negatively enriched in mitochondrial energy metabolism, particularly in the oxidative phosphorylation pathway (NES = −2.68, FDR = 9.20 × 10⁻⁹), and was also negatively associated with pathways like Parkinson’s disease (NES = −2.54, FDR = 9.20 × 10⁻⁹) (Fig. 8C).
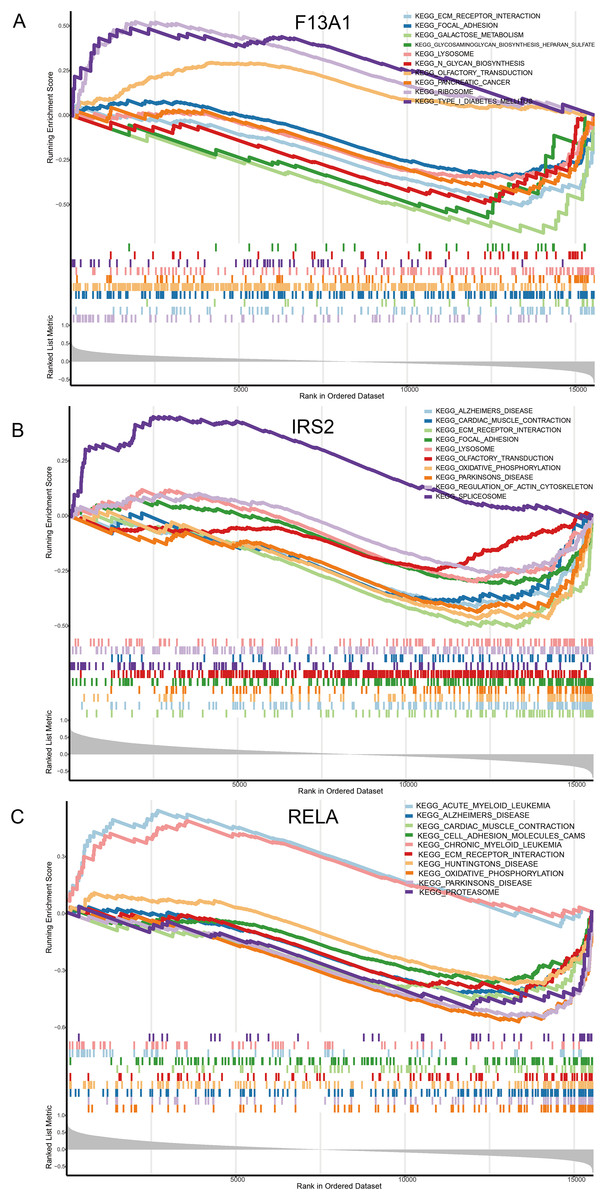
Figure 8: Molecular mechanism analysis and pathway enrichment of the three diagnostic genes in OA.
(A–C) Gene Set Enrichment Analysis (GSEA) plots identifying the biological pathways significantly associated with (A) F13A1, (B) IRS2, and (C) RELA. The plots display the running enrichment scores, Normalized Enrichment Scores (NES), and False Discovery Rate (FDR) q-values for the top enriched KEGG pathways, highlighting the regulatory features of these key diagnostic markers.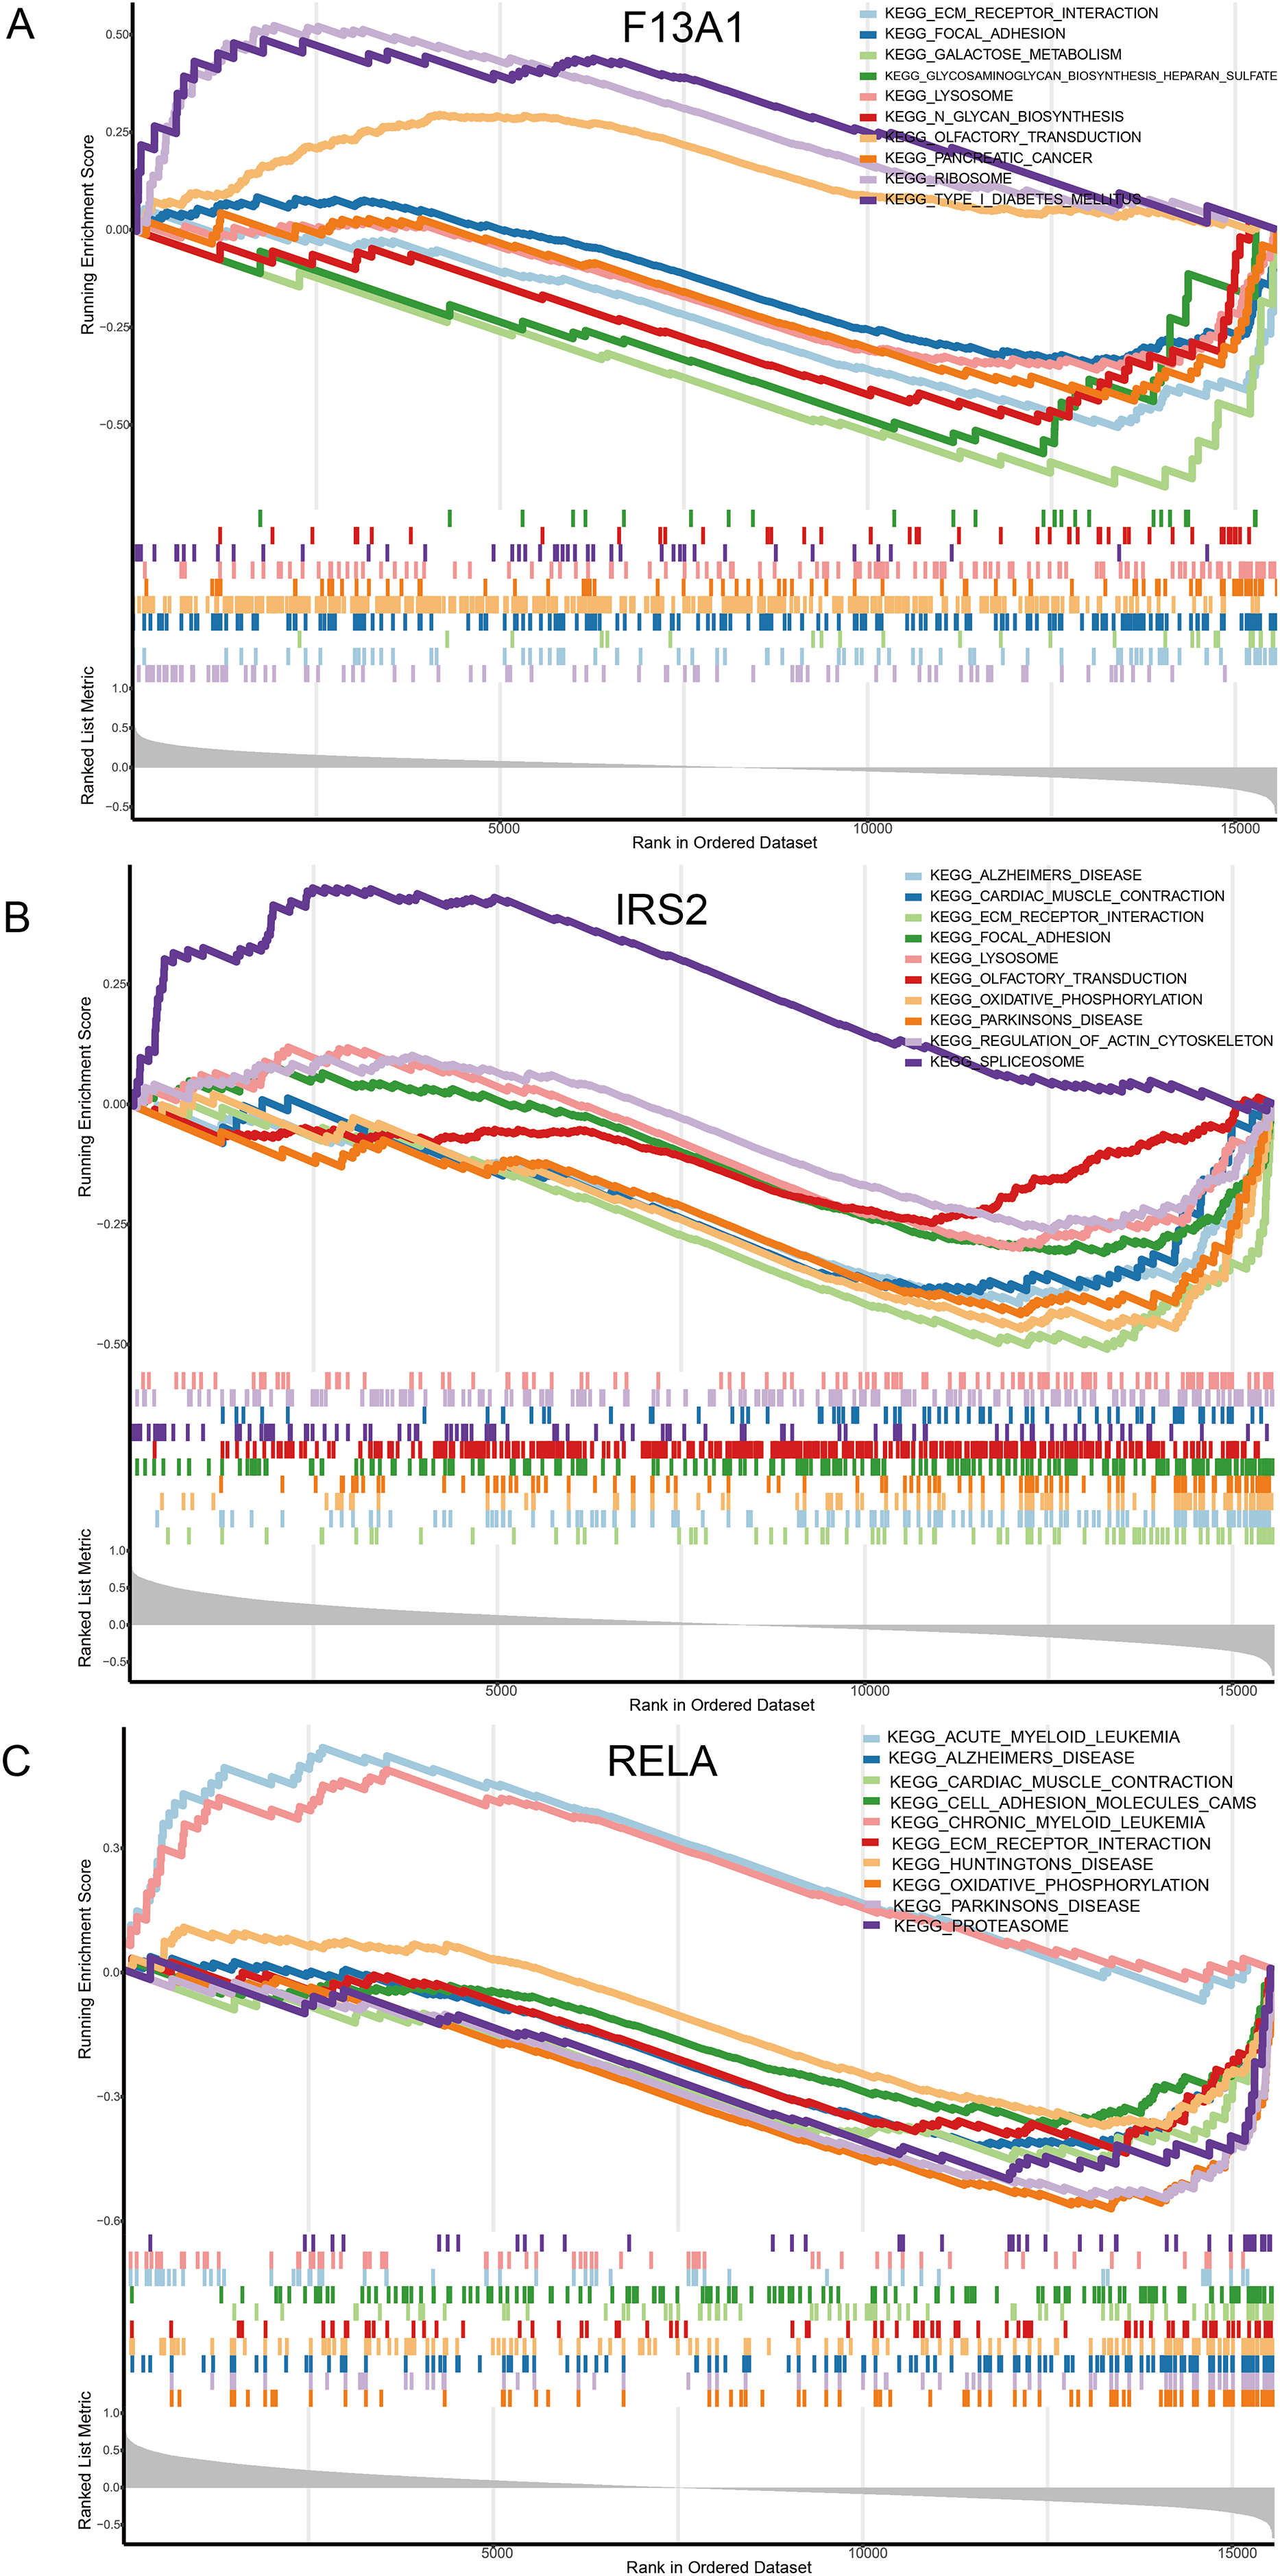
Analysis of DNA methylation data from the GSE73626 dataset identified 18,297 differentially methylated positions (DMPs), including 9,147 hypermethylated and 9,150 hypomethylated sites. Among the diagnostic genes, F13A1 harbored two DMPs: cg03440267 (hypomethylated, Δβ = −0.57, P = 0.004) and cg16530177 (hypermethylated, Δβ = 0.47, P = 0.027); IRS2 contained one DMP: cg12085119 (hypermethylated, Δβ = 0.23, P = 0.044) (Fig. 9A).
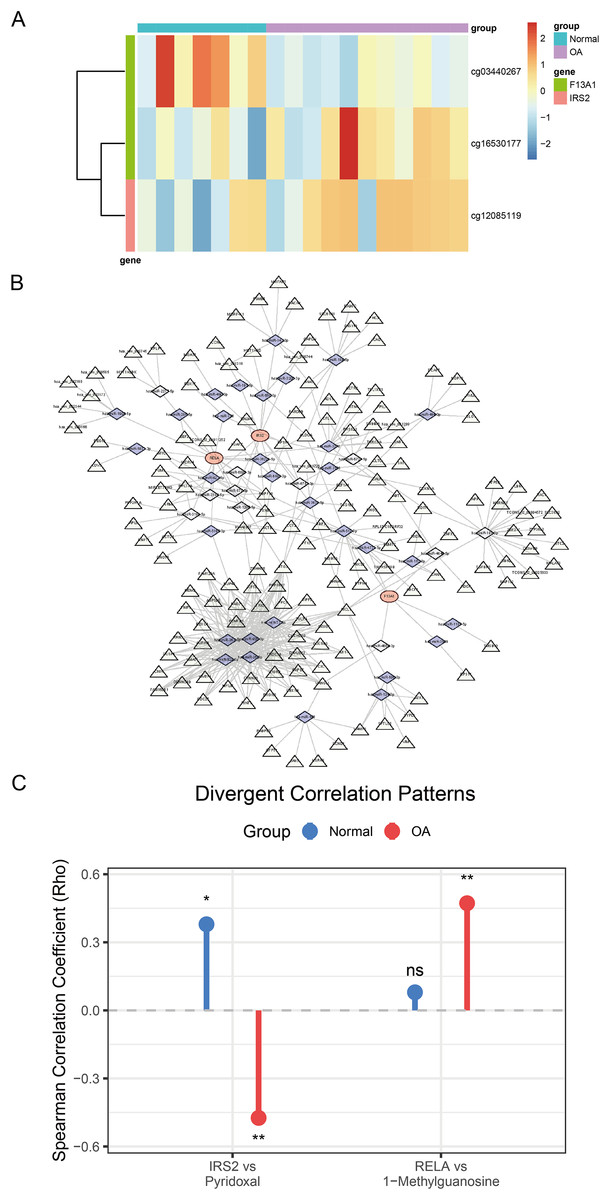
Figure 9: Comprehensive regulatory and metabolic analysis of the identified diagnostic markers.
(A) Heatmap of differential methylation levels of CpG sites associated with F13A1 and IRS2 in OA vs. Control samples; color scale represents methylation β-values. (B) ceRNA regulatory network. Triangles denote lncRNAs, diamonds denote miRNAs, and circles denote the three diagnostic genes. Edges indicate predicted regulatory interactions. (C) Lollipop plot showing differential gene–metabolite correlations. RELA exhibits an OA-specific positive correlation with 1-methylguanosine, while IRS2 shows a reversal in correlation direction with pyridoxal (positive in healthy controls, negative in OA). Statistical tests: two-sided Wilcoxon rank-sum tests for gene and metabolite comparisons; Spearman correlation (two-sided) reporting ρ and P-values. Significance: *P < 0.05, **P < 0.01, ***P < 0.001.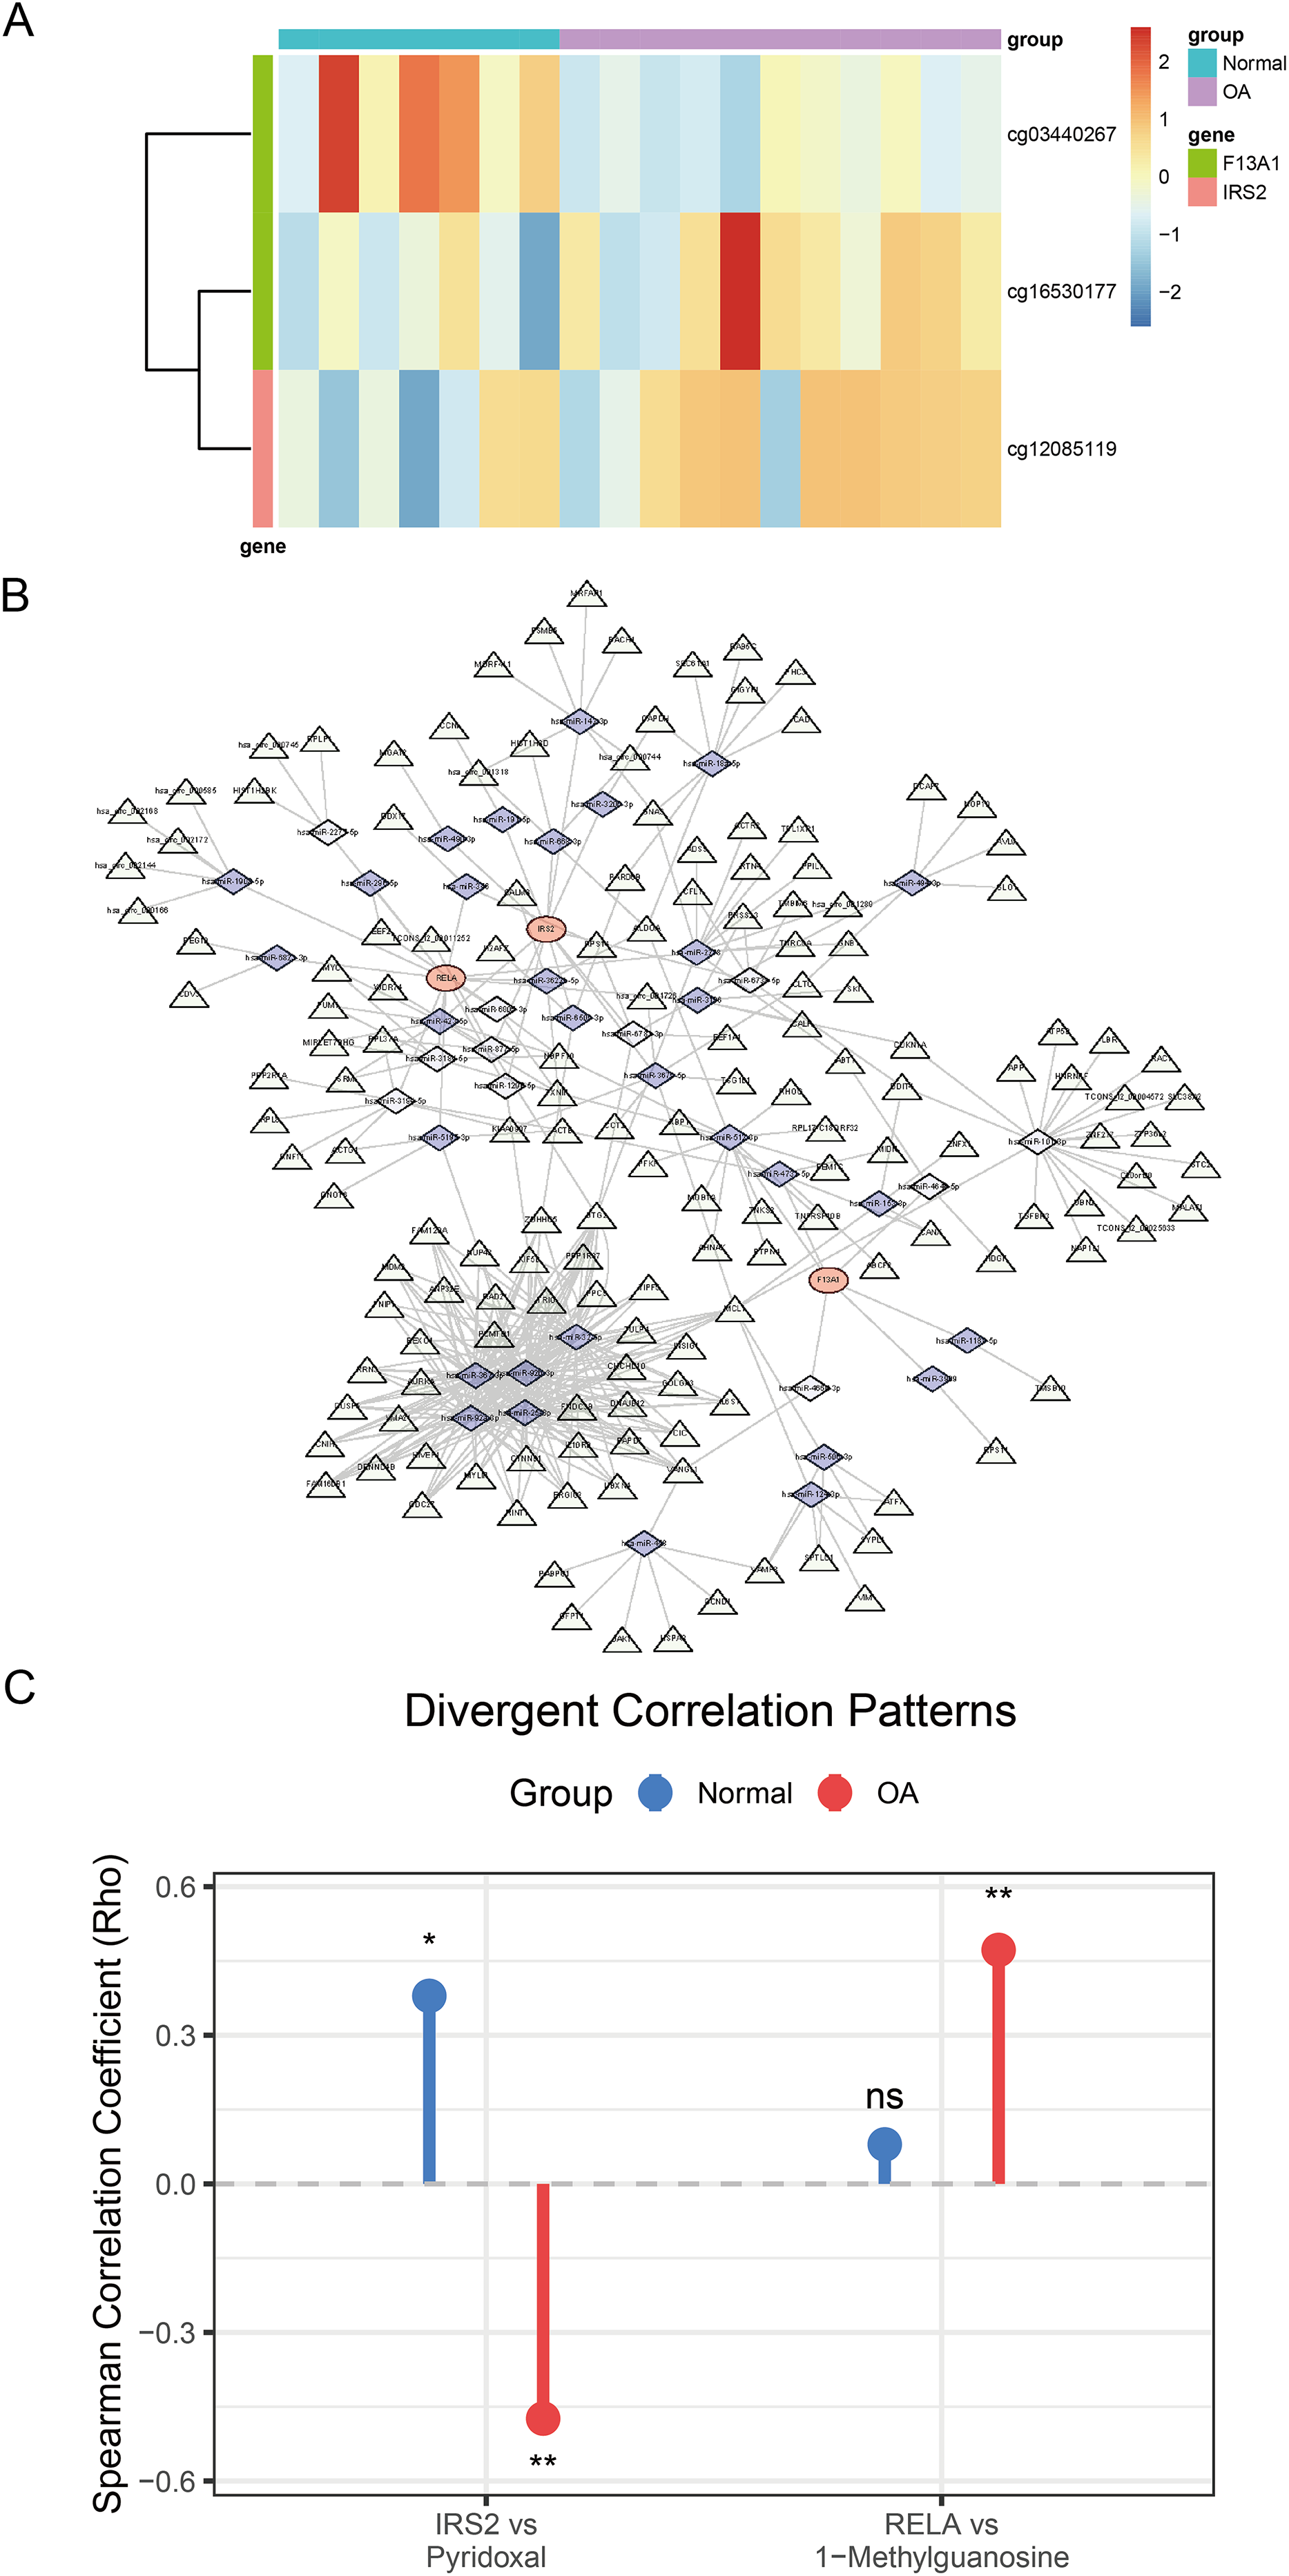
To explore the regulatory mechanisms of F13A1, IRS2, and RELA, we predicted miRNAs targeting these three key genes through integrated analysis. For F13A1, 46 targeting miRNAs were predicted, among which hsa-miR-4731-5p showed significant regulatory interaction with notable expression correlation; for IRS2, 103 potential targeting miRNAs were predicted, displaying complex regulatory patterns with varied expression profiles; for RELA, 128 miRNAs were predicted, including the key hsa-miR-1908-5p, which demonstrated significant impact on RELA expression regulation. Based on miRNA-mRNA interaction predictions, a ceRNA regulatory network containing three mRNAs, 42 key miRNAs, and 158 regulatory nodes was constructed (Fig. 9B). This network comprised 203 nodes and 417 regulatory edges, revealing potential non-coding RNA regulatory mechanisms.
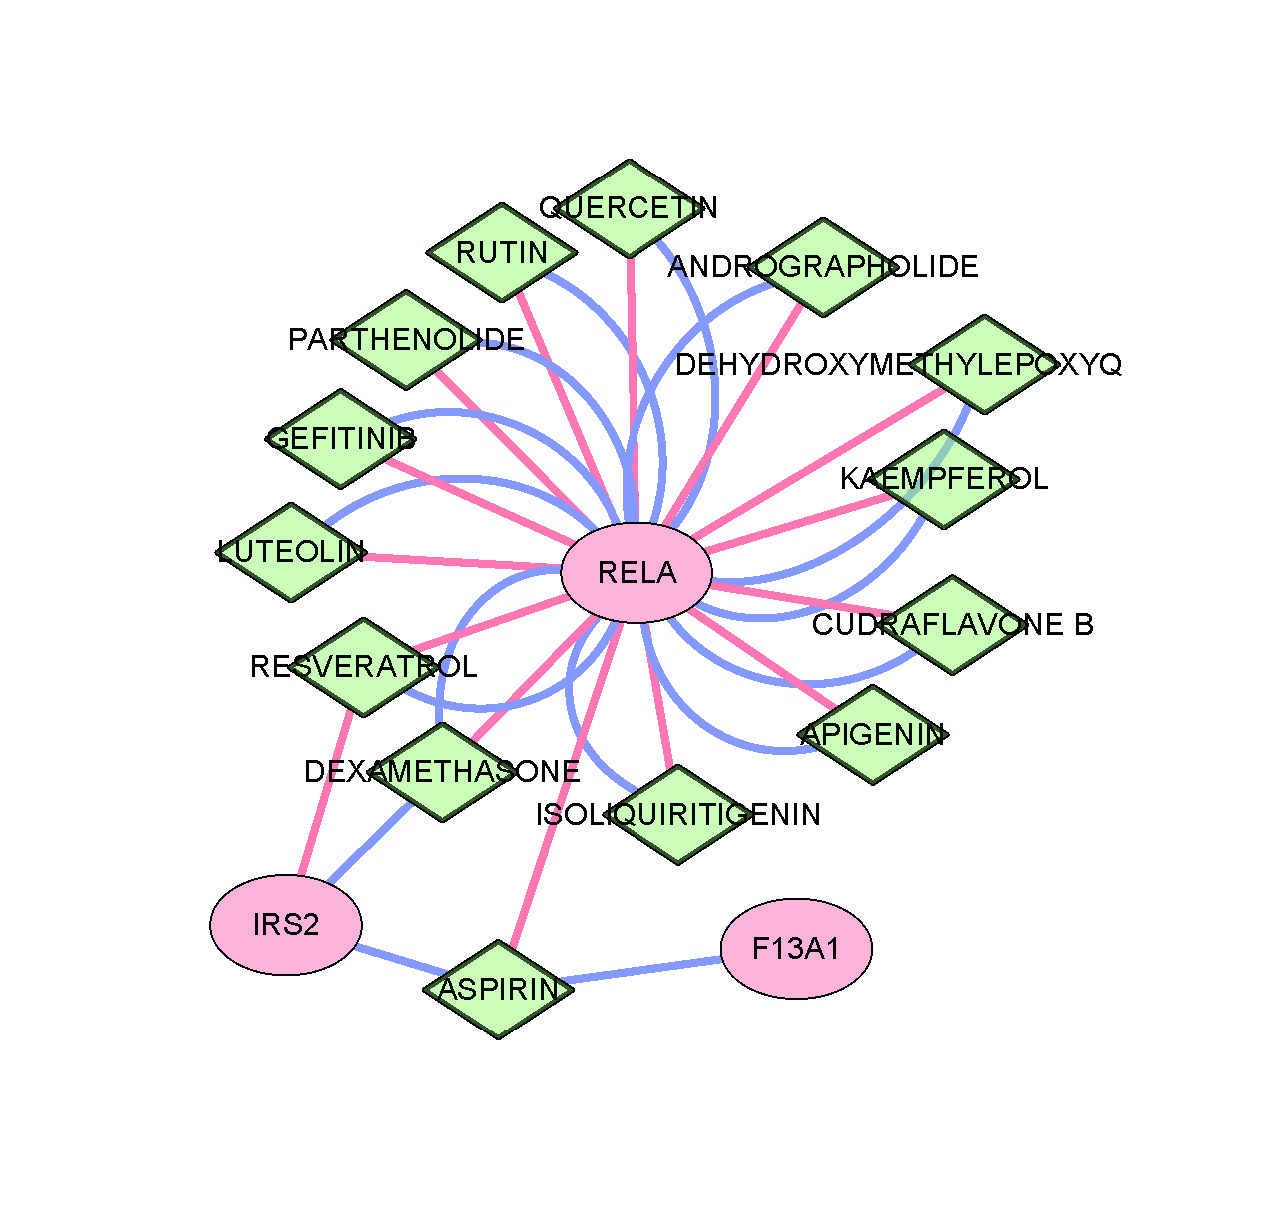
Furthermore, through cross-validation using CTD and DGIdb databases, 14 potential drug intervention targets were predicted based on the three diagnostic genes (Fig. S3). These included several major drug categories: anti-inflammatory pathway drugs (such as troglitazone and dexamethasone targeting RELA), metabolic modulators (such as metformin targeting IRS2), and extracellular matrix regulators (such as thrombin targeting F13A1).
Clinical validation and metabolomic profiling of diagnostic genes
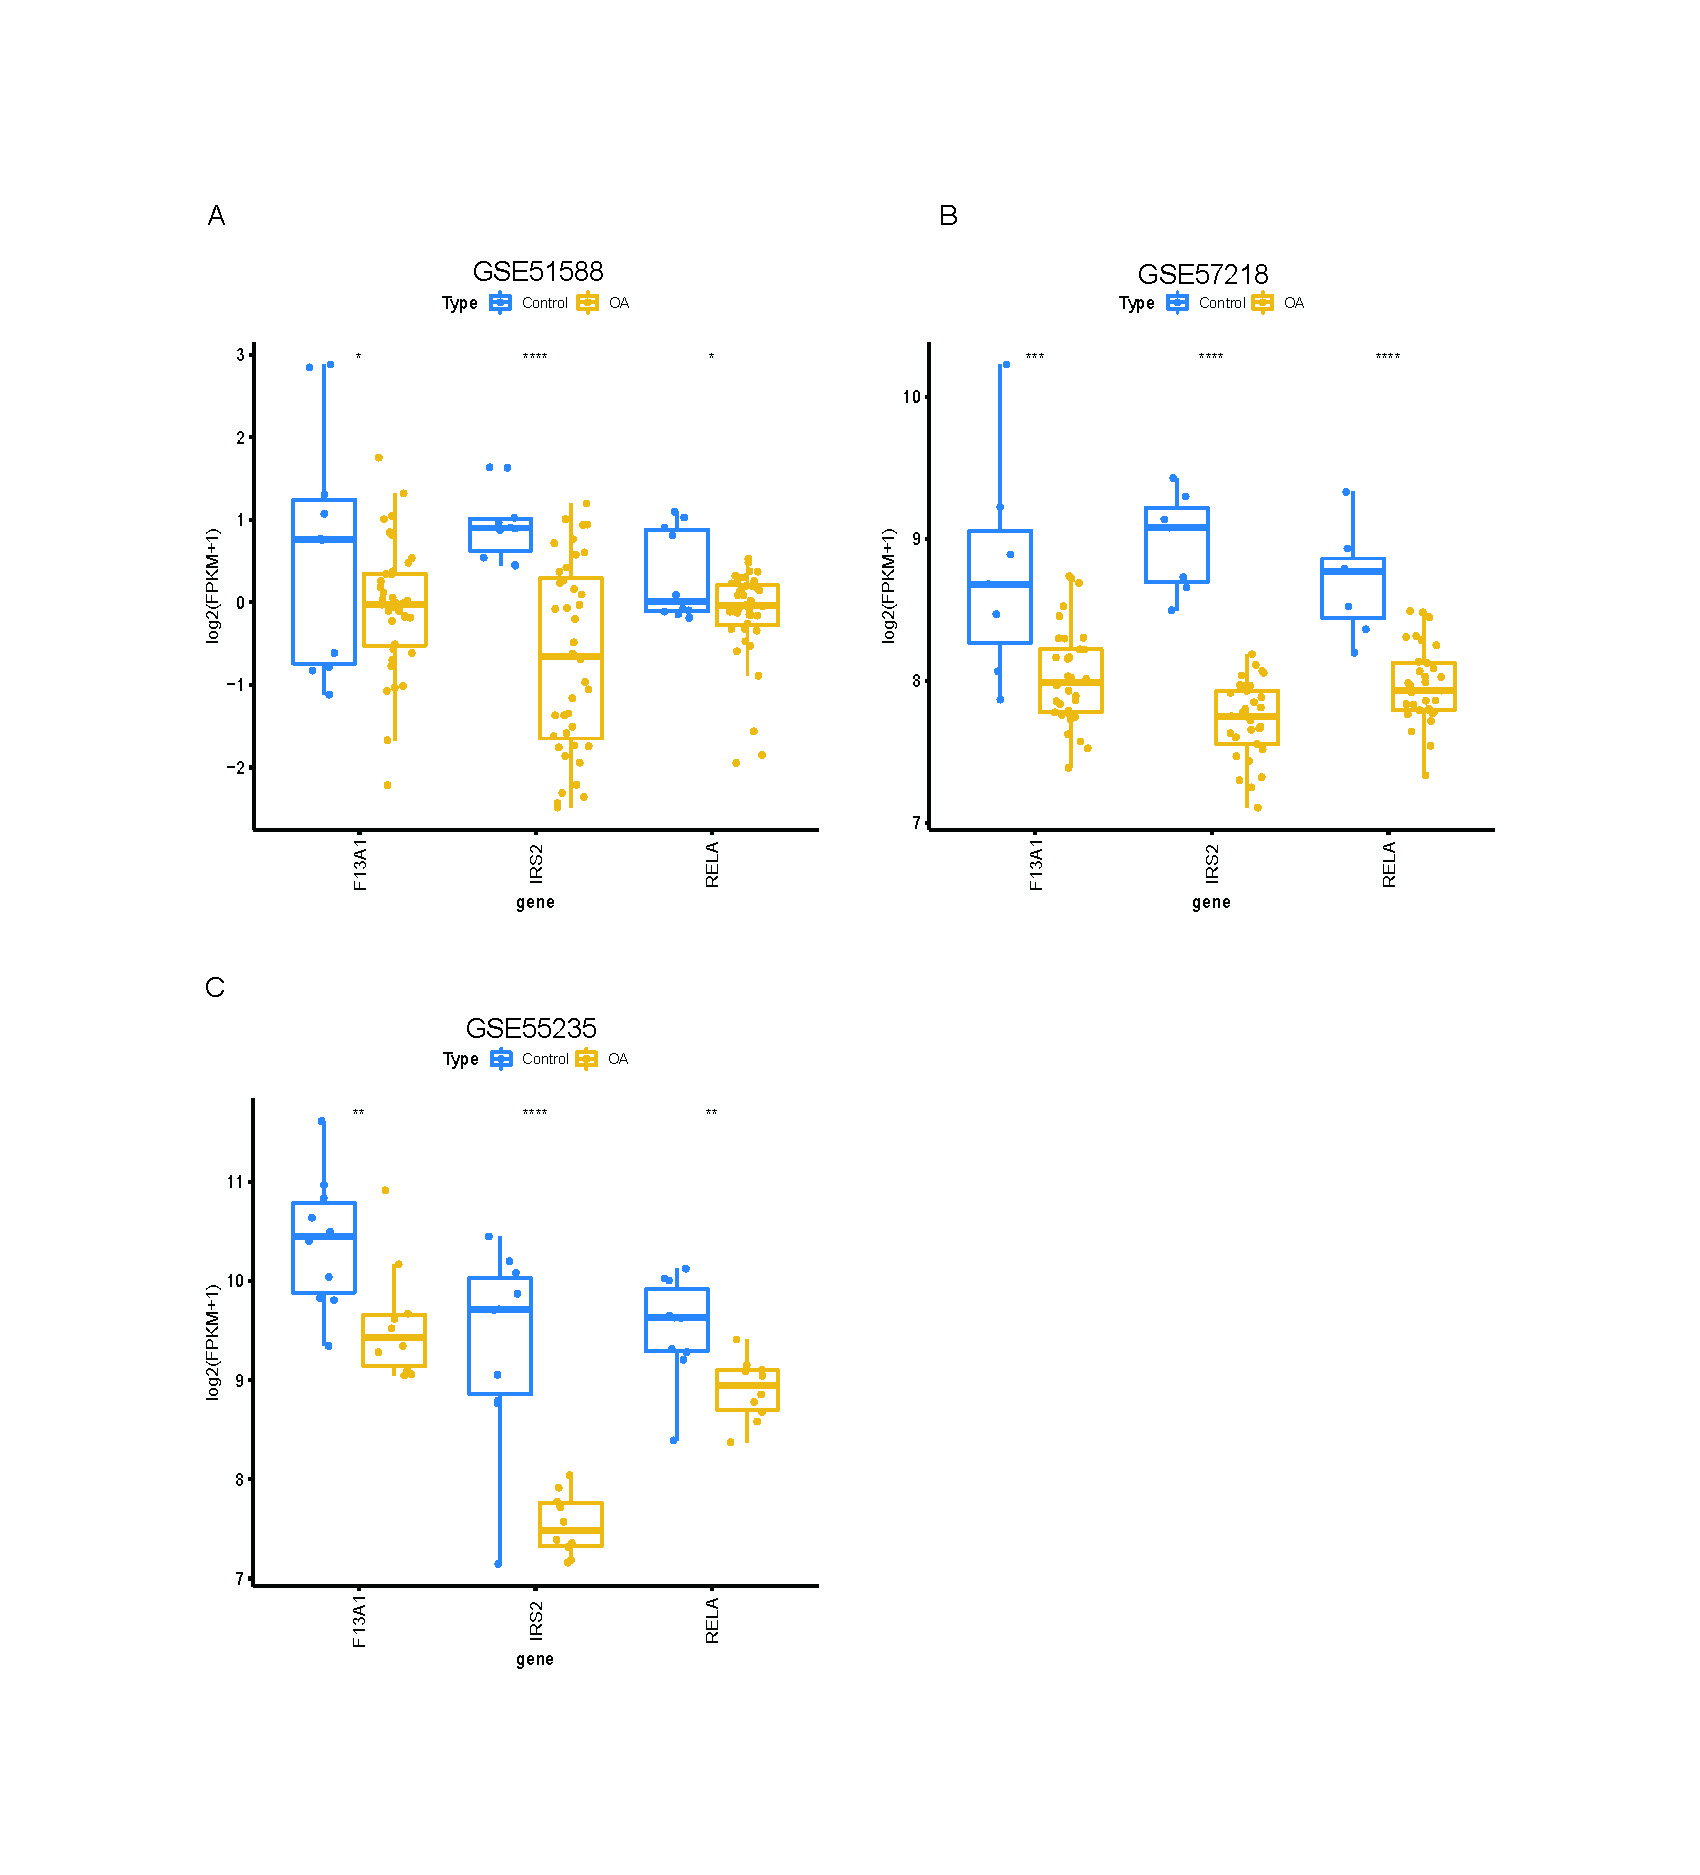
Expression validation in public datasets confirmed that F13A1, IRS2, and RELA were consistently downregulated in OA samples across the GSE57218, GSE55235, and GSE51588 datasets (all P < 0.01) (Figs. S4A, S4B and S4C). A prospective cohort of 31 OA patients and 31 age- and sex-matched healthy controls was then recruited (Table 1). Baseline characteristics (age, sex, BMI) were comparable between groups, whereas OA patients had significantly elevated inflammatory markers (ESR and CRP; both P < 0.01). RT-qPCR of PBMCs confirmed significant downregulation of the three genes in OA patients (all P < 0.01; Fig. 10A). Notably, IRS2 expression in OA patients was negatively correlated with VAS pain scores (ρ = −0.575, P < 0.001) and WOMAC functional scores (ρ = −0.603, P < 0.001) (Figs. 10B and 10C).
| Characteristic | OA Patients (n = 31) | Healthy controls (n = 31) | P-value |
|---|---|---|---|
| Age (years) | 56.5 ± 6.9 | 54.9 ± 4.9 | 0.284 |
| Sex (male/female) | 13/18 | 14/17 | 1.000 |
| BMI (kg/m²) | 25.5 ± 2.0 | 25.1 ± 1.7 | 0.452 |
| Disease duration (years) | 3.9 ± 1.9 | – | – |
| VAS score | 4.0 ± 1.0 | – | – |
| WOMAC score | 52.5 ± 12.9 | – | – |
| K-L grade (II/III/IV), n (%) | 15 (48.4)/13 (41.9)/3 (9.7) | – | – |
| ESR (mm/h) | 19.6 ± 12.9 | 10.2 ± 3.0 | <0.001 |
| CRP (mg/L) | 3.7 ± 1.9 | 0.7 ± 0.2 | <0.001 |
Note:
Values are presented as mean ± SD or counts. P-values were calculated using Student’s t-test for continuous variables and chi-square test for categorical variables. BMI, body mass index; VAS, visual analog scale; WOMAC, Western Ontario and McMaster Universities Osteoarthritis Index; K-L, Kellgren-Lawrence grade; ESR, erythrocyte sedimentation rate; CRP, C-reactive protein.
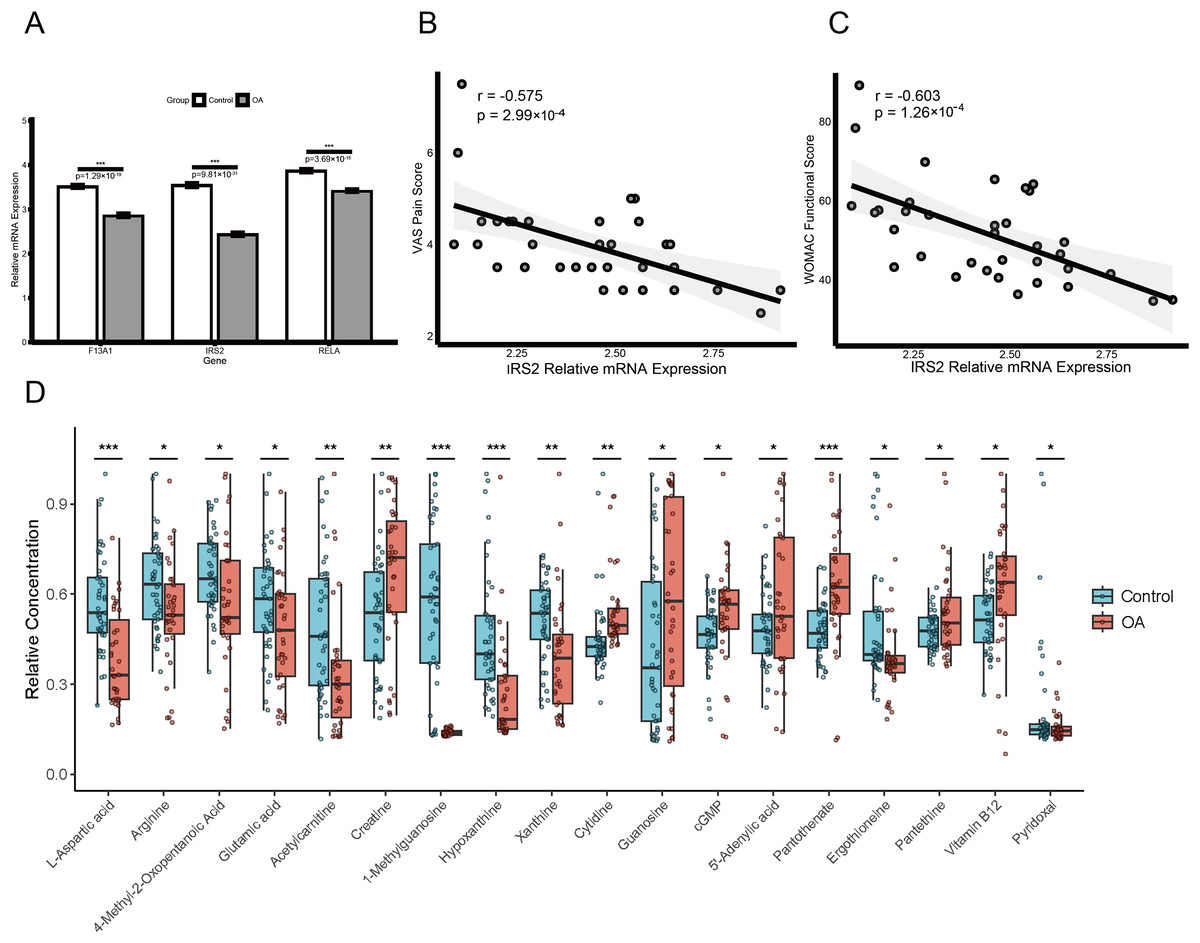
Figure 10: Diagnostic biomarker validation and metabolomic profiling reveal clinical molecular alterations in OA.
(A) RT-qPCR validation of F13A1, IRS2, and RELA expression in PBMCs from an independent clinical cohort. (B and C) Spearman correlations between IRS2 expression and clinical indices: VAS pain score (B) and WOMAC function score (C). (D) Metabolomics profiling in the same cohort showing disease-associated metabolic alterations; boxplots display relative metabolite abundance (a.u.) in OA (red) vs. healthy controls (green). Significance: *P < 0.05, **P < 0.01, ***P < 0.001.
LC-MS/MS-based metabolomics of plasma samples identified multiple metabolites with significantly altered levels in OA patients (Fig. 10D). Levels of 1-methylguanosine (−75.5%, P < 0.001), hypoxanthine (−48.1%, P < 0.001), L-aspartic acid (−35.8%, P < 0.001), acetylcarnitine (−34.8%, P < 0.001), xanthine (−23.5%, P = 0.003), and ergothioneine (−21.2%, P = 0.012) were decreased, whereas pantothenic acid (+30.9%, P < 0.001), creatine (+27.8%, P = 0.006), and proline-hydroxyproline (+69.9%, P = 0.021), as well as guanosine (+77.3%, P = 0.032) and cytidine (+29.2%, P = 0.041) were increased.
To validate the mechanistic link between the identified key genes and glutamine metabolism in a clinical context, we analyzed the correlation between gene expression (RT-qPCR) and metabolite abundance (LC-MS) in the validation cohort. This analysis revealed distinct, disease-specific alterations in the gene-metabolite regulatory network. First, RELA expression exhibited a strictly disease-specific association with 1-methylguanosine. While no correlation was observed in healthy controls (Spearman’s ρ = 0.08, P > 0.05), a significant positive correlation emerged exclusively in OA patients (Spearman’s ρ = 0.472, P = 0.007; Fig. 9C), suggesting that RELA-mediated inflammatory signaling may drive specific metabolic stress responses under pathological conditions. Second, we observed a metabolic rewiring involving IRS2 and pyridoxal. In healthy controls, IRS2 expression showed a positive trend with pyridoxal levels. Strikingly, this relationship was inverted in the OA cohort, which exhibited a significant negative correlation (Spearman’s ρ = −0.474, P = 0.007; Fig. 9C). An interaction analysis confirmed that the regulatory link between IRS2 and pyridoxal was significantly modified by the disease state (P < 0.05), suggesting a potentially disrupted metabolic axis in OA pathology.
Beyond these regulatory alterations, multivariable linear regression adjusting for age, sex, and BMI identified pyridoxal (standardized β = 0.29, 95% CI [0.06–0.51]; P = 0.014) and plasma creatine concentration (standardized β = 0.27, 95% CI [0.05–0.50]; P = 0.019) as independent predictors of OA severity. In contrast, no significant association was observed for cytidine (standardized β = 0.21, 95% CI [−0.03 to 0.44]; P = 0.081; Table S6).
Discussion
OA represents a multifactorial joint disorder pathologically driven by metabolically fueled degeneration, characterized by interconnected cartilage matrix catabolism, maladaptive subchondral remodeling, and pro-inflammatory synovitis (Yunus, Nordin & Kamal, 2020). Although previous studies have established multiple genetic risk loci through large-scale genome-wide association studies and identified potential therapeutic targets (McDonald et al., 2022), the heterogeneity of clinical phenotypes and variability in treatment responses suggest that additional pathogenic mechanisms remain to be elucidated. In this context, this study employed systematic multi-omics approaches, integrating transcriptomics, methylomics, and metabolomics data to systematically investigate the potential role of glutamine metabolism in OA pathophysiological processes. We successfully screened and validated three core diagnostic genes related to glutamine metabolism—F13A1, IRS2, and RELA, which may provide new reference bases for early diagnosis, prognostic assessment, and development of metabolic-targeted therapeutic strategies for OA.
The main findings of this study revealed systematic reprogramming phenomena of glutamine metabolic networks in OA. These three core genes all showed significant downregulation in OA patients, revealing coordinated dysregulation of glutamine metabolic networks that previous single-gene studies failed to capture. Previous research, such as studies by Welhaven et al. (2024) and Wang et al. (2023), respectively reported metabolic biomarkers in cartilage or blood of OA patients, but focused predominantly on single-omics data or specific metabolic pathways. Although Zhou et al. (2025) latest genome-wide association study identified new OA susceptibility genes, it lacked associative analysis with metabolic networks. Compared to these studies, our research integrated transcriptomics, epigenomics, and metabolomics data, not only validating the central role of glutamine metabolism in OA but more importantly revealing its regulatory molecular mechanisms and clinical translational value.
The downregulation of F13A1 (coagulation factor XIII A chain) expression and hypermethylation patterns in its promoter region provide a novel molecular mechanism for understanding extracellular matrix homeostasis imbalance in OA. F13A1 is biologically classified as a transglutaminase, an enzyme that functionally utilizes glutamine residues to catalyze protein cross-linking (Muszbek et al., 2011). Its downregulation in OA directly implies a deficit in glutamine-dependent ECM stabilization processes (Myneni, Mousa & Kaartinen, 2016), which may weaken the mechanical strength of cartilage matrix (Awan et al., 2025). More importantly, our single-gene GSEA analysis showed that F13A1 is mainly enriched in collagen metabolism and ECM remodeling pathways, which is highly consistent with recent findings by Soltani et al. (2025) regarding F13A1’s role in maintaining matrix stability in inflammatory microenvironments. Combined with our methylation data, this suggests that epigenetic modifications may be upstream regulatory mechanisms of ECM degradation in OA, providing a theoretical foundation for developing epigenetic therapeutic strategies.
The downregulation of IRS2 expression in OA and its negative correlation with disease severity reveals the crucial role of insulin signaling pathways in OA metabolic reprogramming. As a key adaptor protein connecting insulin signaling with cellular energy metabolism, IRS2 functional defects may lead to reduced sensitivity of chondrocytes to nutritional signals, thereby affecting the metabolic utilization of amino acids such as glutamine (Manohar et al., 2020). This finding is consistent with Liu et al. (2020) report on insulin resistance phenomena in OA chondrocytes, and also explains the epidemiological observation that diabetic patients are more prone to developing OA (El-Bidawy et al., 2021). However, beyond these general associations, our study uncovered a striking “regulatory reversal” between IRS2 and pyridoxal: while positively correlated in health, this relationship became significantly negative in OA. This suggests that the physiological coupling between insulin signaling and vitamin B6 (pyridoxal) metabolism may be altered under pathological conditions, offering a potential explanation for the metabolic inflexibility observed in OA.
The downregulation of RELA (NF-κB p65 subunit) expression in OA patients initially appears contradictory to the classical pro-inflammatory role of the NF-κB pathway (Feng & Wu, 2022). However, this finding likely reflects complex regulatory mechanisms inherent to chronic inflammatory states. Recent studies indicate that under sustained low-grade inflammatory stimulation, the NF-κB pathway may undergo adaptive changes, including negative feedback regulation and tolerance phenomena (Catheline et al., 2021). Specifically, the suppression of certain pro-inflammatory transcription factors in late-stage OA has been proposed as a protective mechanism to limit excessive tissue damage (Malakootian, Gholipour & Oveisee, 2023). Crucially, RELA-driven inflammation is known to reprogram cellular metabolism towards glutamine dependency (glutaminolysis) to support cytokine production (Capece et al., 2022). Despite the reduction in global RELA expression, our correlation analysis revealed a disease-specific positive association between RELA and 1-methylguanosine exclusively in OA patients. This suggests that while overall expression levels are dampened, the specific metabolic regulatory connectivity of RELA is uniquely activated in the disease state. Furthermore, our ceRNA network analysis indicated that miRNAs, such as miR-126-5p and miR-9-5p, may participate in this regulatory process by targeting RELA, providing new perspectives on the complexity of inflammatory regulation in OA.
Functional enrichment analysis of these three genes revealed their synergistic patterns in OA pathophysiological processes. GO and KEGG analyses showed that F13A1, IRS2, and RELA jointly participate in core pathological processes including amino acid metabolism, energy metabolism, inflammatory response, and oxidative stress. Particularly noteworthy is the significant enrichment of the fluid shear stress and atherosclerosis pathway, highlighting the critical role of mechanical loading in OA pathology. The adipocytokine signaling pathway was also enriched, underscoring the metabolic nature of the disease. Additionally, HIF-1 and FoxO signaling pathways were identified, suggesting that glutamine metabolic dysfunction may drive disease progression by affecting these classical OA-related pathways. As an important energy substrate and antioxidant precursor, glutamine metabolic abnormalities not only affect energy supply to chondrocytes but may also disrupt cellular redox balance (Arra et al., 2022), ultimately leading to cartilage degeneration and persistent inflammatory responses.
Our metabolomics validation further supported the biological relevance of these gene-based findings. The plasma metabolic alterations observed in our study are broadly consistent with previous blood- derived OA research (Liu et al., 2025). Tootsi et al. (2020) reported serum amino acid disturbances associated with OA severity, supporting the amino acid metabolic imbalance seen here. Our finding of reduced hypoxanthine contrasts with studies reporting elevated purine metabolites in OA, which may reflect differences in disease stage or analytical platforms (Kim et al., 2022). Overall, these comparisons reinforce that systemic metabolic reprogramming is a key feature of OA pathology. The significant decrease in plasma levels of 1-methylguanosine, aspartic acid, hypoxanthine, and other metabolites in OA patients, along with elevated pantothenic acid and creatine levels, depicted a complete picture of glutamine metabolic network dysfunction. Particularly, multivariable regression identified not only plasma creatine but also pyridoxal as independent predictors of OA severity. The identification of pyridoxal as an independent correlate of OA severity, together with its altered relationship with IRS2 in OA, indicates that cofactor–metabolic interactions may be perturbed in OA pathology. This is consistent with reports by Wen et al. (2023) regarding metabolic reprogramming in OA chondrocytes (such as the shift from oxidative phosphorylation to aerobic glycolysis). Recent research by Hu et al. (2024) also confirmed the close connection between glutamine metabolism and oxidative stress in chondrocytes, providing collateral evidence for our metabolomics findings.
From a clinical translation perspective, the diagnostic model constructed based on these three genes demonstrates good clinical application potential. Across multiple independent validation sets, the model’s AUC values all exceeded 0.63, showing consistently robust diagnostic performance. Decision curve analysis further confirmed that the combined gene model has higher clinical net benefit compared to single genes. More importantly, these gene biomarkers can be obtained through peripheral blood testing, offering better convenience and early detection capability compared to traditional imaging diagnosis. This provides a scientific foundation for developing blood-based OA early screening tools, with particular value for preventive monitoring of high-risk populations.
These computational predictions suggest potential strategic directions for precision treatment of OA. Epigenetic therapy targeting F13A1 may restore its expression through demethylase inhibitors, thereby improving ECM stability (Woodard et al., 2022). Enhancement of IRS2 function can be achieved through insulin sensitizers (such as metformin) or direct metabolic modulators (Alaaeldin et al., 2021), which are already widely used clinically with good safety profiles. For RELA regulatory abnormalities, selective NF-κB modulators could be considered to restore normal inflammatory response balance. Additionally, direct glutamine metabolic interventions, such as exogenous glutamine supplementation or glutaminase inhibitor applications, may also become new therapeutic options. The diversity of these therapeutic strategies provides possibilities for individualized treatment of different OA patient subgroups.
Because the datasets integrated in this study were derived from multiple sources—including cartilage, synovium, subchondral bone, PBMCs, and serum—it is important to consider the impact of tissue heterogeneity. Despite differences in cellular composition, glutamine metabolism represents a shared metabolic axis across joint-resident and circulating cells, and previous studies have shown that amino-acid metabolic rewiring in OA often appears as coordinated changes across both local tissues and peripheral compartments. Integrating multi-tissue data therefore helps capture conserved, system-level glutamine-related signatures, although this approach may also obscure tissue-specific regulatory features, a factor that should be kept in mind when interpreting our cross-compartment findings.
However, this study also has several important limitations that need to be considered when interpreting results. First, our clinical validation sample size is relatively limited, which may restrict the generalizability of results and the statistical power for detecting smaller effect sizes. Gene expression and metabolite levels may exhibit racial and ethnic differences, therefore these findings need validation in larger-scale, multi-ethnic populations to establish broader applicability. Second, regarding the clinical application efficacy of diagnostic models, predicted drug targets, and specific mechanisms of ceRNA regulatory networks, these are currently based primarily on bioinformatics predictions and preliminary validation, requiring more in-depth in vitro and in vivo experimental studies (such as animal models and cell experiments) to elucidate their exact molecular mechanisms and clinical translation potential. Meanwhile, our analysis mainly focused on peripheral blood specimens, lacking molecular pathological change analysis of tissues such as articular cartilage and synovium. Furthermore, this study employed a cross-sectional design and could not dynamically observe longitudinal changes in these genes and metabolites during OA disease progression.
Despite inherent limitations, this study elucidates glutamine metabolic reprogramming as a central pathobiological axis in osteoarthritis, unraveling its multifaceted regulatory circuitry. These discoveries enhance mechanistic comprehension of degenerative joint processes while forging metabolite-centric strategies for diagnostic biomarker discovery and targeted therapeutic development, ultimately advancing precision management paradigms in musculoskeletal disorders.
Conclusions
This study revealed the crucial role of glutamine metabolic reprogramming in OA pathogenesis through multi-omics integrative analysis and clinical validation. We identified three core diagnostic genes—F13A1, IRS2, and RELA—and confirmed their significant downregulation in OA patient samples, which were closely associated with disease severity and glutamine metabolite levels. Functional analysis demonstrated that these three genes participate in extracellular matrix remodeling, mechanical stress response, and metabolic regulation, respectively, constituting key nodes of glutamine metabolic dysfunction in OA. Furthermore, we revealed potential ceRNA networks and epigenetic mechanisms regulating these genes. These findings provide new theoretical foundations and potential intervention strategies for molecular subtyping, early diagnosis, and metabolic-targeted therapy of OA.
Supplemental Information
Data quality control, sensitivity analyses, and genomic distribution are assessed.
(A–B) PCA plots showing sample distributions in GSE57218 and GSE55235 before (A) and after (B) ComBat batch correction. (C) Upset plot of DE-GMRGs identified using five gene-set definition strategies. (D) Upset plot showing shared DE-GMRGs under four |log 10 FC| thresholds. (E) Circular map showing chromosomal localization of F13A1, IRS2, and RELA.
The diagnostic model performance, evaluated using standard classification metrics.
(A) ROC curve in the training dataset (GSE48556). (B) Bootstrap-based forest plot (1,000 resamples) showing coefficient stability (ORs with 95% CIs). (C) Precision–recall curves (AUPRC) for validation cohorts (GSE51588, GSE55457, GSE114007, GSE29746).
Drug–gene interaction analysis is performed to identify potential therapeutic targets.
Drug–gene interaction network showing predicted therapeutic compounds (green diamonds) and their interactions with the core genes (pink ovals).
Gene expression is validated using independent GEO datasets.
Boxplots showing expression of F13A1, IRS2, and RELA in OA (yellow) and Control (blue) samples in three GEO datasets: GSE51588 (A), GSE57218 (B), and GSE55235 (C). Statistical tests: two-sided Wilcoxon rank-sum. Significance: *P < 0.05, **P < 0.01, ***P < 0.001, ****P < 0.0001.
Gene expression datasets are used in this study to support the analyses.
All datasets were obtained from the Gene Expression Omnibus (GEO) database. 1PBMCs: Peripheral Blood Mononuclear Cells. 2KOA: Knee Osteoarthritis. 3TF: Transcription Factor.
The RT-qPCR primer sequences used in this study are listed here.
F13A1, IRS2, and RELA were the target genes. B2M (Beta-2 - microglobulin) and YWHAZ (Tyrosine 3-monooxygenase/tryptophan 5- monooxygenase activation protein zeta) served as internal reference genes. All primers were synthesized by Shanghai Bioengineering Technology Service Company (Shanghai, China).
The stability of the reference genes was evaluated using the geNorm algorithm.
Lower stability values (M) indicate higher expression stability. B2M and YWHAZ were identified as the optimal normalization pair (M < 0.5).
Differentially expressed glutamine metabolism-related genes (DE-GMRGs).
The 22 DE-GMRGs were identified by intersecting the glutamine metabolism-related genes (GMRGs) with DEGs obtained separately from GSE57218 and GSE55235. The 74 DE-GMRGs were derived from a joint differential analysis performed on the merged, batch-corrected expression matrix. Notably, all 22 genes are contained within the set of 74 genes, representing a core subset identified consistently across both approaches.
Classification performance of the diagnostic model.
Includes Sensitivity, Specificity, Accuracy, PPV, and NPV for the training set and all external validation cohorts.
The correlation between metabolite levels and OA severity, assessed using Spearman analysis.
Multiple regression models were adjusted for age, sex, and BMI. β indicates standardized regression coefficients; CI indicates 95% confidence intervals. P < 0.05 was considered statistically significant.
Completed MIQE checklist for qRT-PCR experiments.
The experimental and data analysis parameters for the qRT-PCR assays performed in this study.
Glutamine Metabolism Clinical Raw Data.
Raw clinical and gene expression data for all participants. Individual data for all 35 osteoarthritis (OA) patients and 41 healthy controls (HC) included in this study. Each row represents a single participant, and the columns detail their demographic, clinical, and molecular information.
R script for multi-omics data analysis.
The main R source code used to reproduce the statistical analyses and visualizations presented in this study. The script covers data preprocessing, differential analysis, correlation analysis between clinical and metabolomics data, and generation of the main figures.