
UBE2S and HIF1α expression patterns and stratified analysis reveal prognostic value in esophageal squamous cell carcinoma
- Published
- Accepted
- Received
- Academic Editor
- Nicole Nogoy
- Subject Areas
- Biochemistry, Cell Biology, Oncology, Pathology
- Keywords
- UBE2S, HIF1α, Stratified prognostic, Esophageal squamous cell carcinoma
- Copyright
- © 2026 Ma et al.
- Licence
- This is an open access article distributed under the terms of the Creative Commons Attribution License, which permits using, remixing, and building upon the work non-commercially, as long as it is properly attributed. For attribution, the original author(s), title, publication source (PeerJ) and either DOI or URL of the article must be cited.
- Cite this article
- 2026. UBE2S and HIF1α expression patterns and stratified analysis reveal prognostic value in esophageal squamous cell carcinoma. PeerJ 14:e20694 https://doi.org/10.7717/peerj.20694
Abstract
Background
The prognostic heterogeneity of esophageal squamous cell carcinoma (ESCC) necessitates robust biomarkers. Although hypoxia-inducible factor 1α (HIF1α) is implicated in ESCC progression, its interplay with ubiquitin-conjugating enzyme E2S (UBE2S) remains uncharacterized.
Methods
We investigated UBE2S and HIF1α expression via immunohistochemistry (IHC) in a cohort of 259 ESCC patients. Transcriptomic data from The Cancer Genome Atlas (TCGA) and Gene Expression Omnibus (GEO) databases were used for validation. Prognostic value was assessed using Kaplan–Meier and multivariate Cox regression analyses. Stratified analysis was employed to identify high-risk subgroups.
Results
UBE2S and HIF1α were significantly overexpressed in ESCC tissues at both protein and mRNA levels. UBE2S expression correlated with nationality (Kazak vs. Han, p = 0.001) and vessel invasion (p = 0.020), while HIF1α associated with gender (p = 0.040) and depth of invasion (p = 0.050). Multivariate analysis identified UBE2S as an independent prognostic factor for overall survival (OS; HR = 1.685, p = 0.041). Notably, co-expression analysis revealed that patients with UBE2S-positive/HIF1α-positive tumors had the poorest prognosis.
Conclusion
In conclusion, our multi-platform data suggest that UBE2S and HIF1α may represent critical biomarkers in ESCC. Their consistent overexpression and association with adverse outcomes support their potential for improving risk stratification and lay the groundwork for exploring them as future therapeutic targets.
Introduction
Esophageal cancer ranks as the 11th most common and 6th deadliest malignancy globally (Bray et al., 2024). In China, esophageal squamous cell carcinoma (ESCC) predominates with distinct regional disparities (Yang et al., 2020). Xinjiang exhibits particularly high ESCC incidence, where the 5-year survival rate remains dismal (10–13%) (Gao et al., 2023). While surgical resection, complemented by radiotherapy and chemotherapy, is the primary treatment, tumor-node-metastasis (TNM) staging—the current prognostic benchmark—fails to predict outcomes accurately due to substantial survival heterogeneity within stages. Thus, discovering robust biomarkers for risk stratification is imperative.
Ubiquitination, a critical post-translational modification, regulates ESCC progression through diverse cellular processes, including endoplasmic reticulum homeostasis, genomic stability, epigenetic regulation, and cell fate decisions (Xia et al., 2024). Therefore, identifying ubiquitination-related biomarkers that can assess prognosis or predict treatment response is of great value for optimizing the clinical management of ESCC patients. Ubiquitination involves a cascade of enzymatic reactions facilitated by three types of enzymes: E1 (activating enzyme), E2 (conjugating enzyme), and E3 (ubiquitin ligase) (Saha et al., 2011). Among them, ubiquitin-conjugating enzyme E2S (UBE2S) is a key E2 enzyme in the ubiquitination process. Recent studies have shown that UBE2S is closely associated with tumorigenesis, prognosis, and treatment sensitivity in various human malignancies (Sheng et al., 2012). It has been confirmed that UBE2S expression is significantly upregulated in multiple malignancies, including colorectal cancer, cervical cancer, ovarian cancer, non-small cell lung cancer (NSCLC), and breast cancer (Zhang et al., 2024). However, the role of UBE2S in ESCC remains unclear. Whether UBE2S can serve as a biomarker and therapeutic target for ESCC, which signaling pathways are involved in regulating ESCC progression, which downstream target genes are modulated, and whether it contributes to ESCC chemoresistance remain to be elucidated.
Hypoxia is a common feature of the solid tumor microenvironment. Previous studies have shown that hypoxia is involved in metabolic reprogramming, cell proliferation, apoptosis, autophagy, and chemoresistance in a variety of cancers (Infantino et al., 2021). Hypoxia-inducible factors (HIFs) are the main transcriptional elements responsible for the above activities, including three α subunits (HIF1α, HIF2α, and HIF3α) and one β subunit (HIF1β). HIF1 is one of the most widely studied HIFs and is a known heterodimer composed of the cytoplasmic constituent subunit HIF1β and the cytoplasmic oxygen-sensitive regulatory subunit HIF1α. HIF1α is localized primarily in the cytoplasm and is normally degraded proteasomally by ubiquitination (Rashid et al., 2021). Activation of the phosphoinositide 3-kinase/protein kinase B/mammalian target of rapamycin (PI3K/AKT/mTOR) signaling pathway is associated with the development of various tumors, particularly ESCC. Abnormally increased p110α expression is a marker of aberrant PI3K signaling activation. Recently, there has been a close correlation between hypoxia and PI3K/AKT/mTOR signaling pathway in tumors (Zhao, Li & Liu, 2024).
In this study, we aimed to construct a risk prediction model based on ubiquitination-related genes by investigating the expression of UBE2S, HIF1α, and p110α, as well as their associations with the prognosis of ESCC patients. We further aimed to explore the potential mechanism by which UBE2S promotes the malignant phenotypes of ESCC by stabilizing HIF1α, subsequently activating the PI3K/AKT/mTOR signaling pathway, and to provide a potential therapeutic strategy for ESCC patients.
Materials andMethods
Patient and tissue samples
A retrospective cohort of 356 formalin-fixed paraffin-embedded (FFPE) esophageal squamous cell carcinoma (ESCC) specimens with matched adjacent non-tumorous tissues (collected from January 2012 to December 2021) was obtained from the Department of Pathology, First Affiliated Hospital of Xinjiang Medical University. All participants provided informed consent. The study protocol was approved by the Ethics Committee of the First Affiliated Hospital of Xinjiang Medical University (Approval No. K202207-34) and conducted in accordance with the Declaration of Helsinki. Clinical medical records were obtained, and telephone follow-ups were conducted until December 2023. Two senior pathologists reviewed all slides to confirm the pathological diagnosis. The inclusion criteria were as follows: (1) curative resection specimens of primary ESCC; (2) no history of neoadjuvant therapy; (3) complete clinicopathological records. The exclusion criteria were: (1) biopsy-only specimens; (2) non-squamous histology; (3) preoperative radiotherapy or chemotherapy; (4) metastatic or secondary esophageal tumors; (5) incomplete follow-up data. Based on these criteria, 259 specimens were included in the final analysis. For bioinformatics validation, data were obtained from The Cancer Genome Atlas (TCGA) Esophageal Carcinoma (ESCA) cohort and the Gene Expression Omnibus (GEO) dataset GSE161533. Given the limited number of normal tissue samples (n = 3) in the TCGA-ESCA cohort, RNA-seq data from normal esophageal mucosa were sourced from the Genotype-Tissue Expression (GTEx) project to construct a robust normal tissue reference. The TCGA and GTEx datasets were integrated, and batch effects were corrected using the ComBat algorithm from the sva R package prior to comparative analysis.
Immunohistochemical staining and evaluation
Immunohistochemical (IHC) staining was performed on tissue microarrays using the streptavidin-peroxidase (SP) method. The primary antibodies used were: UBE2S (rabbit polyclonal, 14115-1-AP, 1:360; Proteintech), HIF1α (rabbit monoclonal, bs-0737R, 1:400; BIOSS), and p110α (rabbit polyclonal, C73F8, 1:250; ZSGB-Bio). The IHC procedure was conducted as follows. Briefly, 4-µm FFPE sections were baked at 65 °C for 100 min, deparaffinized in xylene and rehydrated through an ethanol series. Heat-induced antigen retrieval was performed in citrate buffer (pH 6.0) at 95 °C for 20 min. Endogenous peroxidase activity was blocked with 3% H2O2 for 10 min at room temperature. Sections were then incubated with primary antibodies at 4 °C overnight, followed by incubation with an HRP-conjugated polymer secondary antibody for 30 min at room temperature. Staining was visualized with DAB chromogen, counterstained with hematoxylin, and mounted with a resin-based medium. Two senior pathologists, blinded to clinical outcomes, independently evaluated the IHC staining. Ten non-overlapping fields were selected per section under 400x magnification, and 100 cells were counted per field. A scoring system integrating staining intensity (0: negative; 1: weak; 2: moderate; 3: strong) and the percentage of positive cells (0: ≤1%; 1: 1–20%; 2: 21–50%; 3: >50%) was used. The final score was calculated by multiplying the intensity and percentage scores. A score of ≥4 was defined as positive expression. Interobserver agreement was assessed using Cohen’s kappa coefficient, with a value >0.75 indicating excellent agreement.
Statistical analysis
Statistical analyses were performed with SPSS 27.0 and R (version 4.2.2). Paired t-tests were used for normally distributed continuous variables in paired samples; the Wilcoxon rank-sum test (Mann–Whitney U) and Kruskal–Wallis test were used for non-normally distributed data in two or multiple groups, respectively. Pearson’s correlation analysis was used to assess correlations between protein expression levels. Survival analysis was performed using the Kaplan–Meier method with log-rank tests for group comparisons. Univariate Cox proportional hazards regression was used to screen prognostic variables (p < 0.1 for inclusion), followed by multivariate Cox regression (stepwise method) to identify independent prognostic factors. A two-tailed p-value <0.05 was considered statistically significant.
Results
Baseline characteristics of patients
This study included a total of 259 samples; the detailed clinical features are listed in Table 1 and Table S1. Among the samples, 91 cases (35.1%) were 60 years old or younger, while 168 cases (64.9%) were older than 60. There were 180 males (69.5%) and 79 females (30.5%). There were 135 Han cases (52.1%) and 124 Kazak cases (47.9%).
| Number(%) | HIF1α | UBE2S | |||||
|---|---|---|---|---|---|---|---|
| Negative (%) | Positive (%) | P | Negative (%) | Positive (%) | P | ||
| Gender | 0.040 | 0.917 | |||||
| Male | 180 (69.5) | 28 (84.8) | 152 (67.3) | 19 (70.4) | 161 (69.4) | ||
| Female | 79 (30.5) | 5 (15.2) | 74 (32.7) | 8 (29.6) | 71 (30.6) | ||
| Nationality | 0.766 | 0.001 | |||||
| Han | 135 (52.1) | 18 (54.5) | 117 (51.8) | 22 (81.5) | 113 (48.7) | ||
| Kazak | 124 (47.9) | 15 (45.5) | 109 (48.2) | 5 (18.5) | 119 (51.3) | ||
| Invasion depth | 0.050 | 0.580 | |||||
| Mucosa | 11 (4.2) | 4 (12.1) | 7 (3.1) | 2 (7.4) | 9 (3.9) | ||
| Muscularis | 113 (43.6) | 12 (36.4) | 101 (44.7) | 13 (48.1) | 100 (43.1) | ||
| Full thickness | 135 (52.1) | 17 (51.5) | 118 (52.5) | 12 (44.4) | 123 (53.0) | ||
| Vessel invasion | 0.608 | 0.020 | |||||
| Negative | 205 (79.2) | 25 (75.8) | 180 (79.6) | 26 (96.3) | 179 (77.2) | ||
| Positive | 54 (20.8) | 8 (24.2) | 46 (20.4) | 1 (3.7) | 53 (22.8) | ||
| UBE2S | 0.013 | ||||||
| Negative | 27 (10.4) | 8 (24.2) | 19 (8.4) | ||||
| Positive | 232 (89.6) | 25 (75.8) | 207 (91.6) | ||||
| p110α | 0.018 | 0.704 | |||||
| Negative | 28 (10.8) | 8 (24.2) | 20 (8.8) | 4 (14.8) | 24 (10.3) | ||
| Positive | 231 (89.2) | 25 (75.8) | 206 (91.2) | 23 (85.2) | 208 (89.7) | ||
Notes:
Bold values indicate a statistically significant difference (p < 0.05).
Regarding tumor location, there were 13 cases (5.0%) in the upper esophagus, 140 cases (54.1%) in the middle esophagus, and 106 cases (40.9%) in the lower esophagus. For tumor size, 180 cases (69.5%) had tumors measuring ≥3 cm, while 79 cases (30.5%) had tumors <3 cm. In terms of tumor differentiation, 64 cases (24.7%) were well differentiated, 145 cases (56.0%) were moderately differentiated, and 50 cases (19.3%) were poorly differentiated. There were 89 cases (34.4%) with lymph node metastasis and 170 cases (65.6%) without lymph node metastasis.
UBE2S and HIF1α are highly expressed in ESCC
IHC results showed that UBE2S, HIF1α, and p110α were expressed in the cytoplasm and nucleus of tumor cells. Of these cases, 232 (89.6%) were UBE2S-positive, while 27 (10.4%) were UBE2S-negative. UBE2S and HIF1α were either not expressed or only weakly expressed in the basal cells of cancer-adjacent normal mucosa. The staining intensity could be categorized as colorless, weak, moderate, or strong (Figs. 1A–1D, 1F–1I 1K–1N).
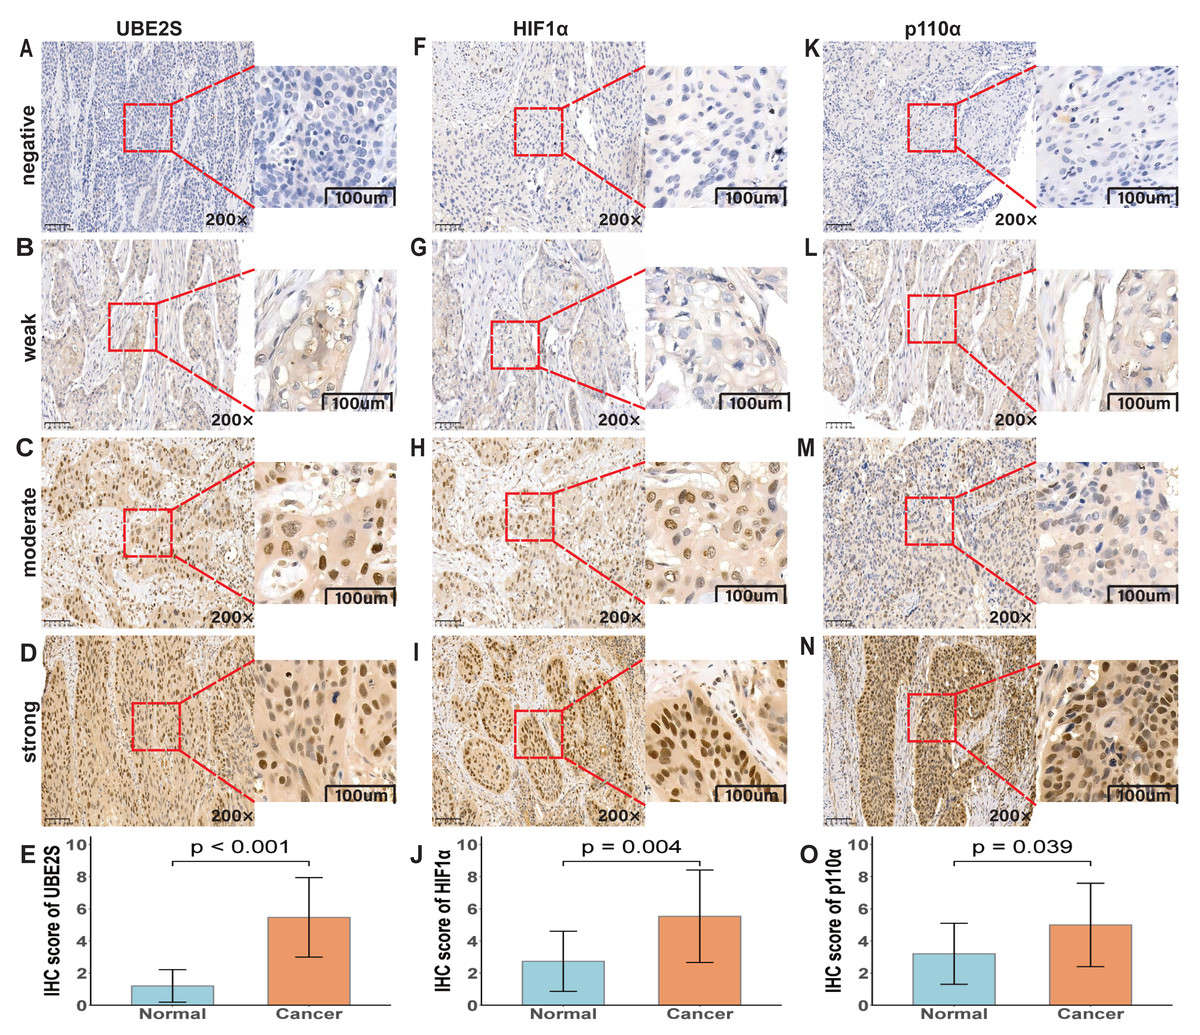
Figure 1: Immunohistochemical analysis of UBE2S, HIF1α, and p110α in ESCC.
(A–D) UBE2S staining intensities: negative, weak, moderate, strong. (E) UBE2S IHC scores (p < 0.001). (F–I) HIF1α staining intensities: negative, weak, moderate, strong. (J) HIF1α IHC scores (p = 0.004). (K–N) p110α staining intensities: negative, weak, moderate, strong. (O) p110α IHC scores (p = 0.039). All micrographs shown at ×200 magnification.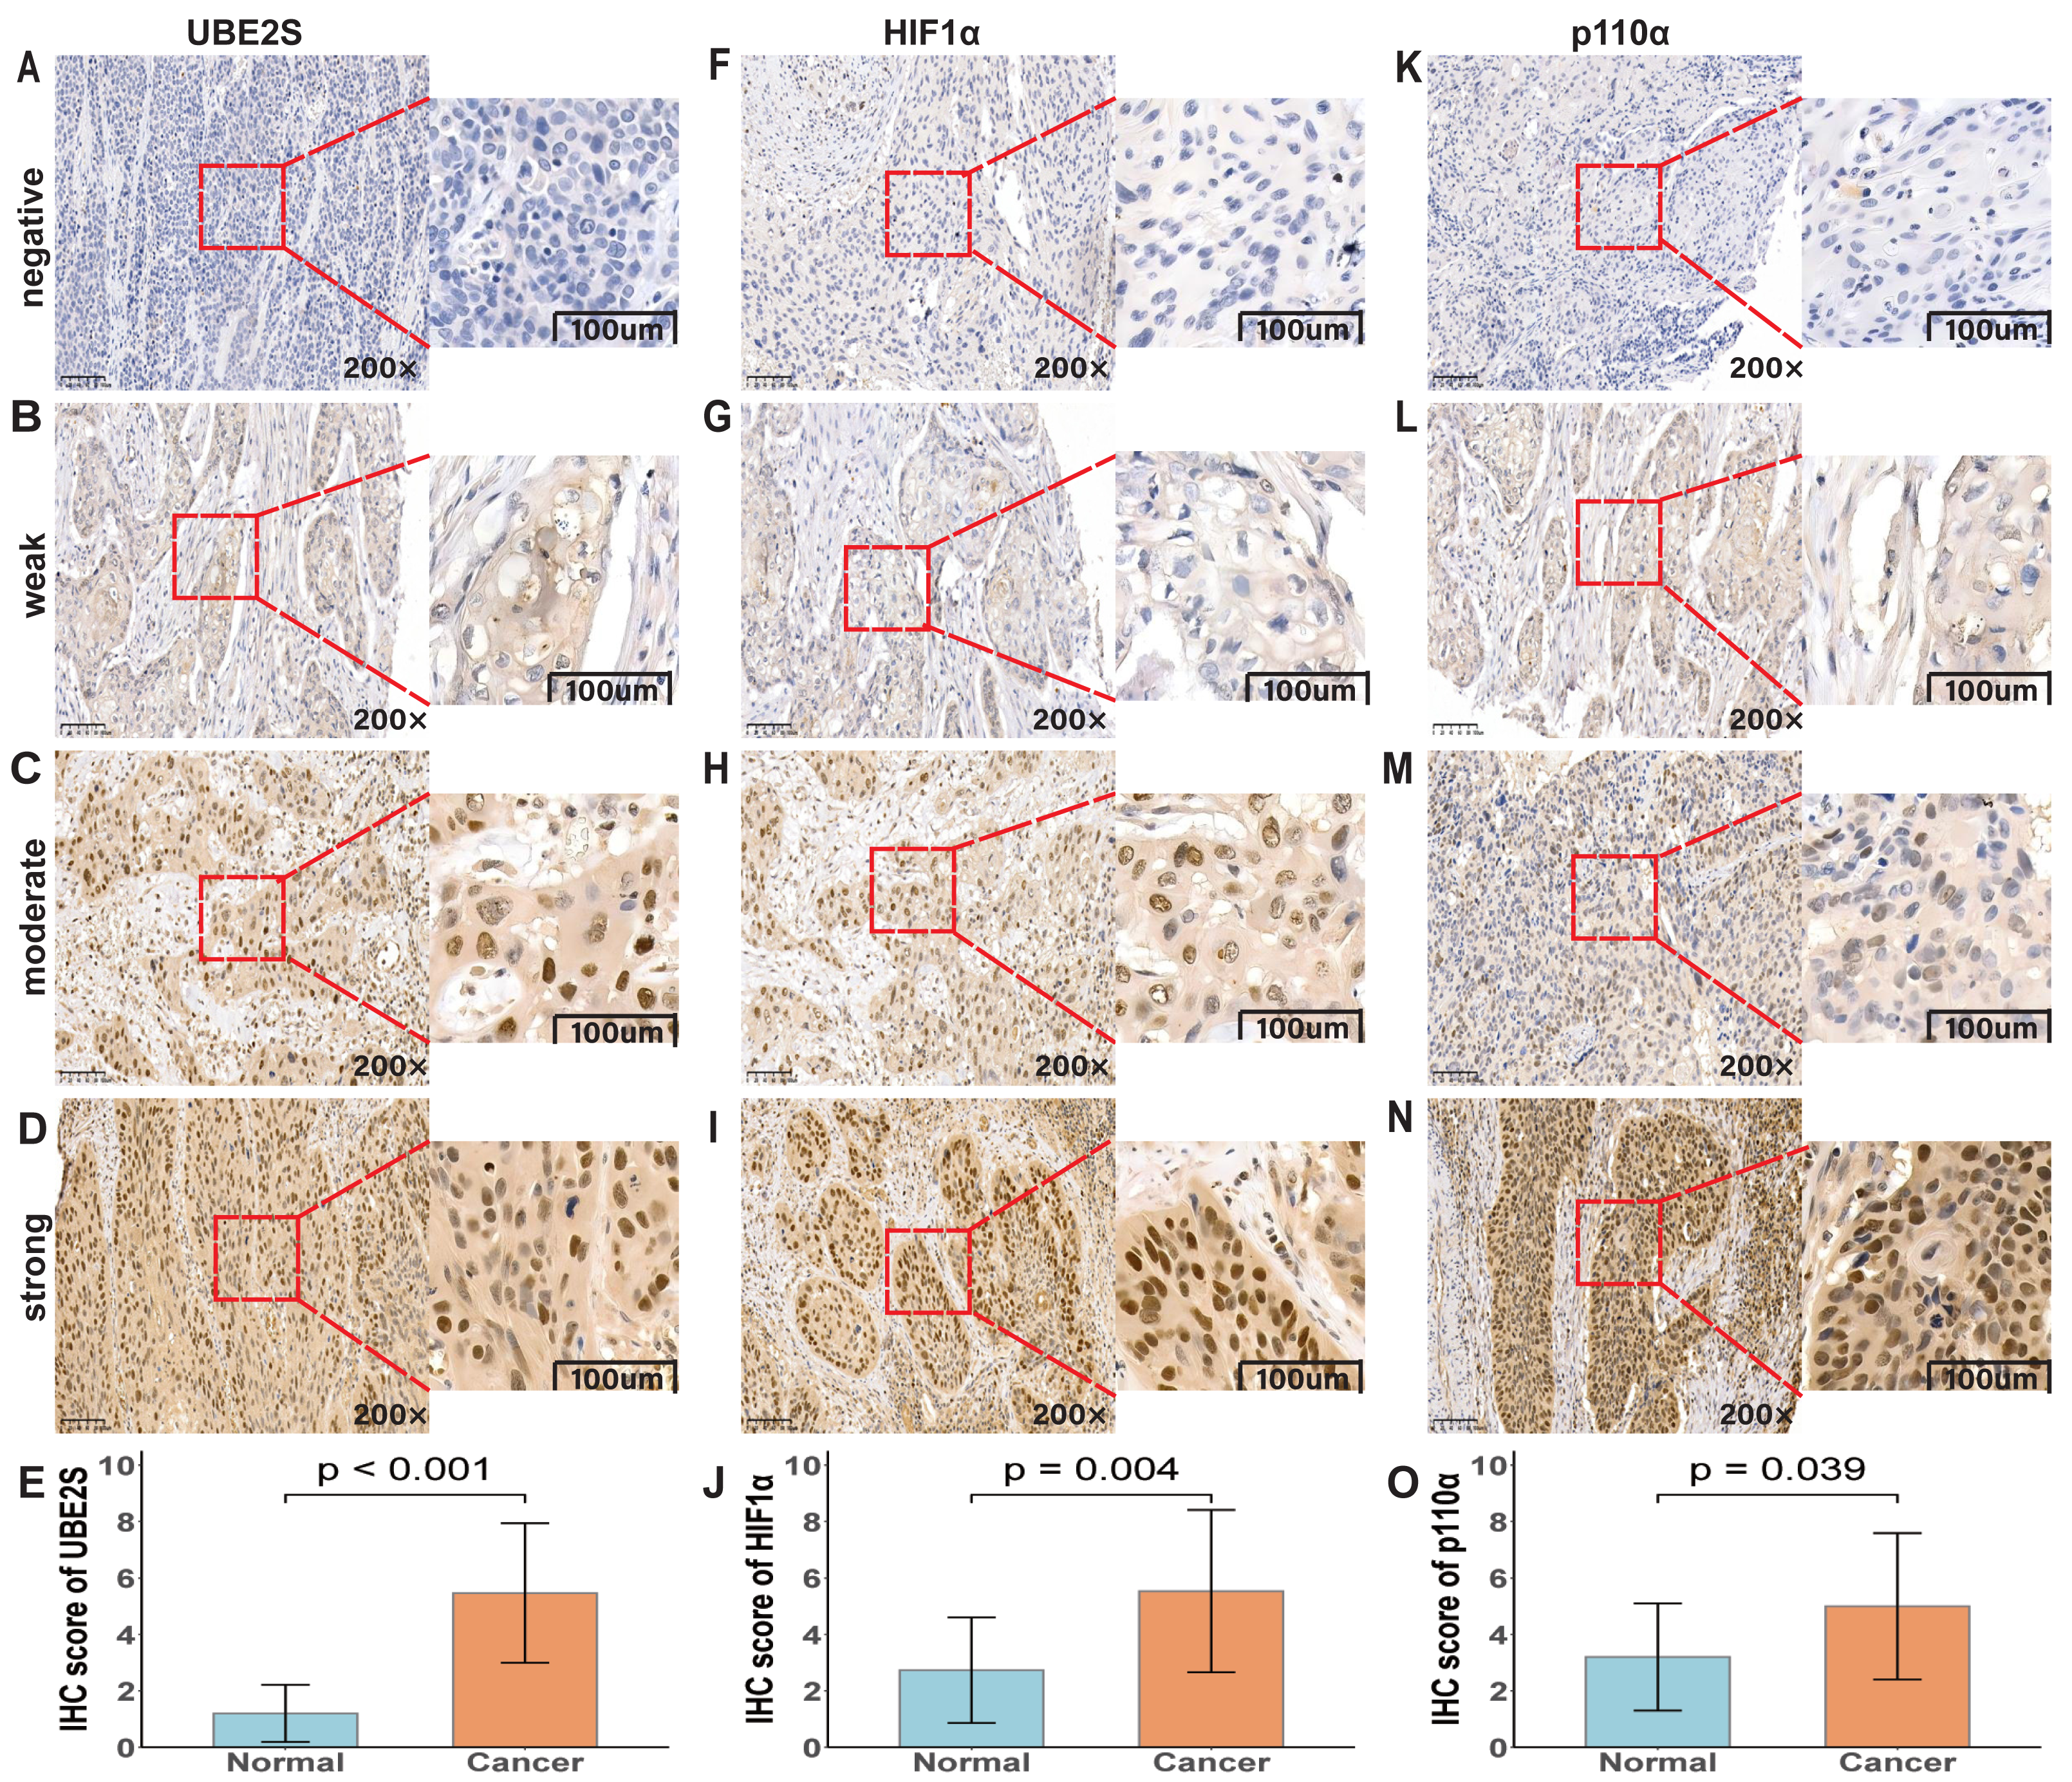
In addition, UBE2S was found to be co-expressed at the sites where HIF1α was expressed, suggesting that there may be an interaction between UBE2S and HIF1α. According to our established IHC scoring system, histograms demonstrated that IHC scores for UBE2S, HIF1α, and p110α were significantly higher in cancer tissues than in normal tissues (Figs. 1E, 1J, 1O; p < 0.001, p = 0.004, p = 0.039).
The positive rates of UBE2S and HIF1α in ESCC tissues were 89.6% (232/259) and 87.2% (226/259), respectively-much higher than those in normal esophageal mucosa (15.7%, 31/198; 9.7%, 18/186). These results indicated that the expression levels of UBE2S and HIF1α in ESCC were significantly higher than those in normal tissues.
Relationship between UBE2S/HIF1α/p110α expression and clinicopathological features
The associations between the expression of UBE2S, HIF1α, and p110α and clinicopathological features are summarized in Table 1 and Table S1. HIF1α expression showed a significant correlation with patient gender (p = 0.040), with a higher positive rate observed in male compared to female patients. Similarly, the positive rate of UBE2S was significantly higher in Kazak than in Han patients (p = 0.001). UBE2S expression was also significantly associated with the presence of vessel invasion (p = 0.020). A trend toward significance was noted for the correlation between HIF1α expression and depth of invasion (p = 0.050). Furthermore, a significant positive correlation was found between UBE2S and HIF1α expression (p = 0.013). We further assessed the clinical relevance of p110α. Analysis revealed no significant associations between p110α expression and standard clinicopathological parameters (Table S2). Notably, however, its correlations with UBE2S and HIF1α revealed a divergent pattern: a statistically significant positive correlation was observed with HIF1α (p = 0.018), whereas the correlation with UBE2S was not significant. This specific correlation pattern may suggest a closer functional relationship between HIF1α and p110α under the present conditions.
UBE2S as an independent prognostic factor for OS
To evaluate the impact of UBE2S and HIF1α expression on patient survival, we performed univariate and multivariate Cox proportional hazards analyses on 259 ESCC samples. Univariate analysis identified UBE2S expression, nationality, lymph node metastasis, infiltration depth, American Joint Committee on Cancer (AJCC) stage, and nerve invasion as factors significantly associated with overall survival (OS) (Fig. 2A). Subsequent multivariate analysis confirmed that UBE2S expression, nationality, lymph node metastasis, and nerve invasion remained independently associated with OS (Fig. 2B). For progression-free survival (PFS), univariate analysis showed significant associations for UBE2S expression, nationality, lymph node metastasis, AJCC stage, and nerve invasion (Fig. 2C). In the multivariate model, however, only nationality retained a significant independent correlation with PFS (Fig. 2D). Collectively, these results indicate that UBE2S expression serves as an independent prognostic factor for OS in ESCC patients.
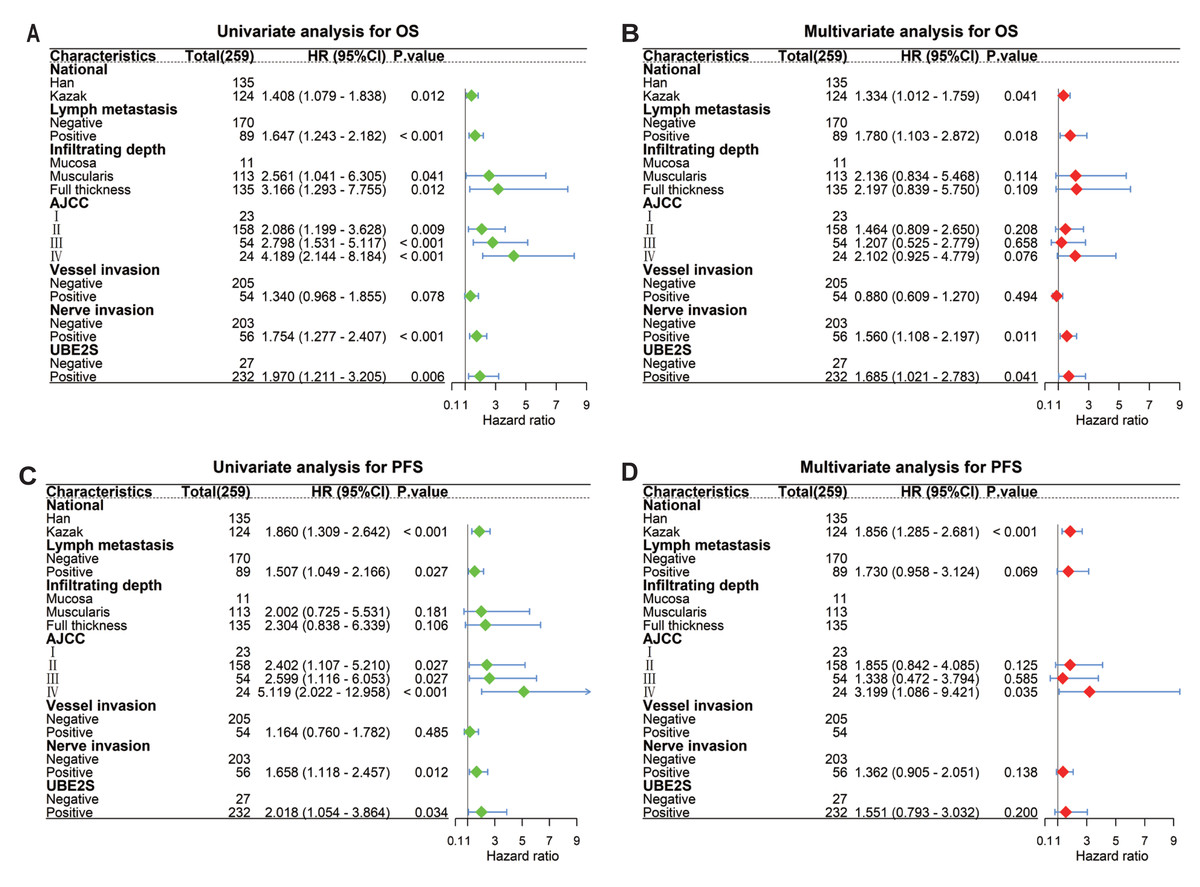
Figure 2: UBE2S is an independent prognostic factor for survival in patients with esophageal squamous cell carcinoma.
Forest plots show the results of univariate and multivariate Cox proportional hazards regression analyses for (A) overall survival (OS) and (C) progression-free survival (PFS). Multivariate analysis identified UBE2S expression as an independent prognostic factor for (B) OS (p = 0.041), whereas it was not significant for (D) PFS (p = 0.200).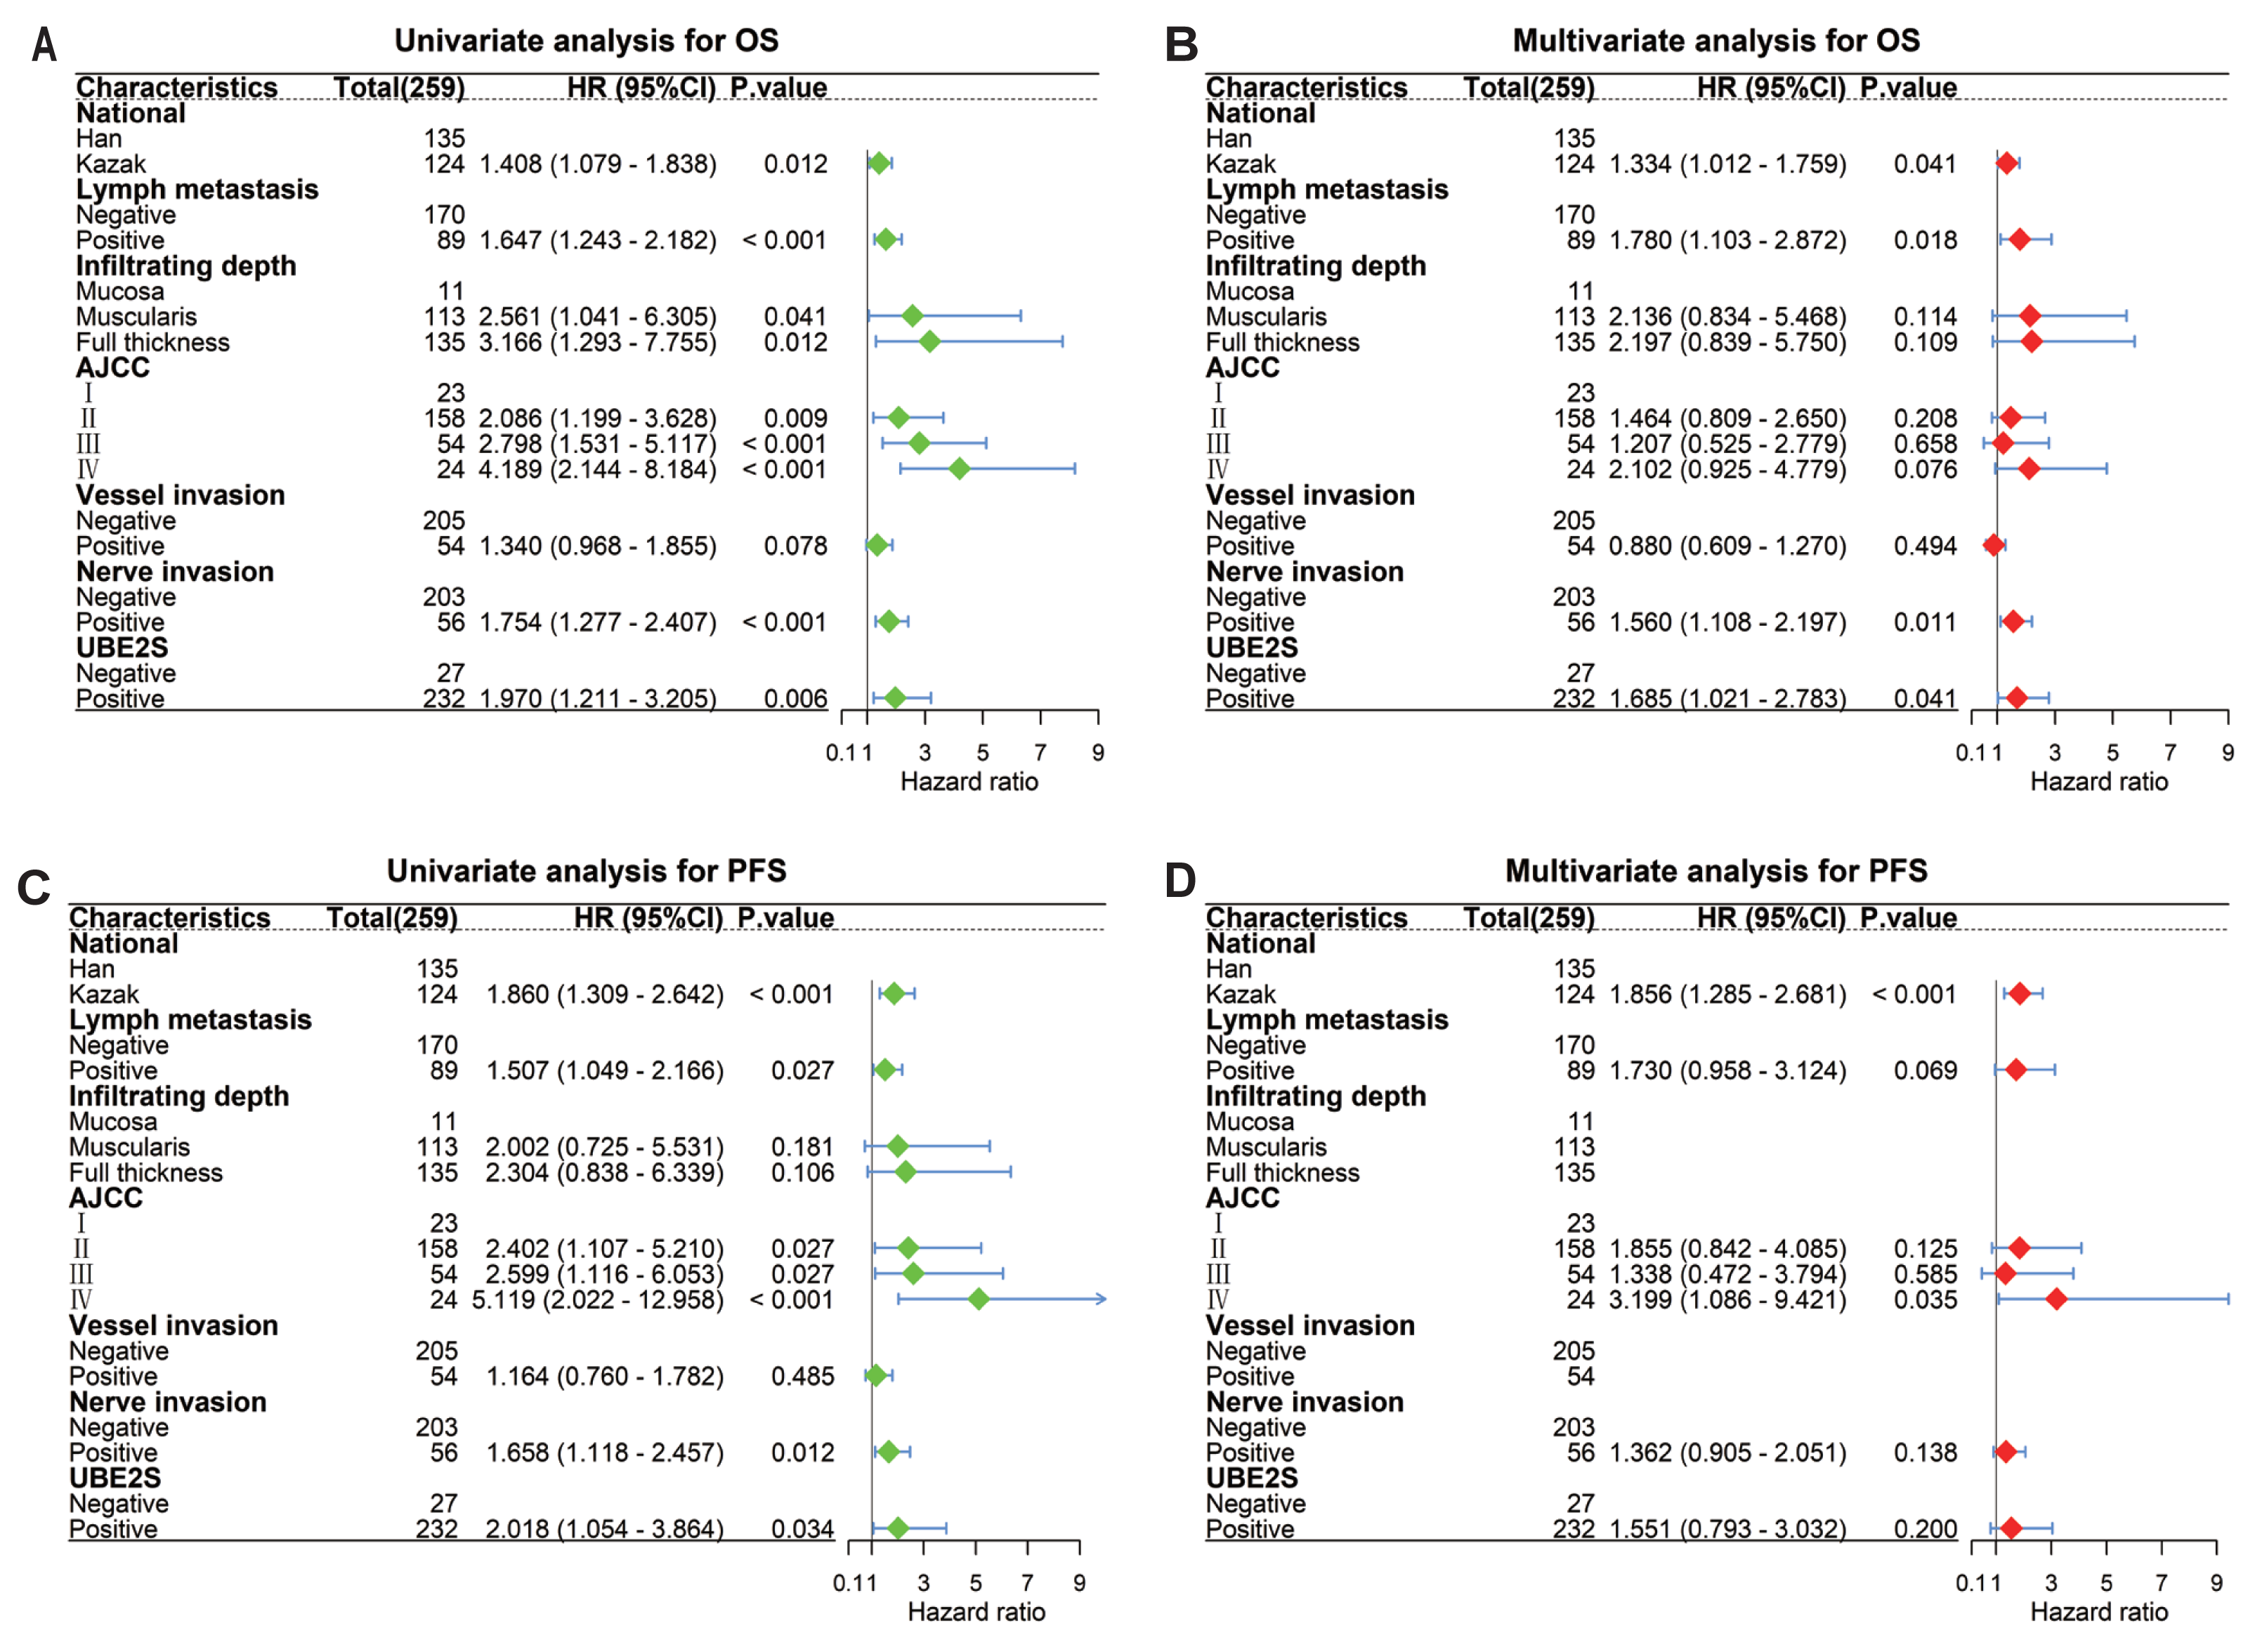
Bioinformatics analysis reveals elevated expression and co-expression of UBE2S and HIF1α in esophageal carcinoma
Initial pan-cancer analysis of TCGA data indicated that UBE2S and HIF1α were significantly overexpressed in multiple malignancies, including ESCA (Figs. 3A, 3B). To further explore this observation, we examined their expression in a larger ESCC cohort. Given the limited number of normal tissue samples (n = 3) in the TCGA-ESCA dataset, we integrated RNA-seq data from the Genotype-Tissue Expression (GTEx) project to establish a more robust normal tissue reference. After batch effect correction and normalization of the combined dataset, comparative analysis confirmed significantly elevated mRNA expression of both UBE2S and HIF1α in tumor tissues compared to the pooled normal controls (Figs. 3C, 3D; p < 0.001). For independent validation, we examined the GEO dataset GSE161533. Analysis of this cohort revealed that UBE2S expression was significantly higher in ESCC tissues relative to paired adjacent non-tumorous tissues (Fig. 3E; p < 0.001). Similarly, HIF1α expression was also significantly elevated in tumors compared to matched normal controls within the same dataset (Fig. 3F; p < 0.001). Furthermore, correlation analysis within the TCGA-ESCA cohort revealed a significant positive correlation between UBE2S and HIF1α mRNA expression levels (Fig. 3G; R = 0.42, p = 0.0013). Collectively, these cross-platform bioinformatics analyses support the notion that UBE2S and HIF1α are consistently overexpressed in esophageal carcinoma. The observed weak-to-moderate positive correlation between their expression levels may point to a potential functional interplay in ESCC, providing preliminary evidence for further mechanistic investigation.
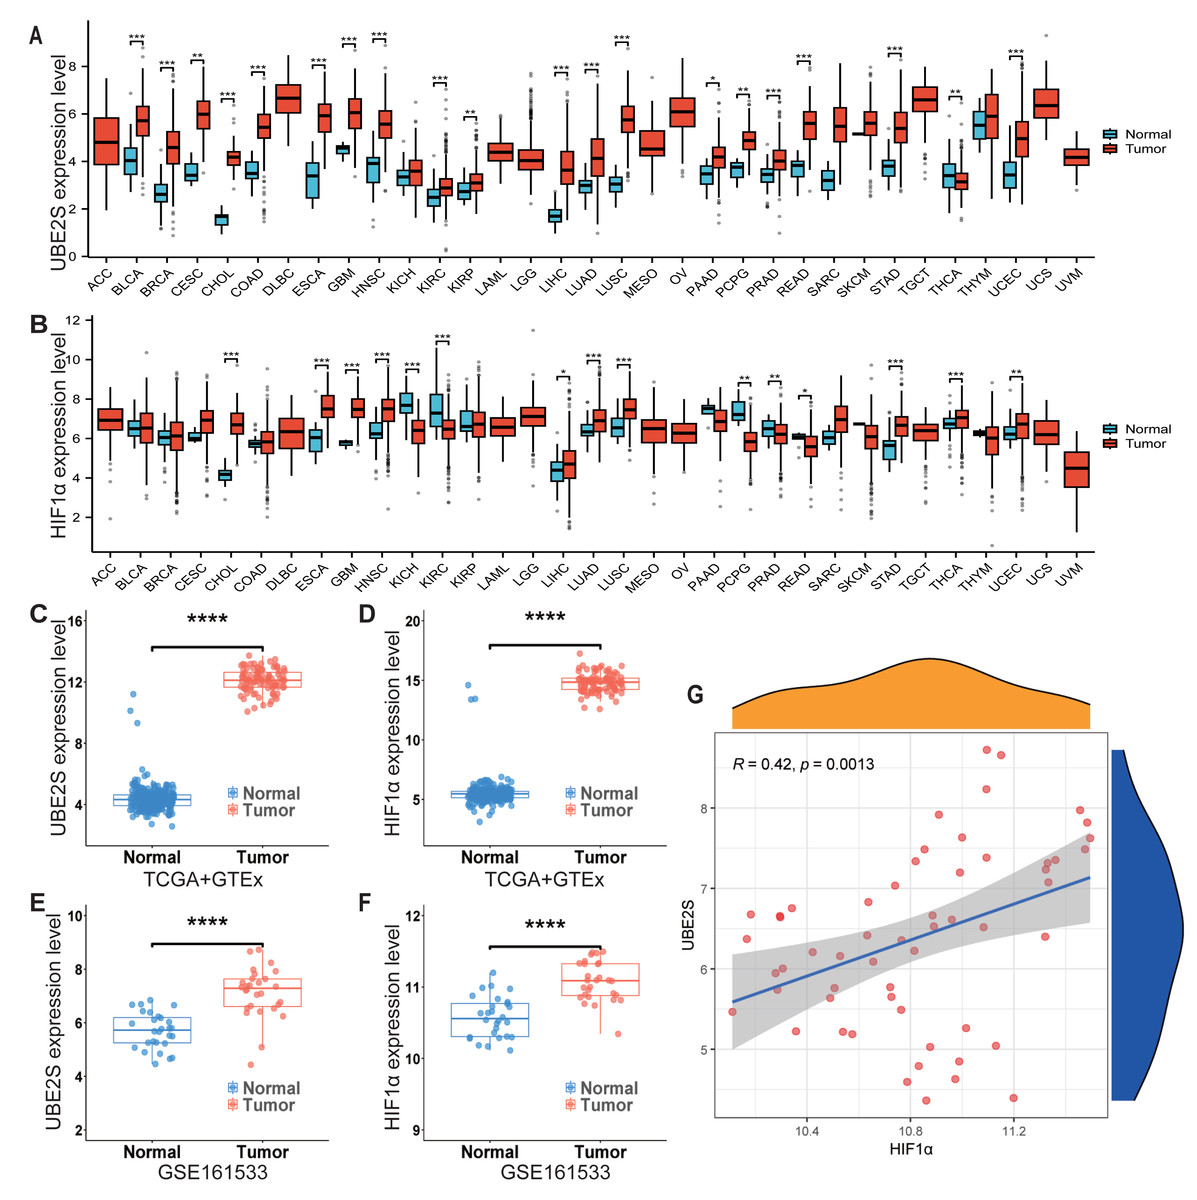
Figure 3: Bioinformatic validation of UBE2S and HIF1α overexpression and co-expression in esophageal carcinoma.
(A, B) Pan-cancer mRNA expression analysis of UBE2S (A) and HIF1α (B) across TCGA malignancies, indicating significant overexpression in ESCA. (C, D) Validation of UBE2S (C) and HIF1α (D) mRNA overexpression in the TCGA-ESCA tumor cohort compared to a pooled normal tissue reference (integrating GTEx data; p < 0.001, Wilcoxon rank-sum test). (E, F) Independent validation in the GEO dataset (GSE161533) confirms significant overexpression of UBE2S (E) and HIF1α (F) in ESCC tissues compared to paired adjacent non-tumorous tissues (p < 0.001). (G) Correlation analysis within the TCGA-ESCA cohort reveals a significant positive correlation between UBE2S and HIF1α mRNA expression levels (Pearson’s correlation; R = 0.42, p = 0.0013).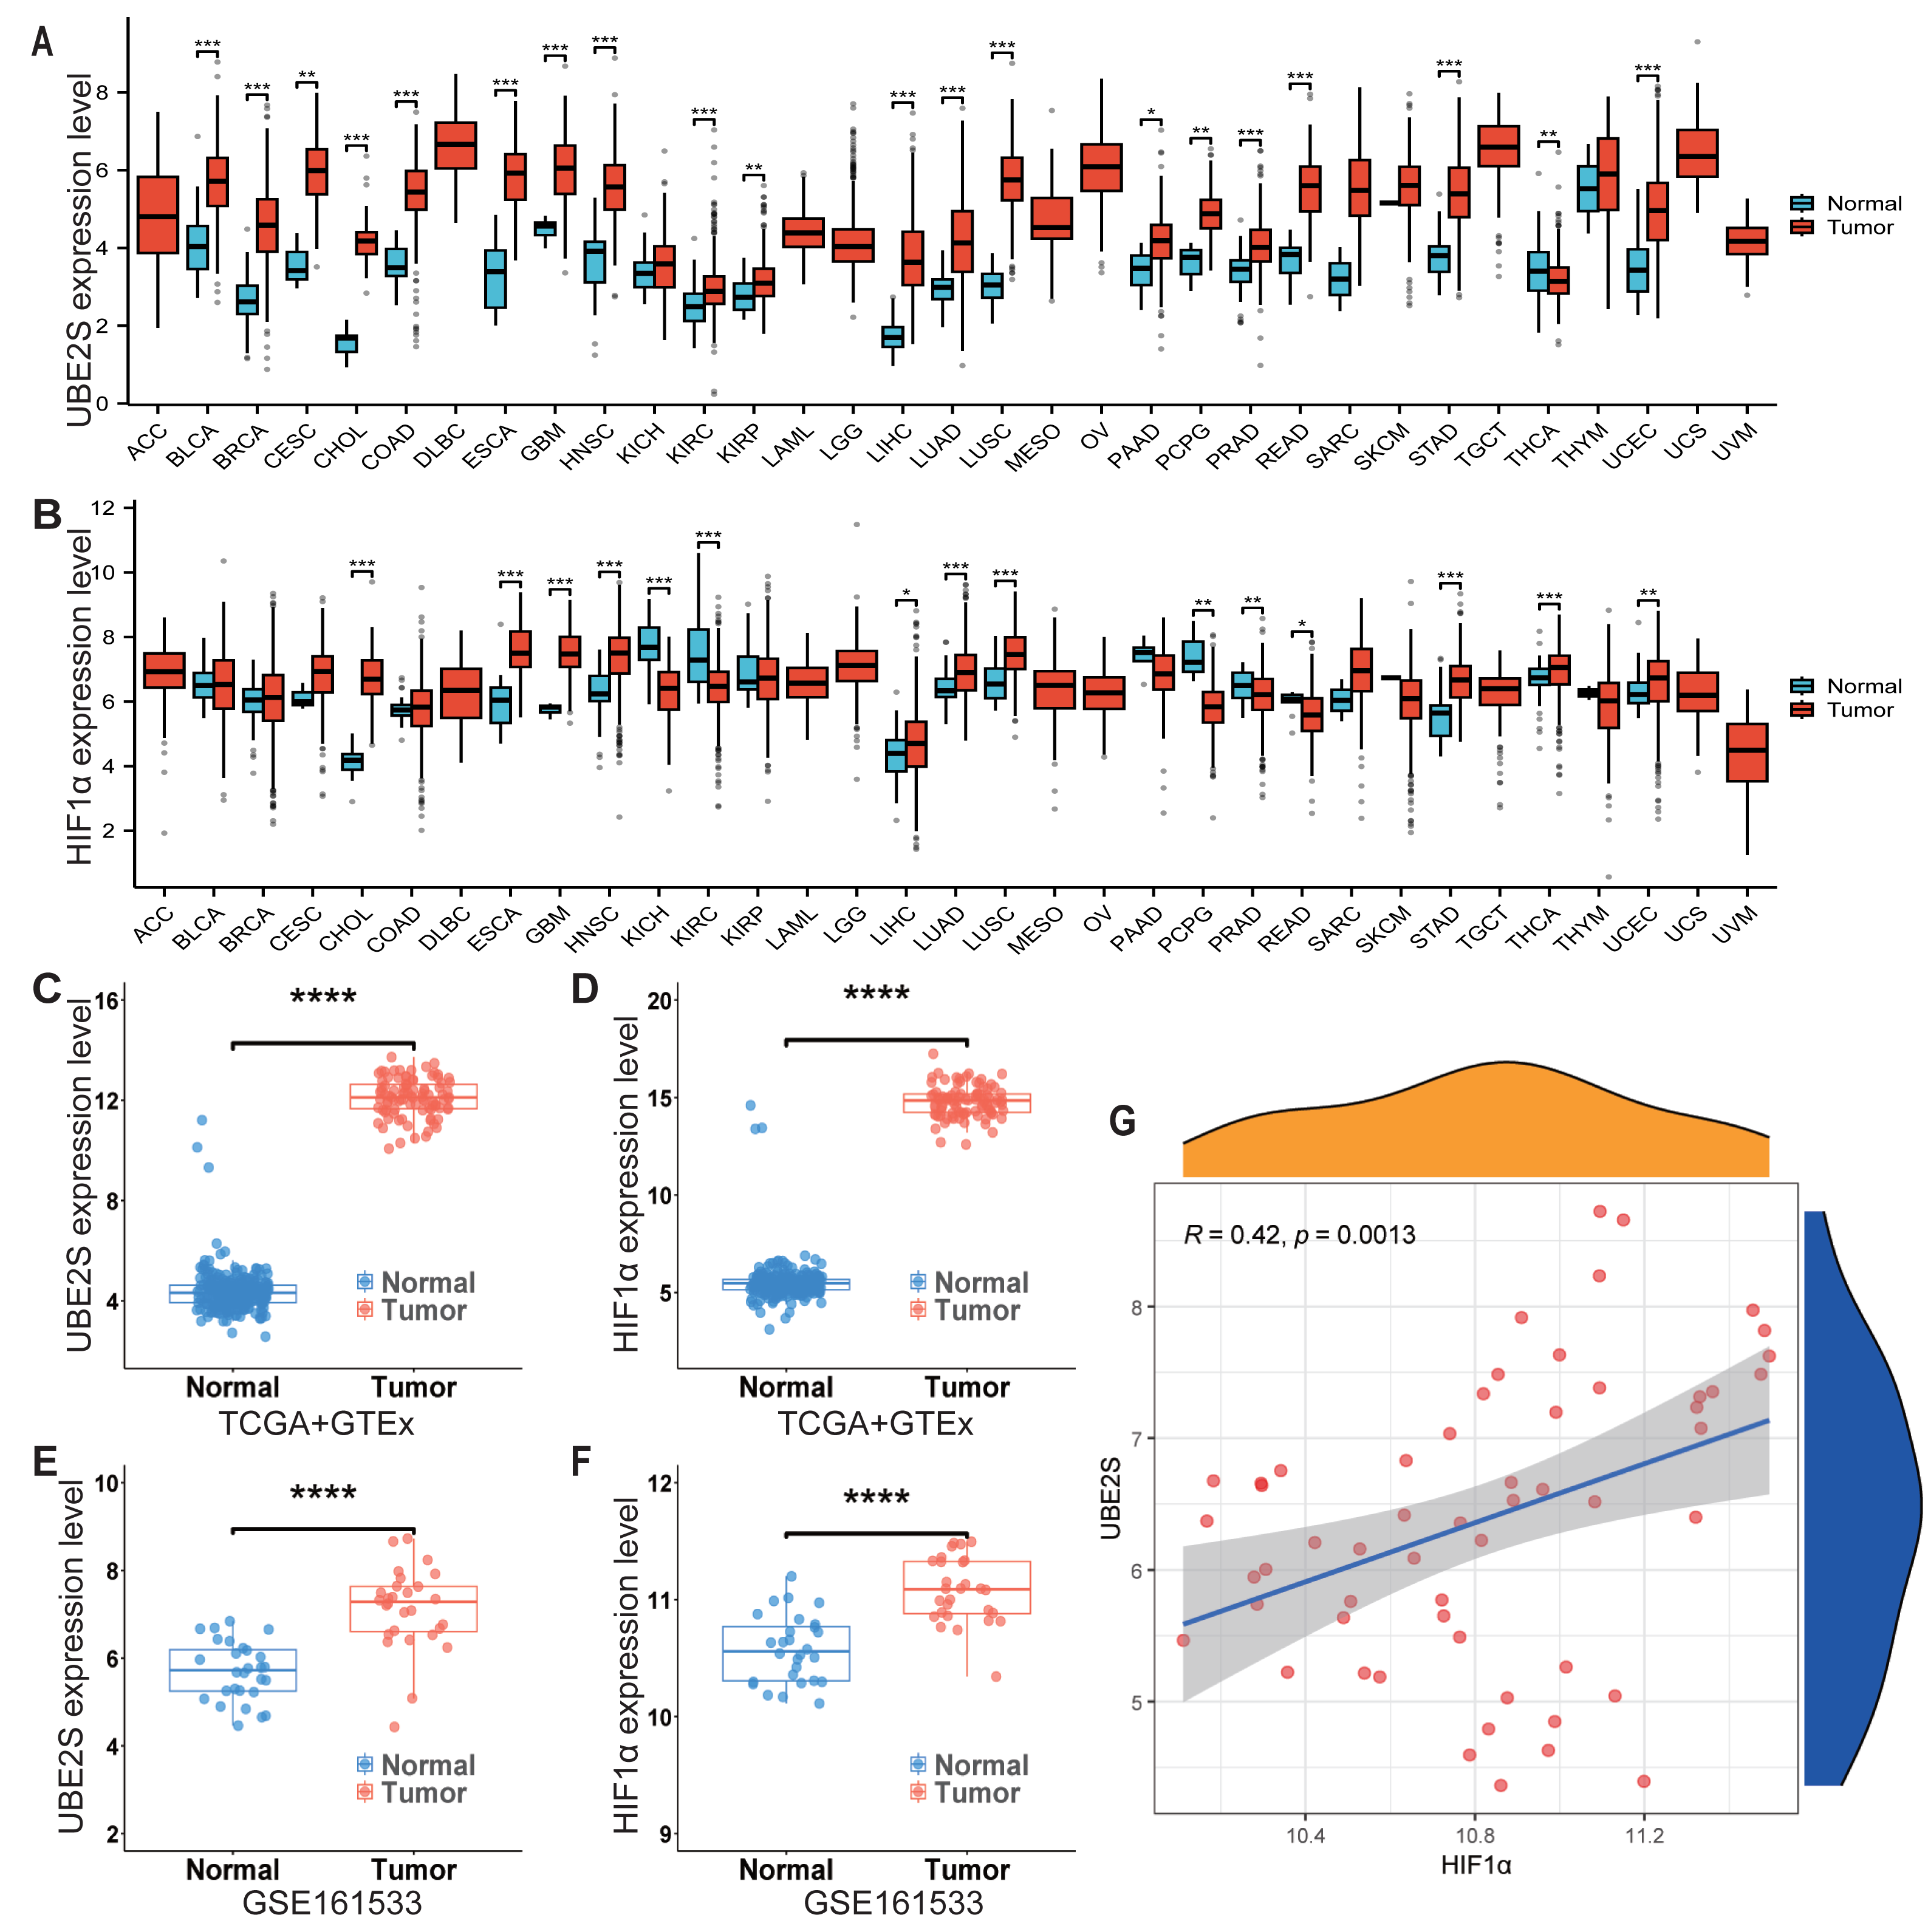
Prognostic impact of UBE2S and HIF1α expression and their synergistic effect
Having established the association between protein expression and clinicopathological features, we next evaluated the prognostic impact of UBE2S and HIF1α. Survival analysis was performed by categorizing patients based on UBE2S and HIF1α IHC expression scores. High expression of UBE2S was significantly associated with poorer overall survival (OS; p = 0.006) and progression-free survival (PFS; p = 0.034) (Figs. 4A–4B). Similarly, high expression of HIF1α was associated with reduced OS (p < 0.001) and PFS (p = 0.002) (Figs. 4C–4D). Taken together, these observations may point to the potential of both UBE2S and HIF1α as biomarkers for adverse prognosis in ESCC. To further investigate the combined effect of UBE2S and HIF1α, a key focus of this study, by classifying patients into four groups based on co-expression status. Kaplan–Meier analysis revealed significant stratification of both OS (p < 0.001) and PFS (p = 0.005) among these groups (Figs. 4E–4F). Patients with dual-positive expression (Group 4) had the poorest outcomes, while those with dual-negative expression (Group 1) had the most favorable prognosis. Groups with discordant expression (Groups 2 & 3) showed intermediate survival, suggesting a potential synergistic adverse effect when both proteins are highly expressed.
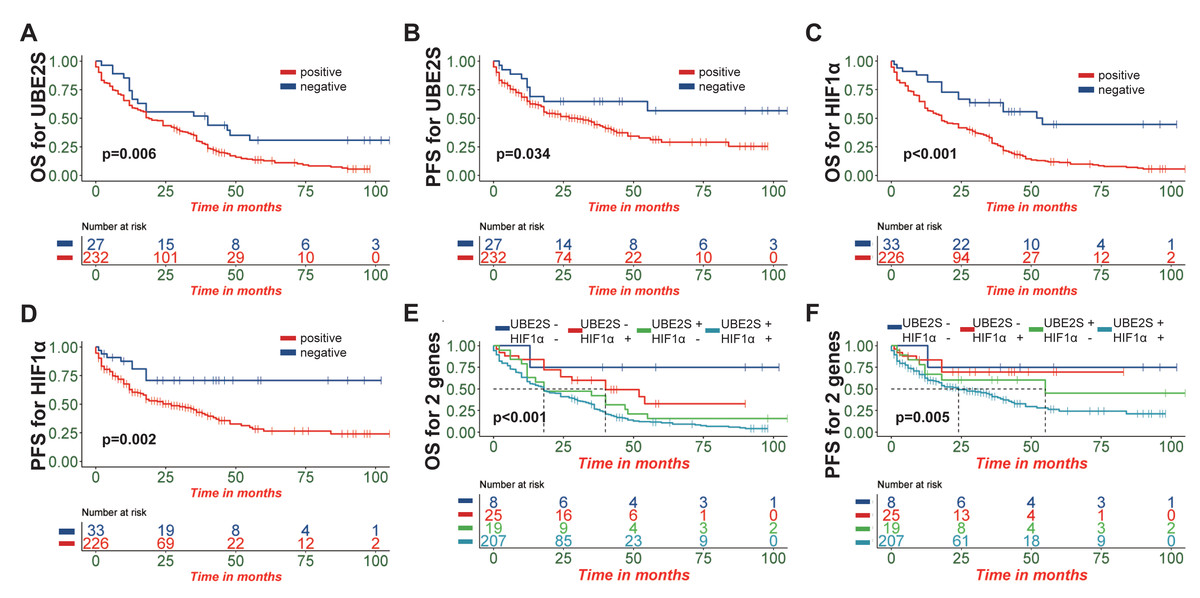
Figure 4: Prognostic impact of UBE2S and HIF1α expression and their synergistic effect in ESCC patients.
(A, B) Kaplan–Meier survival curves showing that high expression of UBE2S is significantly associated with poorer overall survival (OS; p = 0.006) and progression-free survival (PFS; p = 0.034). (C, D) Similarly, high expression of HIF1α is associated with reduced OS (p < 0.001) and PFS (p = 0.002). (E, F) Patients were stratified into four groups based on UBE2S and HIF1α co-expression status: Group 1 (dual-negative), Group 2 (UBE2S-negative/HIF1α-positive), Group 3 (UBE2S-positive/HIF1α-negative), and Group 4 (dual-positive). Kaplan–Meier analysis revealed significant stratification of both OS (p < 0.001) and PFS (p = 0.005) among these groups, with patients exhibiting dual-positive expression (Group 4) demonstrating the poorest outcomes.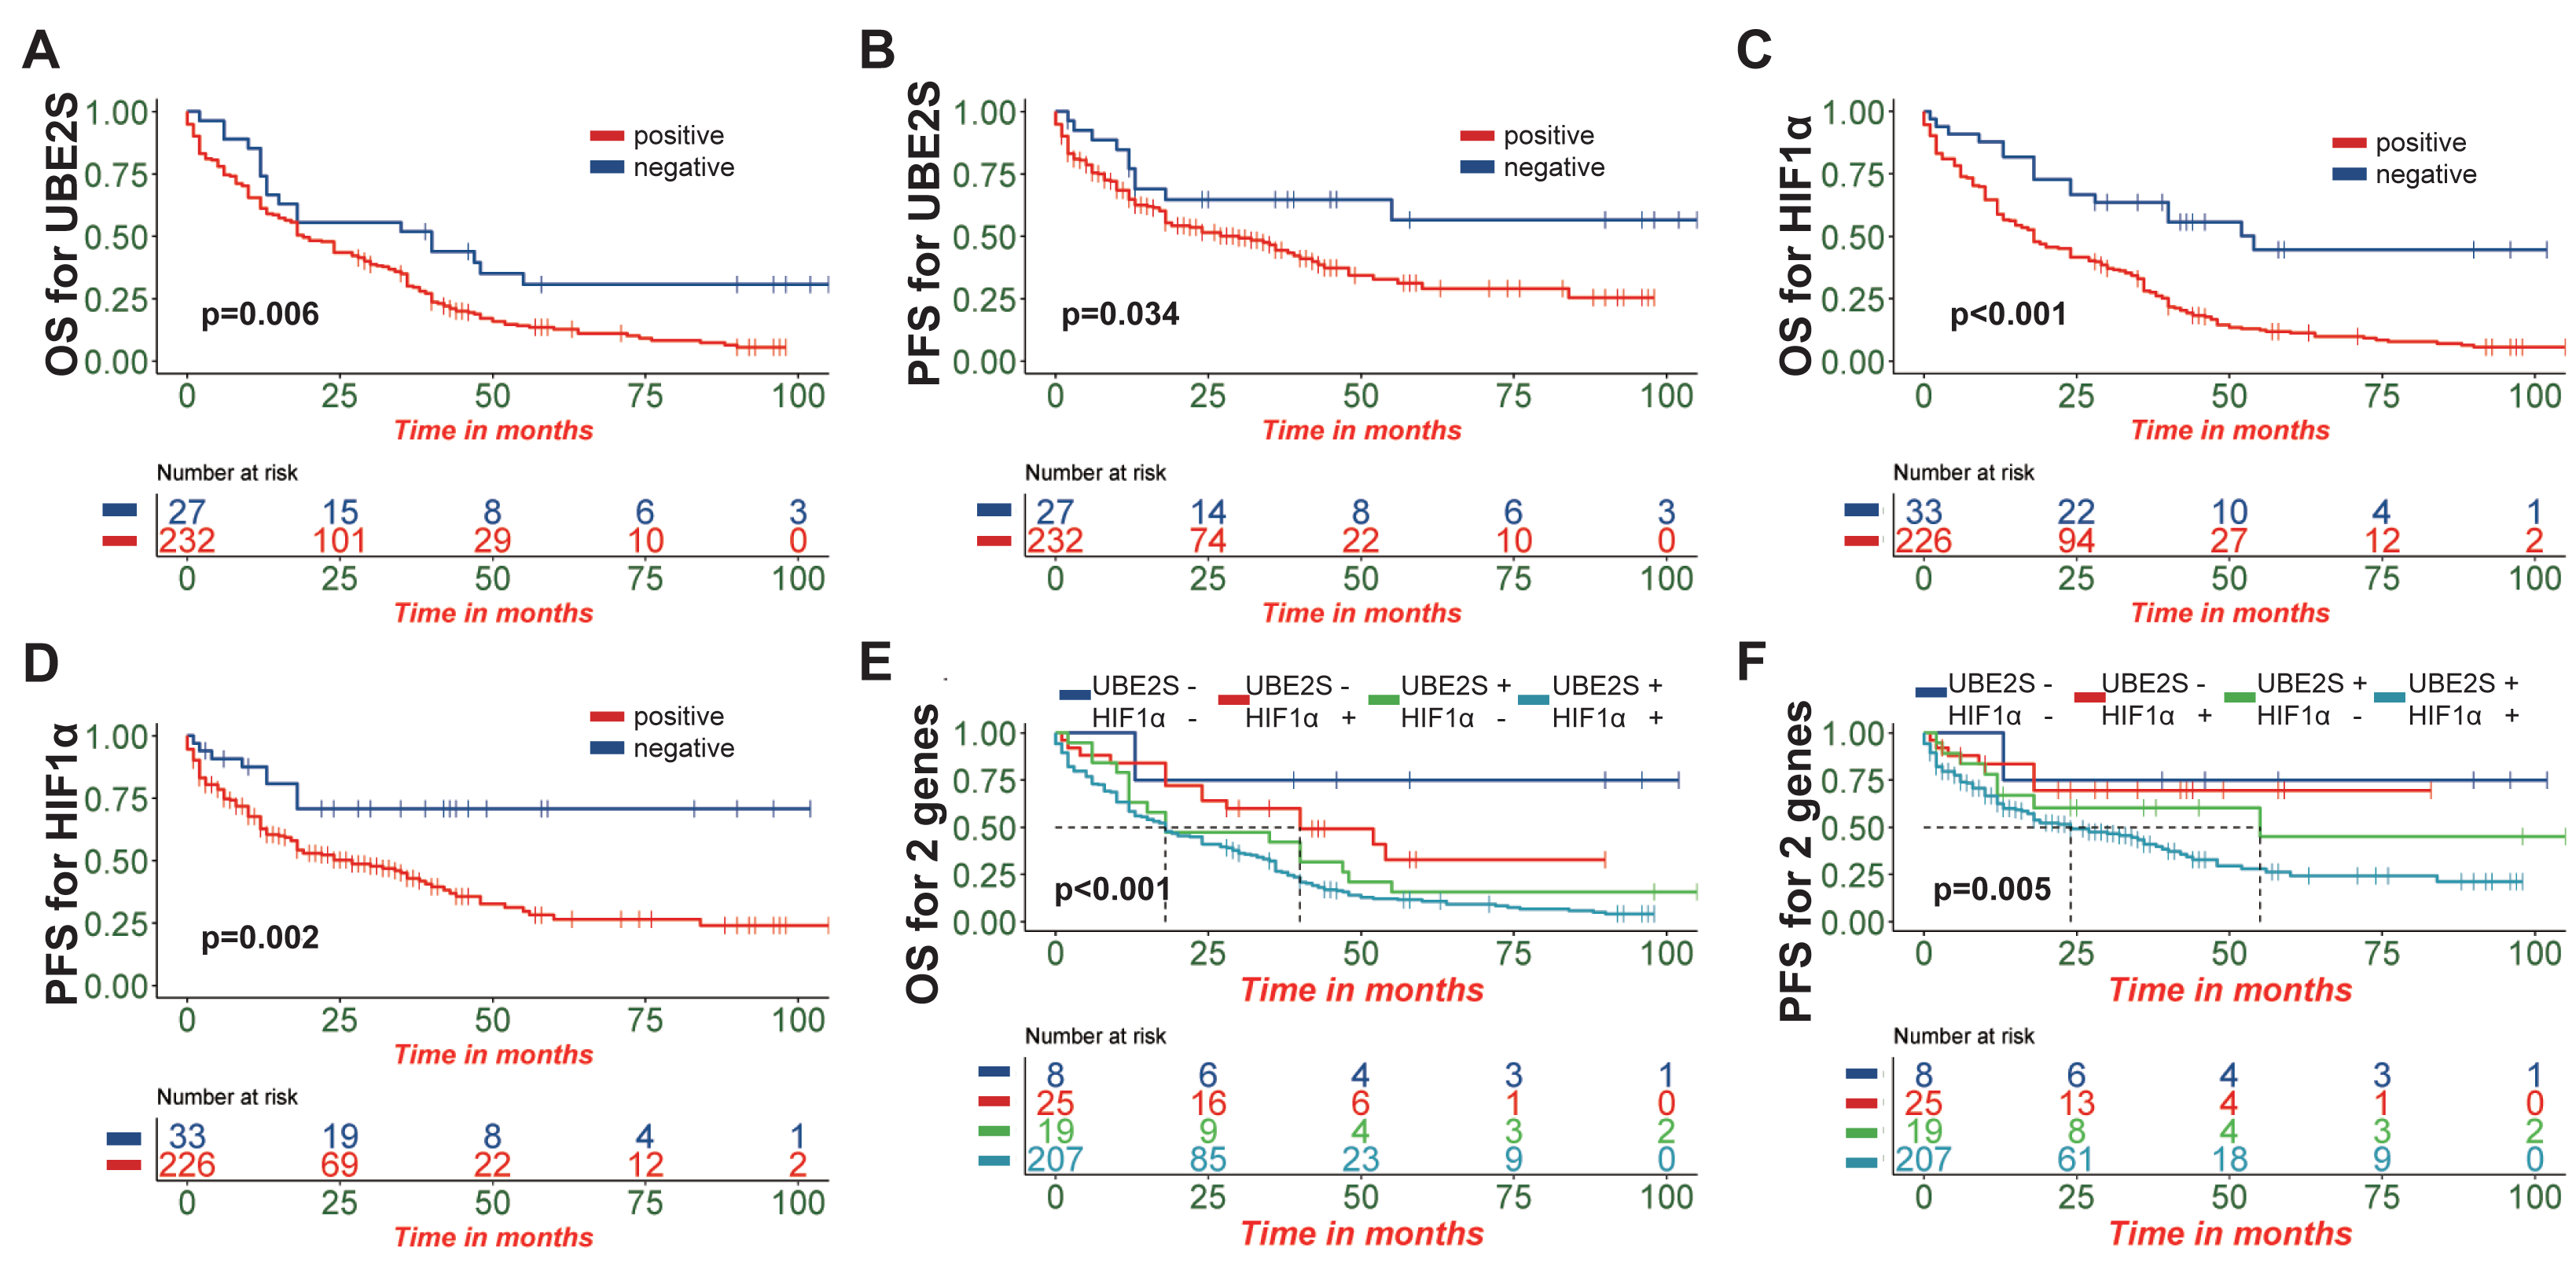
Exploratory stratified analysis of UBE2S prognostic value
To assess the prognostic impact of UBE2S across different patient subgroups, an exploratory stratified analysis was performed. UBE2S-positive expression was associated with reduced OS in subgroups including patients aged >60 years (Fig. 5A, p = 0.047), males (Fig. 5B, p = 0.022), Kazak (Fig. 5C, p = 0.014), tumor size ≥ three cm (Fig. 5D, p = 0.025), mid-esophageal tumors (Fig. 5E, p = 0.005), and moderately to poorly differentiated histology (Figs. 5F–5G, p = 0.017, p = 0.033). Shorter PFS was specifically observed in UBE2S-positive patients with mid-esophageal tumors (Fig. 5H, p = 0.035) and Kazak (Fig. 5I, p = 0.050). It is important to note that these stratified analyses were exploratory. After Bonferroni correction for multiple comparisons, the subgroup p-values did not retain formal significance, and interaction tests were non-significant. Thus, these findings should be interpreted as hypothesis-generating trends requiring validation in future studies.
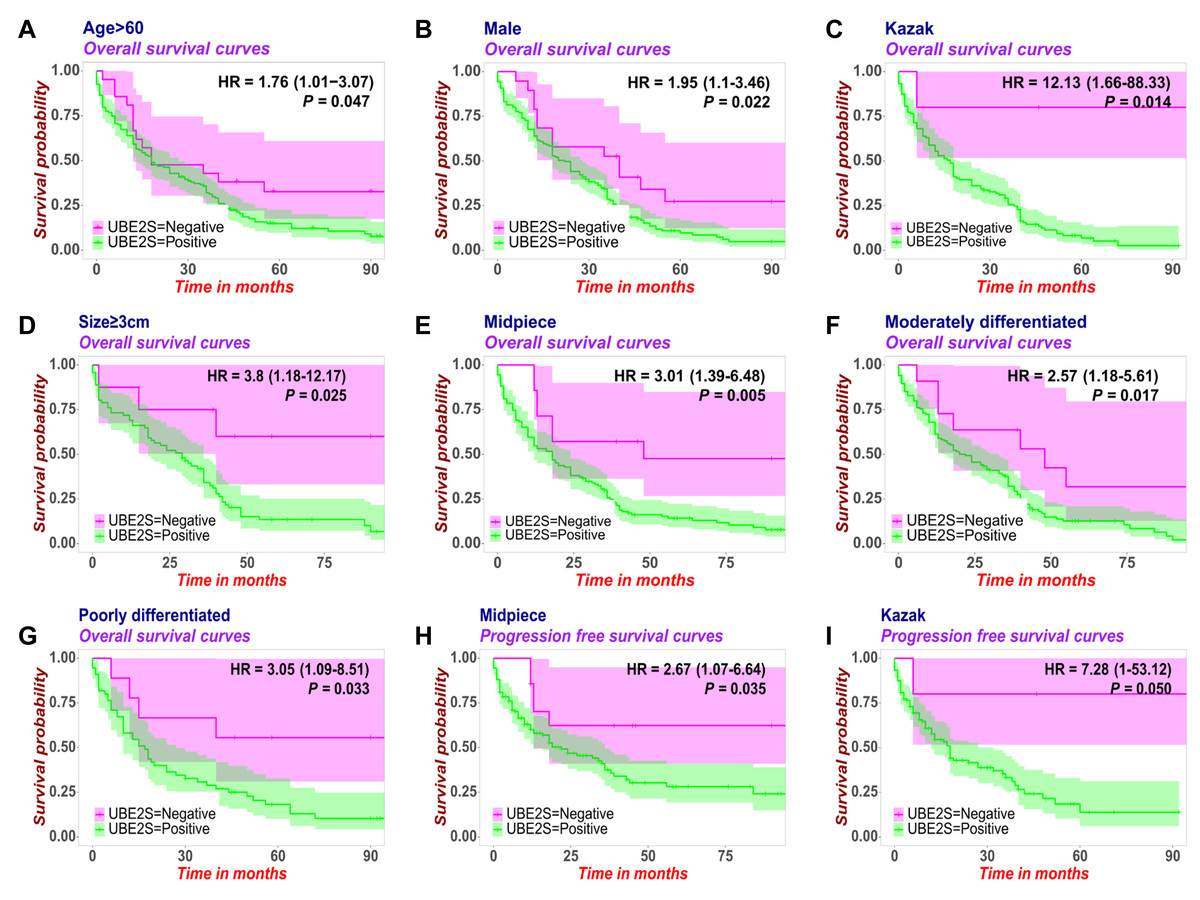
Figure 5: Exploratory stratified analysis of the prognostic value of UBE2S expression across patient subgroups in ESCC.
Kaplan–Meier survival analyses depict the association between UBE2S-positive expression and reduced overall survival (OS) or progression-free survival (PFS) within specific clinicopathological subgroups. UBE2S-positive expression was associated with reduced OS in subgroups of patients aged >60 years (A, p = 0.047), males (B, p = 0.022), Kazak (C, p = 0.014), tumor size ≥ three cm (D, p = 0.025), mid-esophageal tumors (E, p = 0.005), and moderately (F, p = 0.017) to poorly differentiated histology (G, p = 0.033). Shorter PFS was specifically observed in UBE2S-positive patients with mid-esophageal tumors (H, p = 0.035) and Kazak (I, p = 0.050). Note: These stratified analyses were exploratory. After Bonferroni correction for multiple comparisons, the subgroup p-values did not retain formal statistical significance. Thus, findings should be interpreted as hypothesis-generating trends.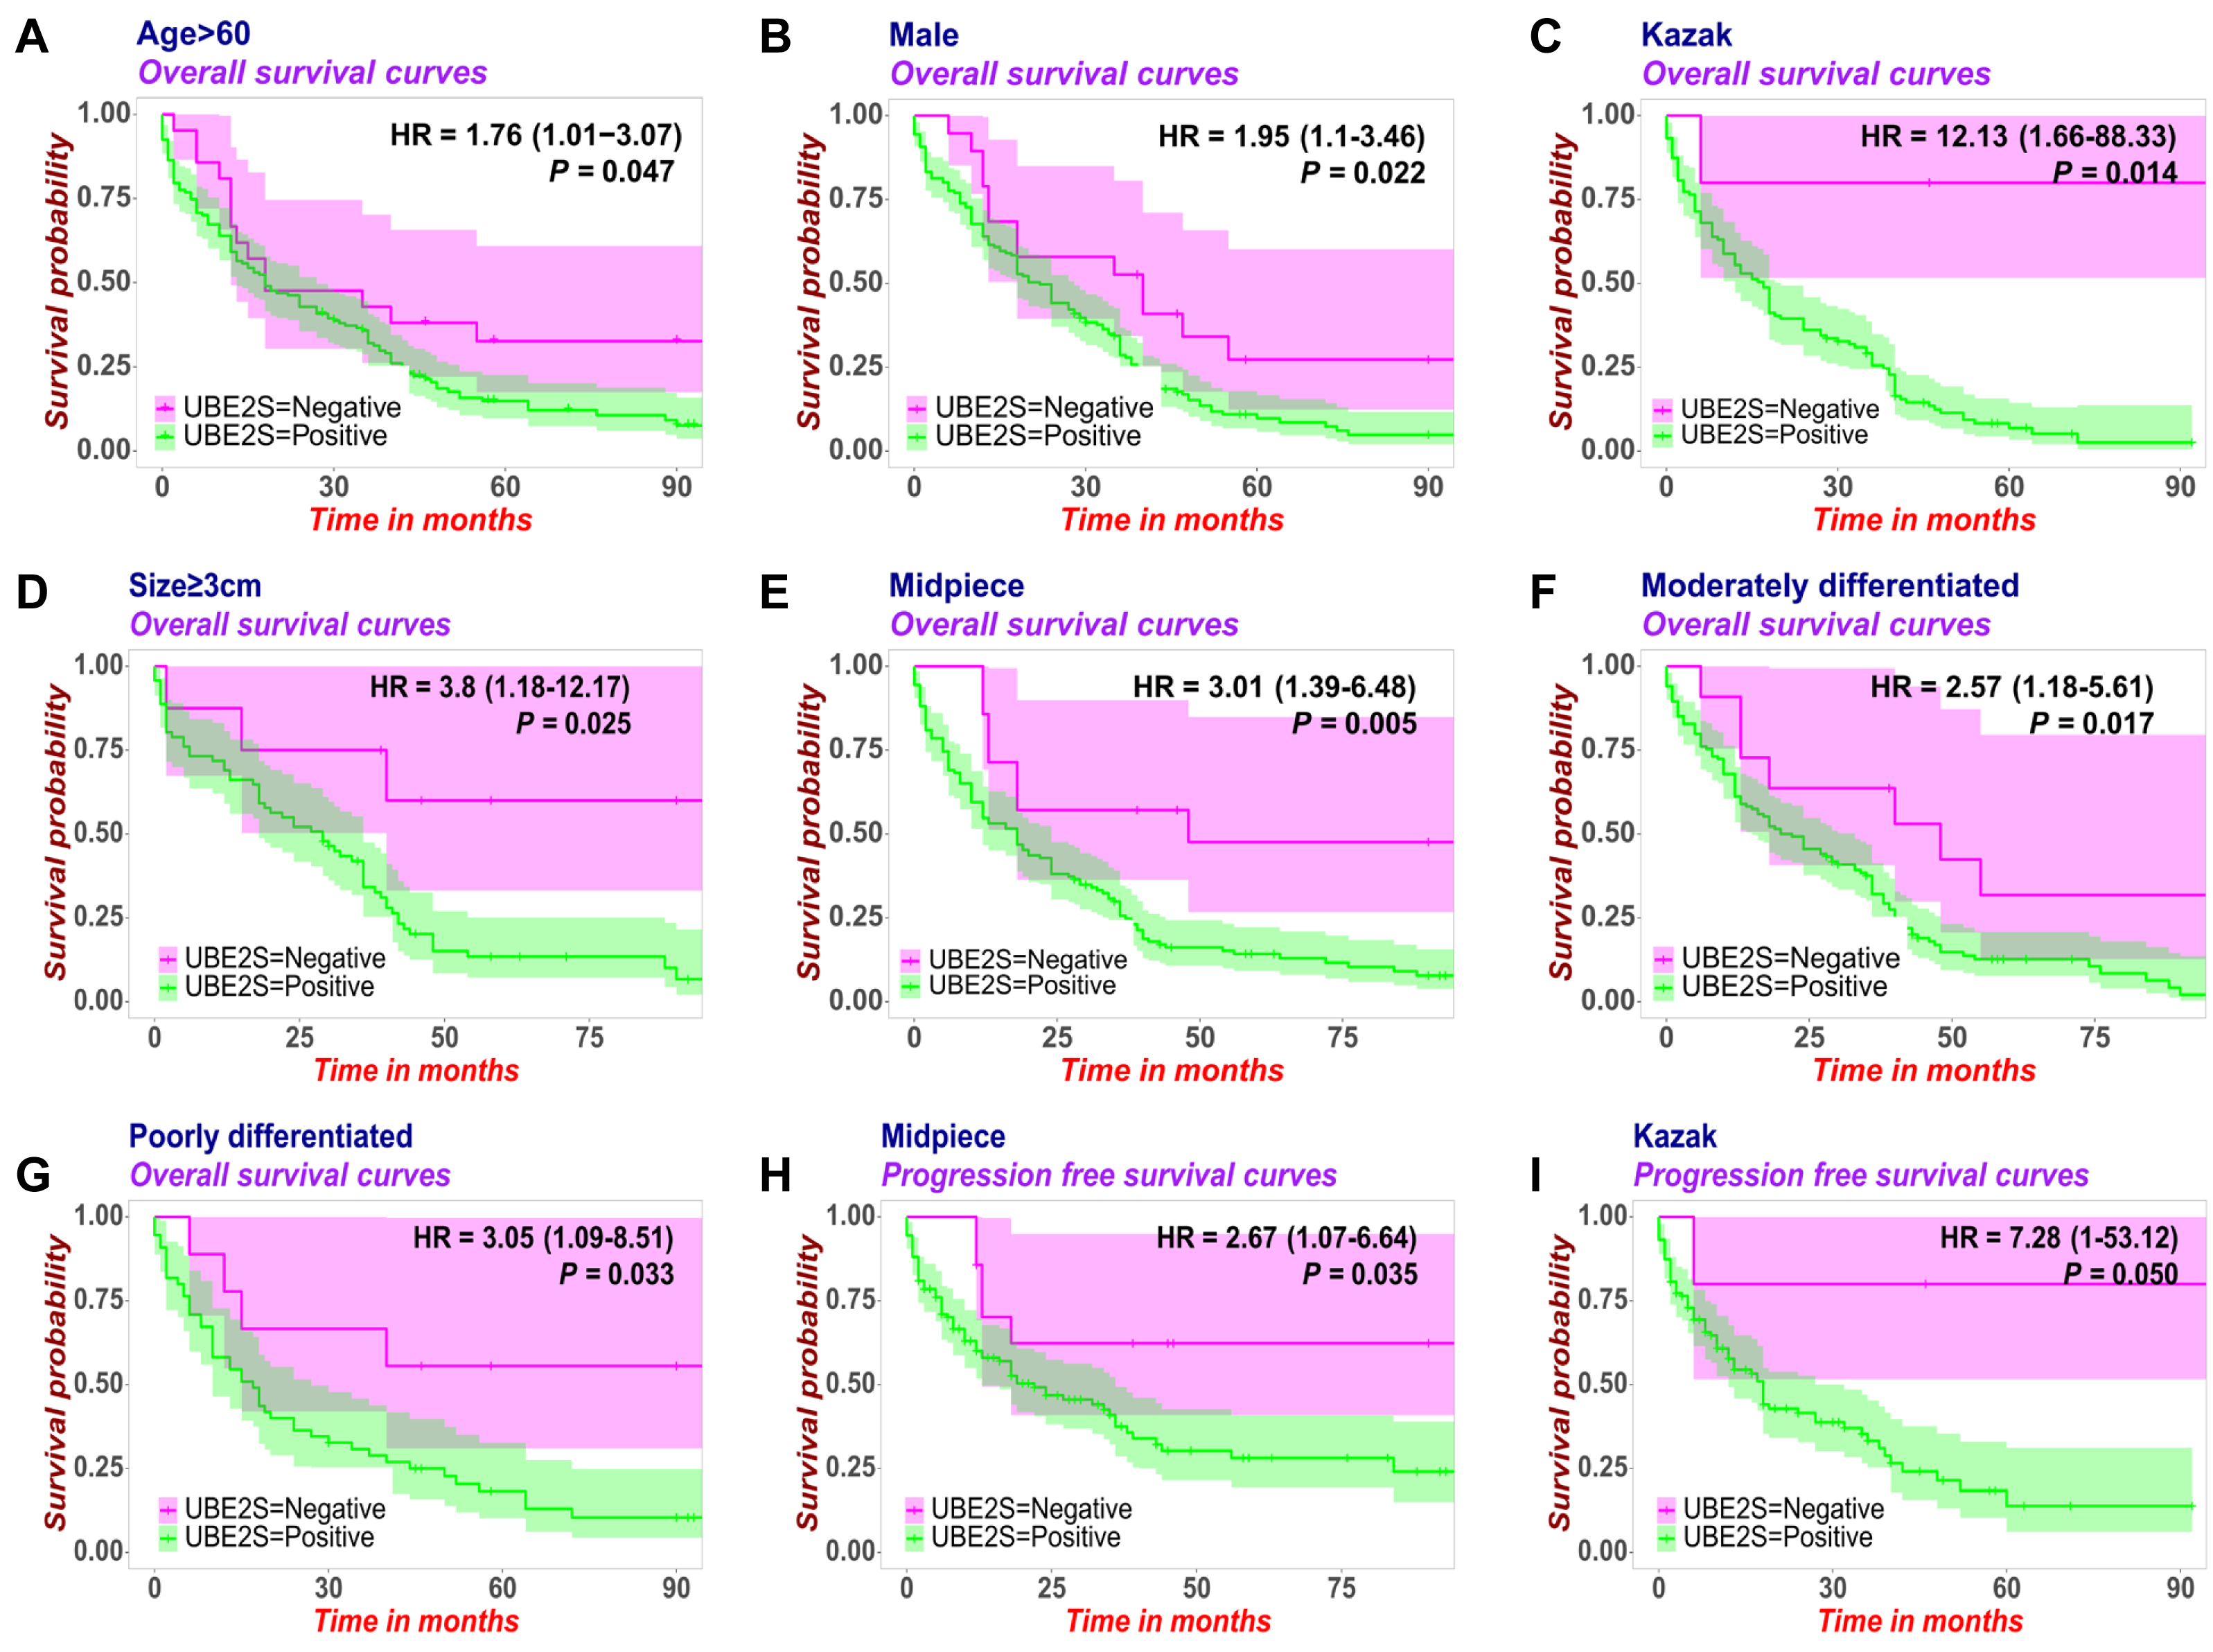
Discussion
Esophageal squamous cell carcinoma (ESCC) remains a lethal malignancy characterized by advanced-stage diagnosis and limited therapeutic options. With 5-year survival rates stagnating below 20%, the identification of novel prognostic biomarkers for risk stratification represents an unmet clinical need. This study addresses this gap by investigating the UBE2S-HIF1α axis, a molecular pathway that may drive ESCC aggressiveness and hold direct therapeutic implications.
Accumulating evidence indicates that UBE2S and HIF1α overexpression serves as an oncogenic driver across multiple malignancies. In our investigation, IHC analysis of ESCC specimens revealed UBE2S positivity in 89.6% (232/259) and HIF1α positivity in 87.3% (226/259) of tumors. Both proteins exhibited characteristic cytoplasmic and nuclear localization patterns. These findings align with reports by Wu et al. (2023), demonstrating that elevated UBE2S expression correlates with adverse prognosis in hepatocellular carcinoma (HCC) patients. Furthermore, UBE2S is upregulated in HCC tissues and cell lines, concomitant with activation of the HIF1α pathway. Given established evidence (Zhang et al., 2022; Zhang et al., 2023) that UBE2S promotes tumor progression by activating the PI3K/AKT/mTOR pathway to regulate cell cycle progression and apoptosis, we sought to explore its role in ESCC. Our data demonstrate significant co-overexpression and a positive correlation between UBE2S and HIF1α at both the protein and mRNA levels. The concurrent overexpression of p110α provides a correlative basis for a potential link between this axis and PI3K signaling, a hypothesis that warrants further functional investigation. The high prevalence of UBE2S and HIF1α expression (>85%) in our ESCC cohort raises a valid question regarding their clinical utility. We posit that the value of such highly expressed biomarkers lies not in identifying a rare high-risk subgroup, but in confirming the aggressive biology that is predominant in the disease population, thereby enabling risk stratification within the majority of patients. This concept is well-established in oncology. For instance, the Ki-67 proliferation index, despite frequent high expression, is a cornerstone of prognostic assessment in breast cancer and neuroendocrine tumors, as reflected in contemporary WHO classifications and clinical guidelines (Loibl et al., 2021; Mete & Wenig, 2022). A negative result for both UBE2S and HIF1α could, by contrast, identify a rare subgroup with a more favorable prognosis, potentially guiding therapy de-escalation strategies. To contextualize our findings, it is important to consider the established landscape of ESCC biomarkers, such as PD-L1, p53, and Ki-67. While these markers provide crucial prognostic and predictive information, the UBE2S-HIF1α axis may offer unique insights into tumor biology, particularly regarding hypoxia response and protein stability regulation. This positions UBE2S and HIF1α as potential complementary biomarkers for defining a highly aggressive tumor subtype.
This study further employs Cox proportional hazards regression modeling for survival analysis. The results identified UBE2S-positive expression (HR = 1.685, 95% CI [1.021–2.783], p = 0.041), Kazak ethnicity (HR = 1.334, 95% CI [1.012–1.759], p = 0.041), lymph node metastasis (HR = 1.780, 95% CI [1.103–2.872], p = 0.018), and nerve invasion (HR = 1.560, 95% CI [1.108–2.197], p = 0.011) as independent risk factors for OS in ESCC patients. Notably, while Yang et al. (2024) applied similar analytical methods, their multivariate regression established different prognostic predictors. This discrepancy likely stems from cohort heterogeneity, suggesting fundamental differences in prognostic drivers across patient populations and disease stages. We further confirmed that high expression of either UBE2S or HIF1α was significantly associated with reduced survival, consolidating their role as adverse prognostic indicators in ESCC, which is consistent with findings in other cancers such as breast cancer (Guo et al., 2023) and previous ESCC studies on HIF1α (Tang et al., 2022). Our exploratory stratified analysis suggested trends toward poorer outcomes in specific subgroups, such as Kazak patients and those with mid-esophageal tumors. However, as these findings did not withstand rigorous multiple testing correction, they should be interpreted as hypothesis-generating, highlighting subgroups that merit further investigation in larger cohorts. Furthermore, the correlation between HIF1α positivity and male gender, as well as between UBE2S positivity and Kazak ethnicity, is intriguing. We speculate that lifestyle factors such as higher rates of smoking and alcohol consumption among males, and dietary habits characterized by high intake of preserved meats in Kazak cuisine, might contribute to these associations through mechanisms involving oxidative stress and DNA damage response, respectively. The observed co-expression and positive correlation between UBE2S and HIF1α at the mRNA level suggest a potential functional interplay that extends beyond post-translational stabilization. While UBE2S is known to stabilize HIF1α protein, their transcriptional co-deregulation could be explained by several non-mutually exclusive mechanisms: (1) A feed-forward transcriptional loop where HIF1α, stabilized by UBE2S under hypoxia, transcriptionally activates genes that in turn promote UBE2S expression; (2) Shared upstream oncogenic signaling pathways, such as PI3K/AKT or RAS/MAPK, which are frequently dysregulated in ESCC and can simultaneously drive the transcription of both genes (Luo et al., 2022; Ma et al., 2024); and (3) co-amplification or epigenetic co-regulation of the genomic loci harboring UBE2S and HIF1α.
Despite these interesting correlations, our study has several limitations that should be acknowledged. Its retrospective and single-center design may introduce selection bias. The high positivity rates of UBE2S and HIF1α, while clinically informative for risk confirmation, limit the statistical power of the negative subgroup. Furthermore, our cohort featured a unique demographic with a high proportion of Kazak patients from Xinjiang, which offers valuable regional insights but may affect the generalizability of our findings, necessitating external validation in diverse populations. Finally, the proposed functional interplay between UBE2S, HIF1α, and the PI3K pathway remains correlative; future mechanistic studies are crucial to establish causality.
Conclusion
In conclusion, our multi-platform investigation establishes that UBE2S and HIF1α exhibit consistent overexpression in ESCC, validated via integrated bioinformatics analyses (TCGA and GEO dataset GSE161533) and IHC staining. Critically, their expression shows a significant correlation with adverse clinical outcomes. The potential synergistic adverse effect of their co-expression and the observed trends in specific subgroups position UBE2S and HIF1α as promising candidates for the development of risk-stratified therapeutic strategies in ESCC management.
Supplemental Information
Associations between p110α expression and clinicopathological characteristics in esophageal squamous cell carcinoma patients (n = 259)
P values were determined by the Chi-square test or Fisher’s exact test, as appropriate.
Associations between UBE2S/HIF1α expression and clinicopathological characteristics in esophageal squamous cell carcinoma patients (n = 259)
P values were determined by the Chi-square test or Fisher’s exact test, as appropriate.