
Genome-wide identification of SMALL AUXIN UP RNA (SAUR) gene family and its expression profiles in response to abiotic stress and auxin in tea plants (Camellia sinensis)
- Published
- Accepted
- Received
- Academic Editor
- Nicole Nogoy
- Subject Areas
- Bioinformatics, Genomics, Plant Science
- Keywords
- Tea plant, SMALL AUXIN UP RNA (SAUR) gene family, Genome-wide analysis, Gene expression profile, Abiotic stress, Auxin
- Copyright
- © 2026 Wang et al.
- Licence
- This is an open access article distributed under the terms of the Creative Commons Attribution License, which permits using, remixing, and building upon the work non-commercially, as long as it is properly attributed. For attribution, the original author(s), title, publication source (PeerJ) and either DOI or URL of the article must be cited.
- Cite this article
- 2026. Genome-wide identification of SMALL AUXIN UP RNA (SAUR) gene family and its expression profiles in response to abiotic stress and auxin in tea plants (Camellia sinensis) PeerJ 14:e20681 https://doi.org/10.7717/peerj.20681
Abstract
Tea plant (Camellia sinensis (L.) O. Kuntze) is particularly vulnerable to abiotic stresses, with impacts on its growth and the production of bioactive compounds. SMALL AUXIN UP RNA (SAUR) genes, the largest family of early auxin-responsive genes, regulate plant growth and abiotic stress responses. However, their roles in tea plant remain unknown. In this study, we conducted a comprehensive genome-wide analysis of CsSAURs, including phylogenetic relationships, gene structure, chromosomal distribution, duplication events, motif composition, cis-elements, and gene ontology (GO) annotations. Expression profiles were examined using transcriptome data and validated by qRT-PCR. A total of 97 CsSAURs were identified and classified into eight phylogenetic groups, with 90 mapped to 15 chromosomes and seven to contigs. Genes within the same group exhibit conserved gene structures and motif compositions. Segmental duplication predominantly contributes to family expansion. The predominant CsSAUR expression was found in flowers, with their promoters containing auxin-responsive, phytohormone, and stress-related cis-elements. A limited number of CsSAURs exhibit responsiveness to cold, drought, salinity, and methyl jasmonate (MeJA). Notably, CsSAUR10, 16, and 73 exhibited significant upregulation under abiotic stress and auxin treatment. Overall, this study characterizes the SAUR family in tea plant and highlights its potential roles in the regulation of growth and stress responses. The identified auxin and stress-responsive CsSAURs represent potential targets for genetic improvement of tea plants.
Introduction
Auxin, a phytohormone present throughout plants, plays a key role in regulating different aspects of plant growth and development, such as cell division, elongation, organogenesis, and stress adaptation (Vanneste & Friml, 2013). The SMALL AUXIN UP RNA (SAUR) gene family, one of the three principle early gene families induced by auxin (alongside Aux/IAA and GH3), represents the largest group, which is characterized by rapid induction within 2 to 5 min (Franco, Gee & Guilfoyle, 1990). SAUR genes are plant-specific and encode small proteins, which share a highly conserved SAUR domain critical for their regulatory roles (Qiu et al., 2020).The SAUR domain spans approximately 60 amino acids and is predominantly composed of hydrophobic amino acids, with a nearly invariant cysteine residue (Qiu et al., 2020). Studies on Arabidopsis thaliana demonstrate that SAURs function in diverse developmental processes—such as hypocotyl and stamen filament elongation (Chae et al., 2012), root growth and development (Qiu et al., 2020), apical hook development (Wang et al., 2020a), and leaf growth and senescence (Wen et al., 2020)—as well as in abiotic stress responses. For instance, the Arabidopsis SAUR41 subfamily (including SAUR40, 70, and 71) not only regulates cell expansion (Qiu et al., 2020) but also alleviates the inhibitory effects of salt stress on seedling growth induced by abscisic acid (Stortenbeker & Bemer, 2019). Up to now, studies demonstrate SAUR gene family has been positioned as a central integrator of hormonal and environmental signaling networks (Stortenbeker & Bemer, 2019).
A notable characteristic of SAUR genes is their functional redundancy. For instance, in Arabidopsis, the SAUR41 subfamily requires quadruple mutagenesis (SAUR41/40/71/72) to elicit noticeable defects in cell expansion and salt tolerance. This underscores the functional overlap among these closely related members (Qiu et al., 2020). Similarly, the SAUR19-24 subfamily promotes cell expansion. Loss-of-function phenotypes, such as reduced hypocotyl length, are only apparent when multiple members are targeted simultaneously using artificial microRNAs (Spartz et al., 2012). Genome-wide evolutionary analyses further support this notion. They reveal that the SAUR family has undergone substantial expansion via tandem and segmental duplications during plant evolution. This trend is especially marked in Fabaceae species, where it has led to the formation of paralogous clusters with redundant roles (Zhang et al., 2021). Simultaneously, many SAUR genes exhibit distinct spatiotemporal expression profiles, suggesting specialized functions in particular tissues or developmental stages. For example, the Arabidopsis SAUR76 is specifically expressed in root endodermal and pericycle cells, particularly during lateral root primordia development, and its expression is regulated by auxin and ethylene, highlighting its specialized role in root tissues (Markakis et al., 2013). Additionally, members of the Arabidopsis SAUR19-24 subfamily are highly expressed in hypocotyls and leaves, influencing organ-specific cell expansion. Overexpression of these genes leads to increased leaf size and apical hook defects, while mutants exhibit growth inhibition in these tissues (Spartz et al., 2012). In apple (Malus domestica), MdSAUR7 is highly expressed in floral organs, whereas MdSAUR15, 24, and 80 promote cell division during fruit development, highlighting their specialized functions in specific organs (Wang et al., 2020b). Such expression specificity suggests that SAUR members play finely tuned regulatory roles across various tissues.
Given the functional redundancy and tissue-specific expression of SAUR genes, a genome-wide identification in tea plants is essential. Redundancy implies that multiple members collectively regulate traits (e.g., leaf growth and stress responses), necessitating a comprehensive analysis to avoid omitting key genes. Tissue specificity indicates certain SAURs may uniquely influence tea-specific processes, such as polyphenol accumulation. Identifying these genes can support the development of molecular markers and gene-editing strategies to improve agronomic traits. For example, in cotton, genome-wide studies of SAUR genes have uncovered members associated with fiber development (Li et al., 2017). Thus, based on evidences from Arabidopsis and other plants, conducting a genome-wide identification of SAUR genes in tea will provide critical insights, advancing genetic improvement and stress tolerance research in tea plants.
Tea plant is a vital economic crop valued for its secondary metabolites (e.g., catechins and theanine), whose growth is more sensitive to various abiotic stress including temperature, cold, drought, high salinity, etc. (Samynathan et al., 2021). Meanwhile, these abiotic stressors influence the biosynthesis and accumulation of bioactive compounds in tea (Samynathan et al., 2021). Low-temperature treatment (15 °C) downregulates the expression of catechin biosynthesis-related genes (except for CsCHS3, CsDFR2, and CsLAR2) (Wang et al., 2018), which leads to a decrease in the total esterified catechins but an increase in non-esterified catechins (Xiang et al., 2021). Drought stress can stimulate a wide range of aromatic components, an increase in proline and total sugar levels, and a decrease in total phenolics (Cao, Liu & Liu, 2007; Gu et al., 2020). Overexpression of PpSAUR5 in Arabidopsis modulates phenylpropanoid metabolic pathway, except for promoting plant growth and floral organ formation (Li et al., 2024). Therefore, it is of great benefit for optimizing tea yield and quality to elucidate the roles and mechanisms of SAUR genes in growth, stress adaptation and production of bioactive compounds.
The SAUR genes were firstly identified in soybean (Glycine max) when investigating hypocotyl elongation (McClure & Guilfoyle, 1987). Since then, members of the SAUR gene family have been identified in many plant species, including moss physcomitrella patens (Zhang et al., 2021), monocotyledon (Zhang et al., 2021) (maize, rice and sorghum), dicotyledon (Li et al., 2021; Liu et al., 2022; Luo et al., 2022; Ren & Gray, 2015) (mung bean, pea, tomato, Arabidopsis , apple, radish, potato, cotton, litchi, tobacco, pepper, petunia, peach, poplar, wax gourd, grape and peanut). The expansion of SAUR gene families in plants such as rice (60 members) suggests functional diversification during evolution. However, no systematic analysis of SAUR genes has been conducted in tea plant (Samynathan et al., 2021).
Advances in the sequencing of the tea plant genomes (Xia et al., 2020) enable genome-wide identification and functional prediction of SAUR gene family. In this study, we carried out a comprehensive analysis of SAUR genes in C. sinensis based on genome-sequencing data, including physicochemical characteristics, phylogenetic relationships, chromosomal distribution and synteny analysis, gene structure and motif composition. We also investigated the tissue-specific expression of CsSAURs based on the transcriptome data from TPIA (Xia et al., 2020). To further clarify the transcriptional regulation of CsSAURs in response to auxin and abiotic stress, the cis-acting elements were predicted and analyzed. Then, the expression profiles of CsSAURs in response to phytohormone and abiotic stress were detected using RNA-seq data from TPIA (Xia et al., 2020) and validated by qRT-PCR. Our study provides the first systematic characterization of SAUR genes in tea plants, establishing a basis for further investigation of their functional roles in growth regulation and stress adaptation, and sheds light on optimizing tea yield and quality through targeted molecular breeding strategies.
Materials & Methods
Identification of SAUR genes and chromosomal distribution
The whole genome/proteome sequence and annotation files of C. sinensis cv. ‘Shuchazao2’ were retrieved for this study from the Tea Plant Information Archive (TPIA, https://tpia.teaplants.cn) (Gao et al., 2023). A hidden Markov model (HMM) profile of SAUR domain (pfam number: PF02519) was downloaded from InterPro (https://www.ebi.ac.uk/interpro) (Blum et al., 2025) and used as a query for the following HMM search to identify SAURs in tea plant.
The candidate members of the SAUR gene family in tea plant were identified by two methods. First, an HMM search (E-value, 1e−10) was carried out against whole proteome of C. sinensis cv. ‘Shuchazao2’ to identify candidate SAUR proteins. Second, using a file of known A. thaliana SAUR protein sequences (Markakis et al., 2013) as a query, a Basic Local Alignment Search Tool algorithms (BLASTP) search (E-value, 1e−10) was performed against the same C. sinensis cv. ‘Shuchazao2’ proteome to obtain the additional candidate SAUR proteins.
The candidate SAUR proteins were further validated with online tools, including Simple Modular Architecture Research Tool (SMART, https://smart.embl.de) (Letunic, Khedkar & Bork, 2021) and https://www.ncbi.nlm.nih.gov/Structure/cdd/wrpsb.cgi (NCBI-CD, https://www.ncbi.nlm.nih.gov/Structure/cdd/wrpsb.cgi) (Wang et al., 2023). The sequences lacking SAUR core domain were removed. The final set of tea plant SAUR protein sequences was used for subsequent analyses.
The chromosomal distribution of SAUR genes was mapped using the Gene Location Visualize from GTF/GFF of Tbtools-II (v[2.376]) based on the data from the genome annotation files (GFF3) of C. sinensis cv. ‘Shuchazao2’. Then, the identified CsSAUR genes of were renamed according to their positions from the top of chromosome 1 to the end of the last chromosome as CsSAUR1, CsSAUR2, CsSAUR3,…, up to CsSAUR[n]. This chromosome-based naming system is independent of homology-based functional annotation.
Phylogenetic analysis and classification of SAUR genes
To start, a multiple sequence alignment of SAUR proteins from A. thaliana and C. sinensis was conducted using the MAFFT online service (https://mafft.cbrc.jp/alignment/software) (Katoh, Rozewicki & Yamada, 2019). The alignment obtained was subsequently to build a phylogenetic tree by the Maximum Likelihood (ML) method using IQ-TREE (2.4.0), with parameters including Poisson correction, pair-wise deletion, and 1,000 bootstrap replicates (random seed). Members of the SAUR gene family in C. sinensis were categorized according to the branching patterns of phylogenetic tree.
Physicochemical properties and subcellular localization
The physicochemical parameters of CsSAURs, including amino acid number, isoelectric point (pI), molecular weight (mW), aliphatic index (AI), instability index, grand average of hydropathicity (GRAVY), were analyzed using the online tool Expasy Protparam (https://web.expasy.org/protparam) (Chen et al., 2023a). The subcellular localization was predicted on WoLF PSORT (https://wolfpsort.hgc.jp) (Horton et al., 2007).
Gene structure and conserved motif analysis
The exon and intron positions of SAUR genes were analyzed base on the information from C. sinensis genome annotation file. Conserved motifs in C. sinensis SAUR proteins were predicted with the online tool Multiple Expectation Maximization for Motif Elicitation (MEME) Suite 5.5.8 (https://meme-suite.org/meme) (Bailey et al., 2015). The identified gene structures and conserved motifs were visualized by Visualize Gene Structure (from GTF/GFF3 file) and Visualize Motif Pattern modules in TBtools-II software (v[2.376]), respectively.
Synteny analysis
Synteny relationships of SAUR genes within C. sinensis and between C. sinensis and A. thaliana were analyzed using Multiple Collinearity Scan toolkit X version (MCScanX) (Wang et al., 2012), with parameters set to default values. The relationship of orthologous SAURs between C. sinensis and A. thaliana was visualized by One Step MCScanX tool in Tbtools-II (v[2.376]). For each duplicated SAUR gene pair, non-synonymous (Ka) and synonymous (Ks) substitutions were computed using the Simple Ka/Ks Calculator in Tbtools-II (v[2.376]). The resulting Ka/Ks ratios were then interpreted using standard evolutionary thresholds: Ka/Ks >1, ≈ 1, and <1 indicating positive, neutral, and purifying selection, respectively.
Cis-regulatory element and GO enrichment analysis
PlantCARE database (http://bioinformatics.psb.ugent.be/webtools/plantcare/html/) was used to predict the cis-acting elements in the promoter regions (+2,000 bp from ATG start code) of CsSAUR genes. Further, GO enrichment analysis based on GO annotation files from TPIA was performed to uncover the biological functions of CsSAUR genes.
Expression profiling of CsSAUR genes across various tissues or under abiotic stresses
The transcriptome data of CsSAUR genes across eight organs (terminal buds, flowers, fruits, young leaves, mature leaves, senescent leaves, roots, and stems) and under abiotic stresses (cold acclimation and deacclimation, PEG, NaCl, and MeJA) were obtained from TPIA. For data processing and visualization, gene expression values were first calculated as log2(fold change) relative to the control. Next, the data were then filtered by removing rows with non-finite values (infinite or NA), setting fold changes between −1 and +1 to zero, and eliminating genes that showed no expression changes across all conditions. After filtering, the processed dataset was used to generate a heatmap with the pheatmap package (version 1.0.12) in R (version 4.1.2). This heatmap demonstrates the tissue-specific expression profiles of CsSAURs and their responses to various abiotic stresses.
Plant materials, growth conditions and treatments
Annual tea cuttings of Camellia sinensis were cultivated in the Tea Garden of Xinyang Normal University (32.13°N, 114.04°E). Healthy, pathogen-free tea seedlings with uniform growth were selected and subjected to programmed temperature acclimation, drought, salt, MeJA and Indole-3-acetic acid (IAA) treatment, respectively. The programmed temperature acclimation was performed under the following regimes, 25/20 °C (day/night) for 6 h (control, CK), cold 10/4 °C for 6 h followed by 7-day adaptation (CA), 25/20 °C for 7 days (DA). During cold acclimation and deacclimation, one bud with one or two tender leaves in quadruplicate was harvested at CK, CA-7d, and DA-7d for transcriptional analysis of CsSAUR16/42/73. For phytohormone treatments, tender leaves were sprayed once with freshly prepared one mM MeJA (Macklin, China) and then collected at 0 h, 6 h, 12 h, and 24 h after treatment for CsSAUR16/73/82 expression analysis. Similarly, tender leaves were sprayed with 100 µM IAA (Macklin, China) and sampled at 0 h, 3 h, 6 h, and 12 h for CsSAUR10/12/16/71/73 expression analysis. For drought and salt stress treatment, the seedlings were cultivated in Hoagland’s nutrient solution (Yu et al., 2020) containing 20%W/V PEG6000 and 200 mM NaCl, respectively. Tender leaves were collected at 0 h, 24 h, 48 h, and 72 h after treatment for CsSAUR7/10/16/73 expression analysis. The harvested samples were all flash-frozen in liquid N2 and stored at −80 °C for further assays.
Real-Time PCR
Total RNA was isolated using RNAprep Pure Plant Plus Kit (Polysaccharides&Polyphenolics-rich; catalog No. DP441; Tiangen Biotech, Beijing, China) according to the manufacturer’s instructions. RNase was not available in the operating environment, reagents and consumables. RNA integrity was verified by 1.0% agarose gel electrophoresis and RNA purity and concentration were measured using a Nanodrop 2,000 spectrophotometer (Thermo Fisher Scientific, Waltham, MA, USA). First strand cDNA from one µg of total RNA was carried out by the use of HiScript II 1st Strand cDNA Synthesis Kit (+gDNA wiper) (catalog No. R212 Vazyme Biotech Co.,Ltd, Nanjing, China) according to the manufacturer’s protocol. The real-time PCR was performed on CFX96 Touch Real-Time PCR Detection System (Bio-Rad, Hercules, CA, USA), using ChamQ Universal SYBR qPCR Master Mix (catalog No. Q711 Vazyme Biotech Co., Ltd, Nanjing, China). Relative quantification was calculated according to the 2−ΔΔCT method. The mean of CsGAPDH and Cs β-actin expression was used as a housekeeping control (Liu et al., 2021; Yu et al., 2020). Specific primers for the CsSAUR genes were designed using Primer-BLAST (https://www.ncbi.nlm.nih.gov/tools/primer-blast/). The primer sequences were showed in Table S1. The PCR amplification efficiency for each primer pair was determined using a standard curve generated from a 5-fold serial dilution of cDNA. All primers used in this study exhibited efficiencies ranging from 90% to 105% with correlation coefficients (R2) greater than 0.99. Primer specificity was confirmed by a single peak in the melt curve analysis and a single band of the expected size on a 2% agarose gel.
Statistical analysis
In this study, all values are presented as mean ± SEM of four biological replicates. Statistical differences were determined through one-way ANOVA followed by the Newman-Keuls test for multiple groups comparison, using GraphPad Prism software (10.4.1, GraphPad Software, Inc., San Diego, CA). Differences in gene expression were deemed statistically significant when p < 0.05.
Results
Identification and characterization of SAUR genes in C. sinensis
We identified the 97 CsSAUR genes in the tea plant genome, systematically renamed according to their chromosomal positions. The 97 identified CsSAUR proteins displayed substantial length heterogeneity, with polypeptide sizes ranging from 67 amino acids (aa) (CsSAUR2, 26, 35, 52, 61) to 200 aa (CsSAUR88). The theoretical mW and pI of the CsSAUR proteins ranged from 7.66 kDa to 22.72 kDa and from 4.30 (CsSAUR74) to 10.71 (CsSAUR8/96), with a mean pI of 7.55, respectively. Further analysis revealed that 43 acidic members exhibited pI < 7, while the remaining 54 displayed pI > 7, corresponding to basic characteristics. This charge dichotomy (mean pI 7.55) suggests potential functional divergence in subcellular localization or pH-dependent regulatory mechanisms. The instability index ranged from 17.78 (CsSAUR94) to 74.89 (CsSAUR7), notably, 82 members (≈85% of total) displayed instability indices >40, suggesting that CsSAUR proteins were extremely unstable. The aliphatic index of CsSAUR proteins fluctuated between 63.47 (CsSAUR9) and 112.65 (CsSAUR94), averaging 88.13. 12 CsSAURs including CsSAUR9 were predicted to be hydrophilic proteins, while the majority exhibited amphiphilic properties. Subcellular localization analysis revealed that 42 CsSAUR were localized to the mitochondria, 25 to the Chloroplast, 19 to the nucleus, and 11 to the cytoplasm (Table S2).
Phylogenetic analysis of SAURs from C. sinensis and A. thaliana
To elucidate the evolutionary relationships and clustering patterns among SAUR proteins in different plant species, a phylogenetic tree was constructed using the ML method based on SAUR protein sequences from C. sinensis and A. thaliana (Fig. 1A). According to a previous report, SAURs can phylogenetically be classified into seven groups in A. thaliana and rice (Oryza sativa) (Jia et al., 2024). However, the variation in the number of SAUR subfamilies across different plant species is indeed a common phenomenon. For instance, the SAUR family has been classified into three subfamilies in woodland strawberry (Zhou et al., 2025) and foxtail millet (Ma et al., 2023), four in longan (Chen et al., 2023b), five in tomato (Mo et al., 2025), and even up to 12 in Brassicaceae (Shukla, Pokhriyal & Das, 2025) and pineapple (Zhang et al., 2023). In this study, the SAUR gene family in C. sinensis was classified into eight subfamilies, labeled as Group I–VIII, with Group VIII being the largest (48 members) and Group IV the smallest (one member). The remaining subfamilies comprised Group I (seven members), Group II (10), Group III (eight), Group V (15), Group VI (six), and Group VII (three). This uneven distribution suggests that the SAUR gene family in C. sinensis developed a distinct evolutionary trajectory from A. thaliana, resulting in species-specific SAUR protein sets. However, it is noteworthy that bootstrap supports for many of the deep internal branches were relatively low (≤ 50%) (Fig. 1A), which is consistent with previous studies on SAUR gene families in other plant species (Jia et al., 2024; Ma et al., 2023; Zhang et al., 2023). This may reflect the rapid evolution and diversification of this gene family, and could partly explain the variations in group numbering and delineation across different studies.
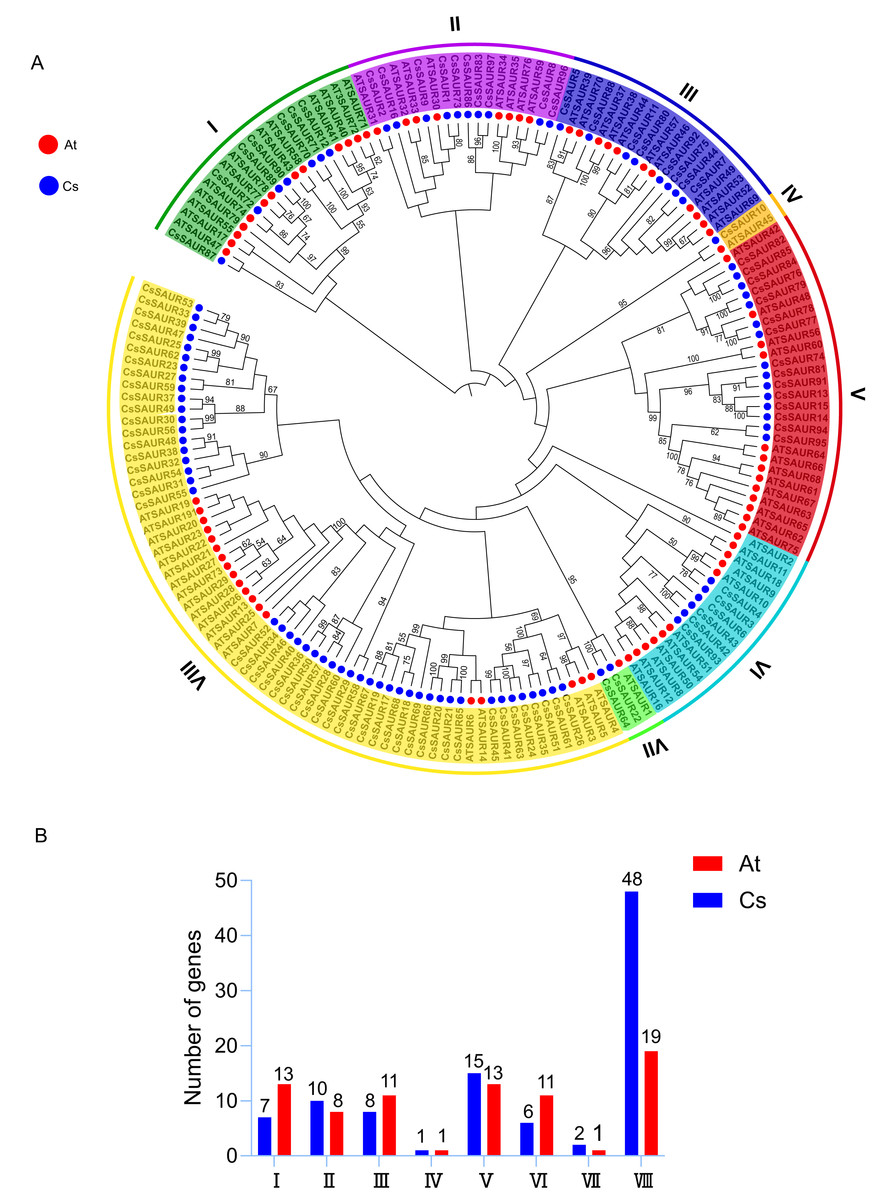
Figure 1: Phylogenetic analysis of SAURs from C. sinensis and A. thaliana.
(A) The phylogenetic tree was built using the maximum likelihood (ML) method, with 1,000 bootstrap replicates. The SAURs in the two species are classified into eight groups, each with distinct branch colors. Branches supported by bootstrap values ≥50% are indicated at the nodes. Red and blue circles outside the branches represent A. thaliana and C. sinensis, respectively. At: A. thaliana; Cs: C. sinensis. (B) Subfamily member statistics of SAUR gene family in C. sinensis and A. thaliana. Red and blue bars represent A. thaliana and C. sinensis, respectively.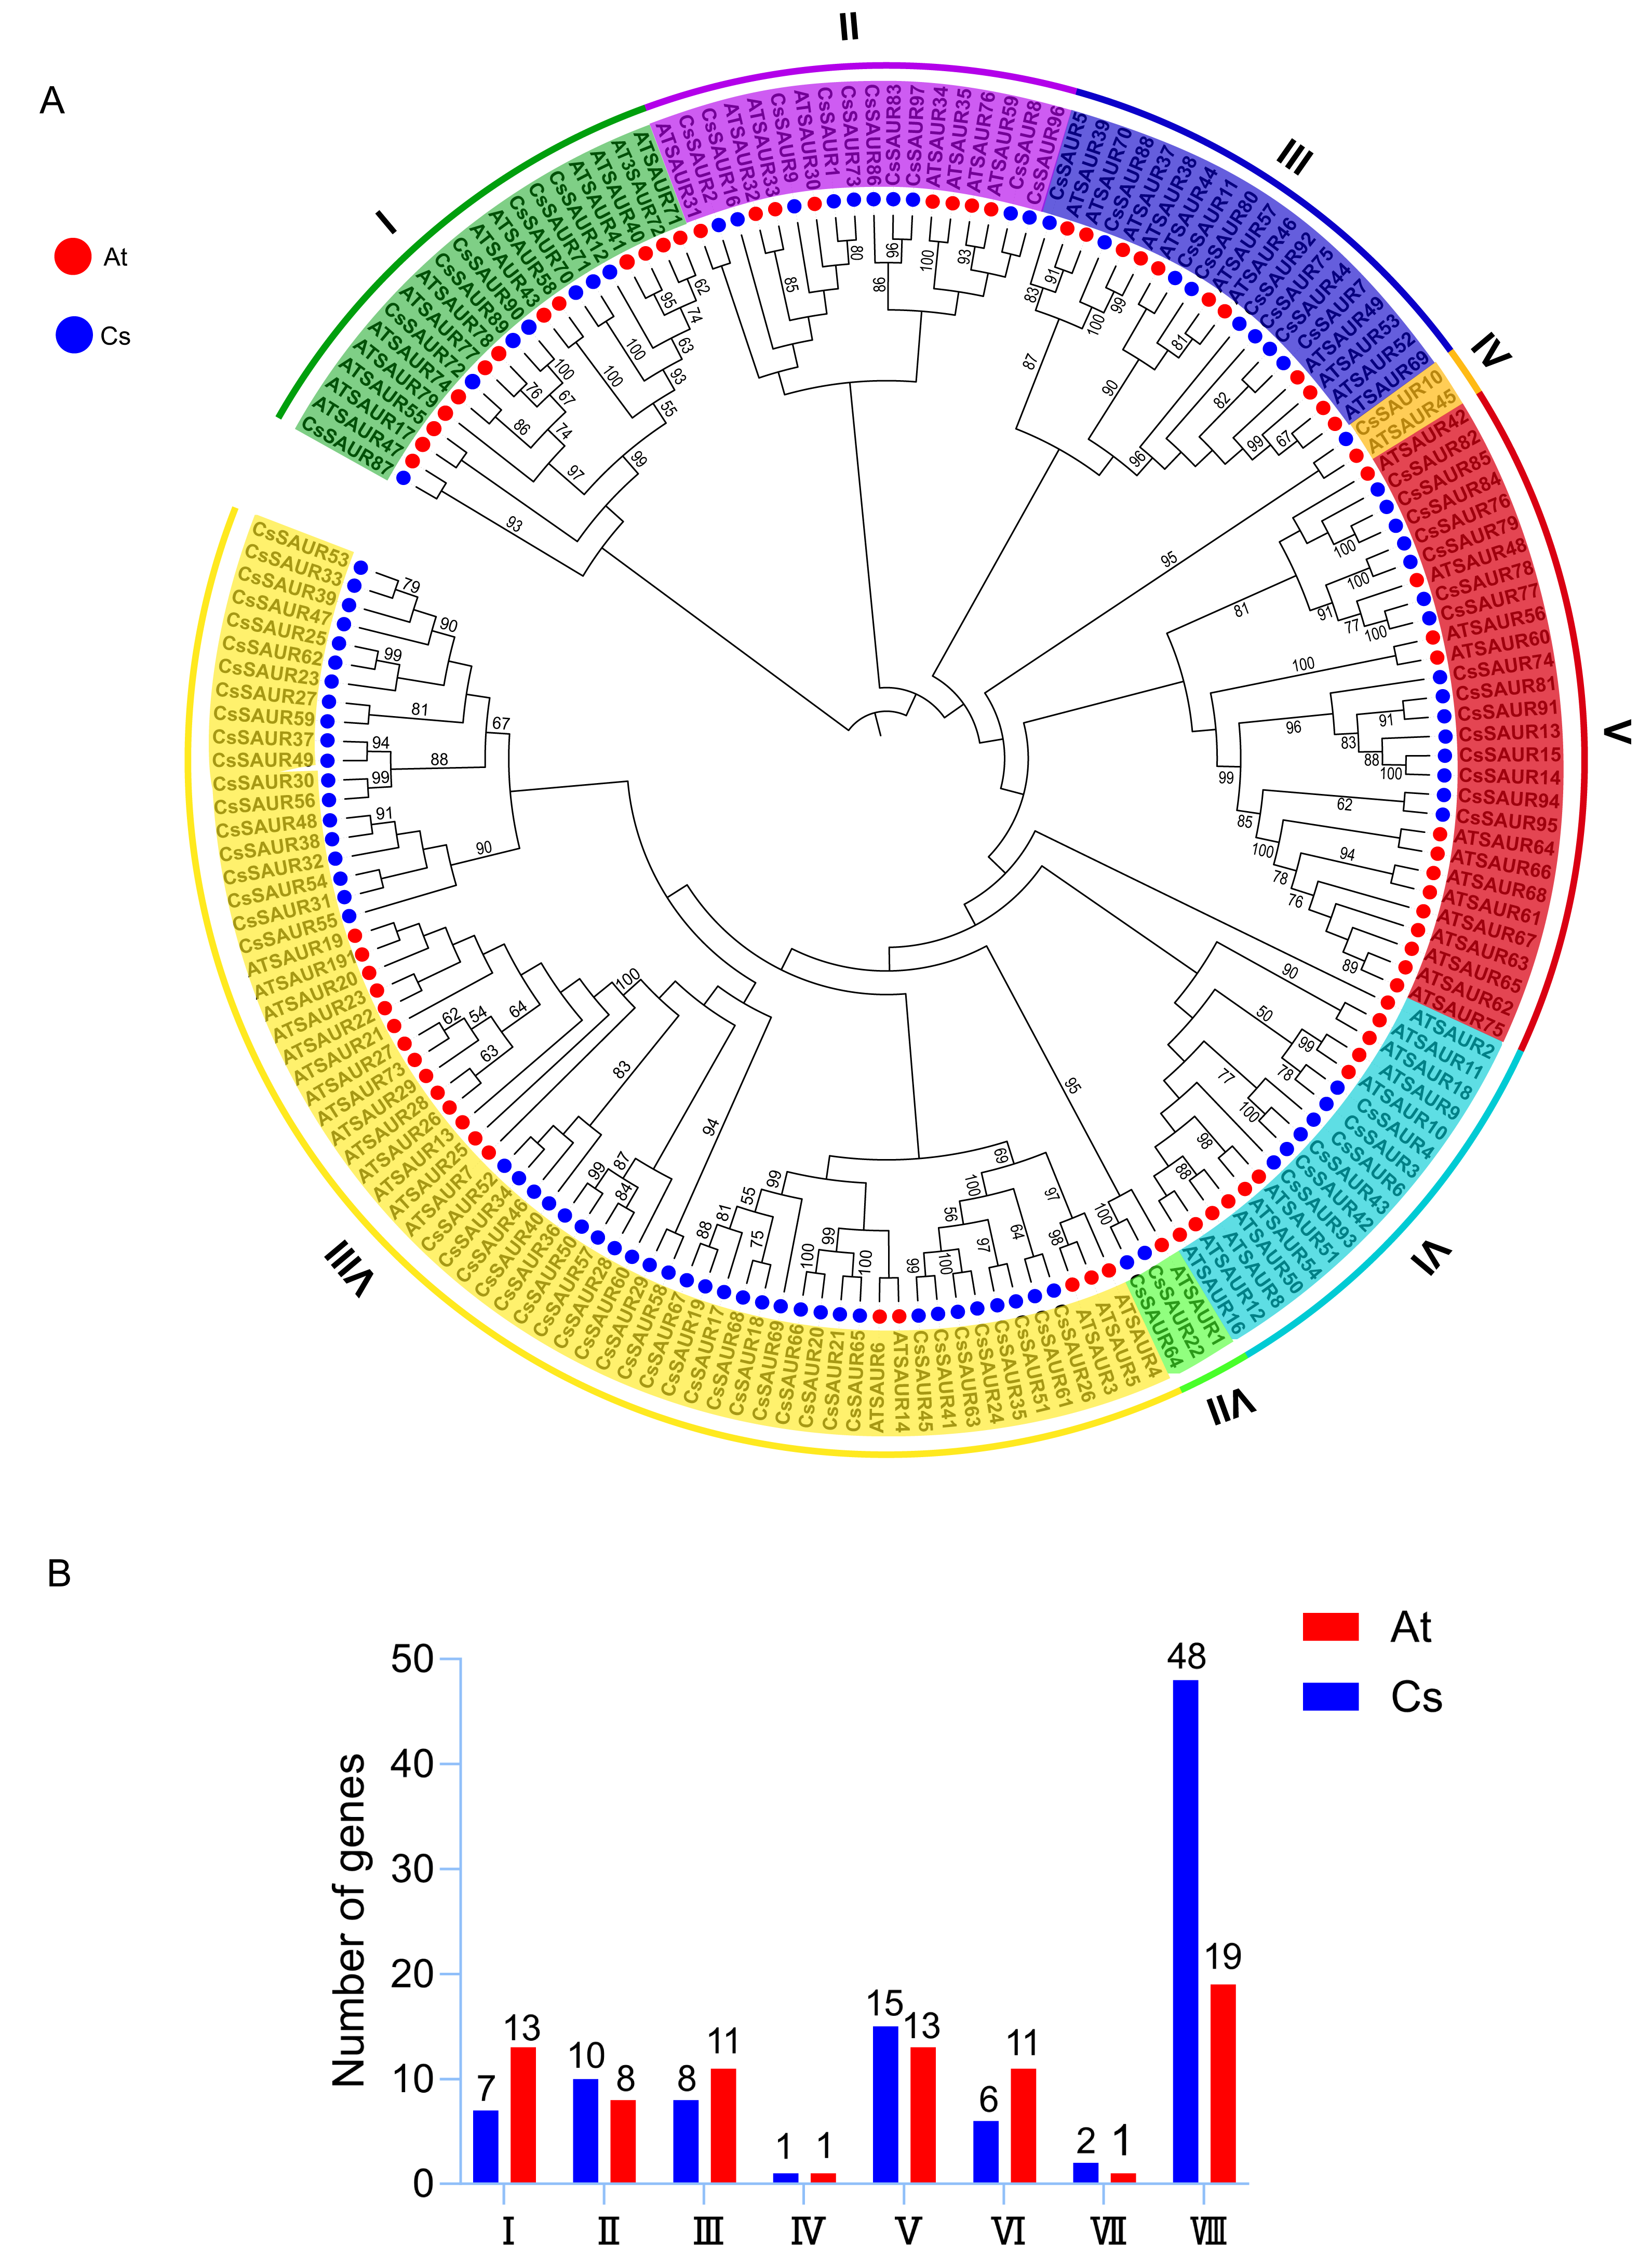
All SAUR subfamilies include members from both C. sinensis and A. thaliana (Fig. 1B). Group IV is notable for containing only one member from each species, tea and Arabidopsis, specifically CsSAUR10 and AtSAUR45. Although these genes exhibit moderate sequence similarity (62.12% by BLASTP), synteny analysis demonstrates that they are not orthologs (Fig. 2), which suggests independent evolutionary origins. Therefore, despite their phylogenetic grouping, the biological functions of CsSAUR10 and AtSAUR45 are likely to have diverged substantially. In contrast, the other groups exhibit different numbers of SAUR genes between the two species. Specially, a strikingly expansion was observed in Group VIII, with tea plant containing 48 CsSAURs compared to only 19 AtSAURs, which implies that Camellia lineage might have undergone large-scale gene gain events in Group VIII during its evolution.
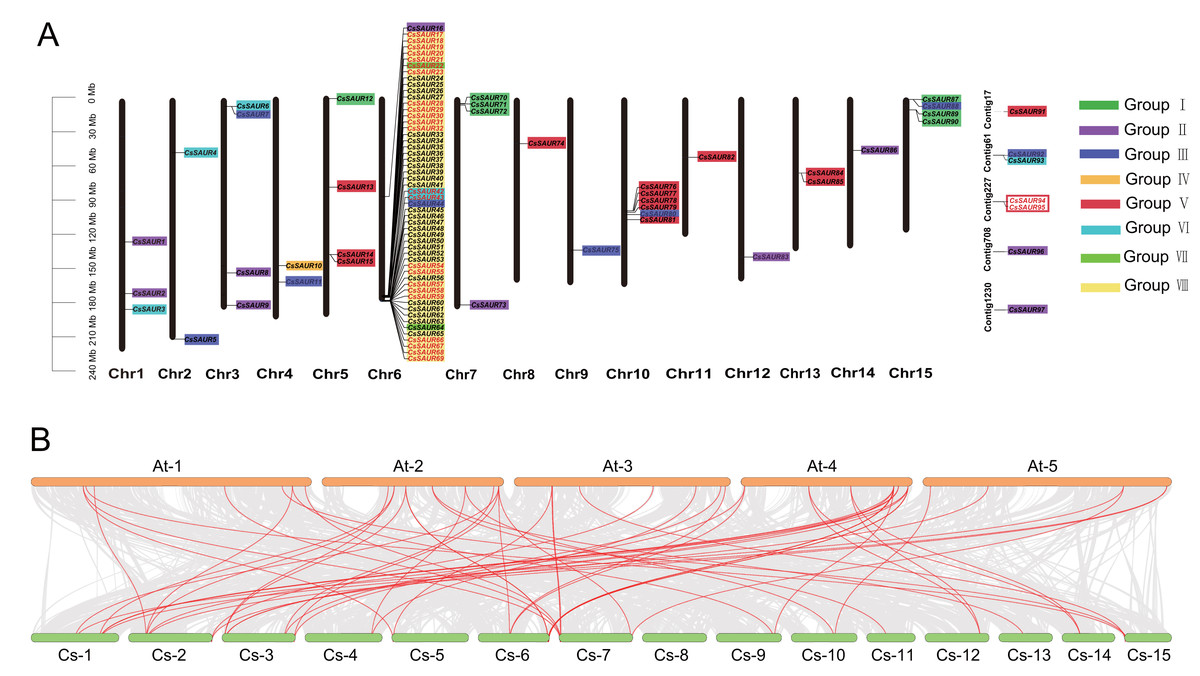
Figure 2: Chromosomal distribution and synteny analysis of CsSAUR gene family.
(A) Chromosomal distribution and gene duplication of CsSAUR gene family. Each chromosome has its number shown at the bottom. Genes that are duplicated in tandem are marked in red. The scale bar on the left represents in mega-bases. The color-coding of genes by their group (I–VIII) facilitates the visualization of their distribution and clustering patterns across the different chromosomes. (B) Synteny analysis of SAUR genes between C. sinensis and A. thaliana. Chromosomes are colored greenish-yellow (C. sinensis) and orange (A. thaliana); gray lines connect collinear blocks; red lines highlight SAUR orthologs.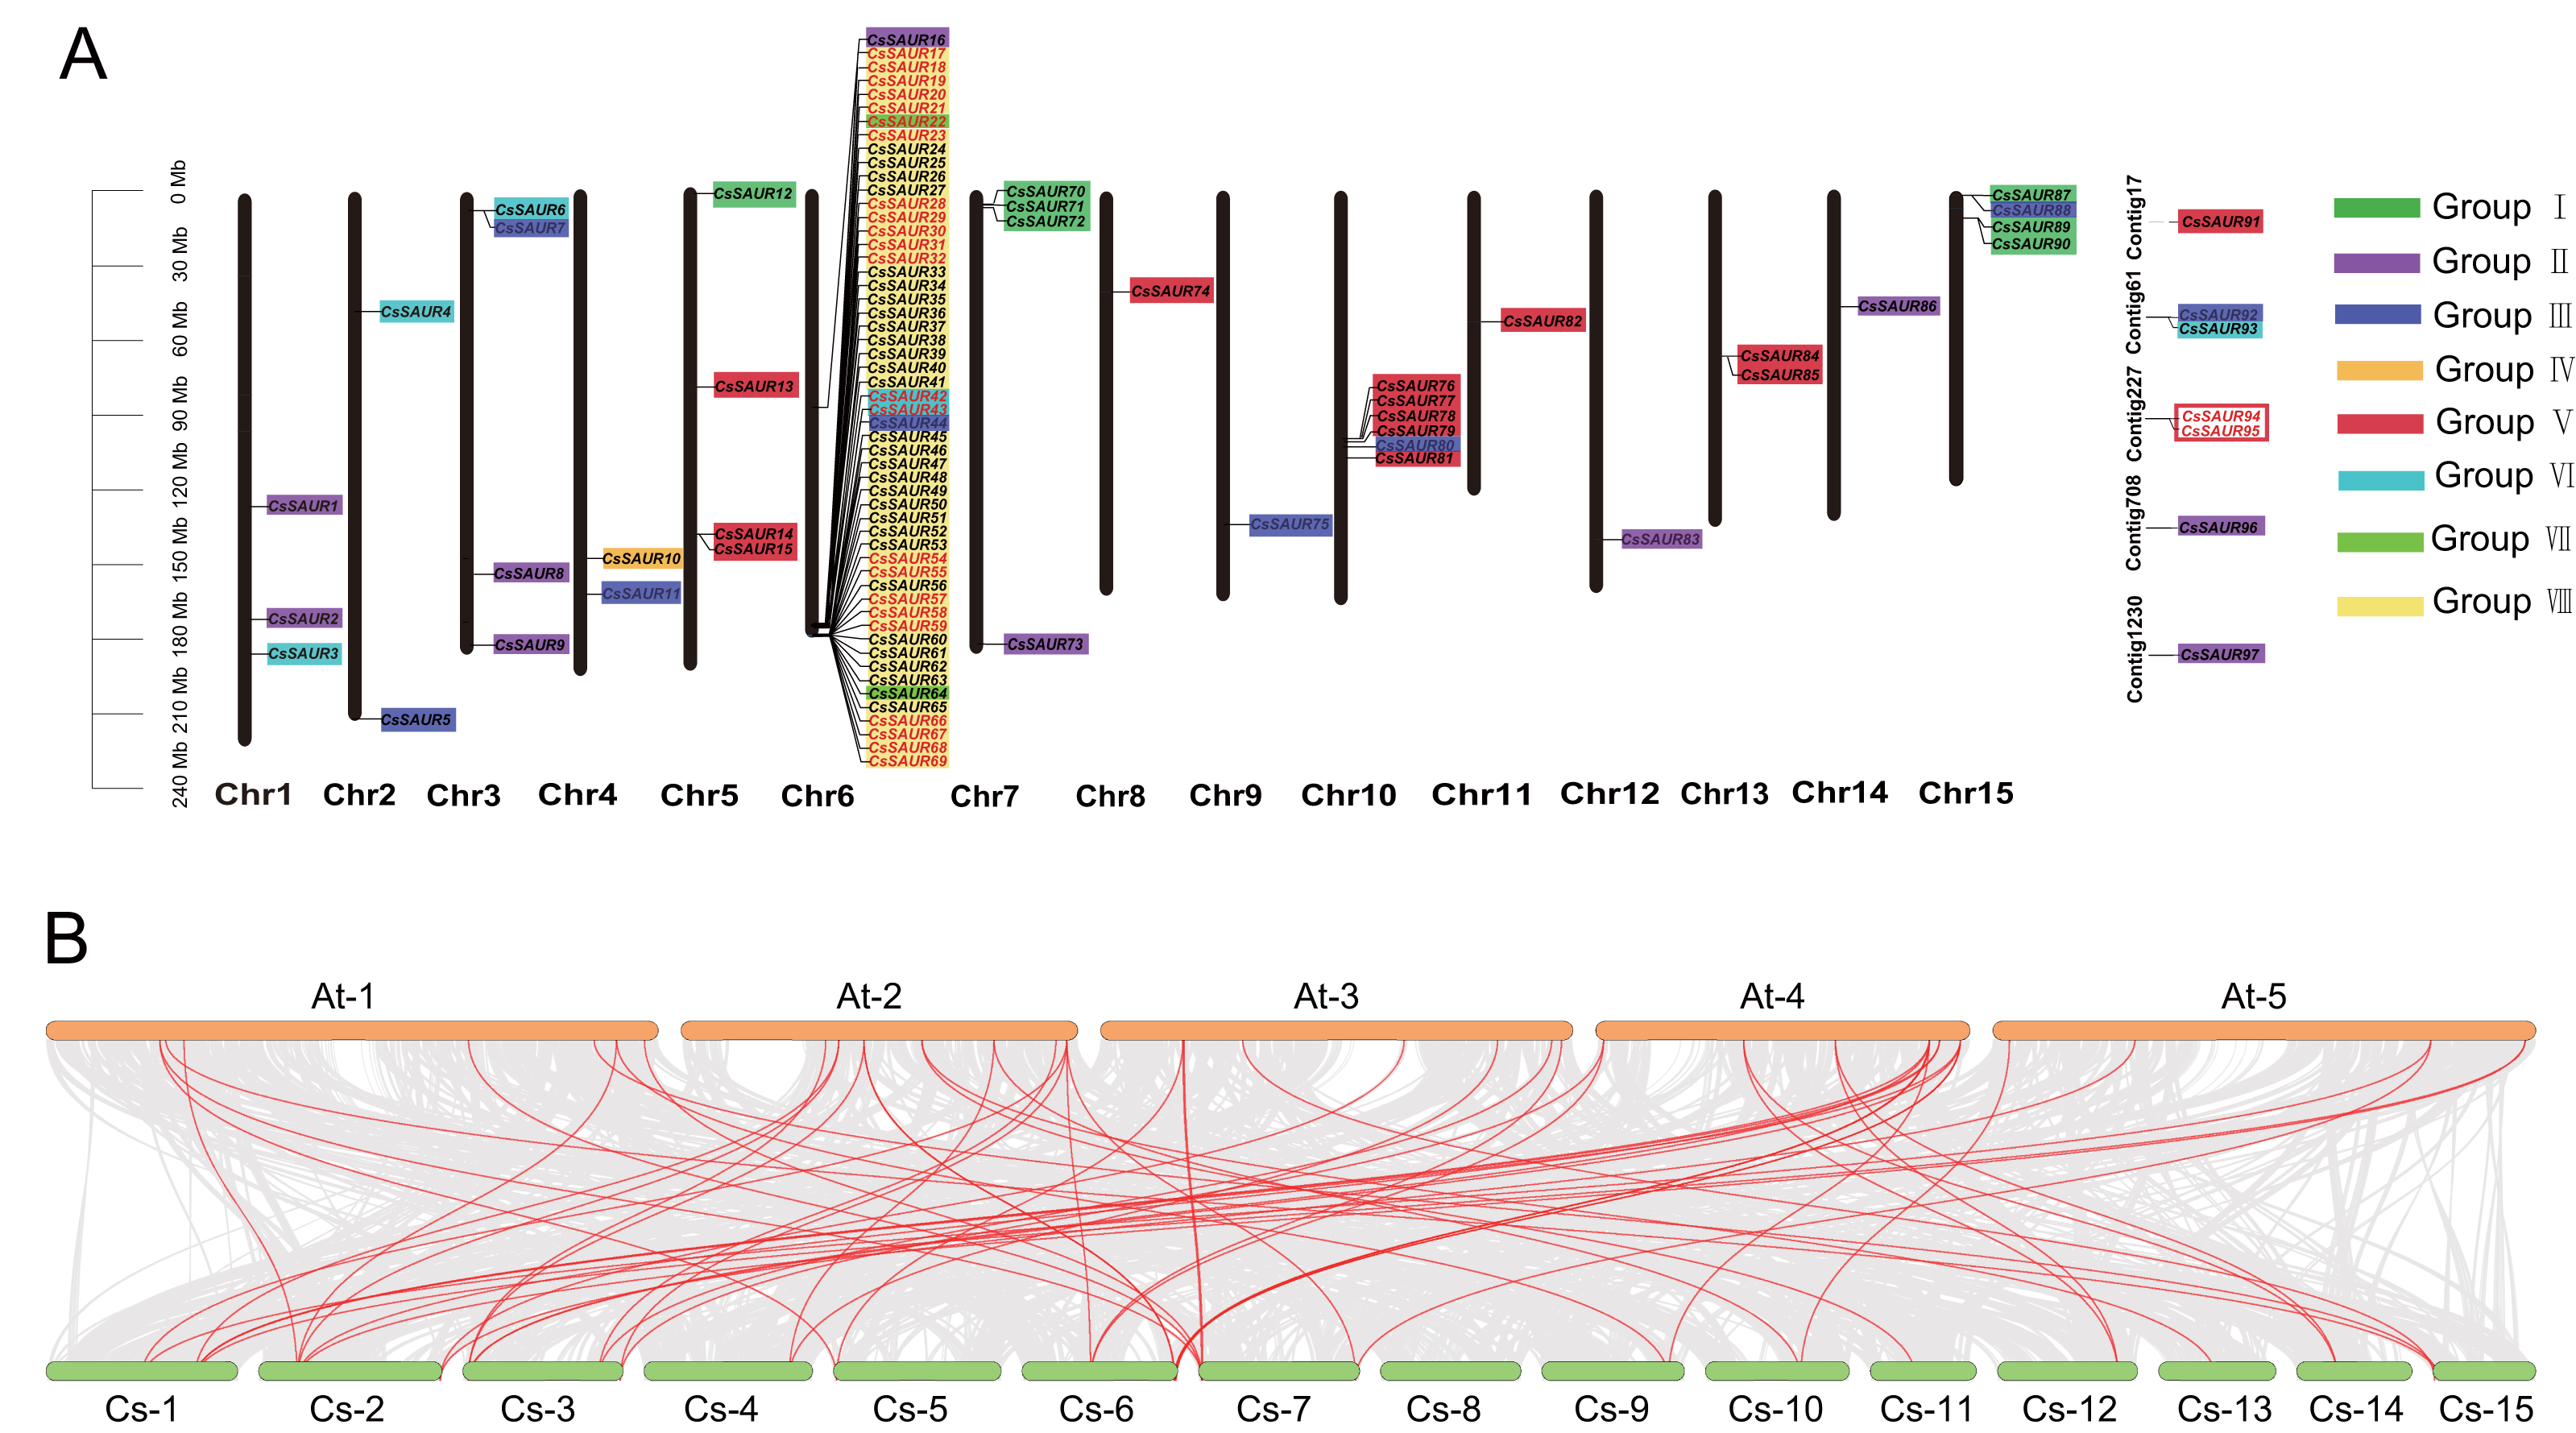
Chromosomal distribution and synteny analysis of CsSAUR gene family
As illustrated in Fig. 2A, the 90 CsSAUR genes are unevenly distributed across 15 chromosomes. For instance, up to 53 CsSAUR genes were present on chromosome 6, while only one gene was observed on chromosome 8, 9, 11, 12, and 14. Additionally, seven CsSAUR genes are located to unassembled contig fragments, reflecting gaps in the current genome assembly.
To investigate syntenic relationship of SAUR genes, we performed collinearity analysis within C. sinensis and between C. sinensis and A. thaliana (Fig. 2, Tables S3 and S4). Among CsSAUR gene family, 25 CsSAURs (∼26%) originated from tandem duplication (TD), which exhibits coherent repeats (Fig. 2A). These clustered genes are distributed as follows: CsSAUR17-23, CsSAUR28-32, CsSAUR54-55, CsSAUR57-59, and CsSAUR66-69 in Group VIII; CsSAUR42-43 in Group VI; and CsSAUR94-95 in Group V. In addition, 44 CsSAUR paralogue gene pairs were generated by segmental duplication (SD), which involves 47 genes accounting for 48% (Table S3). A total of 24 gene pairs were distributed in Group VIII; eight in Group II; four in Group III; and three in Group VI. Notably, some gene clusters that resemble tandem arrays are formed when duplicated segments are inserted in close proximity to their original location. These results suggest that both segmental and tandem duplications contribute to the expansion of the SAUR gene family in tea plants, with the segmental duplication exerting a stronger impact, particularly on the Group VIII subfamily, which explaining why the Group VIII in tea plant has a significantly larger size compared to Arabidopsis.
In addition, interspecies synteny analysis revealed 63 orthologous gene pairs between 37 CsSAURs and 42 AtSAURs (Table S4). A skewed distribution of these pairs was observed across subfamilies: they were abundant in subfamilies I (9), II (13), III (8), VI (14), and VIII (10), absent in IV and VII, V (2) and included seven cross-subfamily pairs. These SAUR gene pairs may play similar biological roles in plant growth and environmental adaptation.
As a result, most CsSAUR gene pairs showed Ka/Ks ratios < 1, indicating that purifying selection acts as the primary evolutionary driver of SAUR gene family in the tea plant. Only three of them exhibited Ka/Ks ratios > 1. Specifically, the Ka/Ks ratios of CsSAUR33-CsSAUR47, CsSAUR33-CsSAUR53, and CsSAUR32-CsSAUR48 are 2.66, 3.21, and 1.03, respectively. Among the three pairs identified, CsSAUR33–CsSAUR47 and CsSAUR33–CsSAUR53 exhibit particularly high Ka/Ks values (2.66 and 3.21, respectively), pointing to strong positive selection and a high likelihood of neofunctionalization. These genes may have evolved to regulate tea-specific traits, such as the rapid growth of new tea shoots or the biosynthesis regulation of secondary metabolites (e.g., tea polyphenols, caffeine). Notably, CsSAUR33 appears in two of the three positively selected pairs, suggesting it may represent an evolutionary “hotspot” for functional innovation in tea plants. After its duplication, the copies (CsSAUR47 and CsSAUR53) may have diverged rapidly to take on new, specialized roles. In contrast, the CsSAUR32–CsSAUR48 pair, with a Ka/Ks ratio just above 1 (1.03), appears to be under relatively weaker positive selection. This may reflect an early stage of functional divergence or more subtle functional alterations.
Gene structure and conserved motif analysis of CsSAUR genes
Phylogenetic analysis classified 97 CsSAURs into eight evolutionary groups and 19 robust sister pairs exhibit exceptionally strong phylogenetic support (bootstrap values ≥99%), including notable associations such as CsSAUR89/CsSAUR90, CsSAUR70/CsSAUR71, and CsSAUR8/CsSAUR96 (Fig. 3A). Gene structure analysis revealed that CsSAUR genes within same group were correlated with more similar intron/exon structures and motif patterns (Figs. 3B and 3C). As depicted in Fig. 3B, only 16 genes (16.5%) contain introns, with a maximum of two introns observed across Group I–VIII. Specifically, 13 members including CsSAUR2 have only one intron, while CsSAUR41, 45, and 87 possess two introns each. In addition, CsSAUR genes contain one or two exons, demonstrating relatively simple genomic structure. Among them, 12 members (12.4%) possess two exons, while the majority retain single exon. This kind of relatively simple gene structure facilitates the expansion of CsSAUR gene family.
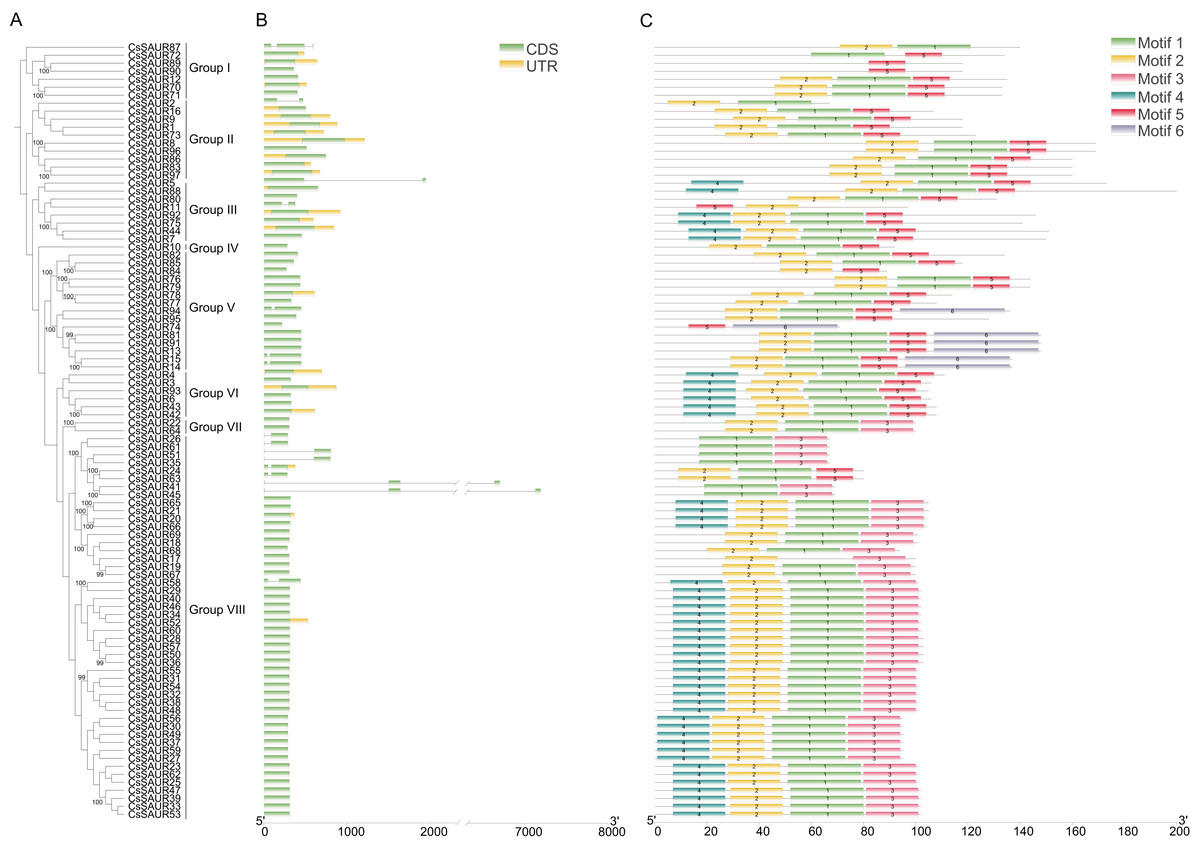
Figure 3: Phylogenetic relationship, gene structure and conserved motif analysis of CsSAUR genes.
(A) Phylogenetic tree of 97 CsSAURs. A phylogenetic tree was built using Maximum Likelihood method with 1000 bootstrap replicates, based on the full-length amino acid sequences of 97 CsSUARs. (B) The structure of CsSAUR genes. Untranslated regions, exons and introns are represented by yellow boxes, green boxes and gray lines, respectively. The exon length was indicated by the scale at the bottom. (C) Distribution of conserved motifs in CsSAURs. The putative motifs (1–6) are indicated in different colored boxes. The length of protein was denoted by the scale at the bottom.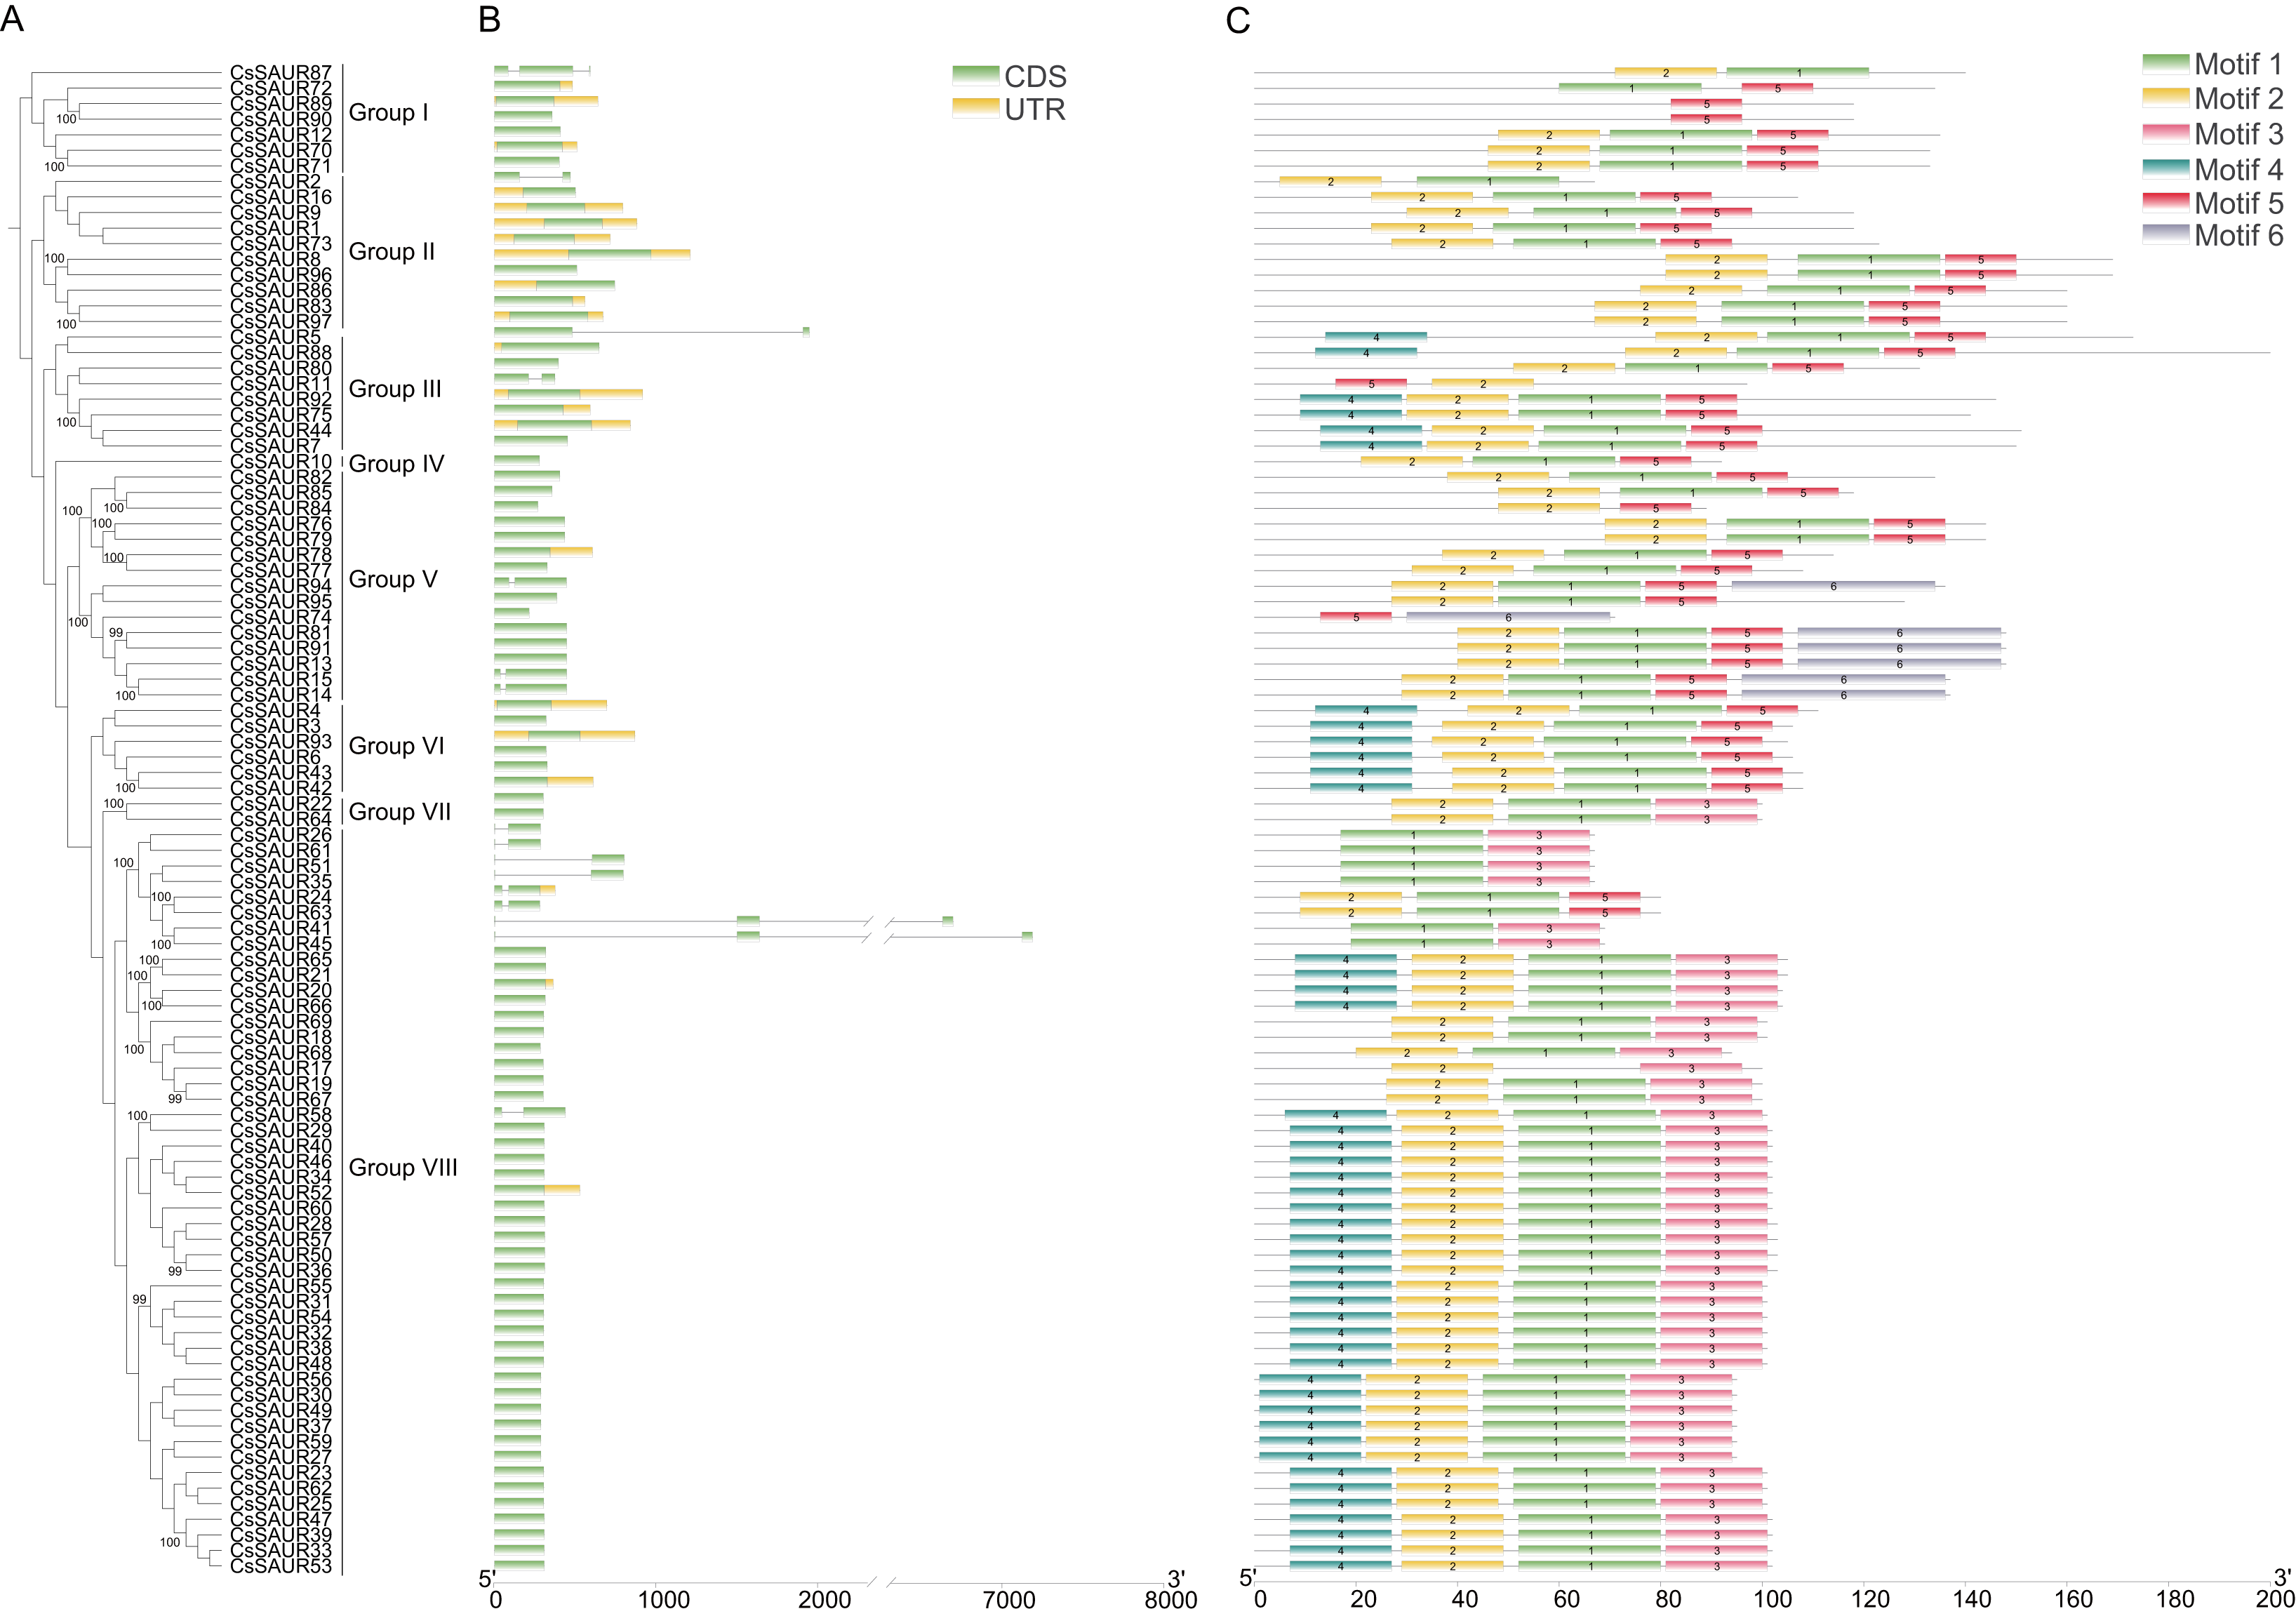
MEME identified 6 distinct conserved motifs on the 97 CsSAUR proteins (Figs. 3C and 4). Among these, motifs 1 and 2 were present in nearly all CsSAURs (96 out of 97), indicating that they may be essential for fundamental SAUR activities, such as auxin responsiveness. Also, these motifs localize to the N-terminal or central regions of the proteins, corresponding to the conserved SAUR core domain reported in Arabidopsis and other species, which is involved in protein stability and interactions with regulators such as 14-3-3 proteins and PP2C.D phosphatases (Ren & Gray, 2015; Spartz et al., 2014). Conversely, motif 6 was found in only seven CsSAURs from Group V, suggesting a role in functional diversification distinct from the majority of the CsSAUR family. Within Group VIII, the largest subgroup with 48 members, motifs 3 and 4 co-occurred in 46 proteins, indicating they may serve as signature motifs associated with the subfamily’s functional specialization, possibly in flower development. The rationale of this is supported by Tissue-specific expression analysis ationale, with nearly half of Group VIII members (21 out of 48) showing flower-specific expression. In contrast, motif 5 is rare in Group VIII (only present in CsSAUR24 and CsSAUR63) but conserved across all other groups (Groups I–VII), except for CsSAUR87 in Group I. This discontinuous phylogenetic distribution implies that motif 5 may represent an ancestral functional module that became dispensable during the diversification of Group VIII.
Although internal branching within Group VIII is evident in the phylogenetic tree (Fig. 1), all of its members were classified into a single subfamily in this study due to shared gene structure and core conserved motifs (Fig. 3). Yet, CsSAUR genes within Group VIII show markedly lower structural similarity to CsSAURs in other Groups. This pattern suggests potential functional conservation of CsSAUR genes within the Group VIII alongside functional differentiation from other subfamilies, possibly reflecting evolutionary adaptation to distinct biological processes.
Cis-elements in the promoters of CsSAUR genes and GO enrichment analysis
To elucidate the potential regulatory mechanism of CsSAUR genes in response to external auxin stimuli, we conducted an analysis to identify candidate auxin-responsive cis-elements located within the promoter regions (+2,000 bp upstream of ATG start codon) of CsSAUR genes. Three types of auxin-responsive cis-elements, AuxRR-core, AuxRE and TGA-element, were detected by searching the promoter sequence against the PlantCARE database (Fig. 5A, Tables S6 and S7). Almost 56.7% of CsSAUR genes lack auxin responsive elements, such as CsSAUR9, 34, and 96, indicating that not all CsSAURs are responded to auxin.
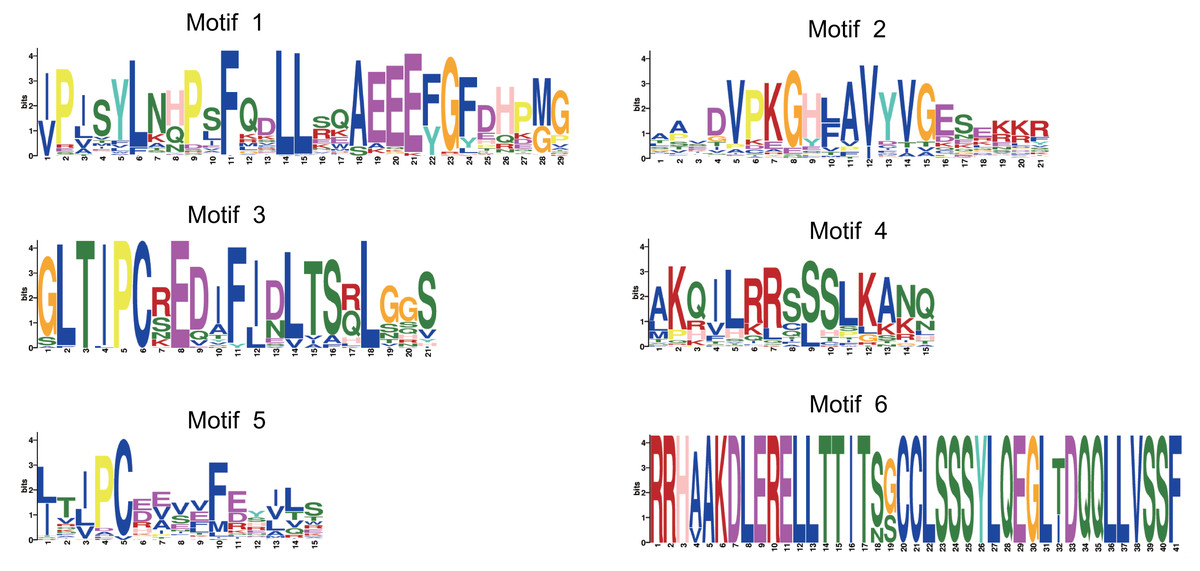
Figure 4: The conserved consensus motif of CsSAURs as determined by MEME analysis.
The symbol heights reflected the relative frequency of occurrence for each specific residue.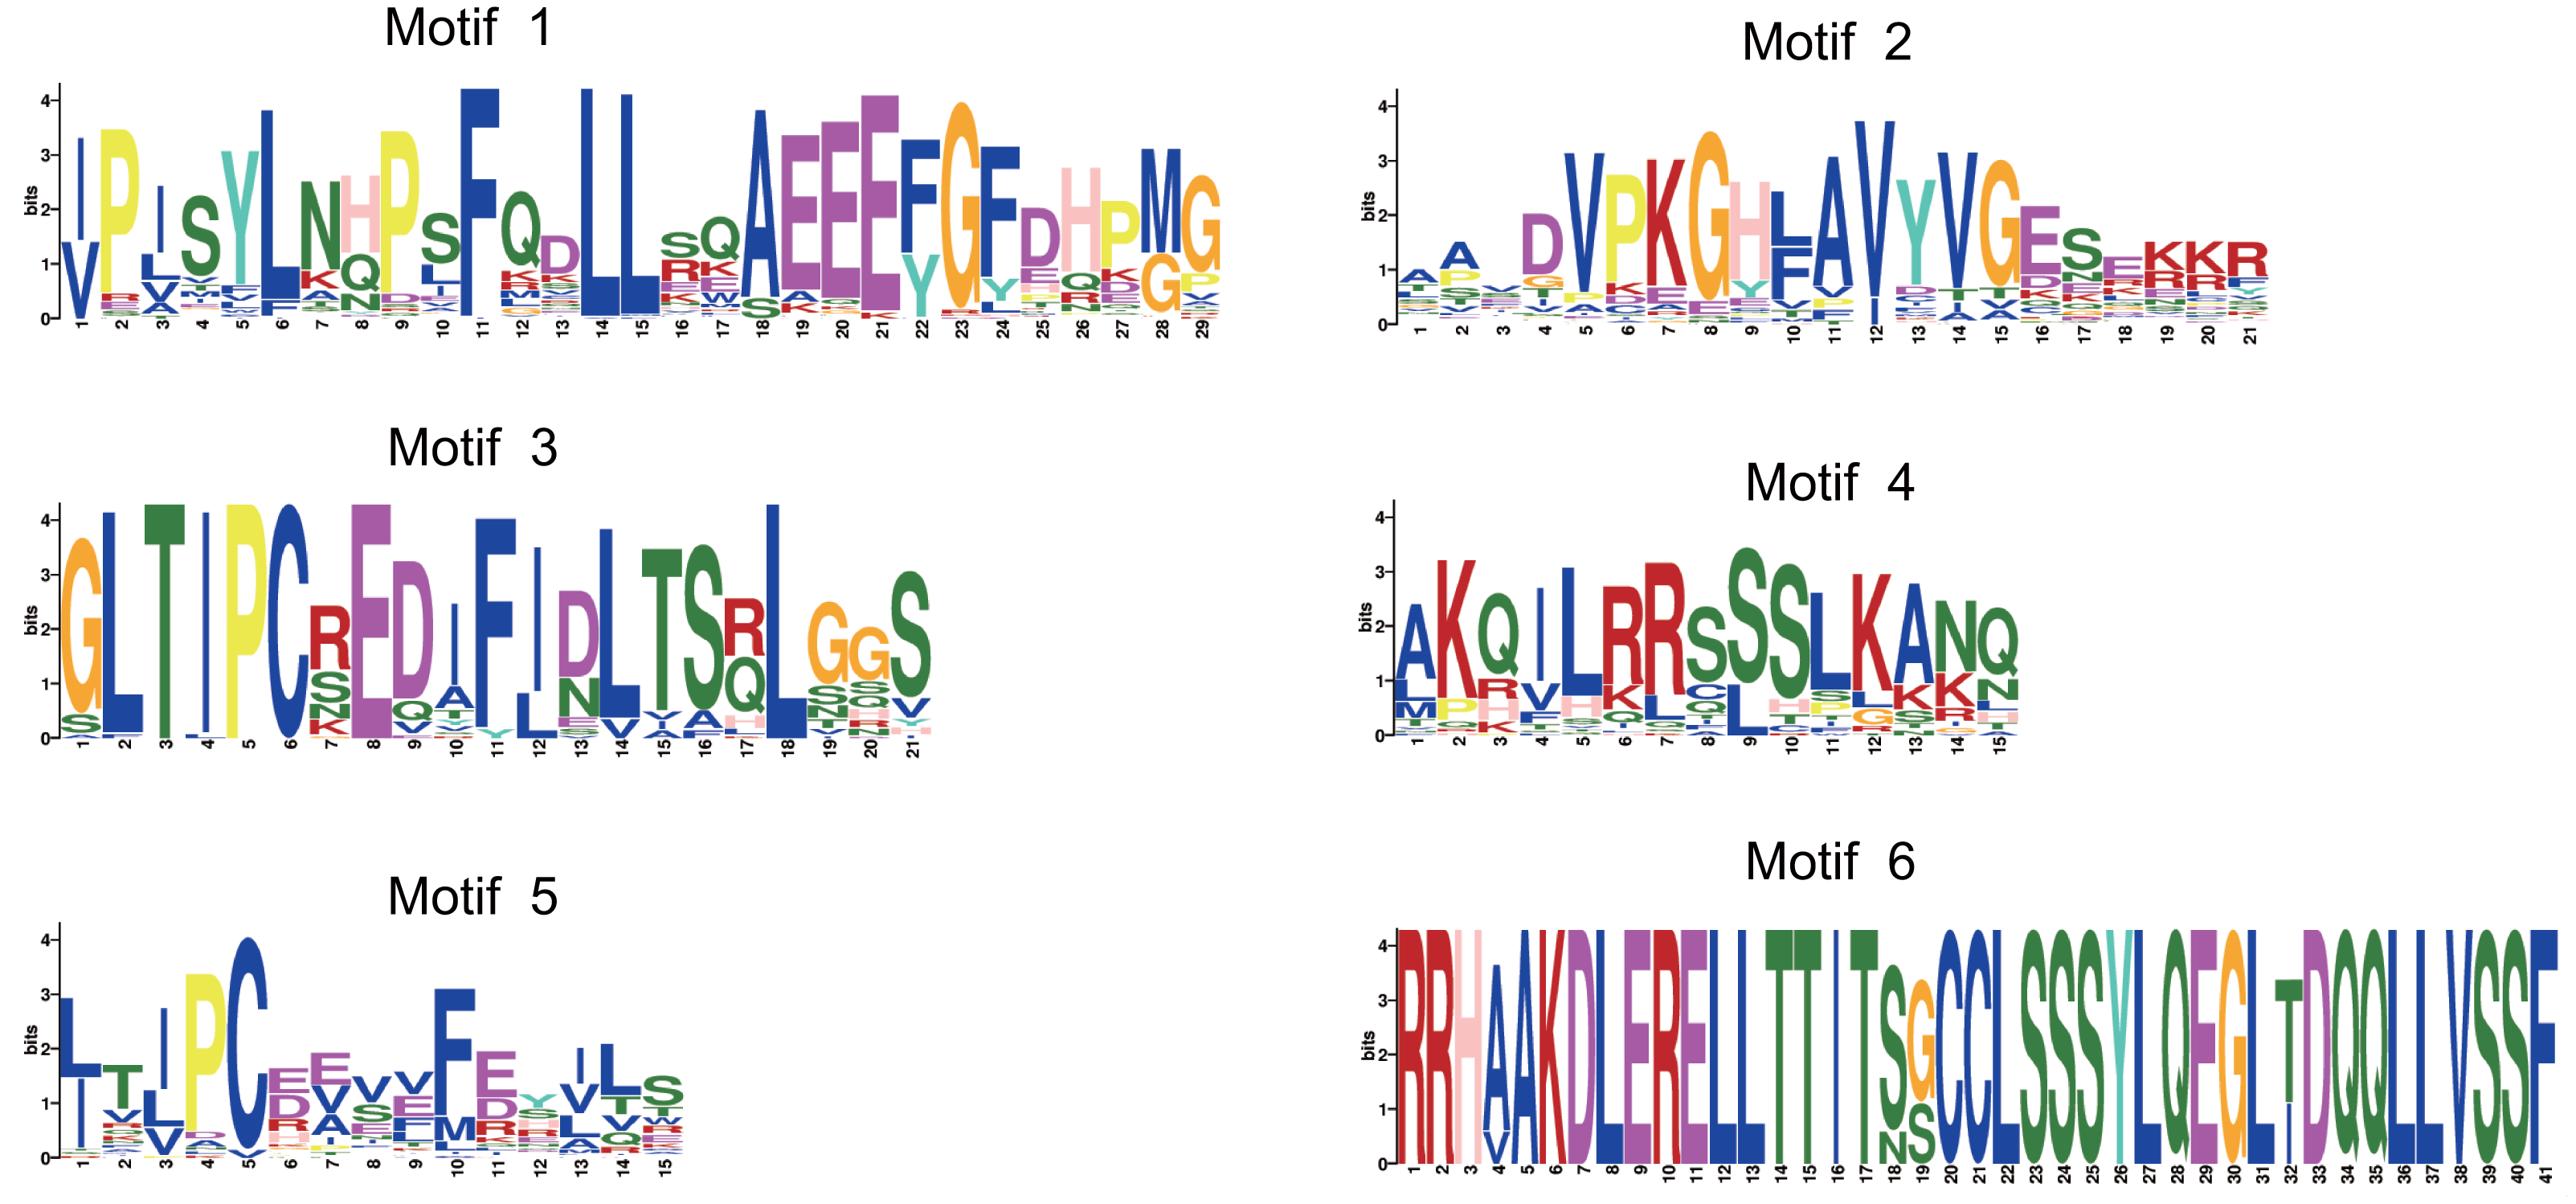
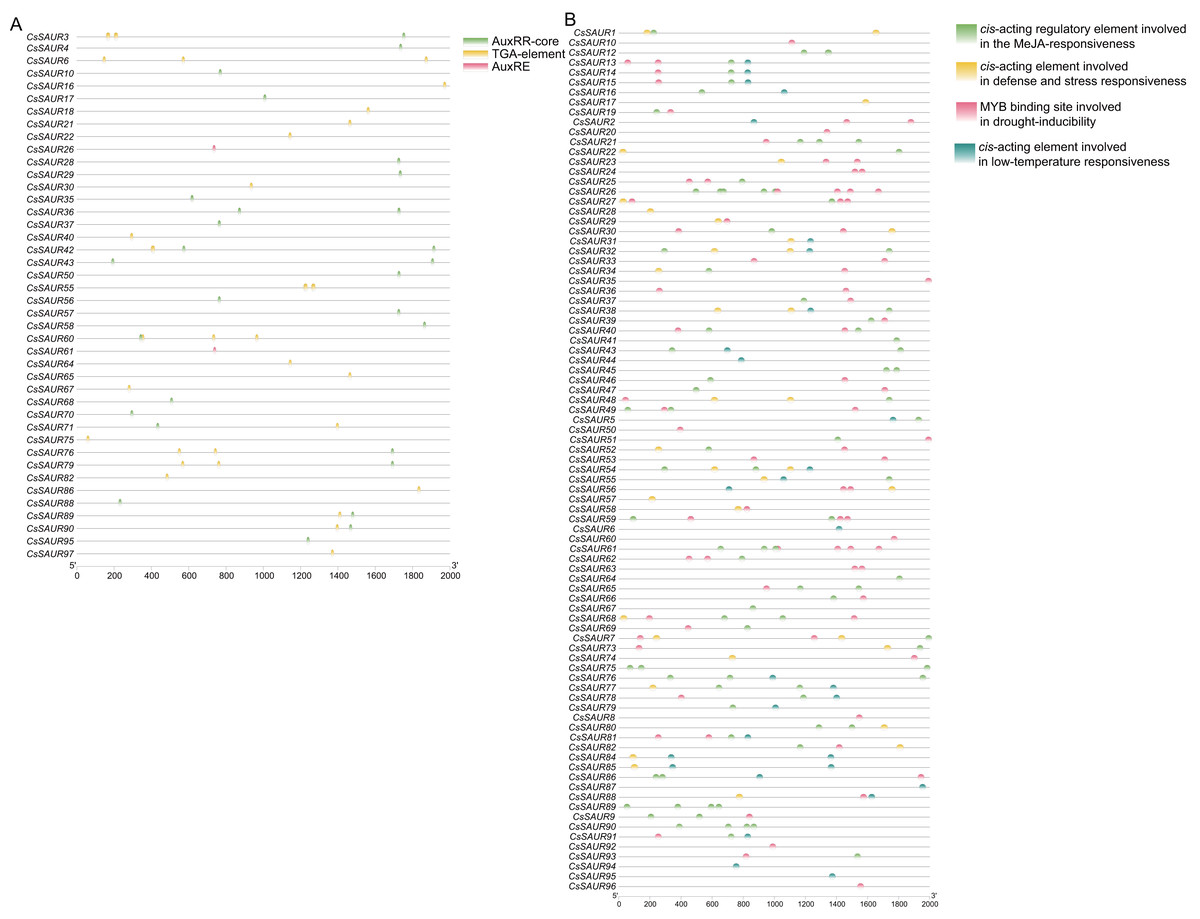
Figure 5: Predicted auxin-responsive cis-elements in CsSAUR promoters.
The promoter sequences (+ 2,000 bp) of CsSAUR genes were analyzed using PlantCARE. (A) Auxin-responsive cis-elements. (B) Cis—elements related to abiotic stresses.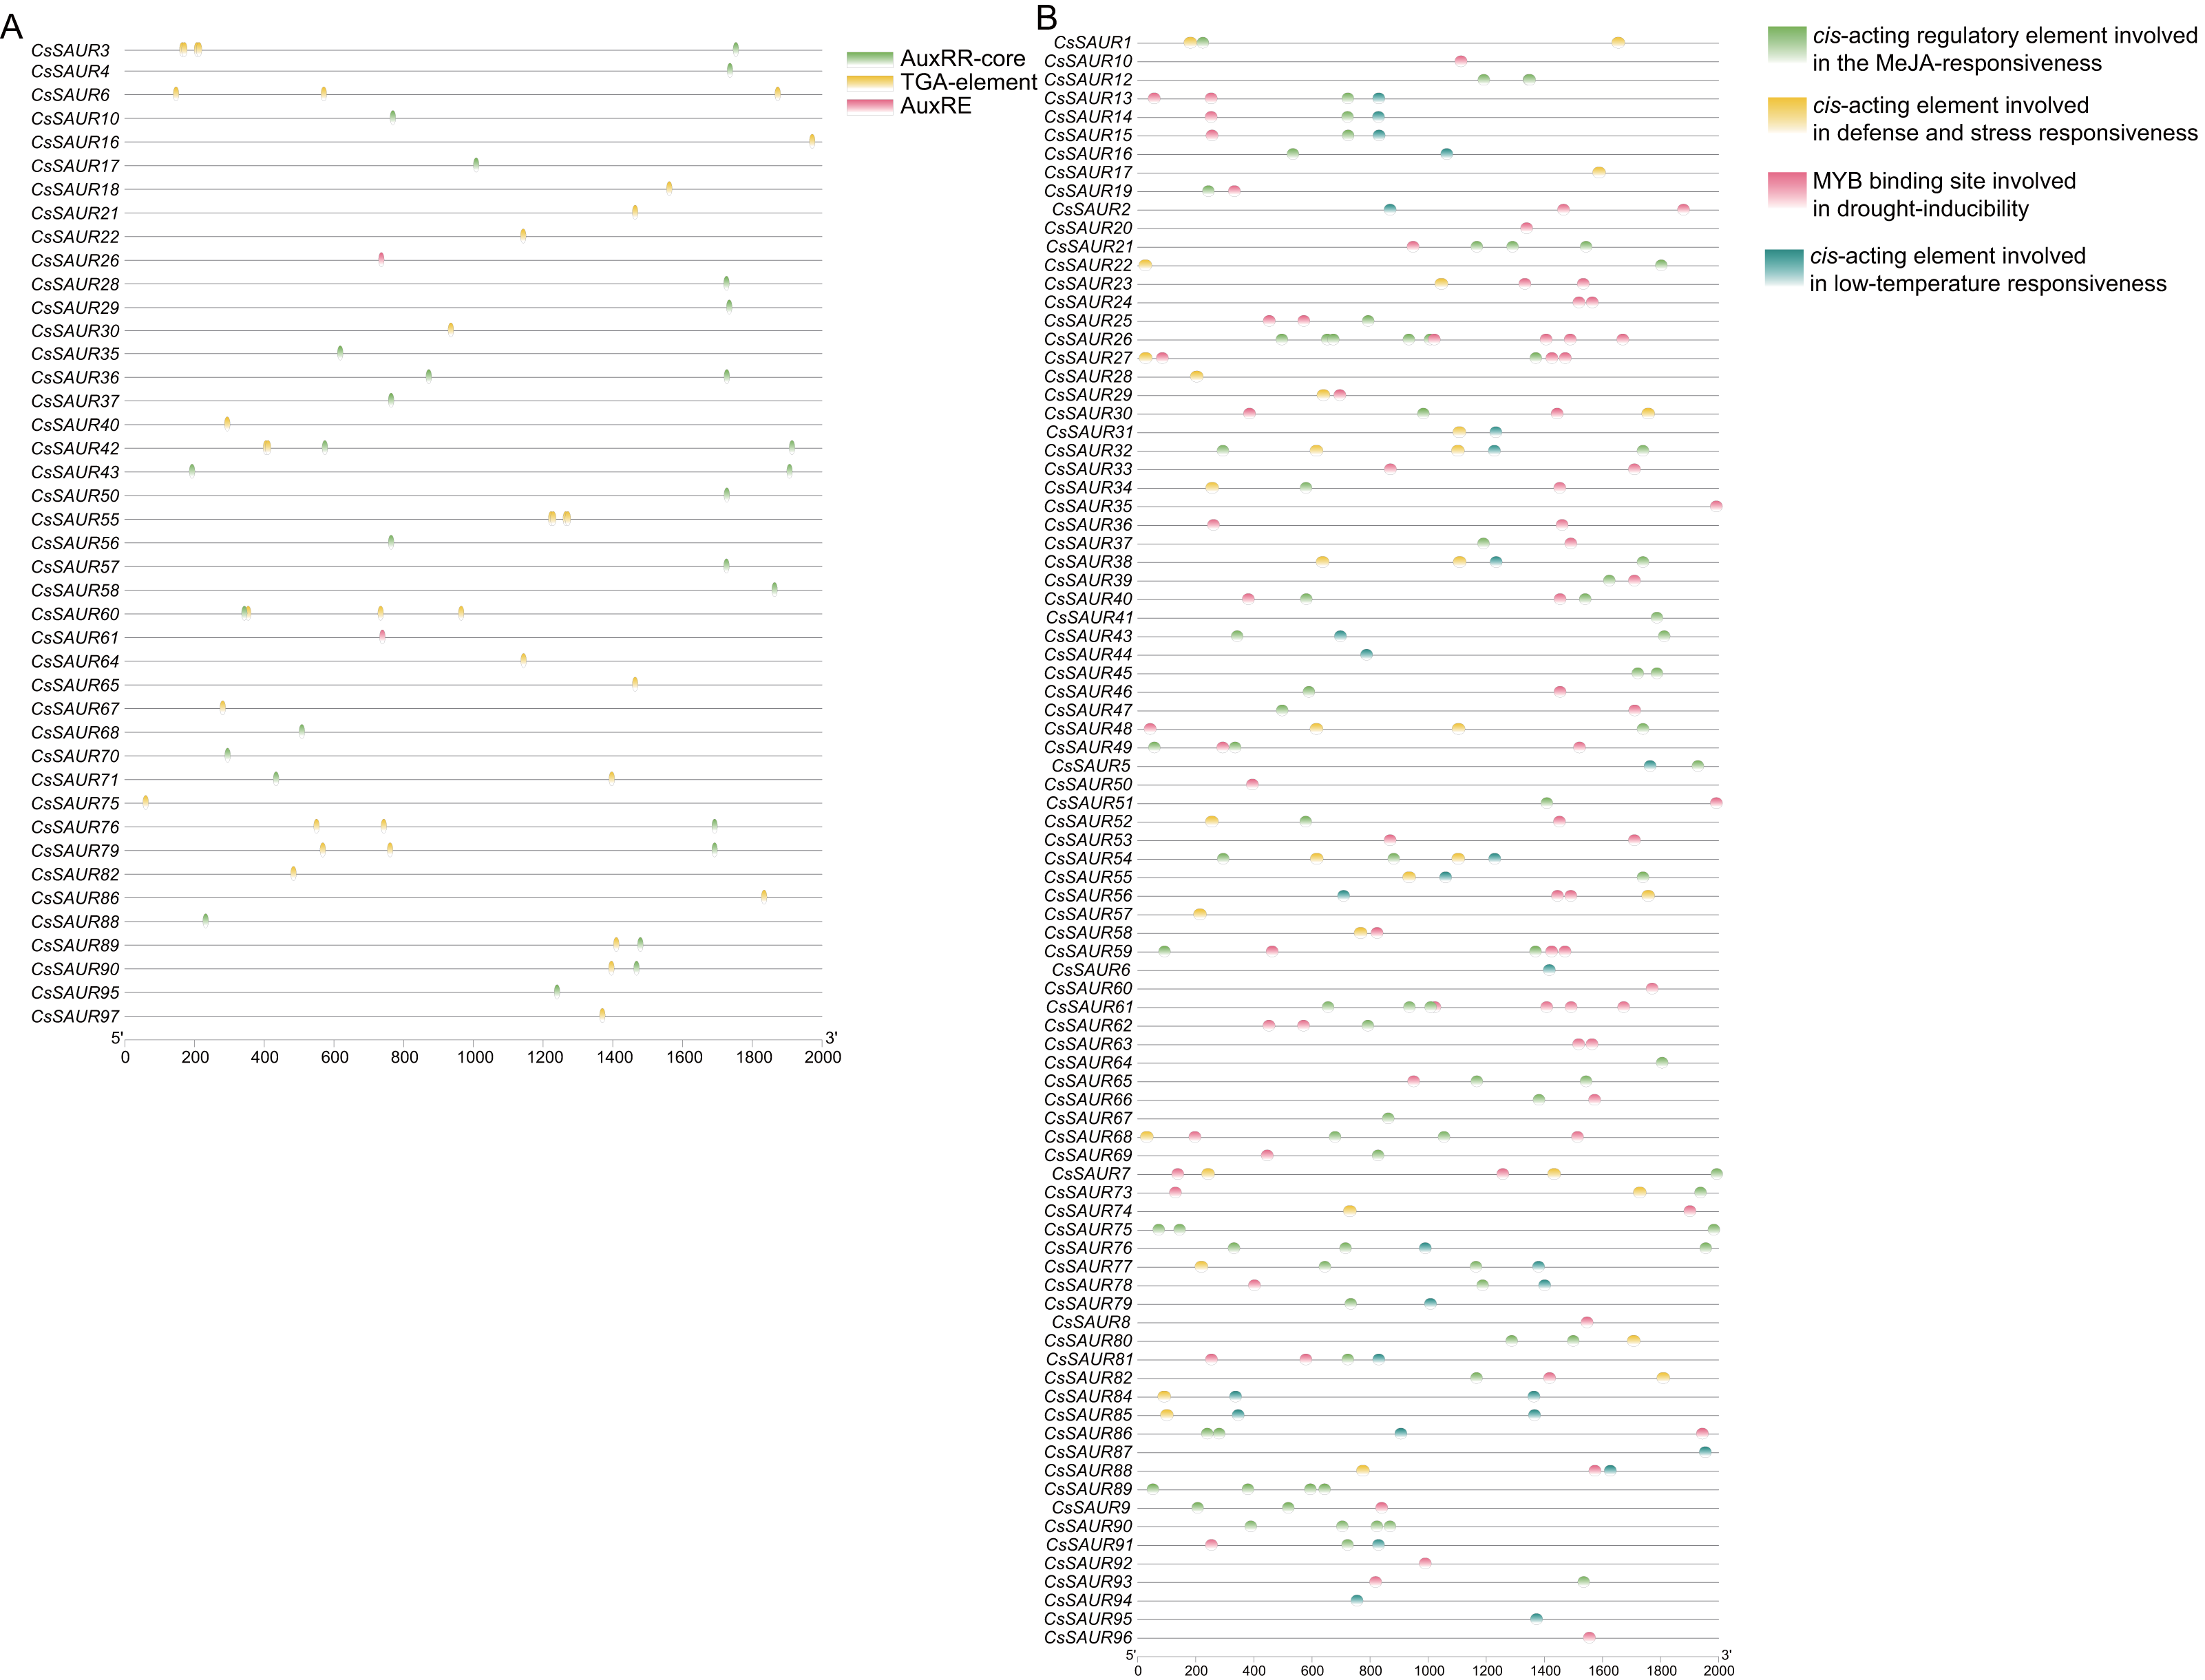
Moreover, the promoters of most members are rich in a variety of cis-elements, including TGACG-motif, ABRE, P-box, GARE-motif, MBSI, G-box, LTR, and MBS. The cis-element analysis indicates that CsSAUR genes can respond to different abiotic stresses including light, low temperature, drought, and phytohormone (e.g., auxin, ABA, MeJA, SA, gibberellin, etc.) and participate in flavonoid biosynthetic pathways (Fig. 5B, Tables S6 and S8).
GO enrichment analysis revealed that CsSAUR2, 10, 12, 70, 71 and 73 are responded to auxin, CsSAUR1 and 9 participated in Ca2+ transportation, CsSAUR34 and 52 responded to stimulus (Table 1). These results suggested that CsSAURs are potentially involved in the biological process described above.
| Gene | GOID | GO name | Type |
|---|---|---|---|
| CsSAUR1 | GO:0006816 | Calcium ion transport | Biological Process |
| CsSAUR9 | GO:0006816 | Calcium ion transport | Biological Process |
| CsSAUR10 | GO:0009733 | Response to auxin | Biological Process |
| CsSAUR12 | GO:0009733 | Response to auxin | Biological Process |
| CsSAUR2 | GO:0009733 | Response to auxin | Biological Process |
| CsSAUR70 | GO:0009733 | Response to auxin | Biological Process |
| CsSAUR71 | GO:0009733 | Response to auxin | Biological Process |
| CsSAUR73 | GO:0009733 | Response to auxin | Biological Process |
| CsSAUR34 | GO:0050896 | Response to stimulus | Biological Process |
| CsSAUR52 | GO:0050896 | Response to stimulus | Biological Process |
| CsSAUR16 | GO:0005739 | Mitochondrion | Cellular Component |
| CsSAUR3 | GO:0005739 | Mitochondrion | Cellular Component |
| CsSAUR4 | GO:0005739 | Mitochondrion | Cellular Component |
| CsSAUR42 | GO:0005739 | Mitochondrion | Cellular Component |
| CsSAUR43 | GO:0005739 | Mitochondrion | Cellular Component |
| CsSAUR6 | GO:0005739 | Mitochondrion | Cellular Component |
| CsSAUR93 | GO:0005739 | Mitochondrion | Cellular Component |
| CsSAUR27 | GO:0005886 | Plasma membrane | Cellular Component |
| CsSAUR29 | GO:0005886 | Plasma membrane | Cellular Component |
| CsSAUR40 | GO:0005886 | Plasma membrane | Cellular Component |
| CsSAUR46 | GO:0005886 | Plasma membrane | Cellular Component |
| CsSAUR58 | GO:0005886 | Plasma membrane | Cellular Component |
| CsSAUR59 | GO:0005886 | Plasma membrane | Cellular Component |
Expression patterns of CsSAUR genes in different tissues
To further determine the potential biologic functions of SAUR genes in tea plant, the expression patterns of 97 CsSAURs were analyzed in various tissues, including the root, stem, apical bud, young leaf, mature leaf, old leaf, flower, and fruit, using the publicly microarray data of TPIA (Fig. 6, Table S9). All SAUR genes in tea plant were differentially expressed among different tissues, suggesting their potential involvements in diverse biological processes. Obviously, CsSAUR60, 61, 63, 65 and 67 in Group VIII displayed negligible expression across all the examined tissues. CsSAUR1, 73, 83, 86, and 97 within Group II have relatively high expression levels in roots, especially CsSAUR73 and 83. As an ortholog of CsSAUR73, AtSAUR32 also shows a highest level in root tissues of Arabidopsis (He et al., 2021). Longitudinal comparisons revealed that flower showed the most extensive CsSAUR gene expression, whereas old leaves displayed the lowest number of gene activation. These observations suggest that CsSAUR genes are strongly related to tea flower development, which aligns with those studies reported previously (Zhang et al., 2023).

Figure 6: A heatmap showing the expression levels of 97 CsSAUR genes across tea plant tissues.
The expression profile of each gene in different tissues is displayed as normalized data (log2).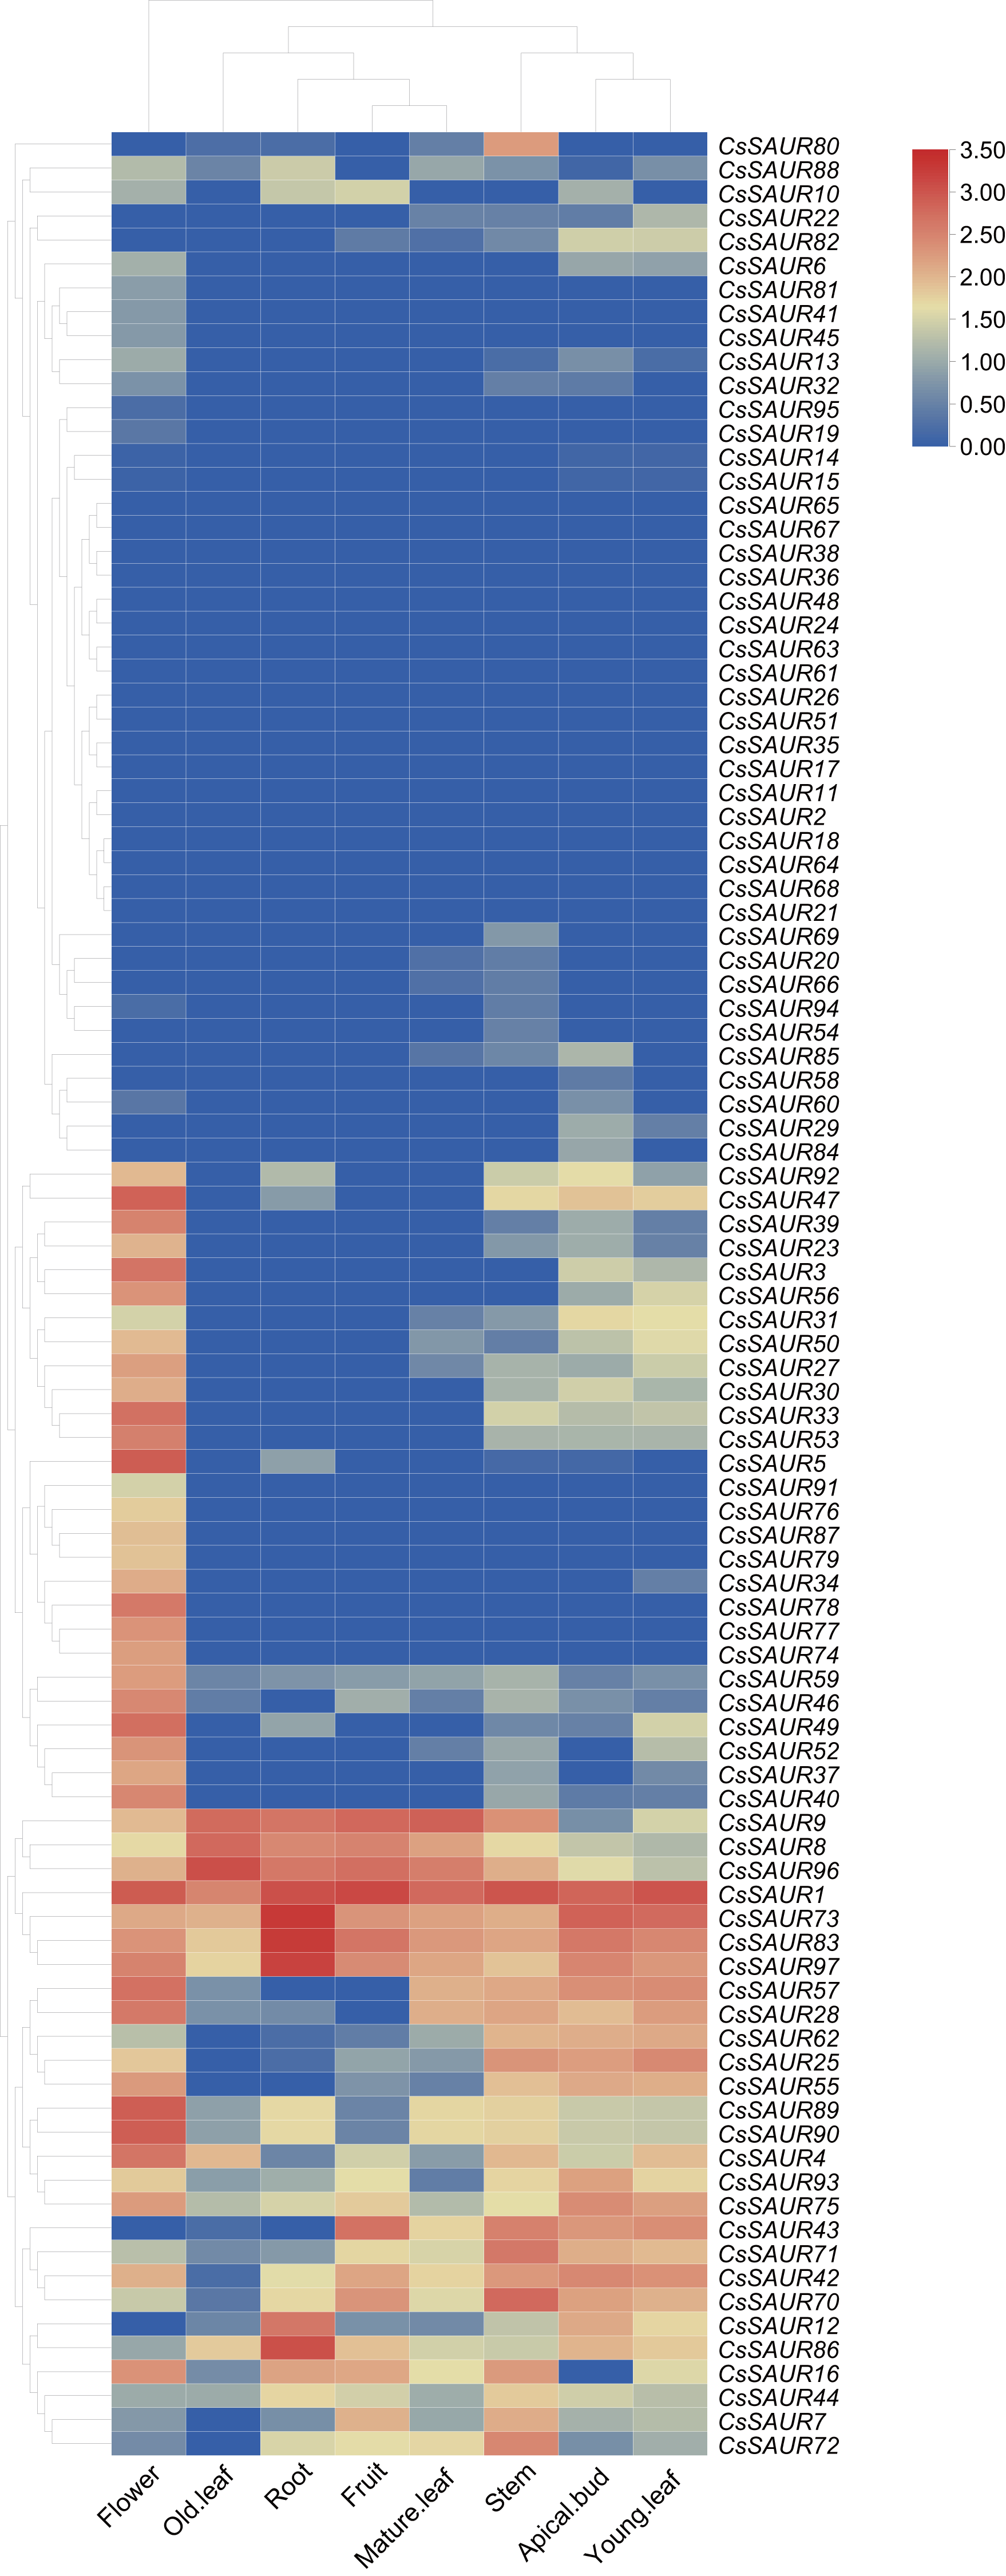
Expression of CsSAURs in response to abiotic stresses and exogenous phytothormones
Based on the promoter cis-element profiling of CsSAUR genes, we propose that CsSAURs may be involved in the processes associated with abiotic stresses and hormonal responses. To verify this hypothesis, the expression patterns of 97 CsSAURs in response to cold acclimation and deacclimation, PEG, NaCl, and MeJA, were analyzed using the public microarray data of TPIA (Gao et al., 2023) (Fig. 7, Table S10). As a result, the majority of CsSAUR genes exhibited relatively stable in expression level (data not shown), with only a small subset displaying differential expression under various stresses.
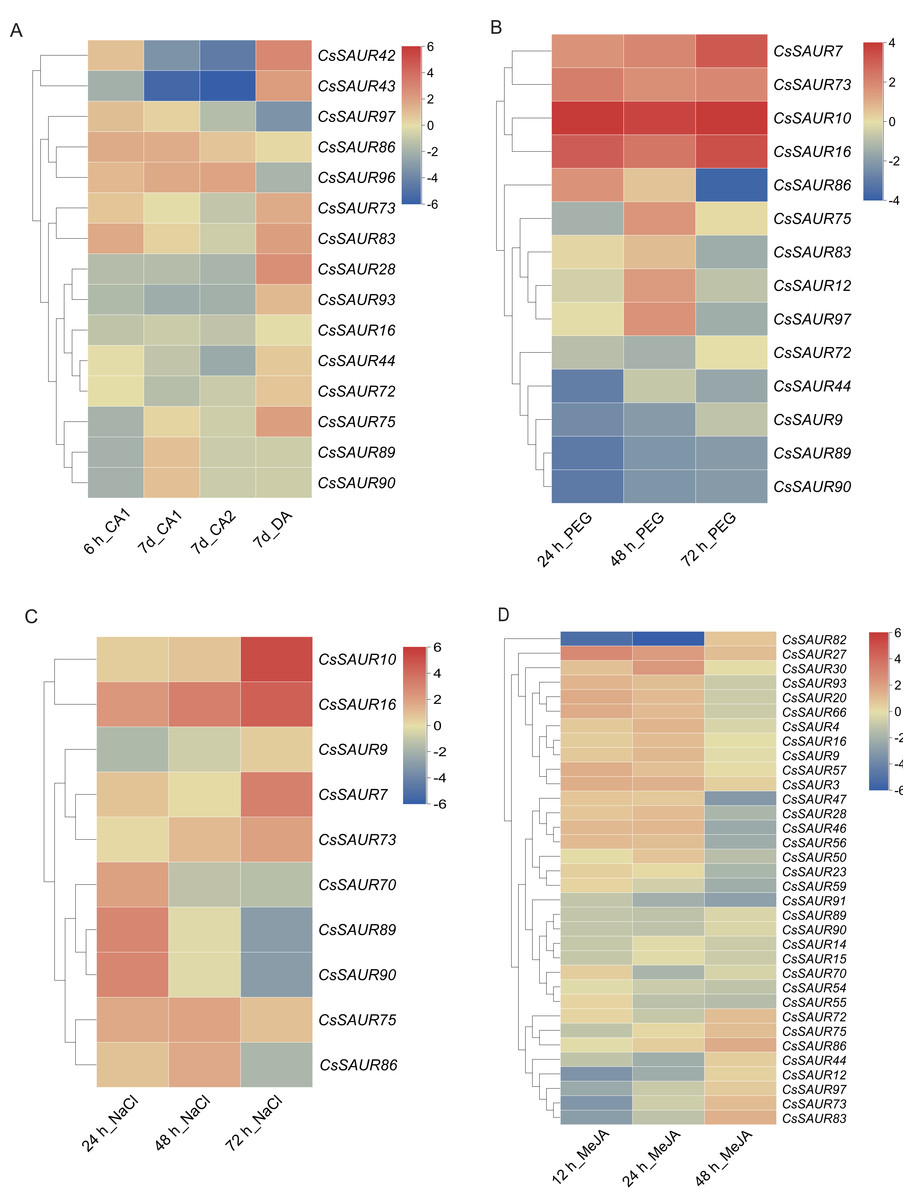
Figure 7: Heatmaps of the fold change values in the RNA-seq data showing the variation in CsSAUR gene expression under cold, drought, MeJA or salt stress.
CA1: 10/4 °C; CA2: 4/0 °C; DA: 25/20 °C.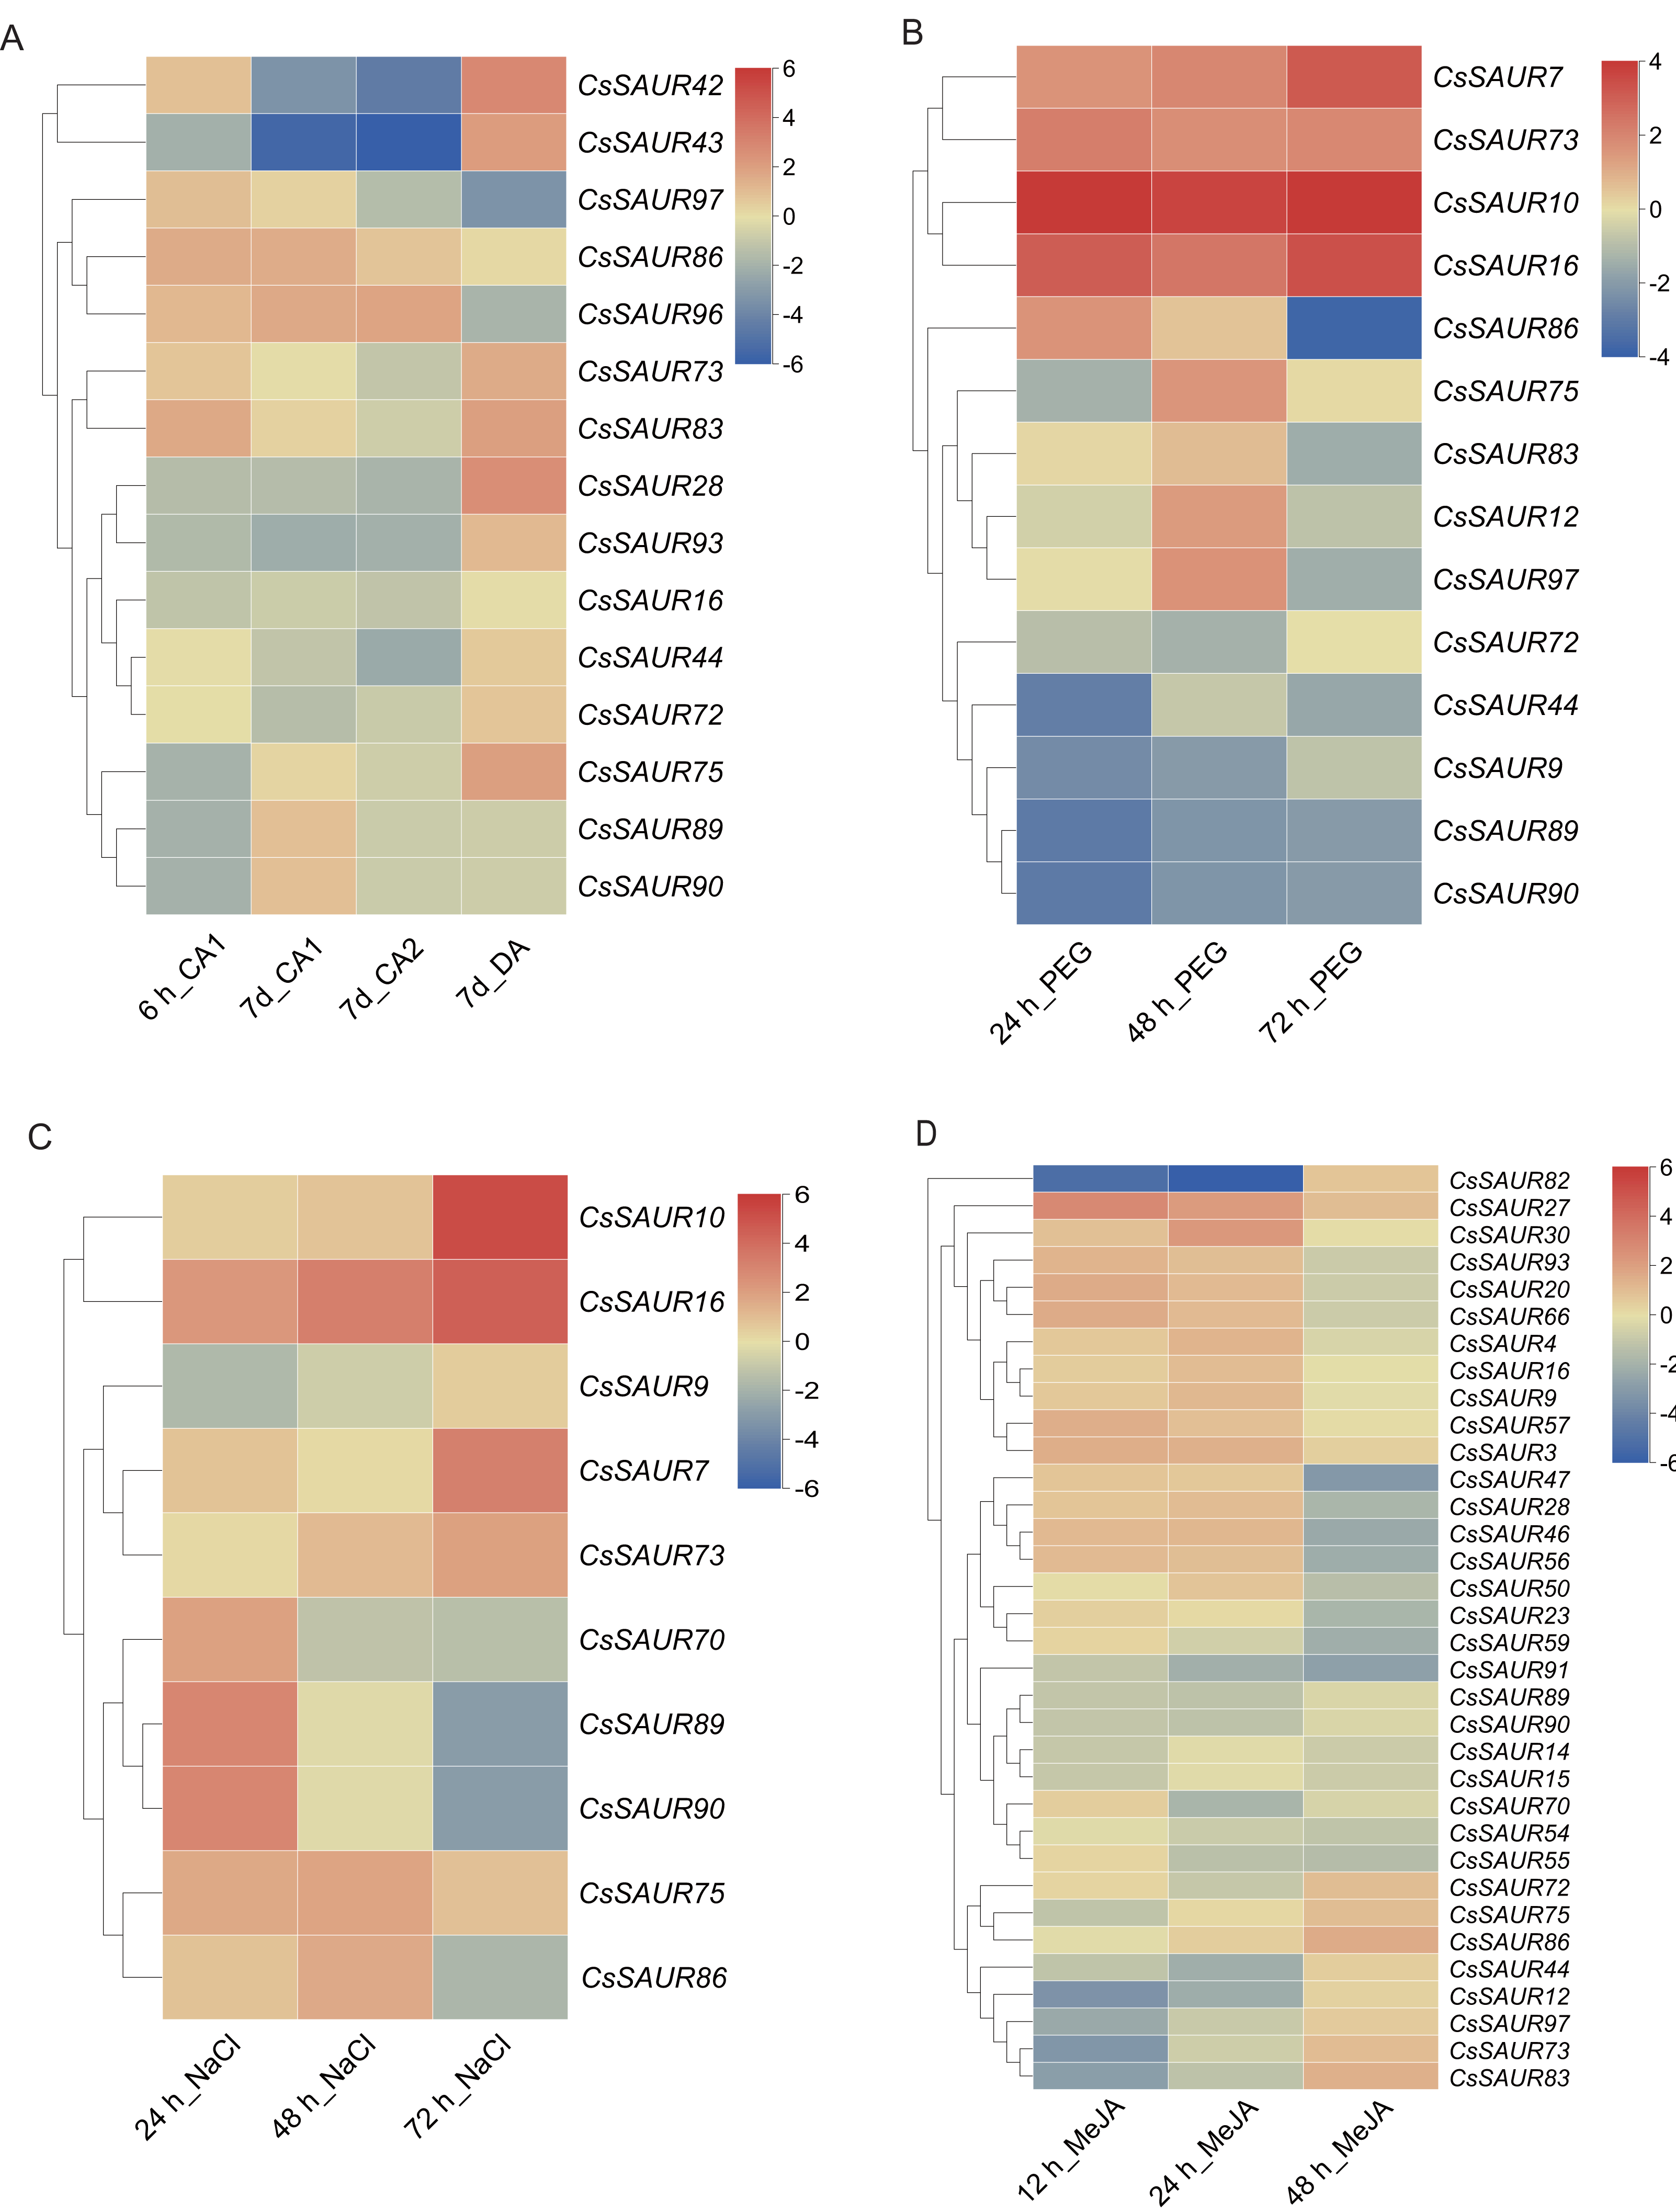
As shown in Fig. 7A, the expression levels of CsSAUR42/43/93 in Group VI and CsSAUR28 in Group VIII were downregulated under cold acclimation, but upregulated after deacclimation. In contrast, the expression of CsSAUR96/97 in Group II showed a gradual upregulation during cold acclimation, whereas a marked downregulation after deacclimation. Additionally, CsSAUR73/83 were significantly induced by cold acclimation and deacclimation. However, the changes in temperature have minimal impact on CsSAUR16, a paralog of CsSAUR73 generated by gene duplication. Under PEG-induced drought (Fig. 7B), transcriptional upregulation was observed in CsSAUR7/10/16/73, while CsSAUR9/44/89/90 demonstrated marked downregulation. CsSAUR86/97 showed an initial increase at 24 or 48 h, but decreased at 72 h. Under salt treatment (Fig. 7C), the expression of CsSAUR7/10/16/73 was gradually increased after exposing to 200 mM NaCl, with CsSAUR10 showing the most pronounced induction (approximately 25-fold increase compared to controls). The expression profiles of CsSAUR70/89/90 and CsSAUR86 in Group I displayed an inverted V-shaped pattern, peaking at 24 h and 48 h respectively. Under exogenous MeJA treatment (Fig. 7D), the expression of most CsSAURs was not significantly altered, except for CsSAUR27, which showed a slight upregulation, and CsSAUR82, which was markedly downregulated.
Further, we performed real-time PCR to validate the expression patterns of CsSAUR16/42/43/73 under cold acclimation and deacclimation, CsSAUR7/10/16/73 under PEG6000 (20%W/V) and NaCl (200 mM), and CsSAUR16/73/82 under MeJA treatment. As expected, the transcriptional patterns of these genes are broadly consistent with those derived from microarray data of TPIA (Fig. 8). Thereinto, CsSAUR7/10/16 were markedly induced by PEG and NaCl; CsSAUR73 was induced by cold acclimation and deacclimation, PEG, NaCl, and MeJA, showing moderate fold increases. Overall, these findings suggest CsSAUR7/10/16/73 may function in diverse stress responses.
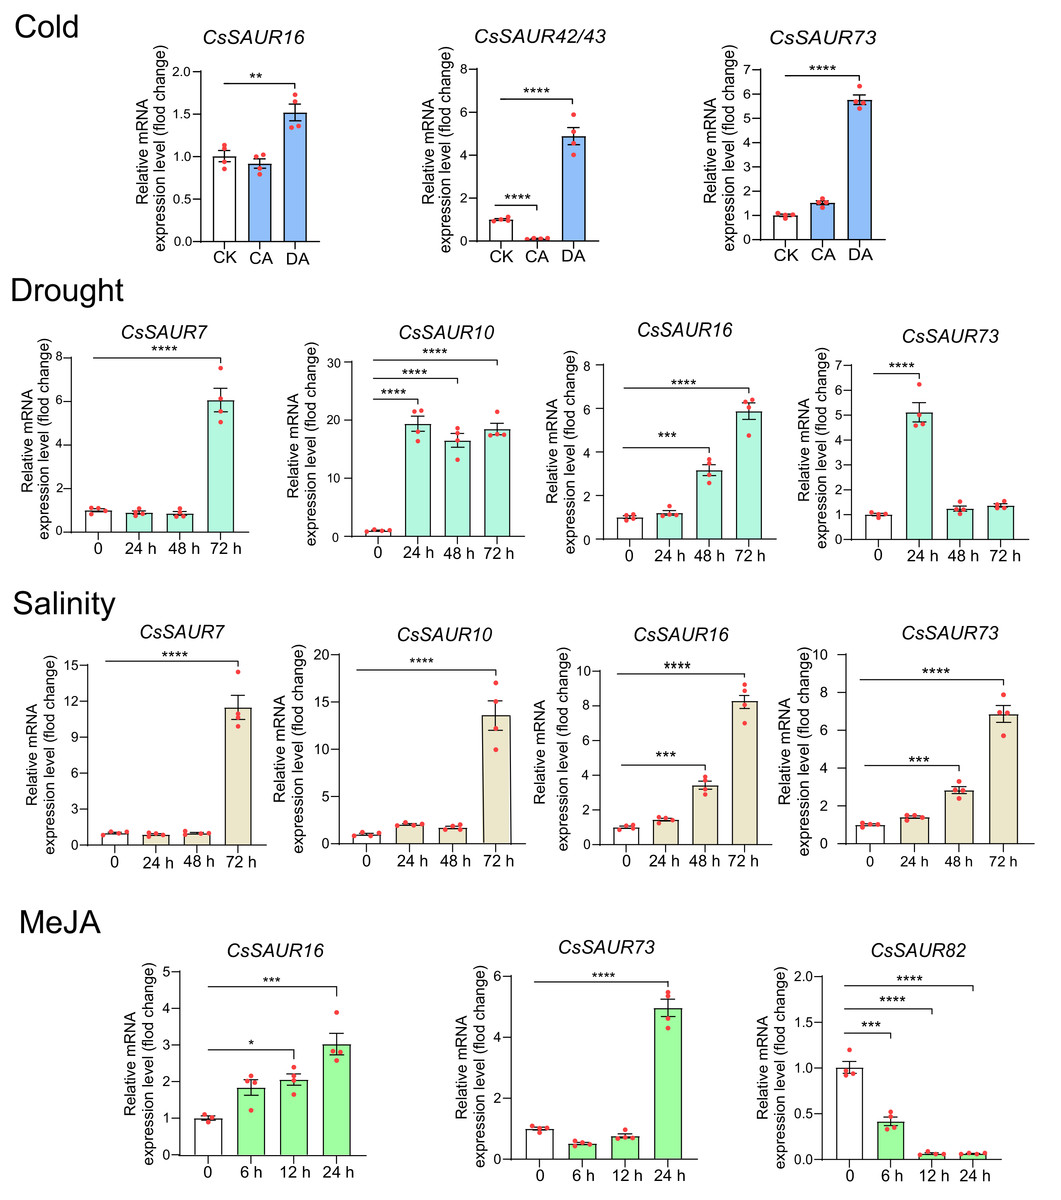
Figure 8: The expression patterns of CsSAUR genes in response to cold, drought, salinity, or MeJA treatment.
Data are means ± SEM, and were analyzed by one-way ANOVA followed by the Newman-Keuls test. * p < 0.05; ** p < 0.01; ***p < 0.001; ****p < 0.0001. CsGAPDH was used as internal controls.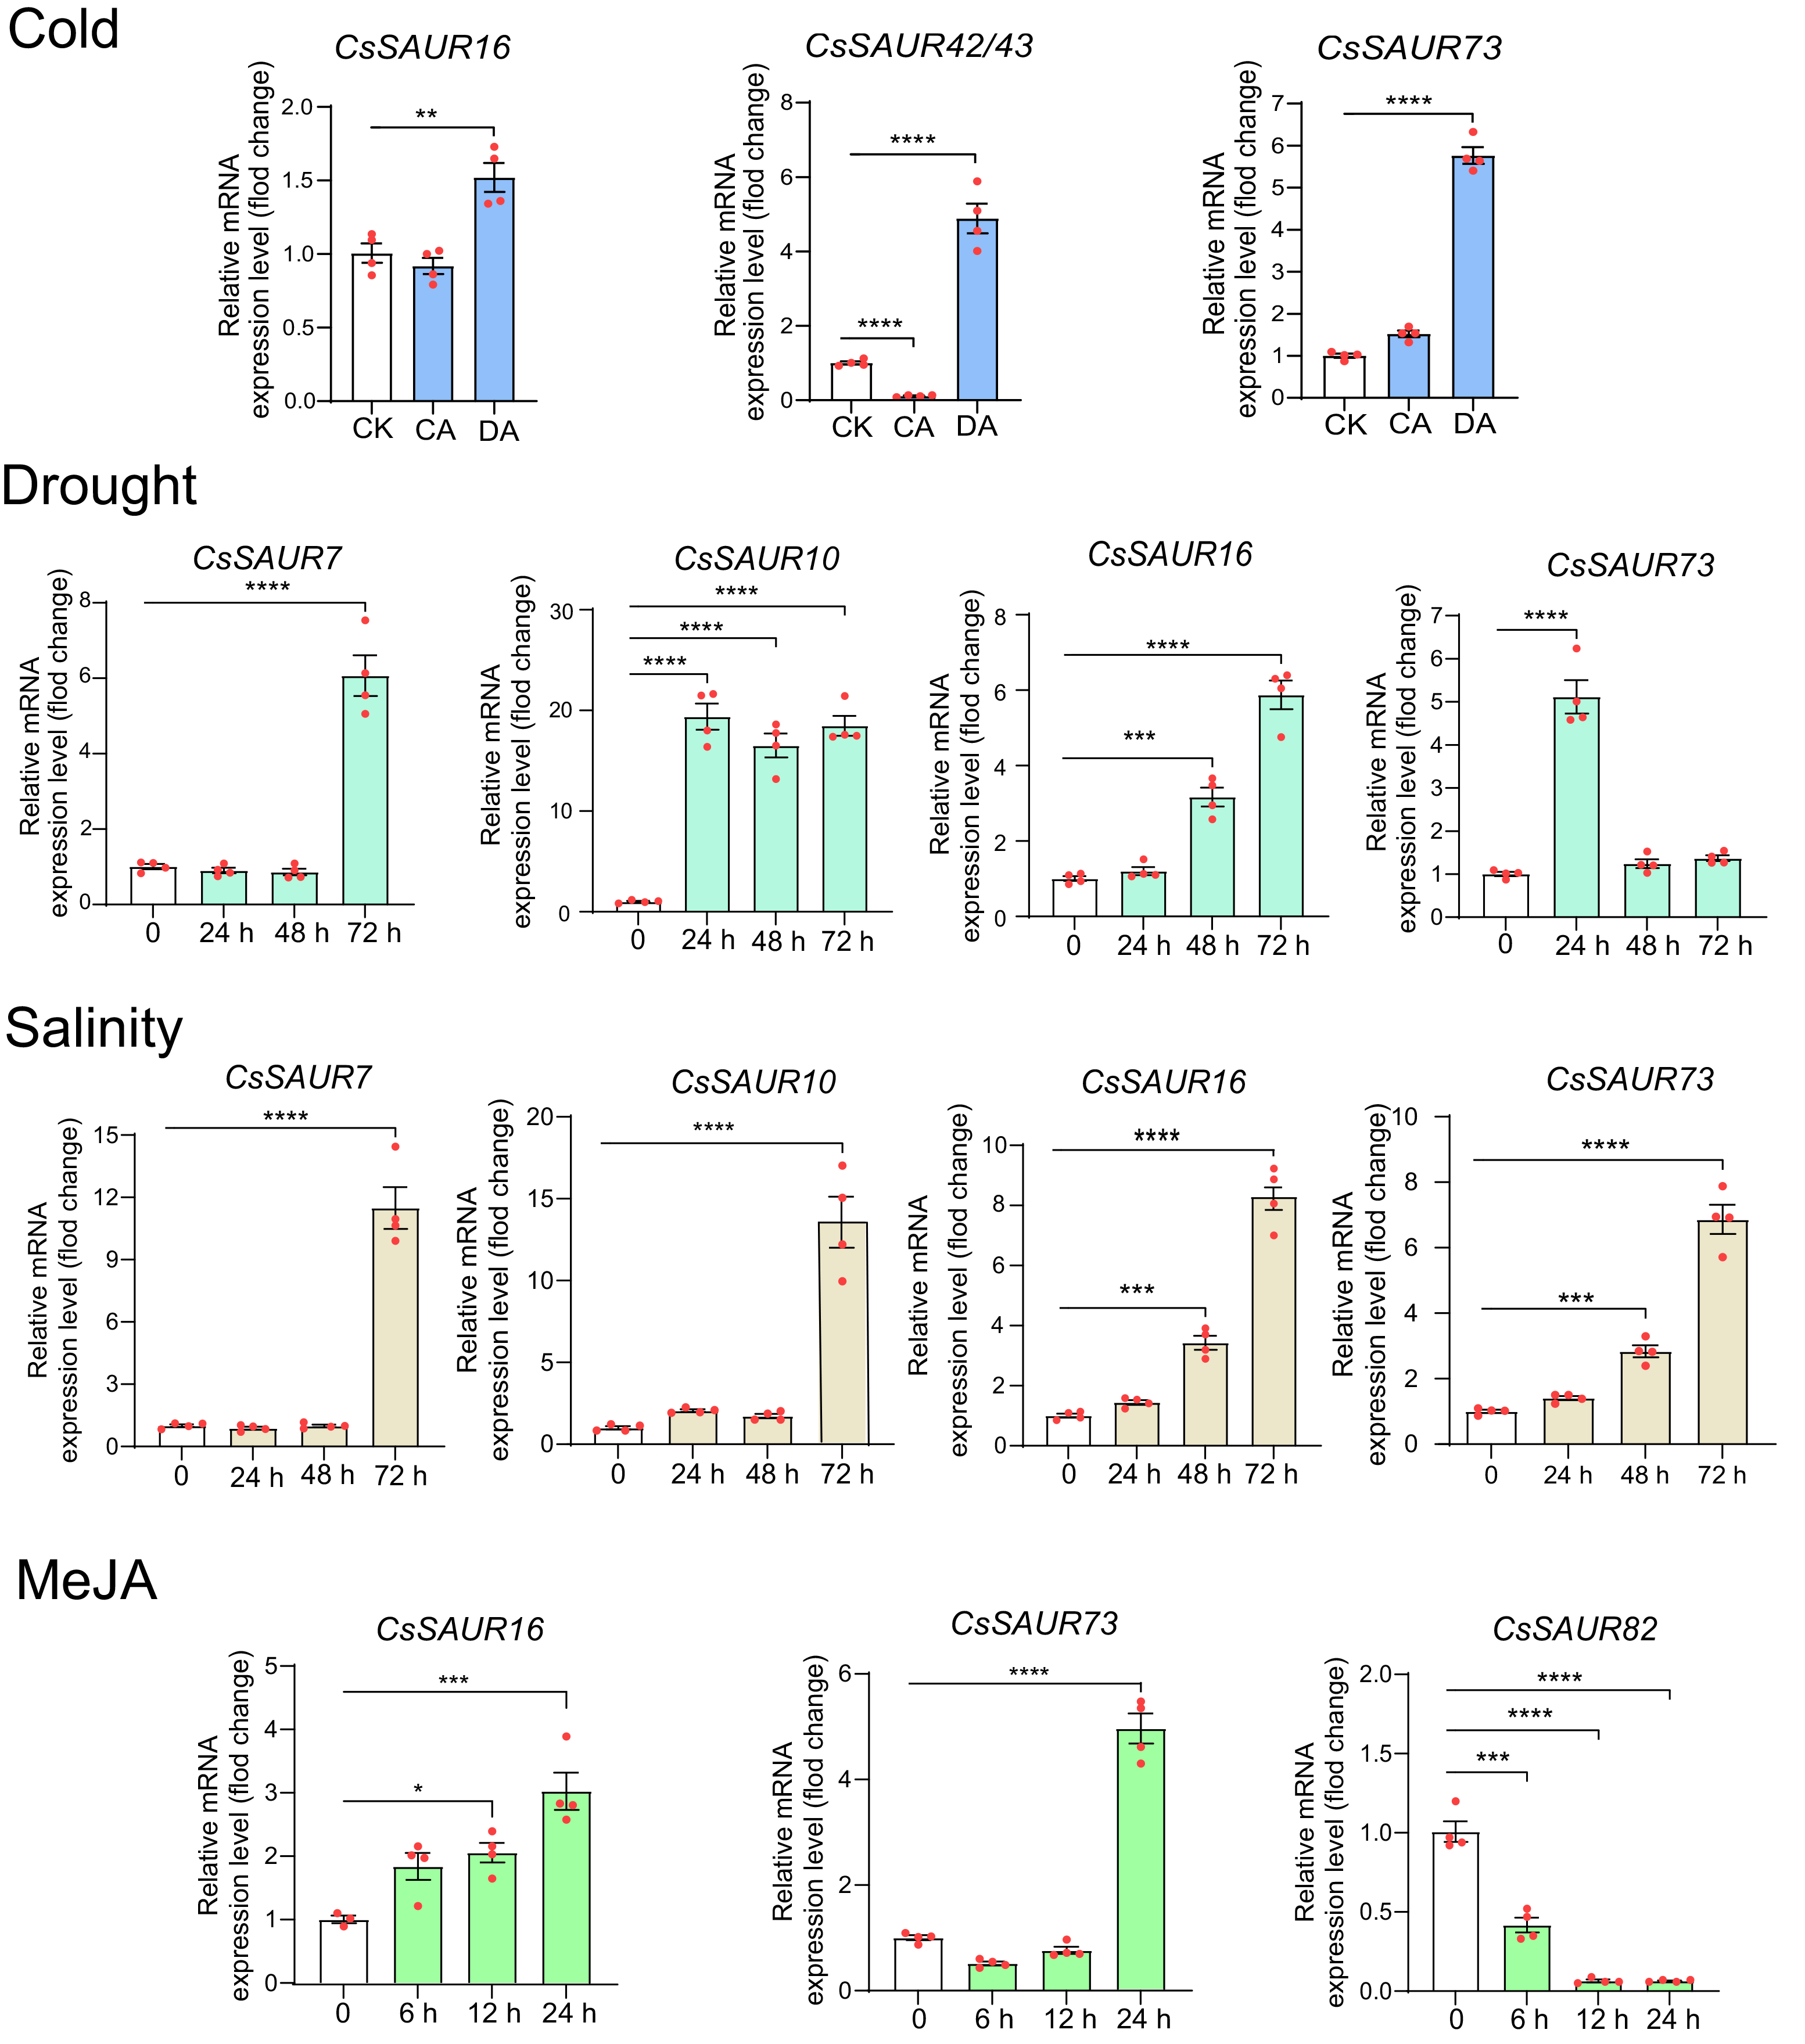
Expression of CsSAURs in response to IAA
To examine the expression of CsSAURs in response to IAA, we selected CsSAUR10/12/16/70/ 71/73 for qRT-PCR analysis based on promoter analysis and GO enrichment results. Similar to CsSAUR42/43, CDS regions of genes 70 and 71 differ by a single base pair: an A→G substitution at position +81. A temporal expression pattern was observed among the CsSAUR genes in response to IAA (Fig. 9). CsSAUR10/12/73 were rapidly up-regulated at 3 h (respectively, p < 0.01, p < 0.0001 and p < 0.001), followed by CsSAUR70/71 at 6 h (p < 0.0001). CsSAUR16 expression displayed a transient suppression at 3 ∼ 6 h (p < 0.001), which was subsequently reversed by a strong induction at 12 h (p < 0.0001). Totally, all CsSAUR10/12/16/70/71/73 genes were significantly induced under 100 µM IAA treatment. These findings demonstrate that specific CsSAUR genes may play crucial roles not only in orchestrating stress adaptation but also in developmental regulation via auxin signaling in tea plants.
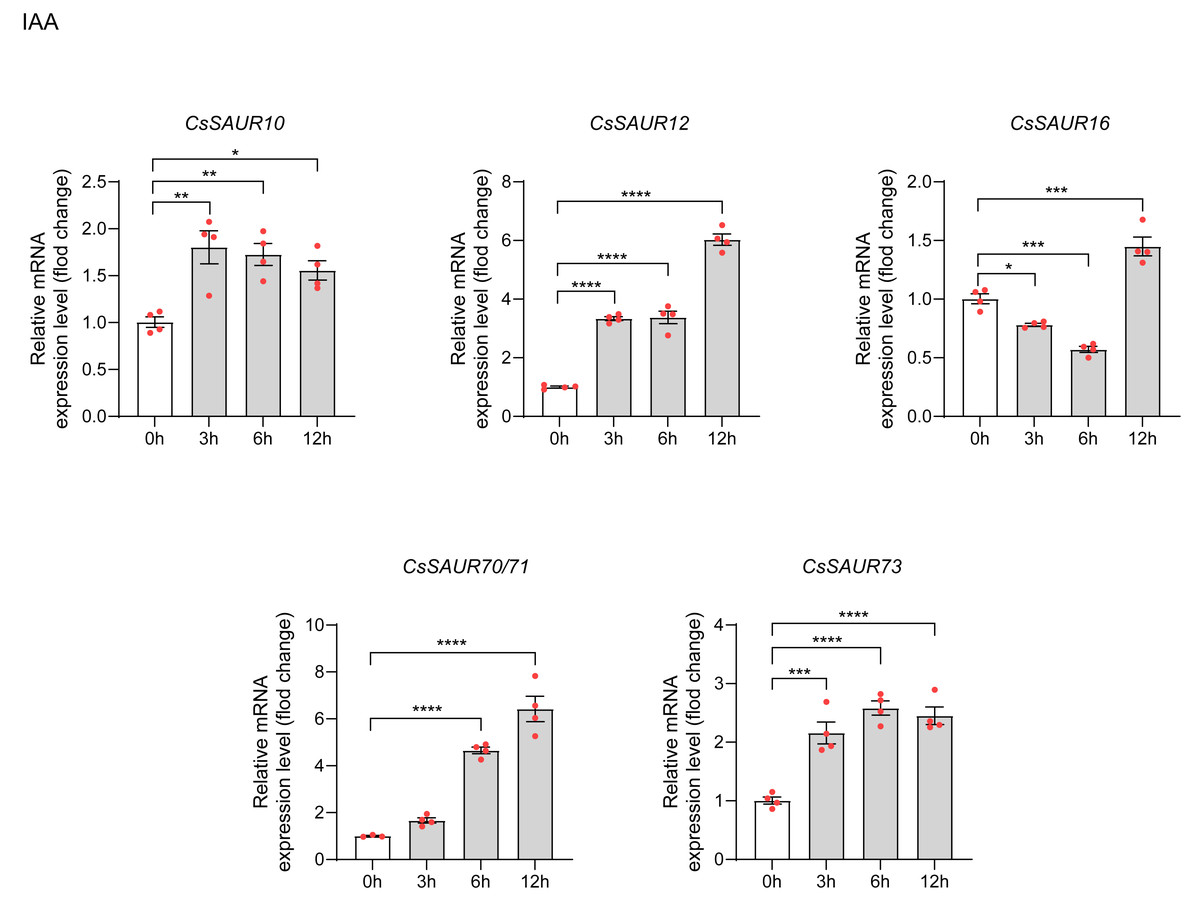
Figure 9: The expression patterns of CsSAU10/12/16/70/71/73 under IAA treatment.
Data are means ± SEM, and were analyzed by one-way ANOVA followed by the Newman-Keuls test. * p < 0.05; ** p < 0.01; ***p < 0.001; ****p < 0.0001. The mean of CsGAPDH and Csβ-actin expression was used as internal controls.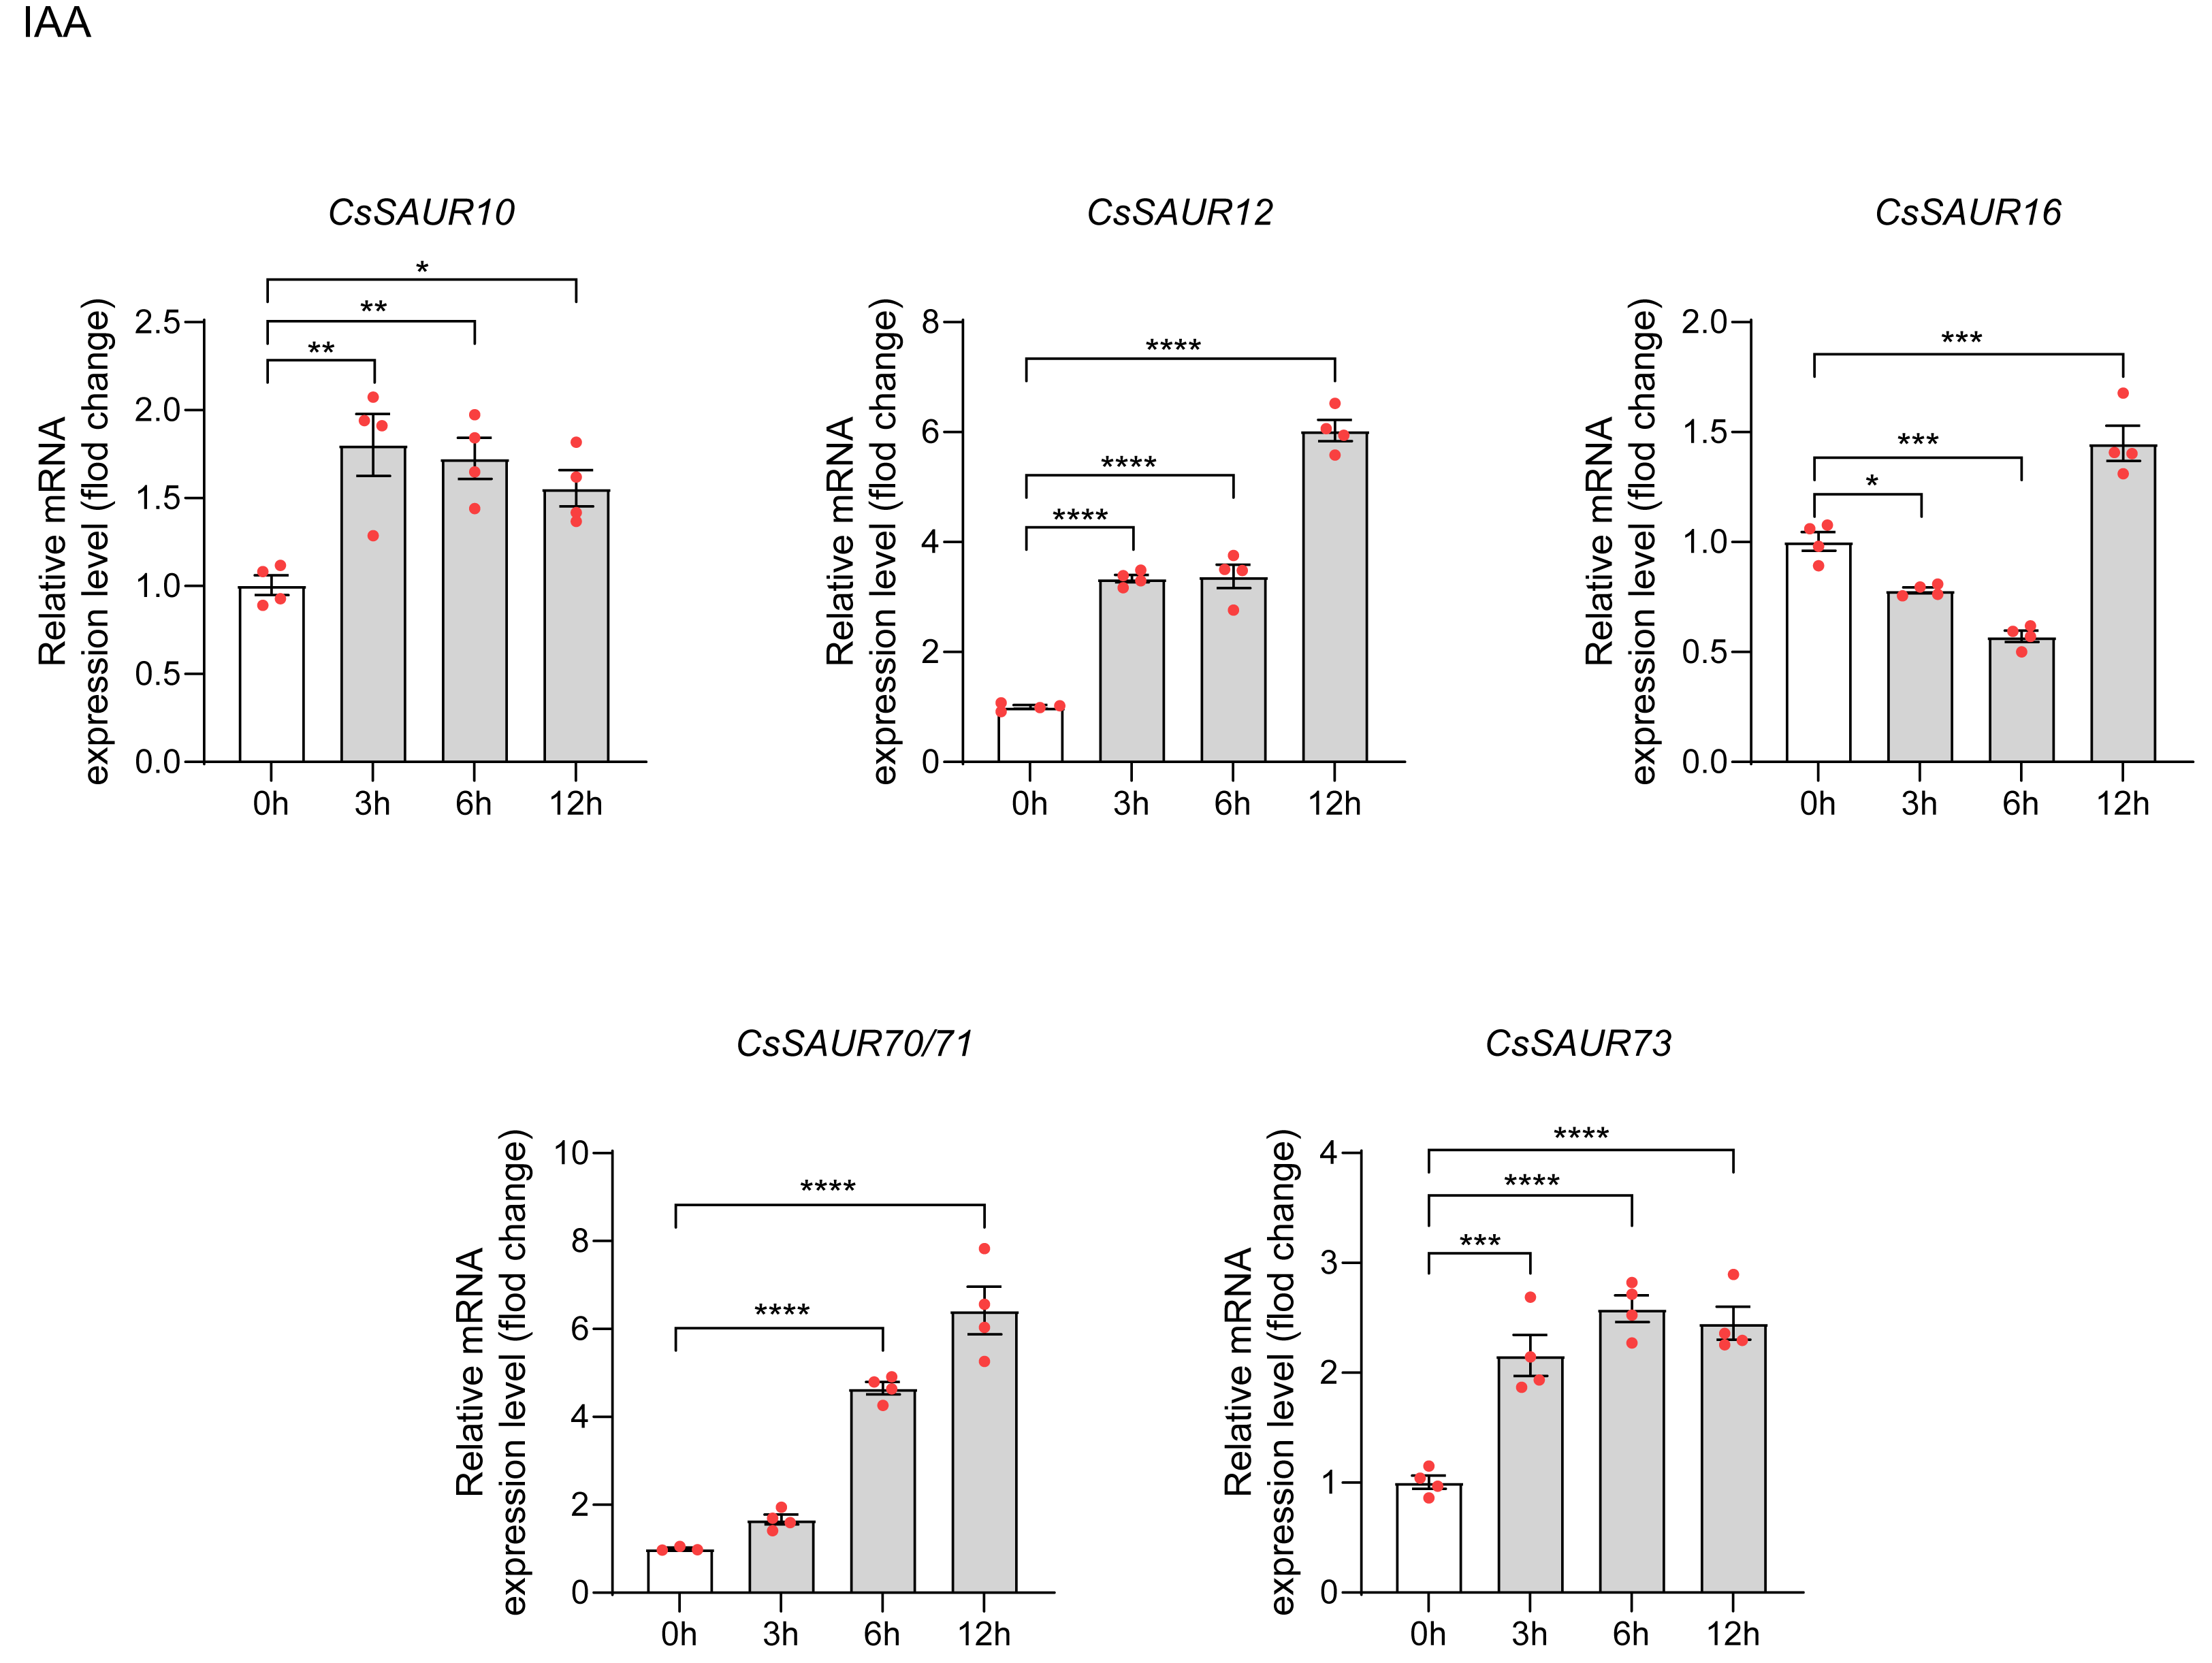
Discussion
From mosses to monocots and further to eudicots, the SAUR gene family has undergone expansion through tandem and segmental duplications, accompanied by functional diversification, establishing itself as a critical molecular toolkit for plants to balance growth and stress adaptation. SAUR genes can be regulated by hormone and environmental factors (such as shade, temperature, drought, high salt, etc.) through acting on ARF–BZR–PIF complex, the upstream region of SAUR genes, or transcript stability (Stortenbeker & Bemer, 2019). Consequently, conducting a comprehensive genome-wide identification and expression analysis of the SAUR gene family in C. sinensis will establish a critical foundation for leveraging SAURs a molecular target to facilitate stress-resistance breeding and optimize secondary metabolite-related traits in tea plants.
Structural characteristics and evolutionary analysis of CsSAUR genes
We identified 97 CsSAUR genes in the 3.2 Gb tea genome. Previous studies have shown that, in monocot plants, 60 SAUR genes were identified in the 466 Mb genome of rice (Jain, Tyagi & Khurana, 2006; Yu et al., 2002), 73 SAURs in the 730 Mb genome of sorghum (Paterson et al., 2009; Wang et al., 2010), and 79 SAURs in the 2.3 Gb genome of maize (Chen, Hao & Cao, 2014; Schnable et al., 2009). And in dicots, 81 SAUR genes were identified in the 125 Mb genome of Arabidopsis (H & J, 2000; Hagen & Guilfoyle, 2002), 162 SAURs in 2.54 Gb genome of peanut (Bertioli et al., 2019; Liu et al., 2022), and 143 SAURs in 844 Mb genome of potato (Wu et al., 2012; Xu et al., 2011). Hence, the number of SAUR gene family member is not correlated with genome size, which is consistent with previous studies (Zhang et al., 2017). Although the tea plant is evolutionarily younger than peanuts and potatoes, it has fewer SAUR genes compared to them, suggesting that adaptive evolution in tea plant may involve SAUR gene loss or functional specialization. Furthermore, the size of the SAUR gene family changes dynamically. This fluctuation suggests that species have repeatedly reshaped this gene family through contraction and expansion events during evolution. These dynamic changes indicate that, more than genome size alone, gene duplication and loss events likely play a key role in the evolution of SAUR family.
Gene structure analysis revealed that 81 CsSAUR genes lack introns, while the remaining members possess 1 or 2 introns (Fig. 3B). This structural simplicity aligns with findings in other species such as rice (Jia et al., 2024). It is well established that genes with fewer introns can be activated more rapidly, enabling swift responses to various stresses (Jeffares, Penkett & Bähler, 2008), and replicate more readily, thereby favoring the expansion of gene family members. Therefore, the absence of introns in CsSAUR genes may facilitate their duplication and expansion.
According to the evolutionary tree, CsSAUR gene family are classified into eight groups, with each group’s gene members sharing similar gene and motif structure (Fig. 3). These structural similarities and variations in CsSAUR genes may be attributed to gene duplication events in tea plants. Among 97 CsSUARs, 25 genes originate from tandem duplication events, while 47 from segmental duplication events (Fig. 2A and Table S3). These findings suggest that segmental and tandem duplications are both contributable to the expansion of SAUR gene family in tea plant, with the segmental duplication impacting stronger. However, for the expansion of the Group VIII, the contributions of tandem duplication and segmental duplication may be roughly equivalent, which is manifested by 21 tandem and 24 segmental duplicated genes. In addition, all these gene pairs generated by duplication were mainly within the same group, indicating their more stable roles in tea plant growth. This expansion mechanism underlying the evolution of SAUR gene family has also been observed in other crop species, such as cacao, cotton, peanut, wax gourd, foxtail millet (Chu et al., 2024), and Chandan (Santalum Album) (Zhu et al., 2024).
Further, Ka/Ks analysis indicated that most CsSAUR gene pairs have undergone purifying selection (Ka/Ks <1) (Table S5), which is indispensable for C. sinensis by removing harmful mutations, sustaining essential biological functions, and safeguarding genomic integrity during evolution. A few duplicated genes (CsSAUR33-CsSAUR47, CsSAUR33-CsSAUR53, CsSAUR32-CsSAUR48) showed signatures suggestive of positive selection (Ka/Ks >1) (Table S5), suggesting their rapid functional divergence, which is consistent with the findings in Santalum album (Zhu et al., 2024). These selective pressures help to shape the environmental adaptability of species, thereby supporting their survival and development over long-term evolution.
Interspecies collinearity analysis between tea plants and Arabidopsis revealed that 37 CsSAUR genes exhibit homologous relationships with 42 AtSAUR genes (Table S4). Homologous gene pairs may exhibit conserved functional similarity because of sharing evolutionary origins. AtSAUR16/50 are involved in cell elongation, suggesting that their orthologs, CsSAUR3/6/42/59 may share similar functions (Van Mourik et al., 2017). Mechanically, AtSAUR50 binds to and inhibits phosphatase PP2C-D1, thereby releasing its suppression of cotyledon and apical hook cell elongation (Qiu et al., 2020). This mechanism provides insight into how CsSAUR proteins regulate tea plant growth and development. AtSAUR70 interacts with calmodulin in a calcium-dependent manner, linking auxin signaling to Ca2+/calmodulin pathway, suggesting a potential analogous role for CsSAUR5. Overexpression of AtSAUR32 enhances drought resistance (He et al., 2021), implying that its orthologs, CsSAUR9/12/16/73 may confer similar stress tolerance in tea plant. AtSAUR41 was demonstrated to be abscisic acid (ABA) inducible and involved in modulating cell expansion and salt tolerance (Qiu et al., 2020), suggesting functional parallels for CsSAUR70/71 in tea plants. Nevertheless, AtSAURs primarily function in the nucleus and cytoplasm, which is contrary to our findings. Our study indicated that CsSAURs were predominately localized to ATP-associated organelles (25 in the chloroplast and 42 in mitochondria) (Table S2), suggesting their potential roles in energy transfer and utilization.
CsSAUR genes are involved in response to abiotic stresses and phytohormones
Our study provides combined in silico and experimental evidence supporting the role of CsSAUR genes in stress and hormone responses. Initially, cis-acting element analysis of the promoter regions (+2,000 bp from ATG) revealed an enrichment of elements associated with auxin, low temperature, drought, and MeJA responsiveness (Fig. 5 and Table S6). This provided a predictive basis for their potential involvement in these signaling pathways. To functionally test these predictions, we analyzed transcriptome data (TPIA) and performed qRT-PCR validation.
The results demonstrated that the expression patterns of several key genes supported the functional relevance of their promoter motifs. Specifically, the fragment-repeat gene pair CsSAUR16 and 73 (Group II) were significantly induced by various stresses and IAA treatment (Figs. 8 and 9). This finding aligns with the identification of specific stress- and hormone-related cis-elements within their promoters. The promoter of CsSAUR16 contains a TGA-element (Fig. 5A), which is a crucial component of a central regulatory network that integrates hormonal signals, such as salicylic acid (SA), jasmonic acid (JA), and abscisic acid (ABA), along with environmental stresses (Zhu et al., 2014). Additionally, the presence of other abiotic stress-responsive elements, including the low-temperature responsiveness (LTR) and the drought-inducible MBS binding site (MYB), within the promoters of CsSAUR16 and 73, provides a mechanistic rationale for their observed upregulation under corresponding stress conditions. The functional significance of this cis-element profile is reinforced by the characterized Arabidopsis ortholog, AtSAUR32 (orthologous to CsSAUR16/73), which enhances drought resistance through the ABA signaling pathway (He et al., 2021). Also, the presence of an AuxRR-core element, recognized as an auxin-responsive motif, within the promoter region of CsSAUR10 offers a rationale for its pronounced activation in response to IAA treatment, as well as under drought and salinity stress conditions (Figs. 8 and 9). The observed alterations in gene expression under conditions of drought, salinity, and hormone exposure can be linked to the anticipated roles of their respective cis-regulatory elements, which are activated by specific transcription factors binding under these stress conditions.
Collectively, these findings suggest the potential roles of CsSAUR gene family in abiotic stress adaptation and phytohormone signaling, especially for CsSARU10, 16 and 73. Last but not the least, we highlight that the experiments in vitro and in vivo are still needed for further verification.
Conclusions
In this study, 97 putative SAUR genes were identified in the genome of tea plant. Subsequently, the physicochemical characteristics, phylogenetic relationships, chromosomal distribution, synteny, gene structure, conserved motifs, cis-acting elements, and GO enrichment analysis of the CsSAUR family genes were systematically investigated. The CsSAUR gene family was classified into eight groups. Among the 97 CsSAUR genes, 90 were distributed unevenly across 15 chromosomes, while the remaining seven were mapped to unassembled contig fragments. Both tandem and segmental duplications contribute to the evolutionary expansion of the CsSAUR gene family, particularly in the Group VIII. The statistical evaluation reveals that segmental duplication events (accounting for 48% of CsSAURs) likely exerted a predominant influence. Purifying selection acts as the principal evolutionary driver of the CsSAUR gene family. The structure analysis demonstrated the majority members of CsSAURs have no introns. Cis-acting element and GO enrichment analysis suggested that CsSAURs are implicated in growth, development, and stress response. The transcriptome analysis showed that most CsSAUR genes had specific expression in the flowers, whereas only a small subset was involved in tolerance of abiotic stresses including cold, drought, sanity, and exogenous MeJA. The members from the same group showed relatively similar expression patterns. Also, real-time PCR analysis revealed that CsSAUR10, 16 and 73 were upregulated by abiotic stresses and auxin. Collectively, these results delineate functional associations between CsSAUR genes and abiotic stresses and phytohormone pathways, and provide a priority candidate target for molecular breeding strategies.