
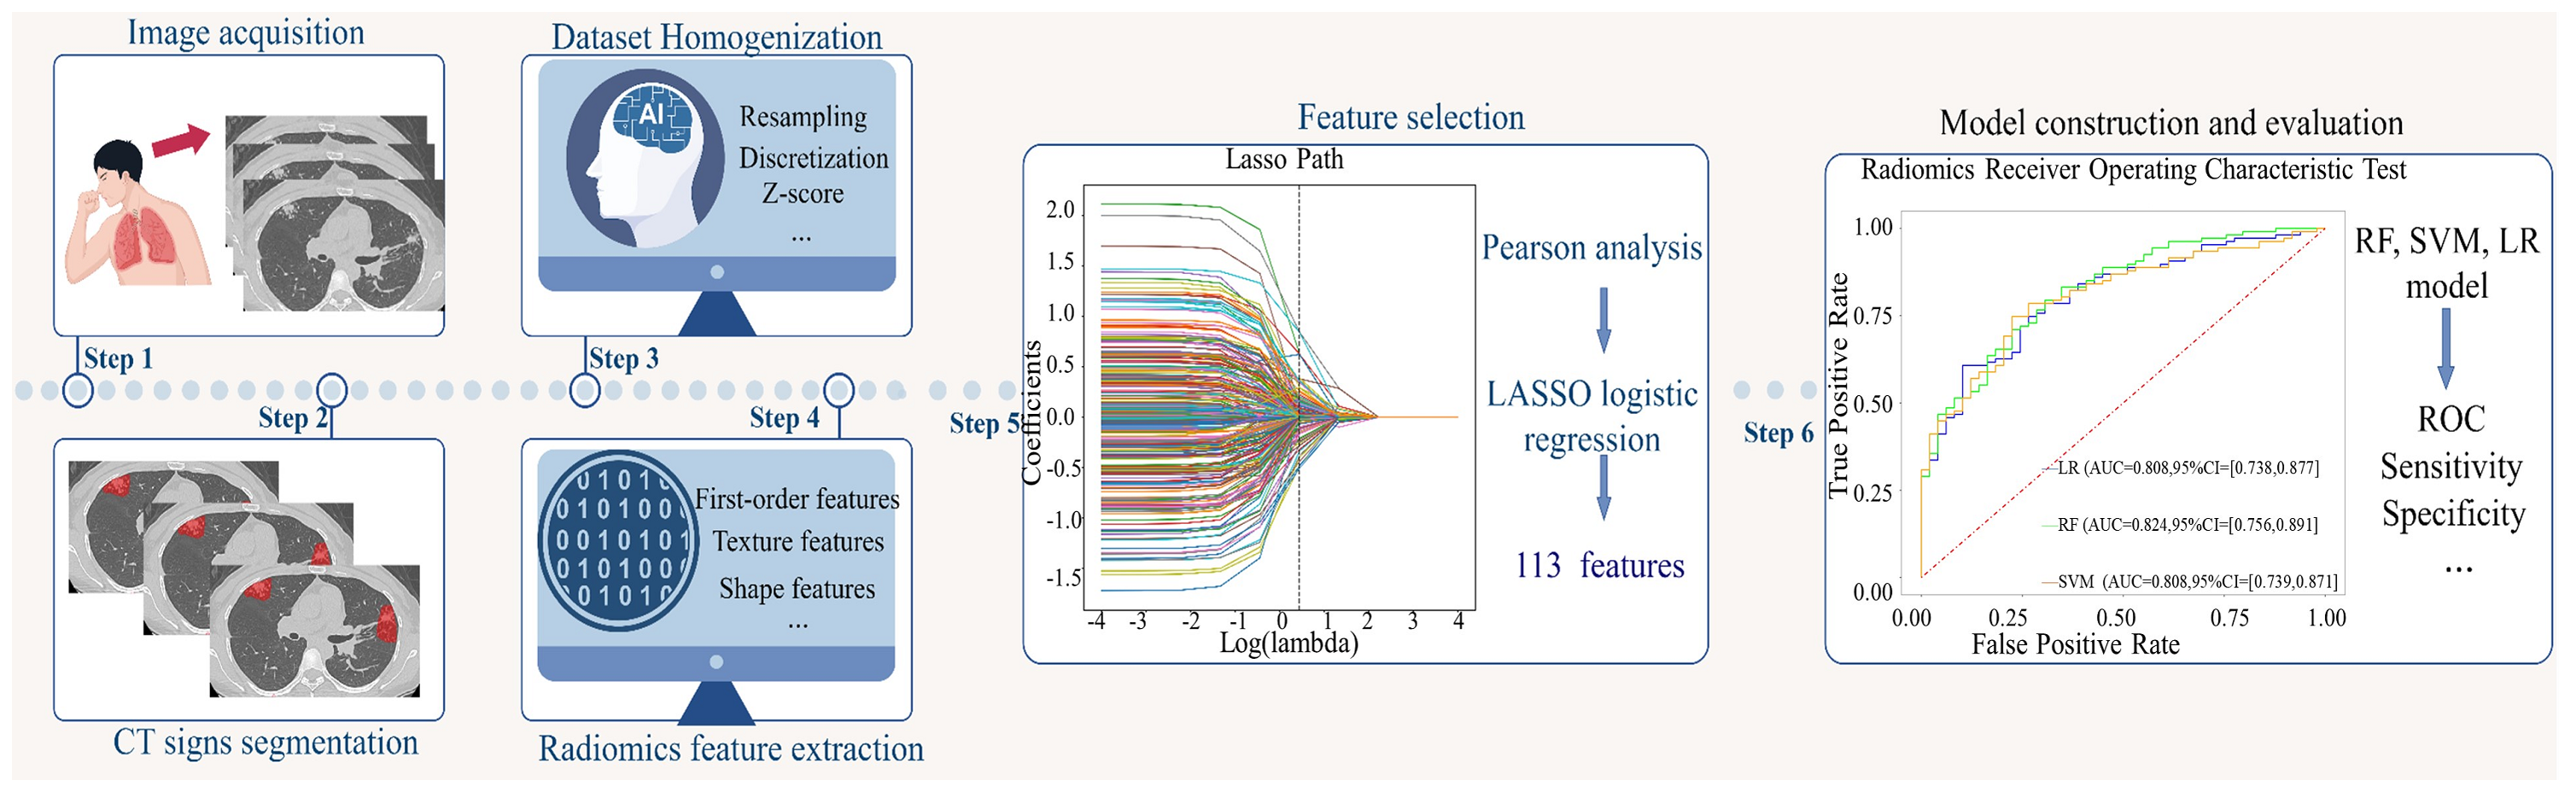
Machine learning and radiomics for predicting therapeutic efficacy in newly diagnosed sputum-negative pulmonary tuberculosis: a retrospective study
- Published
- Accepted
- Received
- Academic Editor
- Nicole Nogoy
- Subject Areas
- Infectious Diseases, Public Health, Radiology and Medical Imaging, Computational Science, Data Mining and Machine Learning
- Keywords
- Pulmonary tuberculosis, Therapy, Machine learning, Radiomics
- Copyright
- © 2026 Sun et al.
- Licence
- This is an open access article distributed under the terms of the Creative Commons Attribution License, which permits using, remixing, and building upon the work non-commercially, as long as it is properly attributed. For attribution, the original author(s), title, publication source (PeerJ) and either DOI or URL of the article must be cited.
- Cite this article
- 2026. Machine learning and radiomics for predicting therapeutic efficacy in newly diagnosed sputum-negative pulmonary tuberculosis: a retrospective study. PeerJ 14:e20557 https://doi.org/10.7717/peerj.20557
Abstract
Background
Early assessment of tuberculosis progression and the efficacy of anti-tuberculosis drugs is crucial for improving disease cure rates. This study aimed to predict the therapeutic efficacy of newly diagnosed sputum-negative but bronchial alveolar lavage fluid (BALF)-positive pulmonary tuberculosis patients after intensive therapy.
Methods
We collected data from 255 patients (178 and 77 in center 1 and 2, respectively) diagnosed with newly diagnosed sputum-negative but BALF-positive pulmonary tuberculosis. Based on imaging and clinical follow-up results, the patients were divided into progression and improvement groups. Radiomics features were extracted from five computed tomography (CT) signs, and feature selection was performed using Pearson correlation analysis and the Least Absolute Shrinkage and Selection Operator (LASSO). Three machine learning models (random forest (RF), support vector machine (SVM), and logistic regression (LR)) were then constructed. Predictive performance was evaluated using receiver operating characteristic (ROC) curves, F1 scores, and Delong tests.
Results
A total of 118 radiomics features were used to construct three models that demonstrated good performance. In the training and test cohorts, the SVM model achieved area under the curves (AUCs) of 0.917 and 0.858, and F1 scores of 0.808 and 0.755, respectively. The RF model showed the highest predictive performance with AUCs of 0.996 and 0.824, and F1 scores of 0.982 and 0.832. The LR model achieved AUCs of 0.927 and 0.808, and F1 scores of 0.867 and 0.747.
Conclusions
Machine learning models based on radiomic features extracted from various CT signs demonstrate potential for predicting the therapeutic efficacy in newly diagnosed pulmonary tuberculosis patients after intensive therapy, providing effective guidance for subsequent treatment.
Introduction
Tuberculosis (TB) is a chronic infectious disease caused by Mycobacterium tuberculosis (MTB) and transmitted through the respiratory tract (Adigun & Singh, 2023). Globally, TB remains one of the leading causes of death from infectious diseases, resulting in nearly twice as many deaths as AIDS (Bagcchi, 2023). The emergence of drug-resistant strains has further complicated TB control and treatment efforts. Therefore, developing effective therapeutic strategies for newly diagnosed pulmonary TB patients is essential to improve clinical outcomes and reduce disease transmission. Across different regions and healthcare systems, smear-negative cases account for approximately 30–60% of all pulmonary TB patients (Campos et al., 2016). Although smear-positive individuals are generally more infectious, smear-negative patients still contribute substantially to TB transmission (approximately 10–20% or even higher) (Tostmann et al., 2008). Moreover, delayed diagnosis in this group often leads to more severe disease progression and poorer clinical outcomes.
Effective treatment is essential to prevent the transmission of tuberculosis. For patients with negative sputum but positive bronchial alveolar lavage fluid (BALF) results, assessing treatment response is difficult. Traditional methods are often subjective, invasive, and time-consuming (Zhang et al., 2023). In this context, the application of emerging artificial intelligence (AI) techniques offers a promising alternative for predicting therapeutic outcomes (Nijiati et al., 2023b). Radiomics, which transforms medical images into high-dimensional quantitative data, provides new insights into disease pathophysiology (Mayerhoefer et al., 2020) and has been extensively applied to various tumors (Peng et al., 2021; Zhou et al., 2020). However, few studies have explored its potential in newly diagnosed pulmonary tuberculosis, particularly for predicting treatment response.
Chest computed tomography (CT) plays a critical role in screening and evaluating pulmonary TB, as TB presents with a variety of radiological features on CT images such as consolidation, nodules, cavities, and tree-in-bud (TIB) signs (Carlesi et al., 2019; Nachiappan et al., 2017). However, CT interpretation largely depends on radiologist experience and image quality, which may lead to potential misdiagnosis or missed cases, potentially delaying timely diagnosis and treatment. In clinical practice, integrating CT imaging with machine learning can enhance the efficiency of diagnosis and therapeutic evaluation in smear-negative pulmonary TB. Radiomics-based models can capture subtle lesion characteristics from routine CT scans, enabling early detection, risk stratification, and identification of treatment response patterns that are difficult to detect with the human eye (Hatt et al., 2019; Lambin et al., 2012; Li et al., 2023b; Zhao et al., 2023). Moreover, such models can support clinicians in making individualized treatment decisions for complex cases, optimize follow-up strategies, and reduce the risk of misdiagnosis or delayed therapy (Nijiati et al., 2023b).
However, current radiomics studies on TB still have several limitations. Most existing models have primarily focused on smear-positive patients (Geric et al., 2023; Han et al., 2022; Liang et al., 2022), whereas research on smear-negative but BALF-positive cases remains limited. This subgroup poses greater diagnostic challenges and shows considerable variability in treatment response, making it clinically important to study. In addition, previous studies have often relied on subjective image interpretation or a limited number of radiomic features (Du Plessis et al., 2023; Perrin et al., 2010), without comprehensive integration of high-dimensional quantitative features and clinical variables, which restricts model interpretability. Moreover, few studies have systematically developed and validated predictive models using early treatment outcomes (disease progression or improvement) under standardized anti-tuberculosis therapy as the study endpoint.
Building upon these research gaps, this study developed a machine learning model integrating baseline CT-based radiomic features with clinical variables to predict disease outcomes in newly diagnosed sputum smear–negative but BALF-positive pulmonary tuberculosis patients after two months of standard anti-tuberculosis therapy. By quantifying imaging features and incorporating key clinical variables, the study aimed to enable early prediction of treatment response, providing a noninvasive and interpretable tool for therapeutic evaluation. This model has the potential to support individualized treatment decisions and treatment monitoring in tuberculosis management.
Materials & Methods
Participants
This retrospective study was conducted at Beijing Chest Hospital, Capital Medical University, and was approved by the Ethics Committee of the hospital (No. BJXK-2021-KY-06). Informed consent from patients was waived by the ethics committees of Beijing Chest Hospital, Capital Medical University (No. BJXK-2021-KY-06), considering the retrospective nature of the study and the utilization of anonymized data, while ensuring patient privacy and confidentiality. All patient data were handled in strict accordance with relevant privacy regulations, guidelines, and the principles outlined in the Declaration of Helsinki, ensuring confidentiality and anonymity throughout the study.
Retrospective data were collected from Hospital 1 and Hospital 2 between 2020 and 2023, including chest CT scans before treatment and laboratory information from patients with newly diagnosed sputum-negative but BALF-positive pulmonary tuberculosis. Missing data for variables such as ESR (erythrocyte sedimentation rate), CRP (C-reactive protein), and time from symptom onset to CT scan were imputed using the median. Two professional radiologists assessed the changes in lung lesions on CT images taken within 1 month before treatment and after intensive therapy, and in combination with the clinical evaluation by physicians, the patients were classified into progression and improvement groups. According to the inclusion and exclusion criteria, a total of 178 patients were enrolled from Hospital 1 as the training cohort, of which 119 improved and 59 progressed. A total of 77 patients were enrolled from Hospital 2 as the testing cohort, of which 51 improved and 26 progressed. The patient recruitment flowchart is shown in Fig. 1. All datasets analyzed in this study, including radiomic features, clinical variables, and corresponding outcome labels, are provided in the Supplementary Materials.
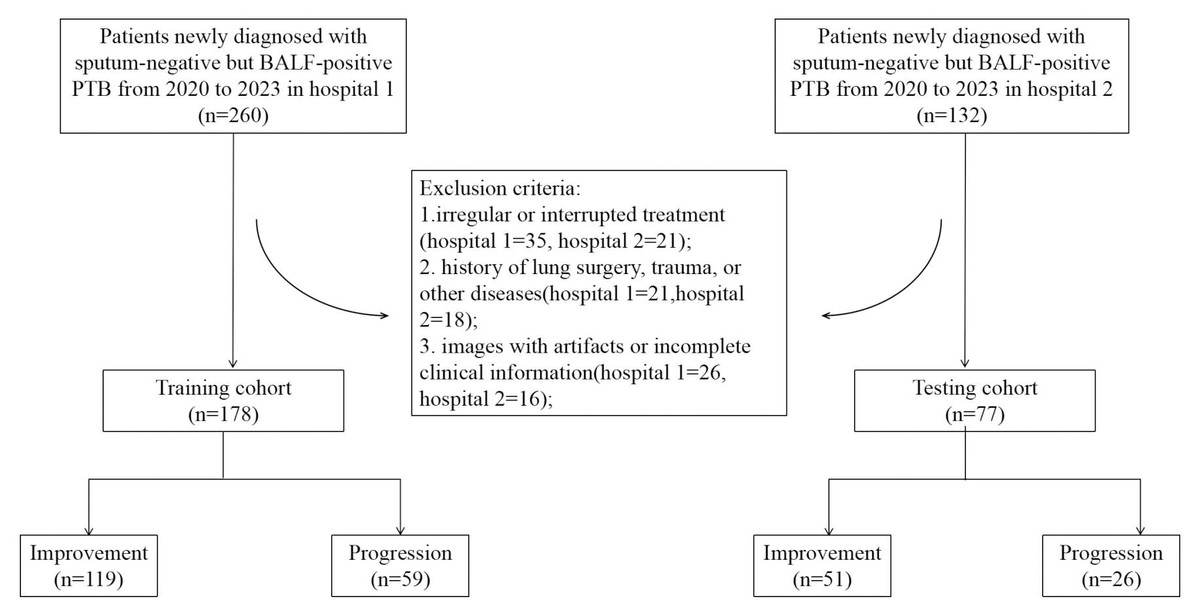
Figure 1: Flowchart of patient selection for the study.
Inclusion criteria: (1) negative sputum smear and culture results, but tuberculosis confirmed by BALF microscopy or polymerase chain reaction (PCR) testing; (2) patients with drug-susceptible tuberculosis were confirmed by drug susceptibility testing (DST) using the proportion method on Löwenstein–Jensen medium or molecular testing (GeneXpert MTB/RIF assay for rifampicin resistance), and all received standard anti-tuberculosis therapy for drug-susceptible TB; (3) newly diagnosed pulmonary tuberculosis; (4) CT scans conducted within 1 month before treatment and after 2 months of standard therapy.
Exclusion criteria: (1) irregular or interrupted treatment (Hospital 1 = 35, Hospital 2 = 21); (2) history of lung surgery, trauma, or other diseases such as HIV (Hospital 1 = 21, Hospital 2 = 18); (3) images with artifacts or incomplete clinical information (Hospital 1 = 26, Hospital 2 = 16).
In imaging assessment, the evaluation is primarily based on factors such as the size, extent, density, and presence of cavities in the lesions. If new tuberculosis lesions appear on imaging or if pre-existing lesions significantly enlarge, accompanied by new pulmonary consolidation or cavity formation, this suggests imaging progression. Conversely, if the size of pre-existing lesions notably decreases or if the pulmonary inflammatory response significantly diminishes, accompanied by a density change in the lesions (e.g., from high-density to low-density areas), this indicates imaging improvement. In clinical assessment, the evaluation is primarily based on clinical symptoms (such as cough, sputum production, and fever), laboratory indicators (including ESR, CRP, serum globulin), sputum smear, and culture results. The final classification is determined through a comprehensive analysis of symptoms, microbiological findings, and imaging.
“Improvement” is only defined when symptoms, microbiology, and imaging all suggest clinical deterioration; otherwise, the condition is classified as “Progression”.
CT image acquisition
All chest CT scans were performed using a Revolution CT or LightSpeed VCT (GE Healthcare). The scanning covered the area from the thoracic inlet to both adrenal glands, with the patient holding their breath after a deep inspiration. The scanning parameters were as follows: tube voltage, 120 kV; automatic tube current modulation; detector collimation, 64 × 0.625 mm; rotation time, 500 ms; and pitch, 1.375. The image reconstruction parameters were: slice thickness, 1.25 mm; increment, 1.25 mm; field of view, 15 cm; and matrix, 512 ×512.
The CT images used in this study were acquired from two scanners (Revolution CT or LightSpeed VCT). To minimize the impact of scanner variability on imaging features, all images underwent standardized pre-processing, including resampling to a uniform voxel size and intensity normalization, to reduce biases arising from differences in resolution and scanning parameters. Moreover, the radiomic features extracted in this study—including texture, shape and first-order statistical features—have previously been validated for good cross-scanner reproducibility (Jha et al., 2021; Zhao et al., 2016). During model training, performance remained consistent across data from different scanners, indicating that scanner variability had a limited impact on feature performance and model predictive capability.
Evaluation of subjective CT findings
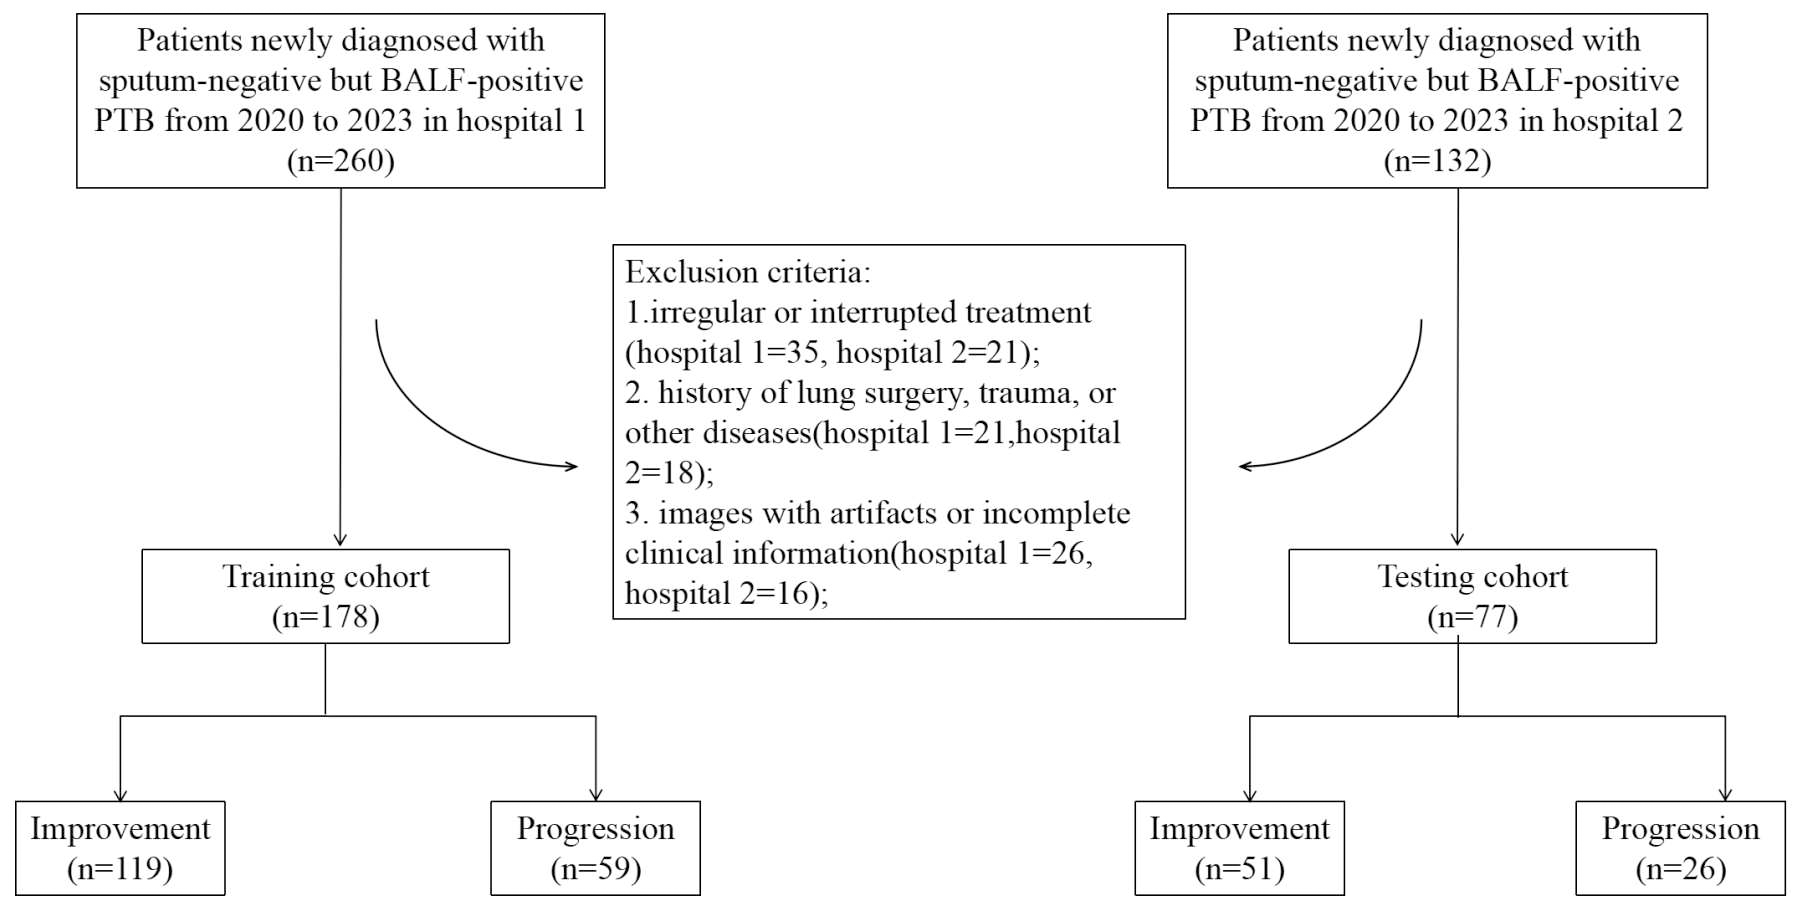
The primary CT signs were analyzed separately by two radiologists with rich experience in TB diagnosis, who were blinded to the final therapeutic efficacy results. The primary signs CT signs of PTB included (a) nodule, (b) TIB sign, (c) consolidation, (d) cavity, (e) fibrostripe (shown in Fig. 2).
Figure 2: Primary CT signs of pulmonary tuberculosis.
CT signs segmentation and radiomics feature extraction
The CT images were imported into ITK-SNAP (version 3.8) for manual segmentation of tuberculosis lesions. Two radiologists with over 10 years of experience in thoracic imaging independently delineated the lesion regions of interest (ROIs) on axial CT images, including both main lesions and satellite nodules visible in the lung window. To assess segmentation reproducibility, 20% of cases were randomly selected and re-segmented by a second reader, and the intraclass correlation coefficient (ICC) was calculated for all extracted features, only features with ICC > 0.75 were retained for subsequent analysis.
To reduce the variability of radiomic features, the dataset was homogenized before feature extraction. All CT images on the Shukun technology platform were resampled to a pixel spacing of 1.0 mm × 1.0 mm × 1.0 mm and discretized with a bin width of 25 Hounsfield units (HU). Additionally, to mitigate differences in image quality and noise between different scans and ensure the reproducibility of results, z-score normalization was applied during CT image preprocessing. A total of 1,874 features were extracted from each ROI, encompassing first-order features, shape-based features, and texture features derived from gray-level co-occurrence matrix (GLCM), gray-level run-length matrix (GLRLM), gray-level size-zone matrix (GLSZM), gray-level dependence matrix (GLDM), and neighboring gray-tone difference matrix (NGTDM).
Feature selection and model construction
All extracted features were standardized using z-score normalization before feature selection. To ensure that only the most contributive features for predicting treatment response are retained, variables with a very strong correlation are excluded. A correlation coefficient between 0.8 and 1 indicates a very strong correlation. Pearson correlation analysis was applied to remove highly collinear features (r > 0.8). A least absolute shrinkage and selection operator (LASSO) logistic regression algorithm with ten-fold cross-validation was then applied to identify the most valuable features (those with non-zero coefficients) by selecting the optimal regularization parameter, alpha.
All machine learning models were optimized for hyperparameters using grid search combined with ten-fold cross-validation on the training set to select the best parameter combination and prevent overfitting (Material S1). We selected three representative machine learning models—logistic regression (LR), random forest (RF), and support vector machine (SVM)—which correspond to three distinct algorithm types: linear models, tree-based ensemble methods, and kernel-based discriminative models. These models have been extensively validated in medical radiomics and clinical prediction studies, offering a balance between feature interpretability, the ability to capture nonlinear relationships, and generalizability. Considering the sample size and feature dimensionality in this study, overly complex models such as deep learning may risk overfitting, while overly simple models might fail to capture nonlinear associations between imaging and clinical features. By choosing these three models, we aimed to control overfitting, assess the robustness of different algorithms, and provide a scientific basis for future model optimization.
Based on the selected radiomic features, three models were trained on the training dataset, with the 3-month imaging and clinical follow-up results as the labels. The training cohort was randomly split into two parts with an 8:2 ratio, and the three models were trained and validated using ten-fold cross-validation on these subsets, followed by testing on an external test cohort. After tuning, the finalized models were evaluated on both the independent test cohort and an internal validation cohort to assess generalizability and detect potential overfitting. The flow chart of this study is shown in Fig. 3.
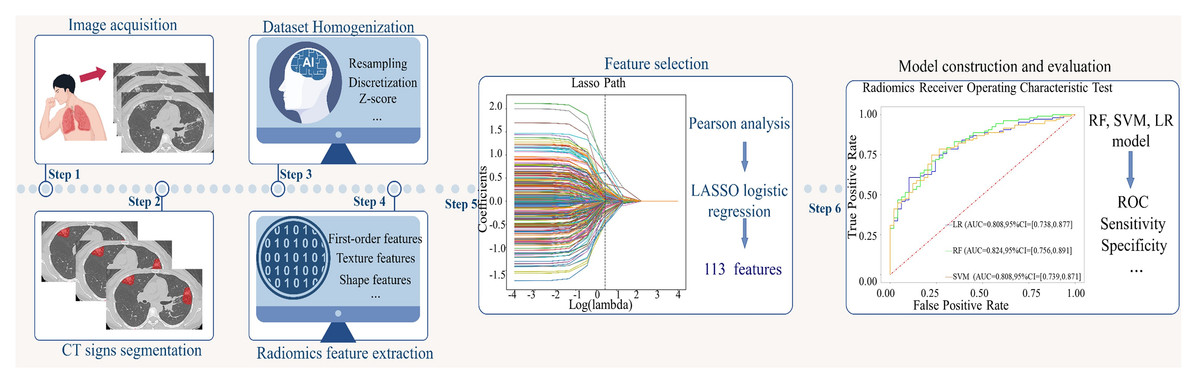
Figure 3: Flowchart of this study.
Model performance may be influenced by various factors, including feature selection and quantity, feature preprocessing and scaling, sample size, class imbalance, data quality and noise, as well as model-specific hyperparameters such as regularization strength, tree depth, or learning rate.
Statistics
All data were analyzed using SPSS 25 (IBM Corp., Armonk, NY, USA) and R software 4.2.2 (https://www.r-project.org). Continuous variables are described as mean ± standard deviation, and the kappa test was used to assess the inter-reader agreement on key CT findings. The differences in continuous variables were analyzed using an independent two-sample t-test, categorical variables were compared between groups using the chi-square test or Fisher’s exact test. To account for multiple comparisons, p-values were adjusted using the Bonferroni/FDR correction. The predictive performance of the models was quantified by the area under the receiver operating characteristic (ROC) curve (AUC) in both training and testing cohorts. Sensitivity, specificity, accuracy, and F1 score were calculated based on the confusion matrix. The DeLong test was used to compare the AUCs of the three models across both cohorts and to assess potential overfitting. Calibration curves were drawn to determine the accuracy of the model predictions. Differences were considered statistically significant at P < 0.05.
Results
Clinical characteristics
Table 1 summarizes the clinical data, key CT findings and treatment regime of the patients. Except for the TIB sign, no significant differences were observed between the progression and improvement groups. The TIB sign was more common in the improvement group (P < 0.05). The inter-observer agreement for all key CT findings was excellent (k > 0.7, all). Distribution and proportion of key CT signs in the training, testing and validation cohorts were comparable (Material S2).
| Variable | Improvement (n = 170) | Progression (n = 85) | P value |
|---|---|---|---|
| Age (years) | 33.30 ± 11.15 | 35.41 ± 14.90 | 0.21 |
| Sex | |||
| Male | 94 (55.3) | 50 (58.8) | 0.59 |
| Female | 76 (44.7) | 35 (41.2) | |
| Time from symptom onset to CT scan | |||
| Time (days) | 37.97 ± 59.62 | 38.37 ± 61.44 | 0.97 |
| No symptoms, n (%) | 23 | 11 | |
| Smoking, n (%) | |||
| Yes | 55 (32.4) | 26 (30.6) | 0.77 |
| No | 115 (67.6) | 59 (69.4) | |
| Alcohol consumption, n (%) | |||
| Yes | 53 (31.2) | 25 (29.4) | 0.77 |
| No | 117 (68.8) | 60 (70.6) | |
| Occupation, n (%) | |||
| Farmer | 12 (7.1) | 4 (9.4) | 0.47 |
| Worker | 45 (26.5) | 26 (30.6) | |
| Student | 23 (13.5) | 13 (15.3) | |
| Employee | 59 (34.7) | 22 (25.9) | |
| Unemployed individual | 15 (8.8) | 11 (12.9) | |
| Others | 16 (9.4) | 9 (10.6) | |
| Clinical data | |||
| Sputum smear (-, %) | 100 | 100 | |
| Sputum culture (-, %) | 100 | 100 | |
| T-SPOT (+, %) | 100 | 100 | |
| ESR (mm/1 h) | 25.35 ± 13.82 | 27.18 ± 15.05 | 0.34 |
| CRP (mg/L) | 25.17 ± 155.86 | 11.35 ± 25.64 | 0.42 |
| Serum globulin (g/L) | 31.22 ± 5.04 | 30.14 ± 4.57 | 0.10 |
| CT signs | |||
| Nodules, n (%) | |||
| Presence | 165 (97.0) | 85 (100) | 0.17 |
| Absence | 5 (2.9) | 0(0) | |
| Tree-in-bud sign, n (%) | |||
| Presence | 148 (87.1) | 61 (71.8) | 0.003 |
| Absence | 22 (12.9) | 14 (16.5) | |
| Consolidation, n (%) | |||
| Presence | 49 (28.8) | 19 (22.4) | 0.27 |
| Absence | 121 (71.2) | 66 (77.6) | |
| Cavity, n (%) | |||
| Presence | 64 (37.6) | 27 (31.8) | 0.36 |
| Absence | 106 (62.4) | 58 (68.2) | |
| Fibrostripe, n (%) | |||
| Presence | 97 (57.1) | 54 (63.5) | 0.32 |
| Absence | 73 (42.9) | 31 (36.5) | |
| Treatment regimen | |||
| HRZE | |||
| 0.3qd 0.45qd 0.5tid 0.75qd | 95 | 48 | 0.93 |
| 0.3qd 0.6qd 0.5tid 0.75qd | 26 | 6 | |
| 0.4qd 0.6qd 0.5tid 0.75qd | 9 | 2 | |
| 0.3qd 0.45qd 0.5bid 0.5qd | 11 | 2 | |
| 0.4qd 0.6qd 0.5tid 1.0qd | 3 | 2 | |
| HRZ | |||
| 0.3qd 0.45qd 0.5tid | 1 | 1 | 1.00 |
| HRE | |||
| 0.3qd 0.45qd 0.75qd | 1 | 5 | 0.01 |
| HRftZE | |||
| 0.5qd 0.6biw 0.5tid 0.75qd | 3 | 2 | 0.75 |
| 0.3qd 0.45biw 0.5tid 0.75qd | 3 | 1 | |
| HRftE | |||
| 0.3qd 0.6biw 0.75qd | 1 | 3 | 0.08 |
| 0.3qd 0.45biw 0.75qd | 3 | 1 | |
| HRftZ | |||
| 0.3qd 0.45biw 0.5tid | 2 | 1 | 1.00 |
| Ethambutol hydrochloride, pyrazinamide, rifampicin and isoniazid tablets II | |||
| 2.7qd | 2 | 3 | 0.20 |
| 3.6qd | 7 | 6 | |
| 4.5qd | 3 | 2 |
Notes:
Values are presented as mean ± SD, or n (%). Differences between groups were assessed using the chi-square test or Fisher’s exact test for categorical variables and the independent two-sample t-test for continuous variables.
- ESR
-
erythrocyte sedimentation rate
- CRP
-
C-reactive protein
- CT
-
computed tomography
- –
-
negative sputum smear and culture, indicating that Mycobacterium tuberculosis was not detected in the sputum sample
- +
-
positive T-SPOT, indicating that there may be a tuberculosis infection in the body
- qd
-
once a day
- bid
-
twice a day
- tid
-
three times a day
- biw
-
twice a week
Feature selection
A total of 1,874 radiomic features were initially extracted from CT images. After removing highly correlated features (Pearson r ≥ 0.8), LASSO regression using ten-fold cross-validation identified 113 non-zero coefficient features associated with tuberculosis progression (Figs. 4 and 5, Material S3), including multiple first-order, shape, and texture features. These features were subsequently used to construct LR, RF, and SVM models. LASSO coefficients and RF feature importance scores showed a weak correlation (r = 0.362, P = 0.000, Material S3).
Model performance
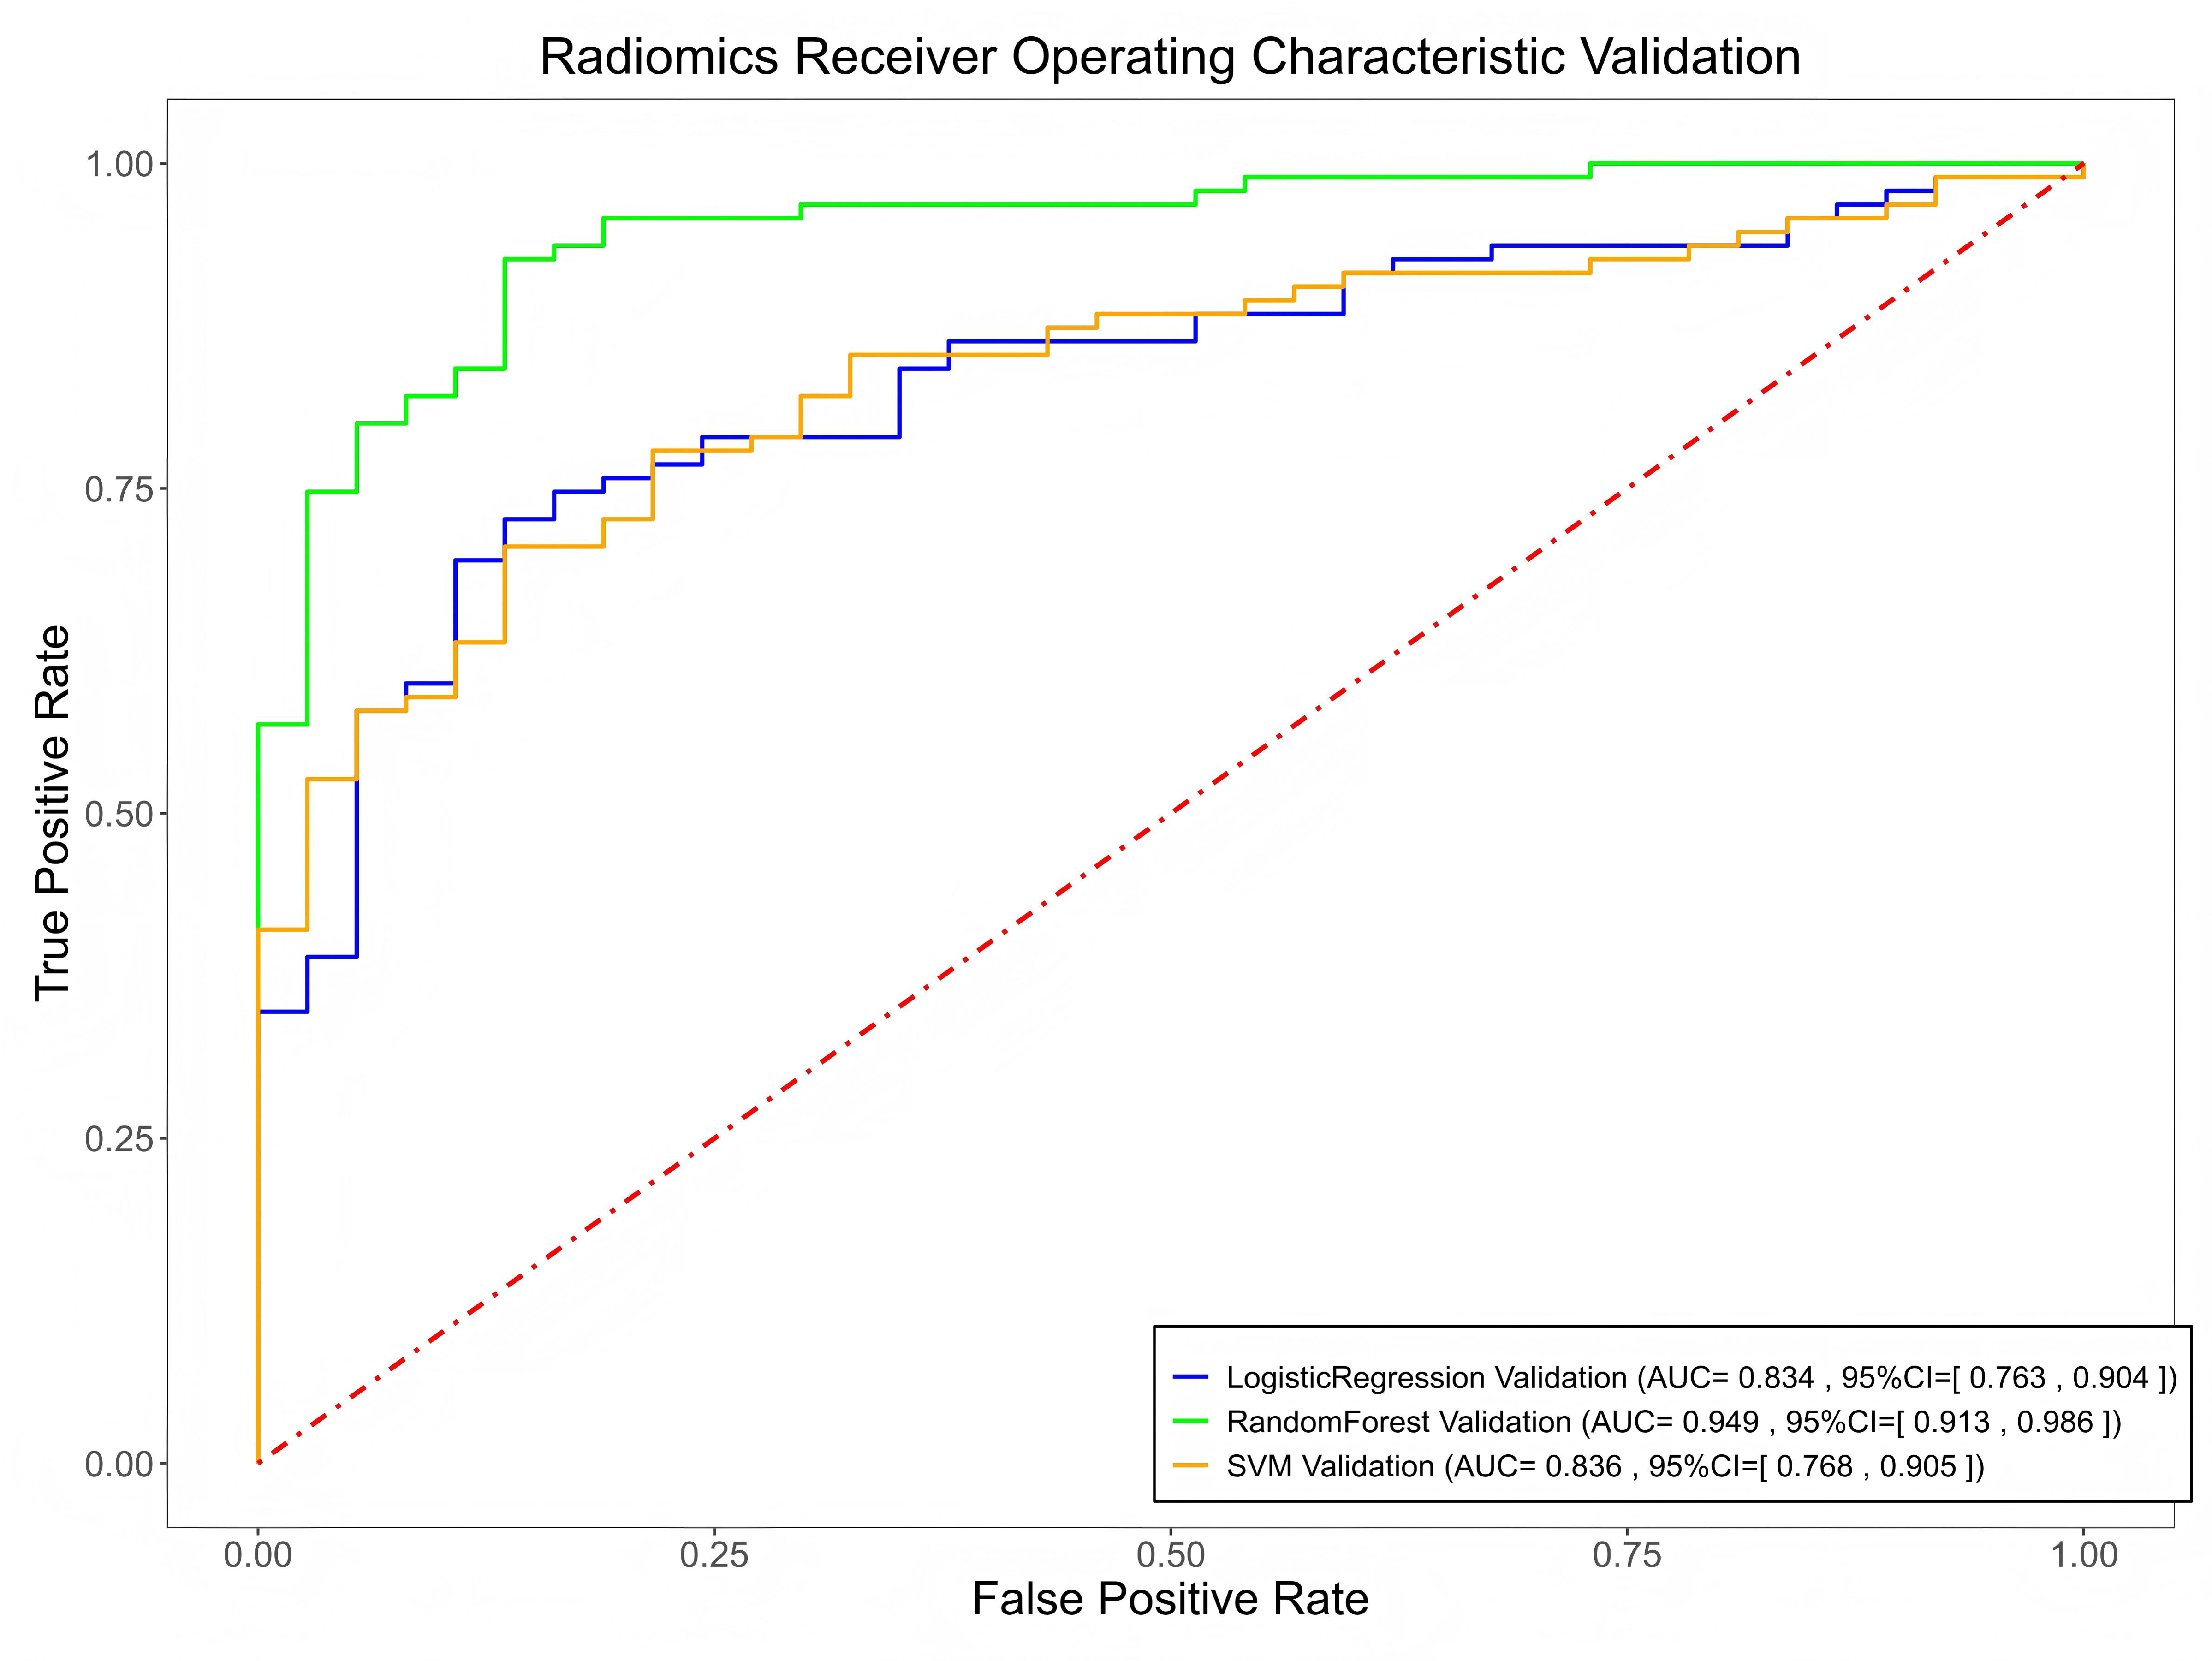
Among the three models, the RF model achieved the highest predictive performance in both the training (AUC = 0.996, F1 = 0.982) and testing cohorts (AUC = 0.824, F1 = 0.832), with superior calibration compared to LR and SVM (Fig. 6, Material S3 and Table 2). However, there were no significant differences between the models (P > 0.05). Internal validation on a 42-case set further confirmed strong generalization (AUC = 0.949, Fig. 7).
Discussion
This study developed three machine learning models based on radiomics features extracted from different CT findings to effectively predict the therapeutic efficacy for this type of TB. By comparing the predictive performance of the RF, SVM, and LR models, comparison of the RF, SVM, and LR models showed no significant differences in overall performance; however, the RF model demonstrated the highest discriminative ability among them.
The standard treatment regimen for drug-sensitive pulmonary TB is 2HRZE/4HR, which consists of an intensive phase and a continuation phase (Motta et al., 2024). The intensive phase plays a critical role in rapidly reducing the bacterial load, mainly by eliminating actively growing bacilli, thereby reducing transmission and preventing the development of drug resistance (Nahid et al., 2016). Accurately predicting the treatment outcome after two months of therapy for newly diagnosed sputum-negative but BALF-positive TB is essential for timely adjustments to the treatment plan, especially in cases of drug resistance or poor therapeutic efficacy.
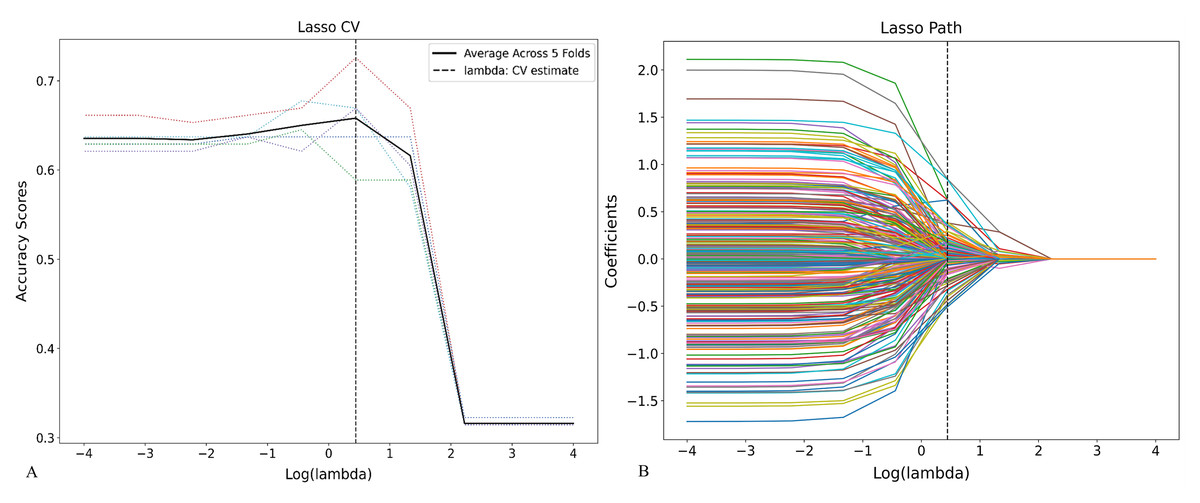
Figure 4: Feature selection using LASSO regression based on radiomic features.
(A) Cross-validation curve for the LASSO model showing the relationship between the regularization parameter (λ) and model performance. The optimal λ value was selected at the point minimizing the cross-validation error. (B) LASSO coefficient path illustrating how the coefficients of individual radiomic features shrink toward zero as log (λ) increases, with non-zero coefficients representing the selected predictive features.
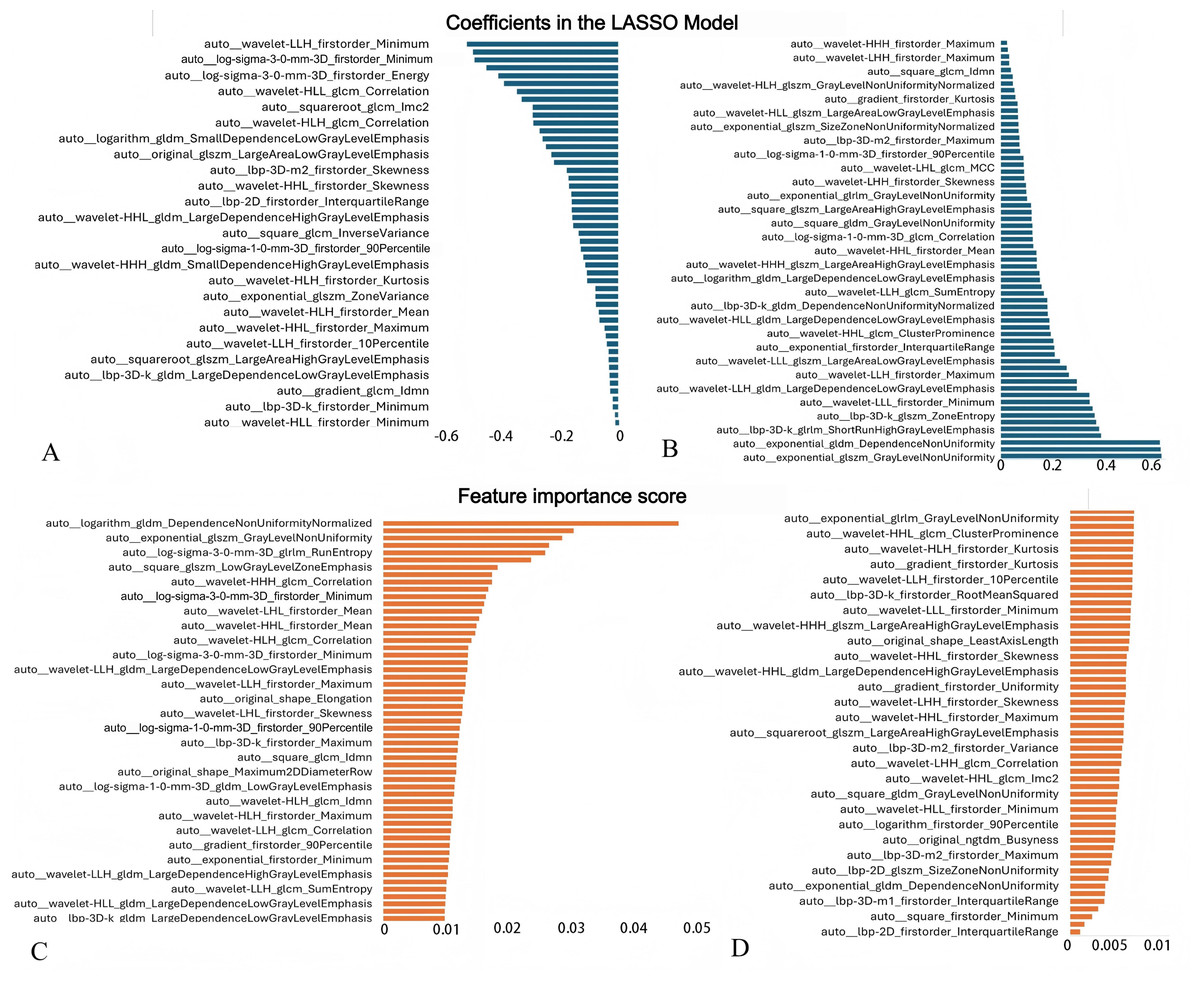
Figure 5: Radiomic features selected for predictive modeling and their corresponding coefficients/importance scores.
(A, B) Coefficients of features selected by LASSO. The vertical axis lists the names of all features retained by LASSO, while the horizontal axis represents the regression coefficients of each feature in the LASSO model. Negative values indicate a negative correlation between the features and the target variable, while positive values indicate a positive correlation. The absolute magnitude of the coefficients reflects the degree of influence. (C, D) Feature importance scores generated by the RF model.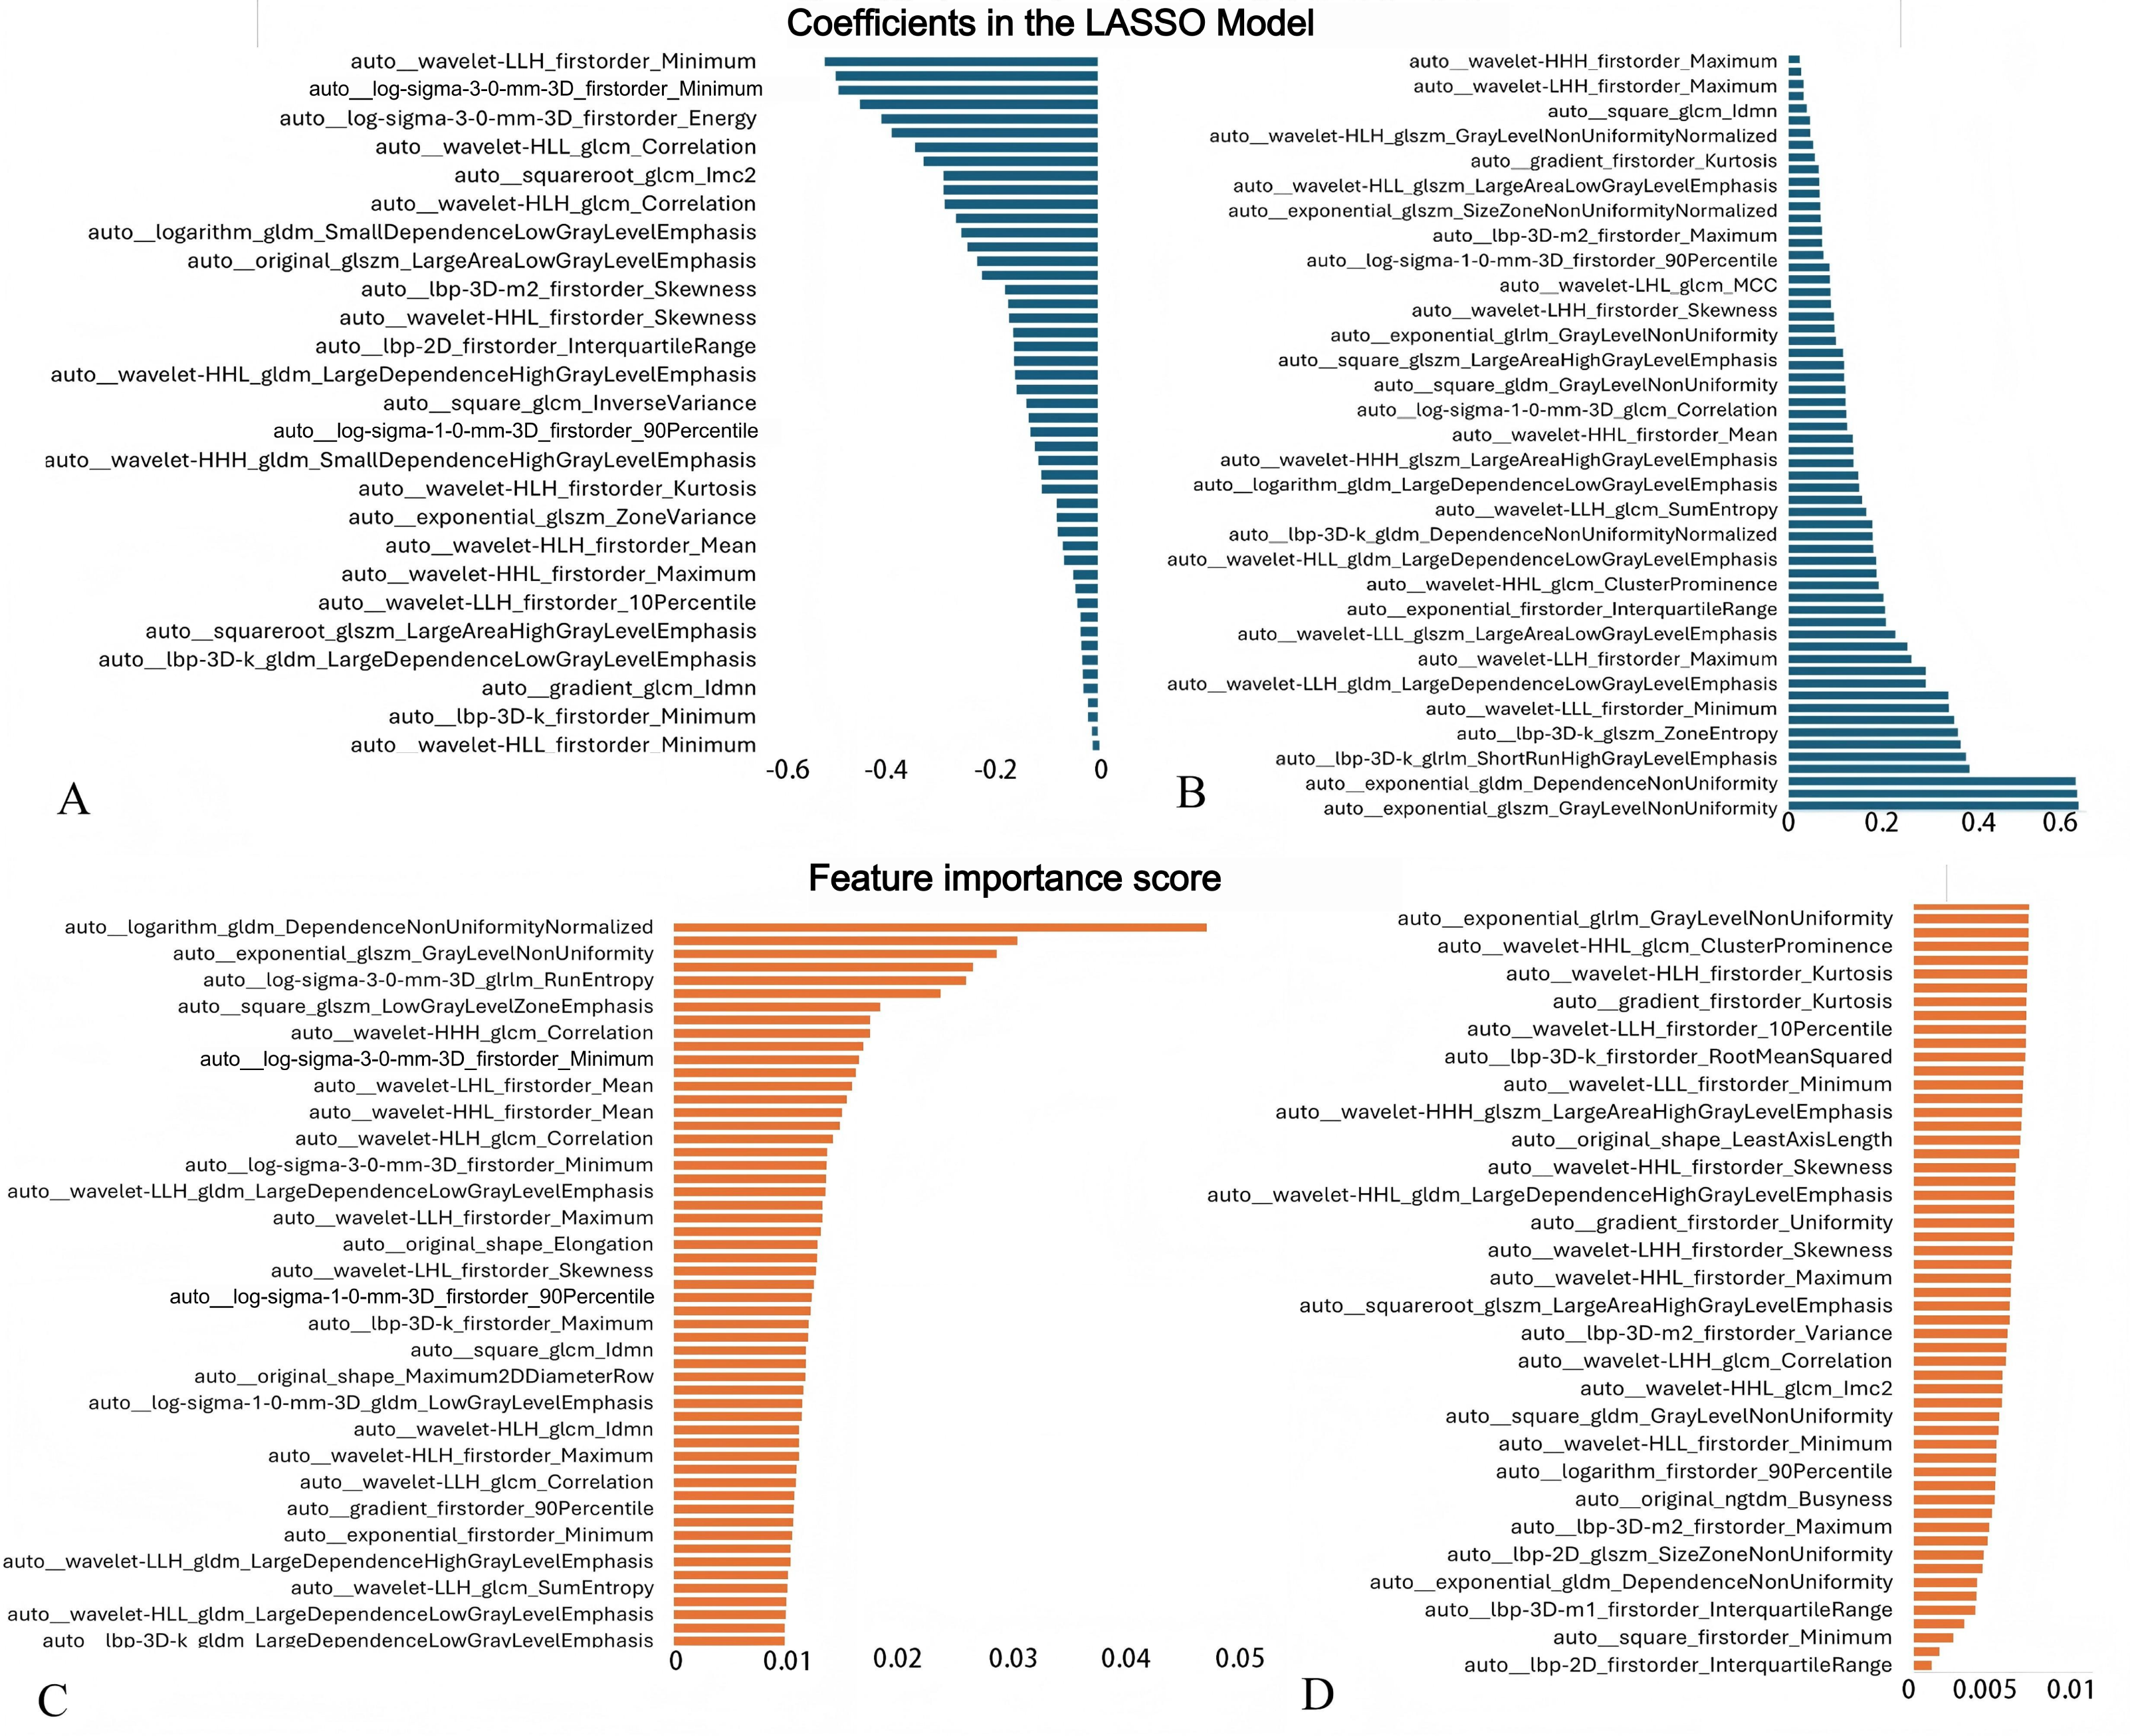
Figure 6: The performance of the three radiomics-based models in predicting the therapeutic efficacy of tuberculosis in the training and test cohorts.
(A, C) ROC curves and precision–recall curves of the three models in the training cohort. (B, D) ROC curves and precision–recall curves of the three models in the testing cohort. The ROC curves illustrate the models’ discriminative ability, the precision–recall curves evaluate performance on the minority class.
This study analyzed the clinical data and key imaging features of the patients. The clinical data included indicators such as age, gender, CRP, ESR, and globulin. Although these indicators are typically elevated in active TB, no significant differences were observed between the improvement and progression groups. Nevertheless, they may still provide preliminary guidance for identifying activeTB.
Each radiological feature, such as nodule, TIB, consolidation, cavity, and fibrostripe, reflects different pathological processes (Geng et al., 2005). Different CT signs also exhibit distinct responses to tuberculosis treatment (Im et al., 1993). In this study, we analyzed several common CT features of pulmonary tuberculosis to evaluate their predictive value for treatment response. The results showed that no significant differences were observed for other features between the progression and improvement groups, except for the TIB sign. This finding is consistent with previous research (Lee et al., 2008), suggesting that the TIB sign may be associated with inflammatory resorption or repair phases, whereas the specificity of other signs is weaker. These results further highlight the clinical relevance of our study, as the timely evaluation of treatment effectiveness is crucial for the early intervention required for newly diagnosed tuberculosis patients, approximately half of whom do not test positive for acid-fast bacilli.
For instance, one study showed that a radiomics model based on cavitary TB could predict sputum culture conversion at six months in patients with multidrug-resistant tuberculosis (Lv et al., 2023). Another study developed three radiomics models using three-month CT features to evaluate treatment response, suggesting that integrating radiomics with deep learning could help predict early treatment failure (Nijiati et al., 2023a). These findings highlight the unique value of radiomics in predicting outcomes.
Radiomics offers rich quantitative data and can integrate various imaging features such as shape, texture, and density to construct a comprehensive lesion feature model (Hatt et al., 2019). By analyzing subtle changes in imaging, radiomics captures details that traditional evaluation methods might miss, enabling the early identification of treatment responses and disease progression. Recent studies have developed and validated radiomics models based on common CT features, such as cavities, TIB, or nodules, to predict multidrug-resistant tuberculosis, with promising results (Li et al., 2023a; Li et al., 2023b). A recent study confirmed that a radiomics model based on cavitary TB can predict sputum culture conversion at six months in patients with multidrug-resistant tuberculosis (Lv et al., 2023). Another study developed three radiomics models based on three-month CT features to evaluate treatment response in tuberculosis (Nijiati et al., 2023a). The results suggested that the integration of radiomics features with deep learning models may help predict early treatment failure in DR-TB. These studies underscore the significant value of radiomics in predicting treatment outcomes. Similarly, our study found that three machine learning models based on radiomics features extracted from five CT signs performed well in predicting the treatment response of newly diagnosed pulmonary tuberculosis after two months. Of these models, the RF model outperformed the SVM and LR models, likely due to its superior ability to handle high-dimensional data. RF can effectively capture complex relationships among features through decision tree ensemble, making it particularly suitable for dealing with datasets containing numerous radiomics features (Hu & Szymczak, 2023). Furthermore, feature importance scores calculated by RF provide a reliable estimate of each feature’s contribution to model predictions. This method is particularly suitable for high-dimensional, correlated radiomic features, enabling an intuitive evaluation of their relative importance and improving model interpretability.
| Index | Training cohort | Testing cohort | Validation cohorts | ||||||
|---|---|---|---|---|---|---|---|---|---|
| RF | SVM | LR | RF | SVM | LR | RF | SVM | LR | |
| AUC | 0.996 | 0.917 | 0.927 | 0.824 | 0.808 | 0.808 | 0.949 | 0.837 | 0.834 |
| SEN | 0.976 | 0.771 | 0.795 | 0.832 | 0.664 | 0.664 | 0.947 | 0.779 | 0.790 |
| SPE | 0.975 | 0.944 | 0.918 | 0.633 | 0.796 | 0.755 | 0.811 | 0.784 | 0.730 |
| ACC | 0.976 | 0.826 | 0.834 | 0.769 | 0.705 | 0.692 | 0.909 | 0.780 | 0.773 |
| F1 | 0.982 | 0.858 | 0.867 | 0.832 | 0.755 | 0.747 | 0.938 | 0.836 | 0.833 |
Notes:
Performance was evaluated using AUC, ACC, SEN, SPE, and F1-score.
- RF
-
random forest
- SVM
-
support vector machine
- LR
-
logistic regression
- AUC
-
area under curve
- ACC
-
accuracy
- SEN
-
sensitivity
- SPE
-
specificity
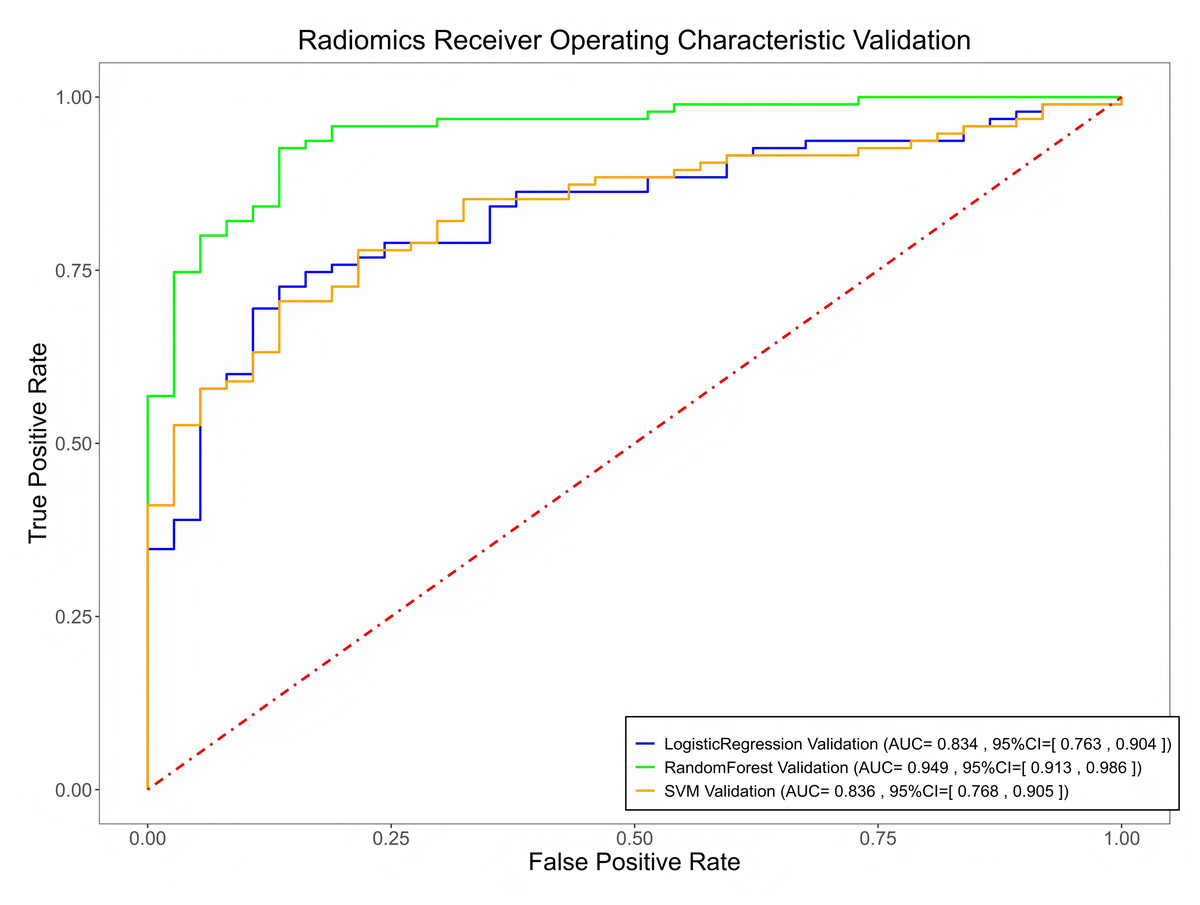
Figure 7: The performance of the three radiomics-based models in predicting the therapeutic efficacy of tuberculosis in the validation cohorts.
The number of original radiomic features is vast. To reduce redundancy and select the most relevant features for treatment response, we first applied Pearson correlation analysis, followed by LASSO regression. This process retained only the features that were significantly associated with treatment outcomes, thereby improving the accuracy and stability of the predictive models. Combining different types of features enables the model to capture various biological properties, ensuring clinical interpretability and biological relevance (Lambin et al., 2012; Zwanenburg et al., 2020). Compared with traditional qualitative assessments, radiomics provides a more precise tool by quantifying subtle differences (Lambin et al., 2012; Zwanenburg et al., 2020). Specifically, different feature types, such as shape, texture and grey-level dependent features, reveal distinct aspects of tuberculosis lesions (Lambin et al., 2012; Aerts et al., 2014; Van Griethuysen et al., 2017; Zhang et al., 2017), contributing to the prediction of treatment response.
This study has several limitations. First, the sample size was relatively small, and future studies with larger cohorts are needed to confirm these findings. Second, this study did not include external validation. Although the internal validation showed stable predictive performance, external validation using multicenter datasets is required to further confirm the generalizability of the model. Third, this was a retrospective study, and prospective studies are needed to verify the clinical value of this noninvasive and practical method in real-world practice. Finally, this study included drug-sensitive TB patients, so the impact of drug resistance on treatment outcomes could not be directly evaluated. Future multicenter studies including both drug-susceptible and drug-resistant patients may provide a more comprehensive basis for individualized treatment.
Conclusions
The three models (RF, SVM, and LR) demonstrated excellent performance in predicting the treatment efficacy of newly diagnosed sputum-negative but BALF-positive pulmonary tuberculosis after two months of intensive therapy. Accurate early prediction of treatment outcomes can help to identify patients at risk of a poor response, facilitate the timely adjustment of therapy and potentially prevent disease progression and further transmission.
Supplemental Information
Code and optimal hyperparameters of three machine learning models
All models were optimized by grid search combined with ten-fold cross-validation on the training set. Parameters shown here correspond to the best-performing configurations used for model training.
Distribution and proportion of key CT signs in the three cohorts
Statistical comparisons of CT signs among cohorts were performed using chi-square or Fisher’s exact tests. P-values were corrected for multiple comparisons using the Bonferroni method. Statistical significance was defined as P < 0.05.
Radiomic features selected by the LASSO regression for model construction and RF importance score generated by the RF model
Features were extracted from manually segmented lesions and normalized before selection. Feature classes include first-order features , shape features, and texture features (GLCM, GLRLM, GLSZM, NGTDM, GLDM).
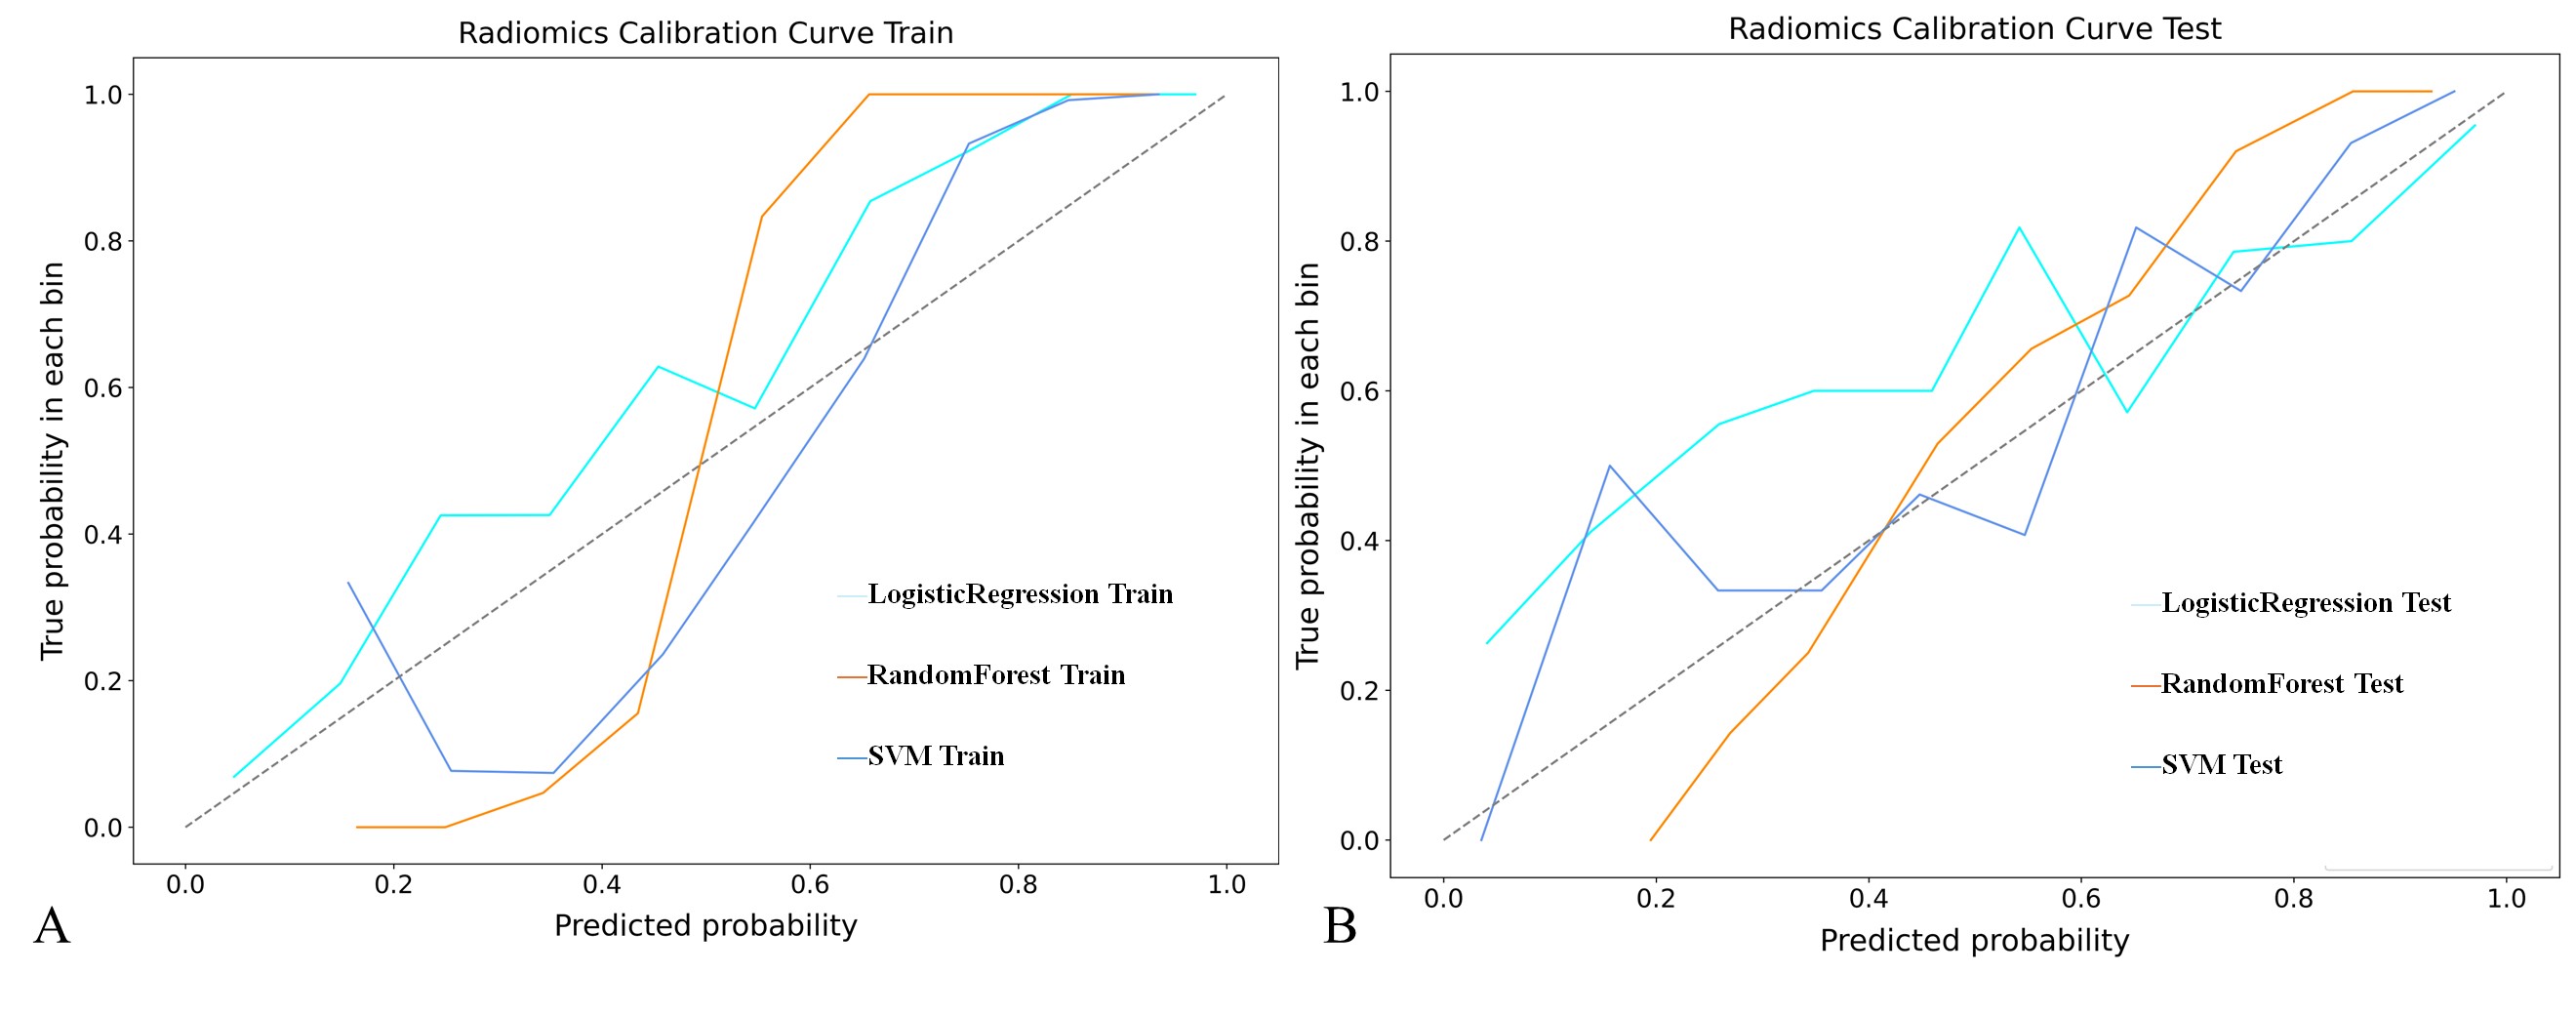
The calibration curves of the three radiomics-based models in predicting the therapeutic efficacy of tuberculosis
(A, B) The calibration curves of the three models in the training cohort and testing cohort. The calibration curves assess agreement between predicted probabilities and observed outcomes.