
Identification of hypoxia- and mitochondria-related genes associated with recurrent spontaneous abortion: an integrative bioinformatics analysis and preliminary validation
- Published
- Accepted
- Received
- Academic Editor
- Sonia Oliveira
- Subject Areas
- Bioinformatics, Genomics, Gynecology and Obstetrics, Women’s Health, Data Mining and Machine Learning
- Keywords
- Mitochondria, Hypoxia, BSG, TRAK1, Recurrent spontaneous abortion, Gene expression
- Copyright
- © 2025 Chen et al.
- Licence
- This is an open access article distributed under the terms of the Creative Commons Attribution License, which permits using, remixing, and building upon the work non-commercially, as long as it is properly attributed. For attribution, the original author(s), title, publication source (PeerJ) and either DOI or URL of the article must be cited.
- Cite this article
- 2025. Identification of hypoxia- and mitochondria-related genes associated with recurrent spontaneous abortion: an integrative bioinformatics analysis and preliminary validation. PeerJ 13:e20467 https://doi.org/10.7717/peerj.20467
Abstract
Background
Hypoxia and mitochondrial dysfunction have been implicated in recurrent spontaneous abortion (RSA), although the precise molecular mechanisms remain unclear. This study aimed to explore hypoxia- and mitochondria-related genes (HRGs and MRGs) that may be associated with RSA using integrative bioinformatics approaches and preliminary experimental validation.
Methods
We analyzed transcriptomic data and curated a list of HRGs/MRGs, and subsequently identified differentially expressed genes (DEGs) between the RSA and control groups. Overlapping DEGs with HRGs and MRGs revealed candidate genes, which were further validated through machine learning and expression analysis. A nomogram was developed to predict RSA risk based on these genes. Additionally, functional enrichment analysis, immune infiltration profiling, and regulatory network analysis were performed, followed by drug prediction. Reverse transcription quantitative polymerase chain reaction (RT-qPCR) confirmed the differential expression of genes.
Results
BSG and TRAK1 were identified, via bioinformatics and RT-qPCR validation, as hypoxia- and mitochondria-related genes associated with RSA. Gene Set Enrichment Analysis (GSEA) suggested that BSG and TRAK1 may be associated with biological pathways such as zinc ion homeostasis and NK cell-mediated cytotoxicity, although their mechanistic roles remain unclear. The nomogram exhibited strong predictive accuracy. BSG and TRAK1 were positively correlated with resting memory CD4+ T cells, with their expression regulated by transcription factors EHMT2 and SUPT5H. Drug prediction analyses, based on gene expression patterns, suggested captopril, valproic acid, and compound 7646-79-9 as potential candidates for future experimental investigation, although their mechanistic roles remain to be validated.
Conclusion
BSG and TRAK1 are upregulated in RSA and associated with RSA-relevant biological processes. While their functional roles require further investigation, these genes represent promising candidates for future mechanistic and clinical studies.
Introduction
Recurrent spontaneous abortion (RSA) refers to the loss of two or more pregnancies before 20–24 weeks of gestation (Dimitriadis et al., 2020). It includes both early embryonic loss and fetal death (Dimitriadis et al., 2020). RSA affects about 2.5% of women of reproductive age, significantly impacting their physical and psychological well-being (Dimitriadis et al., 2020). The etiology of RSA is multifactorial, involving uterine anatomical abnormalities, genetic factors, immune dysfunction, venous thromboembolism, and cardiovascular disease (Wang et al., 2022b; Wei et al., 2023). Notably, around 50% of RSA cases remain idiopathic (Wei et al., 2023), underscoring the need for novel biomarkers and a clearer understanding of its underlying mechanisms.
Hypoxia, a crucial regulator of the pregnancy microenvironment, has garnered increasing attention in reproductive research (Maybin, 2021). Studies have shown that hypoxia-reoxygenation conditions induce oxidative stress in placental villous explants (Hung, Skepper & Burton, 2001). Furthermore, hypoxia-inducible factor-1α (HIF-1α) expression is abnormally upregulated during the endometrial implantation window in RSA patients (Chen et al., 2016). HIF-1α levels are inversely correlated with trophoblast proliferation and invasion under hypoxic conditions (Fang et al., 2017; Li et al., 2019). These results emphasize the role of hypoxia-related genes in RSA pathogenesis.
Mitochondria, central to cellular energy metabolism, play essential roles in reproductive processes, including spermatogenesis, oocyte maturation, and embryonic development (Ramalho-Santos et al., 2009). Growing evidence has linked mitochondrial dysfunction to RSA. Patients with RSA frequently exhibit mitochondrial DNA mutations and D-loop instability (Lu et al., 2024). Additionally, altered mitochondrial function in macrophages, characterized by increased oxidative phosphorylation and reduced membrane potential, has been observed (Sheng et al., 2022). Notably, mitochondrial supplementation has been shown to improve embryo quality and reduce the risk of RSA (Morimoto et al., 2023), emphasizing the critical role of mitochondrial function in reproductive success.
Hypoxia contributes to mitochondrial dysfunction through multiple pathways. It activates the HIF-1α–miR-210 axis, leading to mitochondrial gene repression and cellular dysfunction (Anton et al., 2019). Hypoxia also disrupts mitochondrial fission–fusion dynamics by upregulating Drp1 and downregulating Mfn1—mechanisms implicated in the pathophysiology of RSA (Zhou et al., 2022). These findings underscore the pathological significance of hypoxia-induced mitochondrial dysfunction in RSA and highlight the importance of identifying key hypoxia- and mitochondria-related genes in its pathogenesis.
Although the individual roles of hypoxia and mitochondrial dysfunction in RSA have been studied, the potential gene expression links between these two pathways remain poorly characterized. In this study, we integrated transcriptomic data with functional and immune profiling to identify hypoxia- and mitochondria-related genes that show altered expression in RSA. Preliminary experimental validation confirmed their differential expression. While the precise functional roles of these hypoxia- and mitochondria-related genes remain to be elucidated, they may serve as potential biomarkers and provide a foundation for future mechanistic and therapeutic investigations.
Materials and Methods
Data collection and gene set definition
RSA-associated datasets (GSE165004 and GSE26787) were obtained from the GEO database. The GSE165004 dataset (GPL16699) contains 24 endometrial tissue samples from patients with RSA and 24 from normal controls, and was used as the training set. The GSE26787 dataset (GPL570) contains five RSA and five control endometrial tissue samples, and served as the validation set.
Using GSEA and the MitoCarta 3.0 database, we identified 2,030 mitochondria-related genes (MRGs) for further analysis. Additionally, 493 hypoxia-related genes (HRGs) were collected from published literature (Yu et al., 2023).
Identification of differentially expressed genes
To identify DEGs between RSA and control samples in the GSE165004 dataset, differential expression analysis was performed using the limma package (v1.38.0) (Li et al., 2022). Raw expression data were processed using Agilent Feature Extraction Software (v11.0.1.1) to extract hybridization signals. Background correction and quantile normalization were subsequently performed using limma to ensure data quality and comparability. DEGs were identified based on the criteria p < 0.05 and —log2FoldChange—> 0.5 (James et al., 2022). The distribution of DEGs was visualized using a volcano plot (ggplot2, v3.4.1) (Wang et al., 2022a) and a heatmap (ComplexHeatmap, v2.14.0) (Ding, Goldberg & Zhou, 2023). Notably, the GSE165004 and GSE26787 datasets were analyzed independently due to differences in microarray platforms (GPL16699 and GPL570, respectively), so no data integration was performed.
Overlap and functional profiling of candidate genes
Candidate genes potentially related to RSA were identified by intersecting DEGs with HRGs and MRGs. To explore possible biological functions and pathways of these genes, Gene Ontology (GO) and Kyoto Encyclopedia of Genes and Genomes (KEGG) enrichment analyses were conducted using the clusterProfiler package (v4.7.1.3) (Yu et al., 2012), with a significance cutoff of p < 0.05. Additionally, protein-protein interaction (PPI) networks were constructed via the STRING database (interaction score ≥ 0.4) to explore molecular interactions among candidate genes (Deng et al., 2023).
Selection of gene signatures via machine learning
After obtaining candidate genes, Least Absolute Shrinkage and Selection Operator (LASSO) and Support Vector Machine Recursive Feature Elimination (SVM-RFE) algorithms were applied using the glmnet (version 4.1.4) (Shi et al., 2023) and caret package (version 6.0.93) (Zhang et al., 2019) to select potential signature genes. The intersection of signature genes derived from two machine-learning algorithms was defined as candidate signature genes. The expression of these genes was further explored, and those showing significant differences between RSA and control groups with consistent trends in both GSE165004 and GSE26787 datasets were selected as hypoxia- and mitochondria-related genes (p < 0.05).
Development of a gene-based risk estimation model
To preliminarily evaluate the potential predictive value of hypoxia- and mitochondria-related genes for RSA risk, a nomogram was developed using the rms package (v6.0-1) (Liu et al., 2021), based on their expression levels. Calibration curve and HL test (p > 0.05) were used to assess model performance. Furthermore, performance of nomogram was further evaluated by decision curve analysis (DCA) which was displayed by rmda package (version 1.6).
Enrichment analysis based on selected gene expression
To investigate the biological pathways associated with the expression of hypoxia- and mitochondria-related genes, RSA samples from the GSE165004 dataset were divided into high- and low-expression groups based on the median expression of each gene. Differential gene expression analysis between the two groups was performed using the limma package. All genes were ranked according to log2 fold change values between high and low expression groups. Gene Set Enrichment Analysis (GSEA) was then conducted using the clusterProfiler package (v4.7.1.3), with the ranked gene list as input. The background gene sets used for enrichment were obtained from the Molecular Signatures Database (MSigDB), including GO terms (c5.go.v2023.2.Hs.symbols.gmt) and KEGG pathways (c2.cp.kegg.v2023.1.Hs.symbols.gmt). Enriched terms with —NES—>1 and p-value < 0.05 were considered statistically significant. Tables S1–S2 include the ranked gene lists, and Tables S3–S4 contain details of the background gene sets used.
Immune cell composition and gene expression correlation
The proportions of 22 immune cell types in the GSE165004 dataset were estimated using the CIBERSORT algorithm. Immune cell types with a score of 0 in over 25% of samples were excluded. Differences in immune infiltration between RSA and control groups were assessed using the Wilcoxon test (p < 0.05). Spearman correlation analysis was further applied to examine the relationship between hub genes and differential immune cells (—r—> 0.3, p < 0.05).
Prediction of regulatory associations and related compounds
To explore potential regulatory mechanisms involving the RSA-associated genes identified in this study, transcription factors (TFs) were predicted using the RNAInter dataset, and those with a confidence score >0.1 were retained. In addition, microRNAs (miRNAs) predicted to target these genes were identified using miRDB, TargetScan, and miRWalk. Key miRNAs were obtained by taking the intersection of miRNAs derived from three databases. To screen candidate compounds potentially linked to these RSA-related genes, we predicted compounds via the Enrichr platform using DSigDB, based on the expression profiles of selected genes. Specifically, these genes were input into Enrichr, and compounds with significant enrichment scores were identified based on their associations with gene expression profiles in DSigDB. The predicted drugs were ranked according to their adjusted p-values, and a subset of top-ranked candidates with statistically significant associations was selected for further analysis. Finally, a compound–gene interaction network was visualized using Cytoscape software (v3.10.1) (Wang et al., 2023).
RT-qPCR assessment of selected gene expression
To validate the expression of hypoxia- and mitochondria-related genes in endometrial tissues, specimens were obtained from five individuals with RSA and five matched healthy controls. This study has obtained the approval of the Ethics Committee of Jiangbin Hospital Guangxi Zhuang Autonomous Region (LW2025-003). All patients included in this study provided written informed consent and granted permission for the use of their medical records for the current research.
Total RNA was extracted from 50 mg of frozen tissue using the TRIzol method (Ambion, Austin, TX, USA). Samples were thoroughly homogenized in one mL of TRIzol and incubated on ice for 10 min; we then added 300 µL of chloroform (Chengdu Goodyear Gum Co., Ltd.). After standing at room temperature for another 10 min, the samples were centrifuged at 12,000 × g for 15 min at 4 °C. The upper aqueous phase was carefully collected, mixed with an equal volume of isopropanol (Chengdu Cologne Chemical Co., Ltd.) to precipitate RNA, washed twice with 75% ethanol, and finally dissolved in 20–50 µL of RNase-free water (Xavier).
Tissues were snap-frozen in liquid nitrogen within 15 min of collection and stored at −80 °C until use. Genomic DNA was removed by on-column DNase I treatment (Thermo Fisher Scientific, Waltham, MA, USA), following the manufacturer’s protocol. RNA concentration and purity were assessed using a NanoPhotometer N50 (see Table S5). No-reverse transcriptase (no-RT) controls were included to confirm the absence of genomic DNA contamination.
First-strand cDNA was synthesized using the SweScript First Strand cDNA Synthesis Kit (Xavier) in a 20 µL reaction containing four µL of 5× Reaction Buffer, one µL of Oligo(dT) primer (provided in the kit), one µL of SweScript RT I Enzyme Mix, and 0.1 ng to five µg of total RNA (amount adjusted based on concentration). Reverse transcription was performed under the following conditions: 25 °C for 5 min, 50 °C for 15 min, and 85 °C for 5 s. The resulting cDNA was diluted 5–20-fold with nuclease-free water and stored at −80 °C. To assess potential inhibition, cDNA samples were tested in serial dilutions (5 ×, 10 ×, 20 ×), and no inhibition was observed.
RT-qPCR was performed using the CFX Connect™ Real-Time PCR Detection System (Bio-Rad, Hercules, CA, USA). Each 10 µL reaction consisted of 3 µL of diluted cDNA, 5 µL of 2 × Universal Blue SYBR Green qPCR Master Mix (Xavier), and 0.5 µM each of forward and reverse primers. Primers were designed to amplify all known transcript variants of the target genes. Primer specificity was confirmed using NCBI Primer-BLAST. Detailed sequences, accession numbers, and exon–intron boundary information for all primers are listed in Table S6. Amplification curves were used to evaluate PCR efficiency and relative gene expression levels, while melting curve analysis verified primer specificity (see Fig. S1). No-template control (NTC) reactions were included in each run. No amplification was observed in the NTCs, confirming the absence of contamination or primer-dimer formation. The thermal cycling program included an initial denaturation at 95 °C for 1 min, followed by 40 cycles of 95 °C for 20 s, 55 °C for 20 s, and 72 °C for 30 s, with subsequent melting curve analysis from 65 °C to 95 °C at 0.5 °C increments every 5 s.
Each sample was analyzed in technical triplicate, with 5 biological replicates per group (Control and RSA). Gene expression was quantified using the 2ΔΔCt method, with GAPDH as the internal reference gene (H-GAPDH① for the Control group and H-GAPDH② for the RSA group). GAPDH was selected based on prior literature and its consistent expression in endometrial tissue across conditions. Ct values above 35 were excluded, and technical replicates with a coefficient of variation exceeding 5% were considered outliers and removed. Statistical analysis was conducted using unpaired t-tests in GraphPad Prism 5, with significance set at p < 0.05.
Statistical analysis
Statistical analyses were performed using R software (version 4.2.2) and GraphPad Prism 5. DEGs were identified using the limma package; immune cell differences were compared using the Wilcoxon rank-sum test, correlations were assessed by Spearman analysis, and RT-qPCR data were analyzed using unpaired t-tests, with p < 0.05 considered statistically significant.
Results
Screening and analysis of 11 RSA-associated candidate genes
A total of 831 DEGs, including 419 upregulated and 412 downregulated genes, were identified between the RSA and control groups in the GSE165004 dataset (Figs. 1A–1B). 11 candidate genes were selected by intersecting the 831 DEGs with 2,030 MRGs and 493 HRGs (Fig. 1C, Table S7). Enrichment analysis of these genes revealed enrichment in 584 GO terms and 16 KEGG pathways. GO terms included response to hypoxia, cellular response to oxygen levels, and response to decreased oxygen, among others (Fig. 1D, Table S8). KEGG pathways associated with these genes included hypertrophic cardiomyopathy, AGE-RAGE signaling in diabetic complications, and HIF-1 signaling, among others (Fig. 1E). In the PPI network, UCP3 showed relatively higher connectivity with other RSA-associated candidate genes (Fig. 1F).
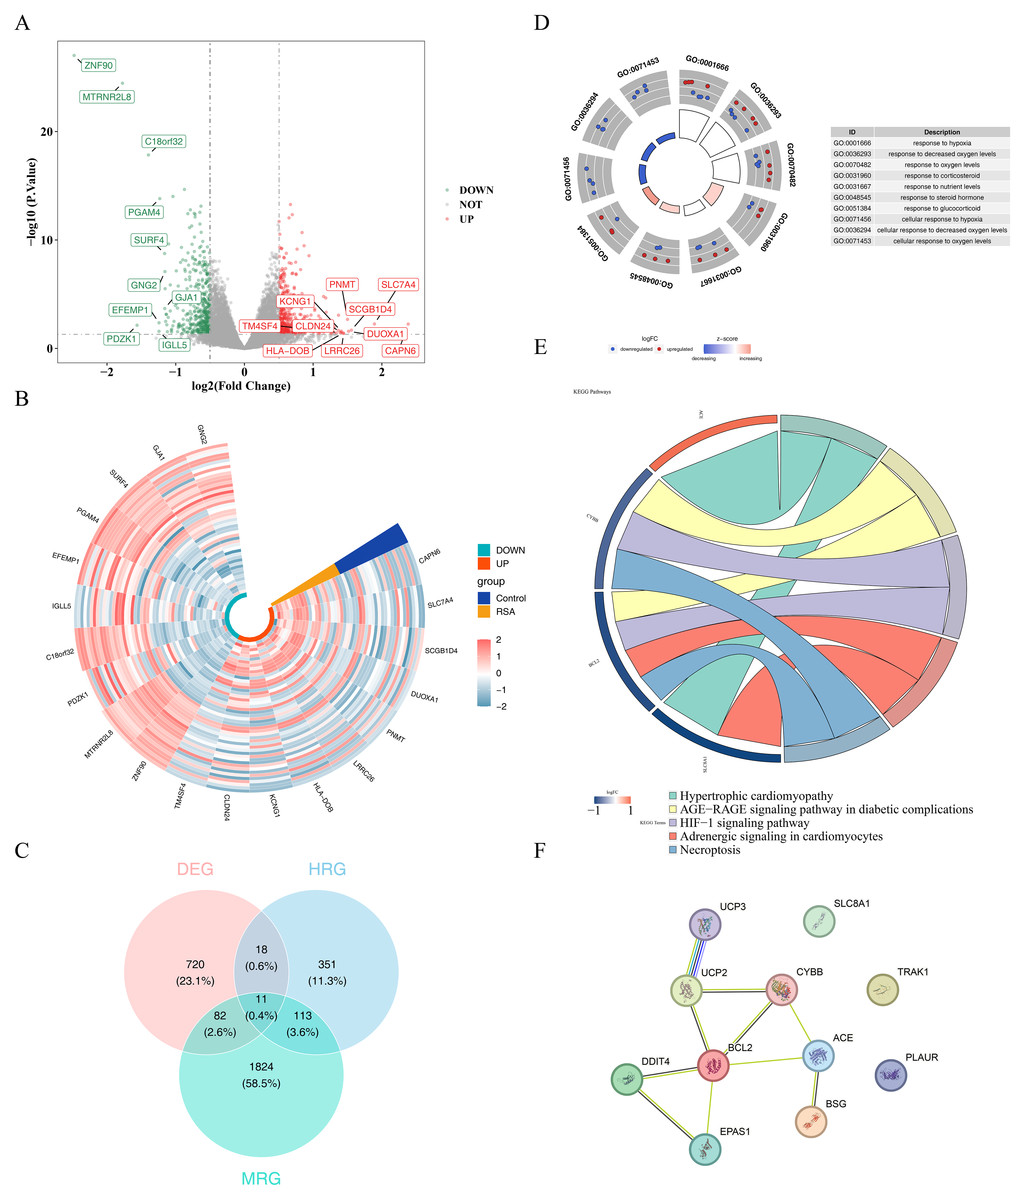
Figure 1: Results of screening and functional analysis of differential genes.
(A) Volcano map of differential gene. Red dots represent up-regulated genes and blue dots represent down-regulated genes; the top 10 genes with the most significant up/down-regulation differences are shown. (B) Heat map of differential gene. Blue represents the control group and yellow represents the RSA group; green identifies up-regulated genes and orange identifies down-regulated genes. The color gradient (−2 to 2) reflects the differential changes in gene expression levels. (C) Venn diagram showing the overlap of DEGs with MRGs and HRGs. (D) GO enrichment analysis of candidate genes. The left inner circle displays a bar chart where the height represents the significance of terms (higher bars indicate greater significance), while color intensity reflects z-scores (deeper colors denote larger z-scores). The outer circle shows scatter plots of gene expression levels across each term, with red and blue dots representing upregulated and downregulated genes respectively. The right side provides descriptions of GO enrichment entries. (E) KEGG pathway enrichment analysis of candidate genes. On the left is the gene, on the right is the pathway, and the name of the pathway is shown below. (F) PPI network analysis of candidate genes.
Expression analysis of BSG and TRAK1 as potential RSA-associated genes
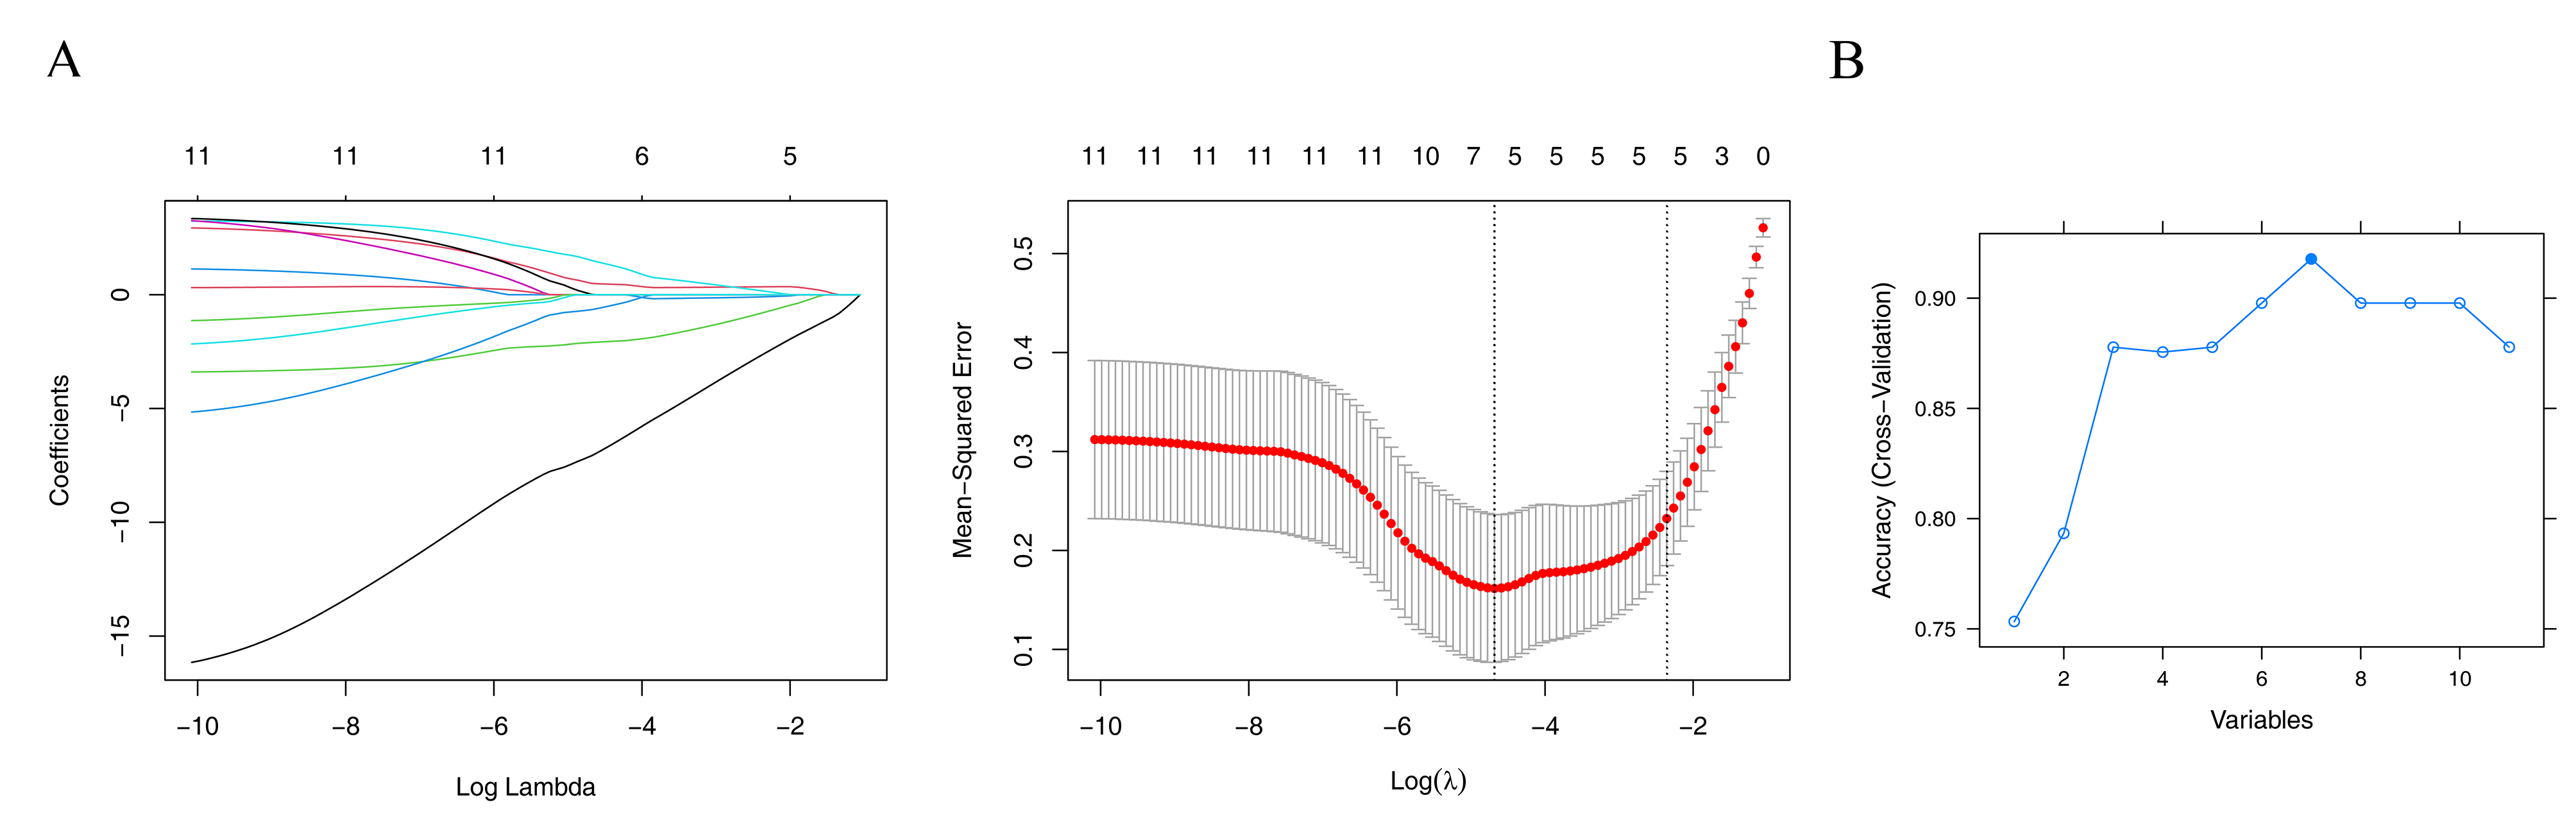
To explore genes potentially associated with RSA, machine-learning algorithms were applied. LASSO analysis yielded UCP3, BCL2, BSG, CYBB, TRAK1, and EPAS1 as one set of candidate genes (lambda.min = 0.00924) (Fig. S2A). Additionally, SVM-RFE produced another set of genes—UCP3, BCL2, UCP2, BSG, CYBB, TRAK1, and SLC8A1—corresponding to the point where the model showed relatively higher classification performance (Fig. S2B). By intersecting the potential signature genes from both machine-learning algorithms, five candidate signature genes (UCP3, BCL2, BSG, CYBB, and TRAK1) were selected (Fig. 2A). Further expression analysis showed that BSG and TRAK1 were significantly upregulated in RSA groups in both the GSE165004 and GSE26787 datasets (Figs. 2B–2C). These findings suggest that BSG and TRAK1 are potentially associated with RSA in these cohorts.
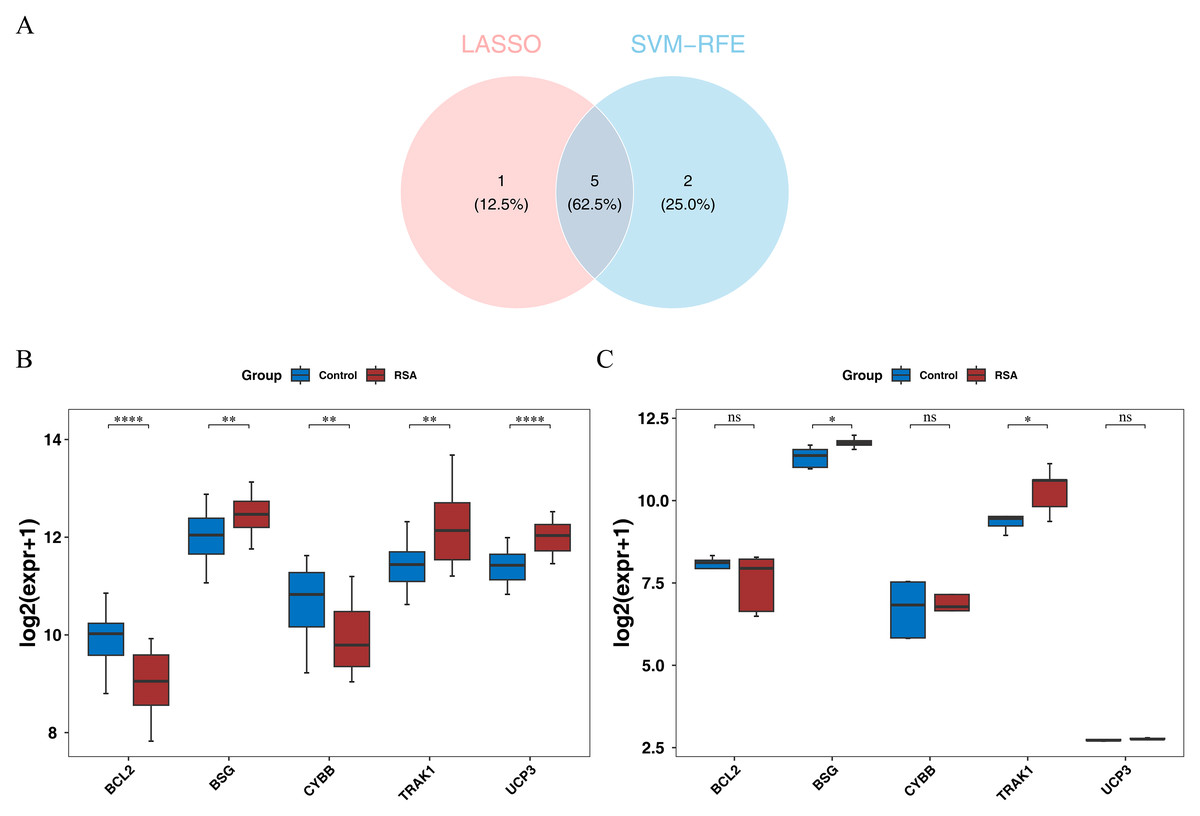
Figure 2: Screening and expression verification of key genes.
(A) Intersection analysis of candidate hub genes. (B) Expression levels of candidate hub genes in the training set (GSE165004). The box plot has genes on the x-axis and expression levels on the y-axis. Red represents disease samples and blue represents control samples. Stars represent significance. **, p < 0.01; ****, p < 0.0001. (C) Expression levels of candidate hub genes in the validation set (GSE26787). The box plot has genes on the x-axis and expression levels on the y-axis. Red represents disease samples and blue represents control samples. Stars represent significance. ns, not significant; *, p < 0.05.
Predictive nomogram based on BSG and TRAK1 expression in RSA patients
A nomogram model was constructed using the expression levels of BSG and TRAK1 to explore their potential utility in assessing RSA-related patterns (Fig. 3A). The calibration curve showed visual alignment with the reference line, and the p-value from the HL test was greater than 0.05, suggesting that the model may exhibit a degree of calibration in this dataset (Fig. 3B). DCA results also showed that the nomogram may have potential clinical relevance within this sample context (Fig. 3C).
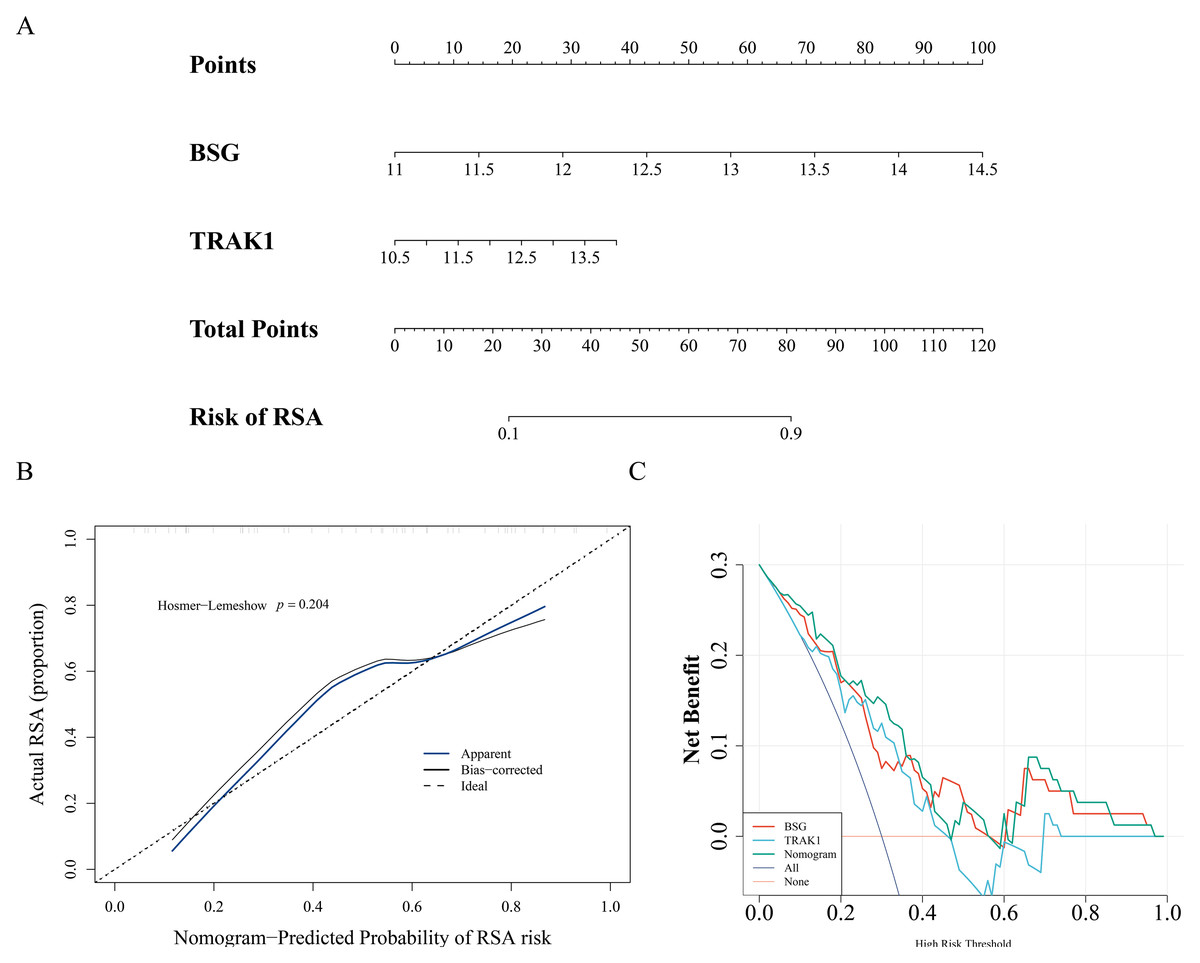
Figure 3: Nomogram of biomarkers.
(A) Nomogram model for RSA risk prediction based on hub gene expression. (B) Calibration of the nomogram. The horizontal axis represents the predicted probability of disease occurrence in the normal model, while the vertical axis shows the actual probability of disease occurrence. The black dashed line corresponds to perfect prediction. The blue solid line represents the entire cohort, and the black solid line, corrected for bias through Bootstrap (1,000 repetitions), indicates the observed performance of the normal model. (C) DCA to evaluate the efficacy of the nomogram.
Enrichment analysis of pathways related to BSG and TRAK1 expression in RSA
GSEA on genes ranked by differential expression between BSG/TRAK1 high- and low-expression groups revealed significant pathway enrichment. For BSG, a total of 1,355 GO terms and 60 KEGG pathways were enriched. Representative GO terms BSG included outer kinetochore, intracellular zinc ion homeostasis, and detoxification of copper ions (Fig. 4A). Enriched KEGG pathways involved DNA replication, mismatch repair, and glycosaminoglycan (GAG) biosynthesis-keratan sulfate (Fig. 4B). In the case of TRAK1, 1,427 GO terms and 38 KEGG pathways were significantly enriched. Key GO terms included serine-type endopeptidase complex, dendritic cell (DC) apoptotic process, and oxalate transport (Fig. 4C). The enriched KEGG pathways included complement and coagulation cascades, natural killer (NK) cell-mediated cytotoxicity, and terpenoid backbone biosynthesis (Fig. 4D).
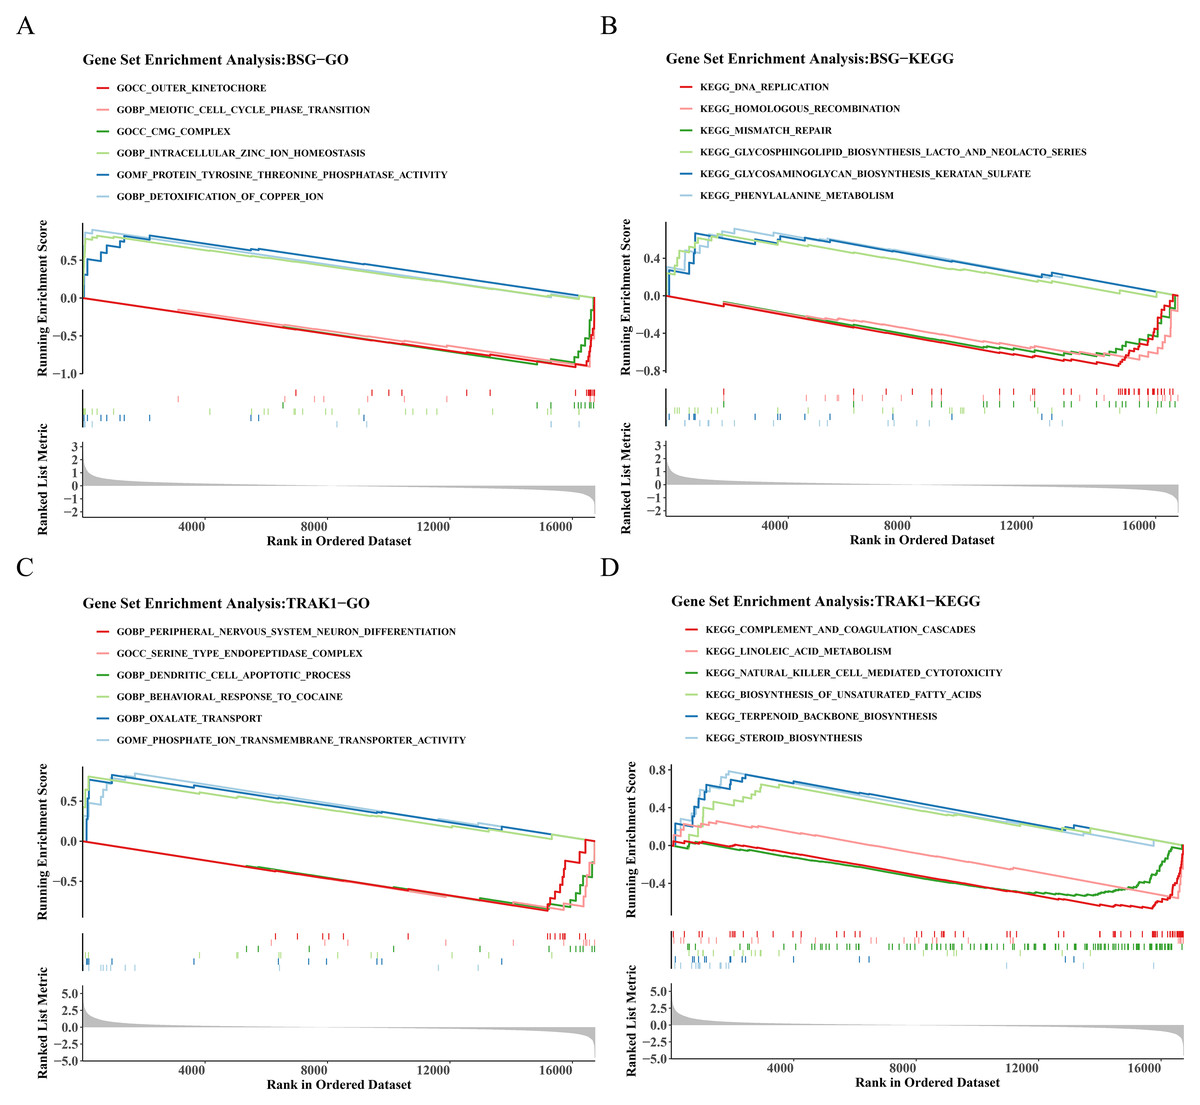
Figure 4: GO and KEGG enrichment analysis of BSG and TRAK1.
(A) GO term enrichment analysis of BSG. (B) KEGG pathway enrichment analysis of BSG. (C) GO term enrichment analysis of TRAK1. (D) KEGG pathway enrichment analysis of TRAK1. The graph is divided into three parts, the top part is a line graph of enrichment scores, each line represents a pathway, the peak value of each line is the enrichment score of the pathway, and the genes before the peak value are the core genes under the gene set of the pathway. If the peak is in the upper left corner, it represents that the core genes are mainly up-regulated genes based on the analysis of the difference between high and low groups of gene expression, and the peak is in the lower right corner, it represents that the core genes are mainly down-regulated genes based on the analysis of the difference between high and low groups of gene expression. The second part marks the genes located in the gene set with lines. The third part shows the distribution of rank values for all genes.
Immune cell composition and gene correlation patterns in RSA
The proportions of 22 immune cell types across all samples from the GSE165004 dataset are presented in Fig. 5A. Differences between the RSA and control groups were observed in M2 macrophages, monocytes, resting memory CD4+ T cells, CD8+ T cells, gamma delta T cells, and regulatory T cells (Tregs). Specifically, M2 macrophages, CD8+ T cells, and gamma delta T cells (γδ T cells) were more prevalent in the control group, whereas the remaining differentially expressed immune cell types exhibited the opposite pattern (Fig. 5B). Furthermore, a Spearman correlation analysis between the selected genes and differentially infiltrated immune cells revealed a positive correlation between BSG and resting memory CD4+ T cells (r > 0.3, p < 0.05) (Fig. 5C). TRAK1 was negatively correlated with M2 macrophages, CD8+ T cells, and γδ T cells (r <−0.3, p < 0.05), but positively correlated with resting memory CD4+ T cells and Tregs (r > 0.3, p < 0.05) (Fig. 5D).
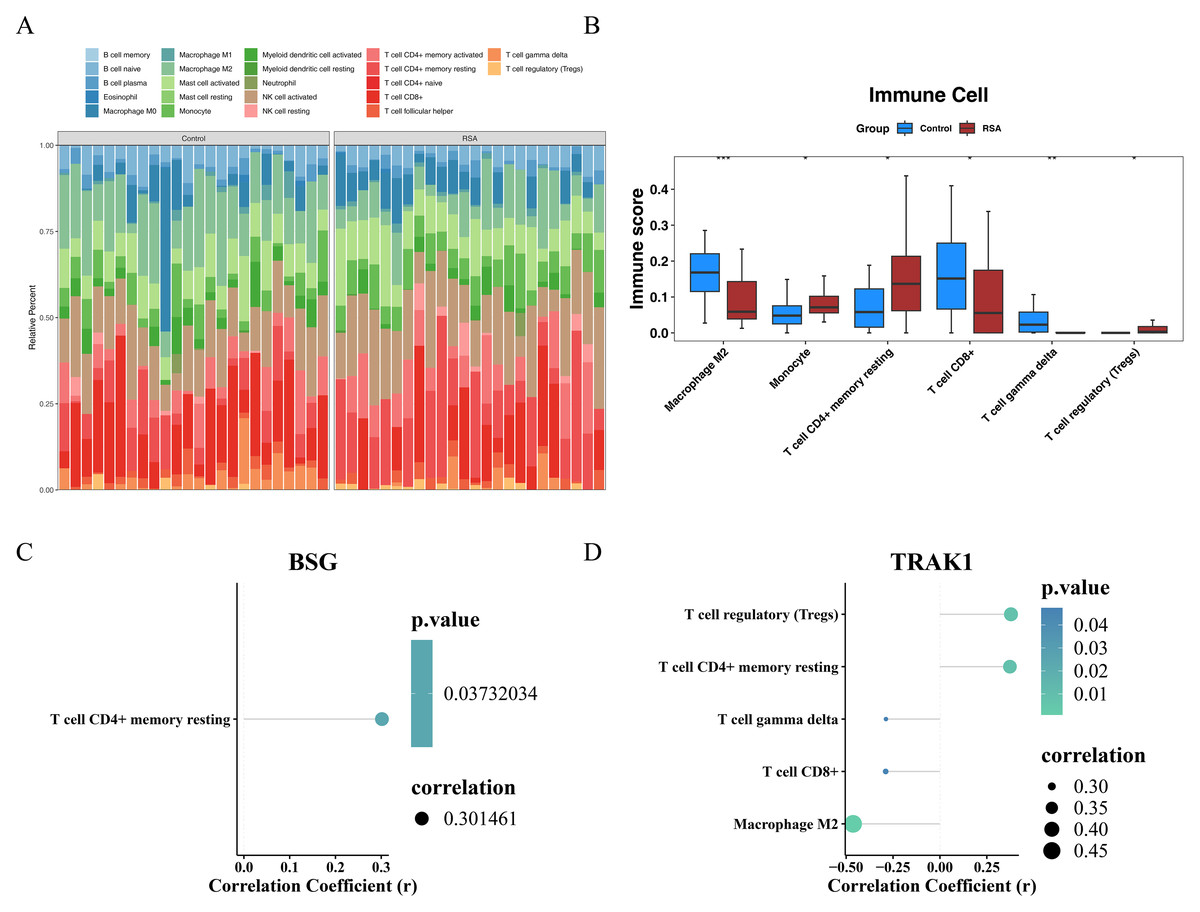
Figure 5: Immune infiltration analysis.
(A) Heat map of immune cell infiltration profiles. (B) Differential immune cell populations between groups. The horizontal axis represents the immune cells and the vertical axis represents the immune score of the immune cells in the sample. * indicates p < 0.05, ** indicates p < 0.01, *** indicates p < 0.001. (C) Correlation between BSG expression and immune cell subsets. (D) Correlation between TRAK1 expression and immune cell subsets. Different colored dots represent various immune cell sub-populations, including regulatory T cells, resting CD4+ memory T cells, γδ T cells, CD8+ T cells, and M2-type macrophages; the color gradient of the dots corresponds to the P-value, the smaller the P-value, the lighter the color is green; and the size of the dots corresponds to the absolute value of the correlation coefficient; the bigger the dots are, the stronger the correlation strength is.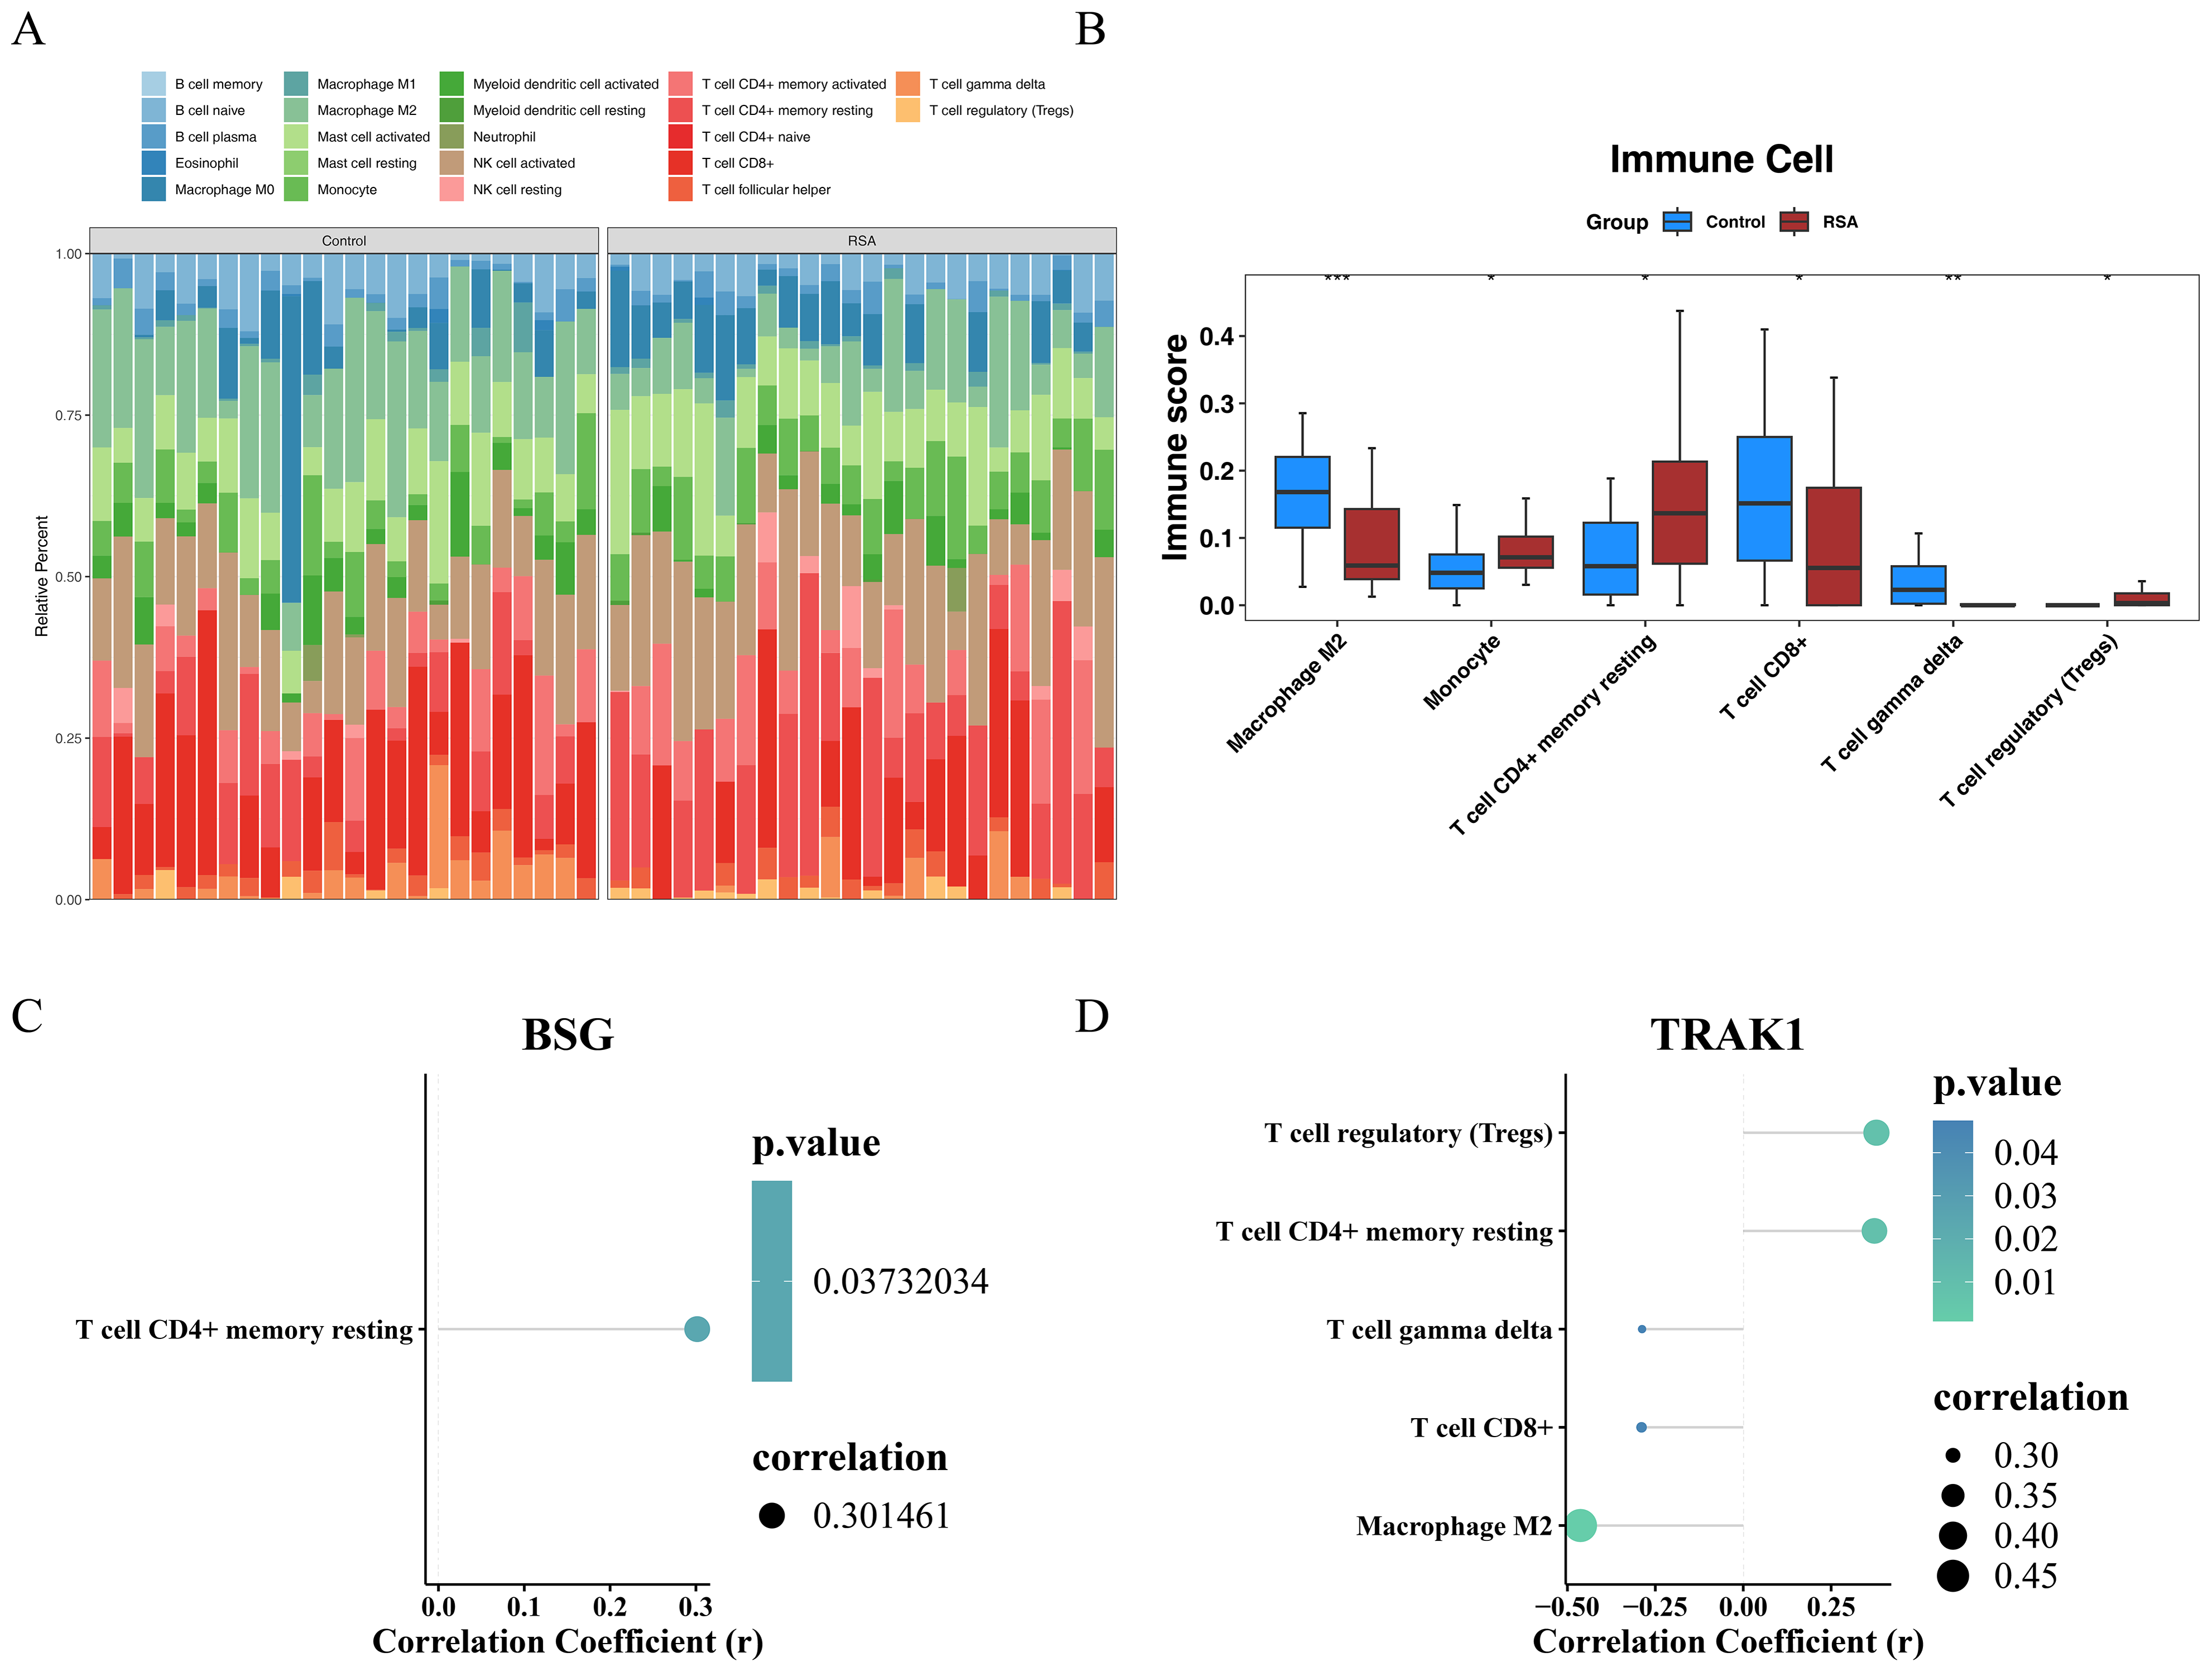
Gene regulatory associations and predicted compounds related to BSG and TRAK1 in RSA
To explore potential regulatory associations of selected genes in RSA-related datasets, 19 TFs were computationally predicted. Among these, EHMT2 and SUPT5H were predicted to be potentially associated with the regulation of both BSG and TRAK1 (Fig. 6A). Based on the selected genes, 258 miRNAs were retrieved from the miRDB database, 1,043 from TargetScan, and 3,996 from miRWalk, resulting in 122 candidate miRNAs by intersecting the outputs of all three databases. Among these, 11 candidate miRNAs (e.g., hsa-miR-6766-5p, hsa-miR-1237-5p, hsa-miR-3692-3p) were predicted for BSG, and 111 key miRNAs (e.g., hsa-miR-6511b-5p, hsa-miR-921, hsa-miR-1251-3p) for TRAK1 (Fig. 6B). Captopril, valproic acid, and compound 7646-79-9 were computationally associated with BSG and TRAK1 in drug prediction analysis, but no functional link is confirmed (Fig. 6C).
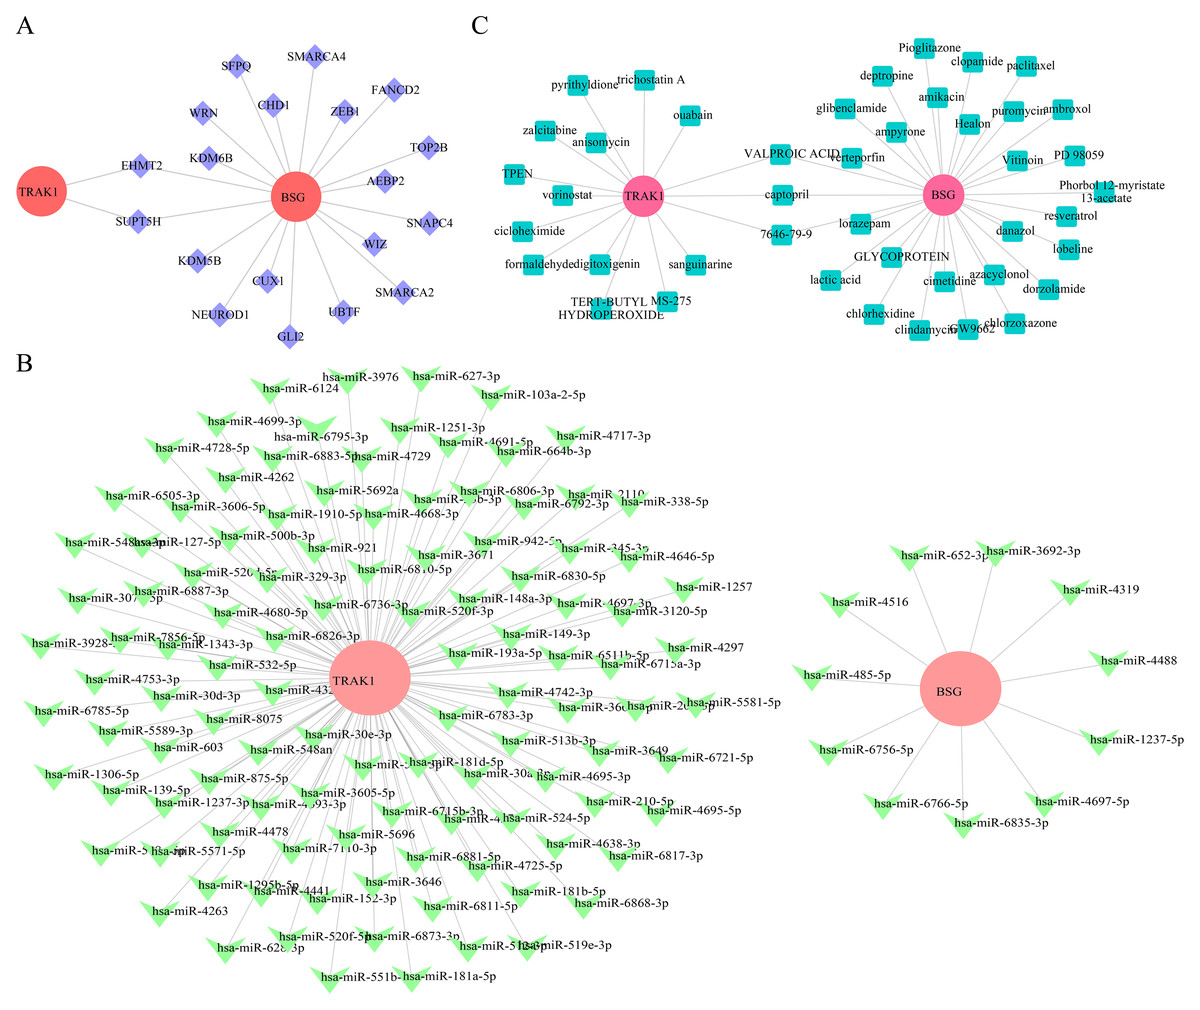
Figure 6: Regulatory network construction and Drug prediction.
(A) TF regulatory network analysis of hub genes. Red is for mRNA; purple: transcription factor TF. (B) miRNA-target interaction network for BSG and TRAK1. Red: mRNA; green is for miRNA. (C) Prediction of potential therapeutic drugs for RPL. Red is for genes, green is for drugs.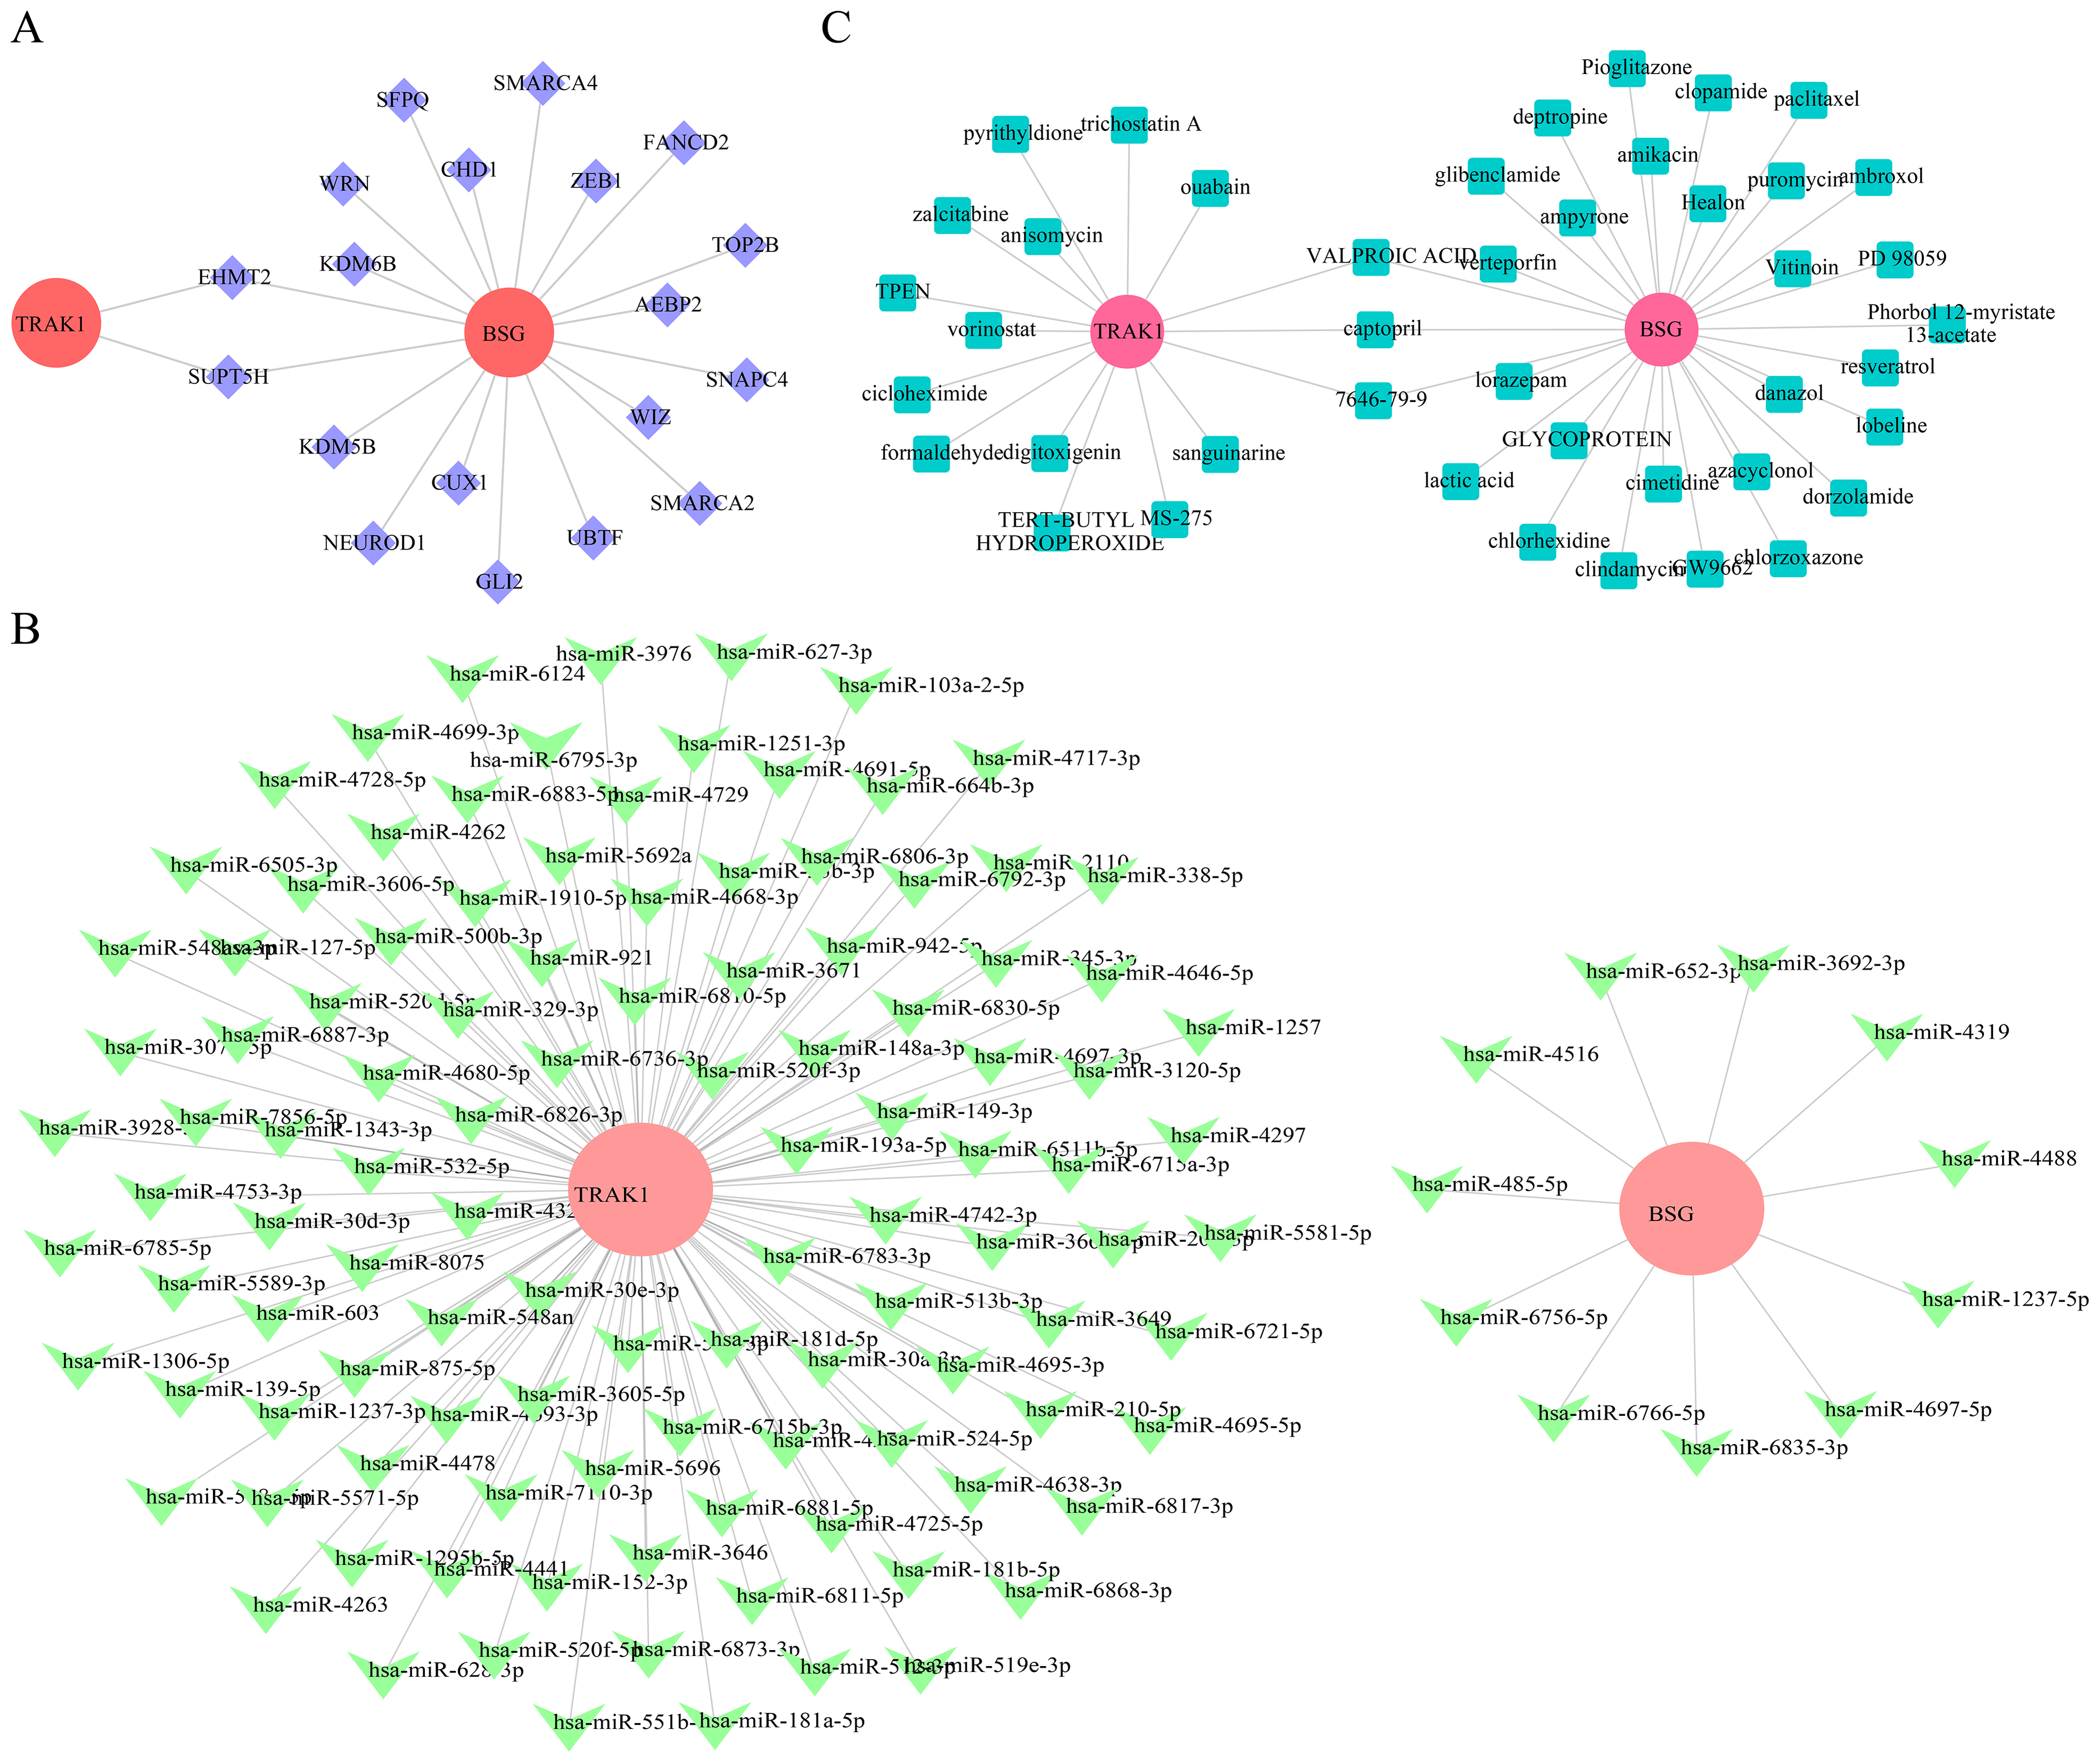
RT-qPCR verification of BSG and TRAK1 expression
RT-qPCR analysis demonstrated a significant increase in BSG expression in the RSA group compared to the control group (p = 0.0010; Fig. 7A). TRAK1 expression showed an increasing trend in the RSA group compared with the control group, though the difference was not statistically significant (p = 0.4415; Fig. 7B).
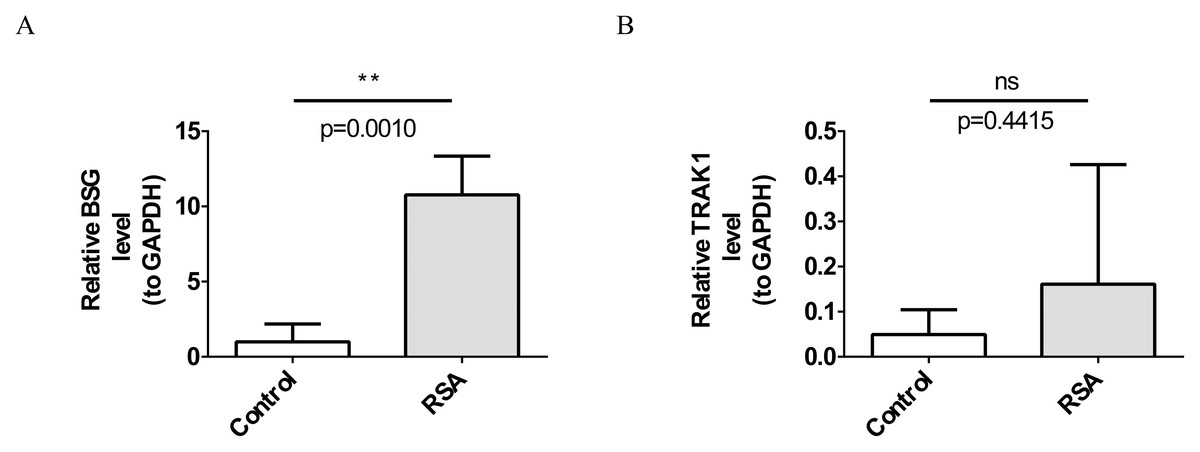
Figure 7: Verification of biomarkers by reverse transcription-quantitative polymerase chain reaction (RT-qPCR) experiments.
(A) Expression levels of BSG. **, p < 0.01. (B) Expression trends of TRAK1. ns indicates p > 0.05.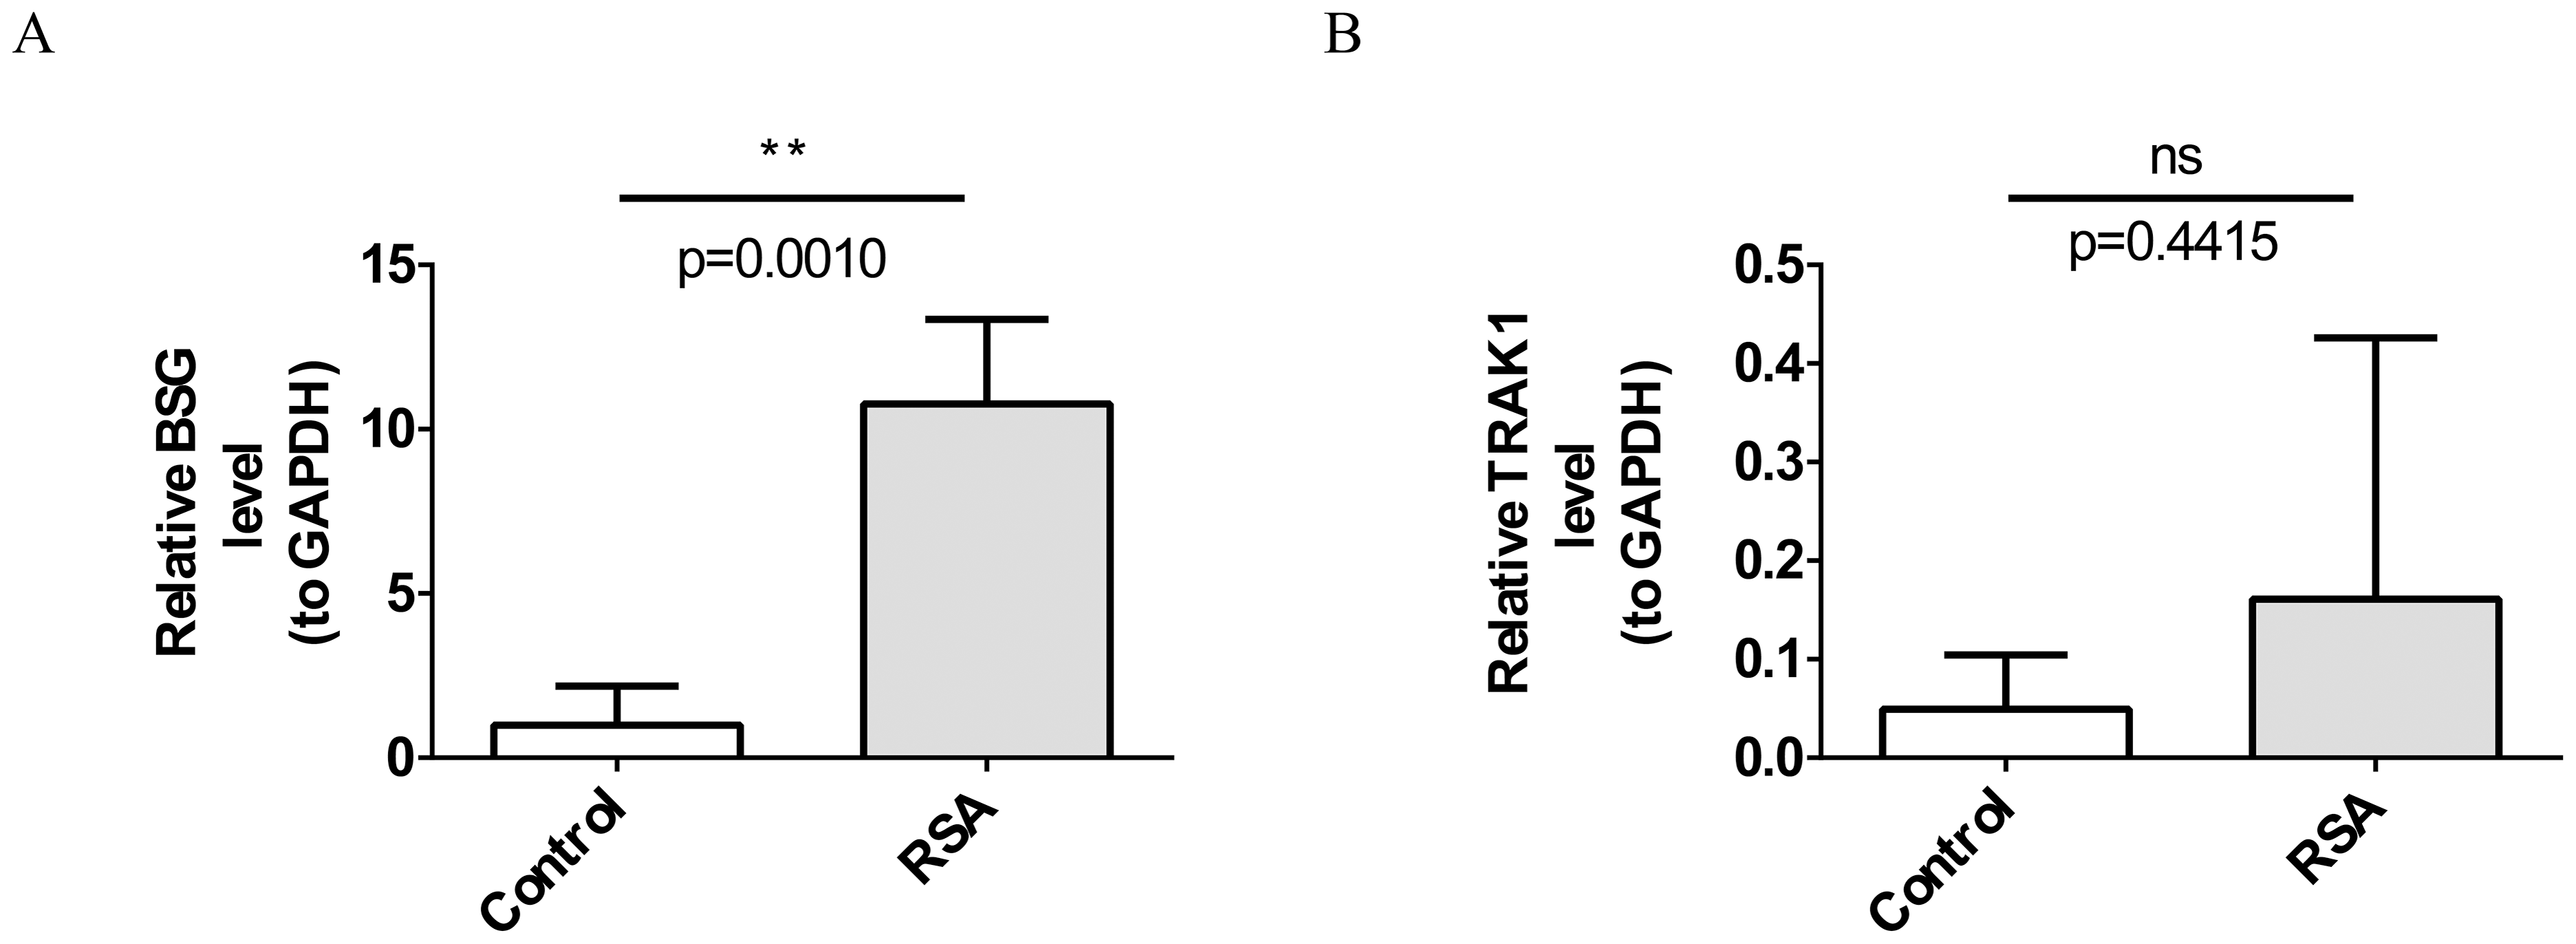
Discussion
RSA is a multifactorial condition primarily associated with dysregulation of maternal-fetal immune tolerance and trophoblast dysfunction (Uţa et al., 2024). Hypoxia and mitochondrial dysfunction have also been implicated in RSA (Chen et al., 2016; Lu et al., 2024), yet the molecular crosstalk linking these factors remains unclear. In this study, we integrated transcriptomic profiling with machine learning approaches to investigate transcriptional features, pathway perturbations, immune microenvironment remodeling, and upstream regulatory factors associated with the hypoxia–mitochondrial–immune axis in RSA. Within this axis, BSG and TRAK1 emerged as potential candidate genes.
By analyzing the GSE165004 dataset, 11 candidate genes—identified through an integrated network combining DEGs, MRGs, and HRGs—were found to be differentially expressed and potentially associated with RSA. GO enrichment analysis suggested that these genes may be involved in cellular responses to hypoxia, consistent with previous studies indicating that impaired mitochondrial adaptation to hypoxia can affect trophoblast invasion in vitro (Anelli, 2015). KEGG pathway analysis revealed significant enrichment in the AGE-RAGE and HIF-1 signaling pathways, both of which have been implicated in oxidative stress and trophoblast injury (Palanissami & Paul, 2018; Rudnicka et al., 2021). Notably, prolonged activation of HIF-1α under pathological hypoxia has been reported to impair oxidative phosphorylation, induce mitochondrial autophagy, and alter the trophoblast metabolism (Xu et al., 2021). These findings highlight the potential importance of hypoxia–mitochondrial interactions in RSA.
Machine learning analyses revealed differential expression patterns of BSG and TRAK1 that may be linked to RSA. BSG, a glycosylated transmembrane protein implicated in embryo implantation (Li & Nowak, 2020), is regulated by HIF-1α, a key factor in cellular hypoxia responses (Zeng et al., 2014). It also influences glycolysis and lactate metabolism via monocarboxylate transporters, potentially affecting mitochondrial bioenergetics and trophoblast function (Kanekura, 2023). GSEA of high BSG expression showed enrichment in pathways related to metal ion homeostasis, including copper detoxification and intracellular zinc regulation, disruptions of which have been associated with early pregnancy complications such as RSA (Asgari et al., 2023; Peng, Liu & Qian, 2025). Additionally, pathways involving protein tyrosine-threonine phosphatase activity and phenylalanine metabolism were enriched, consistent with previous reports linking altered phosphorylation signaling and phenylalanine metabolism to RSA (Chen et al., 2023; Latifimehr et al., 2021), though BSG’s direct involvement remains to be confirmed. The glycosaminoglycan (GAG) biosynthetic pathway was also enriched in samples with higher BSG expression; given GAGs’ roles in cell proliferation and apoptosis (Ricard-Blum et al., 2024), this may suggest potential cellular mechanisms relevant to RSA, pending further validation. Conversely, low BSG expression was associated with enrichment in pathways related to genomic stability, such as DNA replication and mismatch repair, which are important given the role of chromosomal instability in miscarriage (Melo et al., 2023). Overall, these preliminary findings suggest possible links between BSG expression and biological processes relevant to RSA, but additional studies are needed to clarify these relationships.
TRAK1 is known to be involved in mitochondrial transport, fusion, and division—processes vital for mitochondrial function (Lee, Chin & Li, 2018). While its role in RSA is not yet clear, mitochondrial dysfunction is a recognized contributor to RSA pathophysiology (Zhou et al., 2022). Our GO and KEGG enrichment analyses of TRAK1-associated gene expression profiles revealed involvement in pathways related to ion transmembrane transport and oxalate transport, aligning with recent studies on ion homeostasis in RSA (Luthfi et al., 2024). Additionally, enrichment in neuronal differentiation and cocaine behavioral response pathways suggests a potential, though indirect, link to pregnancy maintenance via neuroplasticity mechanisms, consistent with evidence of neuroendocrine axis involvement in RSA (Chemerinski et al., 2022). TRAK1 expression also showed enrichment in steroid, unsaturated fatty acid, and linoleic acid metabolism pathways previously associated with RSA (Wei et al., 2023). Furthermore, TRAK1 has been linked to immunomodulatory pathways, including NK cell cytotoxicity and dendritic cell apoptosis, both relevant to implantation and RSA development (Saito, 2024; Zhang & Wei, 2021). Together, these preliminary findings suggest that TRAK1 may be connected to RSA through multiple biological pathways related to metabolism, neuroendocrine signaling, and immune regulation, though further research is needed to clarify any causal relationships.
Immune infiltration analysis revealed a positive correlation between BSG expression and resting memory CD4+ T cells. Given that glycosylation of trophoblast antigens can inhibit activation of B cells and CD4+ T cells—a key mechanism in maternal-fetal immune tolerance (Rizzuto et al., 2022)—the highly glycosylated nature of BSG suggests it may influence immunoregulatory functions, though direct evidence specific to RSA is lacking.
Additionally, TRAK1 expression showed negative correlations with M2 macrophages, CD8+ T cells, and γδ T cells, and positive correlations with resting memory CD4+ T cells and Tregs. These immune cells contribute to pregnancy immune tolerance and gestational homeostasis, but their imbalance has been linked to maternal immune rejection and increased RSA risk (Manchorova et al., 2022; Saito, 2024). Our findings suggest a potential association between TRAK1 expression and immune modulation in RSA. Further research is needed to clarify whether and how TRAK1 relates to immune cell metabolism—particularly in Tregs, CD8+ T cells, and M2 macrophages—in the context of RSA.
Network analysis identified EHMT2 and SUPT5H as upstream transcriptional regulators of BSG and TRAK1. EHMT2, regulated by HIF-1α-mediated mechanisms (Bobyleva et al., 2024), is involved in histone methylation, a process critical for early embryonic development (Liao et al., 2017). SUPT5H, which plays a crucial role in adapting to hypoxic environments (Zhao et al., 2025), facilitates transcriptional elongation during fertilization and early development (Abe, Schauer & Torres-Padilla, 2022). Additionally, 122 key miRNAs targeting BSG and TRAK1 were identified, with 11 miRNAs targeting BSG and 111 miRNAs targeting TRAK1, suggesting a possible broader regulatory network involving TRAK1 in RSA. These findings indicate that epigenetic regulation, possibly mediated by EHMT2 and SUPT5H, may be involved in the hypoxia-mitochondrial axis related to RSA, though further investigation is needed to clarify these relationships.
Bioinformatics-based drug prediction analyses identified potential associations between captopril, valproic acid, cobalt chloride, and the BSG and TRAK1 genes in RSA. However, these associations are preliminary and require experimental validation to confirm their relevance to RSA pathophysiology. Captopril, an angiotensin-converting enzyme inhibitor with anti-inflammatory and antioxidant effects (Boskabadi et al., 2018), may help reduce oxidative stress and inflammation linked to RSA, but its use in pregnancy is limited due to potential fetal toxicity (Hansell & Palm, 2015). Future studies could investigate safer renin-angiotensin system modulators. Valproic acid, a histone deacetylase inhibitor, influences gene expression by altering DNA methylation (Guidotti & Grayson, 2014). Since DNA hypomethylation supports trophoblast proliferation and invasion in early pregnancy (Zhao, Wong & Stevenson, 2021), valproic acid’s epigenetic effects might be relevant to RSA development. Cobalt chloride mimics hypoxia by activating HIF-1α, scavenging reactive oxygen species, and inhibiting ferroptosis, thereby protecting cells from damage (Jin et al., 2013; Li et al., 2024). Despite this, concerns about its long-term neurotoxicity and cardiotoxicity (Catalani et al., 2012; Oyagbemi et al., 2019) remain. Future research should focus on safer HIF stabilizers with improved pharmacokinetics to explore their potential in RSA therapy.
This study applied an integrated approach combining transcriptomic data and machine learning methods to investigate hypoxia-mitochondria-immune interactions in RSA. Using LASSO and SVM-RFE algorithms alongside transcriptomic analysis, we developed a framework to identify candidate genes, aiming to address some limitations of traditional small-sample studies. Experimental validation of their upregulation supports the reliability of our observations, while drug prediction analyses provide preliminary clues for potential therapeutic exploration. Together, this approach lays groundwork for further research exploring the molecular mechanisms underlying RSA and their clinical relevance.
Despite these strengths, several methodological and interpretive limitations should be noted. First, while BSG was significantly differentially expressed, TRAK1 did not reach statistical significance (p = 0.4415), likely due to insufficient sample size (n = 5 per group)—a factor that reduces statistical power. This warrants cautious interpretation of TRAK1’s role, though the observed upregulation trend suggests potential biological relevance requiring validation in larger cohorts. Second, the bioinformatics approach, particularly GSEA, identifies associations rather than causality. While BSG and TRAK1 are implicated in pathways relevant to RSA (e.g., hypoxia response, immune regulation), their causal contributions remain speculative and necessitate mechanistic validation (e.g., in vitro/in vivo models). Third, drug prediction analyses, though hypothesis-generating, rely on computational modeling and do not account for clinical variables (e.g., pharmacokinetics, off-target effects). These predictions require experimental confirmation and preclinical safety assessment before translational consideration.
Future directions should prioritize expanding sample sizes, integrating single-cell RNA sequencing data to characterize cell-type-specific expression patterns, and validating protein-level changes via immunohistochemistry or mass spectrometry. Additionally, functional studies (e.g., gene knockdown/overexpression) are critical to establish causality, while pharmacologic validation of predicted compounds will inform therapeutic potential. These steps will address current limitations and strengthen the translational relevance of our findings.
Conclusion
BSG and TRAK1 were identified as hypoxia- and mitochondria-related genes associated with RSA, showing links to hypoxia and mitochondrial dysfunction, though the nature of these associations (whether causal or consequential) remains to be clarified, and their specific functional roles in RSA still require further investigation. These findings offer new perspectives on RSA. Importantly, BSG and TRAK1 represent promising candidates for future mechanistic and clinical studies, particularly regarding potential diagnostic and therapeutic applications, once their functional significance is validated.
Supplemental Information
Specific information related to the background gene set (c5.go.v2023.2.Hs.symbols.gmt)
Specific information related to the background gene set (c2.cp.kegg.v2023.1.Hs.symbols.gmt)
RNA concentrations of endometria tissue samples used for RT-qPCR
Primer information for RT-qPCR analysis: accession numbers, sequences, and intron/exon locations
Melting and amplification curves
(A) BSG. (B) TRAK1. (C) GAPDH1. (D) GAPDH2.
Machine learning screens for key genes
(A) LASSO regression for signature genes. Left : Lasso coefficient spectrum. The horizontal axis is the logarithm of lambda, and the vertical axis is the coefficient of variables. Each line represents a gene; Right: Ten-fold cross-validation of adjusted parameters in LASSO analysis. The horizontal axis is the logarithm of lambda, and the vertical axis is the model error. (B) SVM-RFE for signature genes. The horizontal axis is the number of characteristic genes, and the vertical axis is the prediction accuracy of the model.