
Single-cell RNA-seq reveals breast cancer heterogeneity and identifies TCP1 as a therapeutic target in breast cancer
- Published
- Accepted
- Received
- Academic Editor
- Vladimir Uversky
- Subject Areas
- Biochemistry, Bioinformatics, Cell Biology, Genomics, Oncology
- Keywords
- Single-cell RNA-seq, Breast cancer, Heterogeneity, TCP1
- Copyright
- © 2025 Wu et al.
- Licence
- This is an open access article distributed under the terms of the Creative Commons Attribution License, which permits using, remixing, and building upon the work non-commercially, as long as it is properly attributed. For attribution, the original author(s), title, publication source (PeerJ) and either DOI or URL of the article must be cited.
- Cite this article
- 2025. Single-cell RNA-seq reveals breast cancer heterogeneity and identifies TCP1 as a therapeutic target in breast cancer. PeerJ 13:e20451 https://doi.org/10.7717/peerj.20451
Abstract
Breast cancer is composed of diverse cell populations, and this intratumoral heterogeneity profoundly affects clinical behavior. Here, we leveraged single cell RNA sequencing (scRNA-seq) of 68 breast cancer specimens to dissect tumor heterogeneity at high resolution. Unsupervised clustering identified all major cell types of the tumor microenvironment (TME)—including malignant epithelial cells, fibroblasts, T cells, macrophages, endothelial cells, and others—with striking variability in their proportions across molecular subtypes. For example, a BRCA1-mutant triple-negative breast cancer (TNBC) sample showed dense immune infiltration, whereas an estrogen receptor (ER)-positive tumor was mostly epithelial, consistent with known subtype differences in immunogenicity. We applied inference of copy number variations (inferCNV) to distinguish malignant epithelial cells, identifying ~90,000 tumor cells with significant copy-number aberrations enriched for cancer hallmark pathways. Re-clustering of these malignant cells revealed five discrete subpopulations. Notably, a KRT17-positive subcluster displayed the highest stemness score and a distinctive ETS-family transcription factor (ERG) regulon, suggesting a stem-like phenotype. Using The Cancer Genome Atlas (TCGA) cohort, we found that genes upregulated in this KRT17+ subpopulation, particularly NFKBIA, PDLIM4, and TCP1 stratified patient survival. An 8-gene risk signature derived from the KRT17 program segregated patients into high- and low-risk groups with markedly different outcomes. High-risk tumors were characterized by an immunosuppressive TME enriched in M2-like macrophages, whereas low-risk tumors more often harbored lymphocyte-predominant infiltrates. Focusing on TCP1, a chaperonin subunit upregulated in high-risk tumors, we demonstrate that TCP1 knockdown in breast cancer cell lines substantially impairs cell migration (~50% reduction in wound closure) and invasion (P < 0.01). These findings reveal functionally distinct malignant cell states within breast cancer and identify TCP1 as a promising therapeutic target to disrupt aggressive, stem-like tumor cell programs, ultimately guiding more personalized treatment strategies.
Introduction
Breast cancer (BC) is the most commonly diagnosed malignancy in women, characterized by multiple molecular subtypes most notably hormone receptor (HR)-positive, HER2-enriched, and triple-negative breast cancer (TNBC) (Siegel et al., 2025). These subtypes exhibit marked cellular and molecular heterogeneity, which profoundly affects therapeutic responses and overall clinical outcomes (Obidiro, Battogtokh & Akala, 2023). Current treatment strategies include chemotherapy, endocrine therapy, targeted agents, and, more recently, immunotherapies such as immune checkpoint inhibitors (Dvir, Giordano & Leone, 2024; Leon-Ferre & Goetz, 2023). However, treatment options for TNBC remain comparatively limited, with suboptimal efficacy partly attributable to the complex tumor microenvironment (TME) (Harris et al., 2024). Consequently, a more comprehensive understanding of BC heterogeneity and TME dynamics is vital for identifying novel therapeutic targets and improving patient outcomes.
Single-cell RNA sequencing (scRNA-seq) has substantially advanced our capacity to dissect intratumoral complexity (Tietscher et al., 2023). Unlike conventional bulk RNA sequencing, single-cell methods enable the precise identification of individual cell populations, including rare or transitional states, thereby uncovering critical features of tumor progression and therapeutic resistance. This high-resolution approach is particularly valuable for BC, given its pronounced intra- and intertumoral heterogeneity, which directly influences disease aggressiveness and treatment outcomes. Several scRNA-seq-based studies have already illuminated various aspects of BC biology—for instance, clarifying immune cell infiltration patterns and detailing subtype-specific transcriptional programs (Gao et al., 2024; Jackson et al., 2020; Ren et al., 2021; Wu et al., 2021a). However, most of these investigations have focused on a limited range of molecular subtypes or immune-related features, and few have provided a comprehensive, multi-aspect view of both malignant and stromal compartments within the TME.
In this study, we leveraged publicly available scRNA-seq datasets from BC patients to dissect malignant epithelial populations and their surrounding TME. Through integrative analyses including inferCNV, we pinpointed distinct malignant subpopulations characterized by specific genomic and transcriptomic profiles, notably involving P53 disruption, KRAS signaling, hypoxia, and elevated glycolysis. Subclustering further revealed a KRT17+ subset with stem-like traits, suggesting a pivotal role in tumor progression and recurrence. By applying Cox and LASSO regressions, as well as Random Survival Forest (RSF) modeling, to The Cancer Genome Atlas Breast Invasive Carcinoma (TCGA-BRCA) cohort, we identified three key prognostic markers (NFKBIA, PDLIM4, and TCP1), and validated TCP1 functionally in vitro, where its knockdown diminished migratory and invasive capabilities of BC cells. Collectively, these results underscore TCP1’s potential as a therapeutic target and demonstrate how single-cell transcriptomics can refine prognostic evaluation and guide novel treatment strategies in BC.
Materials and Methods
Data collection and preprocessing
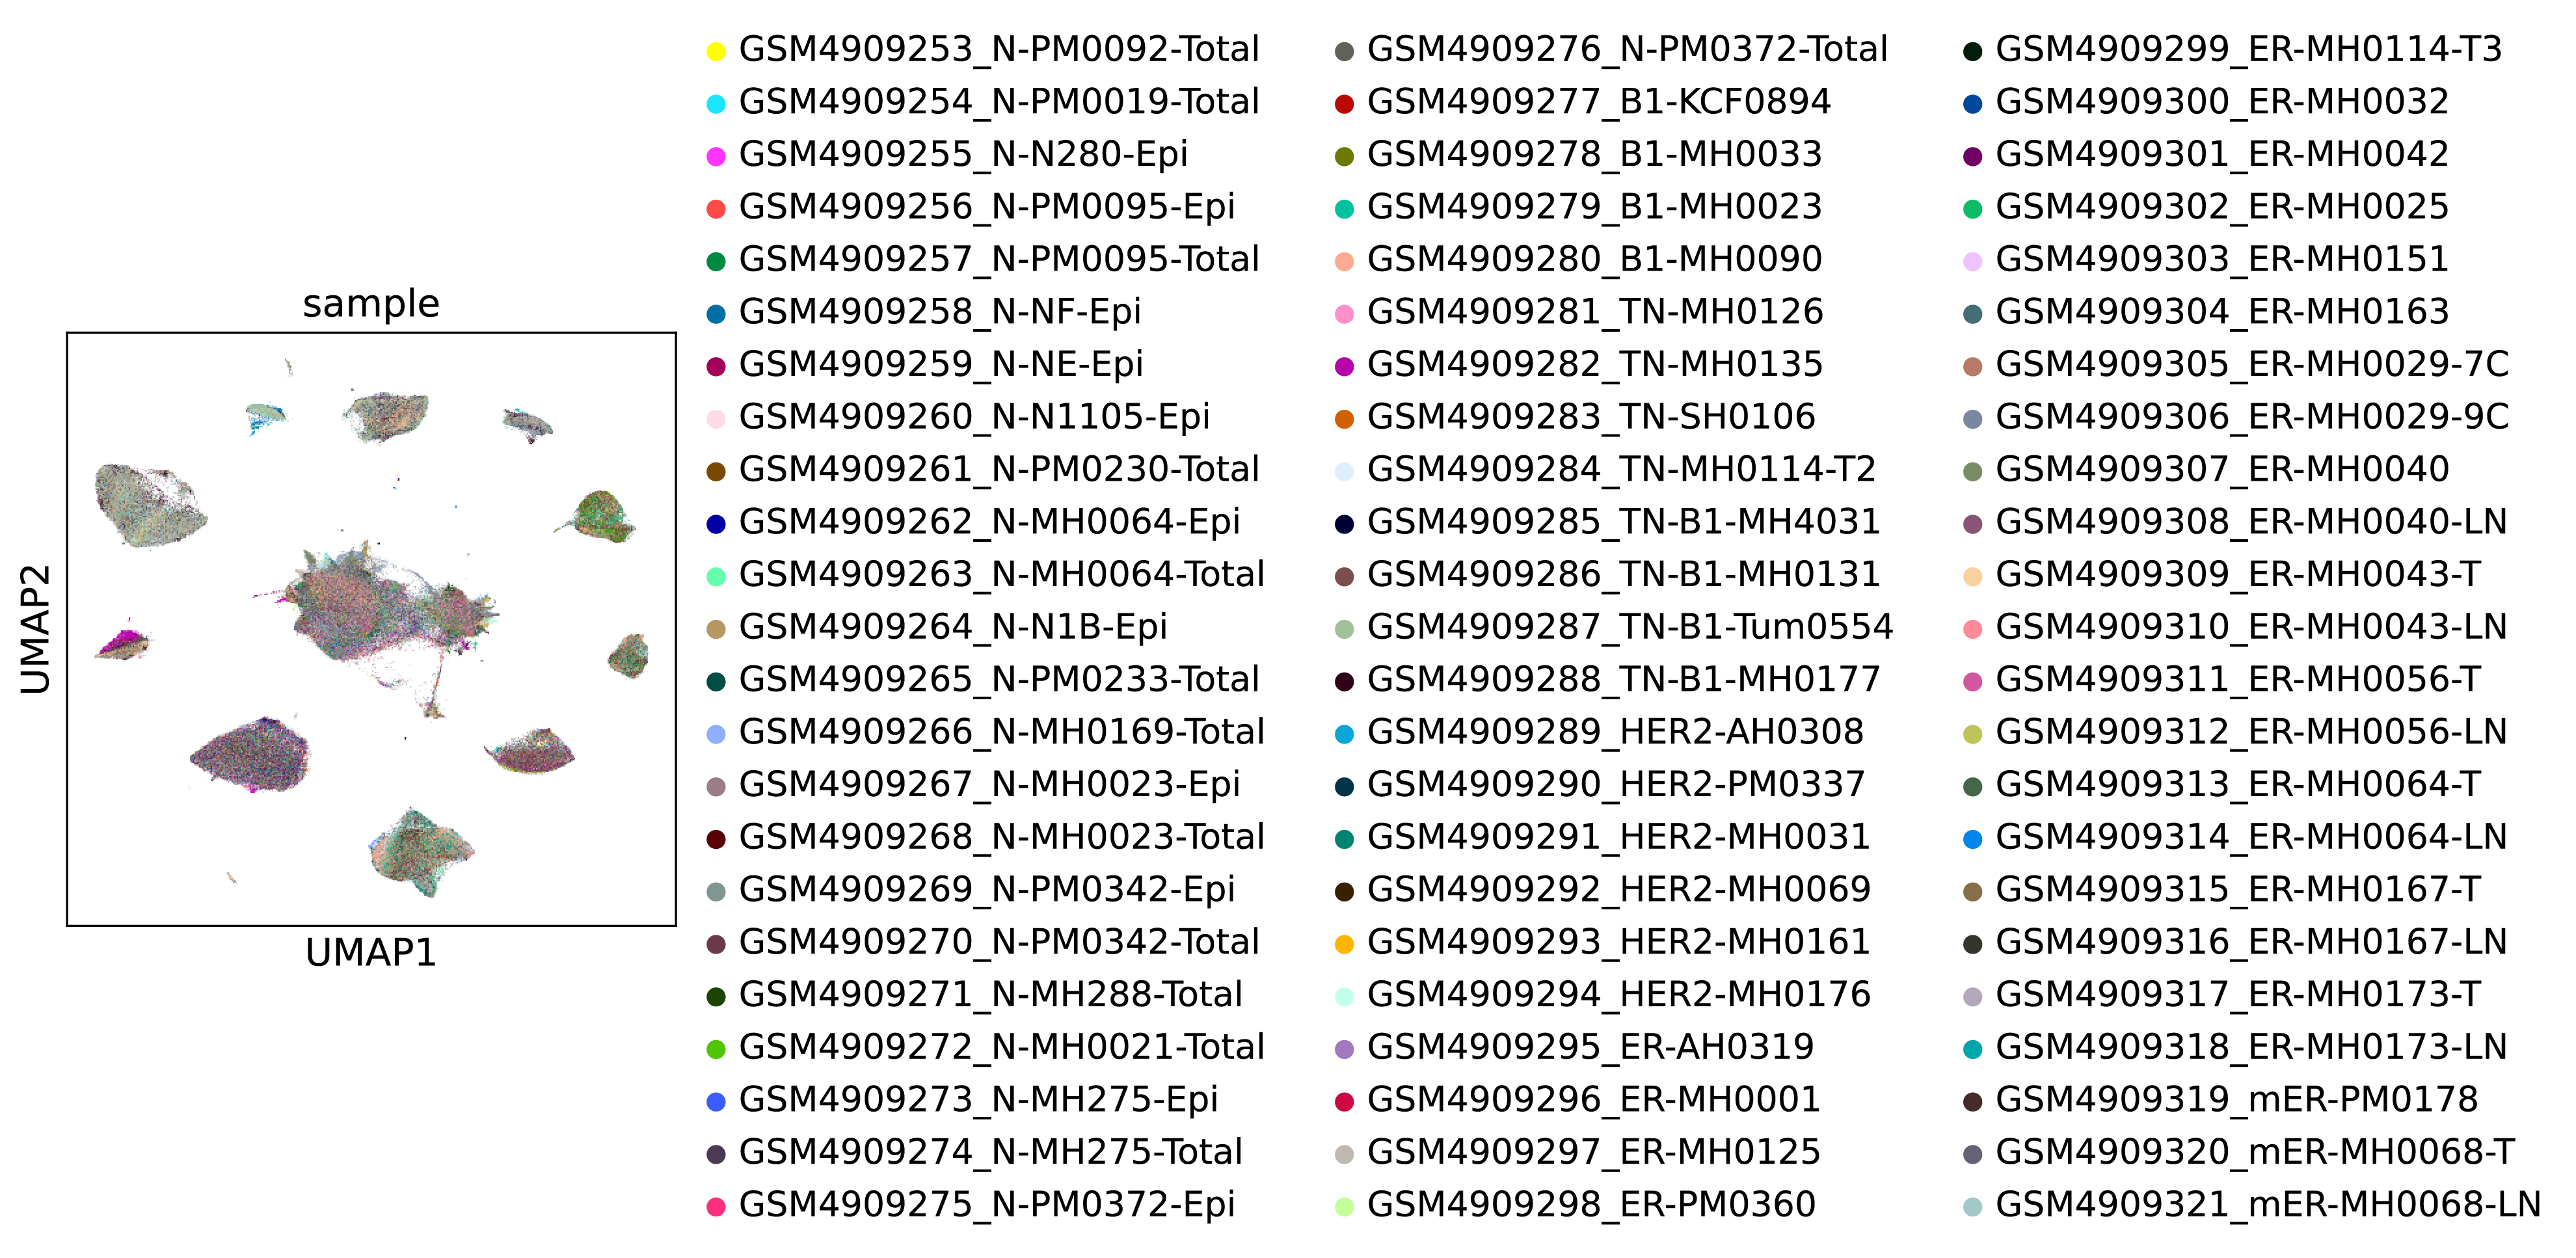
We assembled discovery and validation cohorts integrating single-cell and bulk transcriptomic data from public repositories. The primary single-cell RNA-seq (scRNA-seq) dataset (GSE161529; 68 patient-derived samples; accessed June 26, 2024) was downloaded from the Gene Expression Omnibus (GEO). Downstream analyses were performed in Scanpy v1.9.1 (Wolf, Angerer & Theis, 2018). Putative doublets were identified per sample using Scrublet with default parameters and removed prior to integration (Wolock, Lopez & Klein, 2019). Cells classified as putative doublets were entirely removed from subsequent analyses, thereby minimizing potential artifacts in downstream clustering and differential expression steps.
For bulk-level analyses with clinical outcomes, RNA-seq and phenotype data for primary breast carcinoma were obtained from TCGA-BRCA (accessed May 23, 2024). We excluded non-primary tumors and samples with incomplete clinical annotation, normal samples were curated following established guidelines to correct potential mislabels (Peran et al., 2018). Expression matrices were processed in R using limma v3.52 for normalization and differential expression (Ritchie et al., 2015). For external validation, we analyzed three publicly available GEO microarray datasets: GSE42568 (17 normal, 104 BC), GSE10780 (143 normal, 42 BC), and GSE53752 (25 normal, 51 BC).
scRNA-Seq clustering, visualization and cell annotation
Following QC, counts were normalized with scanpy.pp.normalize_total(target_sum=1e4), log1p-transformed, and the top 2,500 HVGs were selected using scanpy.pp.highly_variable_genes(n_top_genes=2500); PCA was computed on HVGs (40 PCs), patient/technical effects were corrected with Harmony (Korsunsky et al., 2019), Leiden clustering (resolution = 0.1) was run in the Harmony-adjusted PC space (Traag, Waltman & van Eck, 2019), and UMAP was used for visualization; clusters were annotated in two passes literature-derived markers for provisional labels, then sc.tl.rank_genes_groups (Wilcoxon) to define cluster-specific DEGs and refine labels, contextualizing the BC cellular landscape.
InferCNV analysis
To distinguish malignant epithelial cells from non-malignant epithelial cells in the single-cell data, we applied inferCNV (inferCNVpy v0.3.0) analysis. Gene-level read counts were ordered by genomic position, and aggregate copy-number variation (CNV) scores were computed for each cell. Normal B and T lymphocytes served as reference cells with assumed diploid copy number. Epithelial cells with CNV score above the cohort median were classified as putative malignant cells, whereas those below were considered non-malignant. This large-scale genomic aberration criterion segregated virtually all tumor-derived epithelial cells as malignant, consistent with the presence of chromosomal instability in cancer cells. The subset of malignant epithelial cells was then re-clustered with Leiden to resolve intratumoral subpopulations.
GSEA and gene ontology enrichment analysis
GSEA and Gene Ontology term enrichment were performed in R with clusterProfiler (v4.0) to interpret the functional context of the expression profiles (Wu et al., 2021b). For GO, we focused on the Biological Process (BP) category to identify processes and pathways significantly enriched in specific gene sets or clusters of interest. For GSEA, we utilized the Hallmark and KEGG pathway gene sets (obtained from MSigDB) to determine whether predefined sets of genes were significantly enriched among the differentially expressed genes of cell groups (such as malignant vs. non-malignant cells, or high-risk vs. low-risk patient groups in the bulk data). Significance was determined with adjust P < 0.05.
Stemness analysis
We evaluated the differentiation state of tumor subclusters using CytoTRACE2, a computational tool that infers relative developmental potential from gene expression data (Kang et al., 2024). CytoTRACE assigns higher “stemness” scores to cells with gene expression profiles characteristic of less-differentiated, progenitor-like states.
Transcription factor regulon analysis
We investigated transcription factor (TF) activity patterns in different cell populations using the SCENIC workflow, implemented via pySCENIC v1.1.3 (Aibar et al., 2017). To keep computations tractable, large clusters were down-sampled to 300–500 cells and merged into a representative expression matrix; candidate TF-binding regions were restricted to promoter-proximal elements (±10 kb around the TSS or, where specified, the 500-bp upstream window), and motif enrichment with TF assignment was performed using RcisTarget for human (hg38, RefSeq r80, motif collection).
The SCENIC analysis proceeded in three stages: (1) identifying gene co-expression modules, (2) inferring candidate regulons by motif enrichment (matching co-expression modules with TF-binding motif presence in putative target genes), and (3) scoring regulon activity in each cell to determine cluster-specific regulons. For each cluster, we highlighted the top 10–15 TFs showing the highest activity. We then visualized the regulon activity and constructed putative gene regulatory networks to identify key regulatory differences between clusters.
Construction and validation of a novel prognostic risk model
The top 200 genes of KRT17+ Epi were screened related to the BC of TCGA patients using a univariate Cox analysis (P < 0.05). We built a parsimonious prognostic signature using least absolute shrinkage and selection operator (LASSO) regression to retain genes with non-zero coefficients. For each sample, the risk score was calculated as the sum of coefficient–expression products across the selected genes (Risk score = Σ βi × Expi). Patients were dichotomized at the cohort median into high- and low-risk groups, and prognostic performance was evaluated with Kaplan–Meier survival analysis and receiver operating characteristic (ROC) curves.
Immune infiltration analysis
Bulk expression profiles were transformed to log2(TPM + 1) and deconvolved with CIBERSORT using the LM22 leukocyte signature (1,000 permutations) (Chen et al., 2018).
Random survival forest analysis
The “Randomforestsrc” package was used to perform the random survival forest algorithm for hub gene selection, and the importance of prognosis-related genes was ranked (nrep =1,000, indicating that the number of iterations in the Monte Carlo simulation was 1,000). We identified the genes with relative importance >0.3 as the final characteristic genes.
Cell line culture, TCP1 gene knockdown, and wound healing assay
To investigate the functional role of TCP1 in BC cell migration and invasion, we conducted in vitro experiments in two BC cell lines, BT549 (a TNBC cell line) and MCF7 (a luminal A, estrogen receptor-positive cell line). BT549 cells (Wuhan Procell) were maintained in McCoy’s 5A (Gibco, Waltham, MA, USA) with 10% FBS and 1% penicillin–streptomycin; MCF7 cells (ATCC HTB-22) were grown in DMEM containing 10% FBS, 1% penicillin–streptomycin, and 0.01 mg/mL recombinant human insulin to support this insulin-dependent line. All cultures were incubated at 37 °C in 5% CO₂ and 95% humidity.
For TCP1 gene knockdown, we designed 2 shRNA sequences targeting TCP1 (Gene ID: 6950). The target sequences for the shRNAs were: shTCP1-1: 5′-GCTCTTTACATGATGCACTTT-3′ and shTCP1-2: 5′-GCAAGATCACTTCTTGTTATT-3′. These sequences were cloned into the pLKO.1-TRC vector. Lentivirus was produced by transfecting 293T cells with shRNA constructs and packaging plasmids; 48 h later, filtered supernatants were used to transduce BT549 and MCF7 cells, after which puromycin selection (2 µg/mL) was applied from 48 h post-transduction for 7 days to establish stable TCP1-knockdown lines.
For the wound healing (scratch) assay, control and TCP1-knockdown cells were seeded in 6-well plates and grown to ~95% confluence. Using a sterile 200 µL pipette tip, a straight scratch was gently made across the cell monolayer. Cells were rinsed with phosphate-buffered saline (PBS) to remove debris and then incubated in serum-reduced medium (1% FBS) to minimize proliferation during the assay. Wound closure was monitored by photographing the same scratch area at 0 h and 48 h. The wound width at 48 h relative to 0 h was measured using ImageJ software to quantify cell migratory ability. Each experiment was performed in triplicate wells, and multiple fields per scratch were analyzed.
Cell invasion assay
Cell invasive capacity was evaluated using Transwell invasion chambers (24-well format, 8-μm pore size; Corning Inc., Corning, NY, USA) coated with Matrigel. The Matrigel (Corning, Corning, NY, USA) was diluted 1:8 in cold serum-free medium and 50 µL was added to the top of each insert, followed by incubation at 37 °C for 4 h to allow gelling. After preparing TCP1-knockdown and control cells in single-cell suspension, 1.5 × 10⁵ cells in 200 µL of serum-free medium were seeded into the upper chamber of each Transwell insert. The lower chamber was charged with 600 µL of complete medium supplemented with 15% FBS to serve as a chemoattractant. After a 48-h incubation at 37 °C, residual Matrigel and non-invading cells on the upper surface of the insert were gently wiped away with sterile cotton swabs. Cells that migrated to the underside of the membrane were fixed in 4% paraformaldehyde for 15 min, stained with 0.5% crystal violet for 10 min, and rinsed with water. Five non-overlapping fields per insert were imaged at 200× using an inverted microscope, and crystal-violet–positive cells were enumerated. Each condition was assayed in triplicate.
Statistical analysis
All statistical analyses were performed in R version 4.2.1 (R Core Team, 2022) unless otherwise specified. We utilized Wilcoxon test under the circumstance of non-normal data distribution. Kaplan–Meier curves with log-rank statistics were used to compare OS. P < 0.05 was considered statistically significant.
Results
Identification of distinct cell subpopulations in BC
After quality control procedures, including the removal of doublets and low-quality cells, a total of 20,444 single cells were retained for downstream analysis (Fig. S1 and Table S1). Using unsupervised clustering based on the Leiden algorithm, we identified 13 distinct cell clusters (Fig. 1A). Based on canonical marker genes described in the literature, the identified clusters were annotated into eight major cell types, Epithelial cells (clusters 0, 1, 3, and 8; marker genes: KRT19, TACSTD2), Fibroblasts (clusters 4 and 9; marker genes: DCN, TIMP1), T cells (cluster 2; marker genes: CD3D, CD2), Macrophages (cluster 6; marker genes: TYROBP, LYZ), Endothelial cells (cluster 7; marker genes: TM4SF1, PLVAP), Plasma cells (cluster 10; marker genes: MZB1, CD38), Mast cells (cluster 12; marker genes: TPSAB1, TPSB2), and B cells (cluster 11; marker genes: MS4A1, CD79A) (Figs. 1B and 1E).
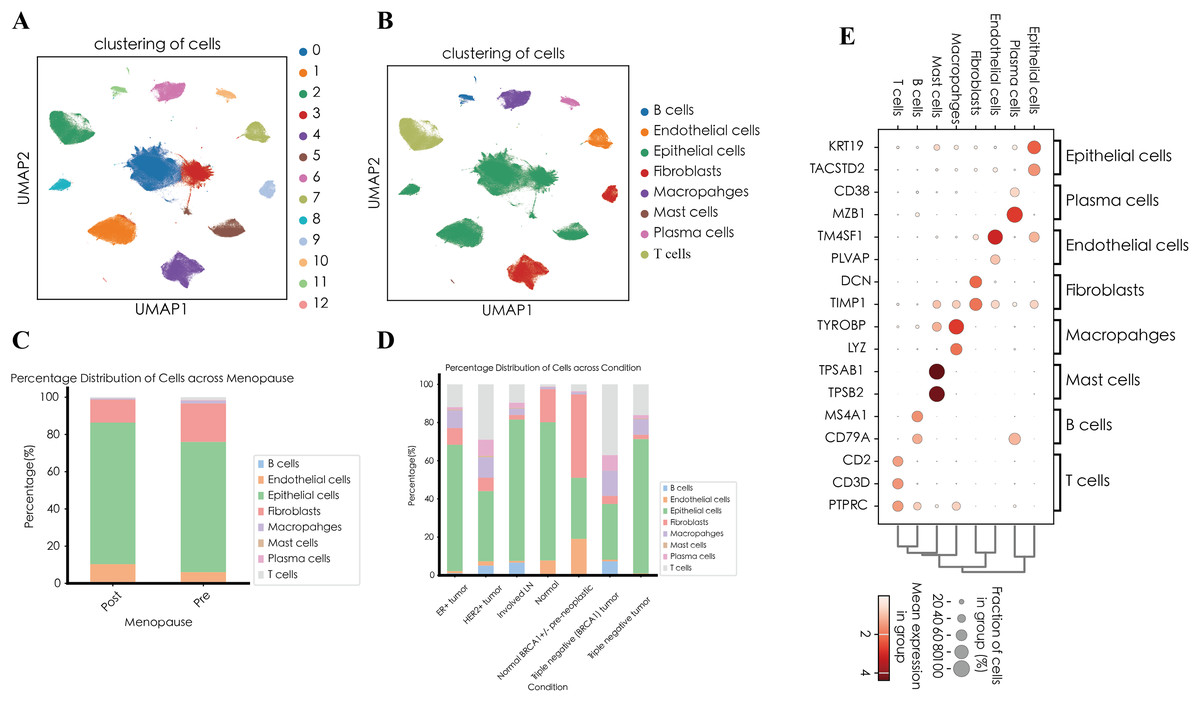
Figure 1: Single-cell landscape of breast cancer.
(A) UMAP visualization of 13 distinct cell clusters identified by unsupervised clustering. (B) UMAP visualization of cell types. (C) Relative abundance of each cell type across different clinical subgroups. (D) Distribution of annotated cell types stratified by menopausal status (pre-menopausal vs. post-menopausal). (E) Dot plot illustrating the expression of representative marker genes across annotated major cell types.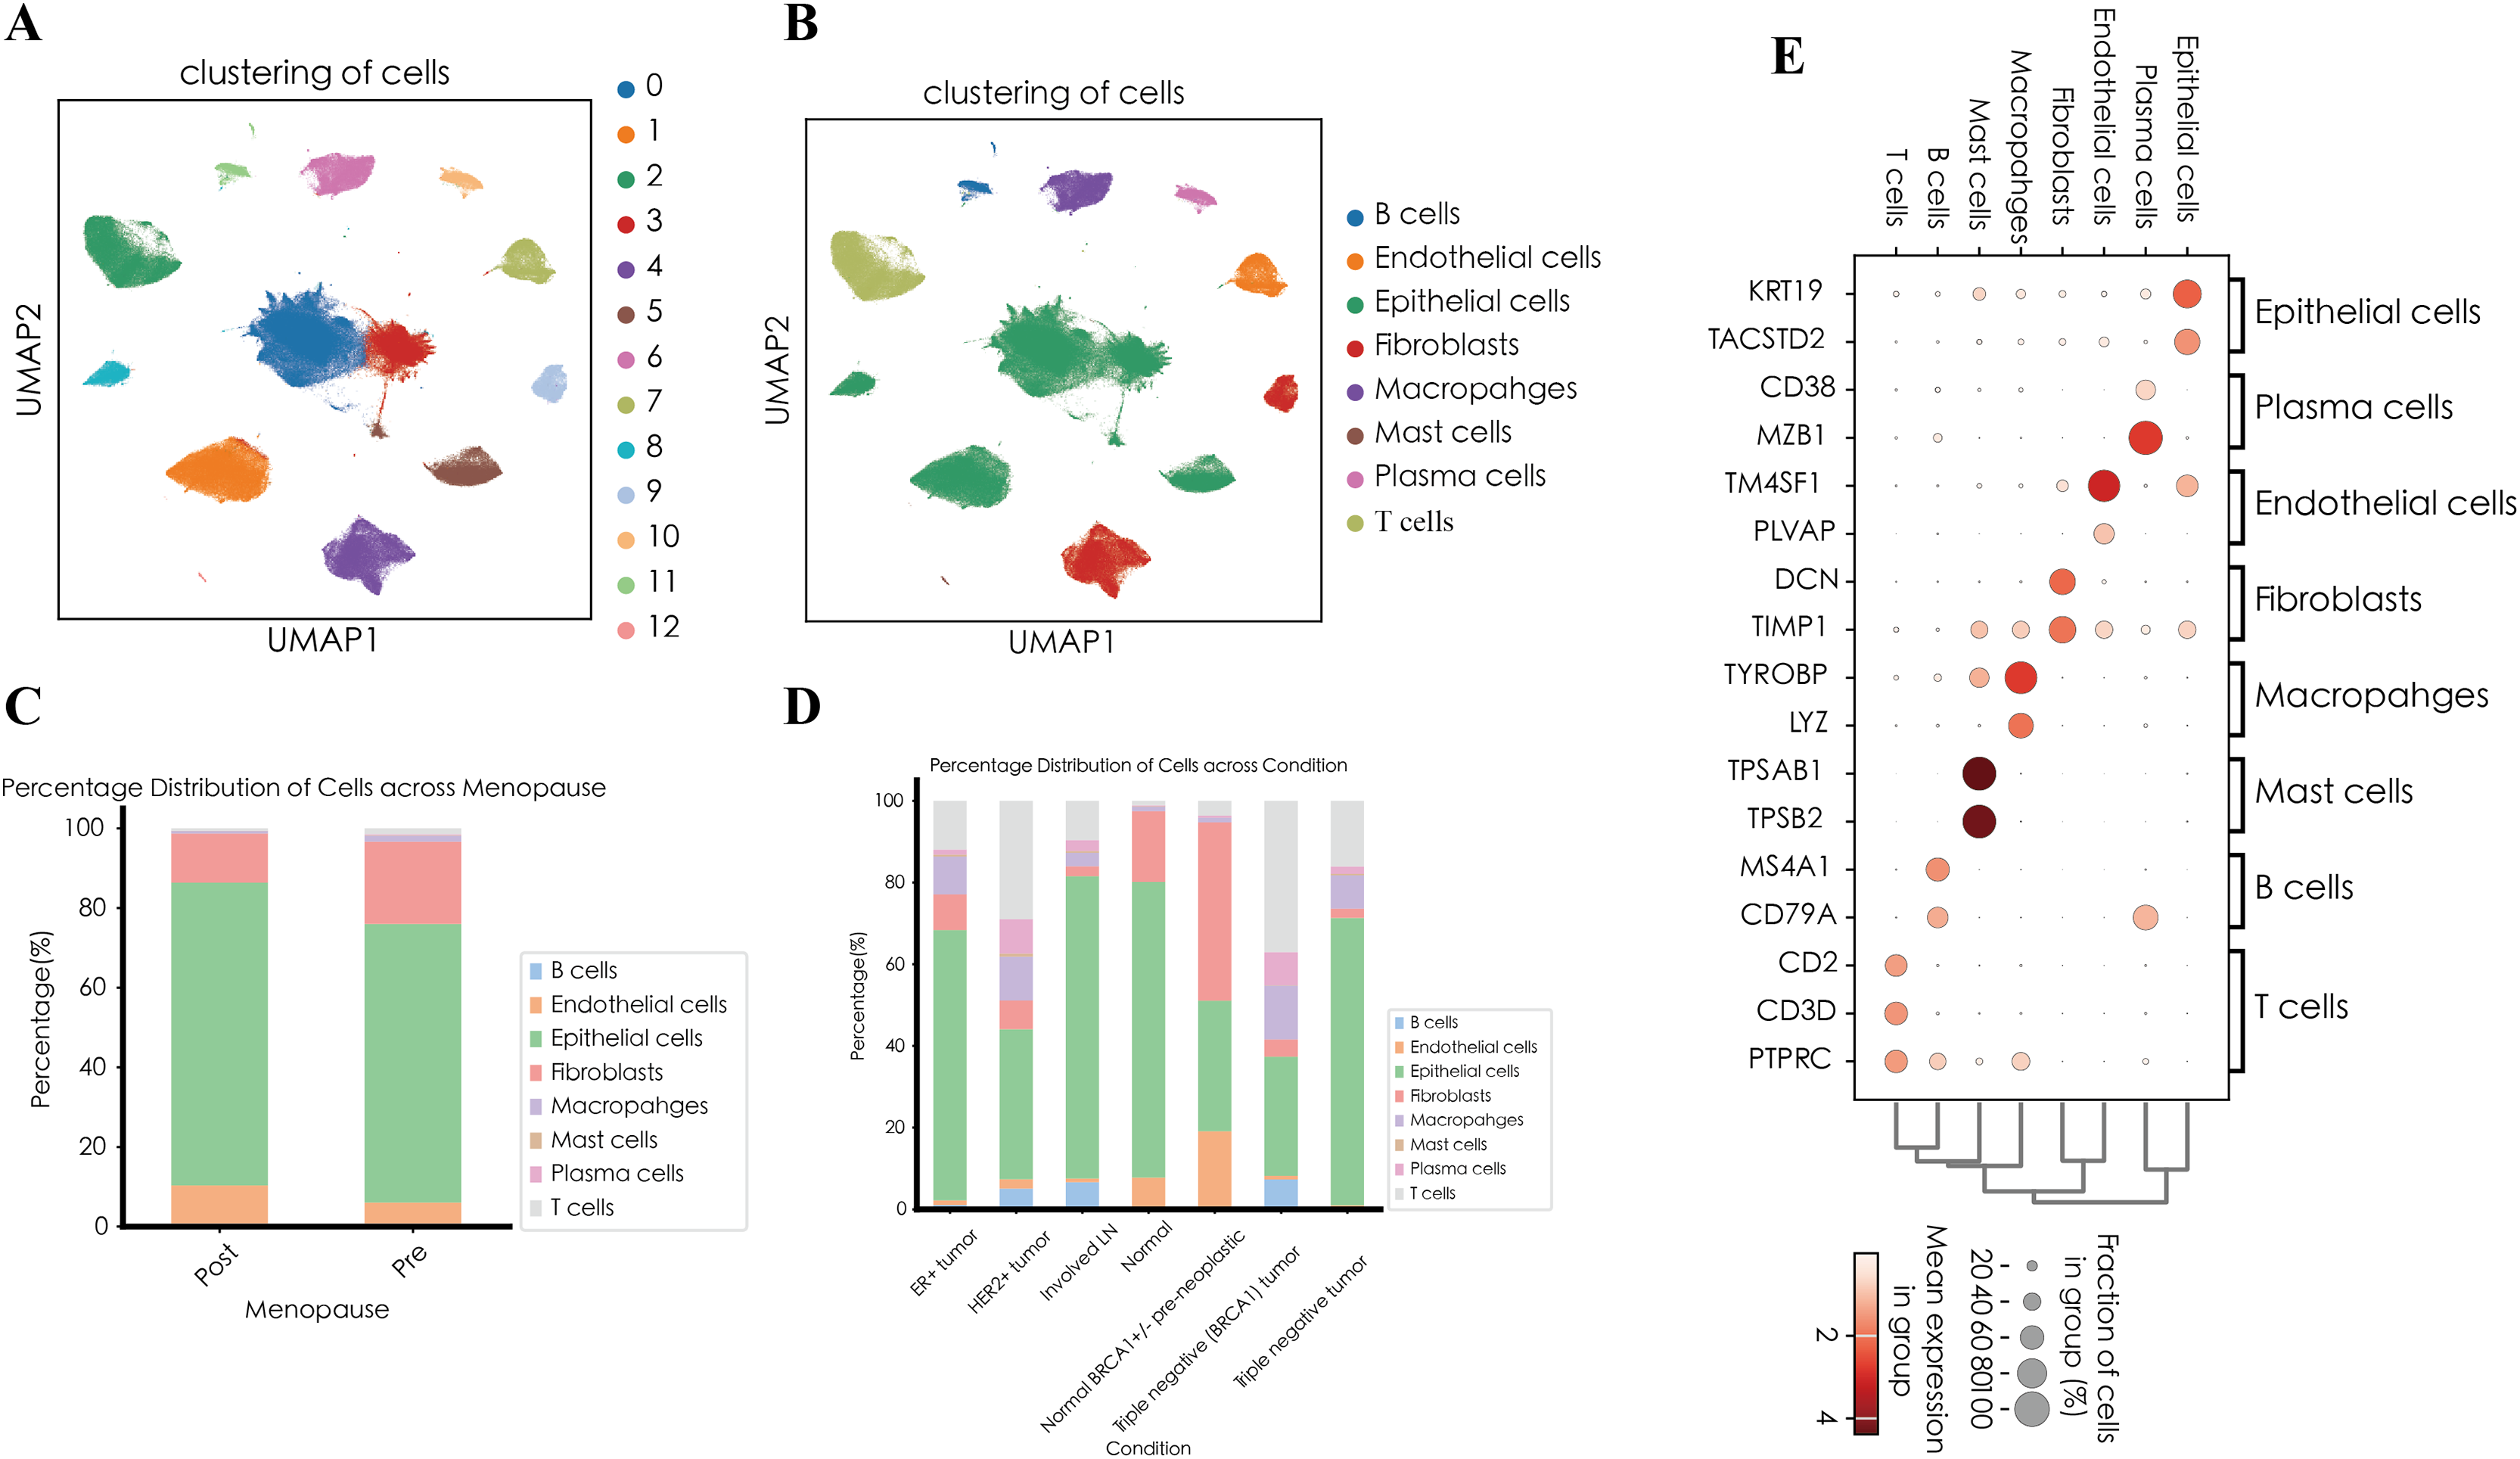
We next compared the relative abundance of these annotated cell types across different clinical conditions (Fig. 1C). Epithelial cells predominated in most samples, accounting for more than 70% of cells in normal breast tissue, involved lymph nodes (Involved LN), and certain TNBC samples. In contrast, fibroblasts were notably enriched (43.63%) in normal BRCA1+/- pre-neoplastic tissue, suggesting a potential relationship between genetic predisposition and early-stage stromal remodeling. The triple-negative (BRCA1) tumor showed pronounced immune infiltration, with T cells constituting 37.03%, macrophages 13.18%, and B cells 7.32%, whereas another TNBC sample remained predominantly epithelial (70.34%). HER2-positive tumors also exhibited considerable T-cell and macrophage infiltration, accompanied by moderate proportions of plasma cells and B cells. In contrast, ER-positive tumors were primarily epithelial (66.14%), with relatively fewer immune cells. Notably, normal breast tissue was mainly composed of epithelial cells (72.39%) and fibroblasts (17.32%), accompanied by minimal immune infiltration. Conversely, the involved lymph node samples contained a high proportion of epithelial cells (74.00%), along with enhanced immune infiltration (B cells, 6.65%; T cells, 9.60%), consistent with lymph node involvement in tumor metastasis.
Further stratification according to menopausal status (post-menopausal and pre-menopausal) revealed distinct cellular compositions (Fig. 1D). Post-menopausal samples showed an increased proportion of epithelial (76.01%) and endothelial (10.33%) cells, accompanied by reduced fractions of fibroblasts and immune cells. In contrast, pre-menopausal samples exhibited higher fibroblast abundance (20.62%) and elevated T cell presence (1.45% and 0.59%), suggesting that fluctuations in estrogen levels might influence stromal remodeling and immune infiltration within the breast tumor microenvironment.
Collectively, our single-cell analysis highlights the considerable heterogeneity of the BC TME across different molecular subtypes and patient backgrounds. We observe not only variation in immune cell infiltration and stromal composition, but also suggestive links between patient factors (like BRCA1 status and menopausal state) and the cellular makeup of tumors. These results provide deeper insight into underlying biological mechanisms and lay the groundwork for exploring how such heterogeneity might influence therapy responses.
Identification of malignant epithelial cells using inferCNV
To evaluate genomic instability at the single-cell level, we performed copy number variation (CNV) analysis using the infercnvpy, utilizing T and B cells as the normal reference (Fig. 2A). A CNV score was calculated for each cell, and based on a threshold of 0.018, we identified 90,496 putative malignant cells and 107,686 non-malignant cells (Fig. 2B). To validate the accuracy of this classification, gene set enrichment analysis (GSEA) was performed on the identified malignant epithelial cells. GSEA revealed significant enrichment of multiple tumor-associated signaling pathways, including the P53 pathway, KRAS signaling DN, hypoxia, glycolysis, apoptosis, and UV response DN. These results suggest that the classified malignant cells harbor distinct molecular characteristics associated with tumorigenesis. Additionally, GO enrichment analysis of BP revealed significant enrichment of pathways associated with positive regulation of translation, pyruvate metabolic process, glycolytic process among malignant epithelial cells, consistent with enhanced cellular metabolism and translational activity frequently observed in tumorigenesis. Collectively, these functional insights further substantiate the malignant characteristics of the identified cellular population.

Figure 2: Malignant cell identification by infercnvpy.
(A) Heatmap of inferred copy number variations across cell types. (B) UMAP highlighting malignant versus non-malignant epithelial cells. (C) GSEA results showing pathways enriched in malignant epithelial cells. (D) GO enrichment (Biological Process) for the top 200 signature genes in malignant epithelial cells.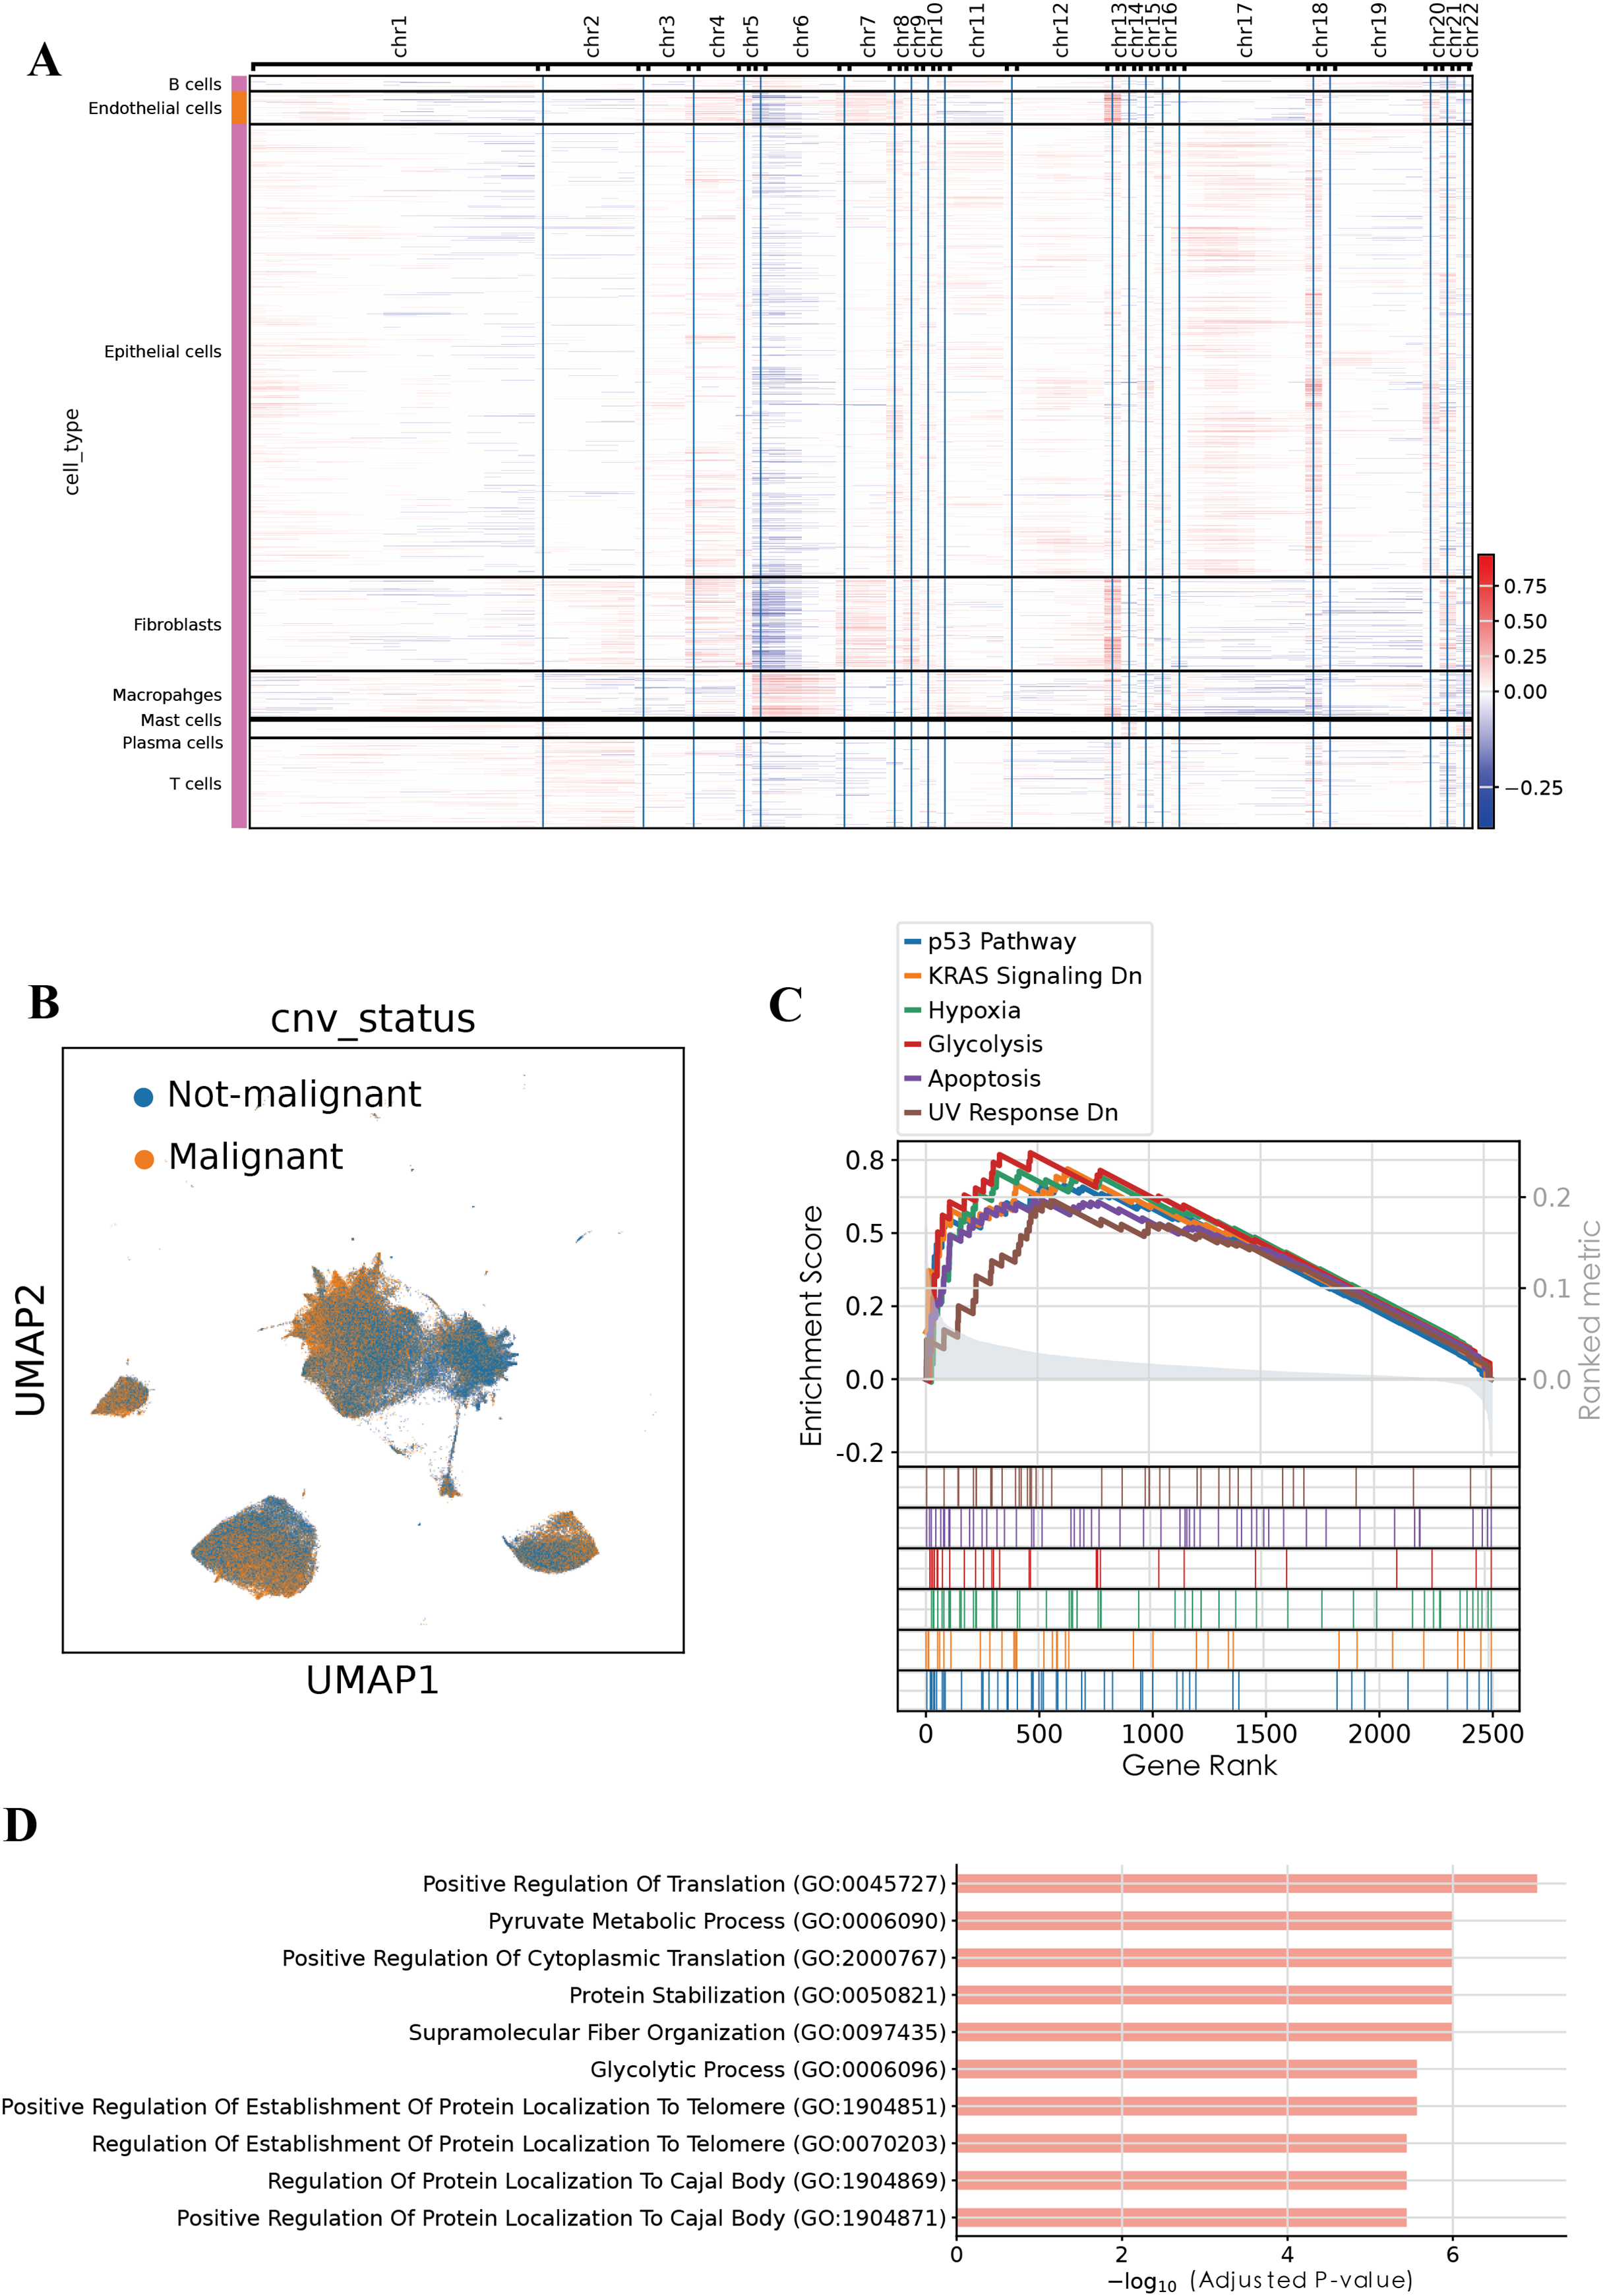
Intratumoral heterogeneity of malignant epithelial cells
To further characterize the intratumoral heterogeneity within the malignant epithelial cell population, we conducted an additional clustering analysis on cells identified by inferCNV. Five distinct subclusters were identified, which we labeled based on their top differentially expressed marker genes, AZGP1+ Epi, HMGB2+ Epi, KRT17+ Epi, MMP7+ Epi, and RPL41+ Epi (Fig. 3A).
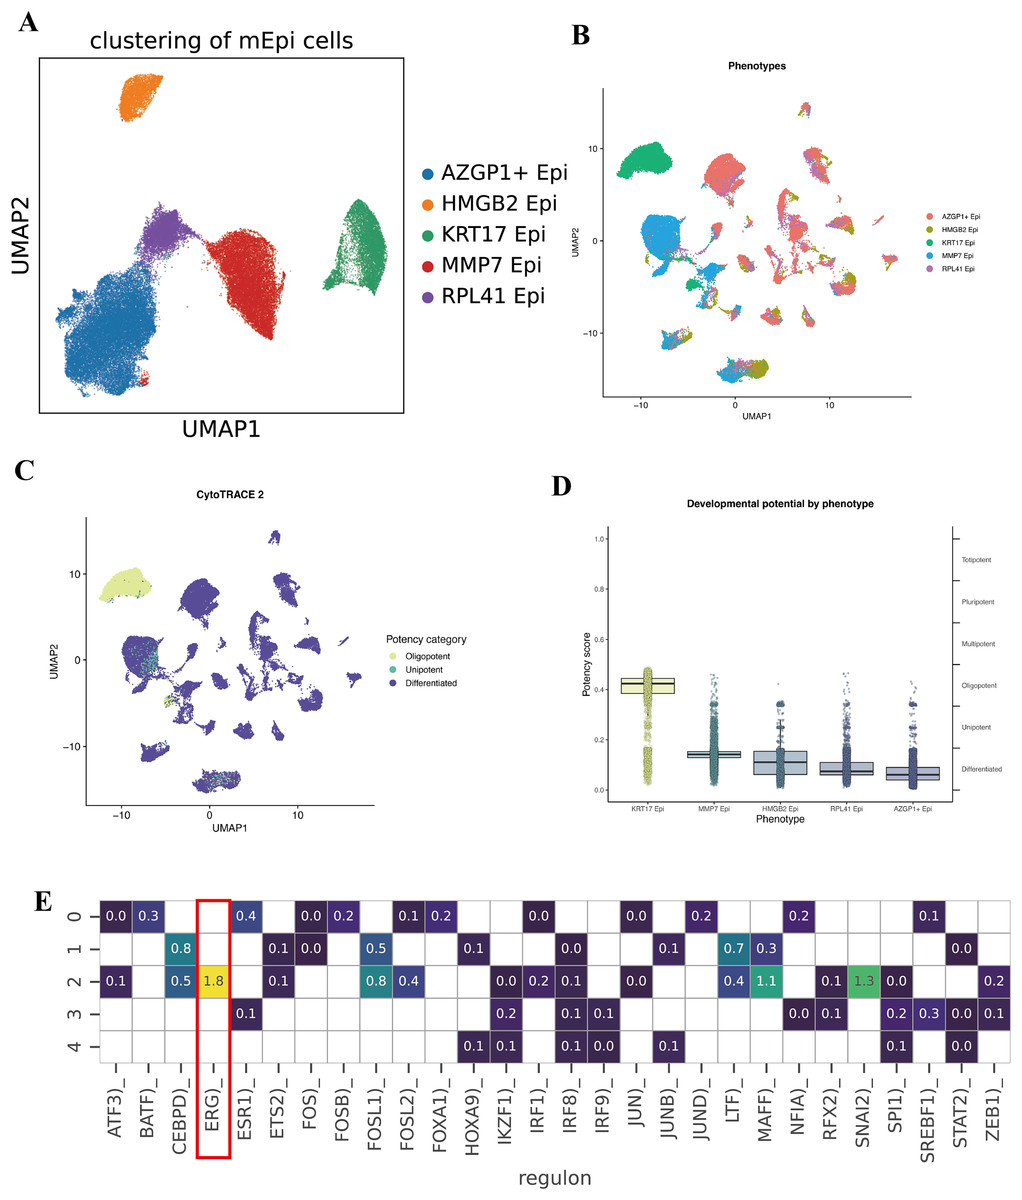
Figure 3: Subcluster analysis of malignant epithelial cells.
(A) UMAP visualization illustrating five distinct malignant epithelial subclusters (AZGP1+ Epi, HMGB2+ Epi, KRT17+ Epi, MMP7+ Epi, and RPL41+ Epi). (B–D) CytoTRACE2 analysis evaluating differentiation potential across malignant epithelial subclusters. (E) Heatmap depicting differential transcription factor activities across the five malignant epithelial subclusters.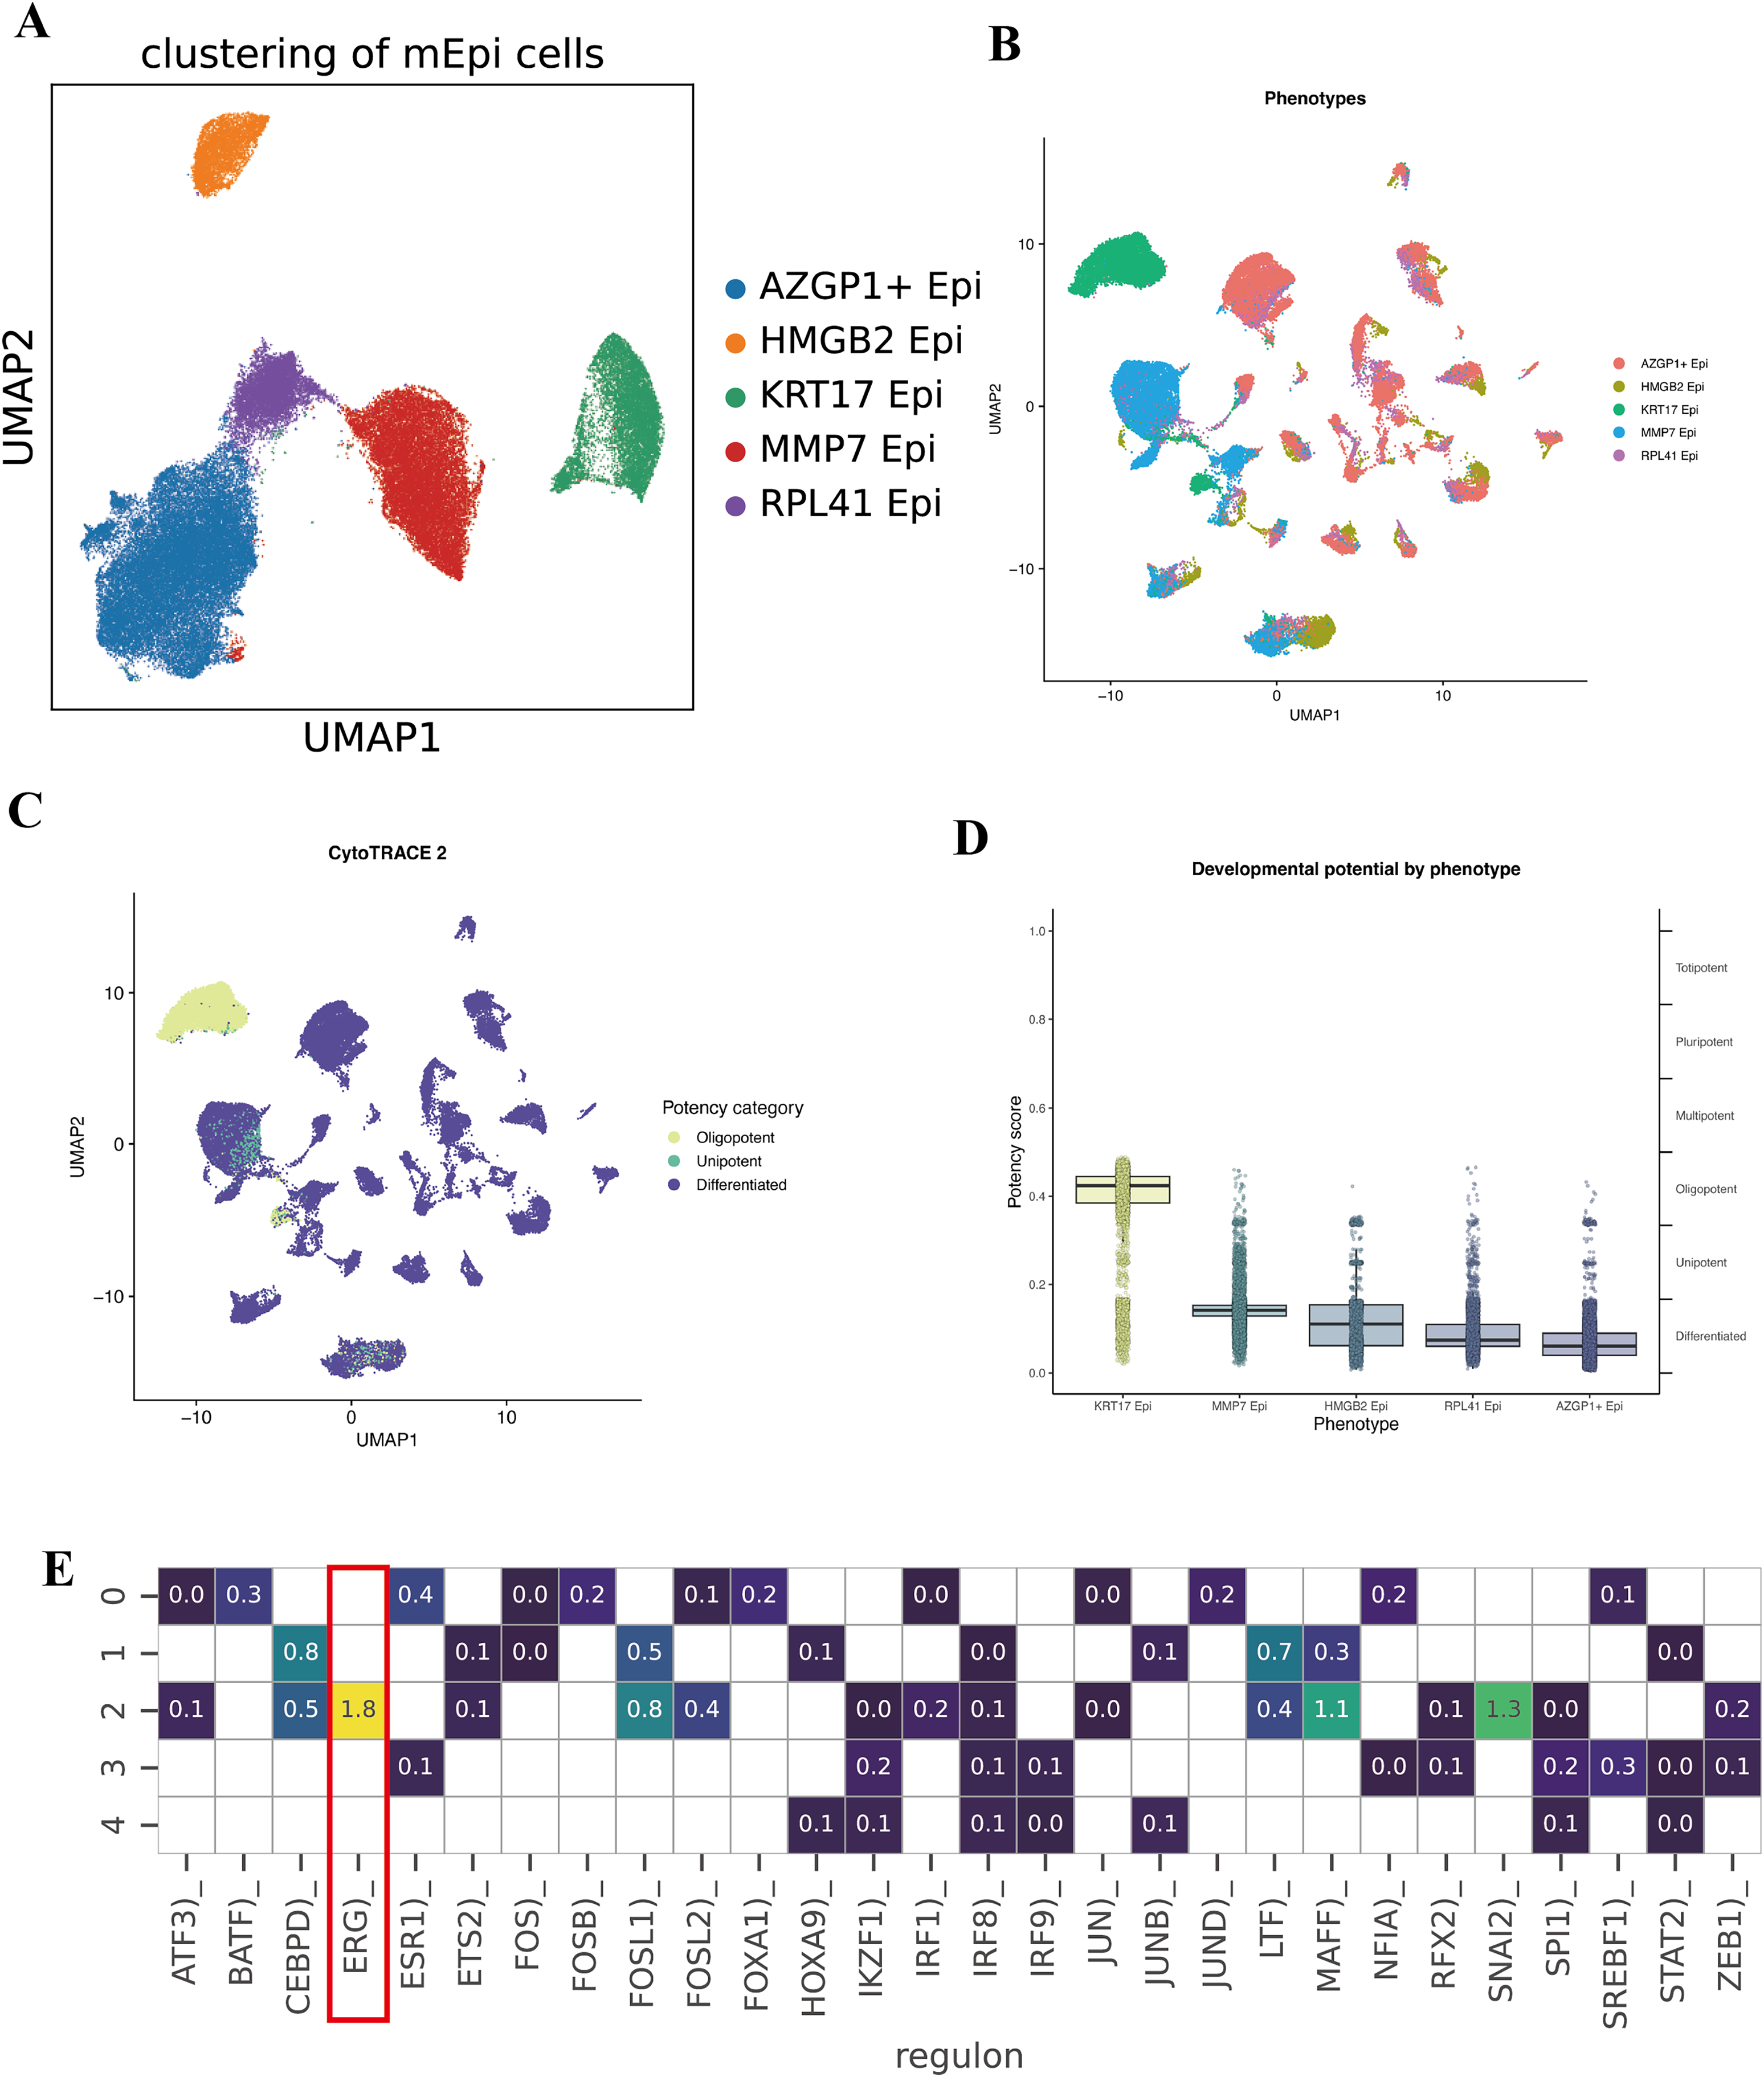
To quantify the developmental or differentiation states of these malignant subpopulations, we applied the CytoTRACE2 algorithm, which infers a “differentiation potential” score for cells (with higher scores often corresponding to more stem-like, less differentiated states). Notably, the KRT17+ Epi subpopulation exhibited the highest predicted differentiation capacity, indicative of a potential stem-like or progenitor-like phenotype within the TME (Figs. 3B, 3C, and 3D). Conversely, the remaining subpopulation showed relatively lower differentiation potential, suggesting a spectrum of differentiation states and specialized functions among malignant epithelial cells. Collectively, these findings highlight the existence of functional diversity and hierarchical organization within the malignant epithelial compartment.
We then sought to understand what transcriptional regulators might be driving the distinct identities of these malignant subpopulations. Using SCENIC to analyze regulon activity, we identified distinct TF enrichment patterns in each subcluster. Notably, the KRT17+ Epi subpopulation showed a strong enrichment and activity of the transcription factor ERG (ETS-related gene) regulon (Figs. 3E and 3F). ERG is an ETS family transcription factor; while better known for its role in prostate cancer, recent studies have implicated ERG in angiogenesis and epithelial-mesenchymal transition in various cancers. Its presence in the KRT17+ cluster’s regulon suggests ERG may be one key regulator defining the state of these stem-like tumor cells. Other subclusters displayed their own top TFs; for example, the AZGP1+ cluster was enriched for XBP1 (a regulator of secretory phenotype and unfolded protein response), and the HMGB2+ cluster showed enrichment of E2F target genes.
These data highlight significant functional heterogeneity among malignant epithelial cells. Within a single tumor, there appear to be cells occupying different niches, some are more stem-like and undifferentiated (KRT17+ Epi), while others are more proliferative (HMGB2+ Epi might correspond to actively cycling cells), others might be more invasive (MMP7+ Epi could indicate an EMT/invasive program), and others have high metabolic or biosynthetic activity (RPL41+ Epi with ribosomal protein upregulation). The KRT17+ subpopulation is particularly intriguing due to its high CytoTRACE score and ERG regulon activity, suggesting it could play an outsized role in tumor aggressiveness, metastasis, or therapy resistance. We posit that this subpopulation may act as a tumor stem cell-like pool, capable of driving tumor growth and surviving treatments.
Prognostic relevance of the KRT17+ epithelial subpopulation
Given the apparent stem-like and aggressive nature of the KRT17+ malignant subcluster, we hypothesized that genes characteristically expressed by this subpopulation might serve as biomarkers of prognosis in BC. We used the top 200 genes most specifically expressed in this cluster and evaluated their prognostic potential using Cox proportional hazards and LASSO regression analyses in the TCGA-BRCA cohort. Eight key prognostic genes (NFKBIA, EIF3J, HSPA9, RTN4, TCP1, PDLIM4, RPL9, and SFN) were ultimately identified (Fig. 4A) and utilized to construct a risk stratification model, dividing patients into high-risk and low-risk groups. Kaplan–Meier survival analysis demonstrated significantly improved overall survival (OS) for patients classified into the low-risk group compared to those in the high-risk group (Fig. 4B, Table S2). Furthermore, time-dependent receiver operating characteristic (ROC) analyses confirmed the robust predictive capacity of the gene signature, yielding area under the curve (AUC) values of 0.82, 0.76, and 0.74 at 1-, 3-, and 5-year follow-up, respectively (Fig. 4C). For external validation, we applied the same coefficients and the TCGA-derived median cut point to the independent GEO cohort GSE42568. Across the full follow-up, the log-rank test did not reach statistical significance (P > 0.05). Notably, the survival curves separated after approximately 3 years, with the low-risk group showing superior OS, thereafter, indicating a delayed risk-separation pattern (Fig. S2, risk table in Table S3).
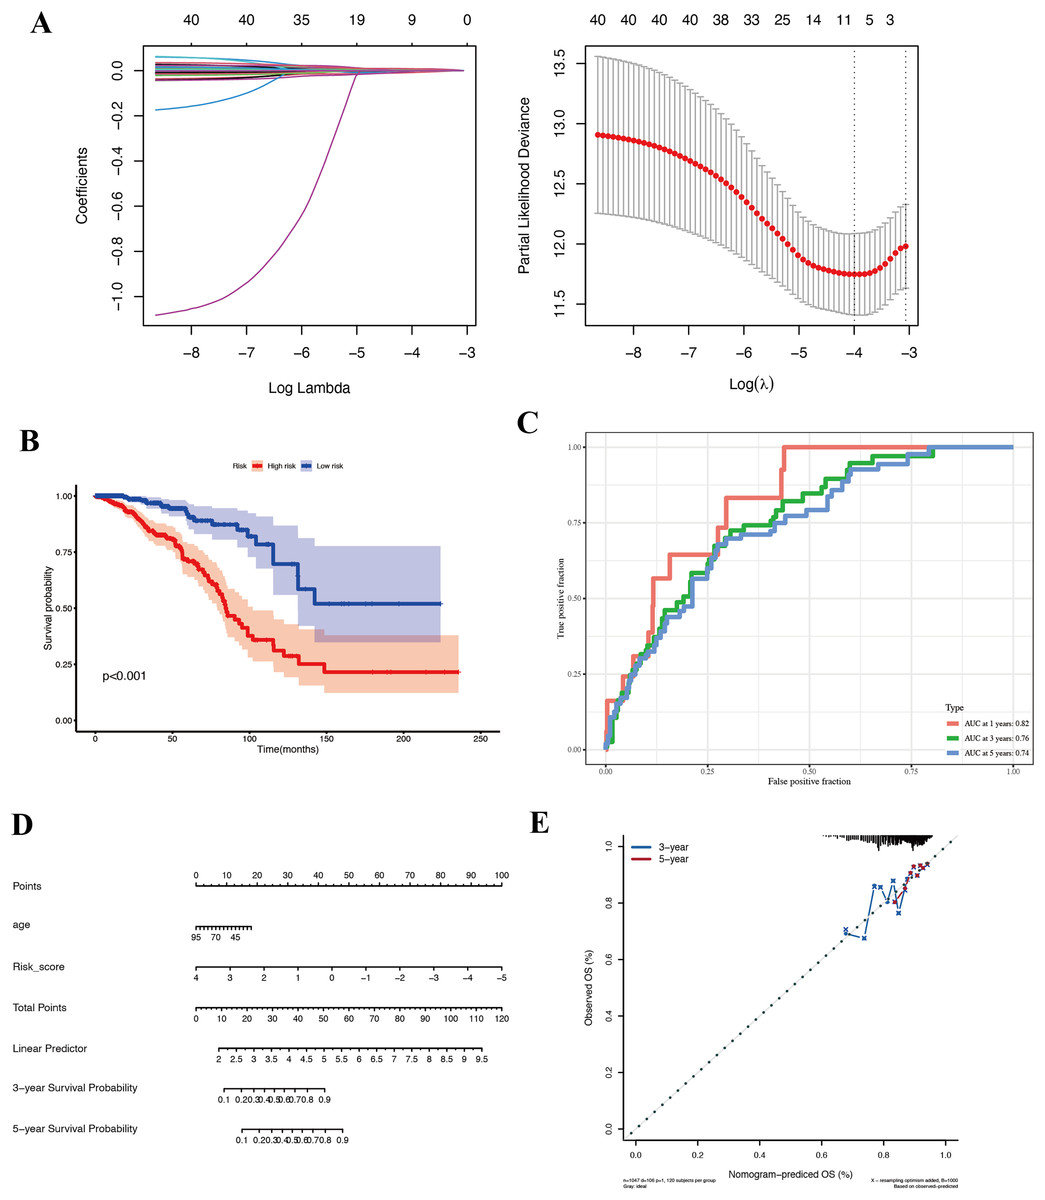
Figure 4: Prognostic analysis in the TCGA-BRCA cohort.
(A) LASSO regression identifying eight core genes. (B) Kaplan–Meier survival curves comparing high-risk and low-risk groups. (C) ROC curves demonstrating prognostic performance at 1, 3, and 5 years. (D) Nomogram integrating risk score and clinical features. (E) Validation plot confirming model robustness.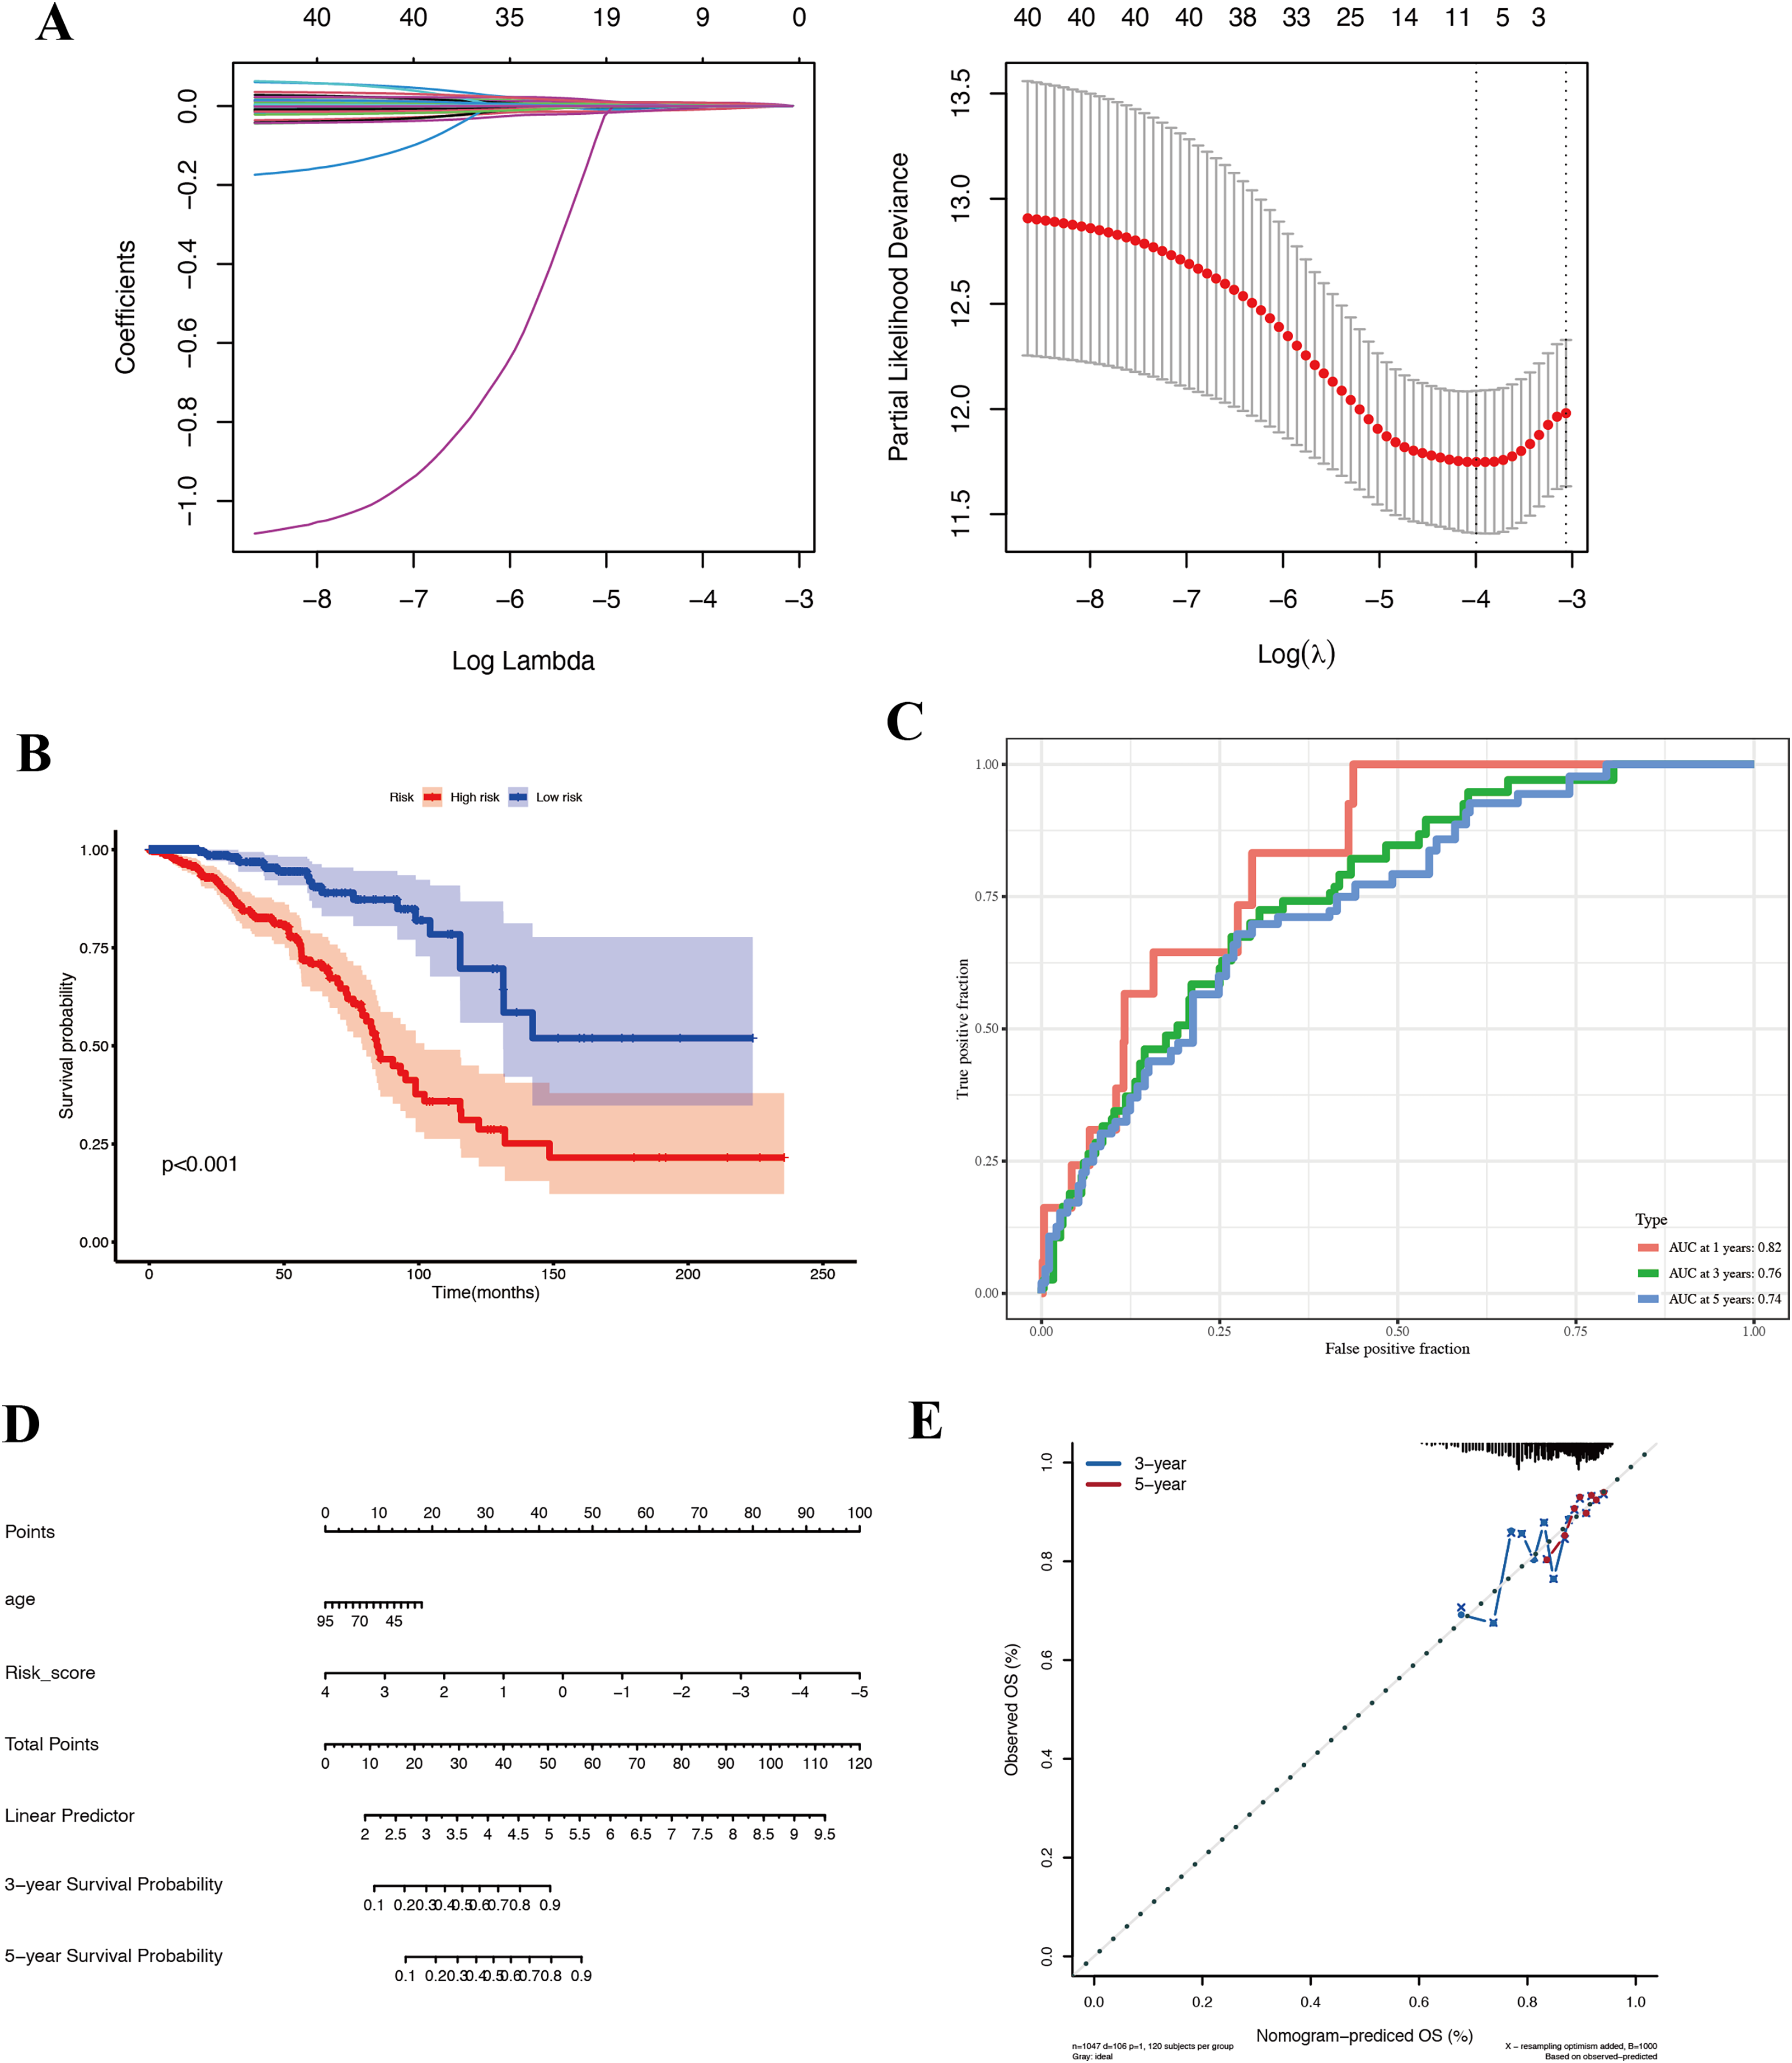
To ensure that the prognostic value of our gene signature was not simply capturing other clinical variables, we performed Cox regression analyses including available clinical factors. In multivariate models, the risk score remained an independent predictor of survival (with a hazard ratio significantly >1 for high-risk vs low-risk, P < 0.01), whereas other factors like age did not retain significance (details not shown in figure). We then built a nomogram that combines the risk score with age to predict 1-, 3-, and 5-year survival probabilities for an individual patient (Fig. 4D). The nomogram allows a clinician to draw a straight line based on a patient’s risk score and age to estimate their survival chance. The calibration plot (Fig. 4E) indicated good agreement between predicted and actual outcomes, particularly for 3-year survival.
In summary, we derived an eight-gene prognostic signature from the KRT17+ malignant cell program that robustly stratifies BC patients by survival risk. This underscores the potential clinical relevance of the biology captured by the KRT17+ subpopulation. It suggests that features of this stem-like subpopulation may drive worse outcomes, and conversely that patients whose tumors have lower expression of these genes fare better. This finding encourages further investigation into these specific genes and pathways, they could be contributing to aggressive disease and might represent targets for therapy or biomarkers for risk stratification.
Molecular and immunological differences between high- and low-risk groups
To gain biological insight into why the High-Risk group had worse outcomes, we compared their molecular and immune profiles to those of Low-Risk tumors in TCGA. Surprisingly, gene expression profiling revealed that High-Risk tumors were enriched in many immune-related pathways. GSEA on Hallmark and KEGG gene sets showed High-Risk tumors upregulate pathways such as inflammatory response, IL6/JAK-STAT3 signaling, complement, TNFα via NF-κB, and interferon gamma response (Hallmarks), as well as B-cell receptor signaling, chemokine signaling, and T-cell receptor signaling (KEGG) (Figs. 5A and 5B). At first glance, this suggests High-Risk tumors might be “immune hot” or inflamed. For instance, genes involved in chemokine-mediated signaling and lymphocyte migration were more expressed in High-Risk tumors, pointing to active crosstalk between tumor and immune cells. Paradoxically, one might expect immune-active tumors to have better outcomes due to immune surveillance. This prompted a closer look at the nature of the immune context in these tumors.
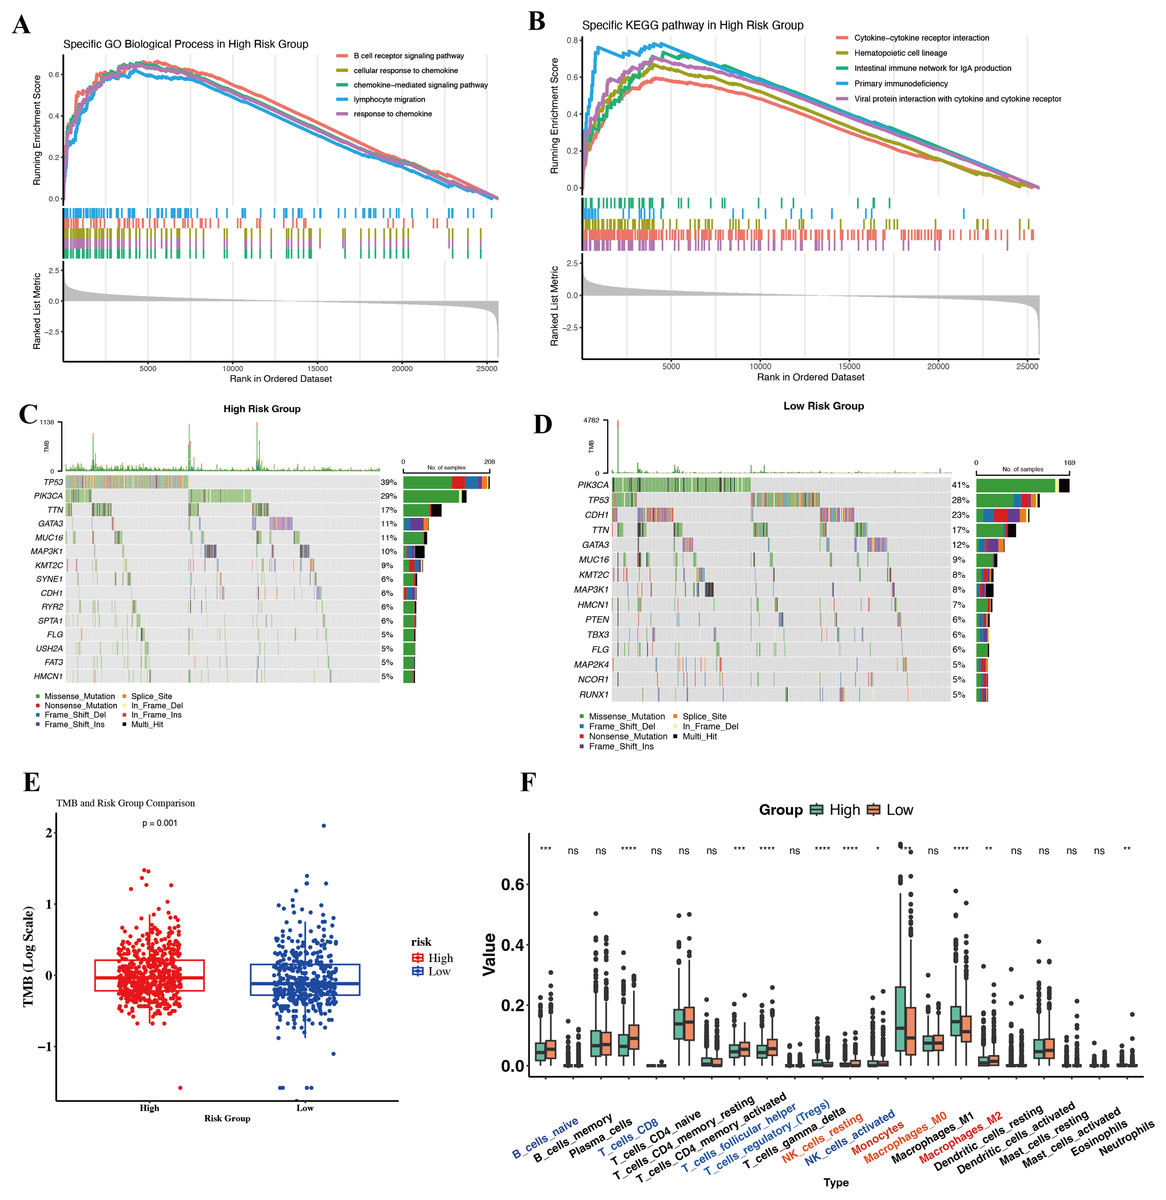
Figure 5: Molecular and immunological differences between high- and low-risk groups.
(A) GO-BP enrichment analysis highlighting significantly enriched immune-related pathways in the high-risk group. (B) KEGG pathway enrichment results demonstrating distinct immune signaling signatures between risk groups. (C, D) Oncoplots illustrating differential somatic mutation landscapes between the two cohorts. (E) Boxplot comparison of TMB, showing significantly elevated genomic instability in the high-risk group. (F) Boxplots depicting differences in immune cell infiltration inferred by CIBERSORT.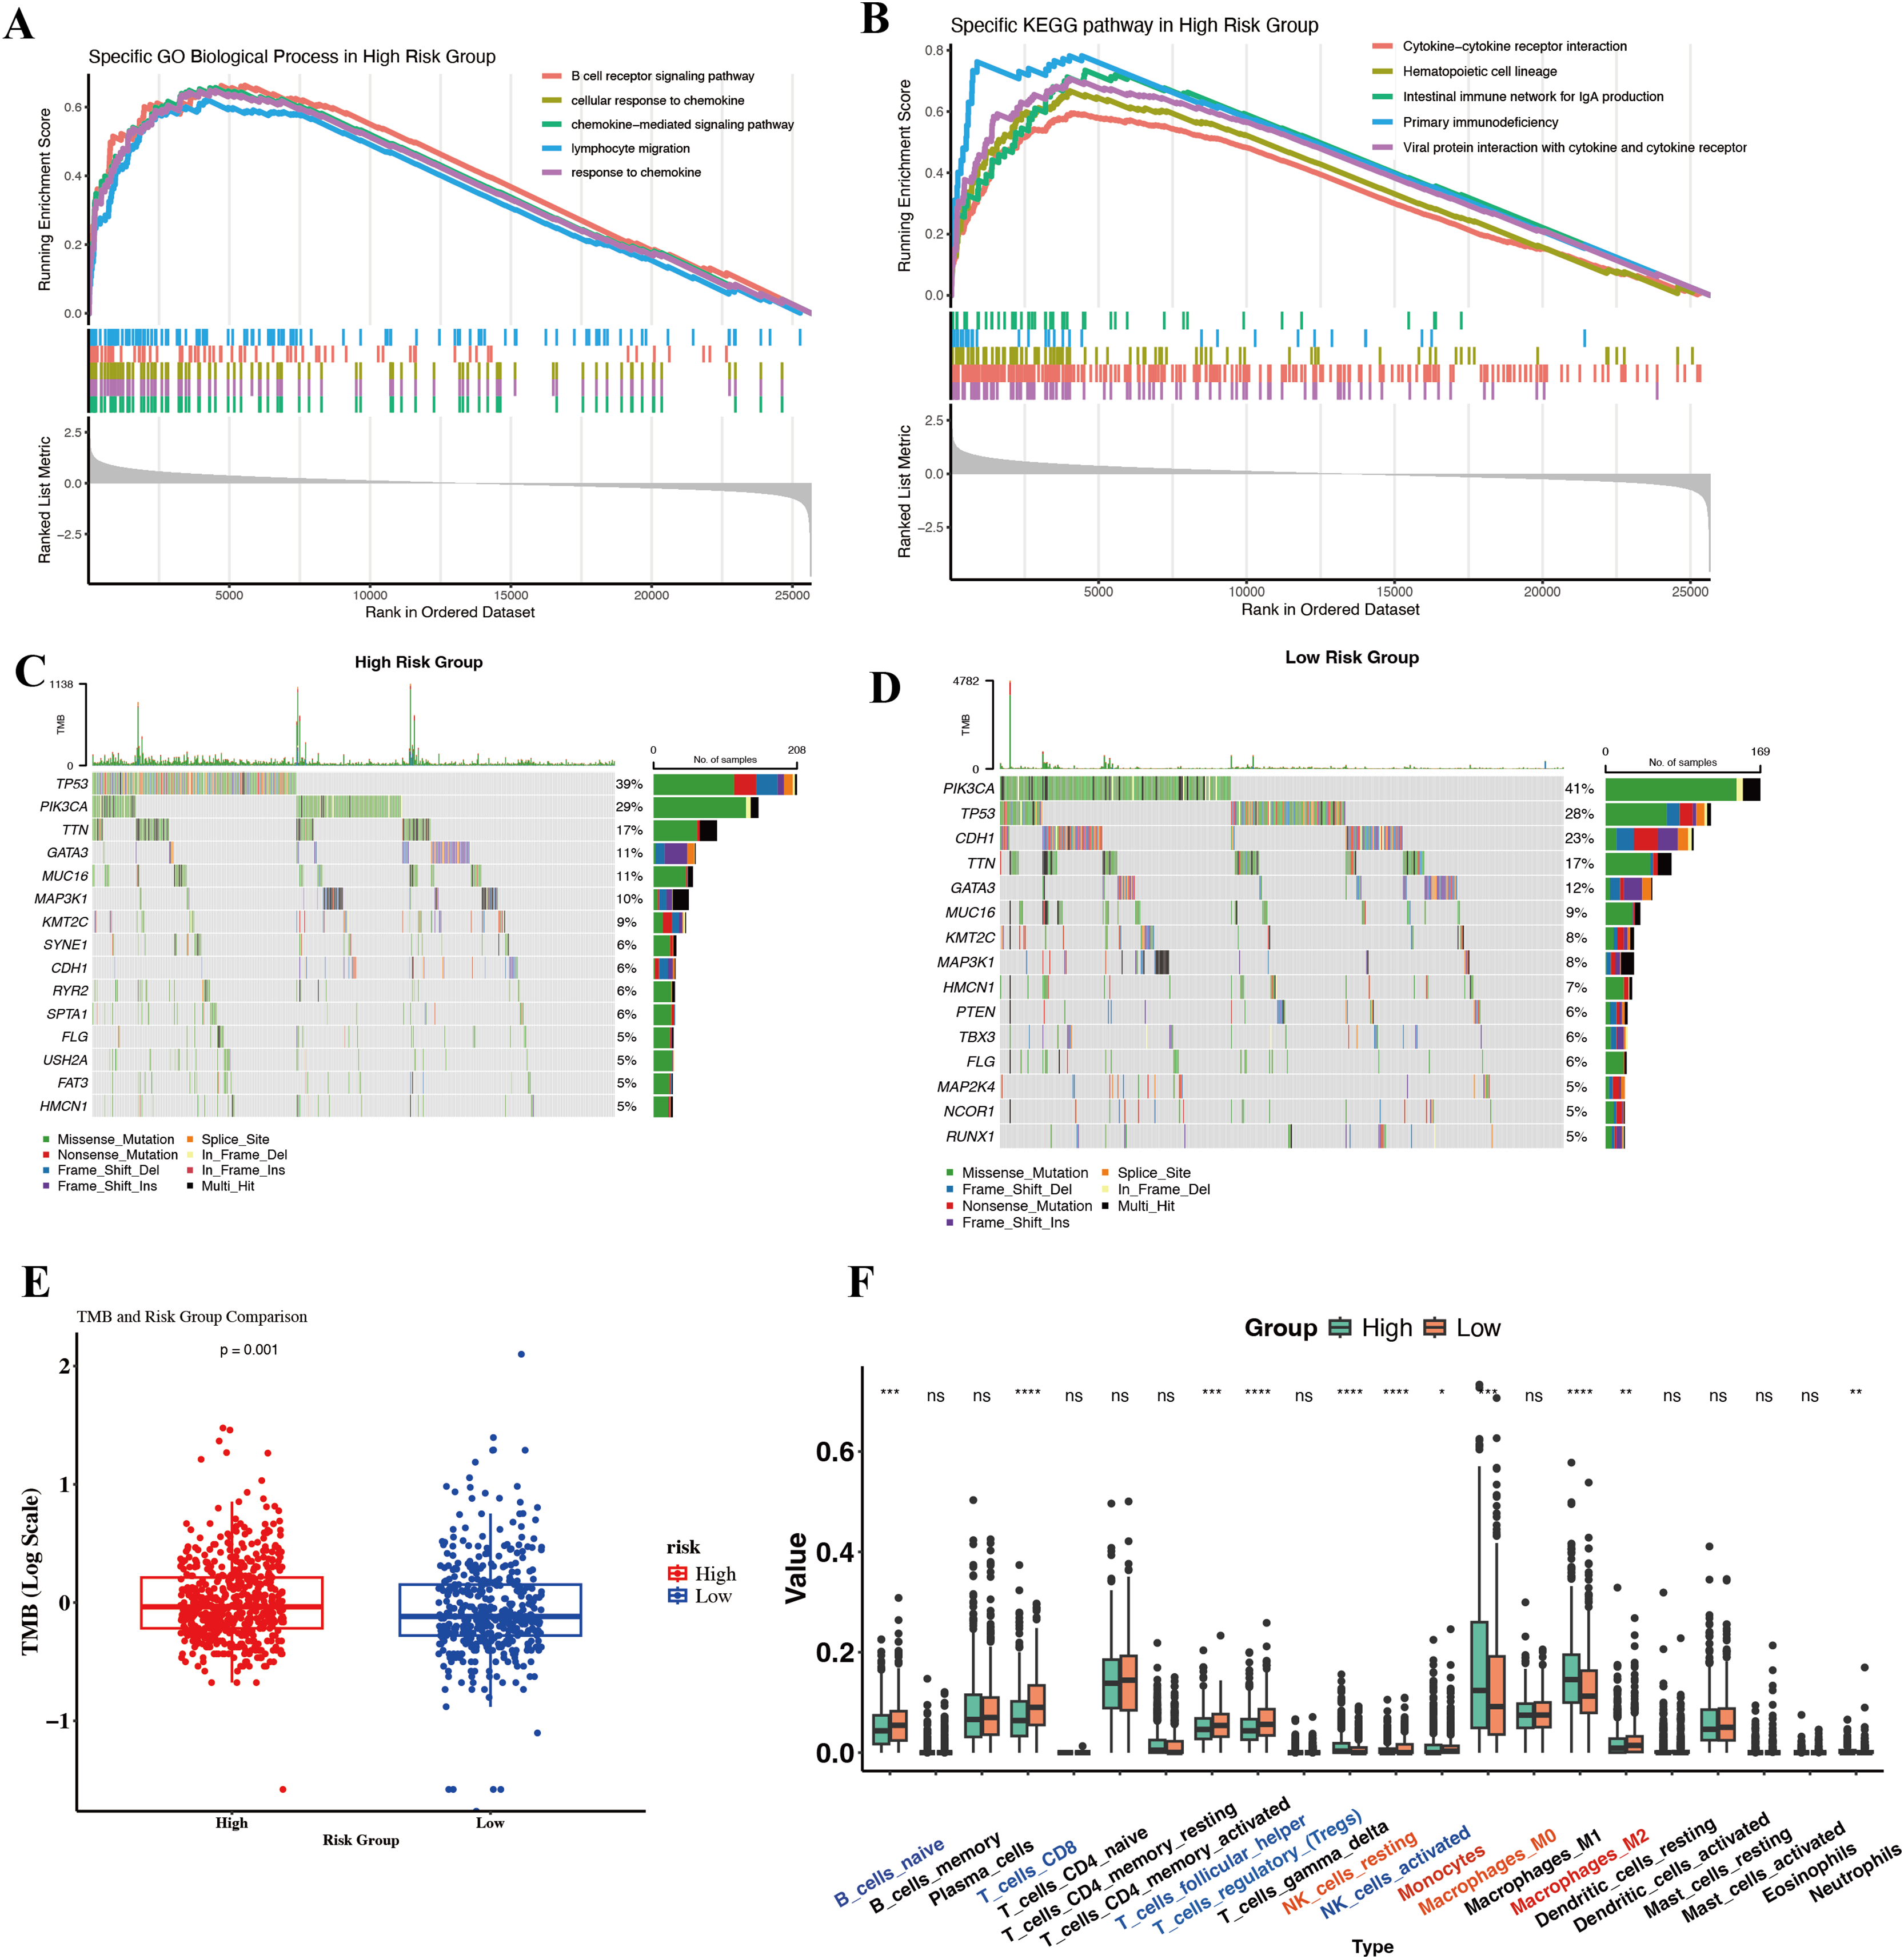
We investigated somatic mutation patterns as a clue. In the high-risk cohort, the three most frequently mutated genes were TP53, PIK3CA, and TTN, whereas in the low-risk cohort they were TP53, PIK3CA, and CDH (Figs. 5C and 5D). Consistently, the tumor mutational burden (TMB) was significantly higher in High-Risk tumors than Low-Risk (Fig. 5E).
To dissect the immune cell composition, we performed CIBERSORT deconvolution on bulk expression data to estimate leukocyte subsets in each tumor. High-Risk tumors showed an overrepresentation of myeloid-lineage cells, particularly macrophages and monocytes (Fig. 5F). Most notably, M2-polarized macrophages were significantly elevated in High-Risk tumors compared to Low-Risk. High-Risk tumors also had slightly higher fractions of neutrophils and resting mast cells. Conversely, some lymphocyte populations, such as resting memory CD4+ T cells and naive B cells, trended lower in High-Risk tumors, though activated CD8+ T cell levels did not significantly differ. The dominance of monocytes/M2 macrophages in High-Risk tumors suggests a TME skewed towards tumor-promoting inflammation rather than effective anti-tumor immunity. M2-like TAMs secrete factors that enhance tumor invasion, angiogenesis, and suppress cytotoxic T cells, and their presence is well-known to correlate with worse outcomes in BC.
In summary, the divergent immune and genomic features between High- and Low-Risk groups reinforce that our single-cell-derived signature captures a meaningful biological dichotomy. Our data provide candidate markers that could be used alongside the gene signature to identify patients who might need additional interventions targeting the immune microenvironment.
Identification of hub prognostic genes in BC
While our eight-gene signature showed good prognostic performance, we aimed to distill the signature to the most critical contributors that could serve as biomarkers or therapeutic targets. Using Random RSF analysis, which evaluates the importance of variables in survival prediction through an ensemble of decision trees, we assessed the relative importance of each gene in the signature. We set a threshold of ≥3% for relative importance. Three genes exceeded this threshold, NFKBIA, PDLIM4, and TCP1 (Fig. 6A). These three can be considered hub prognostic genes in our model, as they independently carried the most weight in stratifying patient survival. The other five genes, while still associated with survival, had lower importance scores and were not included as independent factors in the refined model.
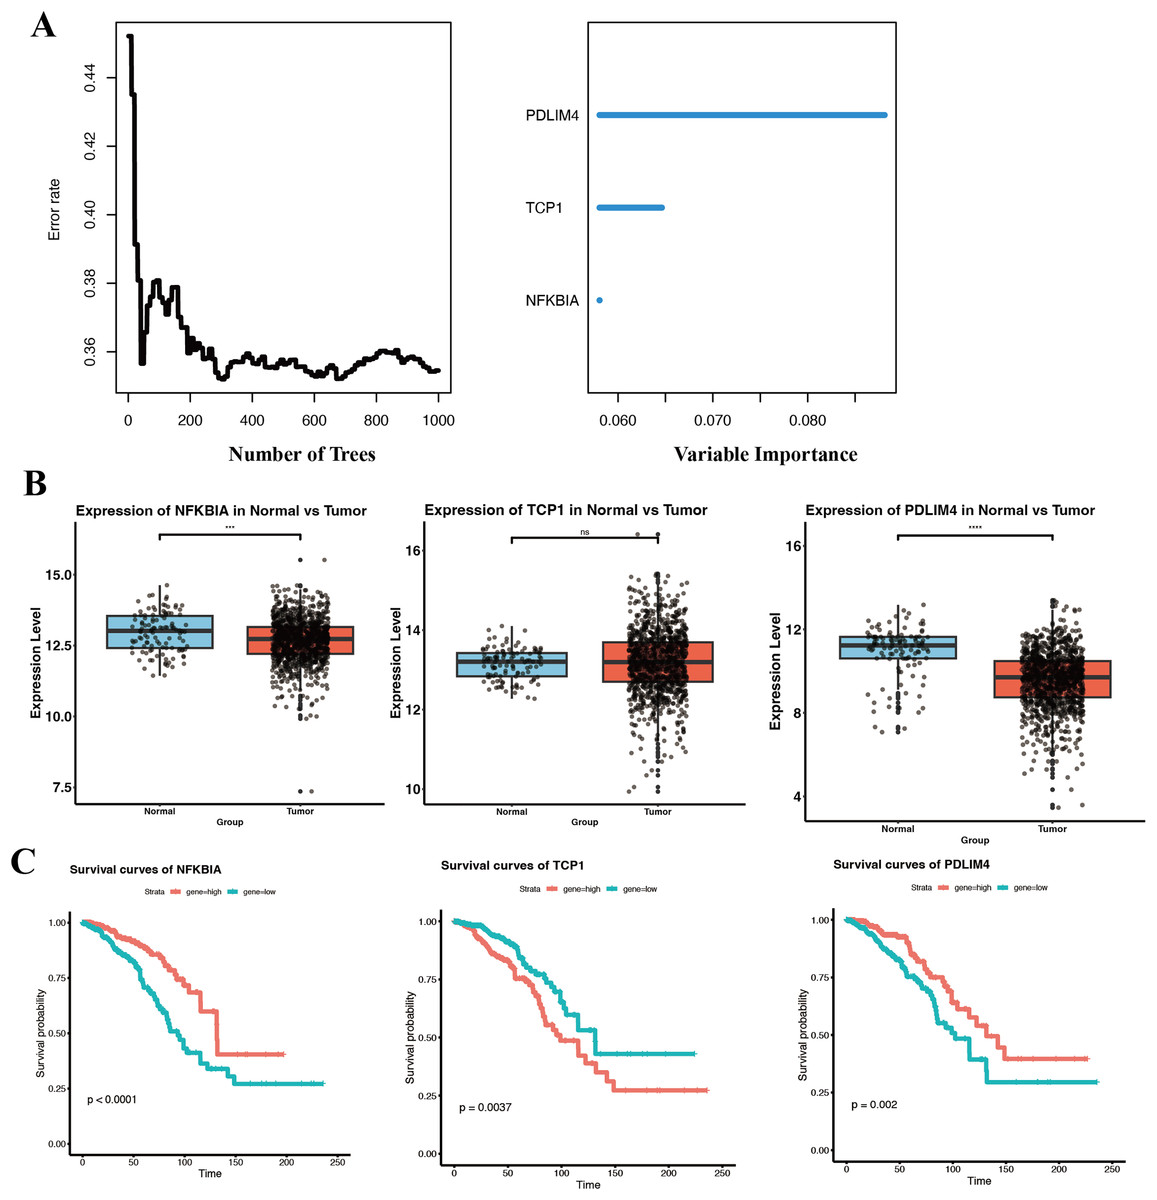
Figure 6: Identification and prognostic of core genes in breast cancer.
(A) RSF analysis identifying NFKBIA, PDLIM4, and TCP1 as independent prognostic markers based on relative importance scores. (B) Boxplots comparing expression levels of NFKBIA, PDLIM4, and TCP1 between breast tumor tissues and adjacent normal tissues within the TCGA-BRCA cohort. (C) KM survival analyses indicating significant differences in overall survival associated with the expression of the three core prognostic genes. ***p < 0.001, ****p < 0.0001.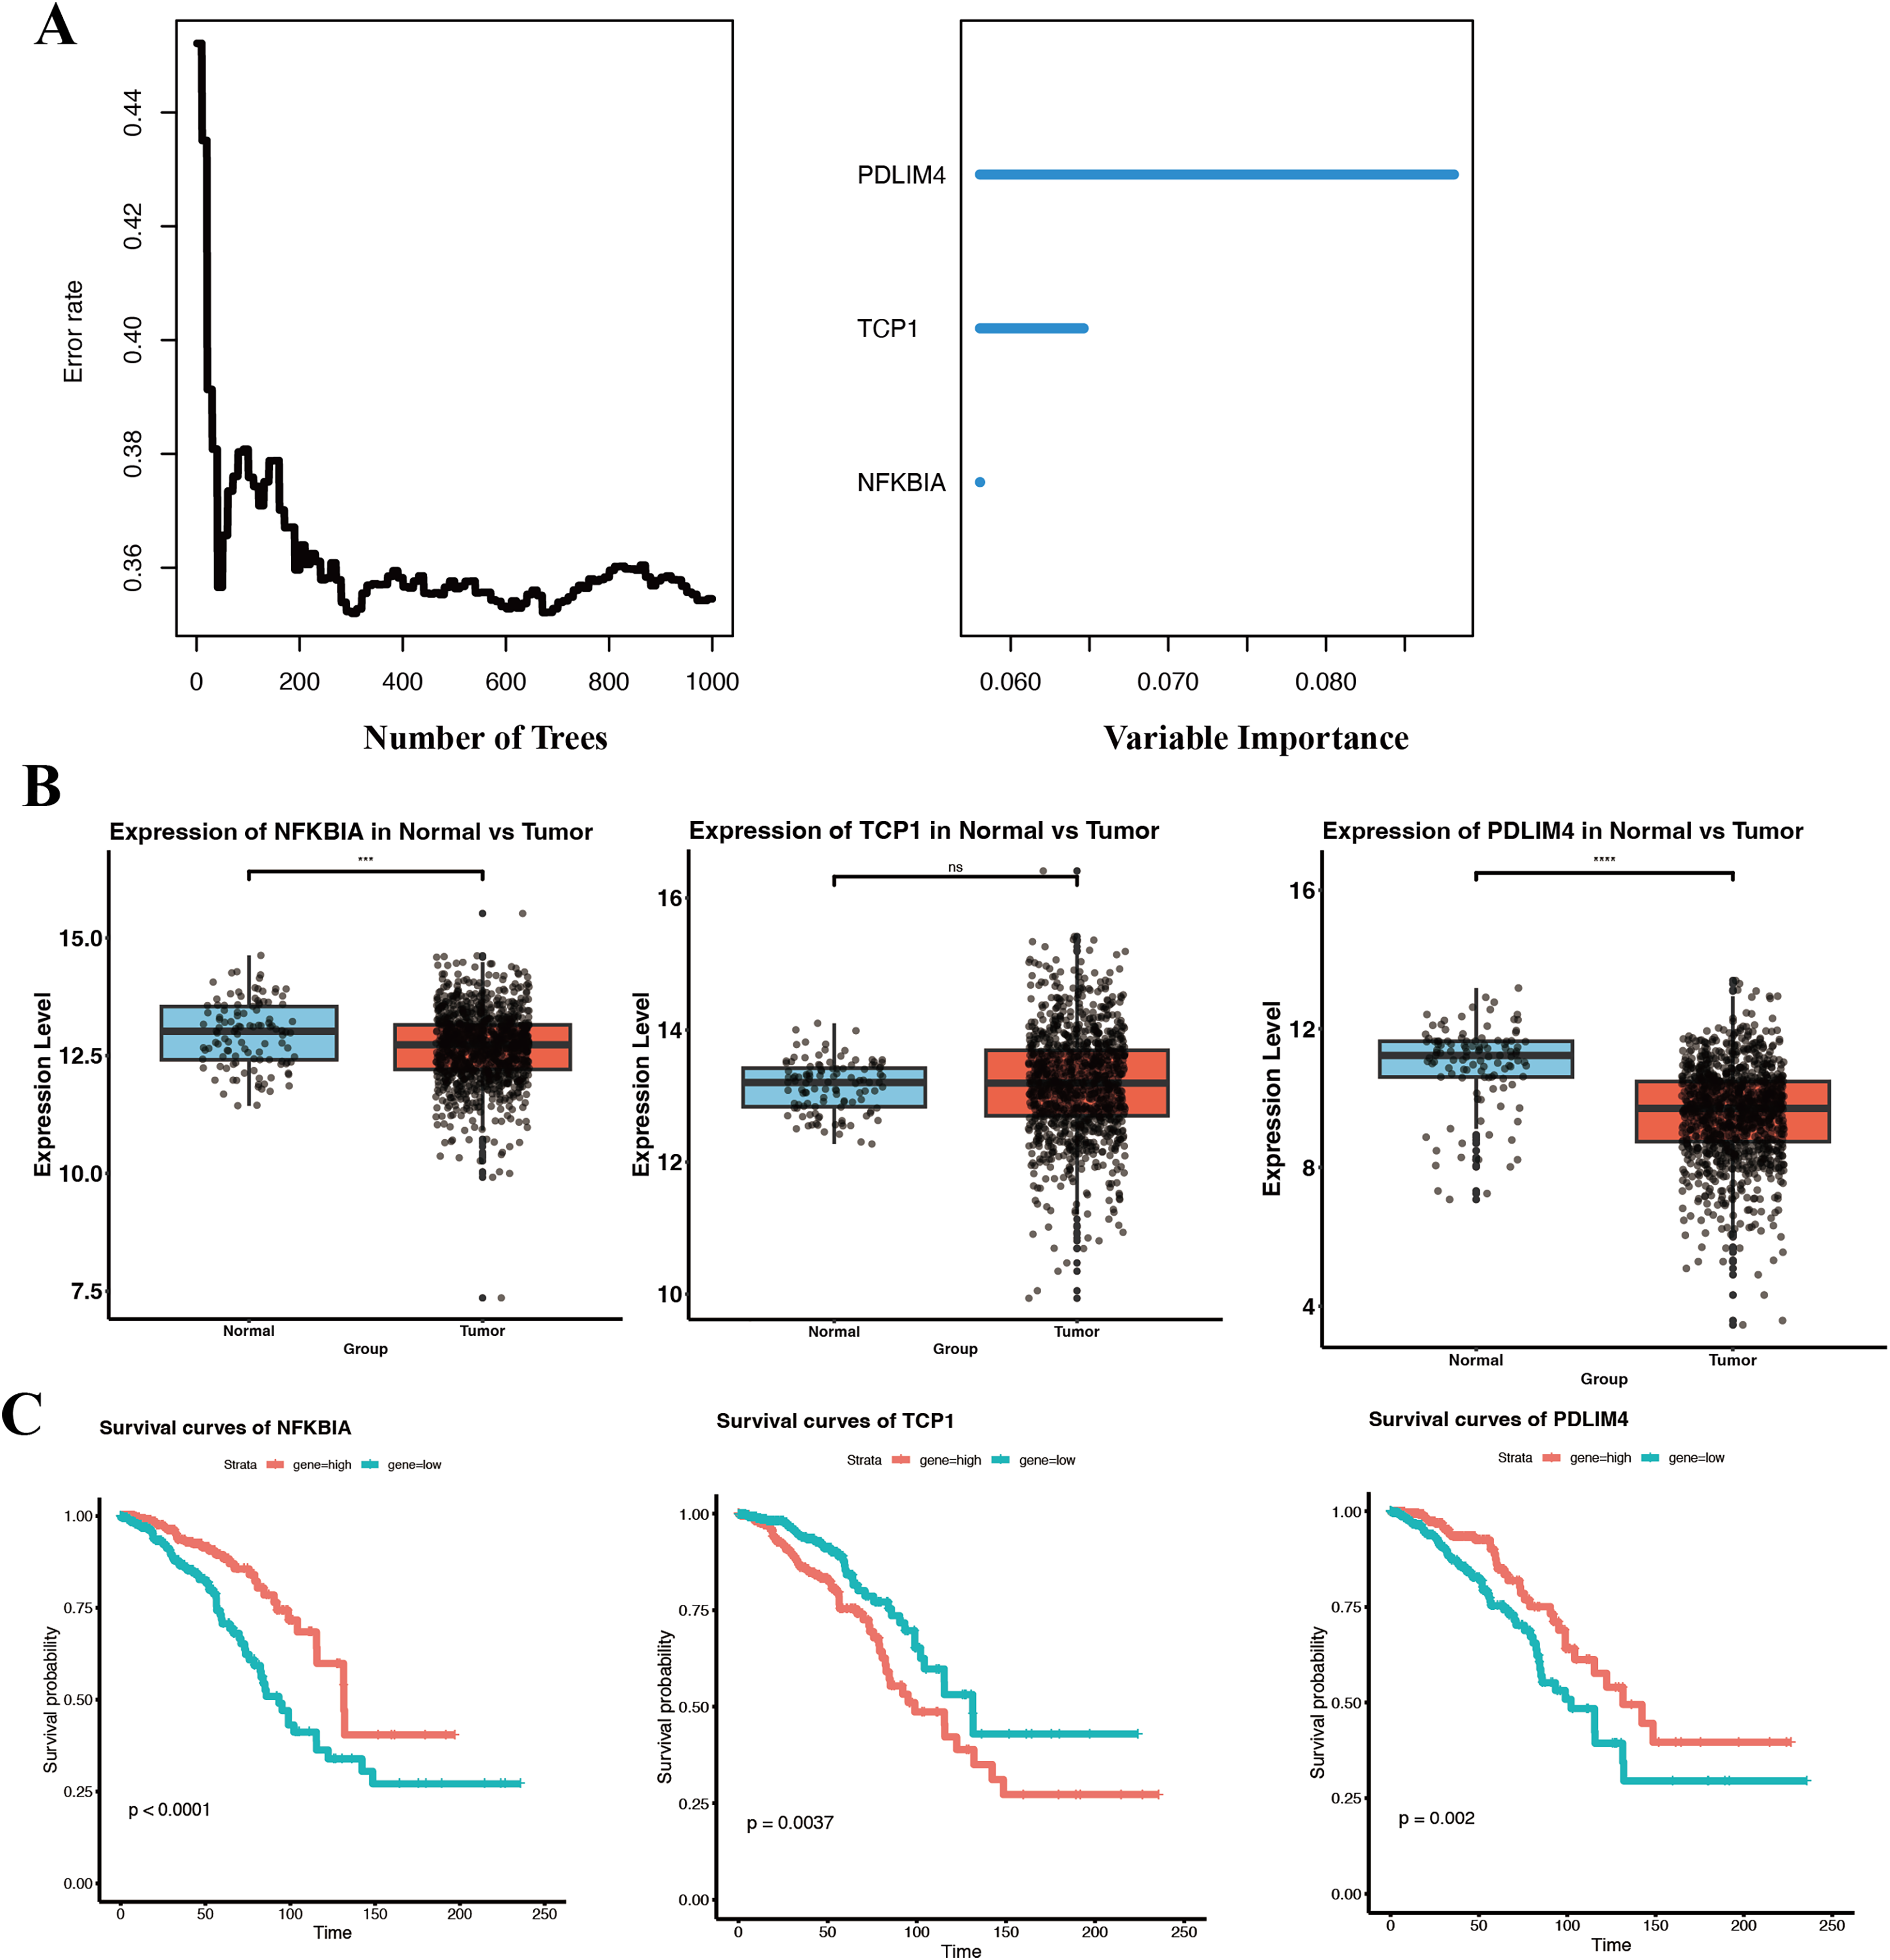
We then examined the expression of these three key genes in tumor vs normal tissue using the TCGA-BRCA dataset. NFKBIA and PDLIM4 were both significantly downregulated in breast tumor tissues compared to normal tissues (Fig. 6B). The lower expression of both NFKBIA and PDLIM4 in tumors, together with the fact that higher expression of these genes correlated with better survival, suggests that they may function as tumor suppressors or at least indicators of a less aggressive tumor phenotype.
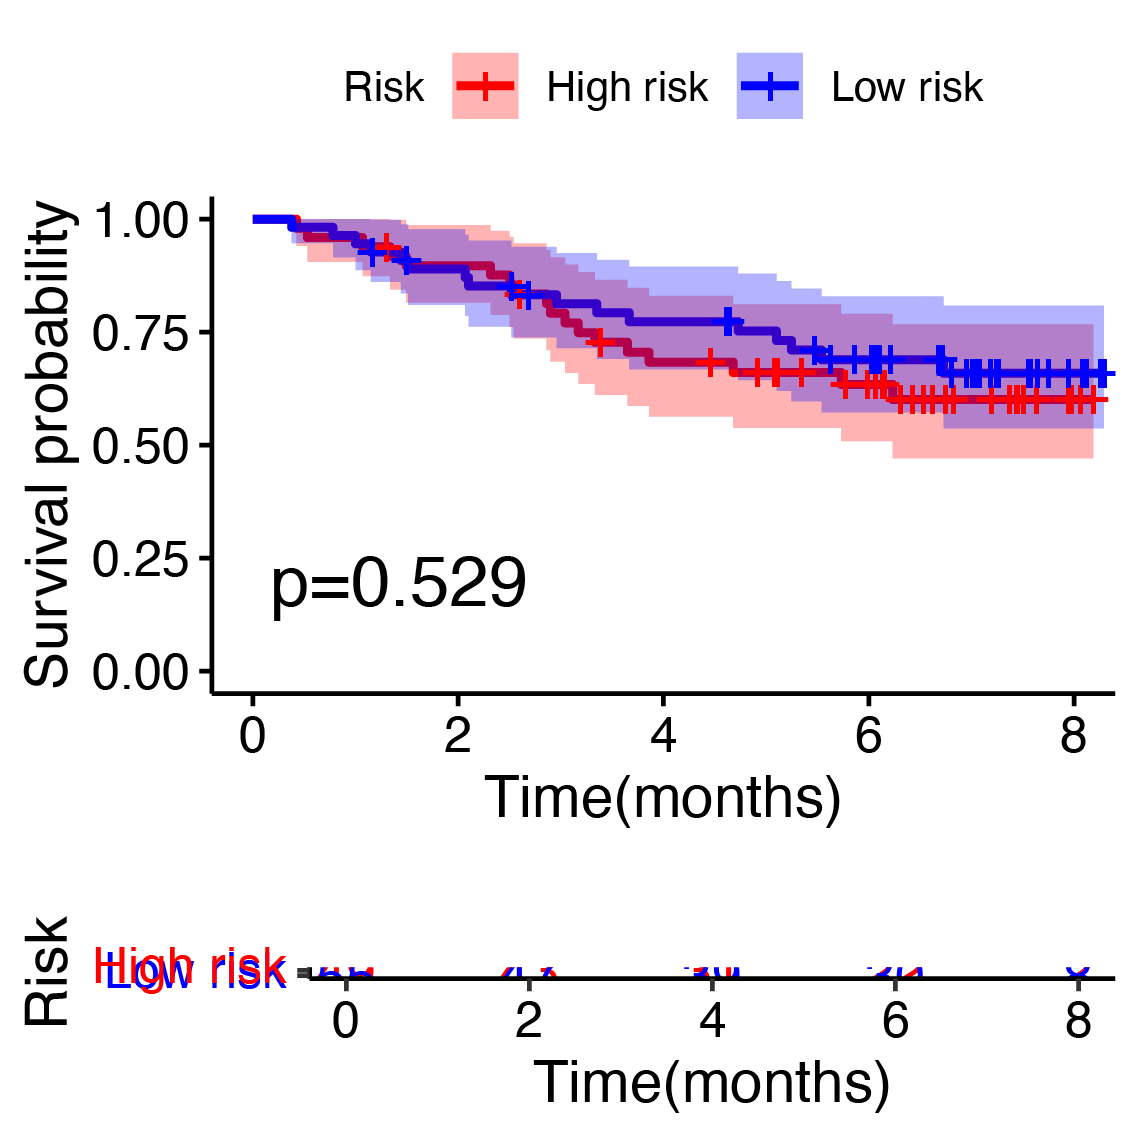
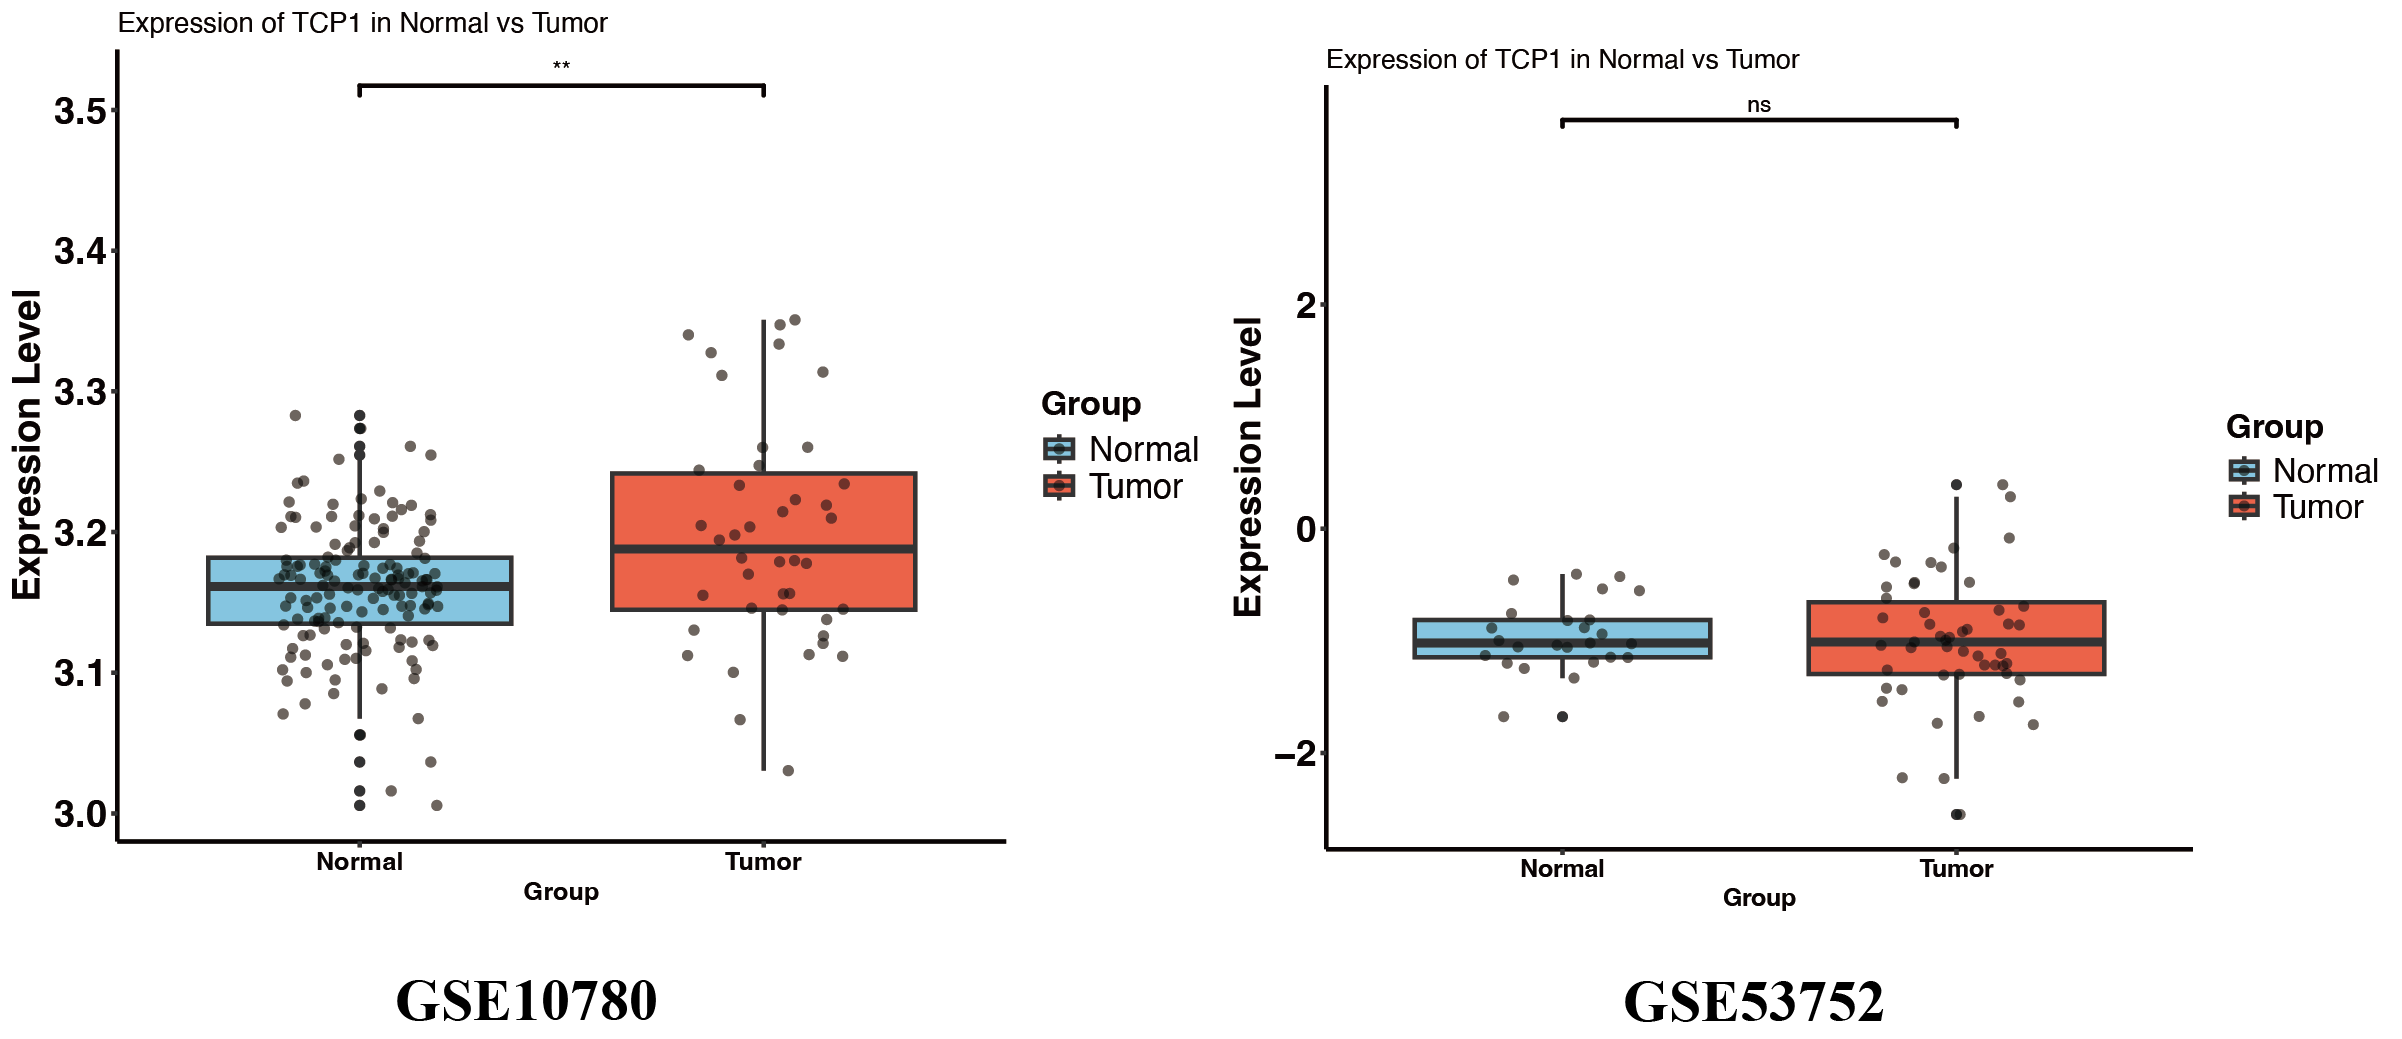
In contrast, TCP1 did not show a large difference in mean expression between tumor and normal tissues in TCGA and GSE53752 (Fig. 6B, Fig. S3), whereas in GSE10780 it was significantly higher in tumors (Fig. S3).
TCP1 is a chaperonin subunit involved in the folding of cytoskeletal proteins and certain oncoproteins. The lack of a strong differential expression could mean that TCP1 is generally required in many cells for basic functions. However, what is critical is that among tumors, those with higher TCP1 expression had significantly worse survival (Fig. 6C). KM analysis confirmed that patients with high tumor TCP1 levels had poorer overall survival than those with low TCP1 levels (P < 0.05).
Functional validation of TCP1 in the malignant phenotype of BT549 cells
To test whether TCP1 plays a functional role in BC aggressiveness, we performed loss-of-function experiments in cell lines. We chose BT549 for initial experiments, and additionally MCF7 to ensure the findings were not limited to one subtype. Using two independent shRNA sequences, we knocked down TCP1 in these cells and assessed changes in migration and invasion, which are key aspects of metastatic potential.
In BT549 cells, TCP1 knockdown led to a significant reduction in cell migration in the wound healing assay. The scratched wounds closed much more slowly in TCP1-depleted cells compared to control cells (sh-NC) (Fig. 7A). By 48 hours, control BT549 cells had substantially migrated into the wound area, whereas TCP1-knockdown cells covered a markedly smaller area of the wound. Quantitatively, the migration rate dropped by ~40–50% upon TCP1 silencing (P < 0.01). This indicates that TCP1 contributes to the motility of breast cancer cells, potentially by assisting in cytoskeletal dynamics or other motility-related processes.
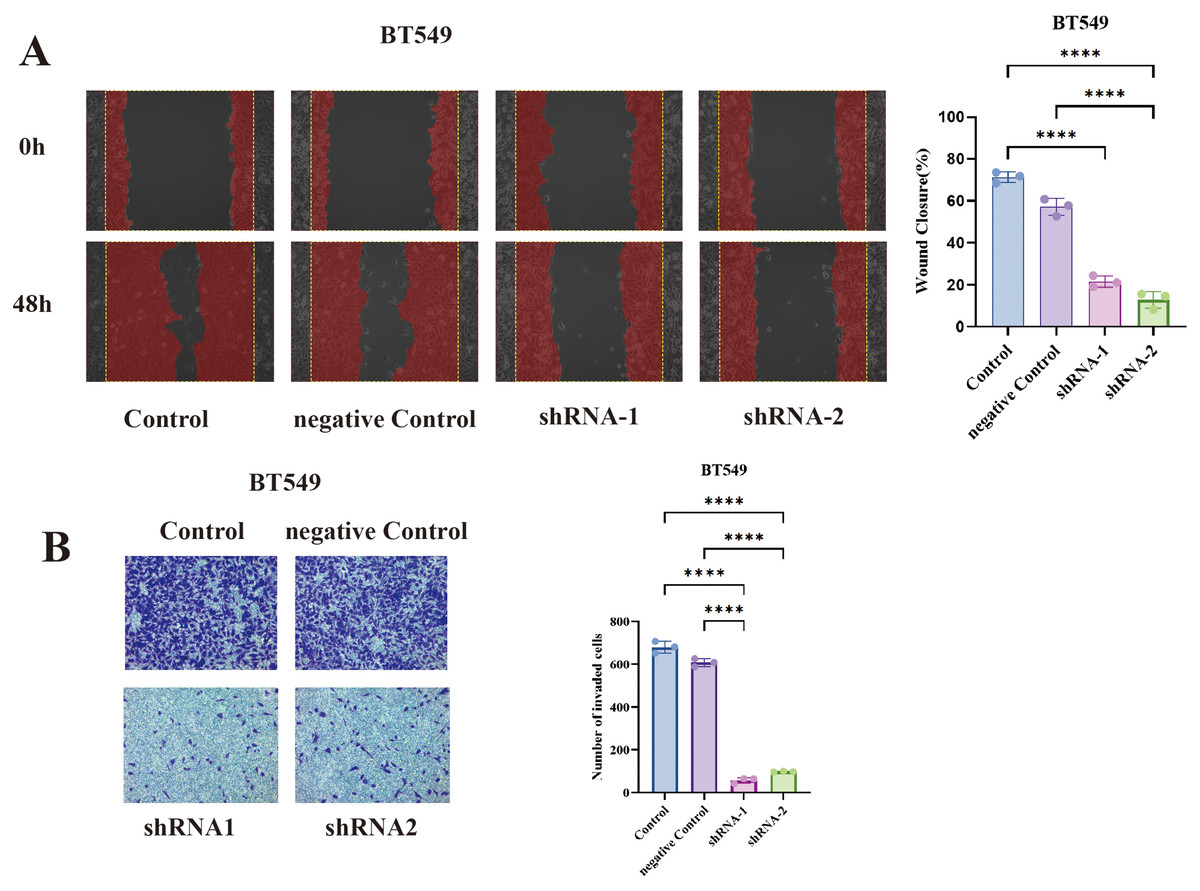
Figure 7: Functional validation of TCP1 in BT549 cells.
(A) Wound healing assay and corresponding quantitative bar graph demonstrating significantly reduced migratory capacity in BT549 cells after shRNA-mediated TCP1 knockdown. (B) Transwell invasion assay with representative images and quantitative bar graph showing decreased invasive potential following TCP1 silencing. ****p < 0.0001.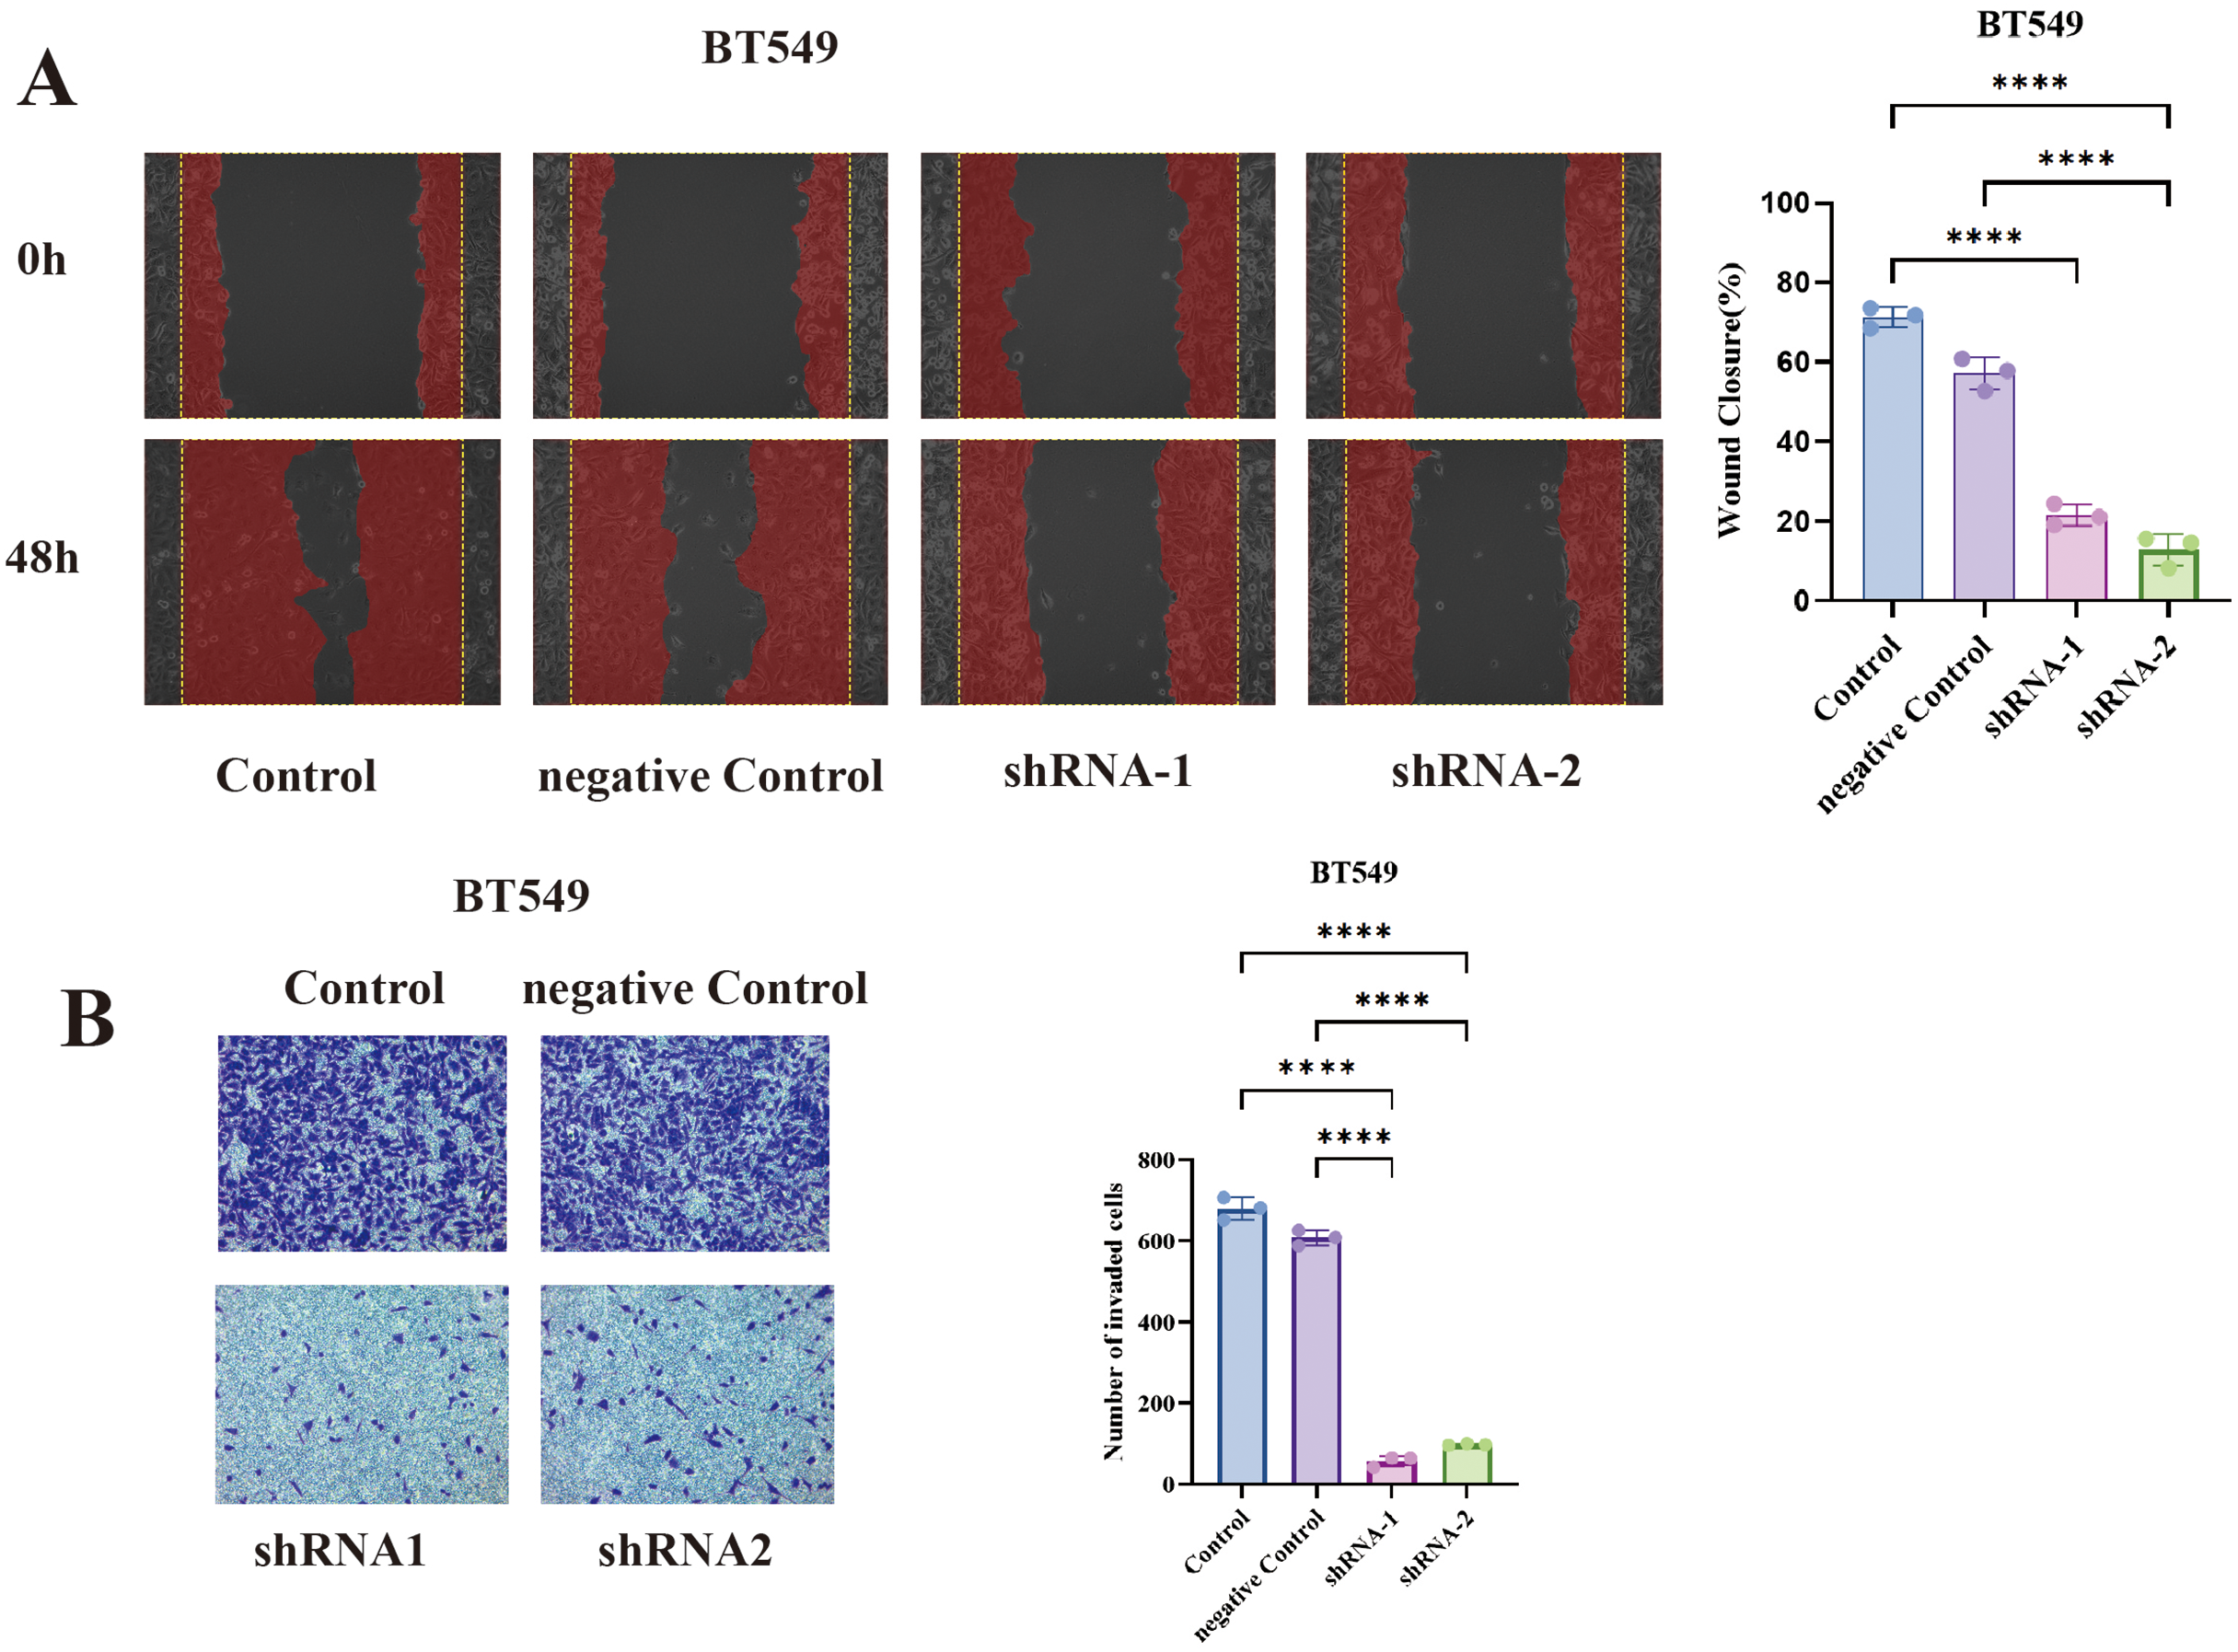
Similarly, TCP1 knockdown drastically impaired the invasive capacity of BT549 cells in Transwell assays (Fig. 7B). Invasive cells that moved through the Matrigel-coated membrane were stained and counted. TCP1-silenced BT549 cells showed roughly a 50% decrease in the number of invading cells compared to controls (P < 0.01). The invaded cells in shTCP1 groups were visibly fewer in microscope images, consistent with these cells being less capable of degrading matrix or moving through pores. Since invasion is a complex process requiring cytoskeletal reorganization, protease secretion, and cell survival in foreign environments, the reduction implies TCP1 might be supporting one or several of these processes in cancer cells.
To generalize our findings, we performed the same assays in MCF7 cells (luminal A subtype). Notably, MCF7 is less inherently motile than BT549, but even in MCF7, TCP1 knockdown yielded a similar trend, the wound healing ability was significantly reduced (shTCP1 MCF7 cells had slower scratch closure compared to sh-NC MCF7), and the Transwell invasion of MCF7 was further diminished with TCP1 silencing (Figs. 8A and 8B).
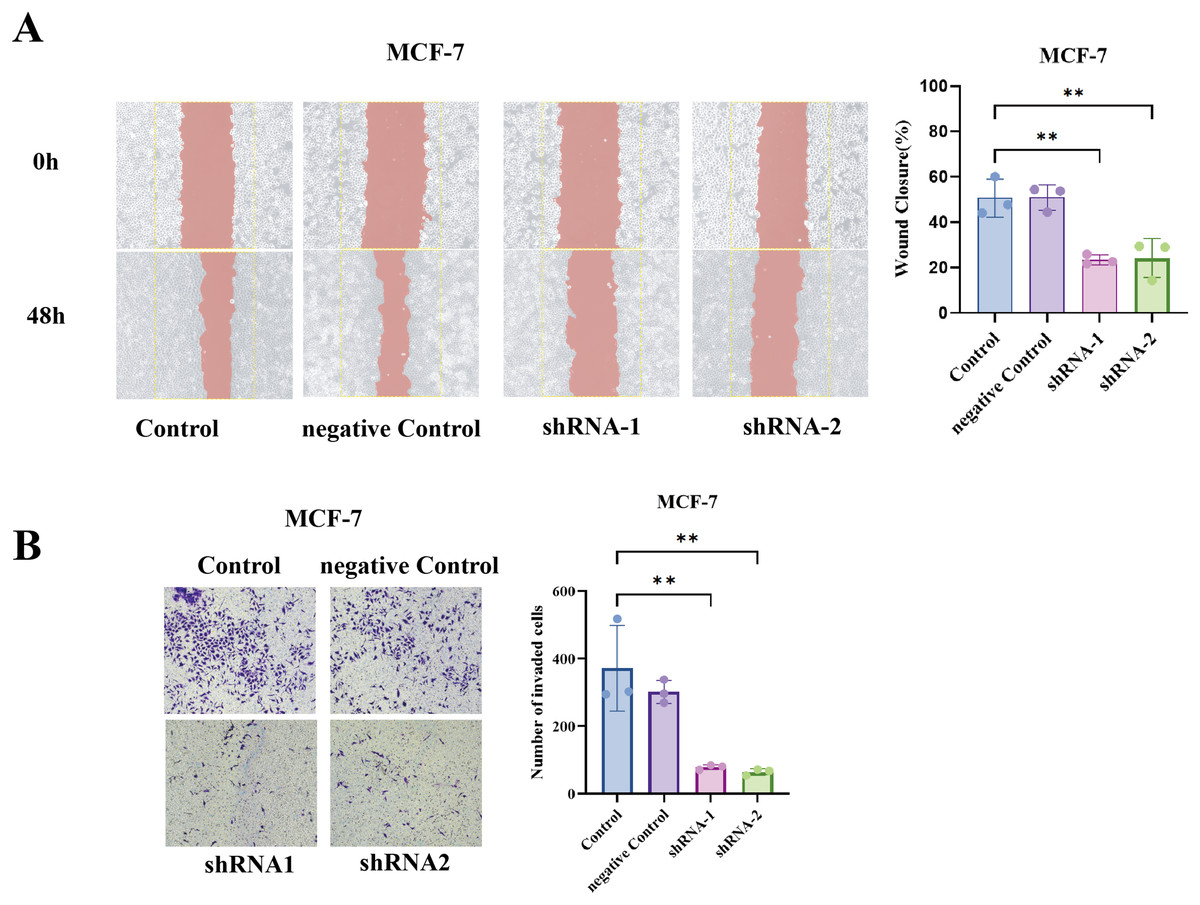
Figure 8: Functional validation of TCP1 in MCF-7 cells.
(A) Wound healing assay and corresponding quantitative bar graph demonstrating significantly reduced migratory capacity in MCF-7 cells after shRNA-mediated TCP1 knockdown. (B) Transwell invasion assay with representative images and quantitative bar graph showing decreased invasive potential following TCP1 silencing. **p < 0.01.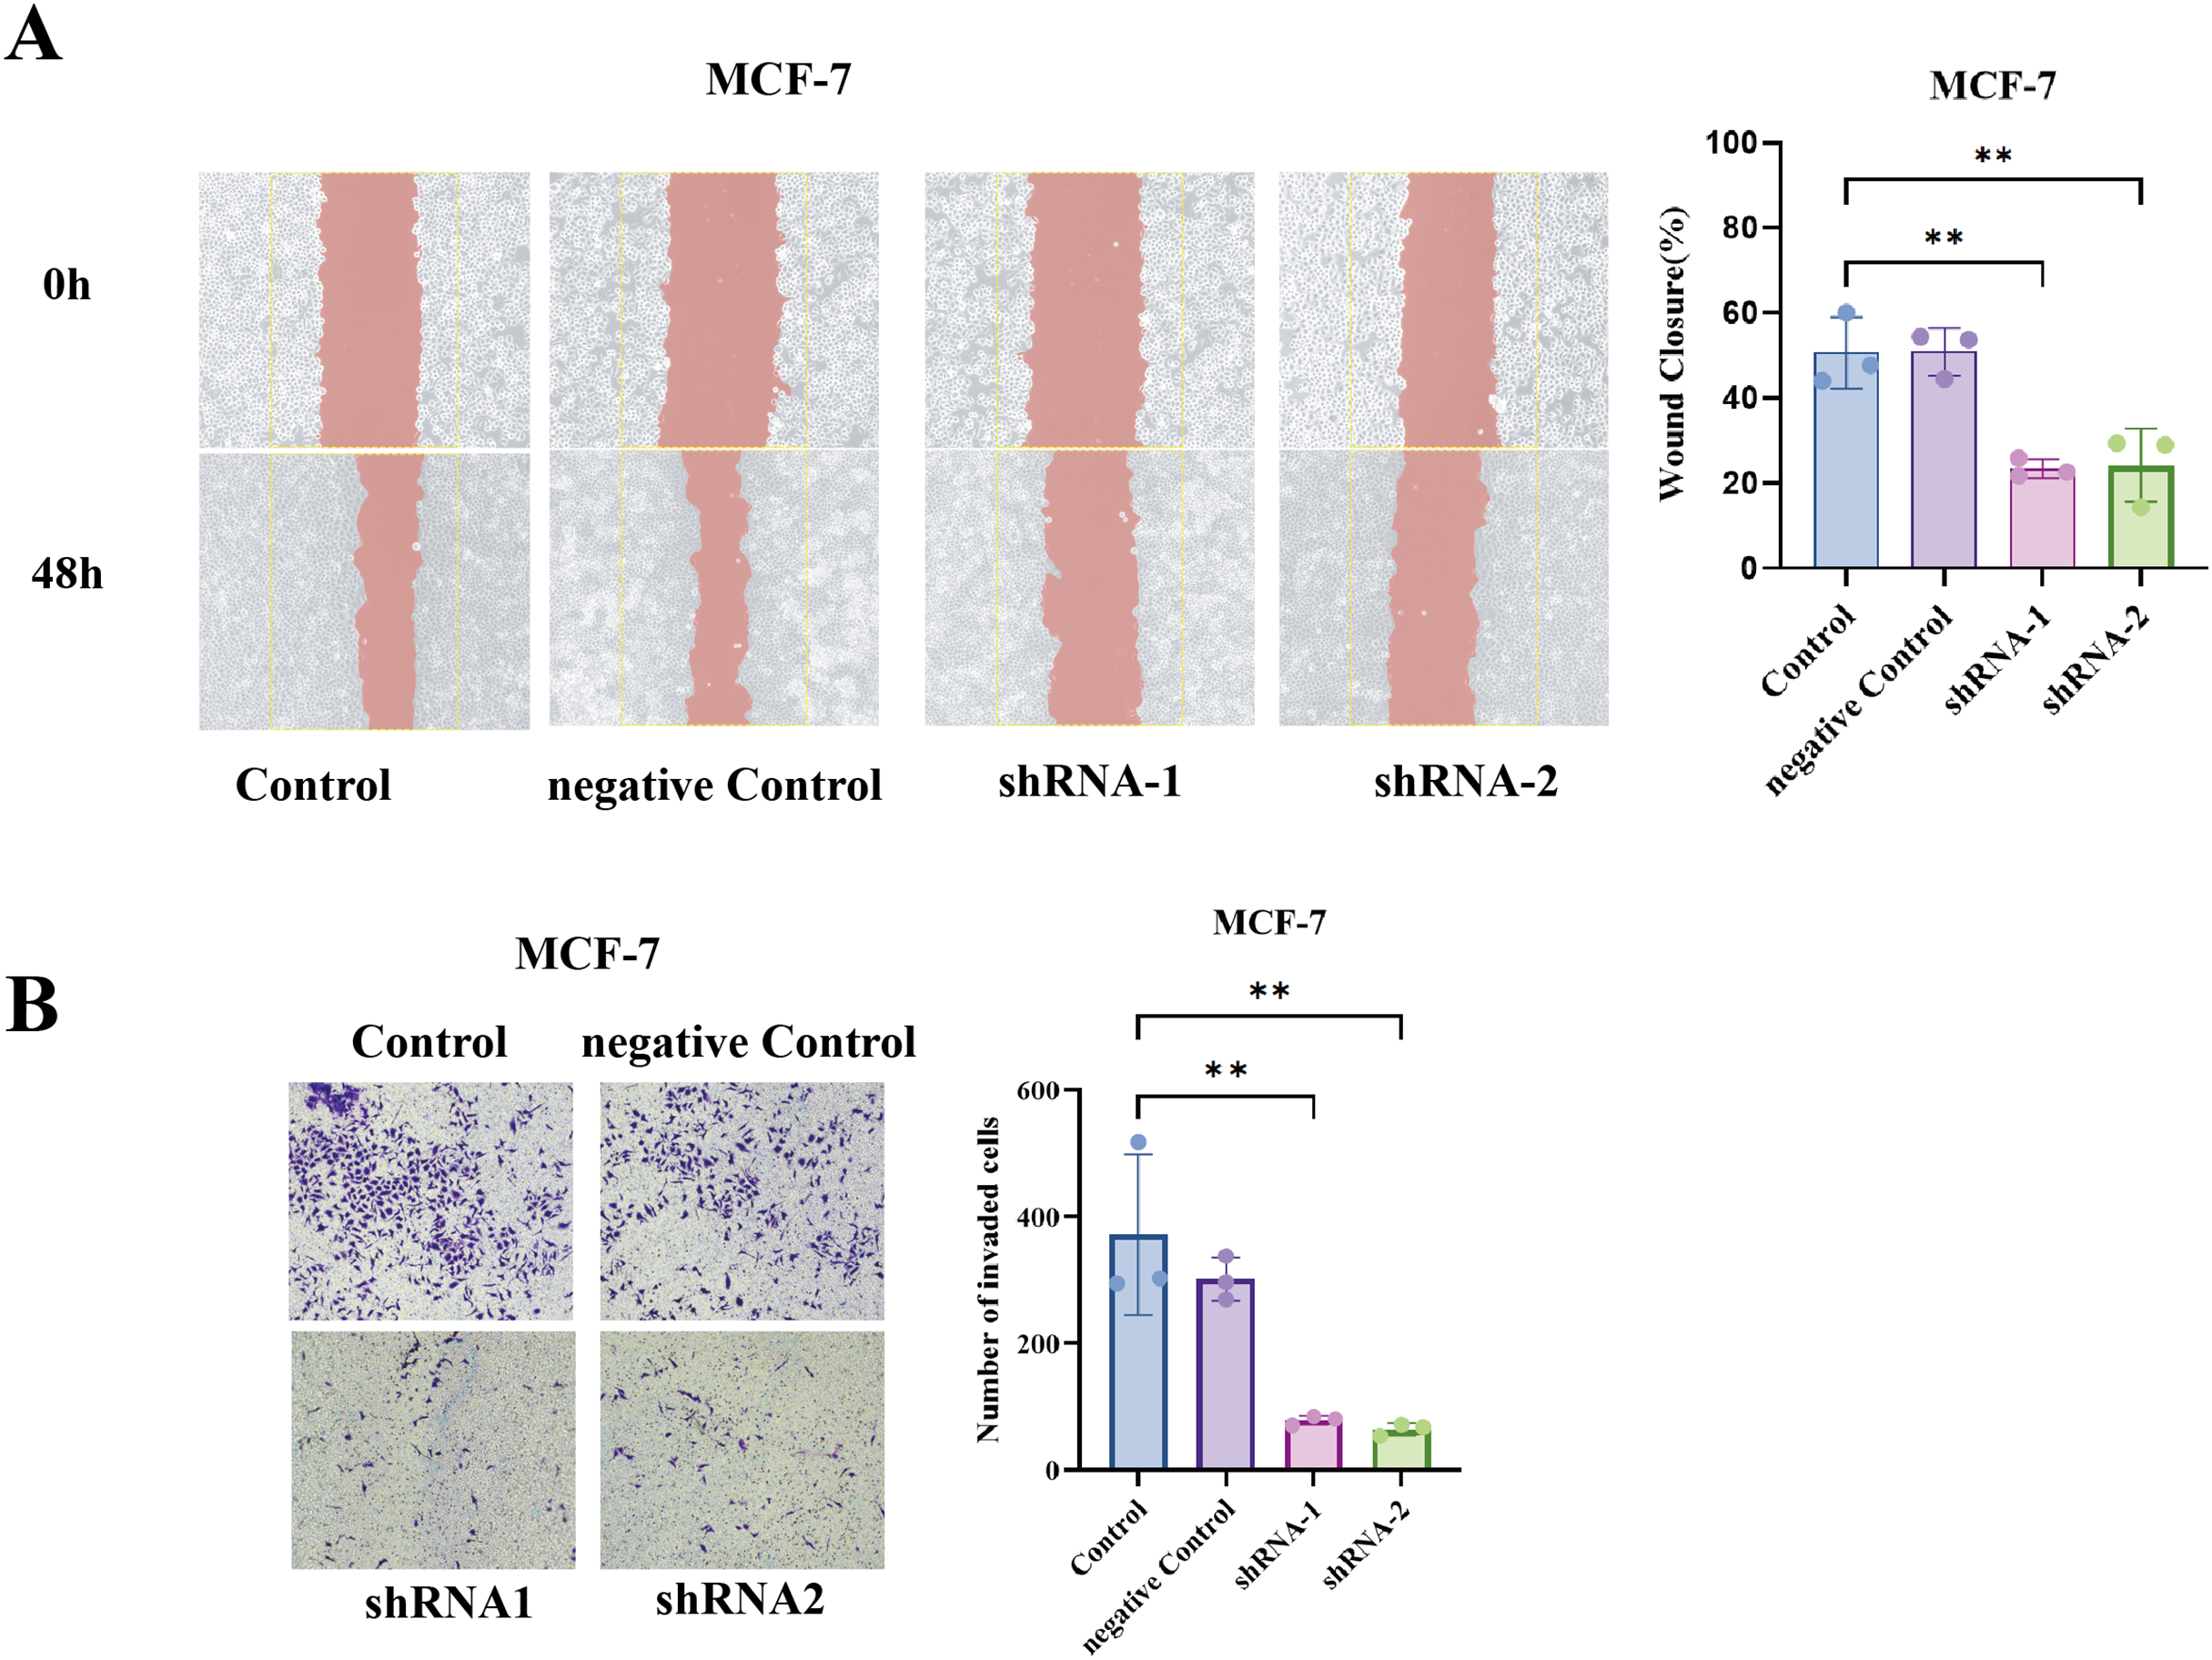
Discussion
In this study, we integrated single-cell transcriptomics, bulk genomics, and experimental validation to chart the landscape of cellular heterogeneity in BC and to link it with clinical outcomes. Our findings emphasize that a breast tumor is not a uniform entity but a complex ecosystem of diverse cell types and states. We showed that even tumors of the same clinical subtype can have markedly different TME compositions, ranging from immune-dominated to stroma-rich, which likely influence how those tumors behave and respond to therapy. By using inferCNV to separate malignant cells, we uncovered hidden intratumoral heterogeneity among the cancer cells themselves, identifying subpopulations with distinct phenotypes such as a stem-like KRT17+ cluster. Crucially, the gene expression program of this subpopulation was found to portend a poor prognosis in patients, highlighting that not all tumor cells are equal, the presence of a particularly aggressive subset can dictate the clinical trajectory.
Our work reinforces several principles of tumor biology. First, the TME and tumor cell-intrinsic features are deeply interwoven in determining outcome. The High-Risk groups in our study combined tumor-intrinsic genomic instability with an immunosuppressive TME (TAM infiltration), a convergence that is known to facilitate metastasis and therapy resistance (Kwa & Adams, 2018; Thomas, Al-Khadairi & Decock, 2021). This resembles the concept of “cold” aggressive tumors, they may have immune cells present, but these are polarized to support tumor growth rather than attack it (Ramos et al., 2022). Prior studies have shown that basal-like breast cancers often exhibit high TILs and PD-L1 expression, yet paradoxically, those with excessive genomic instability can evade immune elimination, resulting in poor outcomes (Kholod et al., 2022). Our data dovetail with these observations and provide a specific gene signature that captures this dangerous combination of traits. This suggests that assays measuring both genomic instability and immune context alongside our gene signature could improve risk stratification and perhaps identify which patients might benefit from immune-modulating therapies.
Second, our single-cell analysis highlights a hierarchy of malignant cell states within tumors. The KRT17+ subpopulation we identified exhibits characteristics reminiscent of cancer stem cells (CSCs), high differentiation potential, and activation of stemness-associated pathways (ETS factors like ERG). While the concept of CSCs in BC has been recognized, for instance, cells marked by CD44+/CD24− or ALDH1+ have tumor-initiating capacity (Li et al., 2017; Ricardo et al., 2011), our study provides a transcriptomic identity for such cells in situ (KRT17, KRT5, with an ERG regulon). Interestingly, KRT17 has been reported as a poor prognostic marker in some breast cancer subsets and is part of the claudin-low/basal phenotype which overlaps with stem-like features (Wang et al., 2019). Our data give functional context to those clinical correlations: tumors enriched in KRT17+/stem-like cells tend to be more aggressive and therapy-resistant, likely because these cells can regenerate tumor heterogeneity and survive stress. This underlines the importance of therapies targeting the stem-like compartment, for example, inhibitors of pathways like Notch, Wnt/β-catenin, or in our case NF-κB/ER stress which might be active in these cells (Maru et al., 2014). Notably, we found the ERG transcription factor active in KRT17+ cells, ERG could be mediating aspects of stemness or vascular mimicry (ERG is pro-angiogenic) (Birdsey et al., 2015). Though ERG is not commonly mutated or overexpressed in breast cancer, its activity could be induced by the TME or stress signals. It would be worthwhile for future research to see if ERG or other ETS factors are essential for the maintenance of this stem-like state, potentially offering another target.
Third, we identified specific molecular players that connect the single-cell findings with clinical outcomes. NFKBIA (IκBα) and PDLIM4 emerged as putative protective factors whose loss is deleterious. This aligns well with known biology, loss of IκBα unleashes NF-κB. Hyperactive NF-κB is a driver of inflammation-linked cancer progression, enriching for cancer stem cells and conferring resistance to apoptosis and endocrine therapies (Tokumasu et al., 2025). There are documented cases of NFKBIA deletions or low expression correlating with poor prognosis in basal-like BC and other malignancies. Our data support the idea that NF-κB pathway activation is a hallmark of high-risk tumors, likely via loss of IκBα or upstream mutations, and suggest that measuring NFKBIA expression could be a surrogate for NF-κB activity in tumors. Similarly, PDLIM4 has been identified as a tumor suppressor in breast and ovarian cancers (Jia et al., 2019; Kravchenko et al., 2016), often silenced epigenetically. It modulates actin stress fibers and focal adhesions; losing PDLIM4 can increase cell motility and invasiveness, which matches our finding that PDLIM4-low tumors were more metastatic. Restoring PDLIM4 or mimicking its function might restrain metastasis, a concept that could be explored, though challenging if the gene is silenced.
On the other hand, TCP1 stood out as an oncogenic factor. Our study is the first, to our knowledge, to implicate TCP1 specifically in breast cancer prognosis and to validate its functional role in cell invasion. There is mounting evidence across cancers that the chaperonin CCT (of which TCP1 is subunit 1) is upregulated to meet the high protein-folding demands of cancer cells (Lewis et al., 1992; Martín-Trillo & Cubas, 2010). CCT assists folding of many proteins, but notably actin and tubulin—which cancer cells reorganize during EMT and metastasis and drivers like MYC, which need stabilization. A recent study demonstrated that TCP1 knockdown in HCC and pancreatic cancer reduced tumor growth and metastasis, precisely because it led to quicker degradation of c-Myc and dampened AKT/ERK signaling (Liu et al., 2025). We observed analogous effects in BC cells, TCP1 knockdown hampered invasion and migration, likely through cytoskeletal and signaling disruptions. This validates TCP1 as a potential therapeutic vulnerability. While targeting a general chaperone is complex (given the risk to normal cells), cancer cells may be more sensitive to chaperone inhibition due to their heightened proteotoxic stress and dependency on oncoprotein (Cox et al., 2022). Efforts are underway to develop inhibitors or degraders of specific CCT components or regulators. For instance, a cell-permeable peptide (CT20p) derived from a proapoptotic protein has been shown to selectively kill cancer cells by inhibiting CCT, causing misfolding of actin and tubulin (Carr et al., 2017). BC with high TCP1/CCT activity, like the ones we identified, could be ideal candidates for such treatments. Moreover, our work raises the possibility of using TCP1 levels as a biomarker, patients with TCP1-overexpressing tumors might have a worse prognosis but also might respond to therapies that exploit proteostasis stress in combination with standard treatments.
In summary, our study resolves a stem-like KRT17+ malignant program that tracks with poor prognosis and an immunosuppressive, TAM-rich TME. A prognostic signature distilled from this program robustly stratifies survival, indicating that the presence of a minor but aggressive stem-like compartment can dominate clinical outcome. Within this circuitry, the chaperonin subunit TCP1 emerges as a tractable dependency: shRNA-mediated TCP1 silencing curtailed wound closure and Matrigel invasion by ~40–50% in BT549 (TNBC) and significantly impaired motility/invasion in MCF7 (ER+), establishing TCP1 as a driver of metastatic traits across subtypes. In contrast, NFKBIA and PDLIM4 behave as protective markers whose low expression aligns with high-risk disease.
This study remains constrained by data breadth and experimental scope. Although we added three external cohorts (GSE42568, GSE10780, GSE53752) and validated the signature externally, only one cohort contained survival endpoints, and the discovery single-cell compendium included limited normal samples. Functional validation was restricted to in vitro loss-of-function assays in two cell lines; we did not perform in vivo metastasis models nor overexpression/re-expression rescue to test causality and reversibility. As a result, the connections among the KRT17+ program, ERG activity, and TCP1 dependence remain partly correlative. In future work, we will expand to multi-center prospective cohorts, incorporate spatial and in vivo models, and perform overexpression and pharmacologic inhibition studies (CCT/TCP1) to establish mechanism and therapeutic tractability.