
Biomarkers of mitochondrial permeability transition-driven necrosis in the regulation of ulcerative colitis
- Published
- Accepted
- Received
- Academic Editor
- Vladimir Uversky
- Subject Areas
- Bioinformatics, Gastroenterology and Hepatology
- Keywords
- Ulcerative colitis, Mitochondrial permeability transition-driven necrosis, WGCNA, Immune infiltration, Bioinformatics
- Copyright
- © 2025 Sun et al.
- Licence
- This is an open access article distributed under the terms of the Creative Commons Attribution License, which permits using, remixing, and building upon the work non-commercially, as long as it is properly attributed. For attribution, the original author(s), title, publication source (PeerJ) and either DOI or URL of the article must be cited.
- Cite this article
- 2025. Biomarkers of mitochondrial permeability transition-driven necrosis in the regulation of ulcerative colitis. PeerJ 13:e20345 https://doi.org/10.7717/peerj.20345
Abstract
Background
Ulcerative colitis (UC) is a gastrointestinal condition characterized by chronic intestinal inflammation and damage to the mucosal barrier, with regulated cell death (RCD) playing a pivotal role in its pathogenesis. Among the various forms of RCD, mitochondrial permeability transition-driven necrosis (MPTDN) has not been thoroughly investigated in relation to UC in the current literature.
Objective
The objective of this study was to identify genes associated with MPTDN that are relevant to UC and to explore their potential implications in the disease process.
Methods
Data were obtained from the Gene Expression Omnibus (GEO) database. Differential expression analysis and weighted gene co-expression network analysis (WGCNA) were utilized to identify differentially expressed MPTD-related genes (MPTDEGs). Machine learning techniques, including Least Absolute Shrinkage and Selection Operator (LASSO), Support Vector Machine-Recursive Feature Elimination (SVM-RFE), and Random Forest (RF), were employed to isolate key hub genes. The diagnostic potential of these genes was evaluated through receiver operating characteristic (ROC) curve analysis, and their expression was validated using an external dataset. Additionally, immunoinfiltration analysis was conducted to investigate the relationship between differentially expressed immune cells and the identified diagnostic genes. The correlation between gene expression and response to anti-TNF therapy was also assessed. Finally, the differential expression of these genes was confirmed in a mouse model of UC induced by 2.5% dextran sulfate sodium (DSS).
Results
A total of six MPTDEGs were identified. The genes CASP1 and CASP4, which were identified through machine learning algorithms, exhibited strong diagnostic performance, with area under the curve (AUC) values exceeding 0.7, indicating the effectiveness of the model. Immunoinfiltration analysis demonstrated a significant correlation between the expression of CASP1 and CASP4 and the presence of macrophages and neutrophils. Importantly, low expression levels of CASP1 were associated with a favorable response to infliximab treatment. Furthermore, the expression levels of CASP1 and CASP4 were significantly increased in UC mouse models (p < 0.05).
Conclusions
The MPTDN-related genes CASP1 and CASP4 have been identified as potential biomarkers for the diagnosis of UC and are associated with abnormal immune cell infiltration in UC patients. Additionally, CASP1 may serve as a predictor of sensitivity to infliximab therapy.
Introduction
Ulcerative colitis (UC) is a chronic and specific variant of inflammatory bowel disease (IBD), characterized by persistent mucosal inflammation. Clinical manifestations include bloody diarrhea, abdominal pain, and intestinal shortening (Ungaro et al., 2017). Historically, UC was primarily observed in developed Western countries; however, since 1990, there has been a significant rise in incidence in newly industrialized regions, including parts of Asia, Africa, and South America. Projections suggest that the prevalence of UC may increase fourfold by 2035 (Ng et al., 2017). It is estimated that by 2023, around 5 million individuals in Asia will be affected by this condition. Patients with UC face a lifelong risk of disease recurrence and demonstrate a markedly increased incidence of colorectal cancer. Over the past two decades, UC has imposed a considerable economic burden on global healthcare systems. The clinical effectiveness of standard pharmacological treatments, such as aminosalicylates, is limited, with response rates ranging from 30% to 50%, often necessitating total proctocolectomy with ileal pouch-anal anastomosis (IPAA) in more severe cases (Ma et al., 2024). Therefore, there is an urgent need to identify more accurate biomarkers for predicting disease prognosis and to develop innovative therapeutic agents.
The pathogenesis of UC remains incompletely understood and is associated with dysregulated immune responses, impaired intestinal barrier function, and gut microbiota disturbances. Emerging evidence also suggests the involvement of the melanocortin system in UC pathology, with melanocortin receptor 3 (MC3R) and melanocortin receptor 5 (MC5R) closely correlated to disease activity (Gravina et al., 2023, 2024). Notably, mitochondrial dysfunction has recently been recognized as a major contributor to UC development. Imbalanced mitochondrial dynamics like fission or fusion abnormalities directly participate in damage to the intestinal epithelial barrier (Haque et al., 2024), thereby disrupting the critical dynamic balance between apoptosis and regeneration that a well-functioning gastrointestinal tract must maintain. Under pathological conditions such as infection, trauma, oxidative stress, and hypoxia, cells may undergo accidental cell death (ACD) or regulated cell death (RCD). Aberrant activation of RCD can trigger sustained inflammatory responses, disrupt epithelial proliferation and differentiation, and compromise barrier integrity. In recent years, PANoptosis—an emerging concept highlighting the simultaneous activation of pyroptosis, apoptosis, and necroptosis within the same cellular environment—has gained widespread attention, forming a complex inflammatory cell death signaling network (Lu, Li & Ye, 2024). In IBD, multiple cell death pathways may coexist and mutually amplify, collectively driving disease progression. Among these, mitochondrial permeability transition-driven necrosis (MPTDN), a specific form of RCD triggered by calcium dyshomeostasis and severe oxidative stress, is closely associated with the collapse of mitochondrial membrane potential (Newton et al., 2024). Given that mitochondria serve as a hub for multiple cell death pathways, their dysfunction may act as a central trigger for PANoptosis. Genome-wide association studies have revealed that approximately 5% of IBD risk loci are closely related to mitochondrial function (Liu et al., 2015). Furthermore, UC patients exhibit elevated levels of reactive oxygen species (ROS) and oxidative stress in inflamed colon regions. Antioxidant agents or dietary supplements have been shown to alleviate symptoms (Papada et al., 2018). Whereas conversely, knockout of MPTDN-associated proteins such as voltage-dependent anion channel 1 (VDAC1) exacerbates mitochondrial damage and leads to more severe colitis symptoms (Verma et al., 2022). It is noteworthy that regulating proton-coupled electron transfer (PCET) to eliminate free radicals—exemplified by the mechanism of mesalazine, a commonly used anti-TNF therapeutic agent in UC—can mitigate inflammation by improving mitochondrial function (Parigi et al., 2023). Despite the above evidence underscoring the central role of mitochondrial regulation in UC, the mechanistic underpinnings of MPTDN remain largely unexplored. This study aims to systematically identify key targets associated with MPTDN, providing new insights into the pathogenesis of UC.
In this investigation, we conducted a screening of differentially expressed genes (DEGs) between control and UC samples, and concentrated on the highly correlated modules identified through Weighted Gene Co-expression Network Analysis (WGCNA) within the dataset. We subsequently intersected these findings with the genes associated with MPTDN, resulting in the identification of MPTDN-related differential genes (MPTDEGs). Further refinement of these genes was achieved using least absolute shrinkage and selection operator (LASSO), support vector machine-recursive feature elimination (SVM-RFE), and Random Forest (RF) algorithms, ultimately leading to the identification of biomarkers. Additionally, we employed CIBERSORT for correlation analysis to elucidate the relationship between disease-associated immune cells and the identified genes. To explore the association between gene expression and anti-TNF therapy, we conducted a drug sensitivity analysis to assess gene alterations following treatment with infliximab (IFX). Finally, we validated the identified genes in a mouse model of UC induced by 2.5% dextran sulfate sodium (DSS) in drinking water. These results offer novel insights into the underlying mechanisms, diagnostic approaches, and therapeutic strategies related to the UC.
Materials and Methods
Data collection and preprocessing
Gene expression profiles and corresponding clinical data from UC patients were retrieved from the Gene Expression Omnibus (GEO) database (https://www.ncbi.nlm.nih.gov/geo/). The inclusion criteria were: (1) human (Homo sapiens) samples; (2) at least 10 healthy controls and 10 UC patients; and (3) colon biopsy specimens. (4) Clinical phenotype: It has detailed clinical metadata (e.g., disease activity, initial treatment status). Detailed dataset characteristics are summarized in Table 1.
| GEO datasets | Platform | Samples source | Normal vs UC | Type |
|---|---|---|---|---|
| GSE87466 | GPL13158 | Colon tissue | 21 vs 87 | DEGs, Machine learning, Immunoinfiltration analysis |
| GSE75214 | GPL6244 | Colon tissue | 11 vs 97 | WGCNA, Immunoinfiltration analysis |
| GSE206285 | GPL15798 | Colon tissue | 18 vs 550 | Validation |
| GSE16879 | GPL570 | Colon tissue | 12 vs 24 | Drug sensitivity analysis |
Differential expression analysis
All the datasets were analyzed separately for their primary analyses (e.g., DEG identification within each cohort) to avoid introducing biases from inter-dataset batch effects. The GSE7466 dataset underwent gene symbol standardization and removal of invalid probes. For genes targeted by multiple probes, expression values were averaged. Differentially expressed genes (DEGs) between UC and control samples were identified using the “limma” package (adj.P.Val < 0.05, |log2FC| ≥ 1.5). Expression patterns were visualized via heatmaps and volcano plots using “ggplot2” and “pheatmap” in R.
Functional enrichment analysis
Gene Ontology (GO) and KEGG pathway analyses were performed for biological processes (BP), molecular functions (MF), and cellular components (CC). Significantly enriched terms (P < 0.05) were visualized using bar and bubble plots (“ggplot2”), highlighting functional categories and pathways associated with DEGs.
Construction of co-expression network and identification of key module
WGCNA was applied to the GSE75214 dataset to identify co-expressed gene modules associated with UC. The trait data for the WGCNA analysis was encoded as a binary variable: Normal samples were assigned a value of ‘0’ and UC samples were assigned a value of ‘1’. Low-expressed genes (mean expression < 0.5) were filtered using “goodSamplesGenes.” The optimal soft threshold (β) was determined via “pickSoftThreshold.” Hierarchical clustering (minimum module size = 30, merge cut height = 0.25) identified modules, and module eigengenes (MEs) were calculated. UC-associated modules were selected based on Pearson correlation (|r| > 0.5, P < 0.05).
Identification of DEGs associated with MPTDN
MPTDN-related genes were curated from literature (Liu et al., 2023). A phylogenetic tree was constructed to assess evolutionary relationships. DEGs from UC vs controls and WGCNA module genes were intersected with the MPTDN gene set. Candidate genes were evaluated via box plots comparing expression levels in UC and control samples.
Identification of MPTDN-related diagnostic biomarkers via machine learning
To ensure the robustness and reliability of the identified hub genes, we employed three distinct machine learning algorithms (LASSO, SVM-RFE, and Random Forest) in parallel. This multi-method approach helps mitigate the inherent biases of any single algorithm and increases confidence in the consensus feature genes selected by all three methods. (1) LASSO regression (via “glmnet” package) for feature selection with 10-fold cross-validation; (2) SVM-RFE with radial basis kernel (5-fold CV, average false positive rate < 0.3); and (3) Random Forest (“randomForest” package; MeanDecreaseGini > 2 threshold). Intersection of the three algorithms’ outputs yielded robust biomarkers, with diagnostic performance evaluated by ROC curves (“pROC” package; AUC > 0.7 considered clinically significant). Candidate genes were validated in GSE87466 (training) and GSE206285 (validation) datasets.
Immune cell infiltration analysis
The CIBERSORT deconvolution algorithm (“CIBERSORT” R package) quantified 22 immune cell subtypes in UC and control samples. Comparative analyses included: (1) Stacked bar plots of cellular proportions; (2) Violin plots for infiltration level comparisons (Wilcoxon test); and (3) Spearman correlation between biomarker expression and immune cell abundance (|r| > 0.3, p < 0.05).
Construction of the animal model
All animal procedures conducted in this study were approved by the Experimental Animal Ethics Committee of Shanghai University of Traditional Chinese Medicine (Approval No.: 2024-240579). The experiments adhered to established animal ethical standards and protocols. Ten male C57BL/6 wild-type mice aged 6–8 weeks were purchased from Shanghai Slac Laboratory Animal Co., Ltd. (License No.: SCXK(Hu)2017-0005). The mice were housed in an independent barrier system within the animal facilities of Shanghai University of Traditional Chinese Medicine, where environmental conditions were regulated to maintain a temperature of 20–22 °C, humidity levels between 40% and 60%, and a 12-h light-dark cycle. The mice were provided with a standard specific pathogen-free (SPF) diet and drinking water. Using a random number table, the mice were divided into two groups: a normal group and a model group, with five mice assigned to each cage. Following a one-week acclimatization period, based on the results of our preliminary experiments, the model group was administered 2.5% dextran sulfate sodium (DSS) (MP Biomedicals, 36,000–50,000 kDa) for seven consecutive days to induce the acute ulcerative colitis model, while the normal group continued on a standard diet and water. Throughout the experiment, parameters such as body weight, presence of bloody stools, and stool characteristics were monitored daily, and the Disease Activity Index (DAI) score was calculated (de Oliveira et al., 2023). Blood samples were collected via orbital enucleation after anesthesia with isoflurane (3% for induction, 1.5% for maintenance). To obtain the entire colon from the cecum to the rectum, the mice were euthanized by cervical dislocation under deep isoflurane anesthesia, and colon length was measured using a ruler. After rinsing with ice-cold physiological saline, a 1-cm segment of colon tissue was excised from the distal end (junction of the colon and rectum), fixed in 4% paraformaldehyde (PFA), and subsequently stained. The remaining tissue sections were preserved at −80 °C for future analysis.
Hematoxylin-eosin staining
Colon tissues were fixed in 4% paraformaldehyde (PFA) for 24 h, dehydrated through graded alcohols, cleared with xylene, and embedded in paraffin. 4-μm-thick sections were cut, dried, and stored at 37 °C. Hematoxylin-eosin (HE) staining involved heat-induced antigen retrieval, rehydration, staining with hematoxylin and eosin, and mounting with resin. Histopathological changes were examined via light microscopy.
Reverse transcription quantitative real-time PCR analysis
Total RNA was extracted from colon tissues using Trizol reagent (Invitrogen, Waltham, MA, USA). RNA was reverse-transcribed into cDNA using an ezbio Reverse Transcription Kit (ezbioscience, San Diego, CA, USA). SYBR Green-based reverse transcription quantitative real-time PCR (RT-qPCR) (ezbioscience, San Diego, CA, USA) quantified mRNA expression, with GAPDH as the reference gene. Amplification conditions: pre-denaturation at 95 °C for 30 s, followed by 40 cycles of 95 °C for 5 s (denaturation) and 60 °C for 30 s (annealing). Primer sequences are listed in Supplemental Information 3: Primer Sequences.
Immunohistochemistry and quantitative analysis
After dissection, mouse colon tissues were fixed in 4% paraformaldehyde for 24 h, followed by dehydration, paraffin embedding, and sectioning. The sections were stored at room temperature until use. For immunohistochemical staining, the sections were deparaffinized with xylene and rehydrated through a graded ethanol series. Antigen retrieval was performed using citrate antigen retrieval buffer (pH 6.0). Endogenous peroxidase activity was quenched by treatment with 3% H2O2. The sections were then blocked with 3% BSA at room temperature. Subsequently, the sections were incubated sequentially with primary antibody (CASP1, Servicebio, 1:500; CASP11, Servicebio, Beijing, China), secondary antibody (Hrp-labeled goat anti-rabbit/mouse secondary antibody, proteintech, 1:500), and treated with DAB chromogenic solution for signal development. Counterstaining was carried out with hematoxylin. Finally, the sections were dehydrated, mounted, and examined under a microscope.
Statistical analysis
Data processing and analysis were performed using GraphPad Prism and R software (version 4.1.0). For comparisons between two groups involving continuous variables, Student’s t-test was applied for normally distributed data, with results expressed as mean ± standard deviation (M ± SD). Nonparametric tests were used for data that did not follow a normal distribution. To account for multiple comparisons, the Bonferroni correction was applied where appropriate. The *p* ROC package in R was used for ROC curve analysis, and diagnostic performance was evaluated by calculating the area under the curve (AUC). Spearman correlation analysis was conducted to assess associations between different genes. For the differential expression analysis, the p-values were adjusted for multiple comparisons using the Benjamini-Hochberg False Discovery Rate (FDR) method. All reported *p*-values are two-sided, and a threshold of *p* < 0.05 was considered statistically significant.
Result
Identification and functional exploration of DEGs in UC
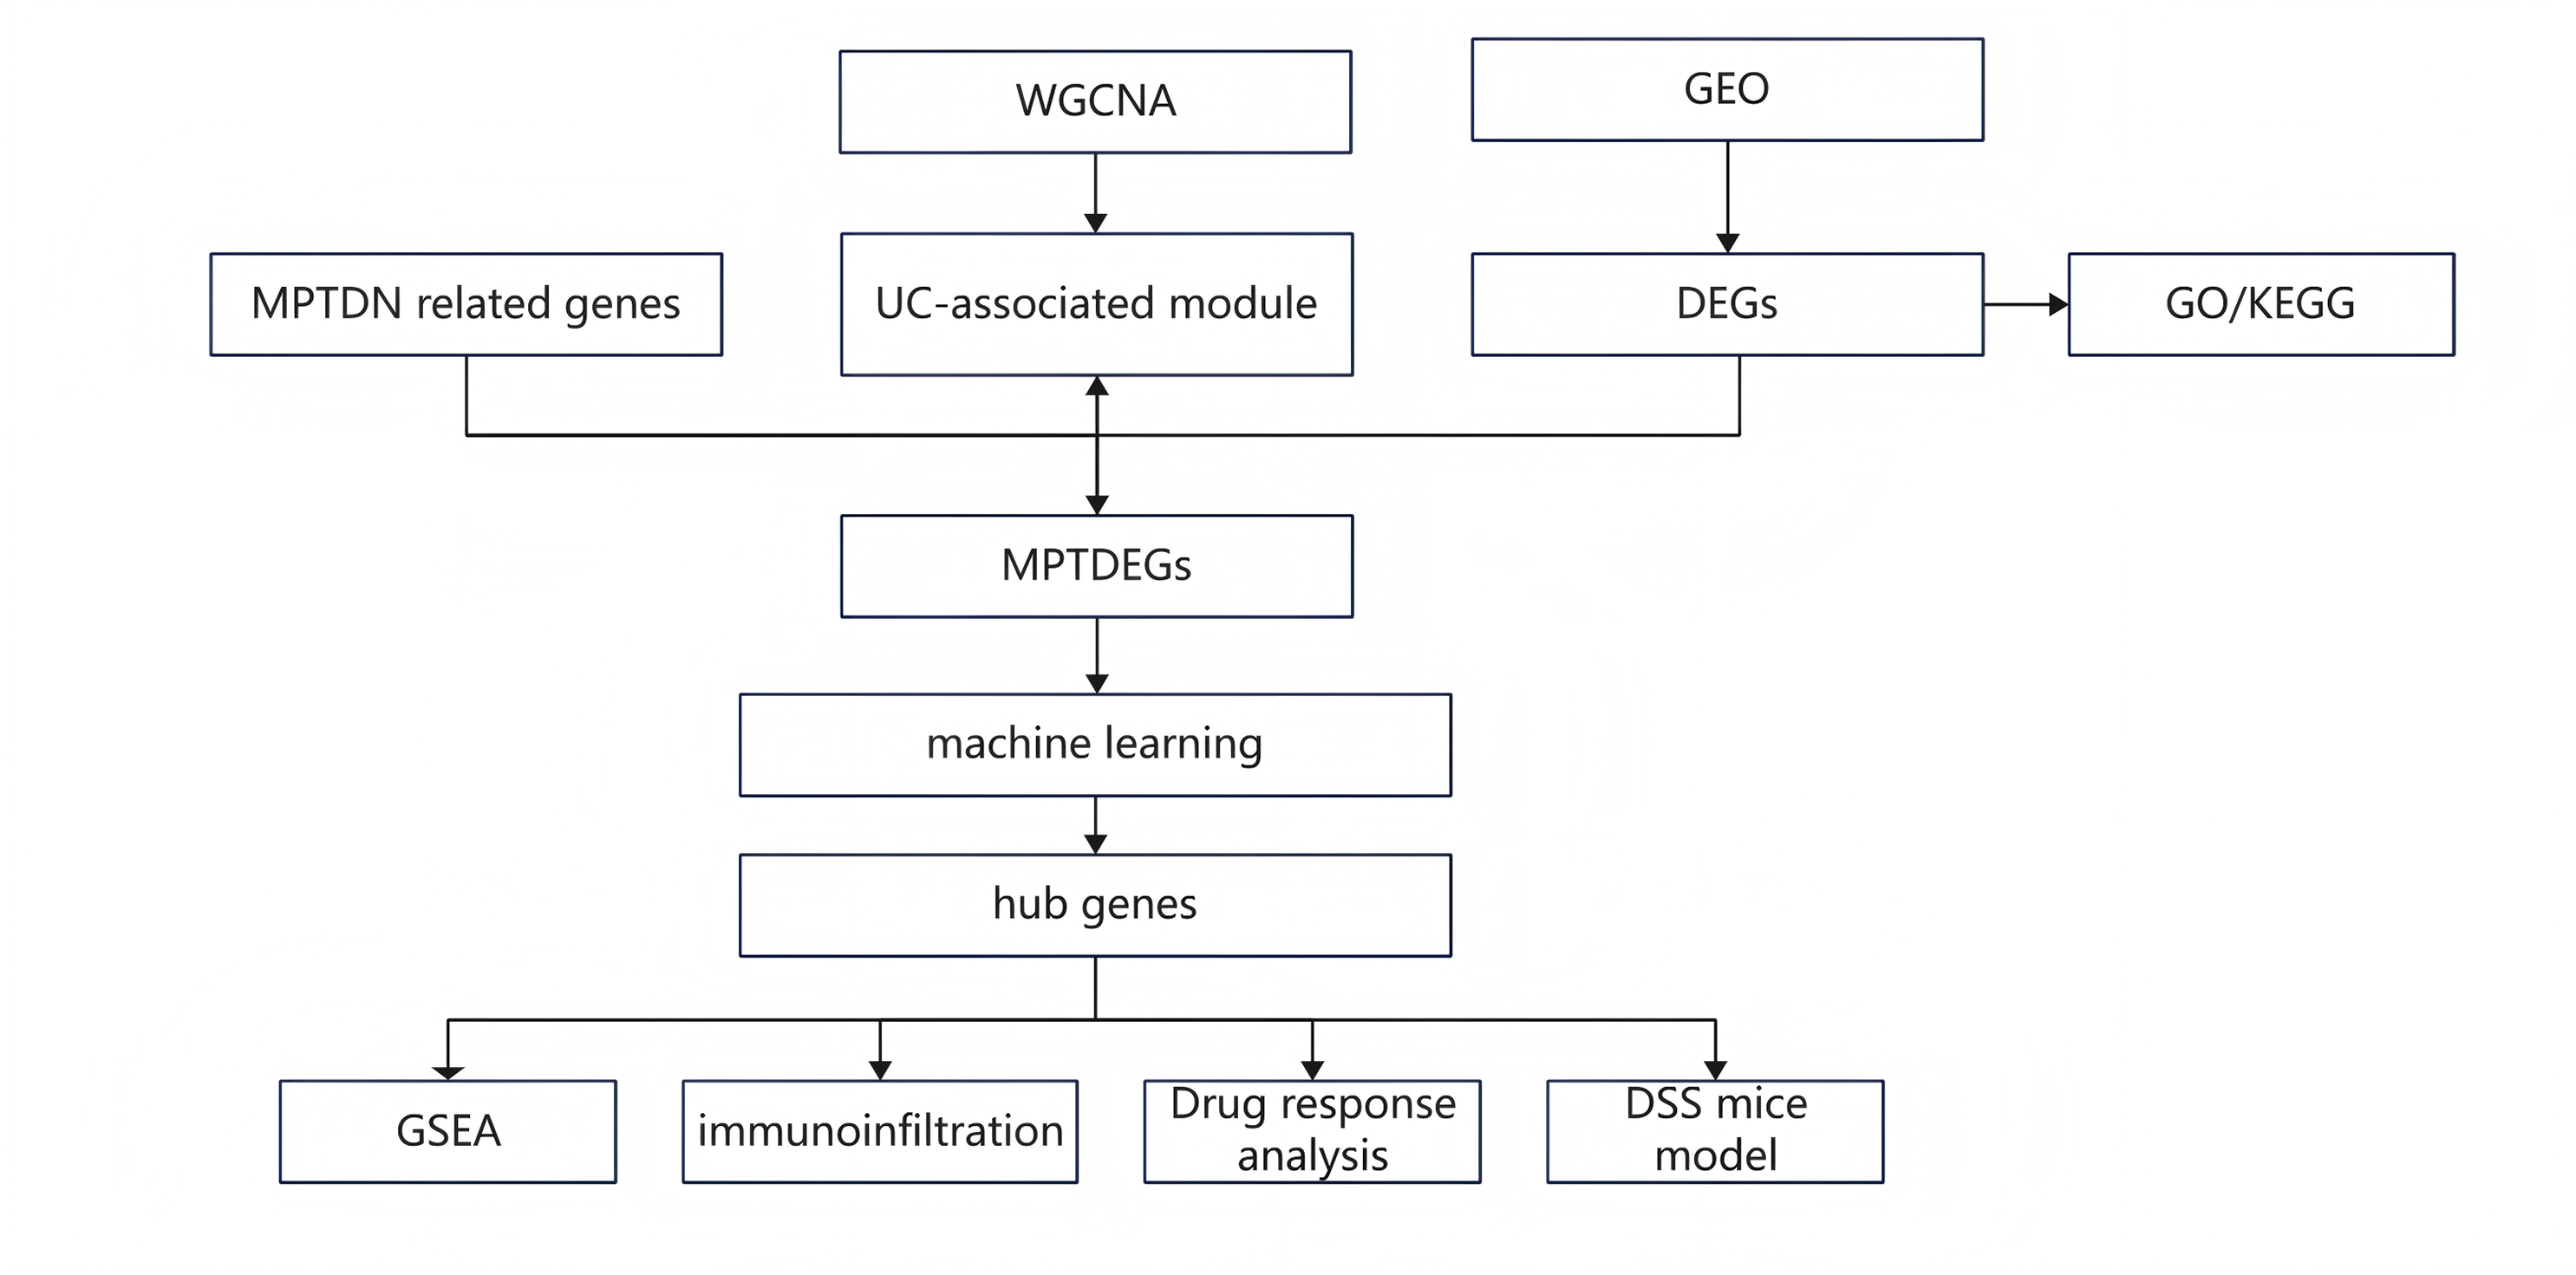
The research flowchart pertinent to this study is illustrated in Fig. 1. The GSE87466 dataset included transcriptomic data from 108 subjects, including 21 normal colon tissues and 87 individual colon tissues diagnosed with UC, of which 20,278 genes were employed into analysis. Notable disparities in gene distribution and trends between normal individuals and those with UC were evidenced through principal component analysis (PCA) (Fig. 2A) and heatmap representation (Fig. 2B). A total of 923 DEGs were identified (refer to Fig. 2C), which included 596 genes that were upregulated and 327 genes that were downregulated in the UC samples. Subsequent functional characterization of these DEGs was performed utilizing GO and KEGG analyses. The DEGs associated with UC were predominantly enriched in functions related to the interaction between viral proteins and cytokines, as well as cytokine receptors, Staphylococcus aureus infection, and cytokine-cytokine receptor interactions. In GO enrichment analysis, the BP categories that were notably abundant included the migration and chemotaxis of inflammatory cells, specifically leukocyte migration and the chemotactic response of leukocytes to bacterial-derived molecules. The MF categories that exhibited significant enrichment included interactions at the external side of plasma membranes and collagen-containing cell membranes. Furthermore, the CC categories that were primarily enriched included chemokine receptor binding and chemokine activity.
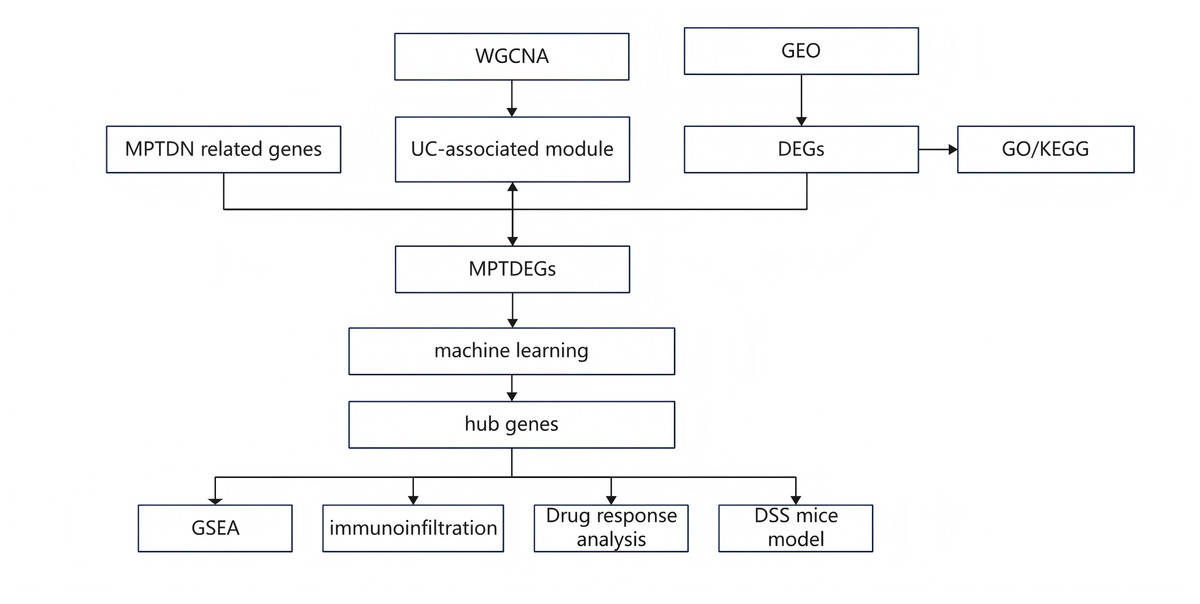
Figure 1: Research design flow chart.
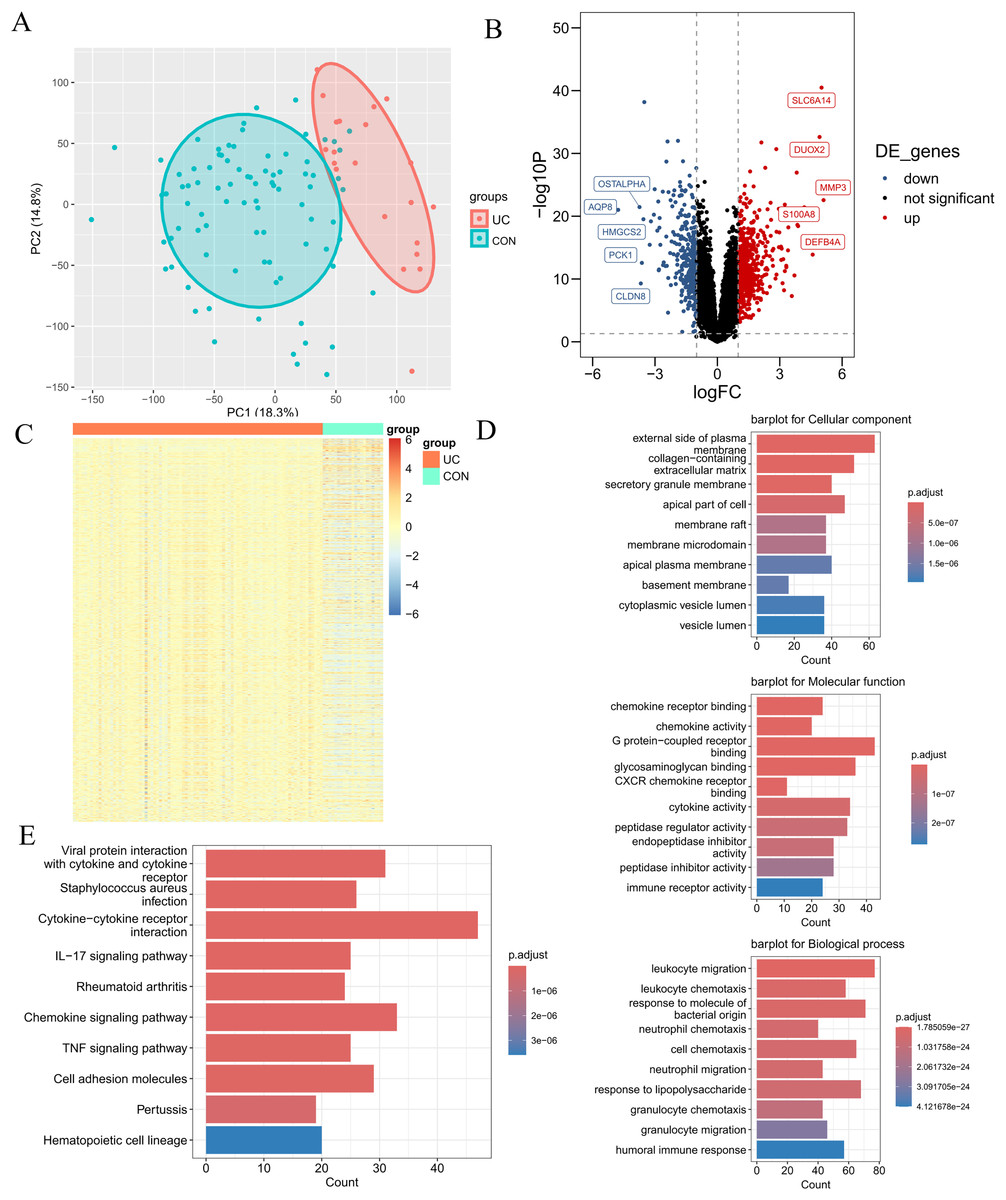
Figure 2: Differential expression analysis.
(A) PCA plot of the normal group and the ulcerative colitis (UC) group. Each point represents a sample. The more convergent the distribution of samples within a group is, the smaller the difference represents. The normal group is within the red circle, and the UC group is within the green circle. The clear boundary between the two circles indicates a relatively large difference between the groups. (B) Volcano plot of differentially expressed genes (DEGs) for the normal group and the UC group. Each point represents a gene. Genes with p < 0.05 and log2FC ≥ 1.5 were selected as differentially expressed genes. Among them, the blue ones are downregulated genes, and the red ones are upregulated genes. (C) Heatmap of DEGs for the normal group and the UC group. (D) Gene ontology enrichment analysis of DEGs (GO). (E) Pathway enrichment analysis of DEGs (KEGG).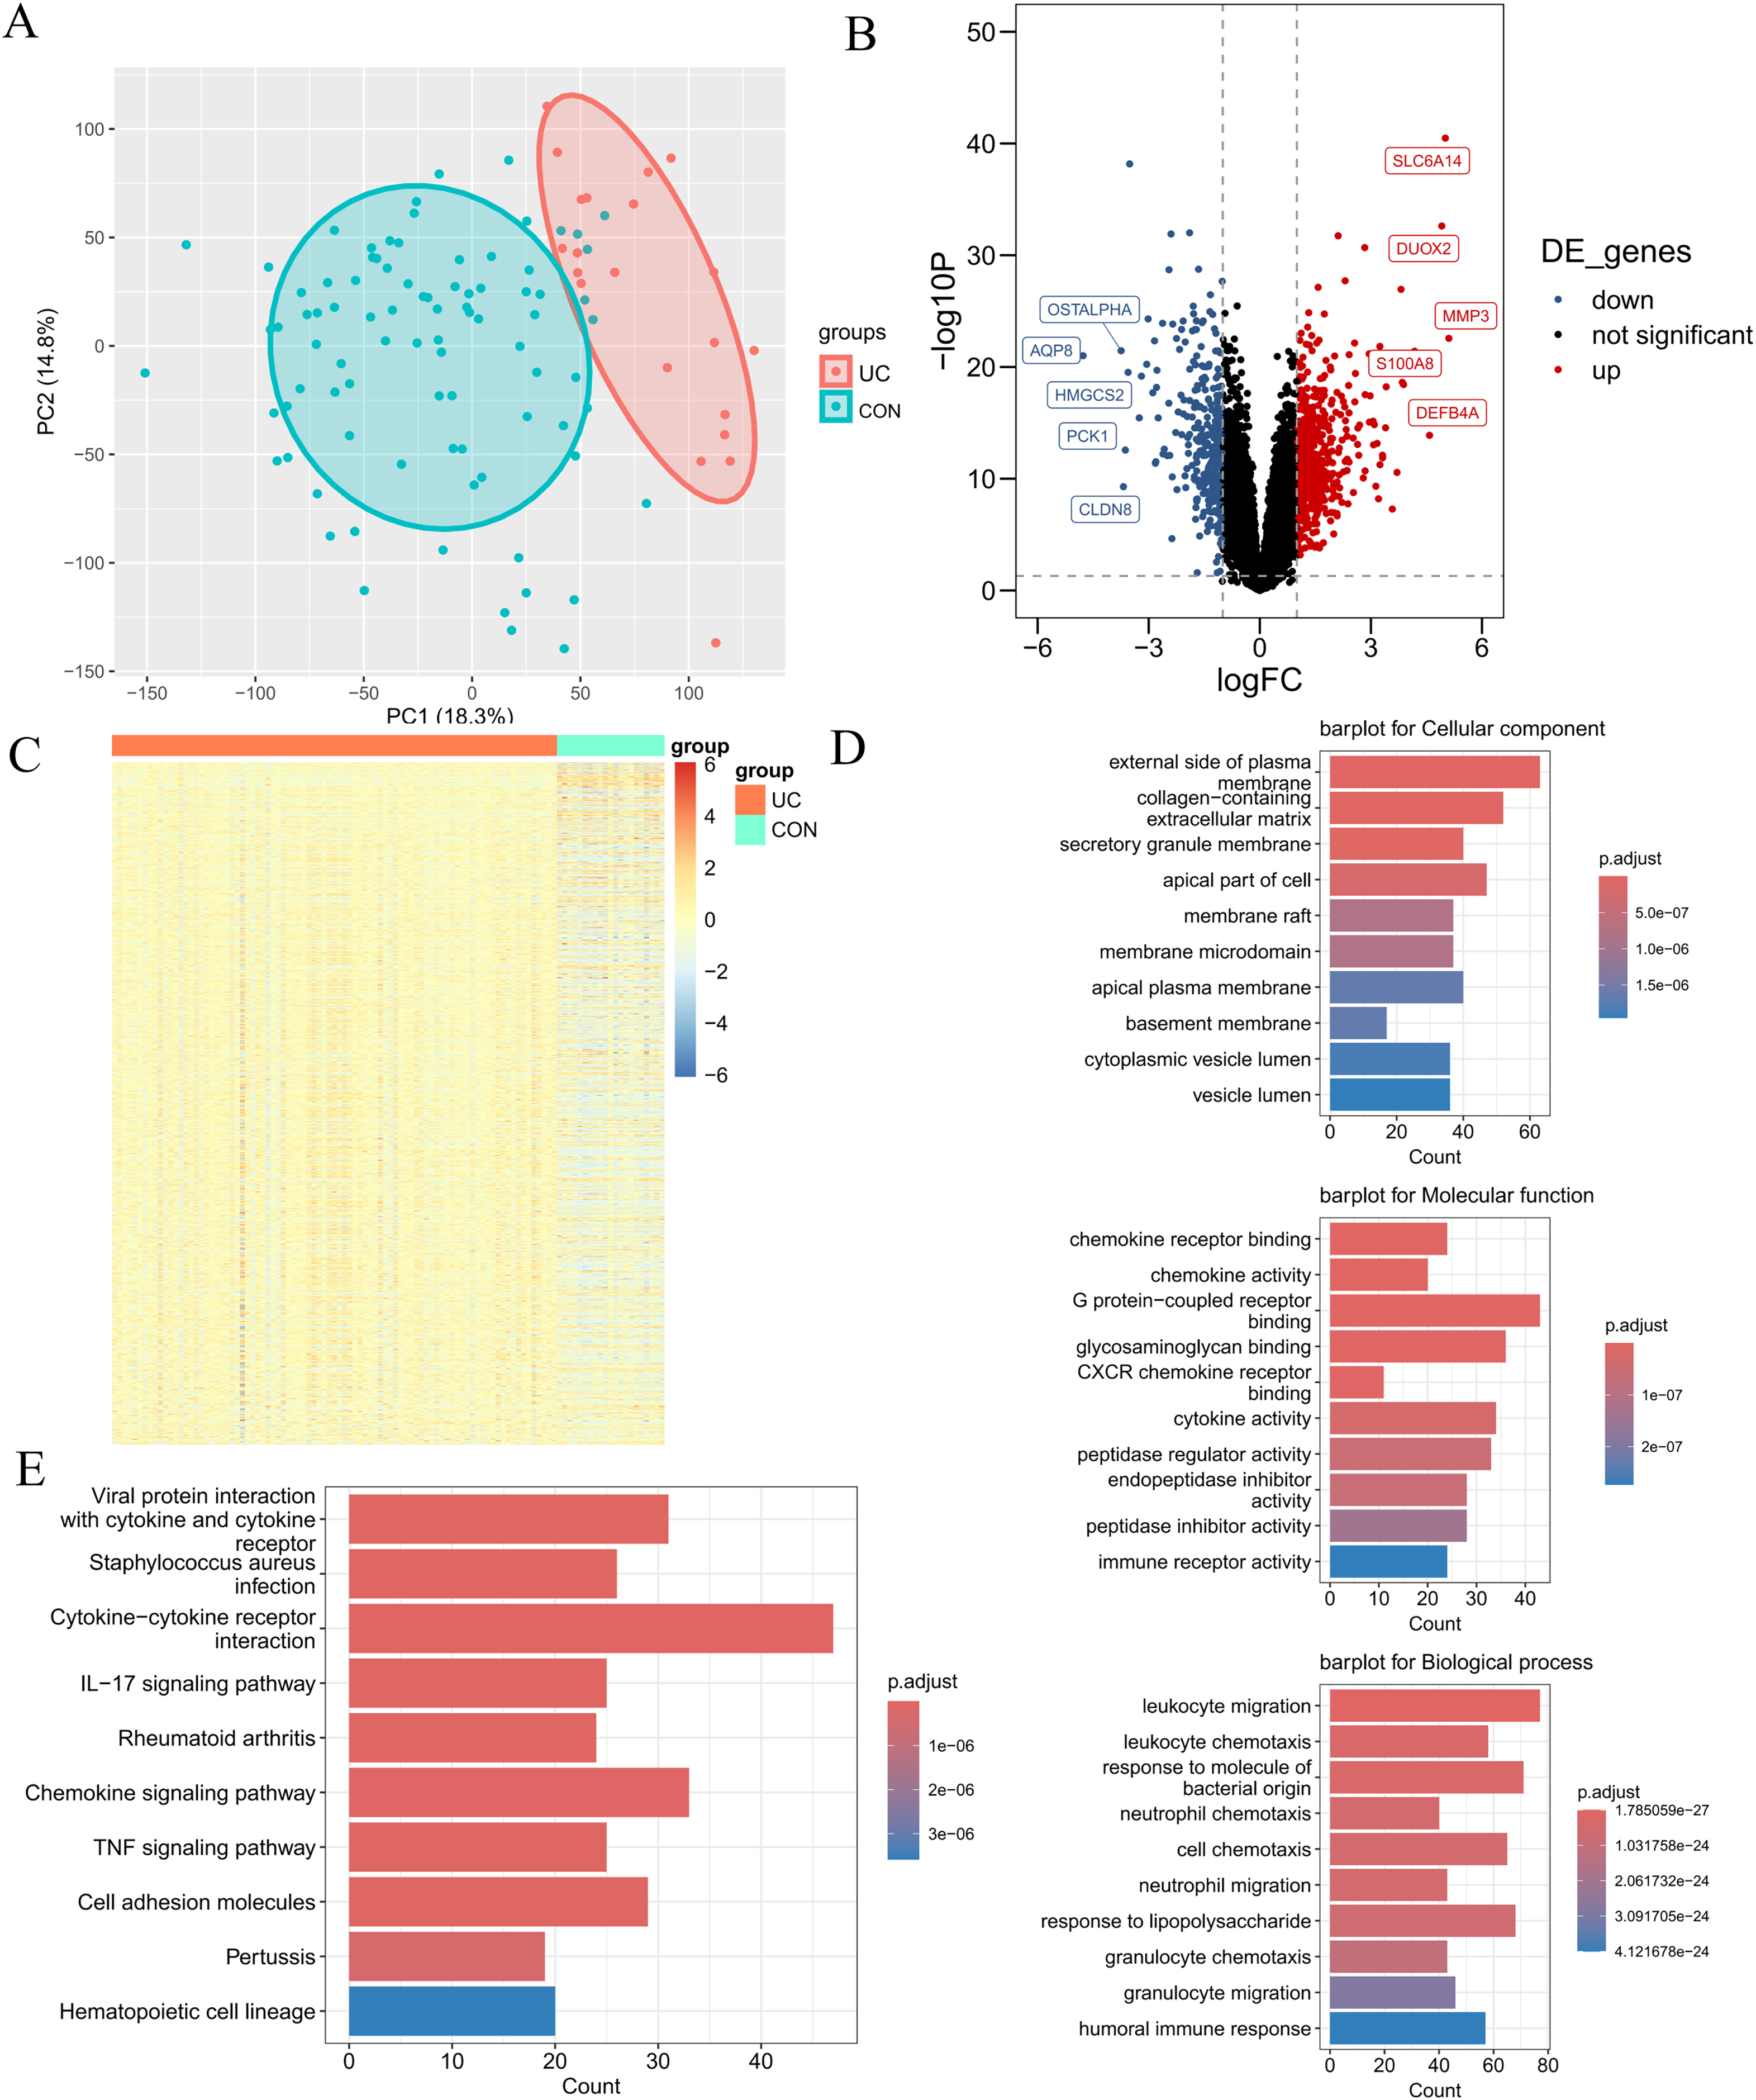
Extraction of module genes associated with UC by WGCNA
The input matrix utilized for WGCNA comprised expression data for 25,294 genes (p < 0.05), which were categorized into 18 distinct gene modules. Notably, the modules exhibiting a strong association and substantial coverage with UC were identified as the brown, sky-blue, and red modules (Fig. 3C). The red module demonstrated the most pronounced positive correlation with UC (cor = −0.21, p = 3.8e−05) and included a total of 378 genes. Conversely, the brown module exhibited the most significant negative correlation with UC (cor = −0.18, p = 3.4e−05) and comprised 522 genes. To identify UC-related DEGs, we integrated the red and brown modules, resulting in a combined module set containing 902 genes. Furthermore, scatter plots illustrating the correlations among the genes within the red and brown modules were generated for analytical purposes.
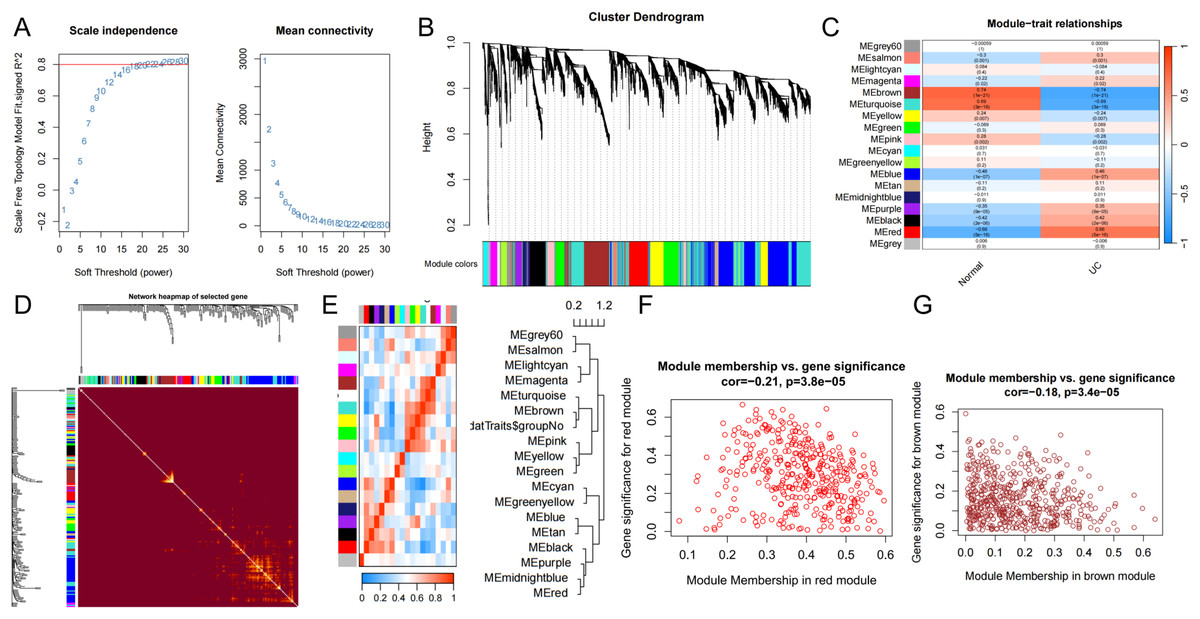
Figure 3: WCGNA analysis.
(A) Soft threshold screening. Topological calculations were performed using soft thresholds ranging from 1 to 30 to determine the optimal soft threshold of 22. (B) Gene module clustering trend. The relationship matrix was transformed into an adjacency matrix using the soft threshold, and then further converted into a topological overlap matrix (TOM). Based on the TOM, the average linkage hierarchical clustering method was utilized to classify the modules, and a total of 18 modules were obtained. (C) Heatmap of the correlation between genes within modules and UC disease characteristics. Among them, the red, sky-blue, and brown modules were significantly associated with the UC phenotype. (D) Weighted co-expression network. (E) Correlation between modules and phenotypes. (F, G) Scatter plots depicting the correlation between gene significance (GS) and module membership (MM) of genes in the red and brown modules.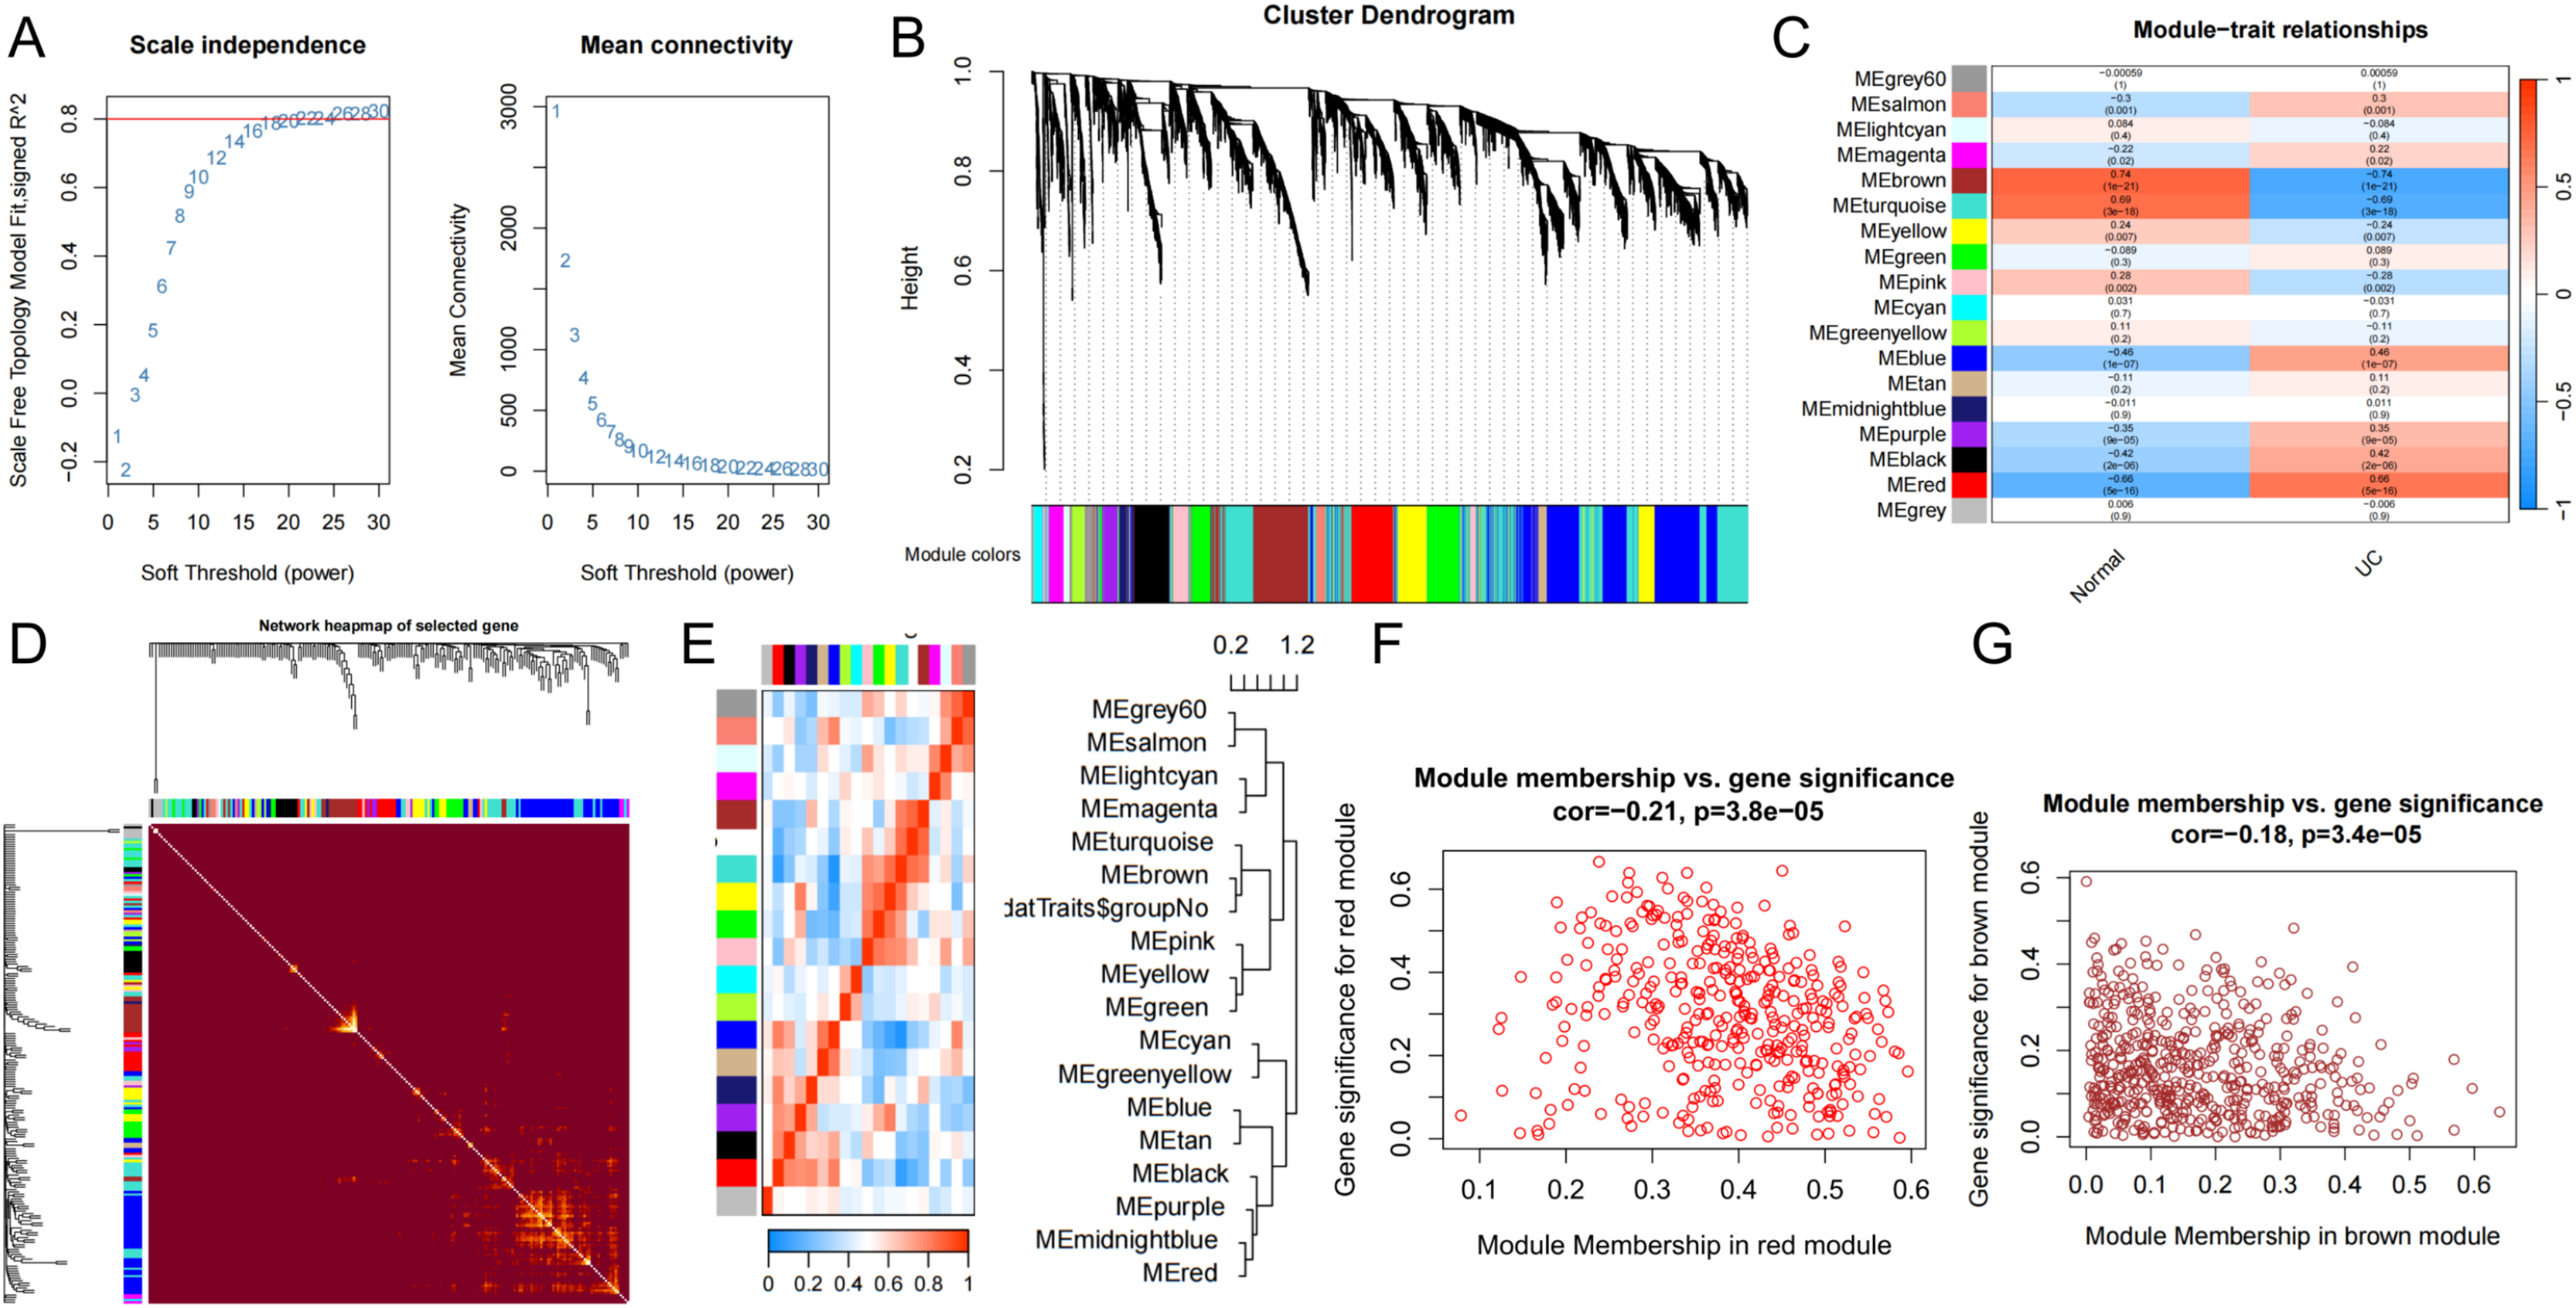
Identification of differentially expressed MPTDEG for UC
The genes analyzed through the volcano plot were organized based on their expression levels. By intersecting DEGs with MPTDN, we identified five significant genes: CASP4, GZMB, BIRC3, CASP1, and STAT1. To determine the genes most closely associated with the disease, WGCNA helped correlate gene expression with disease traits. The intersection of the core modules identified through WGCNA and MPTDN yielded four key genes: CASP10, BIRC3, CASP1, and STAT1. To enhance the comprehensiveness of our gene data, we utilized two distinct gene screening methodologies, resulting in the identification of a total of six characteristic genes (refer to Fig 4B). As illustrated in Fig. 4C, the expression levels of CASP1, CASP4, CASP10, GZMB, BIRC3, and STAT1 were significantly elevated.
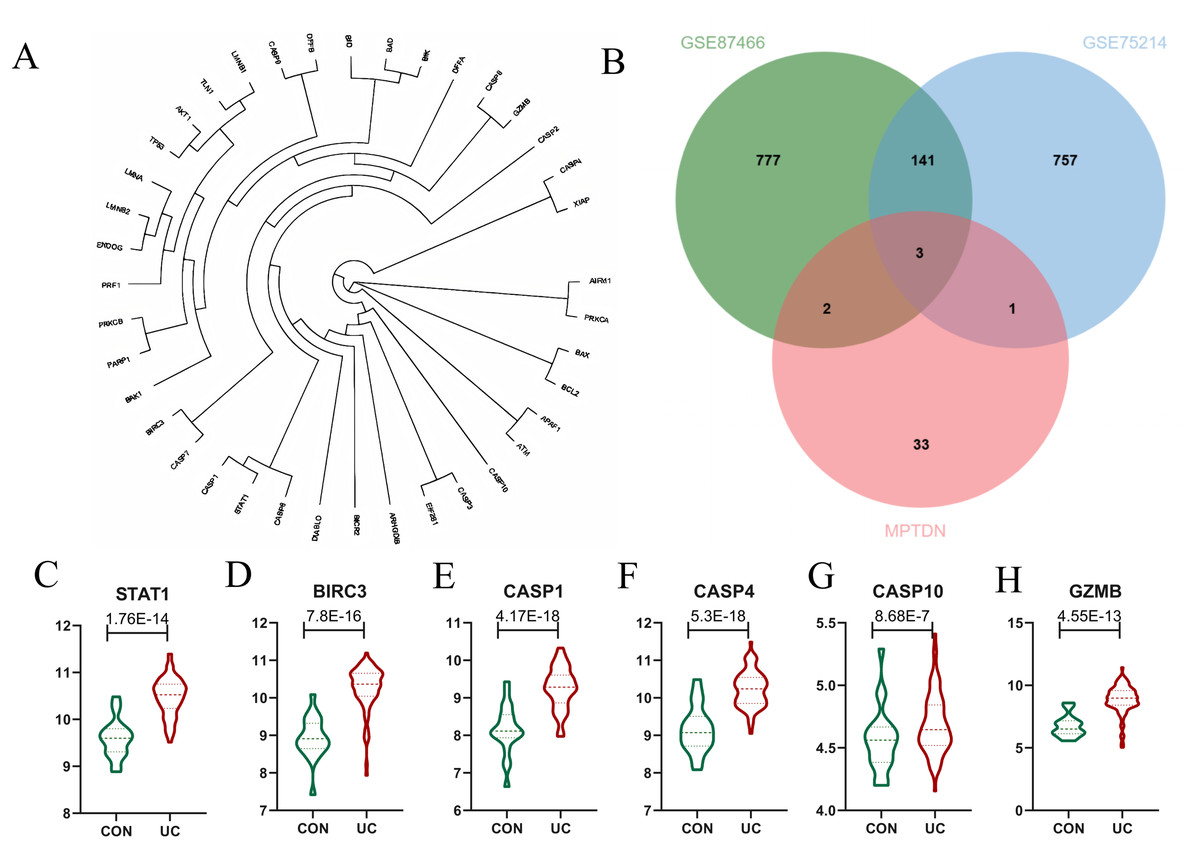
Figure 4: Identification of Differentially Expressed Genes (DEGs) of MPT-Driven Necrosis (MPTDEG).
(A) Phylogenetic tree of 39 MPTDN genes. (B) Sets of DEGs, Weighted Gene Co-expression Network Analysis (WGCNA), and MPT-Driven Necrosis (MPTDN). (C-H) Expression trends of MPTDEGs (STAT1, BIRC3, CASP1, CASP4, CASP10, GZMB) in the Control group and the UC group within the GSE87466 dataset.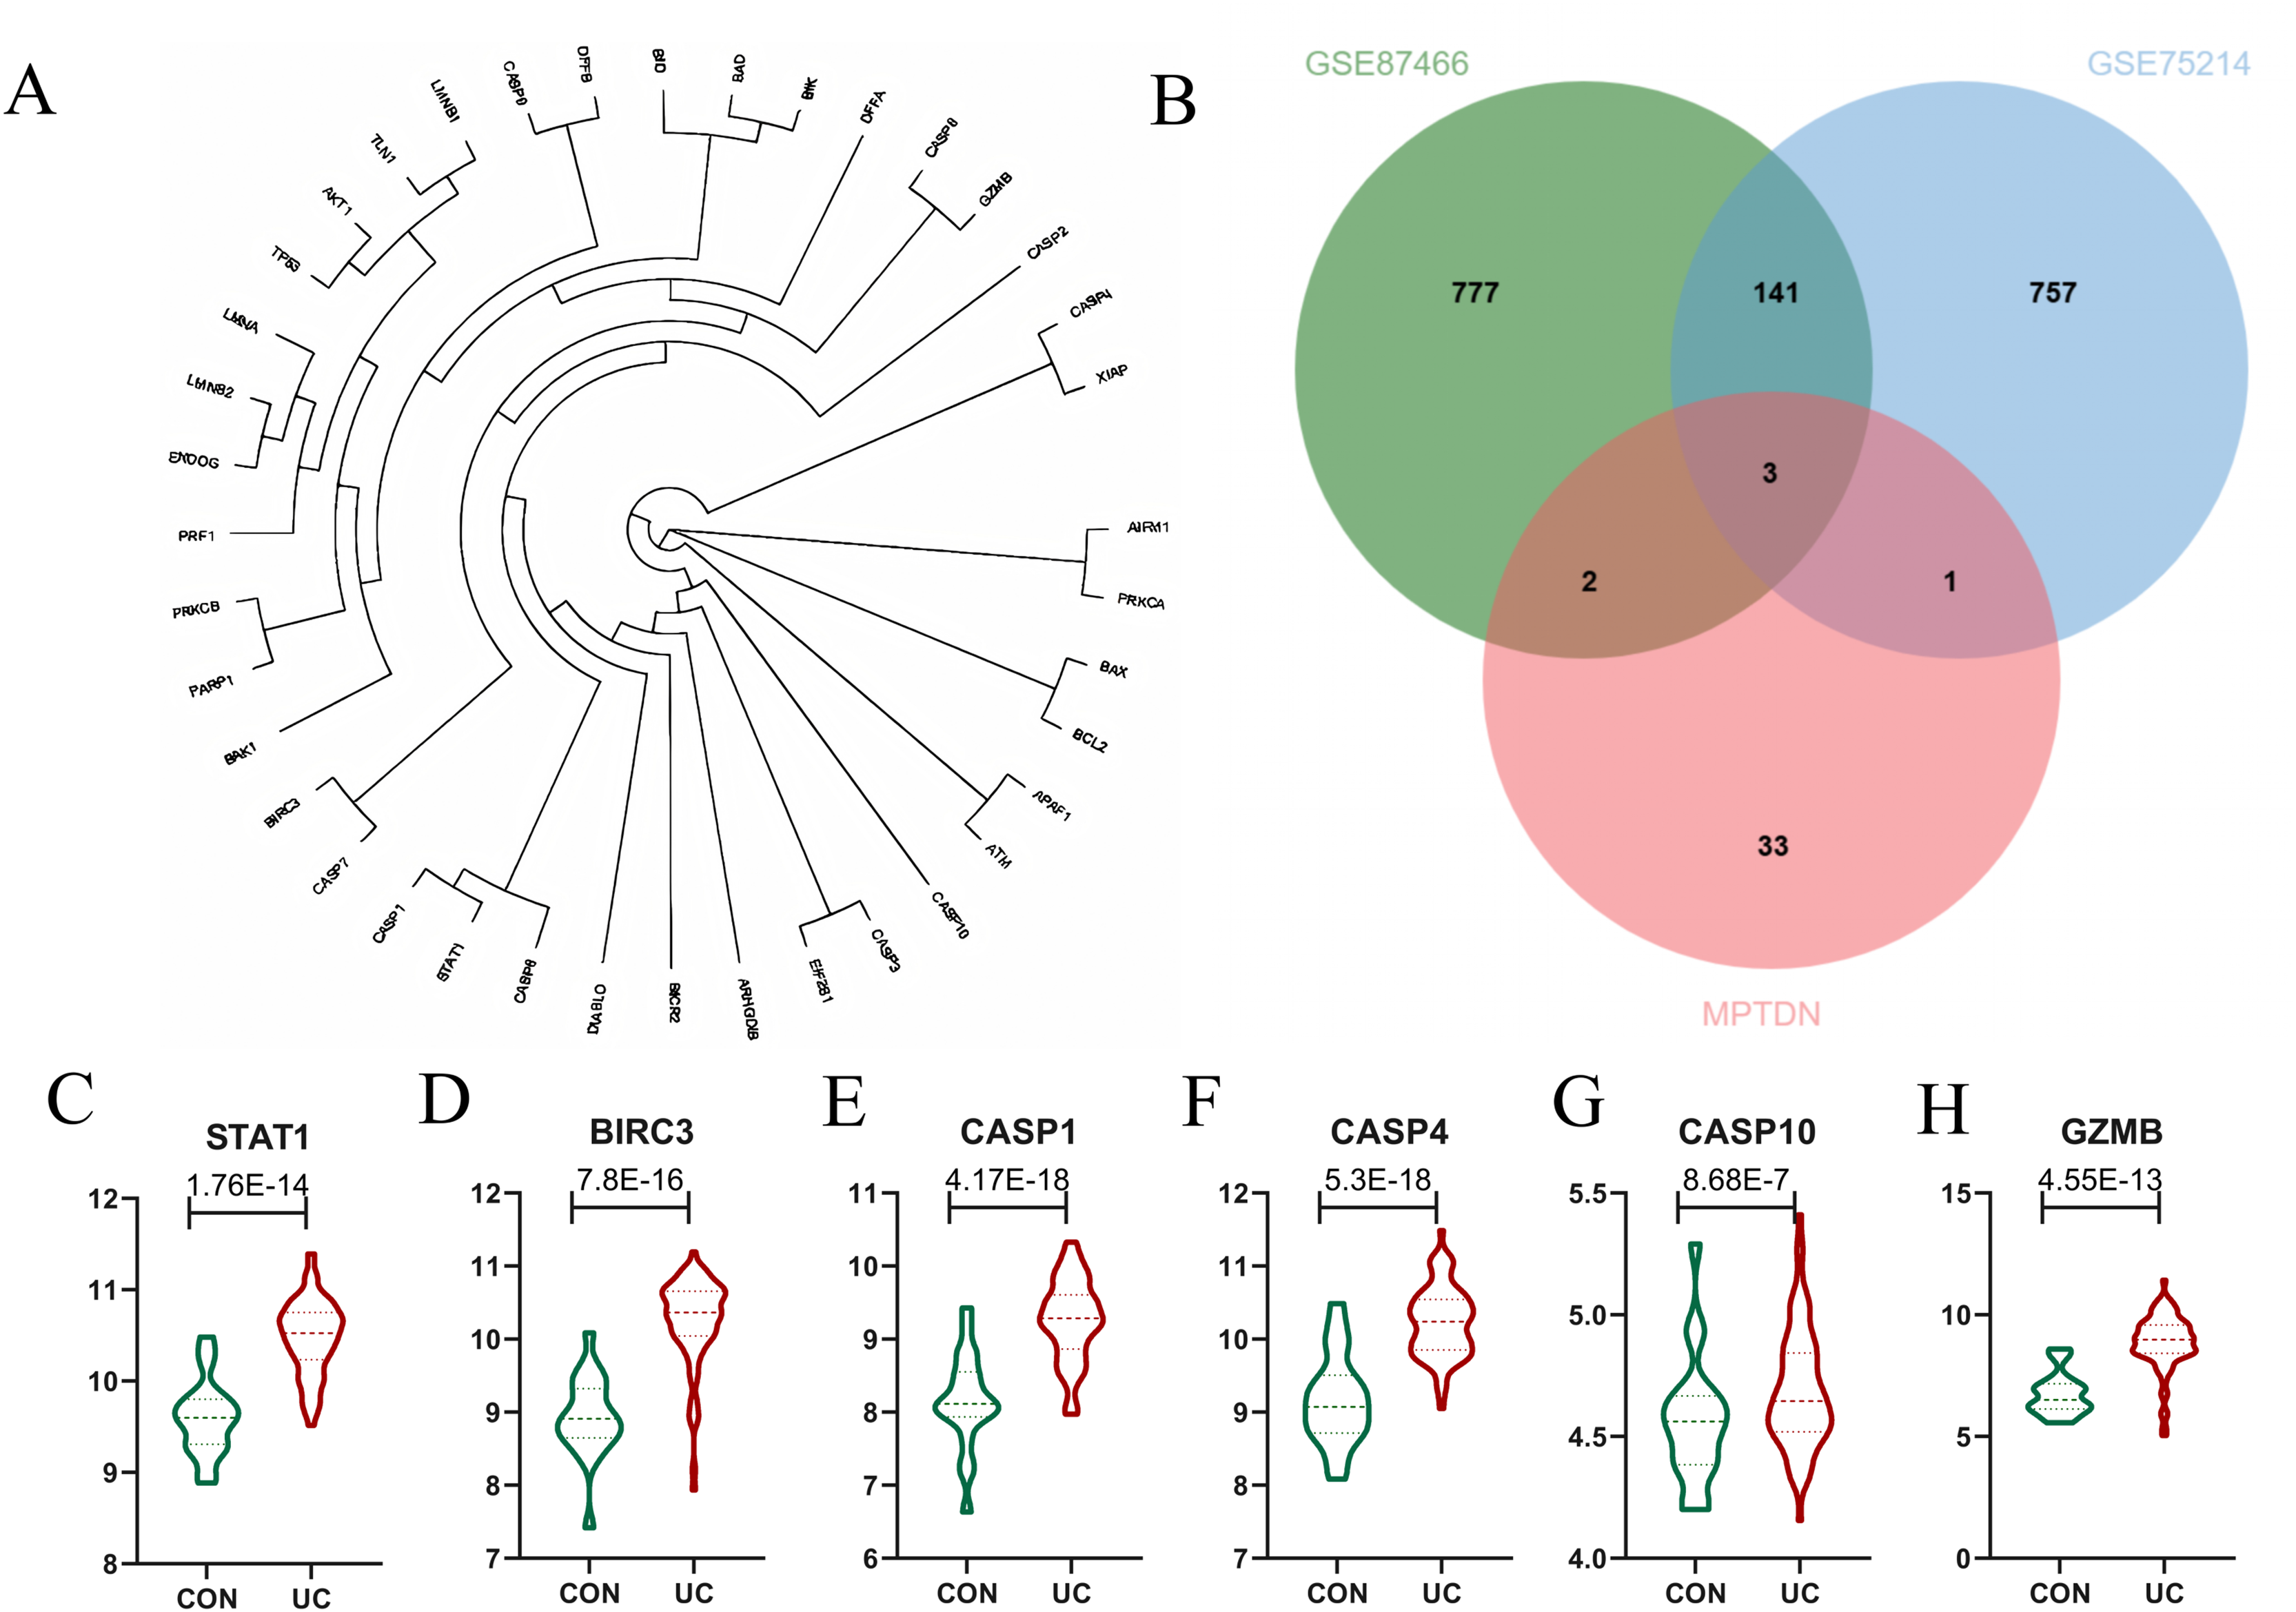
Determination and verification of diagnostic biomarkers
The LASSO, SVM-RFE, and RF methodologies were employed for the optimization of feature genes, as illustrated in Figs. 5A–5F. LASSO regression was chosen for its ability to handle high-dimensional data and select sparse features through L1 regularization. Support Vector Machine Recursive Feature Elimination (SVM-RFE) was utilized to iteratively rank genes based on their contribution to classification margins. Random Forest provided a robust ensemble approach to evaluate feature importance via bootstrap aggregation and impurity reduction. By integrating results from these complementary methods, we aimed to mitigate biases inherent to any single algorithm and enhance confidence in the selected biomarker candidates. These techniques significantly enhanced the UC’s performance through cross-validation. LASSO logistic regression analysis indicated that the optimal lambda.min value, which minimized error, fell between −5 and −6, leading to the identification of five feature genes: CASP1, CASP4, GZMB, BIRC3, and CASP10. In subsequent screening using the SVM algorithm, four feature genes were identified, specifically CASP1, GZMB, CASP4, and BIRC3. The application of the RF algorithm also yielded four feature genes: CASP4, CASP1, STAT1, and BIRC3. The two genes that overlapped between these analyses, CASP1 and CASP4, as depicted in Fig. 5G, were designated as the final biomarkers for UC.
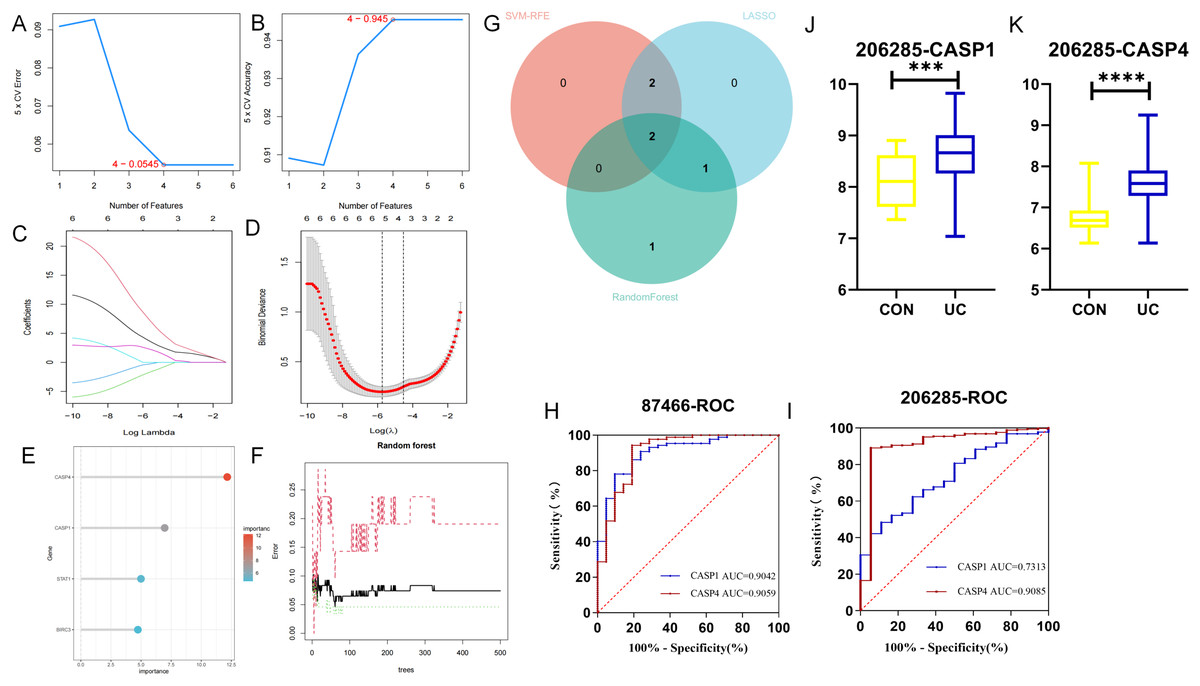
Figure 5: Identification of hub genes by machine learning.
In the GSE87466 dataset, (A, B) the least absolute shrinkage and selection operator (LASSO) model, (C, D) the support vector machine-recursive feature elimination (SVM-RFE) algorithm, and (E, F) the random forest (RF) algorithm were used. To reduce over-co-fitting, the (G) Venn diagram was used to obtain the genes (CASP1, CASP4) commonly diagnosed by the three algorithms. The diagnostic values of CASP1 and CASP4 in the (H) training set GSE87466 and the (I) validation set GSE206285. (J, K) The expression levels of CASP1 and CASP4 in the validation set. ***p < 0.001, ****p < 0.0001.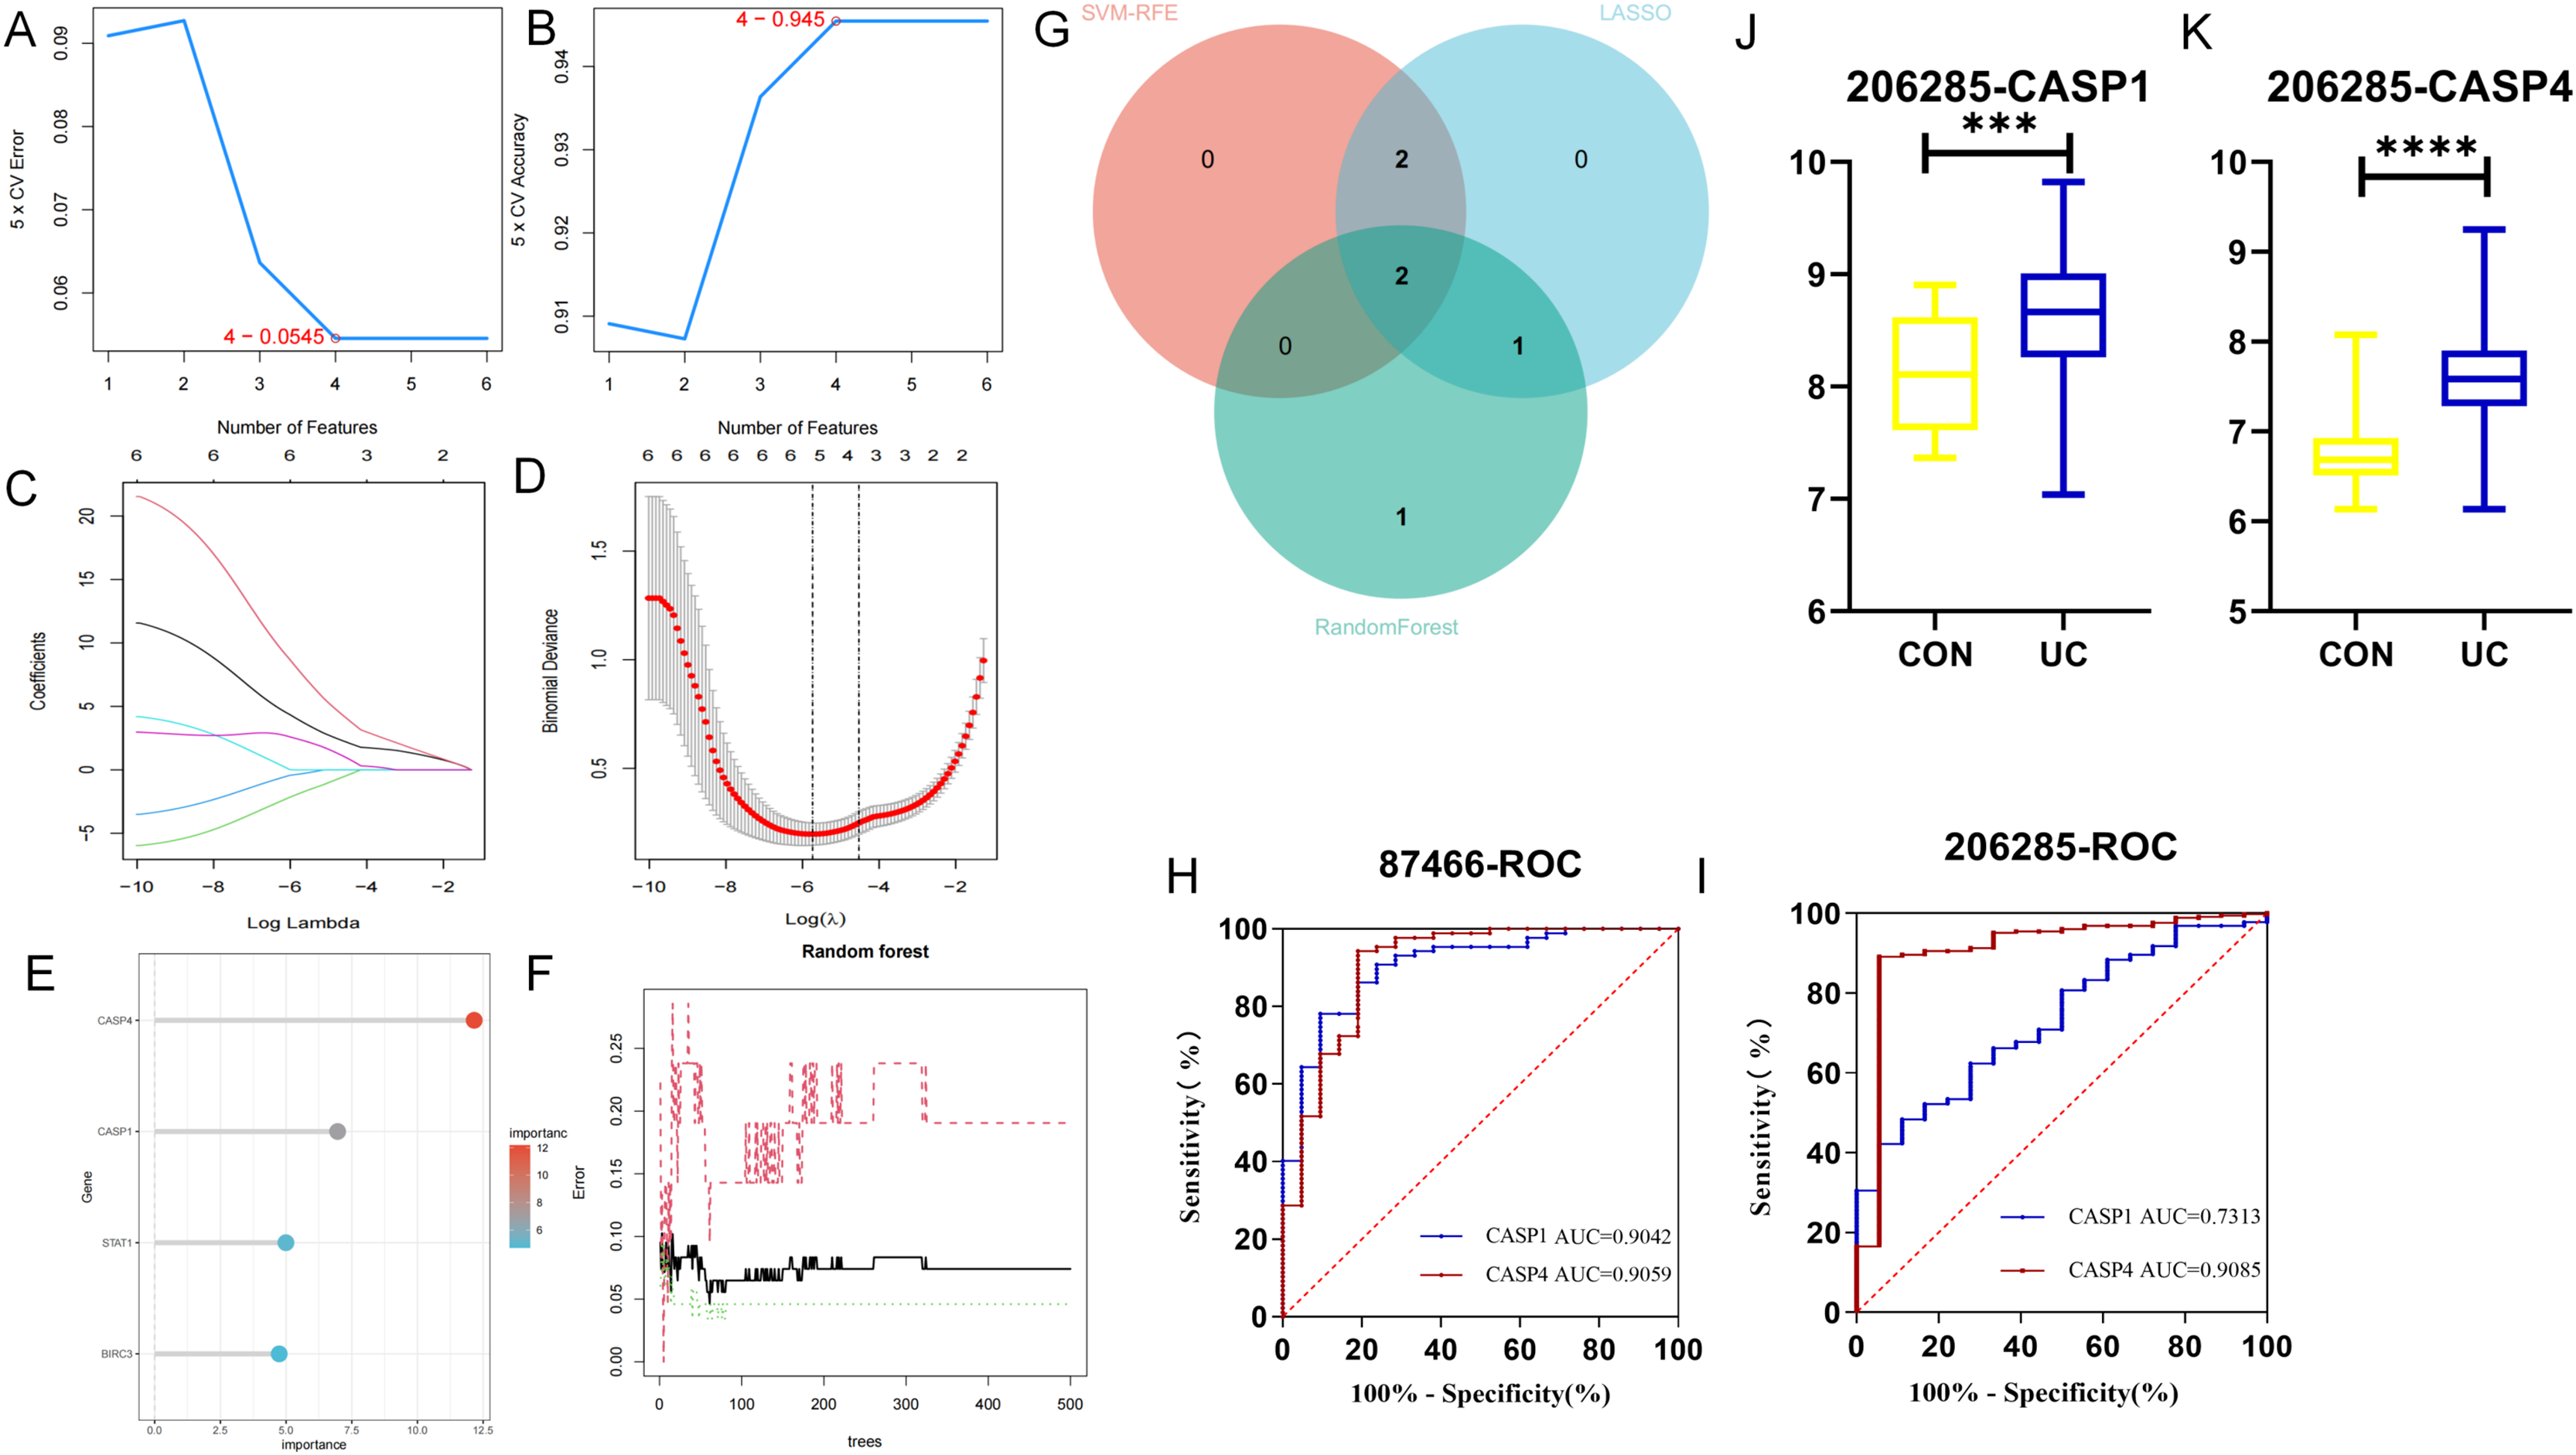
To assess the diagnostic potential of these biomarkers for UC, ROC curve analysis was conducted to evaluate the sensitivity and specificity of each gene within the GSE87466 dataset. As presented in Fig. 5H, the AUC value for CASP1 was 0.9042, while CASP4 exhibited an AUC of 0.9059. Both AUC values exceeded 0.9, indicating that these biomarkers possess significant diagnostic capability in differentiating between diseased and normal specimens. Further ROC curve analysis was performed on the GSE206285 dataset (validation set) to corroborate the diagnostic efficacy of each feature gene. The results, illustrated in Fig. 5I, revealed that CASP1 (AUC = 0.7313) and CASP4 (AUC = 0.9085) both achieved AUC values above 0.7, suggesting that these biomarkers demonstrated commendable diagnostic effectiveness, thereby reinforcing the diagnostic significance of the identified feature genes. Additionally, data from the validation set GSE20628 (Figs. 5J, 5K) exhibited a similar trend to that of the original dataset, further substantiating the relevance of these genes.
To gain deeper insights into the potential roles of CASP1 and CASP4 in the pathogenesis of UC, Gene Set Enrichment Analysis (GSEA) was conducted to identify associated signaling pathways, as shown in Fig. 6. Utilizing the MSigDB database, it was found that CASP1 is linked to several pathways, including the interferon gamma response, interferon alpha response, apoptosis, the cytosolic DNA-sensing pathway, and the p53 pathway. In contrast, CASP4 was associated with the interferon gamma response, apoptosis, and salmonella infection. These findings imply that CASP1 and CASP4 may play critical roles in the pathogenesis of UC, potentially through their involvement in these immune-related signaling pathways.
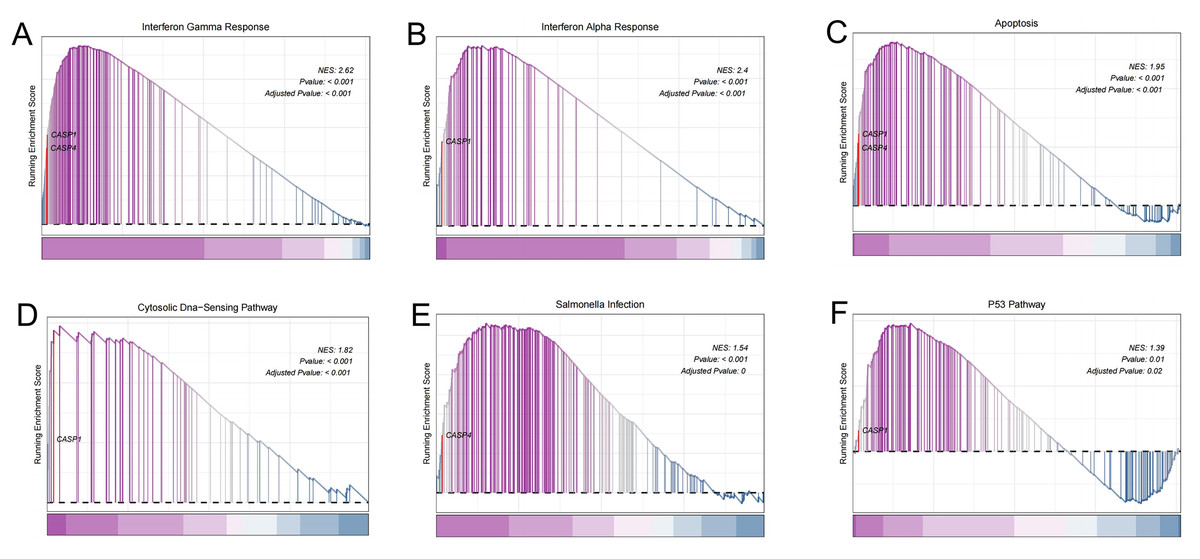
Figure 6: Gene set enrichment analysis (GSEA).
In the pathogenesis of ulcerative colitis (UC), CASP1 was enriched in (A) interferon gamma response, (B) interferon alpha response, (C) apoptosis, (D) Cytosolic DNA-sensing pathway, (F) p53 pathway. CASP4 was associated with (A) interferon gamma response, (C) apoptosis, (E) Salmonella infection.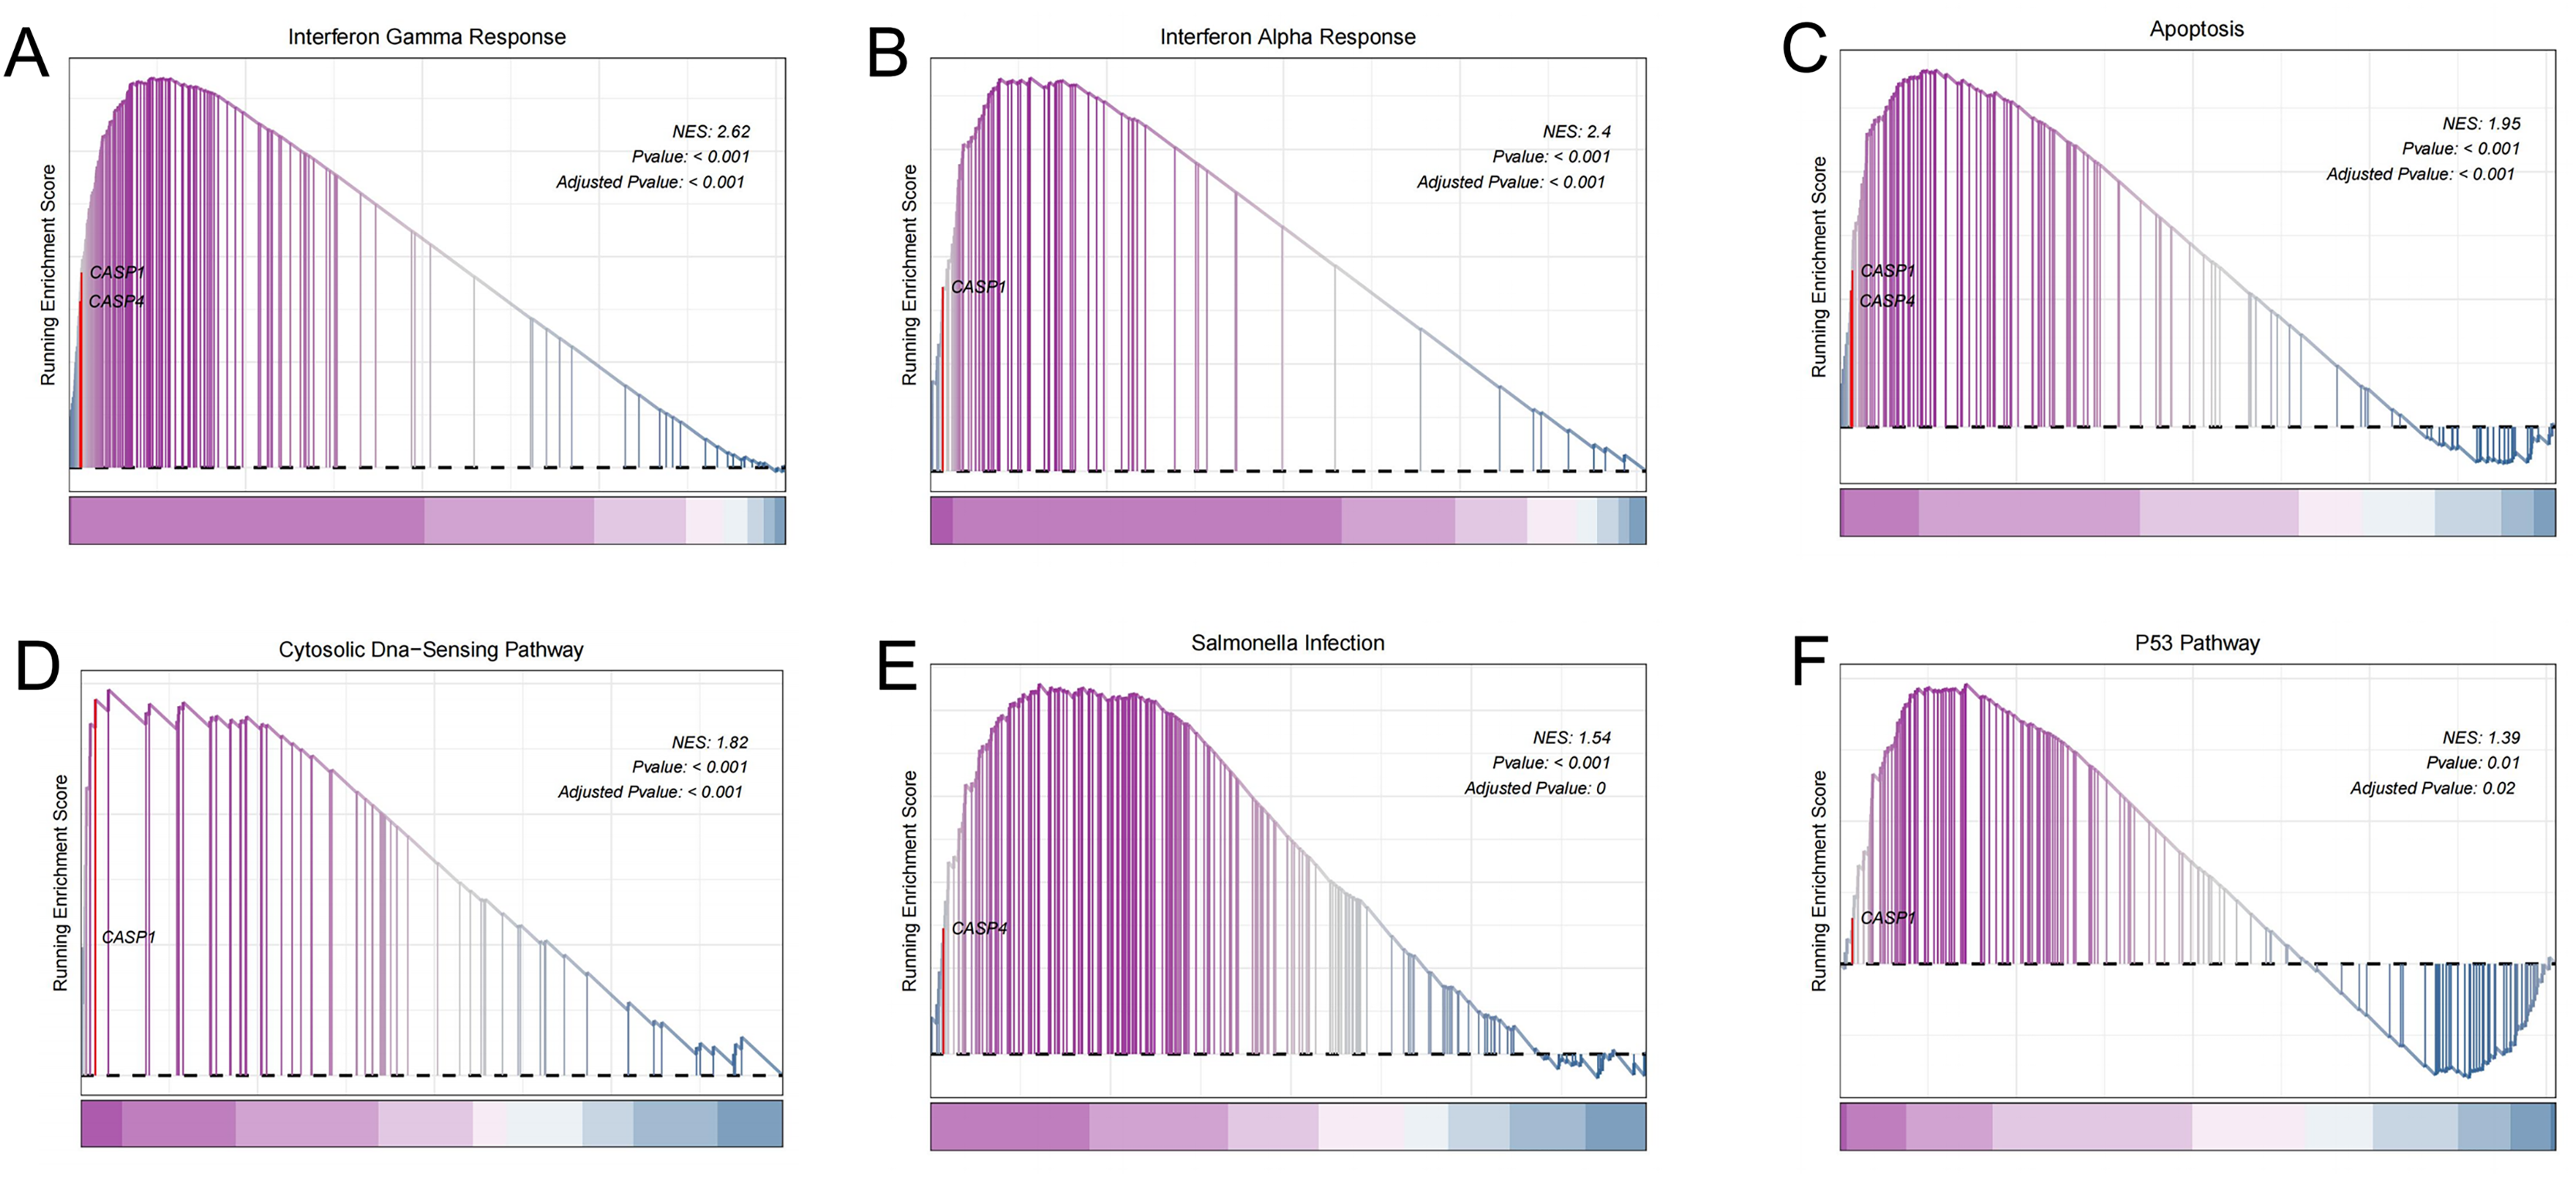
Immune infiltration analysis and its correlation with biomarkers
To investigate the regulatory mechanisms of pivotal genes within the immune microenvironment, the “CIBERSORT” tool in R was employed to assess the proportions and expressions of immune cells in UC and normal tissue samples. Initially, we analyzed the infiltration proportions of 28 distinct immune cell types in UC and healthy tissues using data from GSE87466 (Figs. 7A, 7C, 7E). The box plots revealed significant differences in the infiltration levels of 11 immune cell types between UC and normal samples. Specifically, plasma cells, regulatory T cells (Tregs), activated natural killer (NK) cells, M2 macrophages, and resting mast cells exhibited reduced infiltration in UC samples. Conversely, memory B cells, activated CD4 memory T cells, follicular helper T cells, M0 macrophages, M1 macrophages, activated mast cells, and neutrophils demonstrated increased infiltration in UC samples. In the GSE75214 dataset (Figs. 7B, 7D, 7F), nine immune cell types showed significant variations in infiltration. In UC samples, the infiltration of memory B cells, naive CD T cells, Tregs, and M2 macrophages was markedly diminished, while resting NK cells, M0 macrophages, M1 macrophages, activated mast cells, and neutrophils exhibited heightened infiltration levels. Notably, the immune cells that displayed a significant correlation with UC included B cells, macrophages, mast cells, and neutrophils.
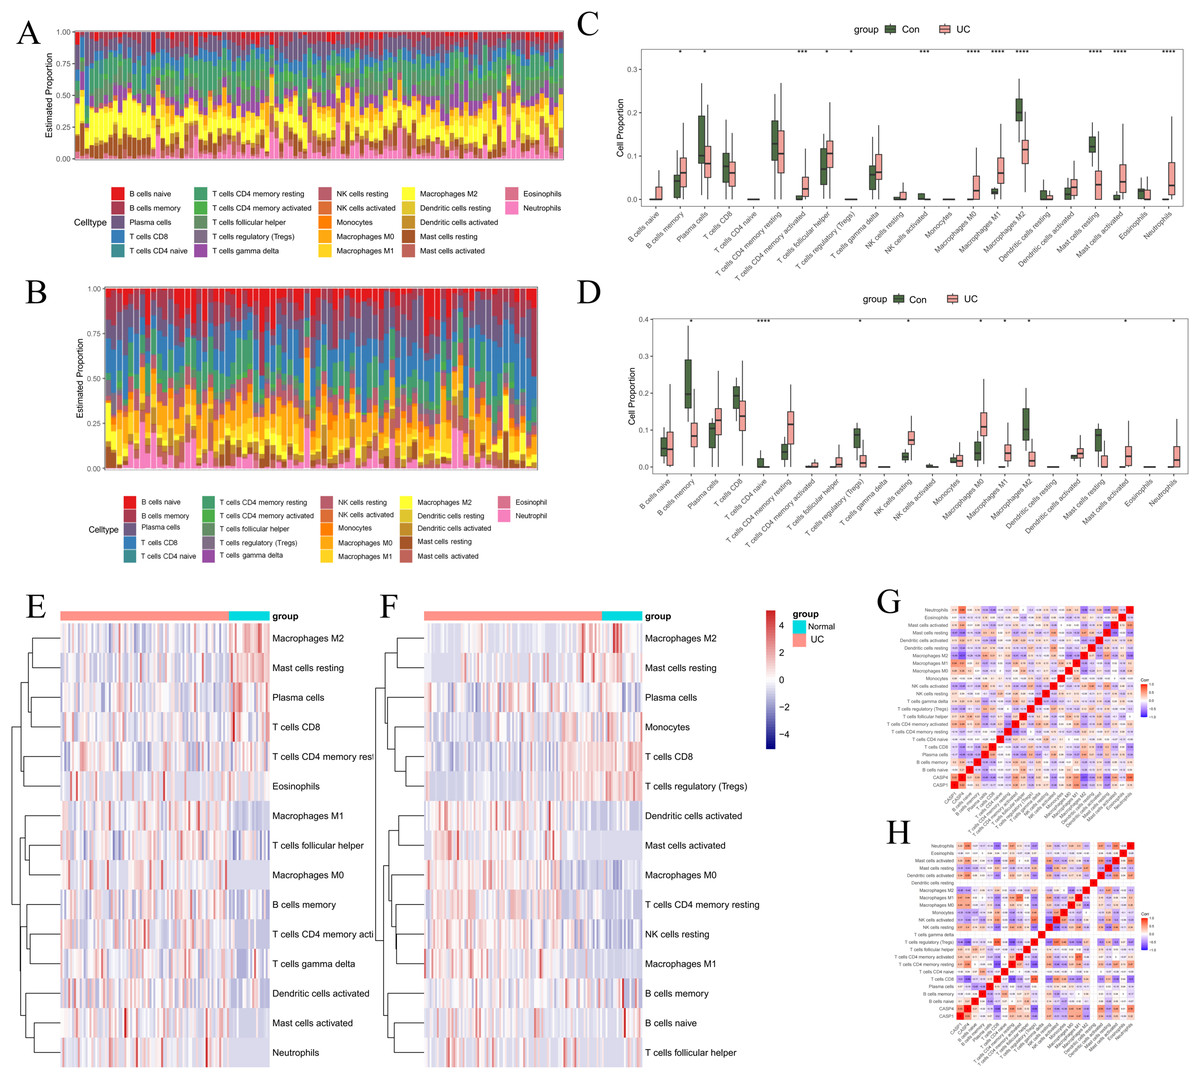
Figure 7: Immune infiltration analysis.
In GSE87466: (A) stacked bar chart showing the distribution of 22 immune cells in normal and UC samples. (C) Box plot comparing the differences in enrichment scores of 22 immune infiltrating cells between normal and UC samples. *p < 0.05, **p < 0.01, ***p < 0.001, ****p < 0.0001, ns: p > 0.05. (E) Heatmap comparing the differences in enrichment scores of 22 immune infiltrating cells between normal and UC samples. (G) Heatmap showing the correlations among immune cells and the correlations between immune cells and genes. In GSE75214: (B) stacked bar chart showing the distribution of 22 immune cells in normal and UC samples. (D) Box plot comparing the differences in enrichment scores of 22 immune infiltrating cells between normal and UC samples. *p < 0.05, **p < 0.01, ***p < 0.001, ****p < 0.0001, ns: p > 0.05. (F) Heatmap comparing the differences in enrichment scores of 22 immune infiltrating cells between normal and UC samples. (H) Heatmap showing the correlations among immune cells and the correlations between immune cells and genes.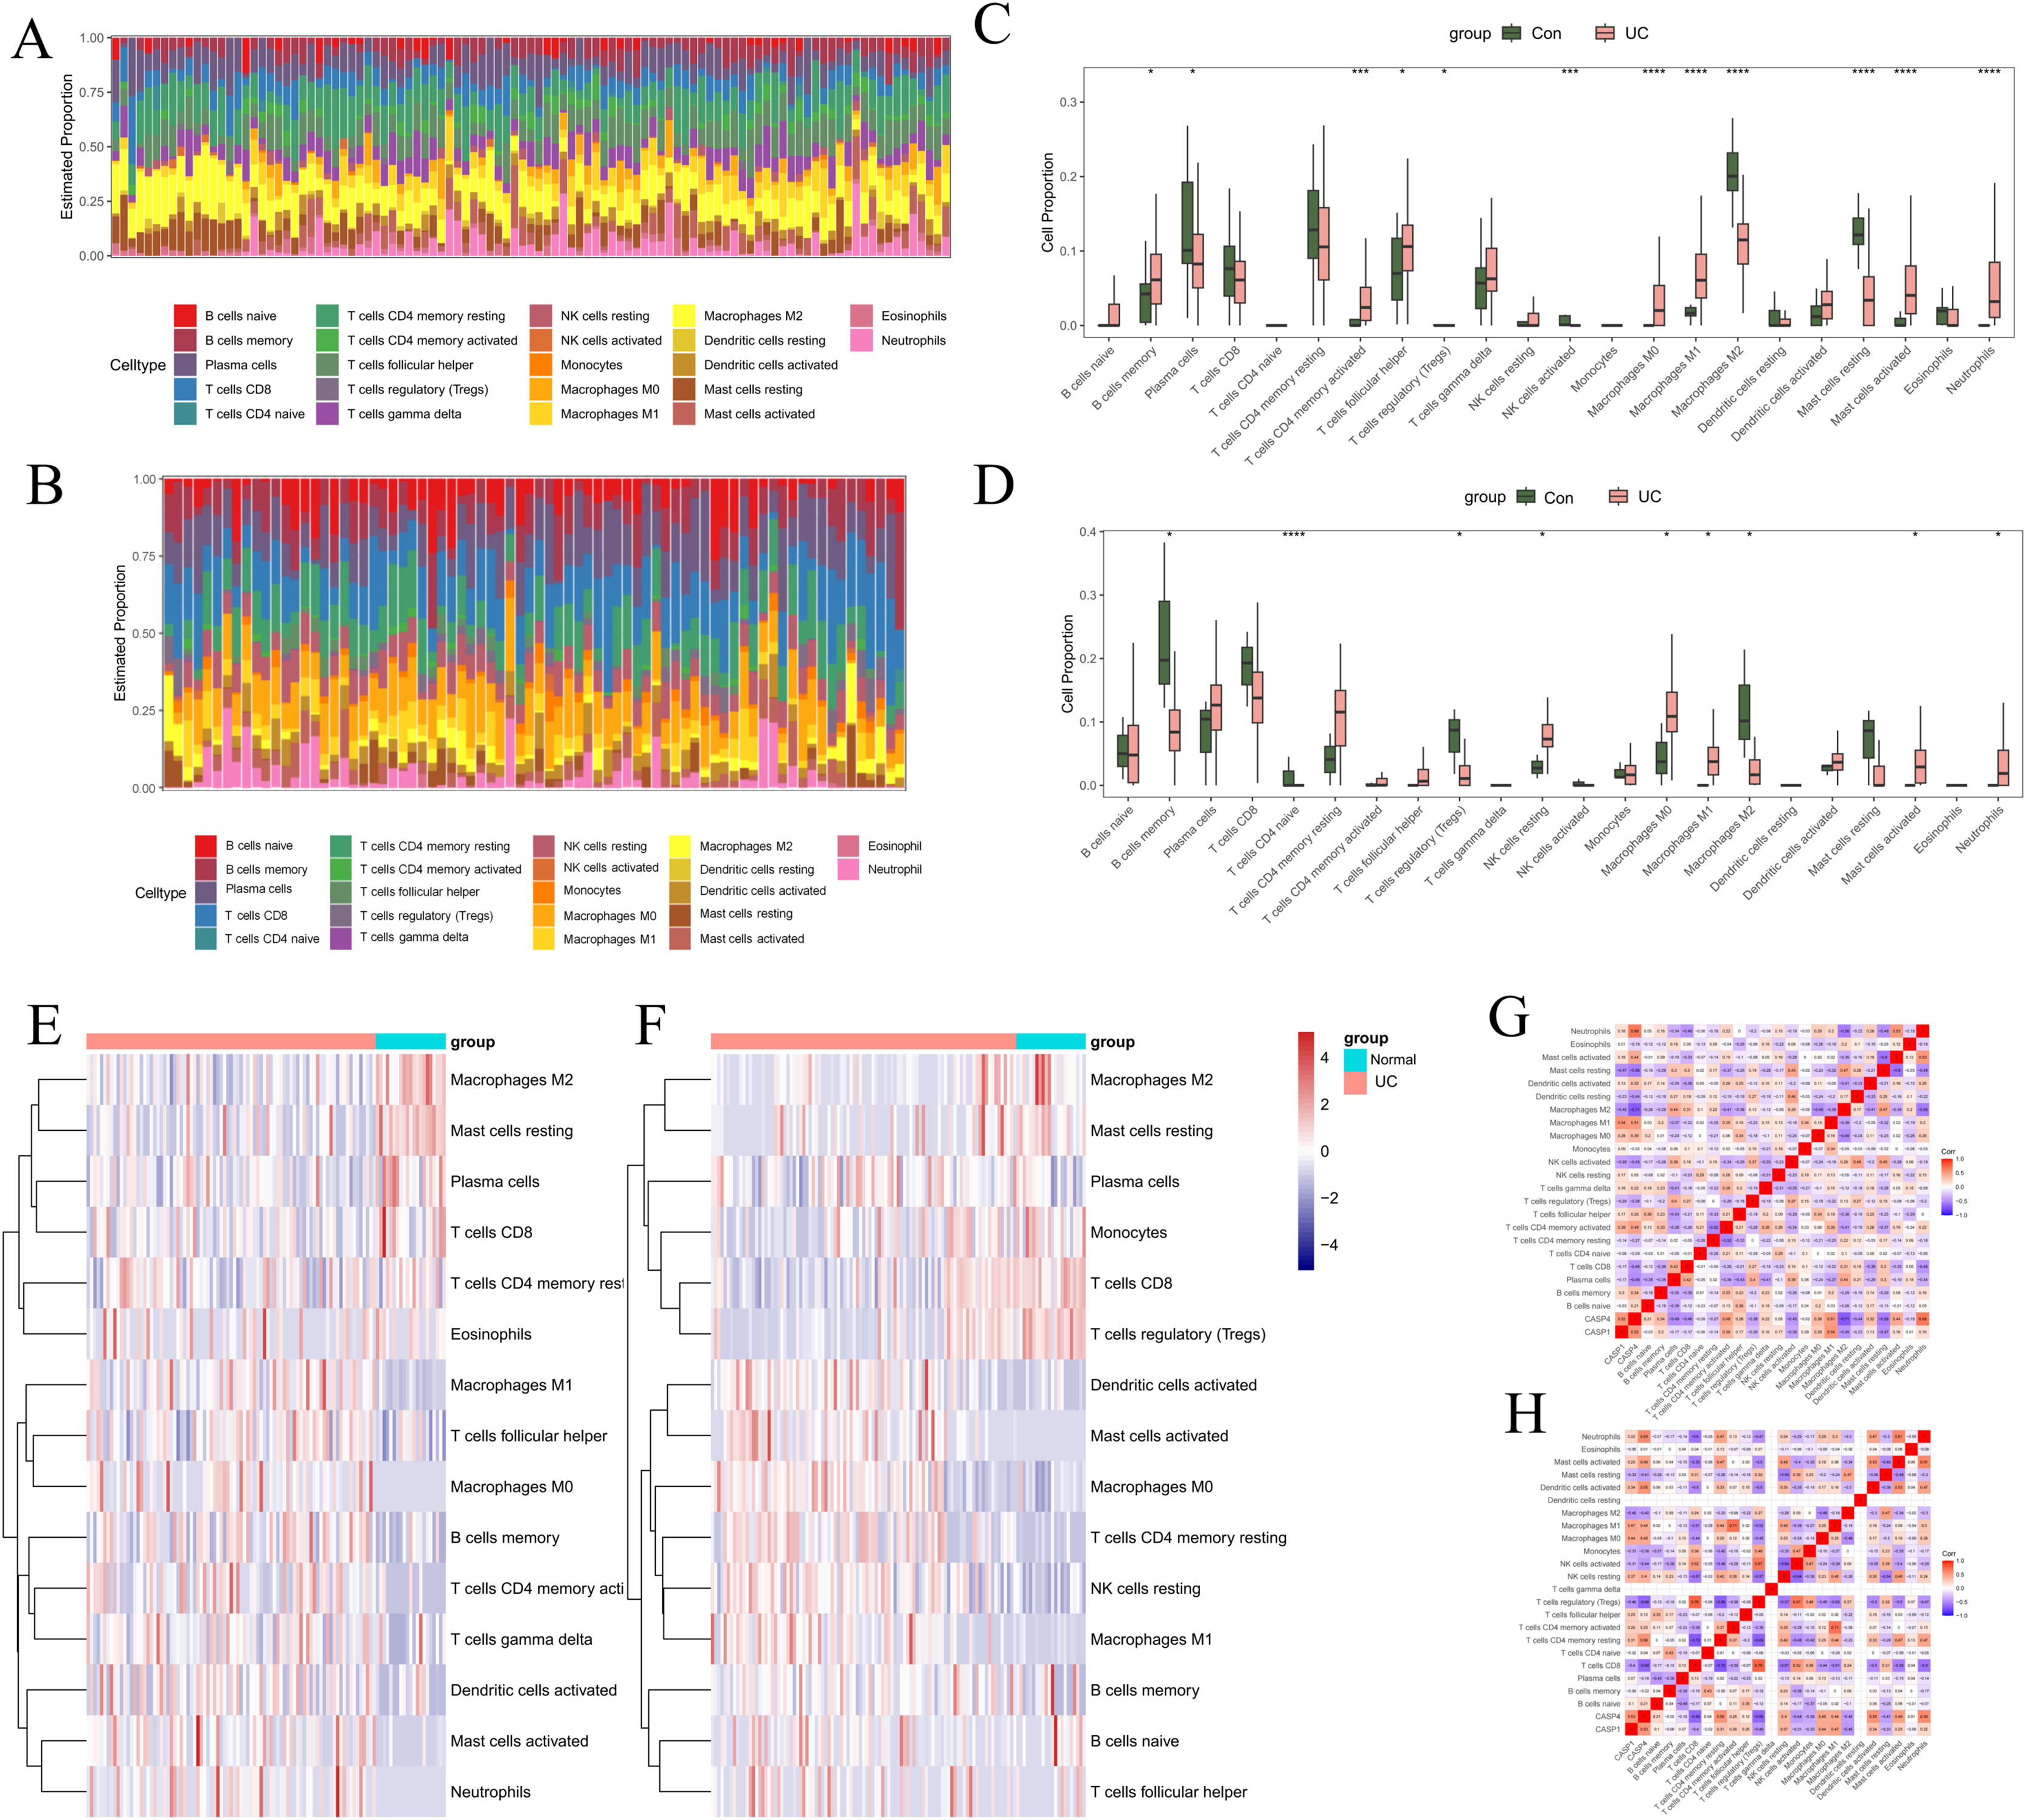
Additionally, we examined the relationship between UC-associated immune cells and biomarkers. In the GSE87466 dataset ( Fig. 7G), the immune cells significantly correlated with CASP1 included M1 macrophages (r = 0.54), M2 macrophages (r = −0.45), and resting mast cells (r = −0.47). The immune cells significantly correlated with CASP4 comprised plasma cells (r = −0.49), activated CD4 memory T cells (r = 0.48), activated NK cells (r = −0.45), M1 macrophages (r = 0.51), M2 macrophages (r = −0.71), resting mast cells (r = −0.56), and neutrophils (r = 0.68). In the GSE75214 dataset (Fig. 7H), the immune cells significantly correlated with CASP1 included Tregs (r = −0.46), M0 macrophages (r = 0.44), M1 macrophages (r = 0.47), and M2 macrophages (r = −0.45). The immune cells significantly correlated with CASP4 included Tregs (r = −0.66), M0 macrophages (r = 0.45), M1 macrophages (r = 0.44), M2 macrophages (r = −0.42), activated mast cells (r = 0.49), and neutrophils (r = 0.59). These findings suggest that macrophages are not only critical immune cells in the context of UC but also serve as significant target cells for CASP1 and CASP4, underscoring their relevance in research focused on macrophage infiltration in models.
Relationship between gene expression and anti-TNF preparations
To investigate the relationship between gene expression and the immune response to pharmacological interventions, an analysis was conducted utilizing the GSE16879 dataset, as illustrated in Fig. 8. In patients with UC who did not receive IFX therapy, there was no statistically significant variation in the expression levels of CASP1, irrespective of the presence or absence of an immune response. This finding suggests that CASP1 is not implicated in the natural immunosuppression observed in UC patients (Fig. 8A). Conversely, following an 8-week course of IFX treatment, a reduction in CASP1 expression was noted exclusively in patients who exhibited a therapeutic response. This observation indicates a strong correlation between CASP1 expression and the efficacy of IFX treatment. Furthermore, patients who did not experience symptom relief post-IFX treatment demonstrated elevated levels of CASP1 expression. In the non-responsive cohort, CASP1 levels remained unchanged after IFX administration, implying that IFX may enhance the immunosuppressive state in UC patients through the modulation of CASP1. In those who responded to IFX, CASP1 expression approached levels observed in healthy individuals, suggesting that CASP1 may serve not only as a diagnostic biomarker but also as a predictor of non-response to IFX in UC patients.
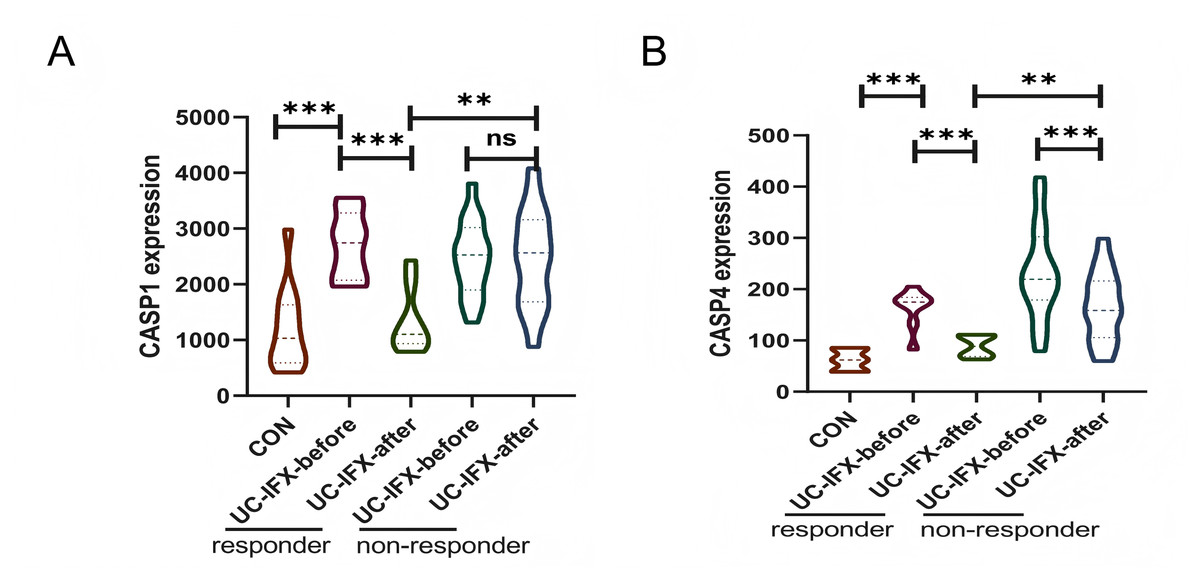
Figure 8: Relationship between CASP1, CASP4 and the Use of IFX.
In the GSE16879 dataset, (A) the expression of CASP1 in UC patients before and after IFX treatment is shown. (B) The expression of CASP4 in UC patients before and after IFX treatment is shown. **p < 0.01, ***p < 0.001, ns: p > 0.05.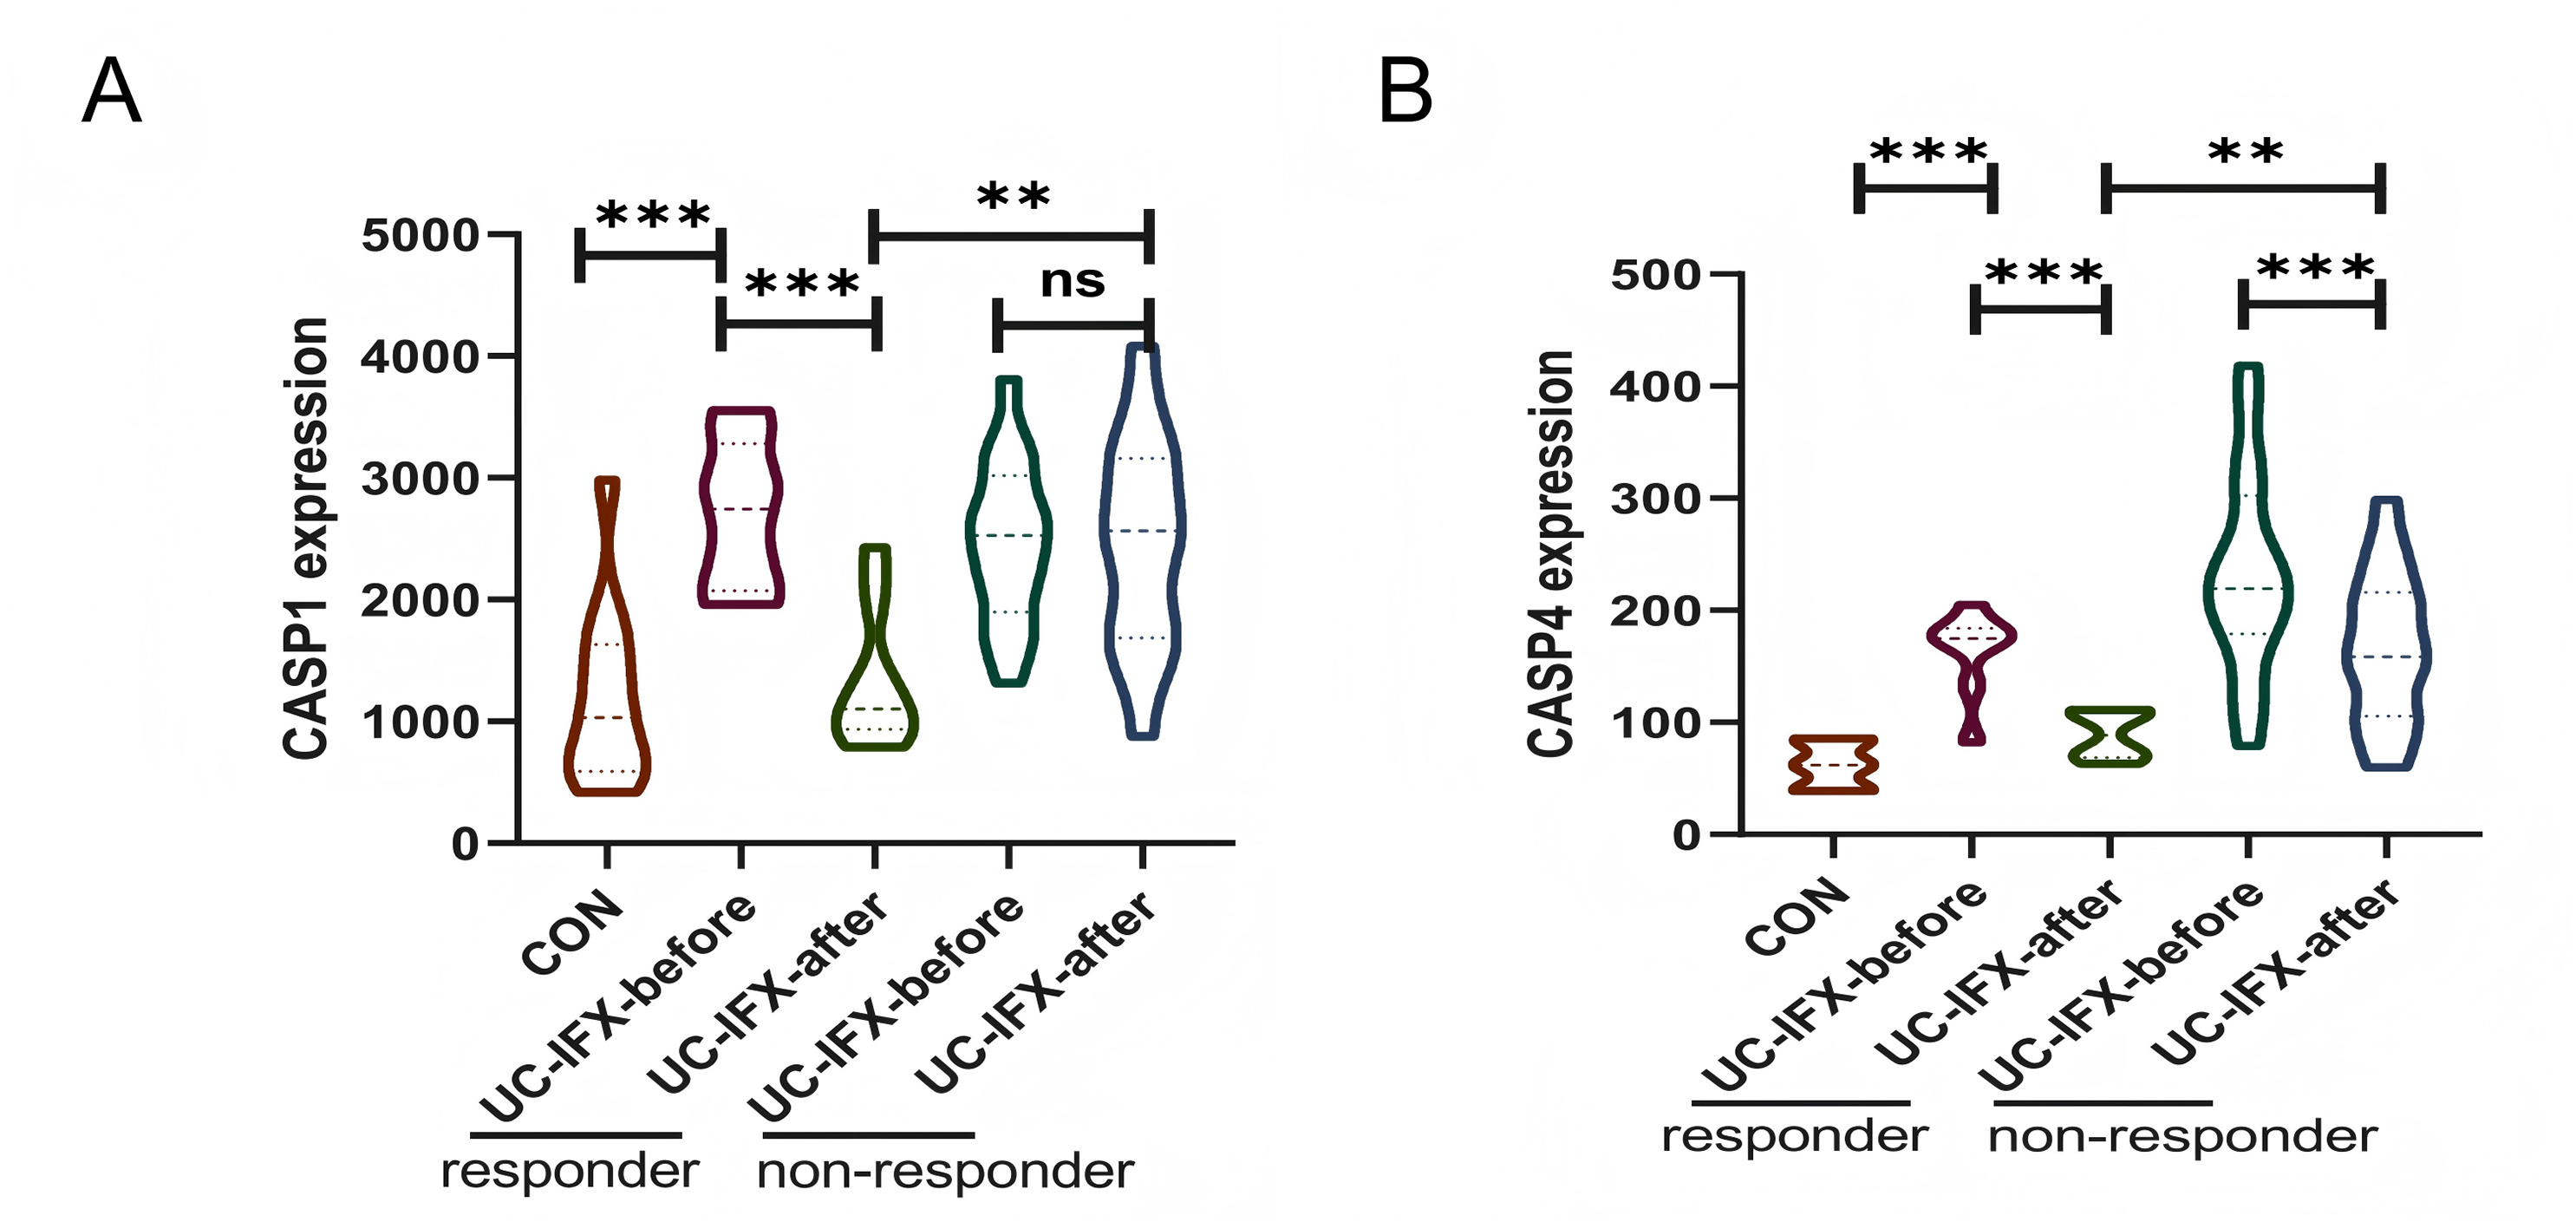
Additionally, the expression levels of CASP4 in the responsive cohort were found to be lower than those in the non-responsive cohort following IFX treatment (Fig. 8B). Nonetheless, in both the responsive and non-responsive groups, a significant decrease in CASP4 expression was observed post-IFX treatment. This indicates a potential association between CASP4 and IFX therapy; however, it does not appear to be a critical target for enhancing the immune response in this context.
Verification of gene expression in DSS induced UC mouse model
In light of the aforementioned findings, a 2.5% DSS solution was administered for a duration of seven days to establish a water-induced UC mouse model. Following the successful induction of the model, notable observations included significant weight loss, the presence of loose and bloody stools, and a marked increase in the DAI score (Figs. 9A, 9B). Additionally, a reduction in colon length was noted (see Figs. 9C, 9D). Histological examination via HE staining revealed disorganization of the colon epithelial cells in the UC mice, with the absence of colonic crypts and a depletion of goblet cells (Figs. 9E–9G). Furthermore, there was a pronounced infiltration of neutrophils at the ulcerated surfaces. Alcian blue-periodic acid-Schiff (ABPAS) staining indicated a significant decrease in the number of goblet cells, alongside damage to the mucosal barrier in the UC mice. Moreover, considering that the mouse functional homolog of human CASP4 is caspase-11, the mRNA and protein expression levels of CASP1 and CASP11 were significantly elevated in the UC mice, corroborating the predicted outcomes (Fig. 9H).
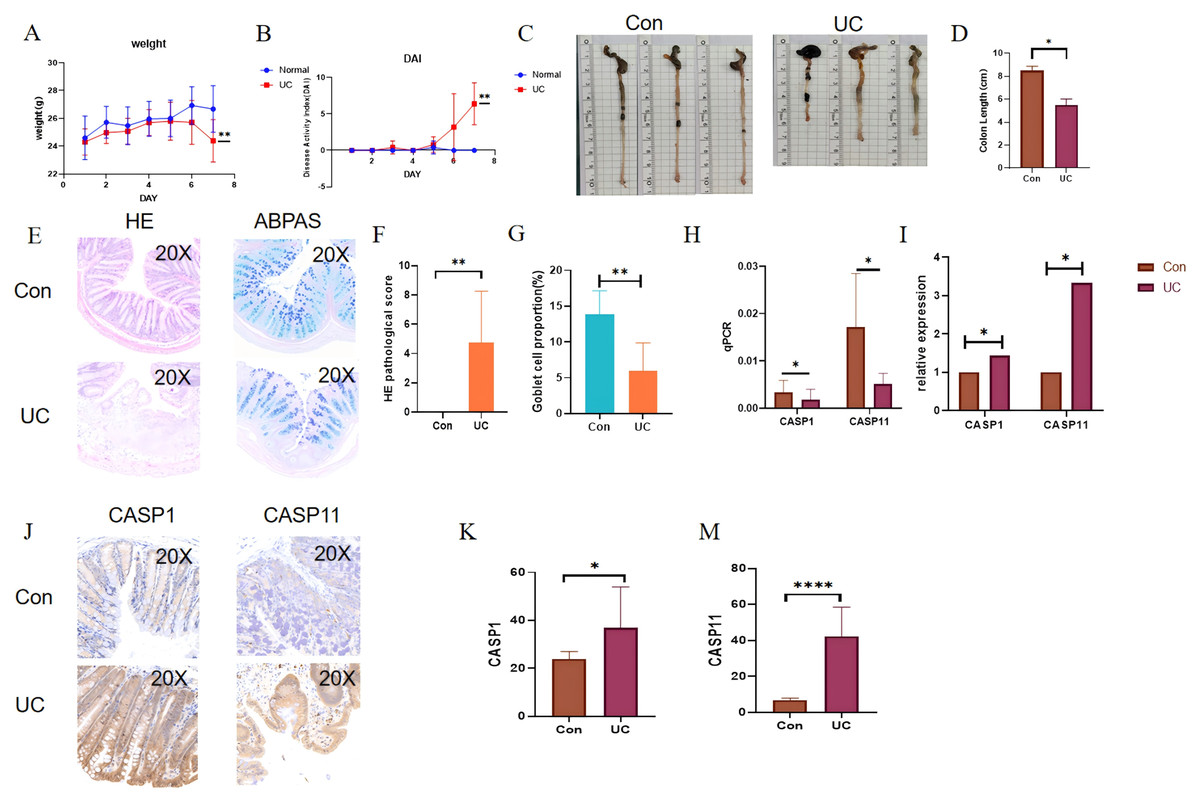
Figure 9: Verification of gene expression in the DSS-induced UC mouse model.
During the 7-day period when UC mice had free access to 2.5% DSS in drinking water: (A) disease activity index (DAI) score of UC mice. (B) Changes in body weight of UC mice. (C, D) Changes in colon length of UC mice and the corresponding statistical values. (E, F) Histological scores of UC mice. (E, G) Statistical chart of the number of goblet cells in UC mice. (H, I) Absolute and relative expression levels of CASP1 and CASP4 by RT-qPCR. (J, K, M) Quantification of CASP1 and CASP4 expression by immunohistochemistry (positive area percentage). *p < 0.05, **p < 0.01, ****p < 0.0001, n = 5.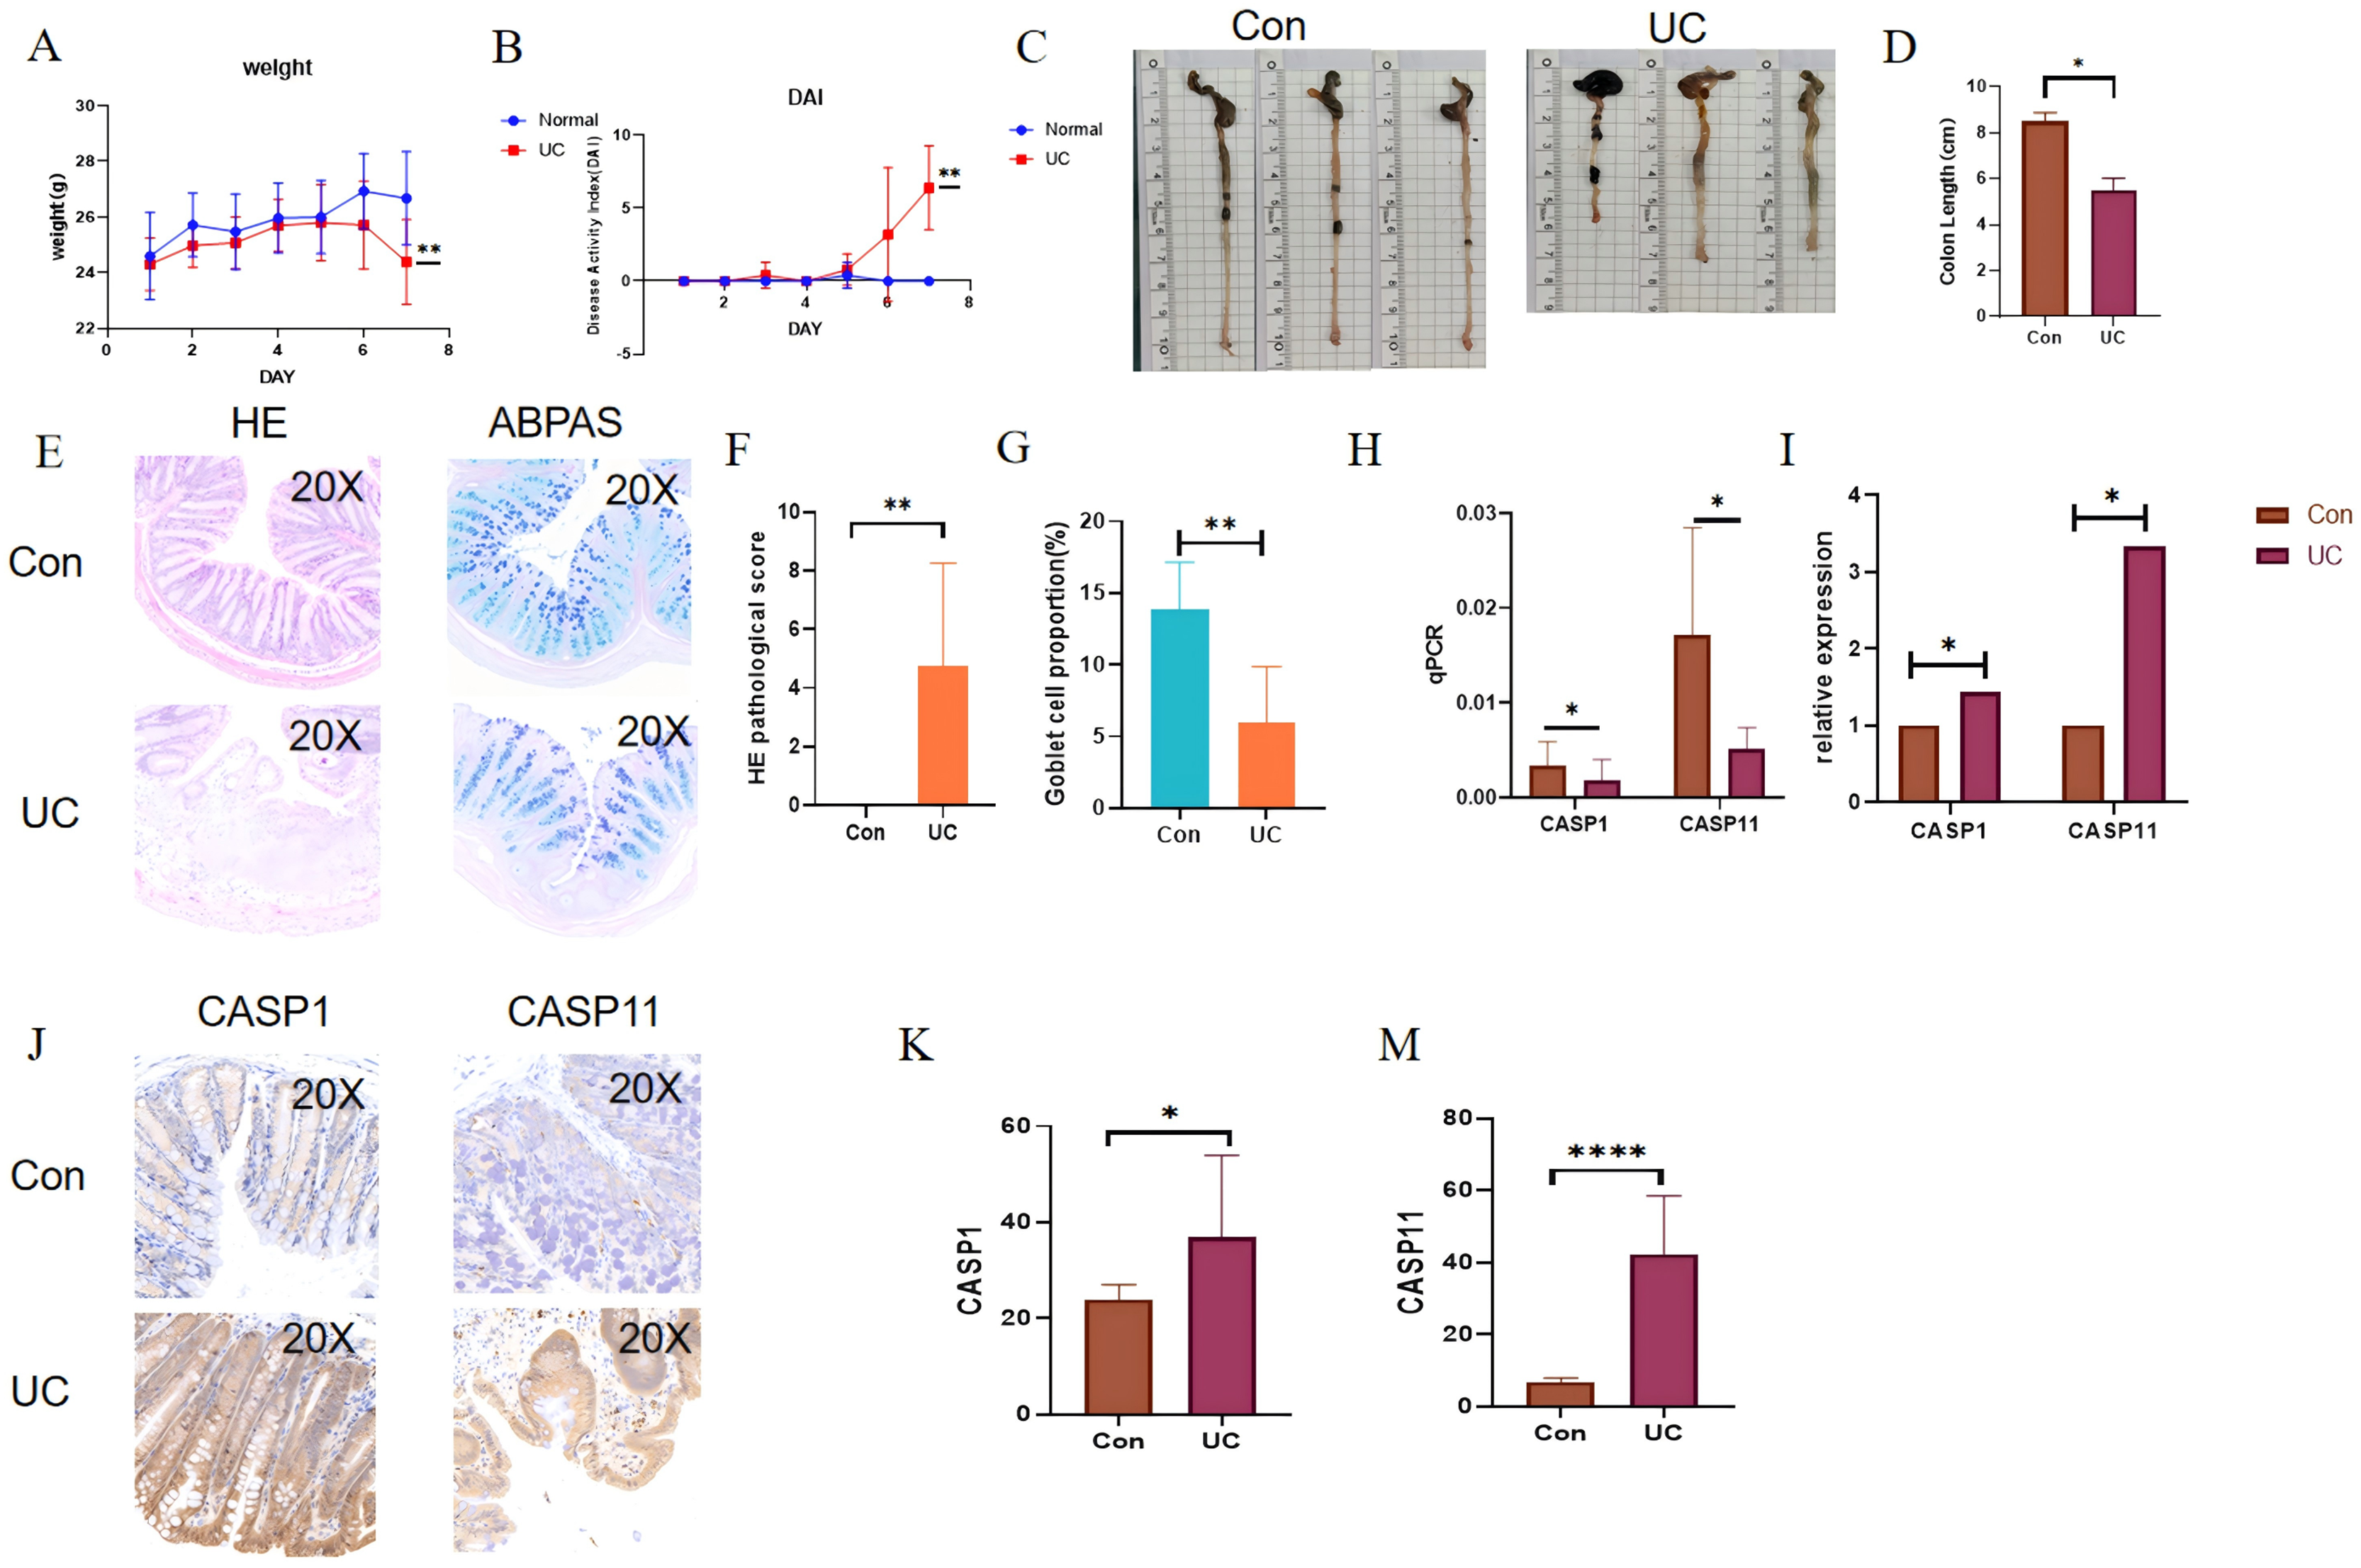
Discussion
MPTDN is a consequence of mitochondrial dysfunction resulting from the sustained opening of the mitochondrial permeability transition pore (MPTP) (Robichaux et al., 2023). The MPTP is characterized as a large, non-specific conductive channel located in the inner mitochondrial membrane, which permits the passage of low-molecular-weight solutes up to 1.5 kDa. The prolonged opening of this channel is instigated by severe oxidative stress or disturbances in calcium ion (Ca2+) homeostasis (Galluzzi et al., 2018). In patients with UC, excessive generation of reactive oxygen species (ROS) and dysregulated calcium signaling collectively constitute upstream key events leading to MPTP opening. Recent studies indicate that the ROS-Ca2+ axis plays a central role in initiating MPTDN: ROS not only directly oxidize MPTP components such as cyclophilin D (CypD) (Rottenberg & Hoek, 2017), promoting its open conformation, but also inhibit endoplasmic reticulum Ca2+-ATPase and activate mitochondrial Na+/Ca2+ exchangers, resulting in cytosolic and mitochondrial matrix Ca2+ overload (Yeste et al., 2024). Ca2+ further combines with phosphate in the mitochondrial matrix to form precipitates, exacerbating oxidative stress and forming a ROS-Ca2+-ROS positive feedback loop that continuously drives MPTP opening. The intestinal environment in UC exhibits significant accumulation of oxidative damage markers and excessive ROS activation (Guazelli et al., 2021). ROS can induce mitochondrial matrix swelling, membrane depolarization, and increased membrane permeability, thereby promoting the release of damage-associated molecular patterns (DAMPs), including cytochrome c, mitochondrial DNA (mtDNA), and ATP (Giorgio et al., 2005). These DAMPs can activate inflammasomes in immune cells, initiating downstream inflammatory signaling pathways that amplify local inflammatory responses and tissue hypoxia, ultimately leading to epithelial cell necrosis and disruption of intestinal barrier integrity (Ho & Theiss, 2022). It is noteworthy that MPTDN exhibits significant crosstalk with other programmed cell death pathways (such as pyroptosis and apoptosis). For example, mtDNA release can enhance type I interferon responses by activating the cGAS-STING pathway, while Caspase-1 activation can further amplify mitochondrial damage signals, creating a self-perpetuating vicious cycle of inflammation. Therefore, interventional strategies targeting the ROS-Ca2+ axis—such as using mitochondrial-targeted antioxidants or calcium signaling modulators—can not only inhibit MPTP opening but also restore mitochondrial energy metabolism, thereby alleviating intestinal barrier damage and inflammatory responses (Fedorov et al., 2022). By elucidating the critical role of MPTDN in UC, this study provides a theoretical foundation for developing novel therapeutic strategies focused on mitochondrial quality.
Initially, a comprehensive analysis of the GSE87466 dataset was performed, resulting in the identification of 923 DEGs. The findings from the GO analysis suggested that these DEGs were potentially linked to various biological processes, notably leukocyte migration and leukocyte chemotaxis. Furthermore, the KEGG indicated that DEGs were significantly associated with several pathways, including cytokine-cytokine receptor interaction, the IL17 signaling pathway, the chemokine signaling pathway, and the TNF signaling pathway. These pathways underscore the critical role of regulating the inflammatory response in UC. Following this, we conducted an initial screening of MPTDEG by integrating DEGs with module genes from WGCNA. Through subsequent screening and validation using machine learning techniques, CASP1 and CASP4 emerged as the principal feature genes associated with MPTDN in UC, and they had good diagnostic potential for UC. Finally, to experimentally validate these findings, We employed an acute DSS colitis model. This model robustly replicates the profound innate immune-driven inflammatory response characteristic of a human UC flare, making it particularly suitable for investigating the rapid upregulation of innate immune mediators like CASP1 and its murine homolog Casp11, and for observing associated MPTDN and tissue damage. Quantitative polymerase chain reaction (qPCR) and immunohistochemistry (IHC) analyses confirmed significant upregulation of Casp11—the murine homolog of human CASP4—at both mRNA and protein levels, thereby supporting the relevance of these genes in UC pathogenesis and their utility as detectable biomarkers.
Caspase-1 (CASP1) and caspase-4 (CASP4) are integral components of the cysteine-aspartic acid protease (caspase) family, which are essential for mediating inflammatory responses and cellular necrosis. The canonical inflammasome is a multi-protein complex consisting of three primary components: the NLRP3 protein, procaspase-1, and the adaptor protein apoptosis-associated speck-like protein (ASC) (Fu & Wu, 2023). Upon stimulation by pathogen-associated molecular patterns (PAMPs) or damage-associated molecular patterns (DAMPs), the inflammasome assembles and recruits the procaspase-1 zymogen, leading to conformational changes that activate the enzyme. Active CASP1 cleaves inactive precursor forms of pro-inflammatory cytokines, such as pro-IL-1β and IL-18, into their active forms, thereby initiating inflammatory and immune responses (Shao et al., 2019). Furthermore, active caspase-1 cleaves the pore-forming protein gasdermin-D (GSDMD), resulting in a lytic form associated with pyroptosis, which contributes to inflammatory necrosis of cells (Sun et al., 2019). In the context of the non-canonical inflammasome, lipopolysaccharide (LPS) binds to and activates caspases 4, 5, and 11, leading to pyroptosis (Smith & Creagh, 2022). Caspase-1 inhibitors (VX765) alleviate the pathological damage and colonic shortening in mice with experimental colitis in a dose-dependent manner (Wang et al., 2022). The oral administration of titanium dioxide (TiO2) nanoparticles has been shown to exacerbate colitis by promoting the assembly and activation of the NLRP3 inflammasome (Ruiz et al., 2017). Therefore, we inferred that CASP1 and CASP4 might be involved in the occurrence and development of UC under the mediation of inflammation-related signaling pathways, which had also been confirmed by relevant literature (Wang et al., 2023).
Although our study specifically focuses on ulcerative colitis (UC), the central roles of inflammasome activation and innate immunity suggest that CASP1 and CASP4 are also closely implicated in Crohn’s disease (CD). Literature reports indicate elevated expression of the pro-inflammatory cytokine IL-1β in both colonic tissues and macrophages of IBD patients, and increased IL-1β levels are associated with disease severity in IBD (McAlindon, Hawkey & Mahida, 1998). In animal models of CD, administration of components such as butyrate has been shown to alleviate intestinal mucosal damage and inflammation by inhibiting NLRP3 inflammasome activation mediated by CASP1 (Xu et al., 2024). However, cellular context and triggering factors may lead to divergent conclusions. Future studies specifically comparing the expression patterns of these caspases in UC and CD tissues are warranted to determine whether they represent pan-IBD biomarkers or are more specifically involved in UC pathogenesis.
Notably, CASP1 and CASP4 also intersect with interferon (IFN) pathways, which are hyperactivated in UC and contribute to innate and adaptive immune dysregulation. Both caspases can cleave cGAS, modulating the cGAS–STING–IFN axis and influencing interferon production (Wang et al., 2017). P53, a transcription factor sensitive to redox changes, is associated with multiple forms of cell death. Evidence suggests that oxidative stress in mitochondria derived from Bax/Bax double-knockout mice can trigger the translocation of cytoplasmic p53 to the mitochondria, promoting the formation of a CypD-p53 complex that facilitates the opening of the MPTP and leads to necrosis (Vaseva et al., 2012). Additionally, LPS released by Gram-negative bacteria, such as Escherichia coli and Salmonella typhi, act as significant stimuli for inflammasome activation. In macrophages primed with interferon-γ (IFNγ), guanylate-binding protein 1 (GBP1) targets vacuoles containing Salmonella, thereby mediating pyroptosis that is dependent on caspase-1 and caspase-4. Taken together, these findings indicate that genes associated with MPTDN may contribute to the pathogenesis of UC by influencing metabolic and immune responses (Naseer et al., 2022).
Abnormal infiltration of immune cells represents a significant pathological characteristic of UC. Identifying the primary immune cells affected by MPTDN may offer new avenues for targeted therapeutic interventions. An analysis of 28 immune cell types from datasets GSE87466 and GSE75214 revealed that regulatory T cells (Tregs), macrophages, and neutrophils are consistently present across both datasets. Correlations between feature genes and immune cells indicated that CASP1 exhibits the strongest positive correlation with M1 macrophages and the most pronounced negative correlation with M2 macrophages. Similarly, CASP4 shows the strongest positive correlation with neutrophils and the most significant negative correlation with M2 macrophages. Neutrophils are known to produce various inflammatory cytokines, including tumor necrosis factor-α (TNF-α), interleukin-1β (IL-1β), and interleukin-6 (IL-6), and they play a crucial role in regulating both innate and adaptive immune responses, demonstrating a strong association with intestinal mucosal inflammation. Prolonged neutrophil infiltration serves as an inflammatory marker for UC and correlates with disease activity. The neutrophil-based PICaSSO histological remission index (PHRI) is an essential component of the UC disease scoring system (Parigi et al., 2023). Intestinal macrophages are pivotal in shaping the inflammatory microenvironment within the gut; they not only phagocytose pathogens but also secrete a variety of cytokines, collaborating with other immune cells to influence the onset, progression, and persistence of UC. M1 macrophages function as the primary effector cells in pathogen elimination, exhibiting significant phagocytic activity that facilitates the rapid clearance of invading pathogens while mediating tissue damage. They also promote Th1- and Th17-mediated immune responses, initiating inflammatory processes to protect the host, particularly during the early stages of inflammation. However, excessive M1 macrophage activity can hinder tissue regeneration and wound healing, leading to host damage. In contrast, M2 macrophages are alternatively activated cells that primarily exert anti-inflammatory effects and contribute to wound healing and fibrosis (Bain & Schridde, 2018). Research has demonstrated that the expression levels of CASP1 and CASP4 are significantly elevated in UC, suggesting their potential involvement in the unresolved damage to the intestinal epithelial mucosa through the assembly of inflammasomes and the promotion of pyroptosis or necrosis in M2 macrophages.
Infliximab (IFX), a chimeric monoclonal antibody targeting tumor necrosis factor-alpha (TNFα), serves as a cornerstone biological agent for moderate-to-severe ulcerative colitis (UC). Although it demonstrates well-established efficacy in inducing and maintaining remission, approximately 30% of patients exhibit primary non-response—that is, failure to achieve clinical, endoscopic, or histological improvement (Mahajan et al., 2022). This therapeutic gap underscores the urgent need to develop diagnostic and theranostic biomarkers to guide precision medicine. Our study reveals that responders to IFX show significantly reduced caspase-1 (CASP1) expression following treatment. Mechanistically, this aligns with the role of CASP1 as an effector protease of the NLRP3 inflammasome—it catalyzes the maturation of pro-inflammatory cytokines (IL-1β, IL-18) and triggers pyroptosis, a process directly implicated in UC mucosal damage (Gao et al., 2024). We therefore hypothesize that by neutralizing TNFα, IFX may indirectly suppress the activation of the NLRP3 inflammasome, a key activator of CASP1. Attenuated TNFα signaling may further reduce mitochondrial ROS production, thereby stabilizing the MPTP and mitigating CASP1/CASP4-mediated pyroptosis and necrosis. The clinical value of measuring CASP1 expression lies in its dynamic changes during treatment. This positions CASP1 not only as a diagnostic biomarker but, more importantly, as a theranostic biomarker for anti-TNF therapy in UC. We propose a model in which baseline mucosal CASP1 levels can stratify patients into probable responders and non-responders before initiating costly biologic therapy. Crucially, its role as a treatment monitoring marker is vital: persistently elevated CASP1 levels after IFX induction therapy strongly predict primary non-response and failure to achieve endoscopic remission. This objective molecular signal provides clinicians with an early indicator—potentially before clinical symptoms manifest—that the current treatment is ineffective, prompting a timely switch to alternative mechanisms of action rather than continuing futile therapy or merely escalating the dose. Thus, the utility of CASP1 extends beyond initial diagnosis to guiding and monitoring therapeutic decisions. Serial assessment of mucosal CASP1—particularly at baseline and after the induction phase—could be integrated into a personalized treatment algorithm to optimize outcomes in UC patients, avoiding unnecessary drug exposure and side effects.
The translational significance is manifested in three aspects: In terms of diagnostic value, quantitative immunohistochemical detection of CASP1 during initial endoscopic evaluation enables early identification of non-responders, thereby avoiding ineffective treatments and reducing healthcare expenditures. Regarding treatment guidance, persistently elevated CASP1 levels following induction therapy indicate treatment failure, necessitating a prompt switch to alternative therapeutic regimens (such as JAK inhibitors or IL-23 antagonists) rather than dose escalation. In the context of drug development, direct inhibition of CASP1 through compounds such as VX-765 offers a novel strategy for patients refractory to IFX (Wang et al., 2022). From a translational perspective, measuring CASP1 and CASP4 mRNA or protein levels in colonic mucosal biopsies obtained during routine endoscopy represents a feasible clinical application. Immunohistochemistry or RT-qPCR on biopsy specimens are readily available techniques in clinical pathology and molecular diagnostics labs. Study demonstrating the expression and function of Casp11 (murine CASP4) in the colon, supports the biological plausibility of targeting this pathway (Fan et al., 2018).
To evaluate the unique value of MPTP-related biomarkers compared to existing biomarkers, we note that existing studies have shown that while NLRP3 inflammasome-related molecules (such as NLRP3, ASC, IL-1β) primarily reflect downstream inflammatory activation (Joaquim et al., 2023), MPTP-related biomarkers (such as CASP1 and CASP4) directly characterize the more upstream pathological event of mitochondrial dysfunction. Multiple studies suggest that the novel cell death pathway driven by MPTP may exist independently of classical inflammasome activation and is associated with broader cellular stress signals (Newton et al., 2024). More importantly, unlike inflammasome biomarkers, which mainly predict response to anti-TNF therapy, MPTP-related biomarkers demonstrate broader predictive value for treatment response. This difference may stem from the ability of the MPTP pathway to simultaneously regulate multiple cell death modalities and immune response processes, making it a more comprehensive biomarker.
This investigation aimed to elucidate the relationship between MPTDN and UC, while also preliminarily examining its potential mechanisms of action in this context. However, several limitations must be acknowledged. First, the data utilized in this research were sourced from public databases, which provided limited clinical information and sample sizes, potentially leading to biased outcomes. Second, the specific effects of macrophage polarization mediated by CASP1 on UC necessitate further validation through animal and cellular studies. Future research will focus on exploring additional pathways associated with MPTDN and investigating the possible regulatory mechanisms involved in UC.
Summary
In conclusion, this investigation identified a total of 923 DEGs, along with a WGCNA-related module comprising 902 genes, and six genes associated with MPTDN in the context of UC. Utilizing three machine learning techniques—LASSO, SVM-RF, and RF—two diagnostic biomarkers were successfully identified. GSEA revealed that CASP1 was linked to several biological processes, including the interferon gamma response, interferon alpha response, apoptosis, the cytosolic DNA-sensing pathway, and the p53 pathway. Similarly, CASP4 was found to be associated with the interferon gamma response, apoptosis, and Salmonella infection. Furthermore, immune infiltration analyses indicated that in the UC model, both CASP1 and CASP4 were correlated with the infiltration of macrophages and neutrophils. Drug sensitivity assessments suggested that CASP1 may serve as a predictor for non-responders to IFX treatment. By establishing a DSS-induced UC mouse model, we validated the regulation of the biomarkers at the in vivo level, confirming the alignment of these findings with the results obtained from bioinformatics analyses.
Supplemental Information
ROC curve of the logistic regression model combining CASP1 and CASP4 expression levels in the validation set.
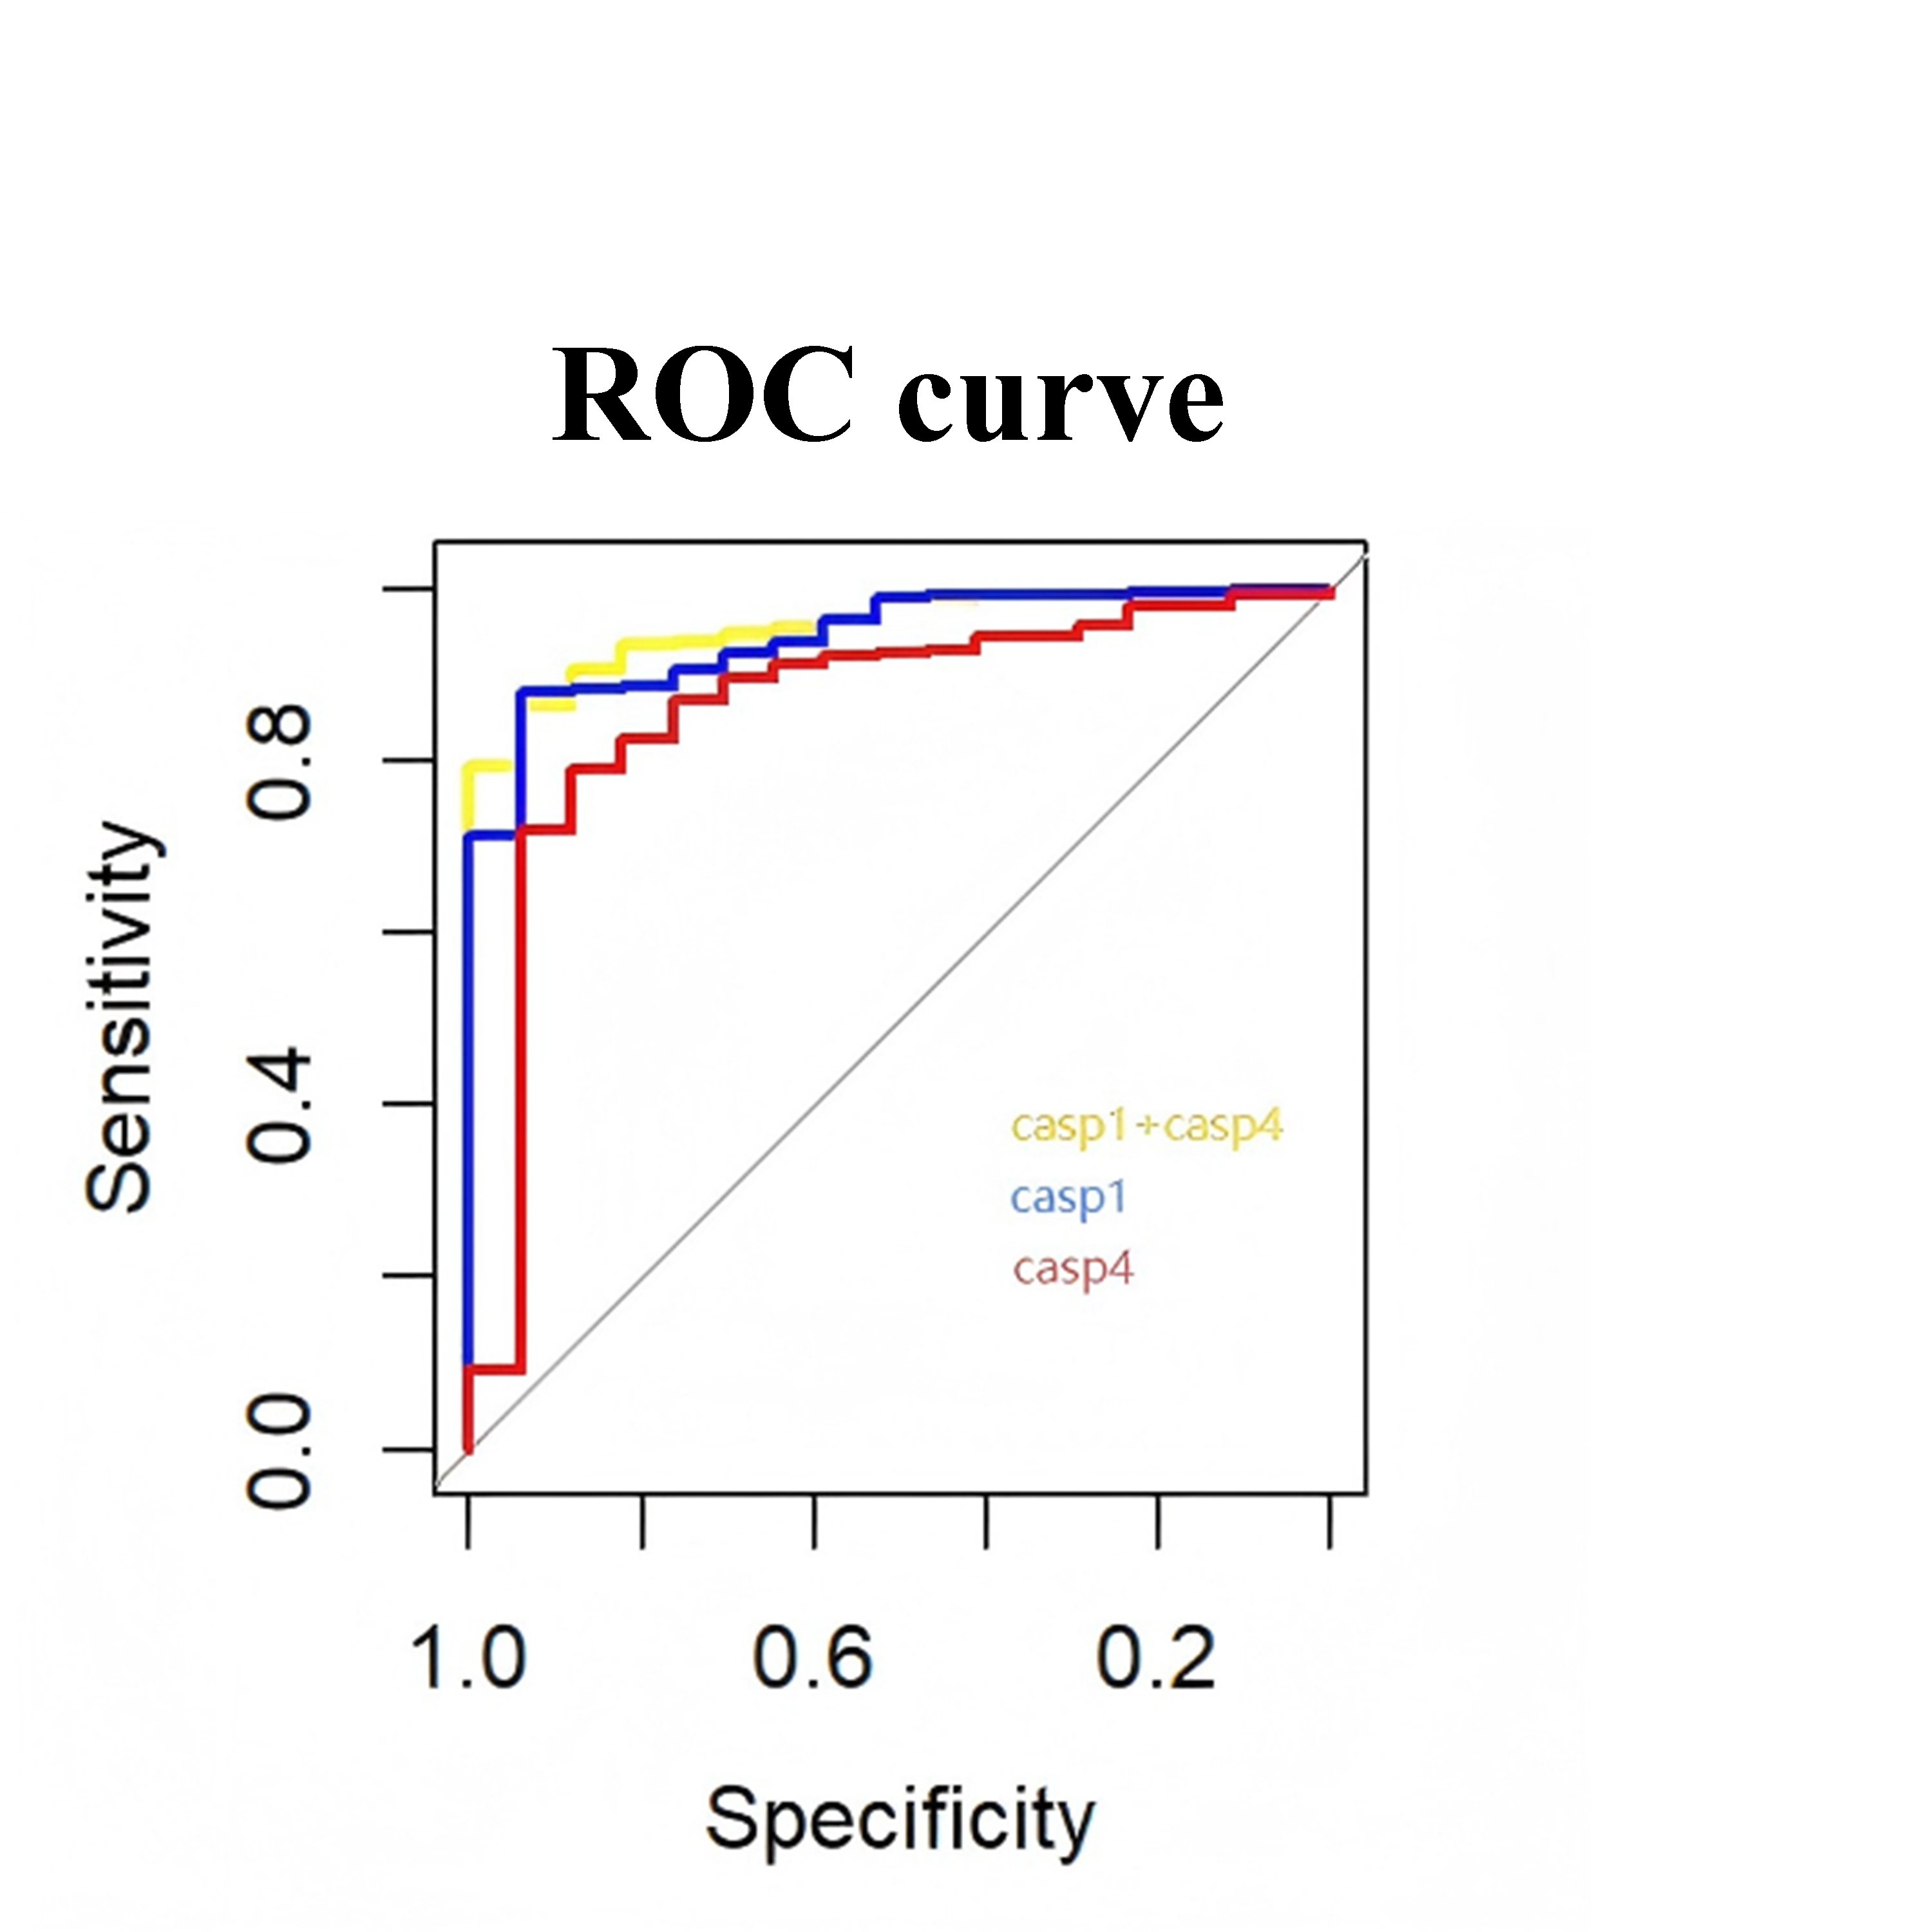
Raw data.
(a) body weight, (b) disease activity index, (c) colon length (d) HE pathology score (e) goblet cell area proportion.