
DHCR7: from sterol biosynthesis to oncogenic role in colorectal cancer
- Published
- Accepted
- Received
- Academic Editor
- Vladimir Uversky
- Subject Areas
- Bioinformatics, Cell Biology, Molecular Biology, Oncology
- Keywords
- 7-Dehydrocholesterol reductase (DHCR7), Colorectal cancer, PI3K/AKT/mTOR signaling, Oncogenesis
- Copyright
- © 2025 Zhou et al.
- Licence
- This is an open access article distributed under the terms of the Creative Commons Attribution License, which permits using, remixing, and building upon the work non-commercially, as long as it is properly attributed. For attribution, the original author(s), title, publication source (PeerJ) and either DOI or URL of the article must be cited.
- Cite this article
- 2025. DHCR7: from sterol biosynthesis to oncogenic role in colorectal cancer. PeerJ 13:e20323 https://doi.org/10.7717/peerj.20323
Abstract
Objective
7-Dehydrocholesterol reductase (DHCR7) is an enzyme that plays a crucial regulatory role in sterol biosynthesis and has been implicated in tumorigenesis and progression. This study aims to elucidate the biological function of DHCR7 in the pathogenesis of colorectal cancer (CRC).
Methods
By integrating multi-omics data (including public genomic databases and mass spectrometry data from clinical samples) and establishing in vivo and in vitro experimental systems (encompassing animal models and CRC cell lines with gene overexpression and knockdown), we systematically investigated the functional role of DHCR7 in CRC. A multimodal research strategy combining bioinformatics analysis with molecular biology experiments (Quantitative Real-Time Polymerase Chain Reaction (qRT-PCR), western blotting, immunohistochemistry, etc.), proteomics analysis (liquid chromatography–mass spectrometry), and cellular functional assays (proliferation, apoptosis, migration, and invasion) was employed.
Results
Elevated levels of sterols were observed in CRC tumor tissues, and high cholesterol levels were found to promote the malignant phenotype of tumor cells. Mass spectrometry revealed that DHCR7 was significantly upregulated in CRC tissues and correlated with poor clinical prognosis. DHCR7 could modulate the cholesterol levels in CRC cells; overexpression of this gene enhanced cell proliferation, inhibited apoptosis, and promoted invasion and migration. Conversely, inhibition of DHCR7 expression abrogated these pro-tumorigenic effects, which was consistent with the inactivation of the PI3K/AKT/mTOR signaling pathway and confirmed by pathway reactivation experiments. DHCR7 deficiency significantly reduced tumorigenicity in vivo.
Conclusion
DHCR7 regulates the progression of CRC both in vitro and in vivo through the PI3K/AKT/mTOR signaling axis and affects the cholesterol levels in CRC.
Introduction
As the third most common malignant tumor worldwide, Colorectal Cancer (CRC) ranks as the fourth leading cause of cancer-related death in the world (Dekker et al., 2019). Cholesterol is essential for the formation of cell membranes, playing an integral role in maintaining cellular integrity and stability. The byproducts and bioactive molecules generated during cholesterol synthesis, absorption, modification, and degradation are essential for both intra- and inter-cellular signal transduction (van Duijnhoven et al., 2011). Extensive research has established a close link between cholesterol metabolism and CRC initiation and progression (Huang, Song & Xu, 2020). Disruptions in cholesterol metabolism are commonly observed in CRC cells, and the reprogramming of this pathway significantly contributes to tumor cell proliferation, migration, and invasion. Although excessive cholesterol production can be detrimental, the exact mechanisms by which CRC cells modify cholesterol metabolism to promote tumor progression remain unclear (Huang, Song & Xu, 2020; Liu et al., 2022).
In the process of cholesterol synthesis, the enzyme 7-Dehydrocholesterol Reductase (DHCR7) facilitates the transformation of 7-dehydrocholesterol (7-DHC) into cholesterol (Moebius et al., 1998; Fitzky et al., 1998). Mutations in the DHCR7 gene are linked to Smith-Lemley-Opitz syndrome (SLOS), the most common disorder associated with disruptions in cholesterol synthesis (Jira et al., 2003; Tomita et al., 2022). Individuals with compromised DHCR7 function due to genetic mutations typically present with reduced cholesterol levels and elevated 7-DHC concentrations (Keller, Arnold & Fliesler, 2004). Studies have suggested that inhibiting DHCR7 activity can enhance immune defense by promoting interferon (IFN)-β production (Xiao et al., 2020). In the field of oncology, DHCR7 has been associated with the advancement of various types of cancer, including breast, bladder, and gastric malignancies (Chen et al., 2023; O’Brien et al., 2018; Li et al., 2023; Zeng et al., 2024). Recent studies are investigating the potential role of DHCR7 in the lymphatic spread to lymph nodes, known as lymph node metastasis (LNM), in cervical cancer. This research is shedding light on how DHCR7 might contribute to the progression of the disease (Mei et al., 2024). Although the effect of 7-DHC on ferroptosis sensitivity is well-documented (Li et al., 2024), it also remains largely unknown what role DHCR7 plays in CRC.
Our RNA-seq analysis revealed that DHCR7 is significantly overexpressed in CRC tissues and serves as a crucial prognostic biomarker for CRC. To clarify DHCR7’s tumor-promoting role in CRC, we modified DHCR7 levels in vitro to study its impact on cell proliferation, apoptosis, cell cycle, migration, and invasion. Furthermore, the biological function of DHCR7 was validated in vivo. In summary, this study underscores the essential role of DHCR7 in the progression of CRC and identifies DHCR7 as a potential therapeutic target for CRC.
Materials and Methods
Specimens
The RNA later® reagent (Thermo Fisher Scientific, Waltham, MA, USA) was employed to preserve 100 pairs of CRC tissues and their corresponding normal colorectal tissues, which were collected from Gansu Provincial Hospital. Comprehensive details regarding the included samples are provided in Table S1. Informed consent was obtained from all participants, and signed a written informed consent form. The study received approval from the Ethics Committee of Gansu Provincial Hospital (Approval No. 2023-509). Furthermore, the HColA180Su21 microarray, acquired from Shanghai Xinchao Biotechnology Co., Ltd. (Shanghai Shi, China), was utilized in this research. This microarray comprised 94 cancer tissue samples and 86 adjacent tissue samples.
Mass spectrometry
This study employed a data-independent acquisition (DIA) strategy for quantitative proteomic analysis of CRC and adjacent normal tissues. Three couples CRC tissue of samples were cryogenically ground, lysed with Sodium Dodecyl Sulfate-Tris-HCl (SDT) buffer (containing 100 mM NaCl and Dithiothreitol (DTT)), and homogenized by ice-water bath sonication. After thermal denaturation (95 °C, 8–15 min) and acetone precipitation, total proteins were extracted, quantified via Bradford assay, and validated by 12% Sodium Dodecyl Sulfate-Polyacrylamide Gel Electrophoresis (SDS-PAGE) electrophoresis. Proteins were enzymatically digested using trypsin (37 °C, 4 h + overnight), followed by desalting with C18 columns and lyophilization. For DIA-based mass spectrometry, peptide samples were separated on a Ultra-High Performance Liquid Chromatography (UHPLC) system (Vanquish Neo; Thermo Fisher Scientific, Waltham, MA, USA) equipped with a C18 analytical column (ES906, 150 µm × 15 cm, 2 µm) under gradient elution. Mass Spectrometry (MS) analysis was performed using a Thermo Orbitrap Astral mass spectrometer with an Easy-spray ion source (1.9 kV, 290 °C). DIA parameters included a primary scan range of m/z 380–980 (240,000 resolution), 300 variable isolation windows, and secondary scans (m/z 150–2,000) at 80,000 resolution (Astral analyzer) with 25% normalized collision energy. Raw data were processed to identify differentially expressed proteins (p < 0.05, |log2FC| > 0) through log2 transformation and fold-change calculations. Visualization of differential protein expression (volcano plots) and functional enrichment analysis (bubble/chord diagrams) were conducted using R packages (ggplot2, clusterProfiler) to elucidate proteomic signatures between cancerous and normal tissues.
Bioinformatics analysis of DHCR7
This study analyzed RNA-seq and clinical data from The Cancer Genome Atlas (TCGA) and Genotype-Tissue Expression (GTEx) databases to evaluate DHCR7 expression patterns in colorectal cancer (Colon Adenocarcinoma (COAD)/Rectal Adenocarcinoma (READ)). After converting Fragments Per Kilobase of Transcript per Million Mapped Reads (FPKM) to Transcripts Per Million (TPM) values and performing log2 transformation, non-parametric statistical analyses revealed significant DHCR7 expression differences between tumor and normal tissues (Mann-Whitney U test, p < 0.05). Survival analysis using Kaplan-Meier curves and Cox regression further assessed DHCR7’s prognostic value, with all analyses conducted in R using specialized bioinformatics packages (ggplot2, survminer) and considering p < 0.05 as statistically significant.
Cell culture and transfection
Human CRC cell lines, including SW480, SW620, and HCT116, along with the normal colorectal epithelial cell line NCM460, were procured from iCell in Shanghai, China. These cell lines underwent short tandem repeat (STR) profiling for authentication and were verified to be devoid of mycoplasma contamination. Cell cultures of SW480 and SW620 were maintained in Leibovitz’s L-15 medium supplemented with 10% fetal bovine serum. In contrast, HCT116 cells were cultivated in McCoy’s 5A medium with an identical serum concentration. All cultures were kept under incubation conditions of 37 °C and a 5% CO2 atmosphere. Modifications to the DHCR7 sequence (Table S3), along with viral and plasmid constructs, were provided by GenePharma (Shanghai, China). Following lentiviral transduction, cancer cells underwent a 2-week selection process with puromycin, after which they were cultured in a complete medium containing a reduced concentration of puromycin to establish cell lines with either high or low DHCR7 expression. The efficacy of the transfection procedure was confirmed by quantifying DHCR7 expression via qPCR post-transfection.
RNA extraction and RT-qPCR
Quantitative Real-Time Polymerase Chain Reaction (qRT-PCR) analyses were conducted in triplicate utilizing Bio-Rad’s CFX Connect Real-Time PCR Detection System (Bio-Rad, Hercules, CA, USA). The reactions were facilitated with SYBR Green Master Mix kits (product no. Q711; Vazyme, Nanjing, China), Bio-Rad’s facility in Hercules, California, USA. Reverse transcription was performed using TaKaRaScript™ Prime-time RT Master Mix (Perfect Real Time). To ascertain the relative expression levels of the genes of interest, the mean threshold cycle (Ct) values were normalized against the endogenous control gene, glyceraldehyde 3-phosphate dehydrogenase (GAPDH). The relative gene expression was subsequently quantified employing the 2−ΔΔCT method, a widely recognized approach for accurately determining gene expression changes. The primers used are listed in Table S3. Other Polymerase Chain Reaction (PCR) techniques reported in this study are in the Supplemental Materials.
Immunoblotting
The protein content within tumor samples, measuring 2 to 3 mm in diameter, was quantified using a Bicinchoninic Acid Assay (BCA) assay kit from Beyotime Biotech in Shanghai, China. For protein separation, equal volumes of lysed proteins were subjected to SDS-PAGE, followed by transfer onto polyvinylidene fluoride membranes. These membranes were pre-treated with a 5% skim milk buffer to block non-specific binding. They were then incubated with the primary antibodies at 4 °C overnight, followed by a 1-h incubation at room temperature with secondary antibodies that were horseradish peroxidase-linked. The western blot signals were visualized using the ProteaSimple ECL detection system from CA, USA. Antibody information is detailed in Table S2.
CCK8 assay
Cells were plated in 96-well plates with a concentration of 1 × 10³ cells per well. After a 24-h incubation period, cell viability was assessed using the Cell Counting Kit-8 (CCK-8) from Beyotime (Shanghai, China). The cells were maintained in 100 μL of medium, to which 10 μL of CCK-8 reagent was added, and then incubated for a period between 1 to 4 h at 37 °C. Subsequently, the absorbance was measured at 450 nm with a Multiskan FC microplate photometer.
Clone formation assay
Clonogenic assays were conducted with approximately 1,000 CRC cells per well of a 6-well culture plate for 12 to 14 days. In order to remove any residual growth medium, the cells were washed with Phosphate-Buffered Saline (PBS) after the growth medium was aspirated. Cells were fixed for 30 min with 4% paraformaldehyde (PFA). Using a 0.5% solution of crystal violet dye for 15 min, the cells were washed again with PBS to remove the fixative and stained with the solution after fixation. The cells were rinsed with PBS to remove excess dye, and colonies were photographed. The images were analyzed using ImageJ software to quantify the number of colonies.
Wound healing assay
CRC cells were seeded in 6-well plates at a density of 300,000–500,000 cells per well. After the cells adhered and reached 85–95% confluency, a scratch was made in the center of the well by a 200 L pipette tip. To assess the migration potential, the wounds were first rinsed with PBS and then incubated in a medium containing 2% Fetal Bovine Serum (FBS). Images were captured immediately after scratching and post-migration.
Transwell assay
Invasion was measured by adding diluted Matrigel (1:8 ratio of Matrigel to serum-free medium) to the upper surface of 24-well plate chambers (8.05 m PET membrane, Corning). The plates were left to incubate, which allowed the Matrigel to solidify into a gel layer. In the migration assay, CRC cells were plated in the upper compartment at a density of 20,000 to 50,000 cells per well with 200 μL of serum-free medium. Concurrently, 600 μL of medium enriched with 10% FBS was introduced to the lower compartment. The upper surface of the chambers was cleaned with cotton swabs after 24 h, and the lower surface was stained with 0.5% crystal violet after 4% PFA was used to fix the migratory/invasive cells. Invasive cells were counted under a microscope (Nikon, Tokyo, Japan) in five non-overlapping random areas, and the results were analyzed statistically.
Immunohistochemical staining analysis
The immunohistochemical staining procedure was performed as follows: Paraffin-embedded sections were deparaffinized in xylene and rehydrated through a graded ethanol series. Antigen retrieval was carried out using citrate buffer (pH 6.0) with microwave heating. Endogenous peroxidase activity was blocked by treating the sections with 3% hydrogen peroxide for 15 min, followed by blocking nonspecific binding sites with 5% Bovine Serum Albumin (BSA). Subsequently, the sections were incubated with primary antibodies (see Table S2) at 4 °C overnight, followed by incubation with Horseradish Peroxidase (HRP)-conjugated secondary antibodies at room temperature for 1 h. The target protein signals were visualized using a diaminobenzidine (DAB) chromogenic system, and cell nuclei were counterstained with hematoxylin to provide tissue structure localization. Finally, the sections were dehydrated through a graded ethanol series, cleared in xylene, mounted with neutral resin, and analyzed under an optical microscope. In tissue microarray analysis, we employ a standardized staining interpretation protocol. The specific scoring criteria are as follows: staining intensity is graded on a four-tier scale, with scores of 0 (negative), 0.5 (0.5+), 1 (1+), 2 (2+), and 3 (3+); the staining positivity rate is scored as a percentage, ranging from 0% to 100%. The final total score is calculated as the product of the staining intensity score and the staining positivity rate, yielding a numerical range of 0–300%. This total score serves as the standard for quantifying expression levels and requires independent interpretation for both cancerous tissues and adjacent normal tissues (epithelium).
Subcutaneous graft tumor model
All animal studies were conducted in compliance with the ethical guidelines established by the Ethics Committee of Gansu Provincial Hospital, with the specific approval number GSSY-2024-564, ensuring the welfare of the animals. The Gansu Provincial Hospital Animal Experiment Center reviewed and approved the experimental protocols. Male BALB/c nude mice, 5 weeks of age, were sourced from Viton Lever Ltd. in Beijing, China, and were housed in a pathogen-free environment at the Lanzhou University Animal Experiment Center (Table S4). The standardized screening procedure for animal experiments is “remove individuals with tumor volume <50 mm3 (calculated by the formula (length × width × width)/2) or volume fluctuation > 20% (n = 3/40) from the 7th day after vaccination”, while monitoring the animal health status daily (weight change > 15% or the experiment is terminated in advance if the activity is abnormal). To ensure comparability between experimental groups and compliance with animal ethics. Additionally, we implemented randomized grouping, ensured blinding, and devised a strategy to address potential confounding variables. For each experimental group, six mice received a subcutaneous injection and under local anesthesia (5 ml, 0.1 g lidocaine), in one side of the abdominal region with 5 × 10⁶ SW480 cells that had been transfected and resuspended in 200 μL of PBS. Post-injection, the mice’s tumor dimensions were monitored every 7 days, and on day 28, the mice were sacrificed and the tumors were removed. The tumor volume was calculated using the formula: tumor volume = (length * width * height)/2 (mm3). Every 7 days, fixed experimenters used calibrated calipers (accuracy 0.1 mm) to measure the tumor’s longest diameter (L) and shortest diameter (W). Prior to the end of experiment, we meticulously developed the euthanasia criteria and opted for the carbon dioxide method for the humane euthanasia of our experimental nude mice. The specific methods and criteria, ensuring the highest standards of animal welfare, are thoroughly documented in the Supplemental Files (Animal Euthanasia Protocol). Upon completion of the initial research project, surviving animals may remain housed within the laboratory for potential utilization in additional colorectal cancer-related studies. During this period, we are committed to maintaining their quality of life and administering requisite medical care.
Liquid chromatography-mass spectrometry/mass spectrometry analysis of sterols
After grinding the tissue, samples were processed with a tissue lyser at 20 Hz for 90 s, followed by freeze-thaw cycles and 15 min of ultrasonication. Residues were treated with a pyridine solution containing derivatization reagents, then mixed with water and extracted with Methyl Tert-Butyl Ether (MTBE) after standing at 80 °C for 60 min. The organic phase was dried under nitrogen and redissolved in acetonitrile for Liquid Chromatography-Mass Spectrometry (LC-MS)/MS analysis using a UHPLC-MS system with a Zorbax Eclipse Plus C18 column. Chromatographic separation was achieved with a gradient elution of water and acetonitrile, both containing 0.1% formic acid, and the mass spectrometer was optimized with an ion-spray voltage of 5,500 V, curtain gas pressure at 40 psi, and a temperature of 550 °C for electrospray ionization (ESI). Quantification of sterols was performed using an internal standard method after validation.
Exogenous cholesterol repletion experiment
CRC cells SW480 and HCT116 were seeded at a density of 2 × 10³ cells per well in a 96-well plate. The experimental groups were set as follows a 5% FBS culture group, a 5% lipoprotein-deficient serum Lipoprotein-Deficient Serum (LPDS) group, and a 5% LPDS group supplemented with human serum lipoproteins 5 μg/mL. At 0, 24, 48, and 72 h, 10 μL of CCK-8 reagent was added to each well and incubated at 37 °C in the dark for 2 h. The Optical Density (OD) values at a wavelength of 450 nm were measured using a microplate reader, with the reference wavelength set at 630 nm. For the scratch assay, CRC cells SW480 and HCT116 were first cultured in 5% FBS medium for 1 week before grouping. The groups were set as a 5% FBS culture group, a 5% LPDS culture group, and a 5% LPDS group supplemented with human serum lipoproteins 5 μg/mL. The cells were seeded at a density of 3 × 10⁶ cells per well in a 6-well plate. When the cells reached a confluence of 85% to 95%, a scratch was made in the center of each well using a 200 μL pipette tip. Images were captured at 0 and 24 h to assess the migration status of the cells under different cholesterol levels.
Philippine dyeing
The cell samples were first fixed with 4% paraformaldehyde, followed by washing with PBS to remove excess fixative. Subsequently, the samples were stained with hematoxylin for 5–10 min, washed, and then differentiated with 1% hydrochloric acid alcohol. The nuclei were returned to blue using a bluing solution. Next, the samples were stained with eosin for 1–2 min, washed, and dehydrated through a graded alcohol series. After dehydration, the samples were cleared with xylene and finally mounted with neutral gum. The stained cell samples were observed under an optical microscope, with nuclei appearing blue and cytoplasm green, revealing clear cellular structures.
Statistical analysis
Data analyses were conducted employing SPSS software, version 30.0.0, and the R programming environment, version 4.4.2. The Kolmogorov-Smirnov test was implemented to evaluate the distribution characteristics of the dataset. Data adhering to a normal distribution were presented as the mean with the corresponding standard deviation, formatted as mean ± SD. Conversely, data that did not adhere to a normal distribution were reported using median values and their associated interquartile ranges. For statistical comparisons, independent t-tests were applied to datasets that were both normally distributed and exhibited chi-squared variances. In instances where the data were not normally distributed or had unequal variances, the Mann-Whitney U test was employed for data analysis.
Results
Proteomic mass spectrometry analysis identified DHCR7 as a differentially highly expressed protein in CRC tissues
In this study, deep proteomic analysis was performed on three pairs of CRC tissues and adjacent normal tissues, identifying a total of 2,329 high-confidence proteins. Cluster heatmap analysis revealed that the expression level of DHCR7 was significantly upregulated in the CRC group (Fig. 1A), which was further validated in the volcano plot (Fig. 1B). Gene Ontology (GO) functional enrichment analysis indicated that the differentially upregulated proteins in the CRC group were primarily enriched in the following biological processes (BP): “cholesterol metabolism” and regulation of “metabolic process”; molecular functions (MF) were significantly enriched in “catelytic activity” (Fig. 1C). Kyoto Encyclopedia of Genes and Genomes (KEGG) enrichment analysis showed that the differentially expressed proteins were enriched in the steroid biosynthesis pathway (Fig. 1D). Further localization using KEGG Mapper revealed that DHCR7 is located at a key node downstream of the cholesterol biosynthesis pathway, and its upregulation may promote the biosynthesis of cholesterol end products by catalyzing the reduction of 7-DHC. Differential protein of gene set enrichment analysis (GSEA) based on Hallmark, KEGG, and GO gene sets further validated these findings. In the KEGG gene set, “steroid biosynthesis” (Normalized Enrichment Score (NES) = 3.62, Enrichment Score (ES) = 0.68) and “cholesterol metabolism” (NES = 2.64, ES = 0.61) were significantly positively enriched (Fig. 1E). In the GO gene set, “cholesterol biosynthetic process” (GO:0006695, NES = 3.58, ES = 0.69) and “regulation of cholesterol homeostasis” (GO:0008204, NES = 3.50, ES = 0.68) also showed significant enrichment (Fig. 1E). These results suggest that the cholesterol metabolism pathway is abnormally activated in CRC tumor tissues, and DHCR7, as a core hub protein in this metabolic network, may promote tumor progression by driving cholesterol metabolic reprogramming.
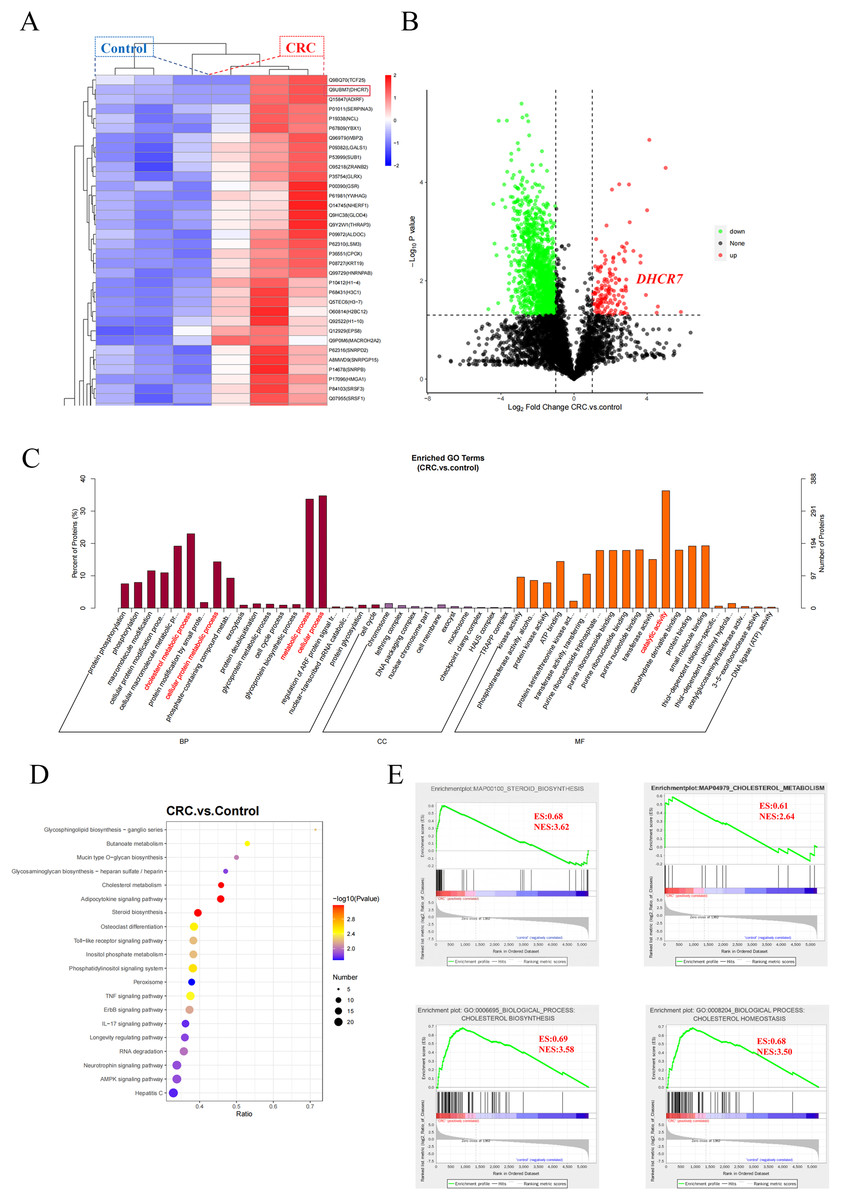
Figure 1: Data of protein mass spectrometry of CRC tissue.
(A) Hierarchical clustering heatmap analysis of three pairs of CRC tissues and adjacent normal tissues. (B) Volcano plot analysis of three pairs of CRC tissues and adjacent normal tissues. (C) GO functional enrichment analysis of three pairs of CRC tissues and adjacent normal tissues. (D) KEGG functional enrichment analysis of three pairs of CRC tissues and adjacent normal tissues. (E) Differential protein of GSEA based on Hallmark, KEGG, and GO.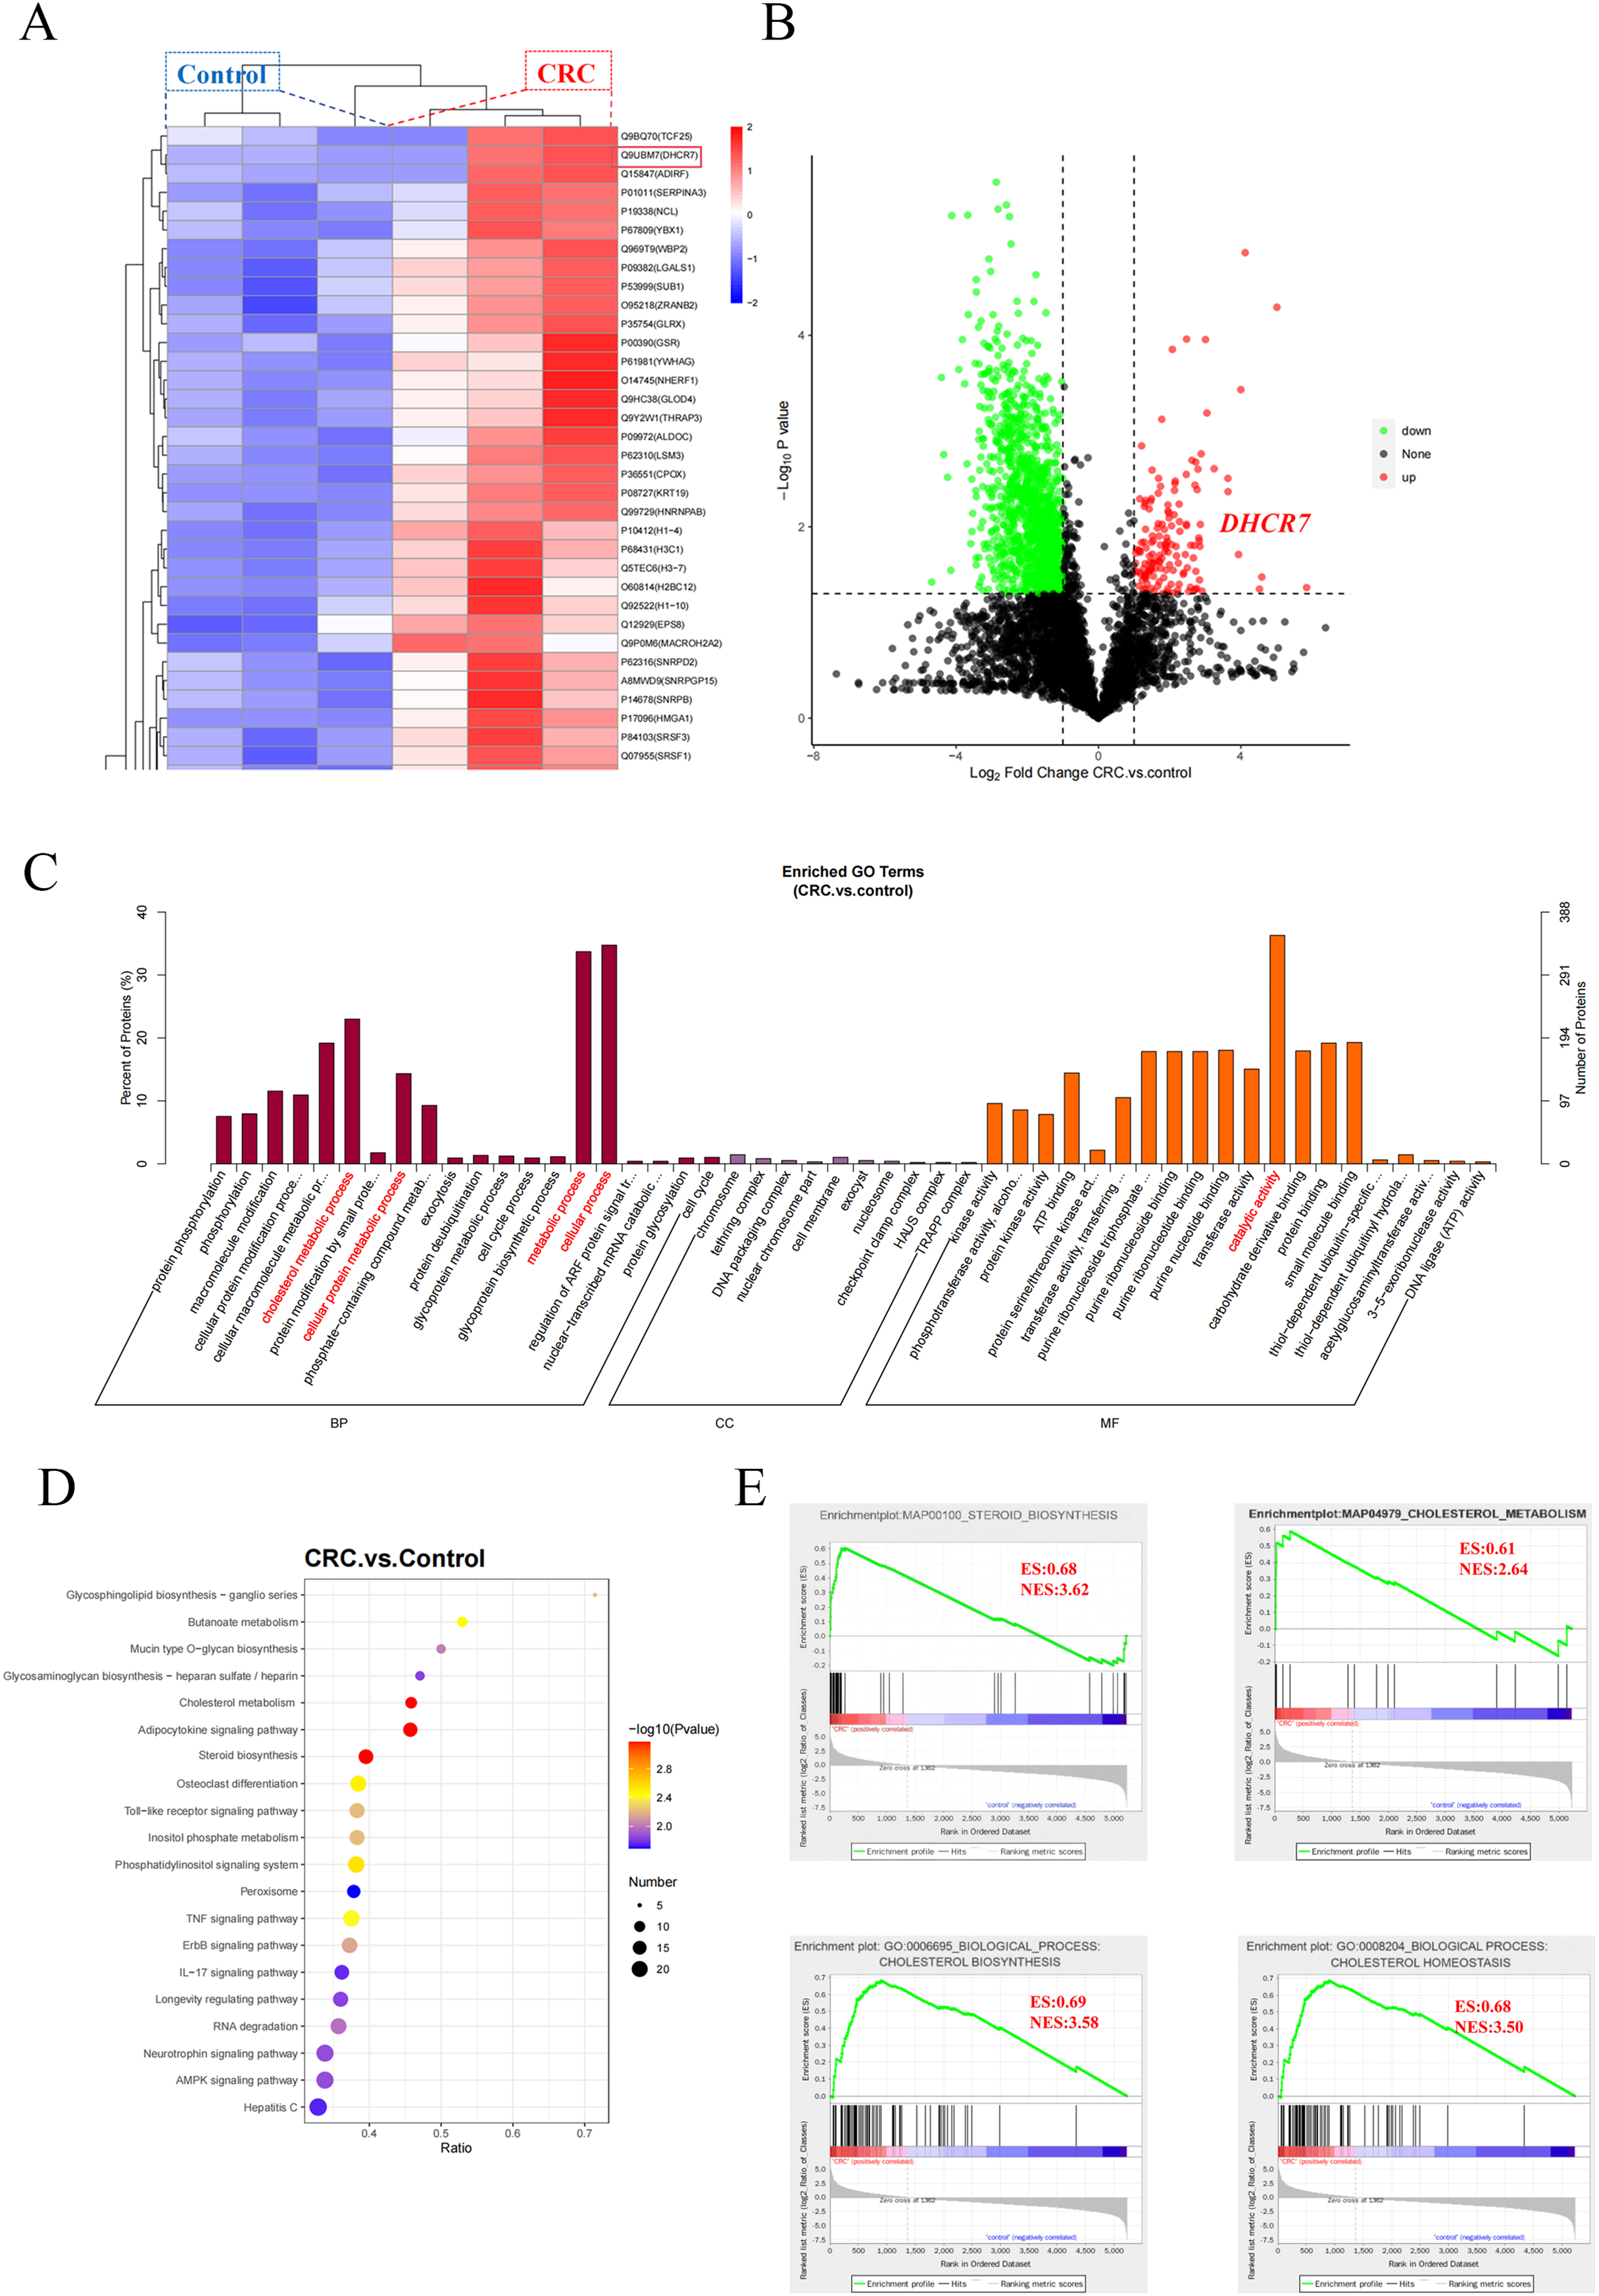
DHCR7 is highly expressed in CRC tissues and is associated with poor prognosis
To further validate the proteomic MS results and elucidate the expression pattern and clinical significance of DHCR7 in CRC, this study integrated a multi-dimensional analysis strategy. Firstly, bioinformatics analysis based on the TCGA and GTEx databases revealed that the mRNA expression level of DHCR7 in CRC tissues was significantly higher than that in normal tissues (Figs. 2A, 2B), and patients with high expression exhibited a significantly lower 5-year overall survival (OS) rate (p < 0.05, Fig. 2C). In a retrospective cohort comprising 90 pairs of CRC tumor and adjacent normal tissues (Table S1), high expression of DHCR7 protein was significantly associated with poor prognosis (HR = 2.43, 95% CI [1.23–4.81], p = 0.011, Fig. 2F). Immunohistochemical (IHC) analysis further confirmed at the morphological level that DHCR7 was highly expressed in tumor tissues, with staining signals primarily localized in the cytoplasm and accompanied by disorganized glandular structures (Fig. 2D). Using a standardized staining evaluation protocol, the positive staining rate in tumor tissues was found to be significantly higher than that in corresponding adjacent tissues (p < 0.001, Fig. 2G); the Wilcoxon rank-sum test further validated that DHCR7 expression in tumor tissues was significantly higher than in adjacent tissues (p < 0.001, Fig. 2E). These consistent results indicate that DHCR7 plays a pro-tumorigenic role in CRC, and its high expression may influence tumor progression and patient survival outcomes by regulating cholesterol metabolic reprogramming (Fig. 2H).
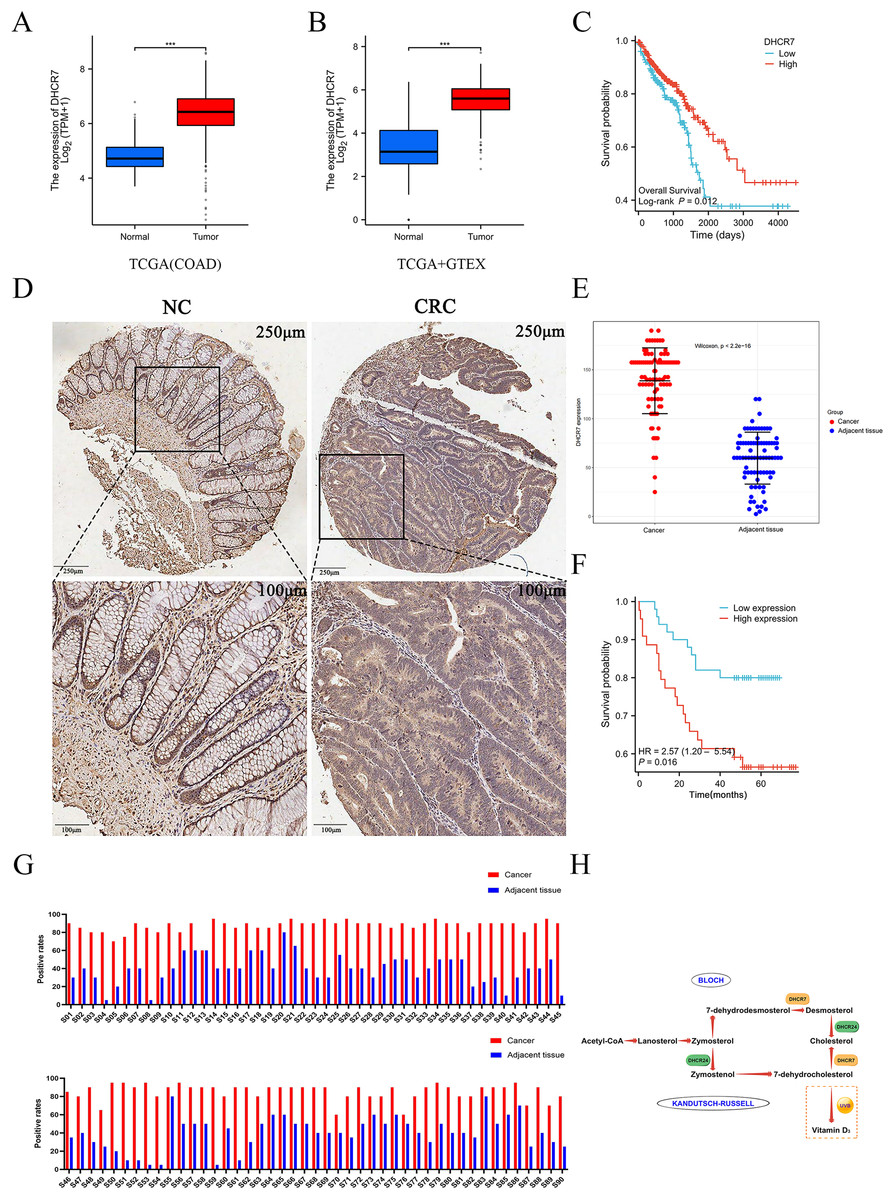
Figure 2: The differential expression of DHCR7 in CRC patients is associated with poor prognosis.
(A) Comparative analysis of DHCR7 expression in normal and tumor tissues in the TCGA database. (B) Comparative analysis of DHCR7 expression in normal and tumor tissues in the TCGA +GTEX database. (C) High expression of DHCR7 worsens the overall survival of TCGA CRC patients. (D, E) IHC revealed that in the tissue microarray of CRC patients, the expression level of DHCR7 was statistically significant (p < 0.05), indicating that the expression level of DHCR7 was higher in tumor tissues compared to adjacent non-cancerous tissues. (F) Data from local patients support that high expression of DHCR7 worsens overall survival in CRC patients. (G) Immunohistochemical positive rate maps were performed on 90 microarray colon cancer tissue samples and corresponding non-cancer tissue samples. (H) The simplified schematic representation of the biosynthetic pathways for cholesterol and vitamin D. ***p < 0.001 compared with control (ANOVA or Student’s t-test).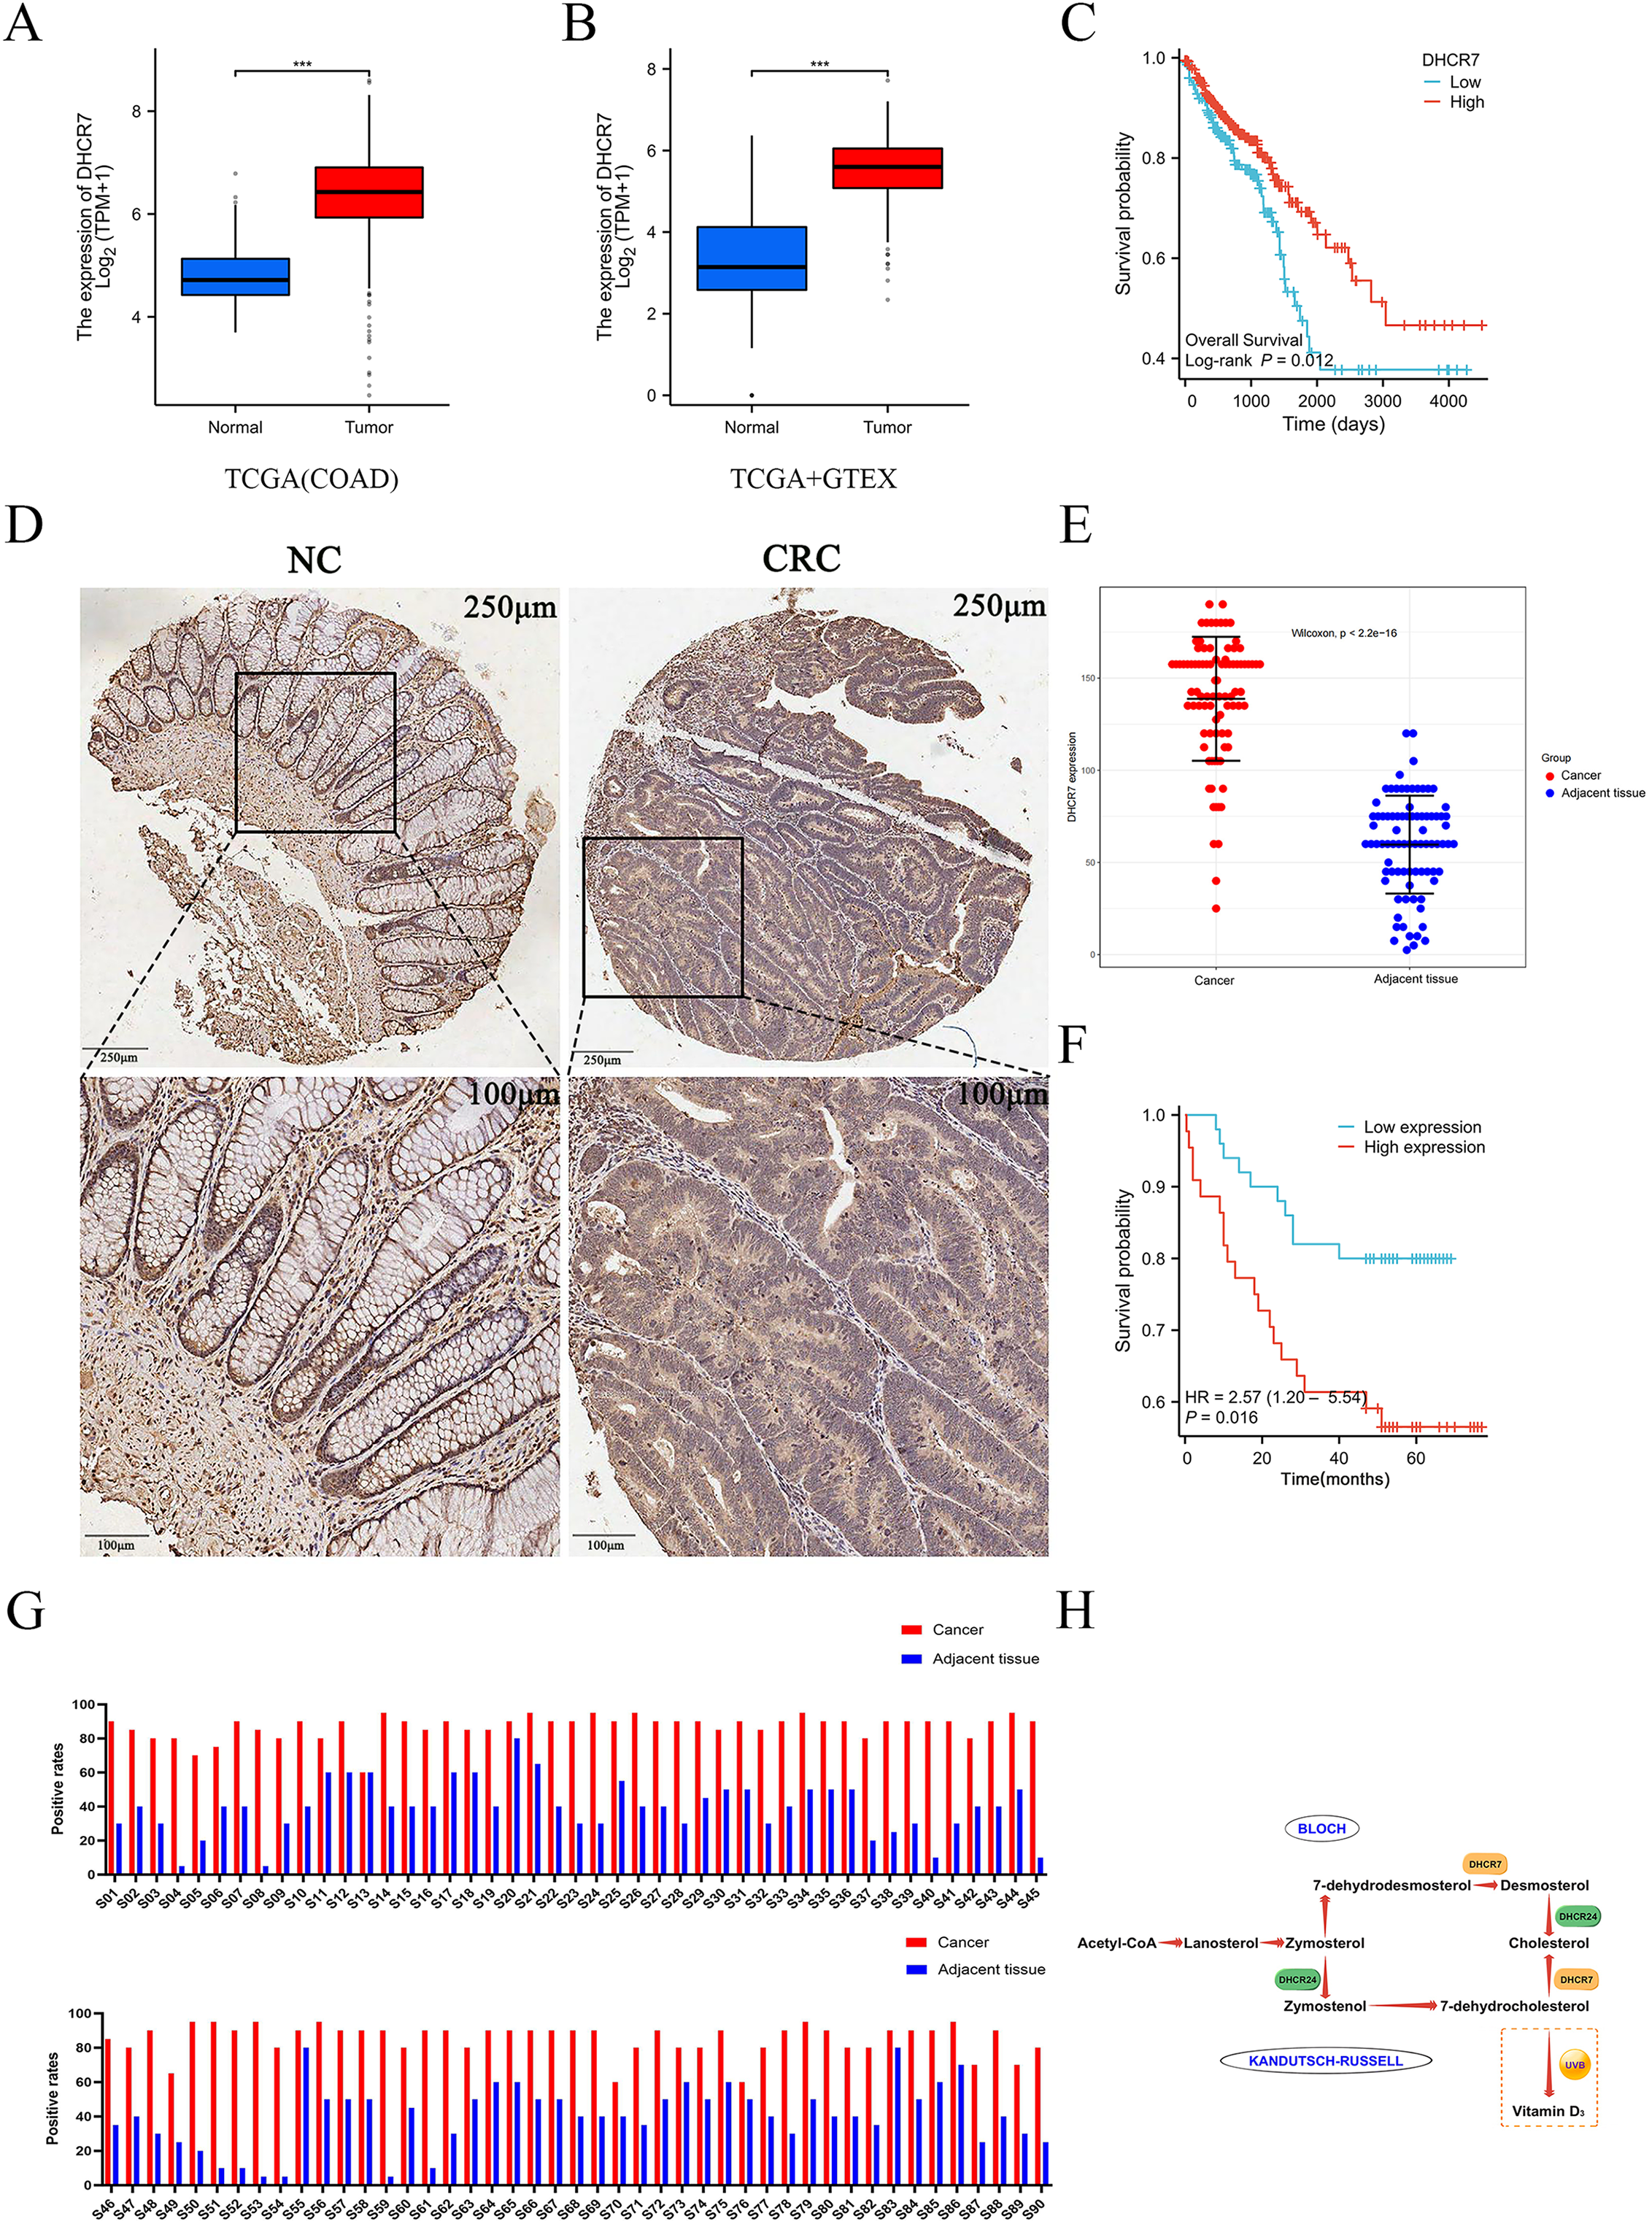
DHCR7 inhibition reduces the proliferation capacity of CRC cells
Differential expression of DHCR7 mRNA was observed across various CRC cell lines, including NCM460 as control. Notably, significant disparities were found between SW480 and HCT116 lines, highlighting their suitability as cellular models for further investigation (Fig. 3A). To deepen our investigation, a DHCR7-deficient cell model was established. After transfecting CRC cells with siDHCR7 constructs, DHCR7 mRNA expression was assessed through qRT-PCR. The results revealed that the si-DHCR7-2 fragment, containing two interfering sequences, exhibited the most effective suppression of DHCR7 expression in both cell lines (Fig. 3B). The siDHCR7-2 treatment also significantly reduced DHCR7 protein levels compared to the negative control (NC) group (Fig. 3C), demonstrating that DHCR7 had been successfully downregulated (Fig. 3B). Following the identification of si-DHCR7-2 as a candidate for deeper investigation, assays such as CCK-8 and colony formation were employed to assess the impact of DHCR7 suppression on the viability and clonogenic potential of SW480 and HCT116 cell lines. The results indicated that the inhibition of DHCR7 led to a decrease in both cell viability and the ability to form colonies in these cell lines (Figs. 3D, 3E).
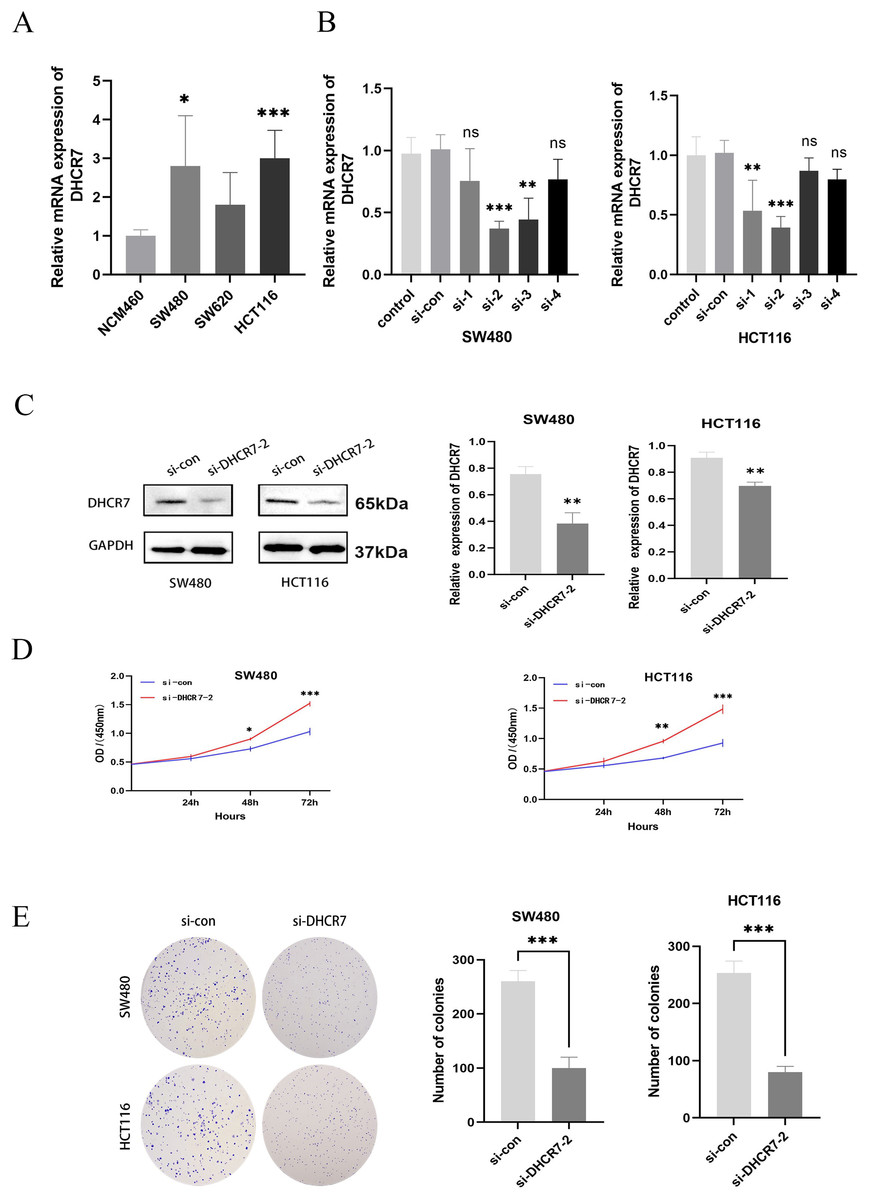
Figure 3: Silencing DHCR7 significantly inhibited CRC cells proliferation in vitro.
(A) Expression of DHCR7 mRNA in different CRC cell lines (B, C) Protein and RNA expression levels after knockdown of DHCR7 in SW480 and HCT116 cells. (D) The proliferation of cells in the DHCR7 knockdown group and the control group at 24, 48, 72 were detected by CCK-8 method in SW480 and HCT116 cells. (E) Colony formation with DHCR7 knockdown in SW480 and HCT116 cells. Glyceraldehyde-3-Phosphate Dehydrogenase (GAPDH) is used as loading control. ns: no significant difference; data are shown as mean ± SD of three independent experiments, *p < 0.05, **p < 0.01, ***p < 0.001 compared with si-con ANOVA or Student’s t-test.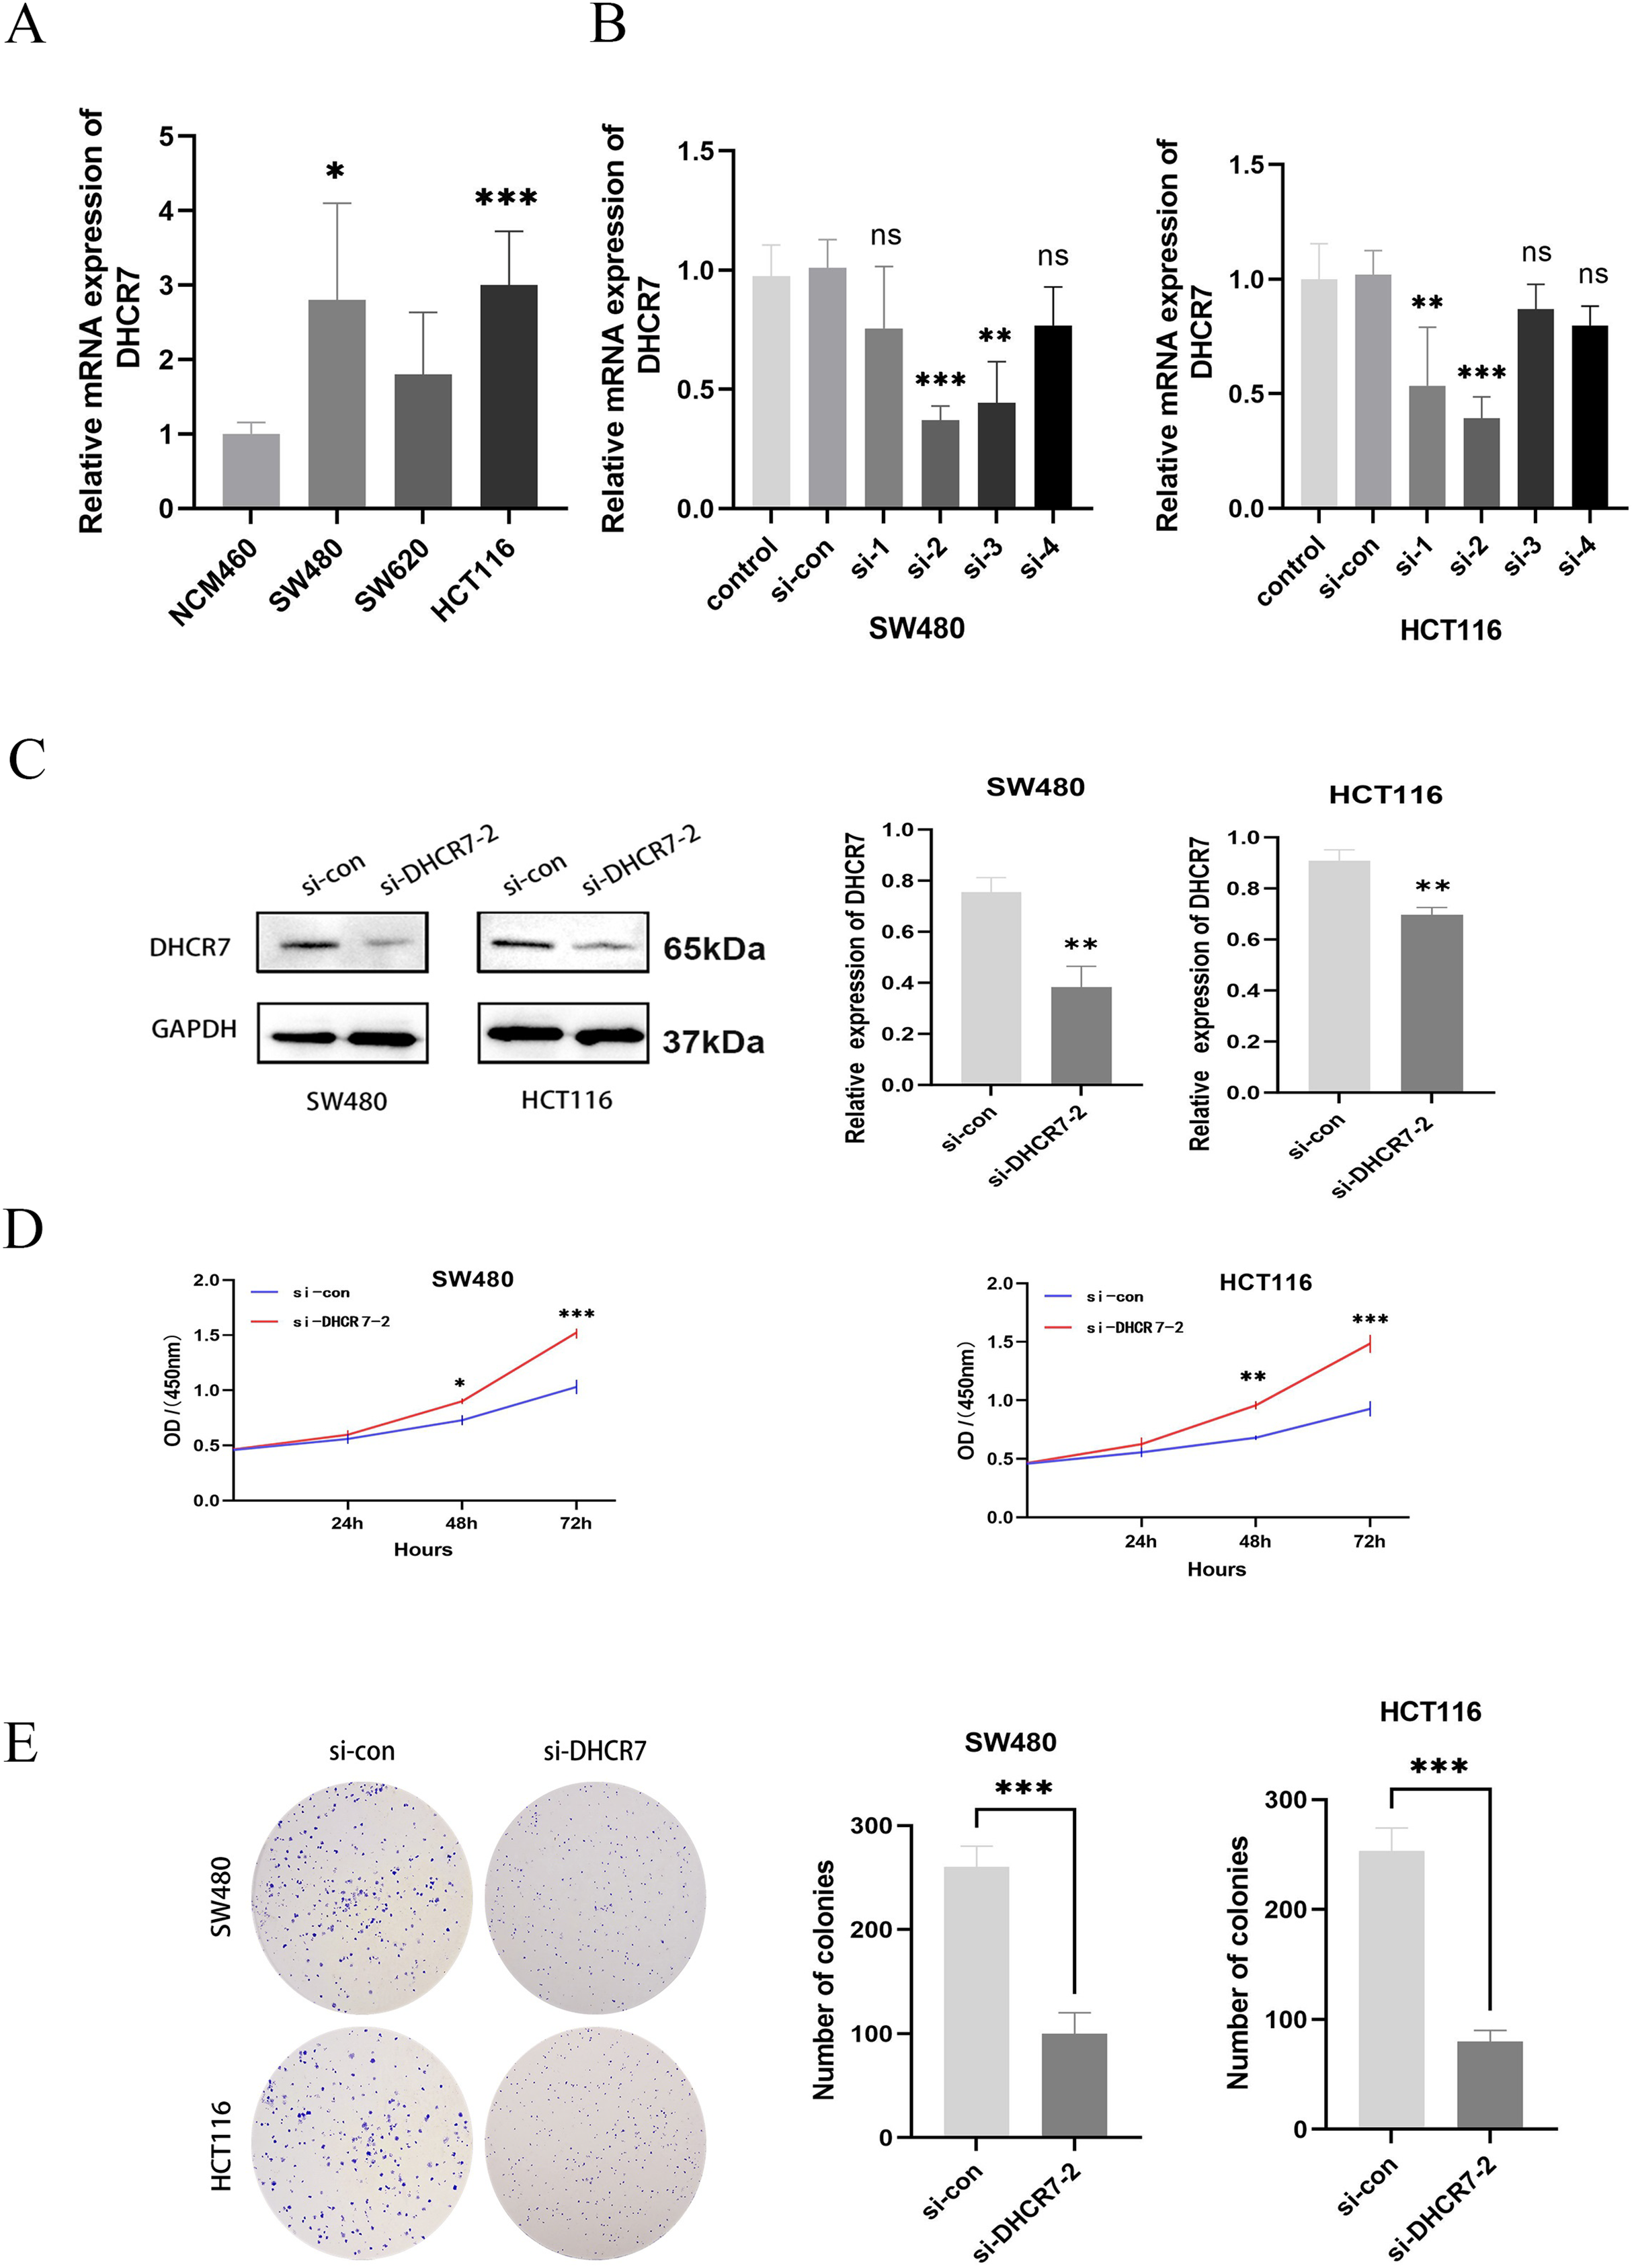
Migration and invasion of CRC cells are suppressed by depleting DHCR7
A significant decrease in migration was observed in SW480 and HCT116 cells with knockdown of DHCR7, both in wound healing assays (Fig. 4A) and transwell assays (Figs. 4B, 4C). Figure 4D showed that the DHCR7 knockdown cells expressed significantly lower levels of N-cadherin (N-Ca), matrix metalloproteinase-9 (MMP-9) and Vimentin, while e-cadherin (E-Ca) was significantly increased.
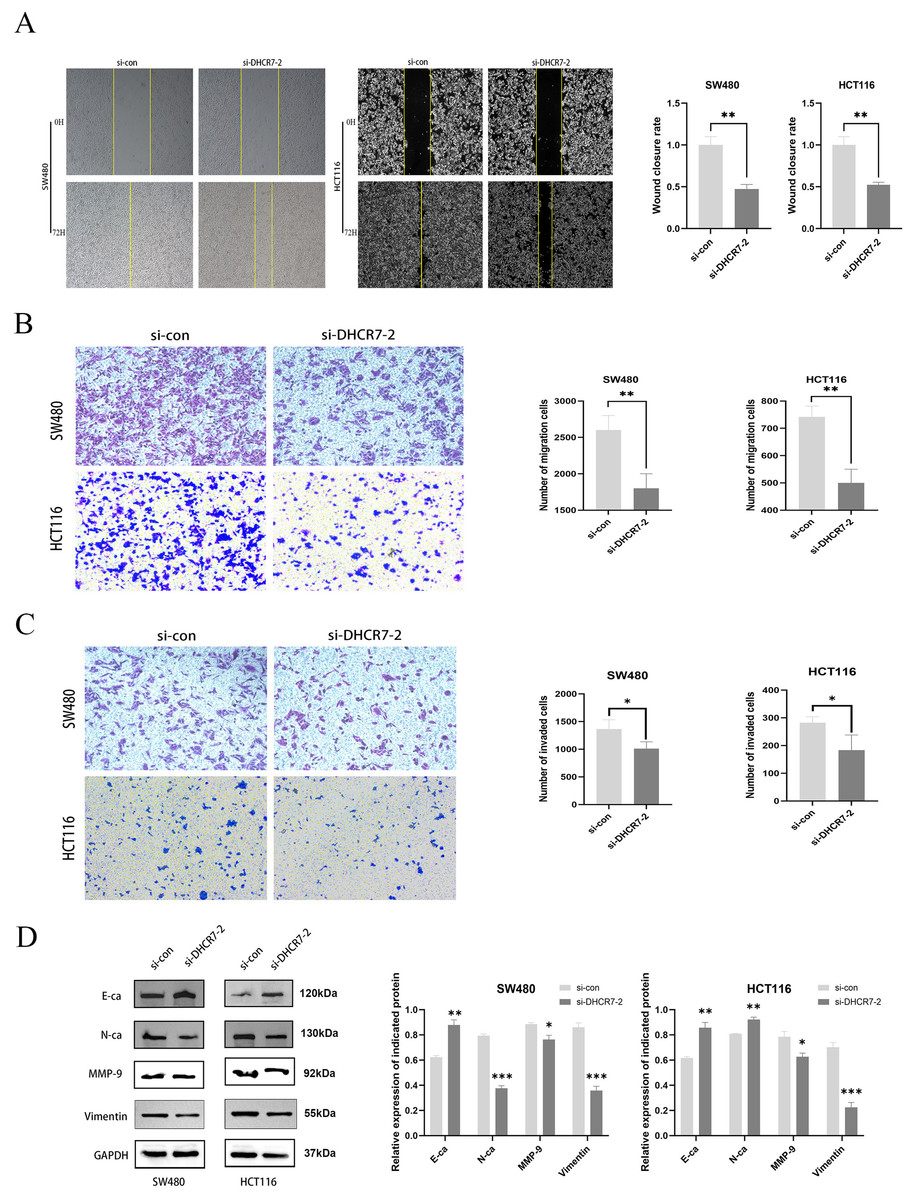
Figure 4: The suppression of DHCR7 expression inhibits cellular migration and invasion capabilities.
(A) The 72 h wound healing assay conducted in SW480 and HCT116 cells and the statistical analysis. (B) Transwell migration assay performed in SW480 and HCT116 cells and statistically analyzed. (C) Transwell invasion assay performed in SW480 and HCT116 cells and statistically analyzed. (D) Immunoblotting of proteins in relation to Epithelial-Mesenchymal Transition (EMT) in SW480 and HCT116 after knockdown of DHCR7. GAPDH is used as loading control. *p < 0.05; **p < 0.01; ***p < 0.001 compared with ANOVA or Student’s t-test.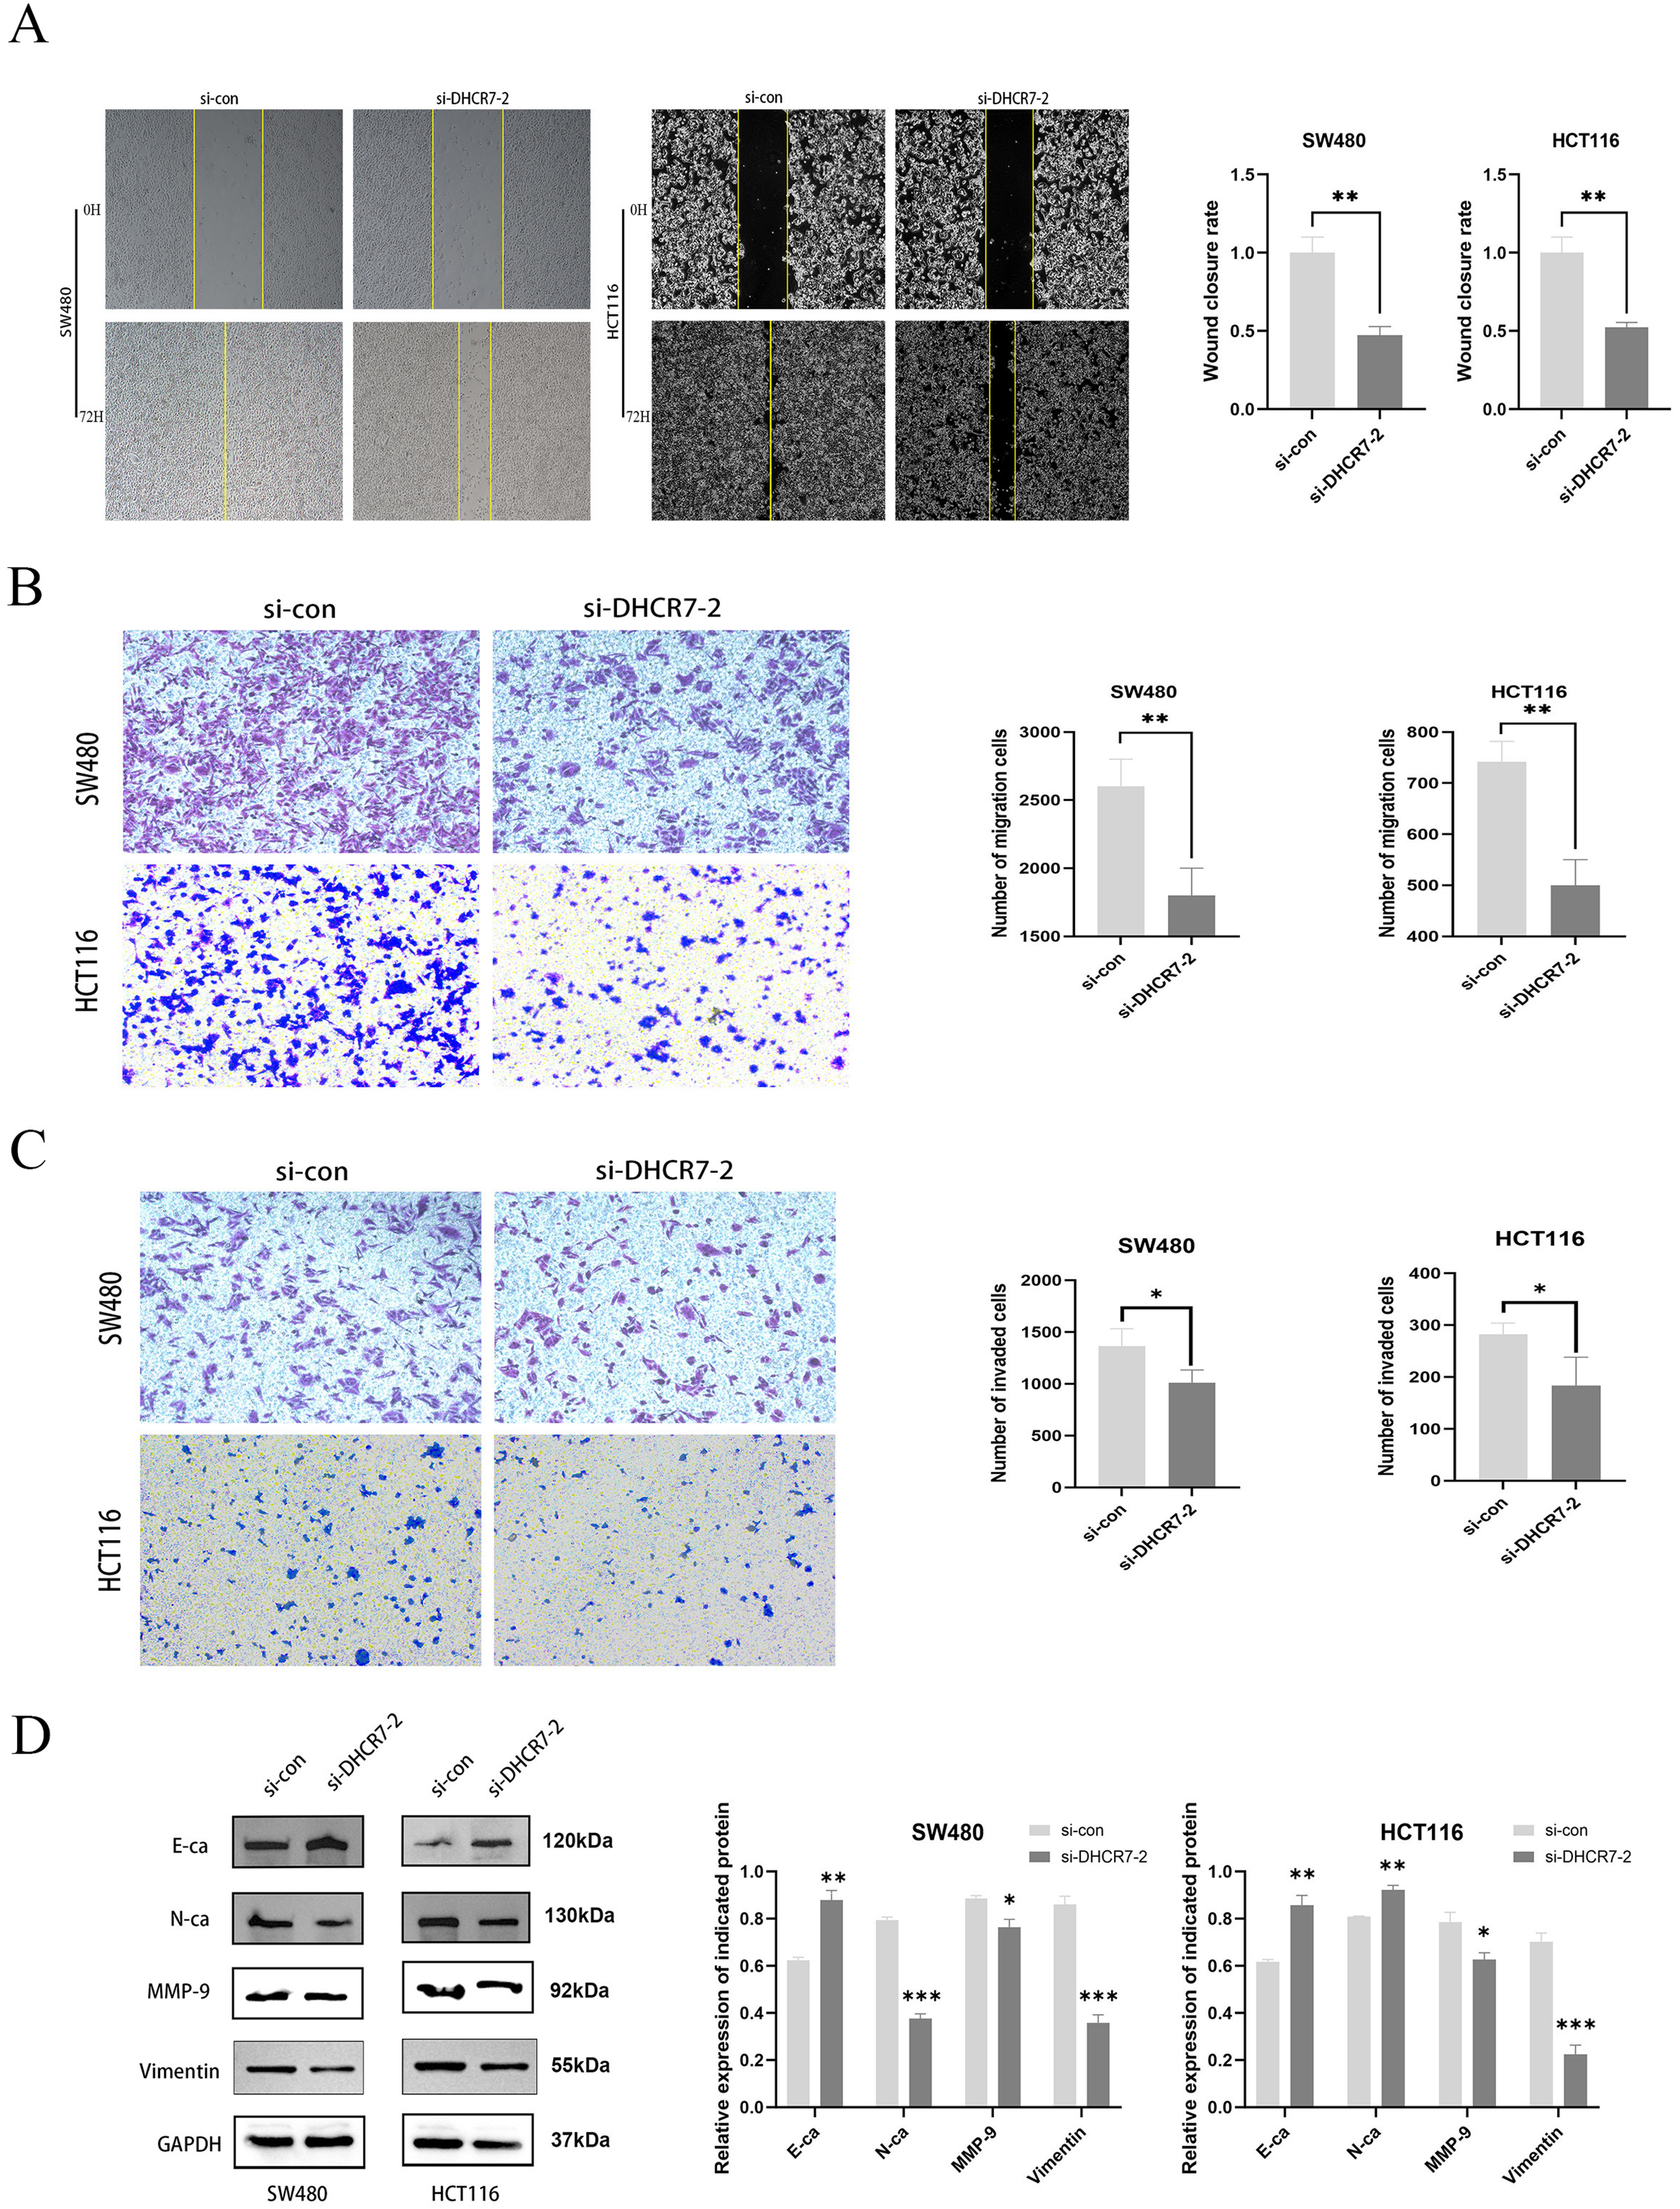
Knockdown of DHCR7 inhibited cell proliferation in CRC cells, arrested G1 phase cell cycle, and affected PI3K/AKT/mTOR signaling
The inhibition of DHCR7 increased apoptosis in CRC cells, as revealed by flow cytometry (Fig. 5A). Moreover, treatment with si-DHCR7 increased the proportion of G1 phase cells. In contrast, the S-phase was shortened in both cell models (Fig. 5B). As a result of knockdown of DHCR7, apoptosis-related proteins and cell cycle-related proteins were significantly reduced (Fig. 5C). Moreover, Gene Set Enrichment Analysis (GSEA) analysis revealed that patients with high DHCR7 expression showed altered sterol metabolism, cell cycle, DNA replication, as well as PI3K/AKT/mTOR pathway activity (Fig. 5D). Additionally, western blotting analysis demonstrated that cells deficient in DHCR7 showed a suppression of PI3K/AKT/mTOR signaling, as evidenced by PI3K, p-AKT, and p-mTOR protein levels being lower (Fig. 5E).
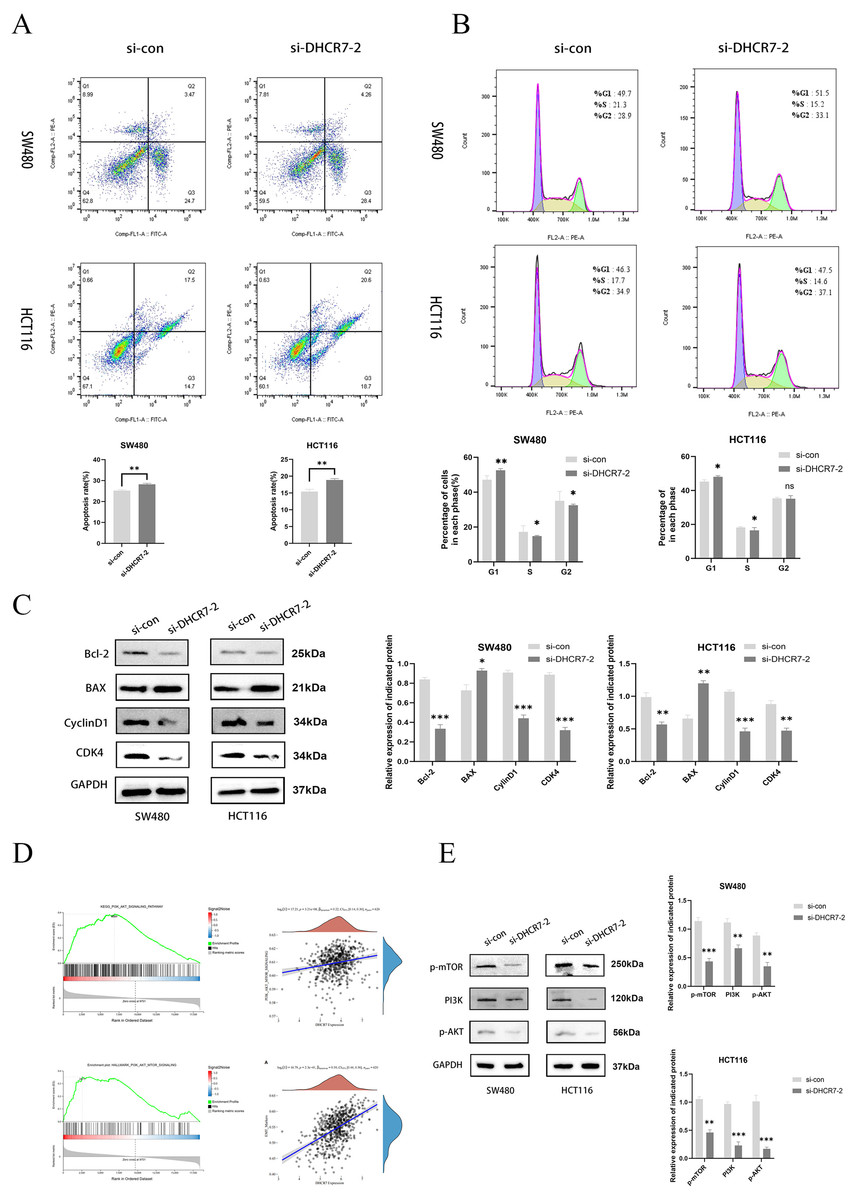
Figure 5: Silencing DHCR7 triggered cell apoptosis, caused G1 phase arrest, and affected the PI3K/AKT/mTOR pathway.
(A) Flow cytometry assessed apoptosis in SW480 and HCT116 cells following 48-h DHCR7 knockdown, with statistical analysis showing the apoptotic rate (%) in CRC cells. (B) Cell cycle distributions in SW480 and HCT116 cells were analyzed after treatment with DHCR7 siRNA and related statistical analysis, as detected by flow cytometry. (C) Immunoblotting analysis revealed the impact of DHCR7 knockdown on the expression levels of proteins associated with apoptosis and the cell cycle in SW480 and HCT116 cell. Protein expression was statistically analyzed. (D) GSEA analysis showed that in CRC, high expression of DHCR7 showed significant enrichment with processes related to sterol metabolism, cell cycle, DNA replication, and PI3K/AKT/mTOR signaling pathway. (E) Correlation analysis between DHCR7 and the PI3K/AKT/mTOR signaling pathway was conducted. Immunoblotting were used to determine the impact of DHCR7 knockdown on the protein expression levels of PI3K, p-AKT, and p-mTOR in SW480 and HCT116 cells, and the protein expression data were statistically analyzed. GAPDH was used as loading control. *p < 0.05; **p < 0.01; ***p < 0.001 compared with si-NC (ANOVA or Student’s t-test).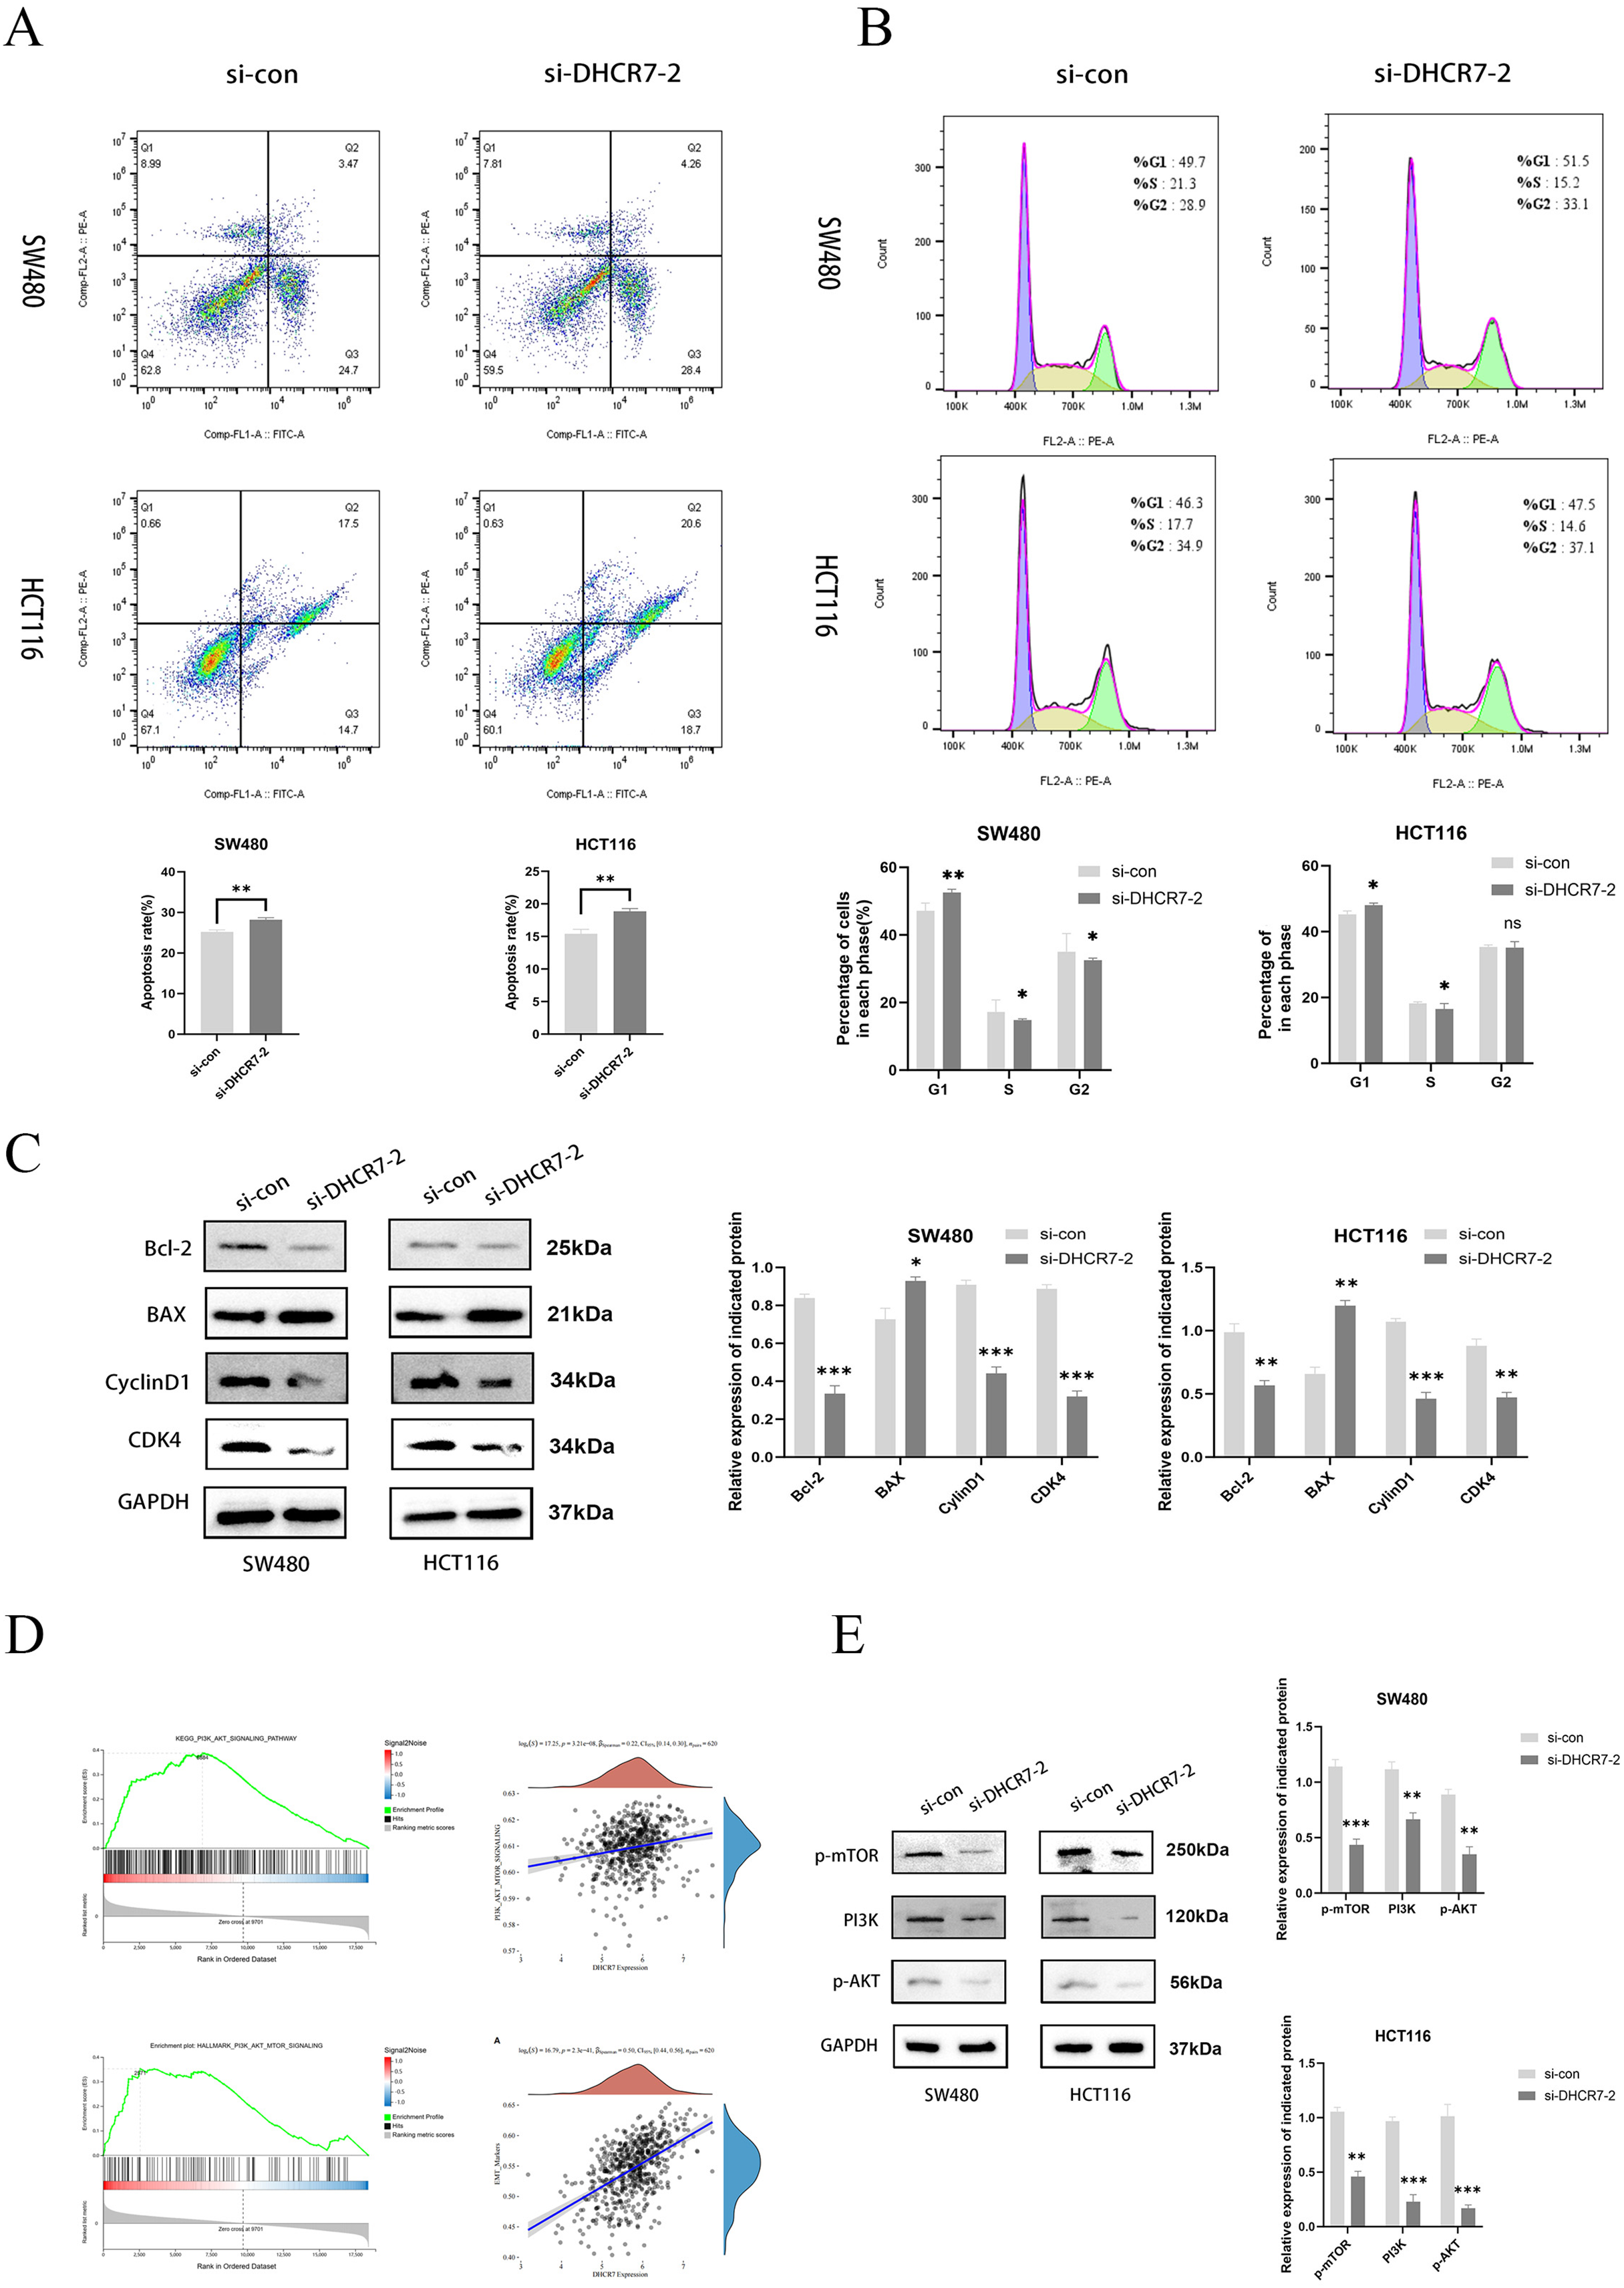
Proliferation, migration, and invasion of CRC cells are enhanced by overexpression of DHCR7
To further investigate the role of DHCR7 in CRC, DHCR7 overexpression experiments were performed, which confirmed the efficiency of DHCR7 overexpression (Figs. 6A, 6B). CCK-8 and colony formation assays demonstrated that the overexpression of DHCR7 significantly increased the survival and proliferation of SW480 and HCT116 cells (Figs. 6C, 6D). Additionally, scratch assays demonstrated that DHCR7 overexpression significantly accelerated wound healing (Fig. 6E) and enhanced cell migration and invasion (Fig. 6F). Moreover, overexpression of DHCR7 led to up-regulation of proteins associated with cell migration, including N-Ca, MMP-9, and Vimentin, while E-Ca was down-regulated (Fig. 6G). This finding offers valuable insights into the molecular mechanisms through which DHCR7 modulates cell migration in CRC.
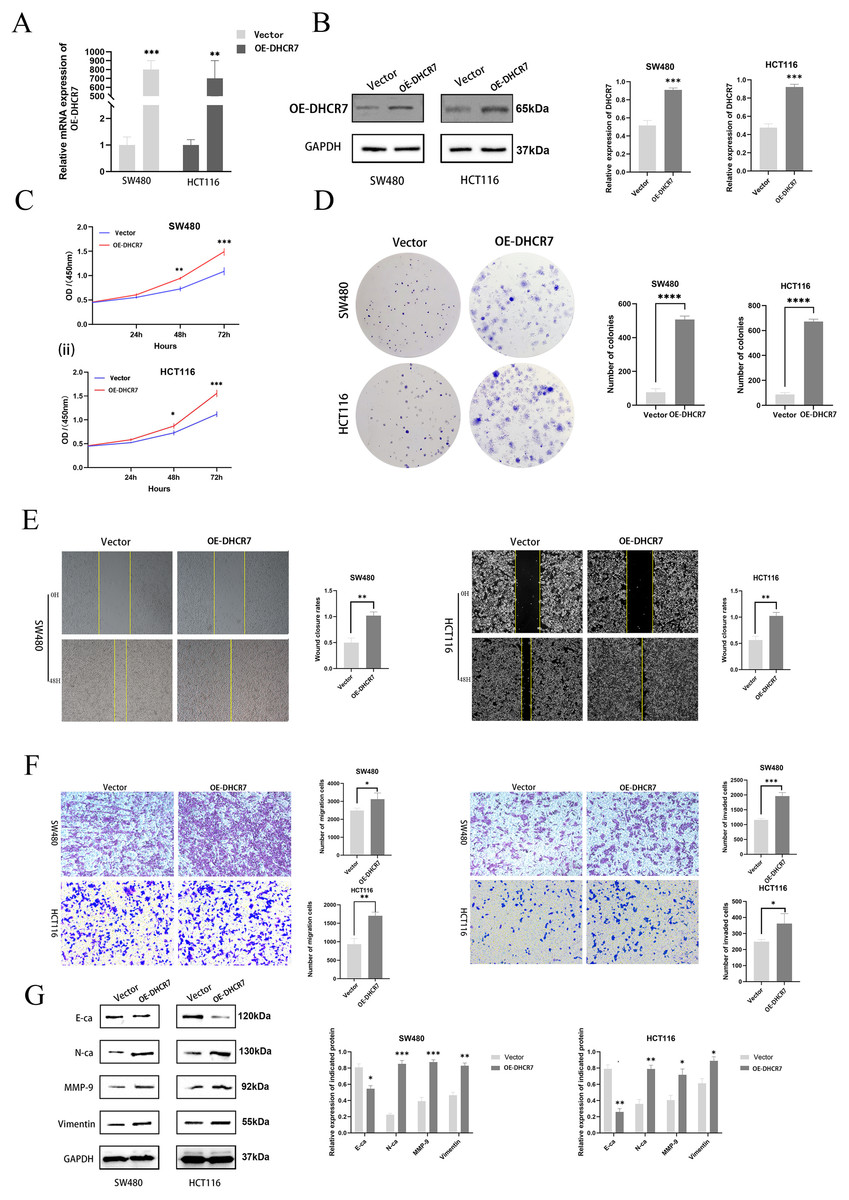
Figure 6: Overexpression of DHCR7 significantly enhanced the proliferation of CRC cells, promoted cell migration and invasion in vitro.
(A, B) Protein and RNA expression levels in SW480 and HCT116 cells after overexpression of DHCR7. (C) The proliferation of cells in the DHCR7 overexpression group and the control group at 24, 48, 72 were detected by CCK-8 method in SW480 and HCT116 cells. (D) The effect of overexpression of DHCR7 on CRC proliferation was tested by clone formation assay. (E, F) The migration and invasion of cells in the DHCR7 overexpression group and the vector group were detected by wound healing and transwell in SW480 and HCT116 cells. (G) Immunoblotting of proteins in relation to EMT in SW480 and HCT116 after expression of DHCR7. GAPDH is used as loading control. *p < 0.05; **p < 0.01; ***p < 0.001; ****p < 0.0001 compared with ANOVA or Student’s t-test.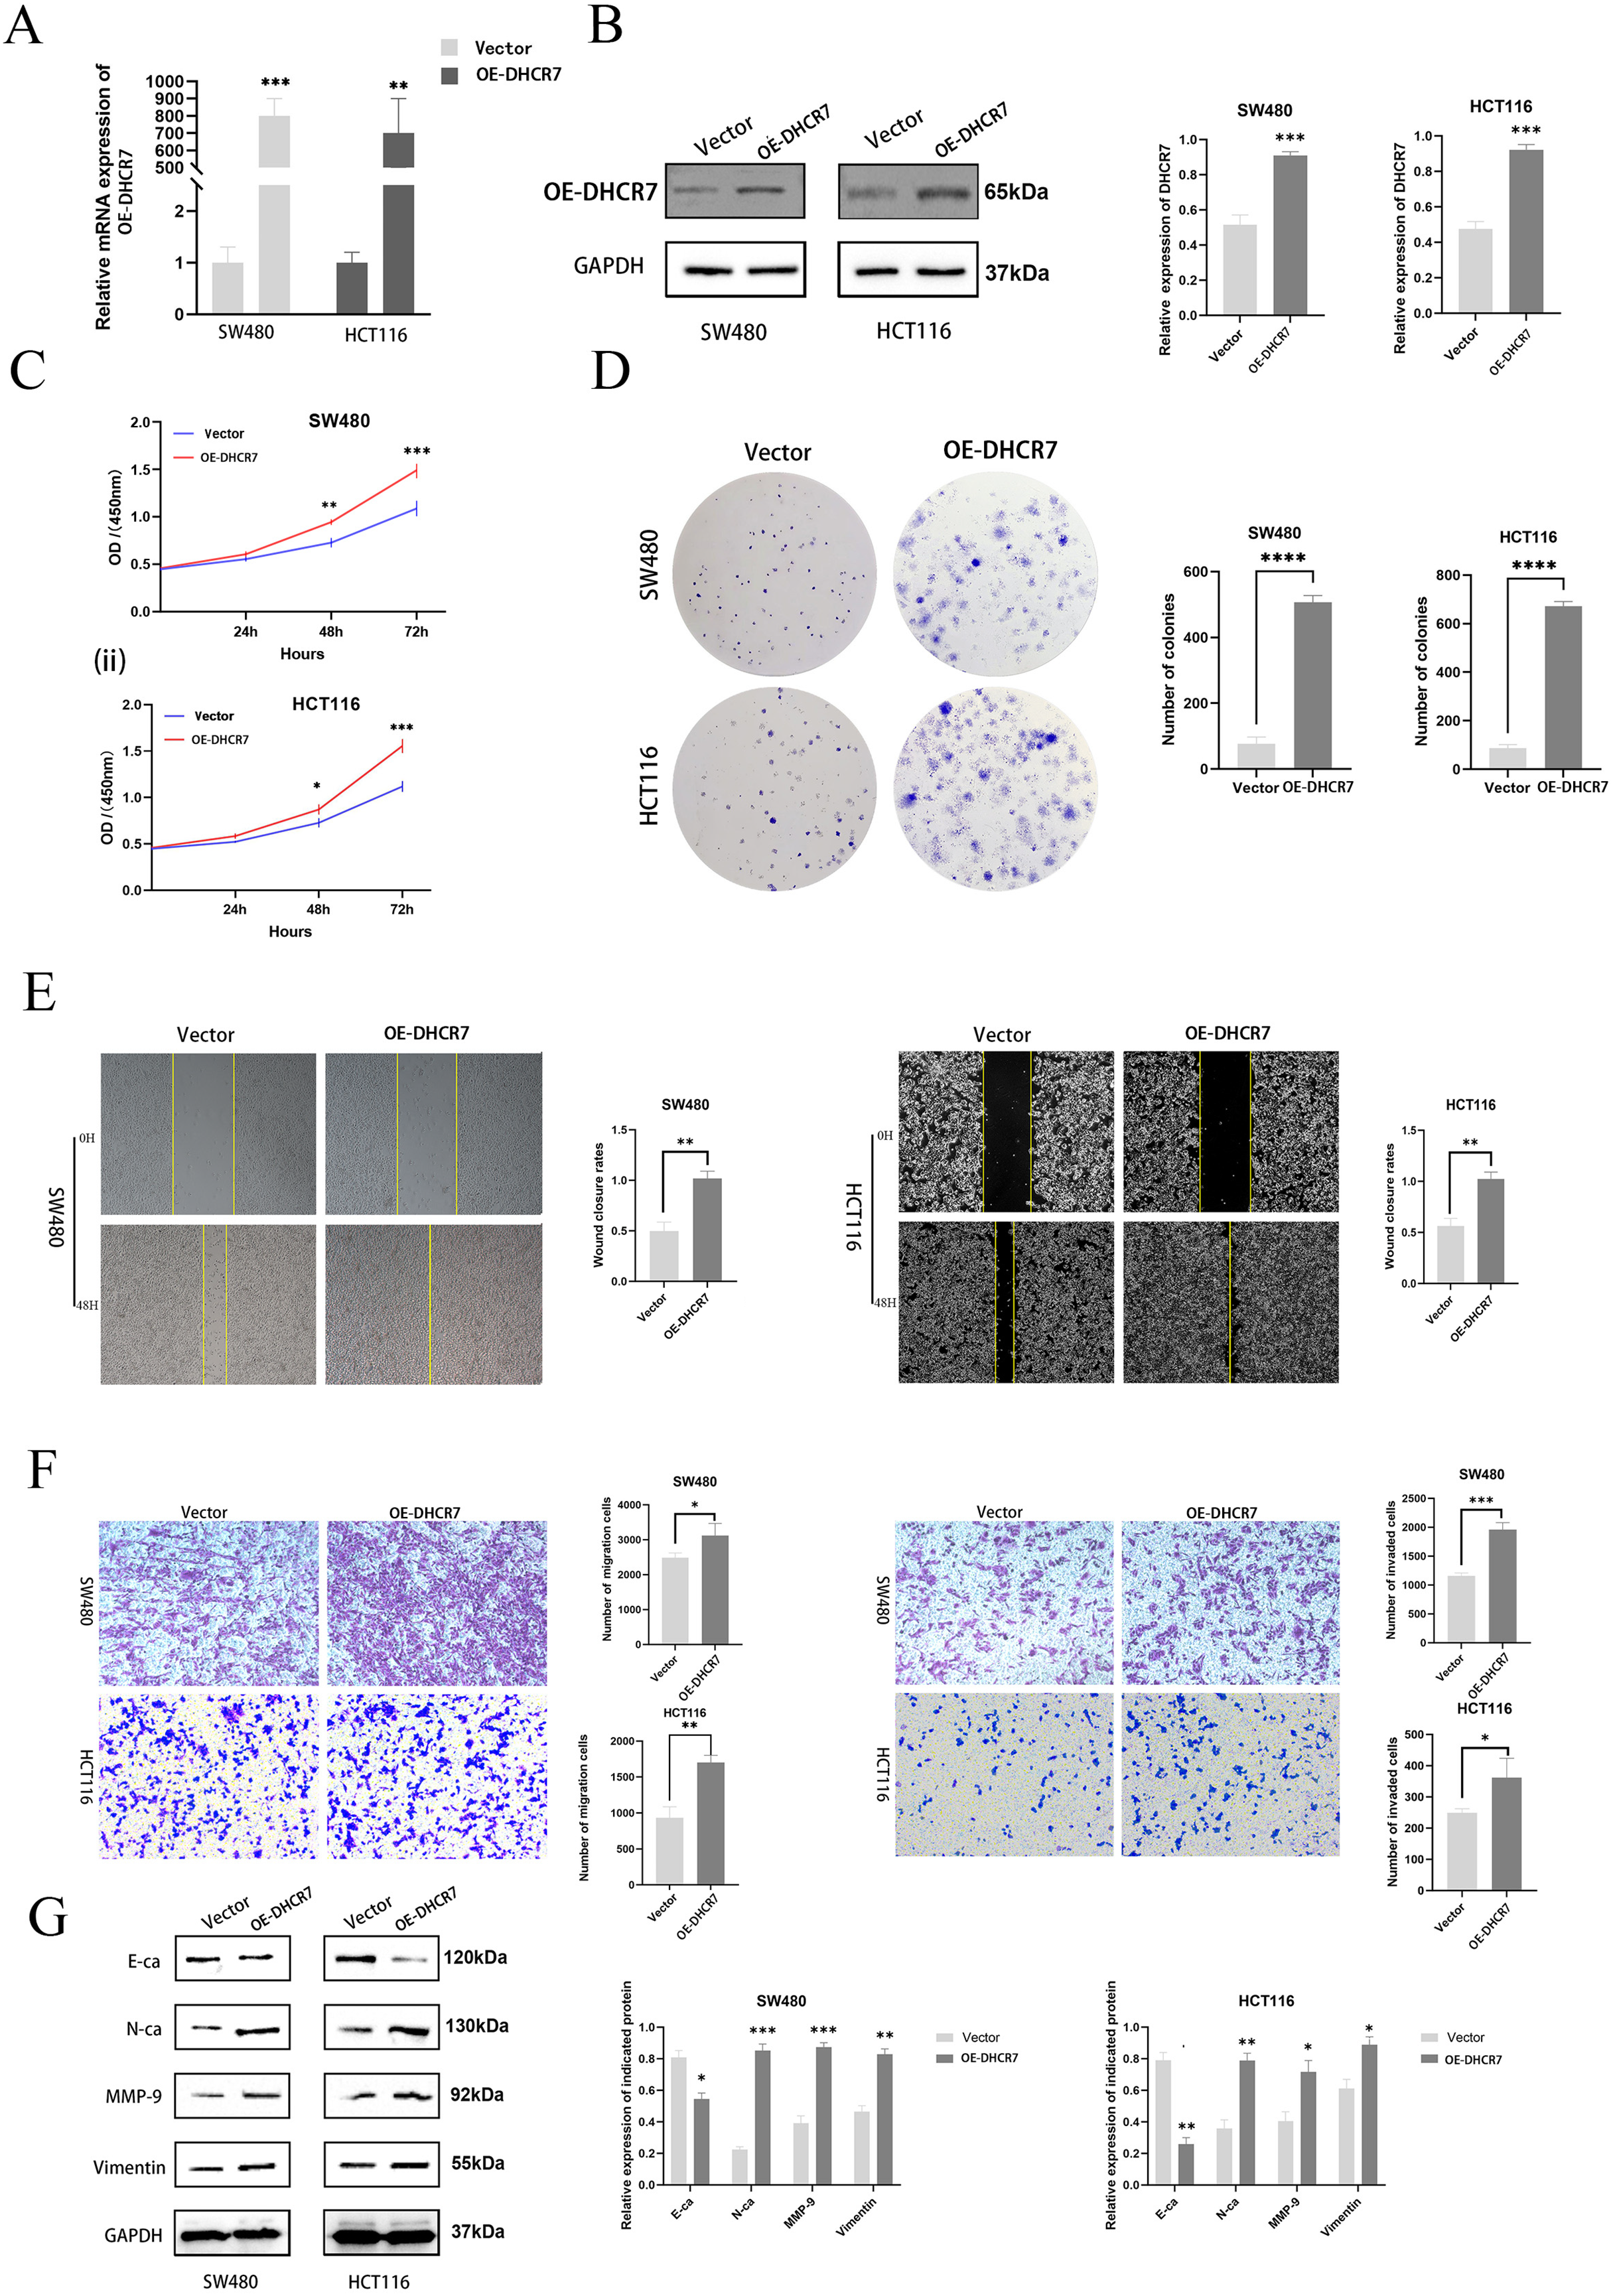
The overexpression of DHCR7 diminishes apoptosis and G1 phase arrest while activating the PI3K/AKT/mTOR signaling pathway
CRC cells overexpressing DHCR7 exhibited significantly suppressed apoptosis (Fig. 7A) accompanied by characteristic cell cycle alterations, manifested as a marked reduction in G1-phase cell population with a concurrent prominent increase in S-phase cell proportion (Fig. 7B). Furthermore, the overexpression of DHCR7 resulted in changes in the expression levels of proteins associated with apoptosis and cell cycle regulation (Fig. 7C). Notably, the accumulation of DHCR7 activated critical proteins within the PI3K/AKT/mTOR signaling pathway, thereby reinforcing its contributory role in tumor progression (Fig. 7D).
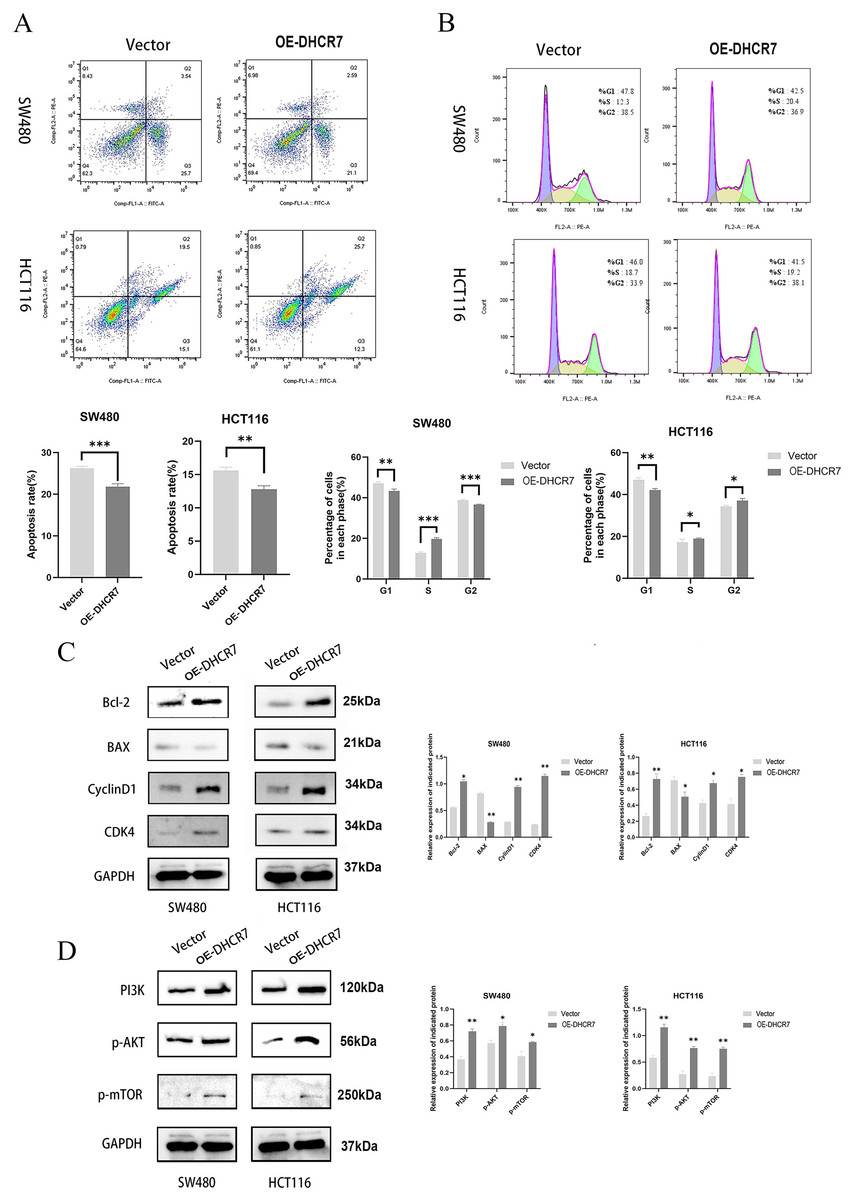
Figure 7: DHCR7 overexpression suppresses apoptosis and activates PI3K/AKT/mTOR pathway in CRC cells.
(A) Distribution of apoptosis in DHCR7 overexpression group and vector group in SW480 and HCT116 cells. (B) Proportion of each cellular phase in the TGFBI overexpression group and the vector group in SW480 and HCT116 cells. (C) Immunoblotting analysis elucidated the effects of DHCR7 overexpression on apoptosis and cell cycle-related proteins, as well as on PI3K, p-AKT, and p-mTOR expression in SW480 and HCT116 cells. Data are shown as mean±SD of three independent experiments, *p < 0.05, **p < 0.01 and ***p < 0.001 compared with Vector.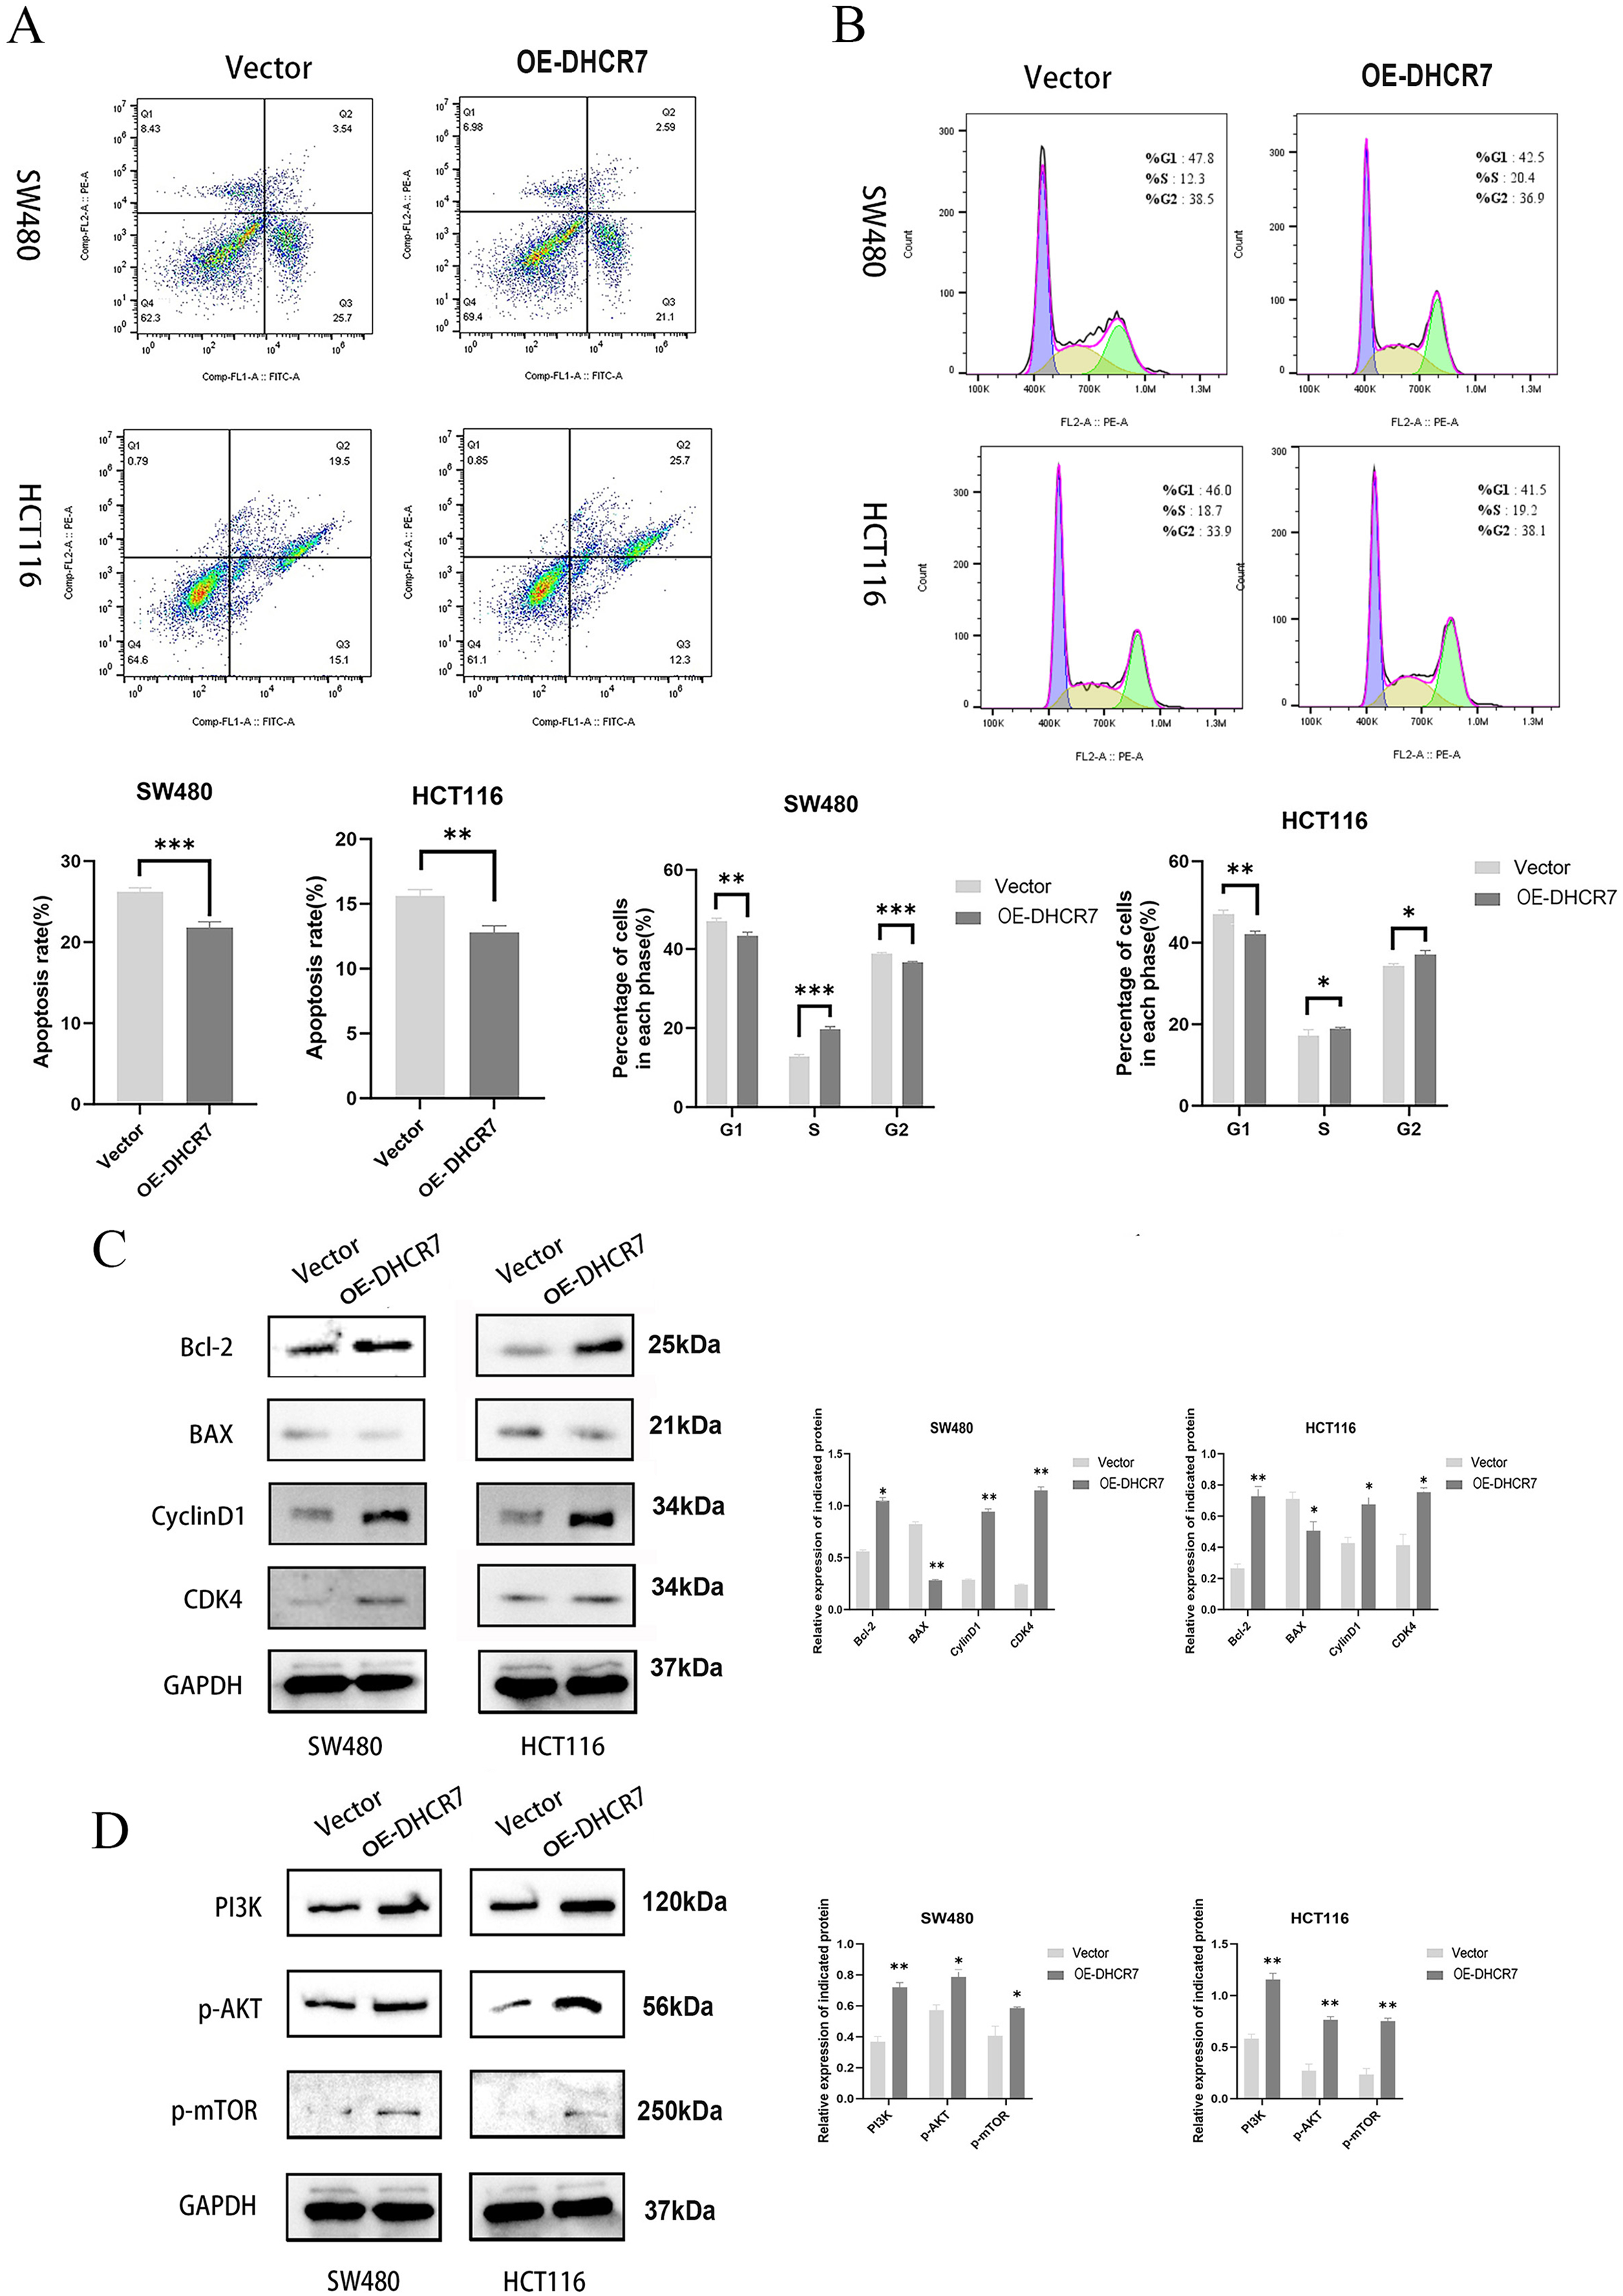
Nude mice model with DHCR7 knockdown inhibits subcutaneous and in vivo tumor growth
To assess the effect of DHCR7 on CRC progression in vivo, Si-DHCR7 transfected SW480 cells were injected subcutaneously into mice and tumor growth was monitored every 7 days. The results showed that on day 14 of treatment, tumors in the Si-DHCR7 group began to appear significantly smaller than those in the carrier control group (Fig. 8A). Under live imaging, tumors in the Si-DHCR7-treated group grew more slowly and had smaller volumes compared to the vector control group. Tumor volumes in the Si-DHCR7-treated group averaged 89.19 mm 3, compared with 143.3 mm 3 in the vector-control group (Fig. 8A). In the Si-DHCR7 group, graft weight after excision also showed a significant decrease when compared with the vehicle-treated group (p < 0.01) (Fig. 8A). In addition, Si-DHCR7 significantly reduced DHCR7 expression at both the mRNA and protein level (Fig. 8B). Hematoxylin-Eosin (HE) staining results showed that tumor cells in the Si-DHCR7 group were loosely arranged, mitotic figures were reduced, and necrotic areas were increased (Fig. 8C). Ki-67 staining results indicated that the positive cell rate in the Si-DHCR7 group was significantly decreased (Fig. 8D).
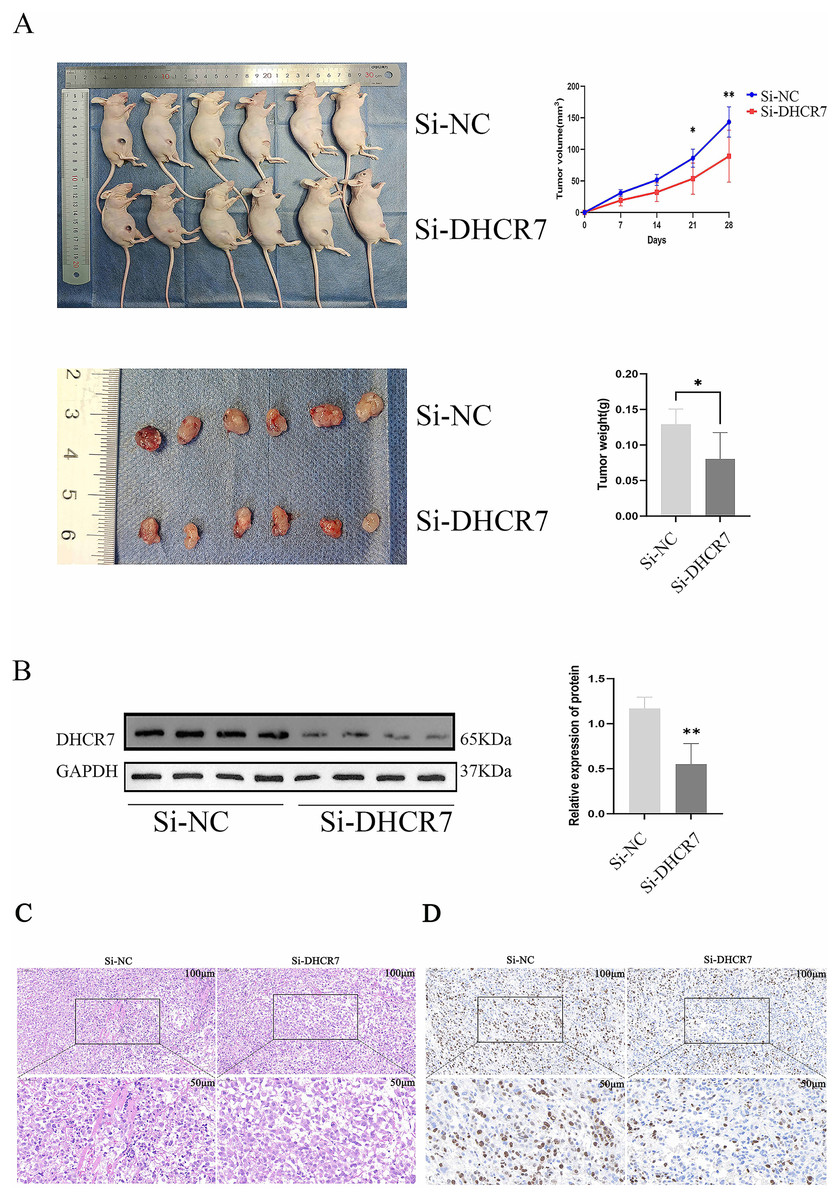
Figure 8: Knocking down DHCR7 significantly inhibited CRC cell proliferation in vivo.
(A) We established a xenograft model by subcutaneously implanting wild-type and DHCR7- knockdown SW480 cells into BALB/c nude mice (n = 6) and monitored tumor growth for 4 weeks, with volume assessments on days 7, 14, 21 and 28 post-inoculation. Lentiviral infection was used to enhance SW480 cell engraftment. At the study’s conclusion, mice were euthanized, and tumors were excised and weighed. (B) DHCR7 protein expression in tumor tissues was quantified by immunoblotting. (C) HE staining showed that the tumor cells in LV-shDHCR7 group were arranged loosely, the mitotic image decreased, and the necrotic area increased. (D) Ki-67 staining showed that the positive cell rate of LV-shDHCR7 subcutaneous graft tumor was significantly decrease. GAPDH is used as loading control. *p < 0.05; **p < 0.01 compared with Student’s t-test.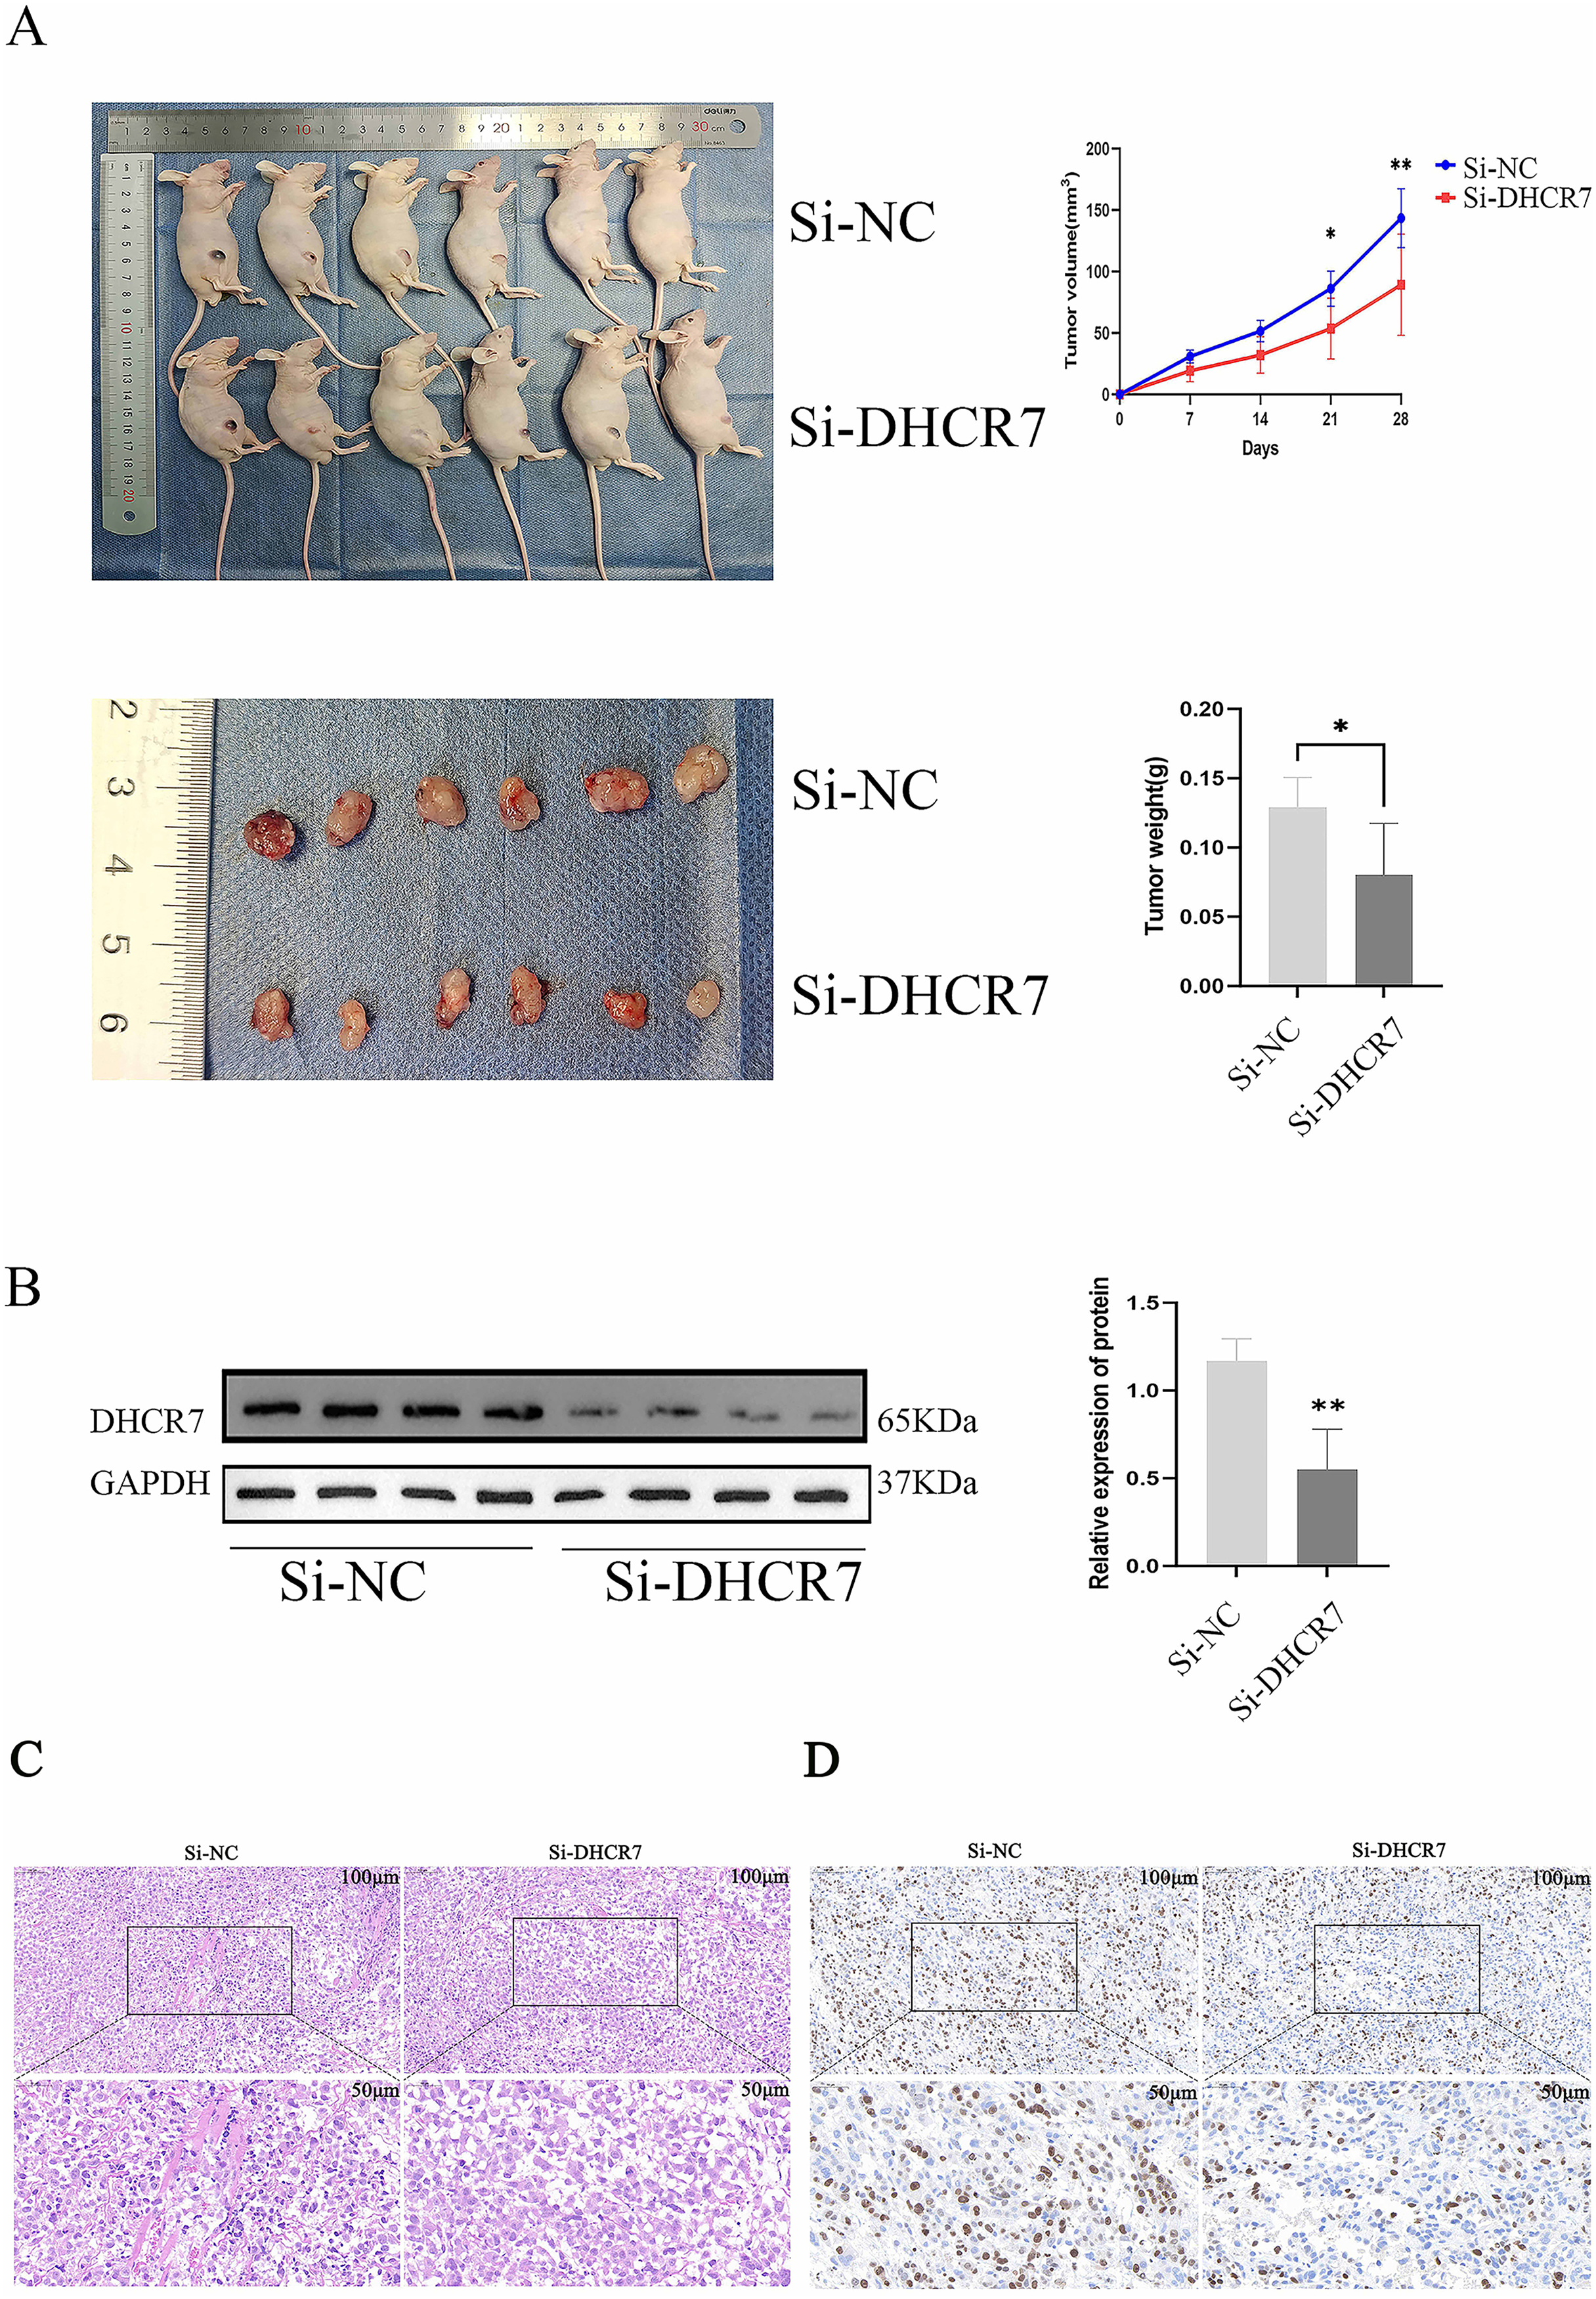
SC79 reversed the effects of DHCR7 downregulation in CRC cells
To further investigate the role of the PI3K/AKT/mTOR signaling pathway in DHCR7-mediated tumor promotion, we treated SW480 and HCT116 cells transfected with DHCR7 siRNA with the AKT activator SC79. The results showed that SC79 significantly reversed the decrease in colony formation ability caused by DHCR7 knockdown (Fig. 9A). Additionally, SC79 restored the impaired cell migration and invasion capabilities induced by DHCR7 downregulation (Figs. 9B–9E).
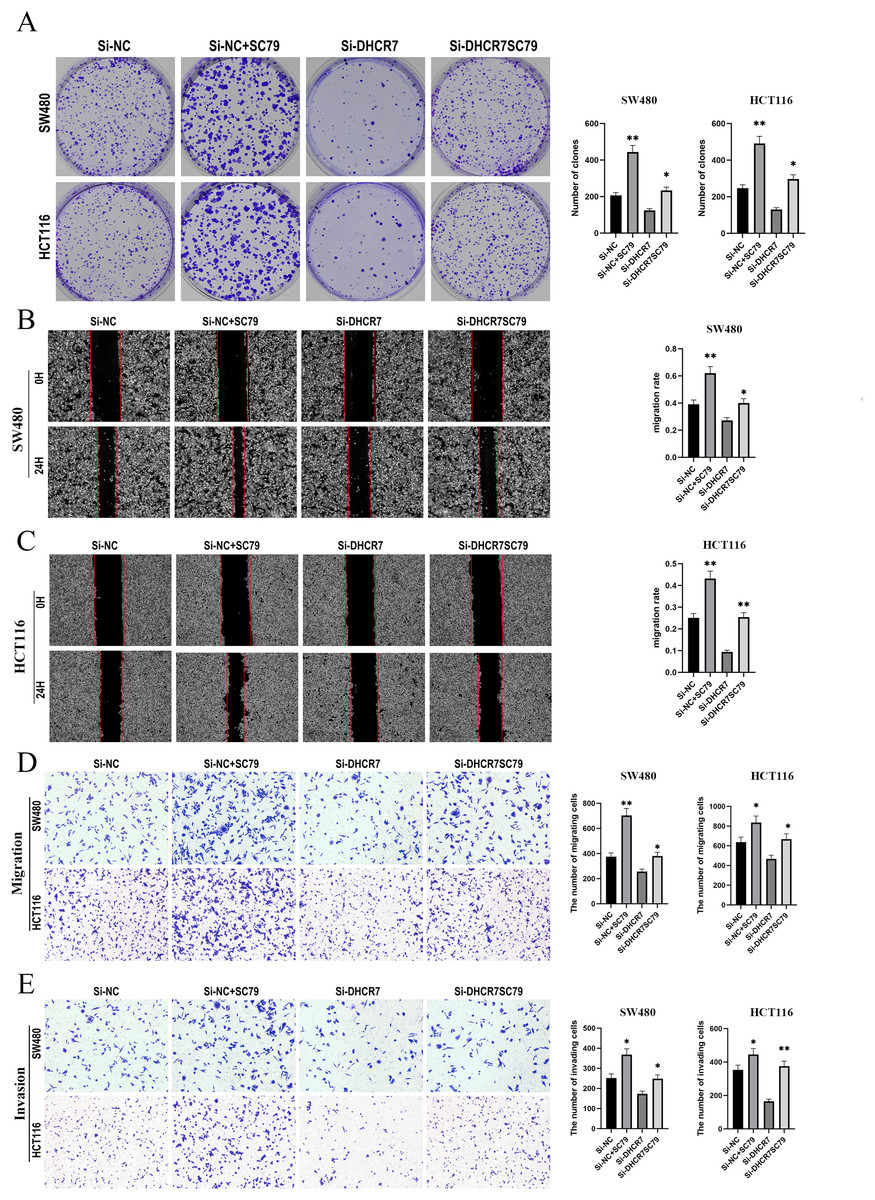
Figure 9: SC79 Reverses the Effects of DHCR7 Knockdown in CRC Cells.
(A) Colony formation in SW480 and HCT116 cells treated with Si-NC, Si-NC + SC79, Si-DHCR7, and Si-DHCR7 + SC79. (B–D) Cell migration in SW480 and HCT116 cells was evaluated using wound healing and transwell assays for the Si-NC, Si-NC + SC79, Si-DHCR7, and Si-DHCR7 + SC79 groups. (E) Cell invasion in SW480 and HCT116 cells was assessed using transwell assays for the Si-NC, Si-NC + SC79, Si-DHCR7, and Si-DHCR7 + SC79 groups. *p < 0.05; **p < 0.01 compared with ANOVA or Student’s t-test.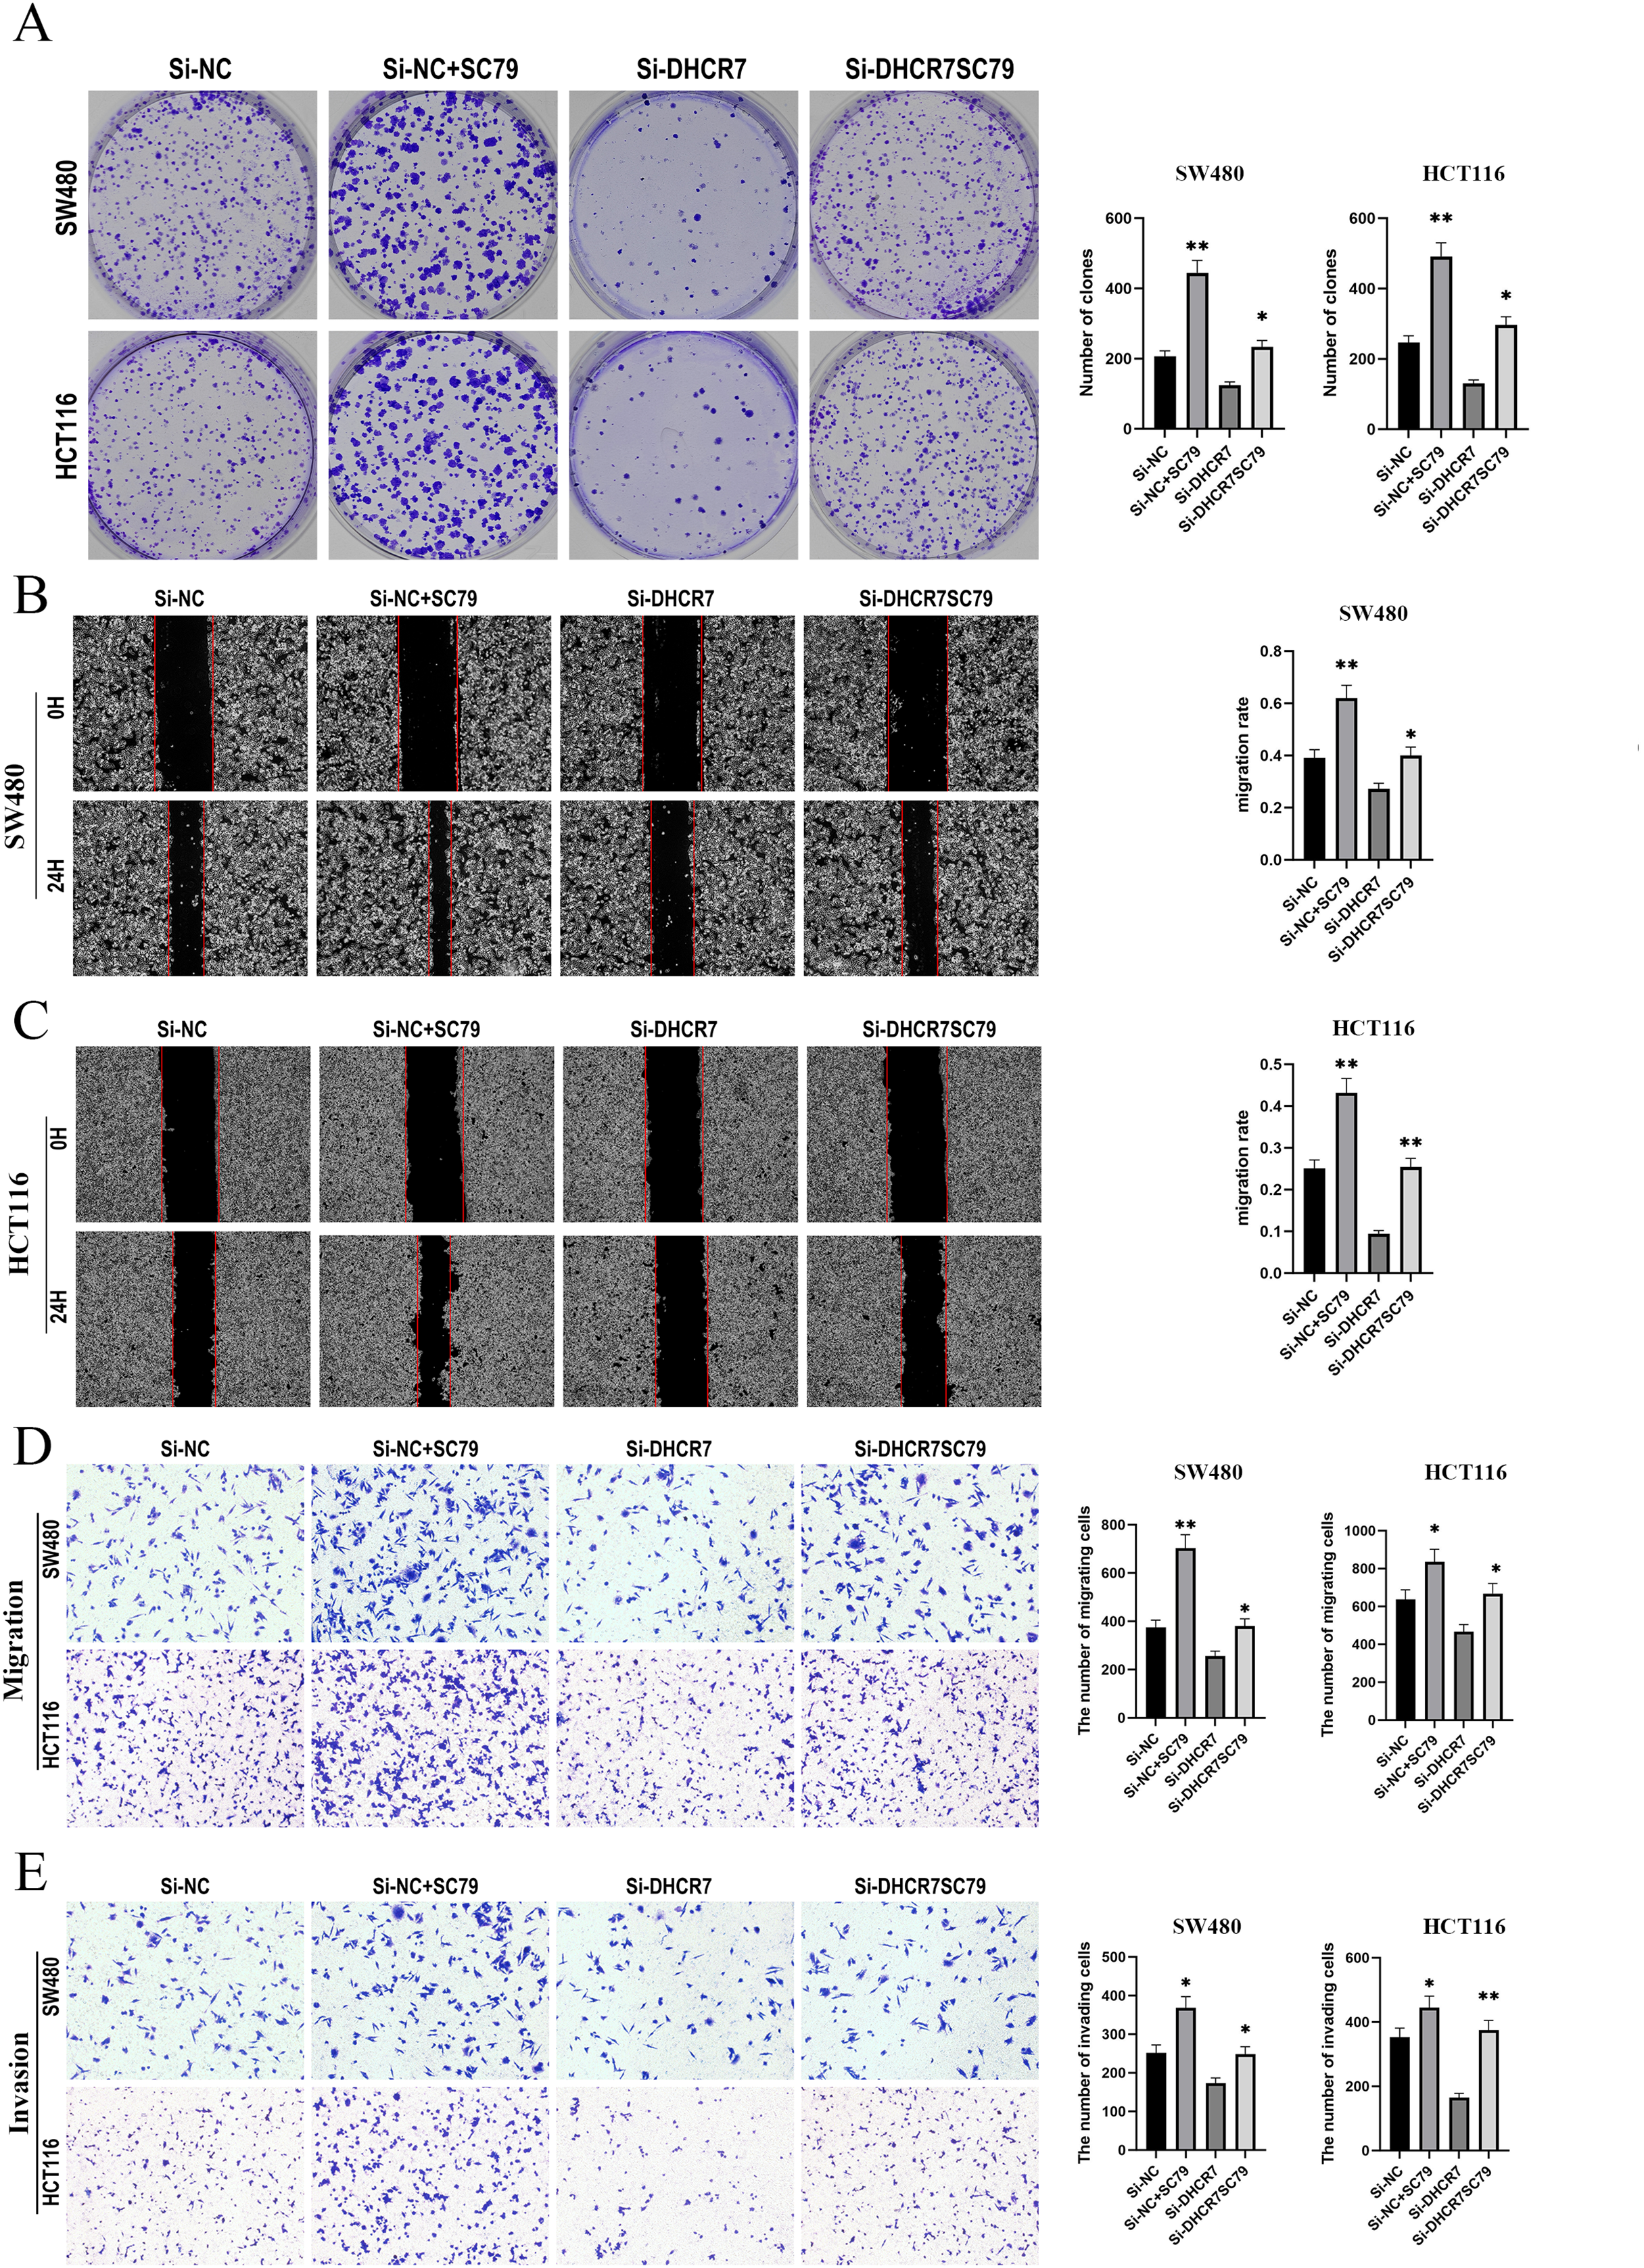
LY294002 reversed the effects of DHCR7 upregulation in CRC cells
We treated SW480 and HCT116 cells overexpressing DHCR7 (OE-DHCR7) with the PI3K inhibitor LY294002. The results showed that LY294002 effectively blocked the promotive effects of DHCR7 overexpression on cell colony formation, migration, and invasion (Figs. 10A–10E). Furthermore, the administration of SC79, an activator of AKT, effectively restored the diminished phosphorylation levels of AKT and mTOR that were induced by the knockdown of DHCR7. In contrast, the application of LY294002, a PI3K inhibitor, counteracted the increased phosphorylation of AKT and mTOR observed following DHCR7 overexpression (Fig. 11A–11C).

Figure 10: LY294002 rescues the effects of DHCR7 overexpression in CRC cells.
(A) Colony formation in SW480 and HCT116 cells treated with Vector, Vector + LY294002, OE-DHCR7, and OE-DHCR7 + LY294002. (B–D) Cell migration in SW480 and HCT116 cells was evaluated using wound healing and transwell assays for the Vector, Vector + LY294002, OE-DHCR7, and OE-DHCR7 + LY294002 groups. (E) Cell invasion in SW480 and HCT116 cells was assessed using transwell assays for the Vector, Vector + LY294002, OE-DHCR7, and OE-DHCR7 + LY294002 groups. *p < 0.05; **p < 0.01 compared with ANOVA or Student’s t-test.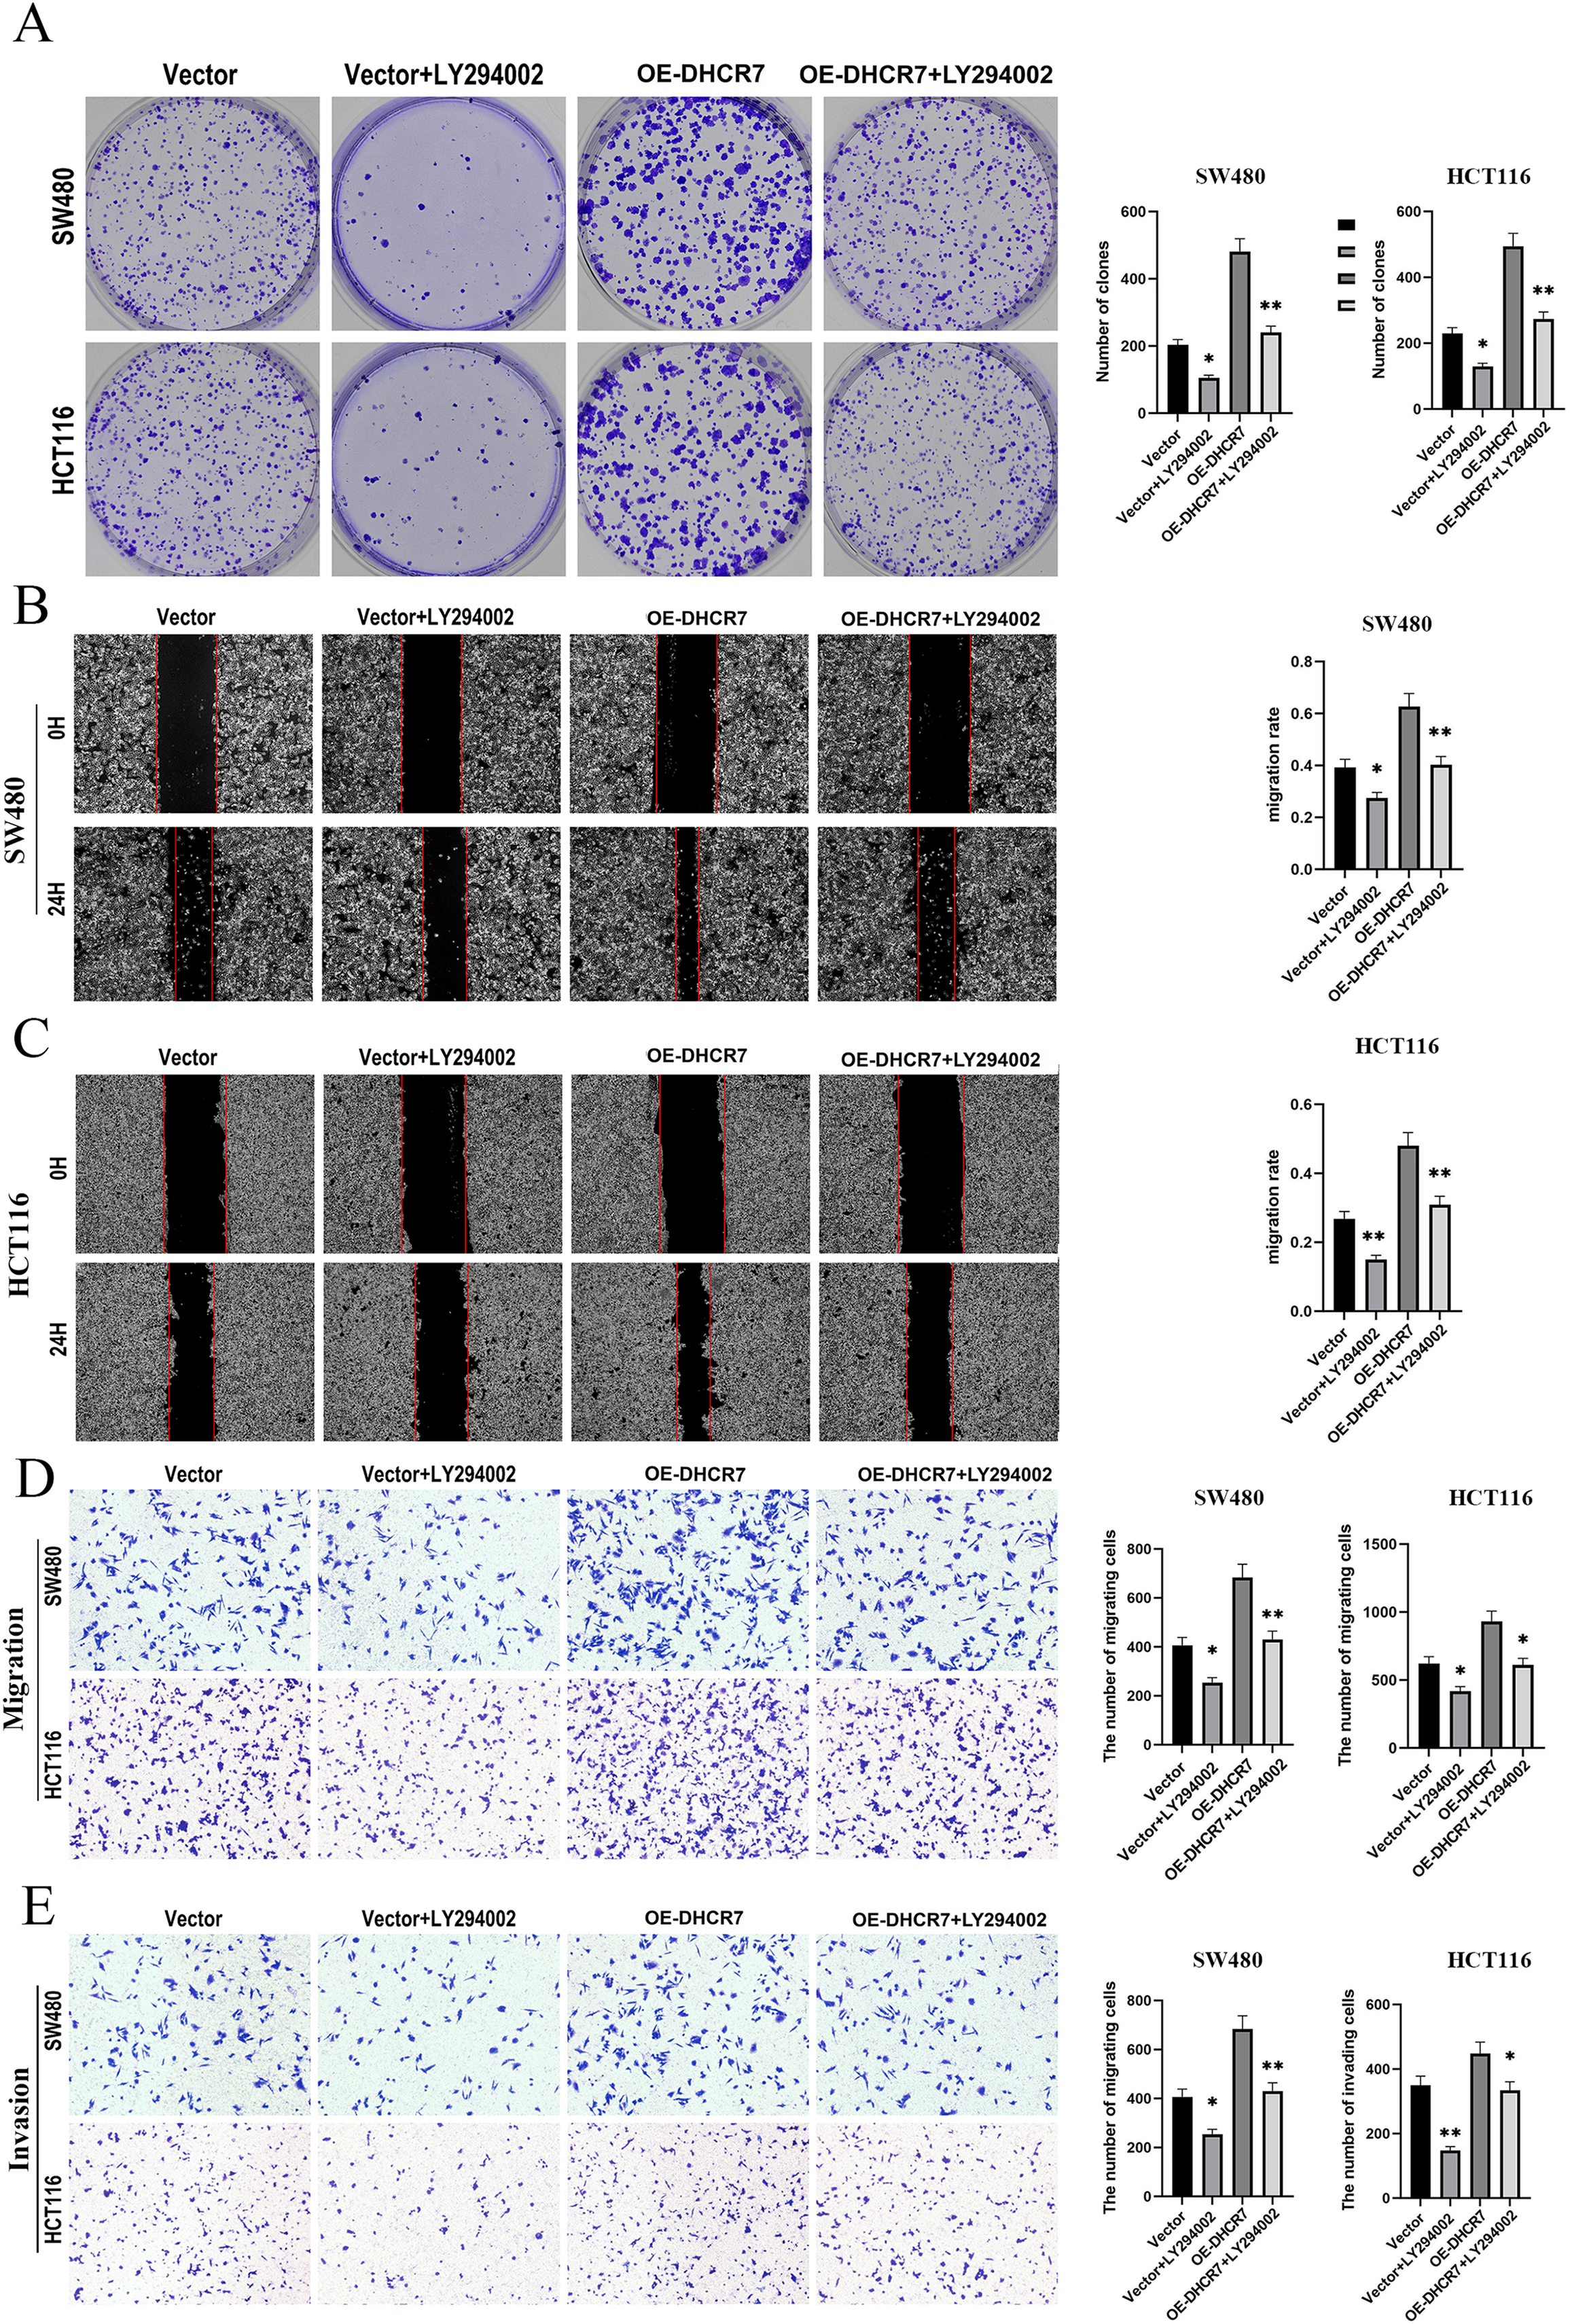
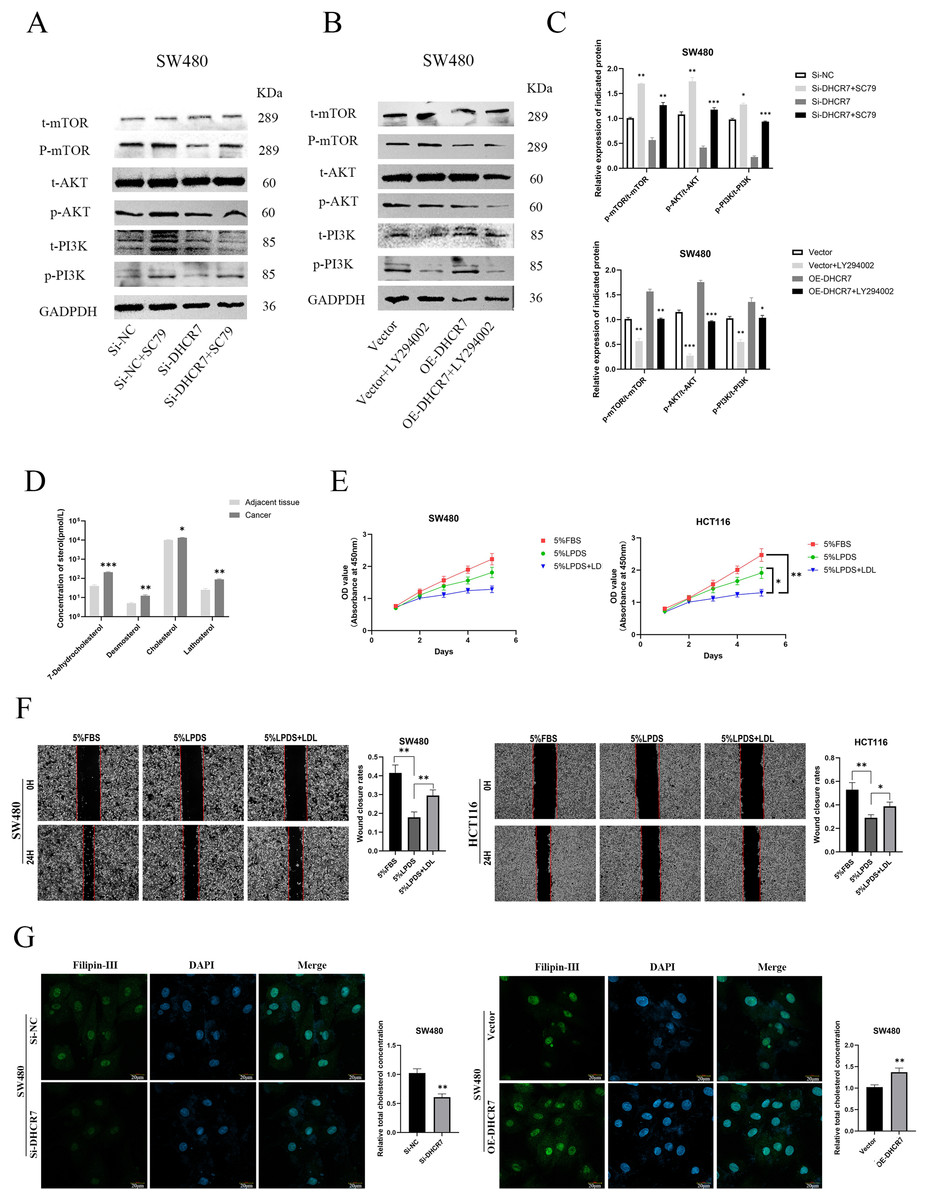
Figure 11: DHCR7 regulated the expression levels of PI3K/AKT pathway proteins and cholesterol in CRC.
(A–C) Western blotting analysis of PI3K/AKT/mTOR signaling pathway-related protein expression in CRC cells. (D) Alterations in small molecule sterol levels in post-surgical tissues reveal significantly elevated levels in tumor tissues. (E) Cholesterol is involved in the proliferation of CRC cells. (F) Cholesterol is involved in CRC cell migration. (G) Philippine staining demonstrated that altered expression of DHCR7 can affect total cholesterol levels in cells GAPDH is used as loading control. *p < 0.05; **p < 0.01; ***p < 0.001 compared with ANOVA or Student’s t-test.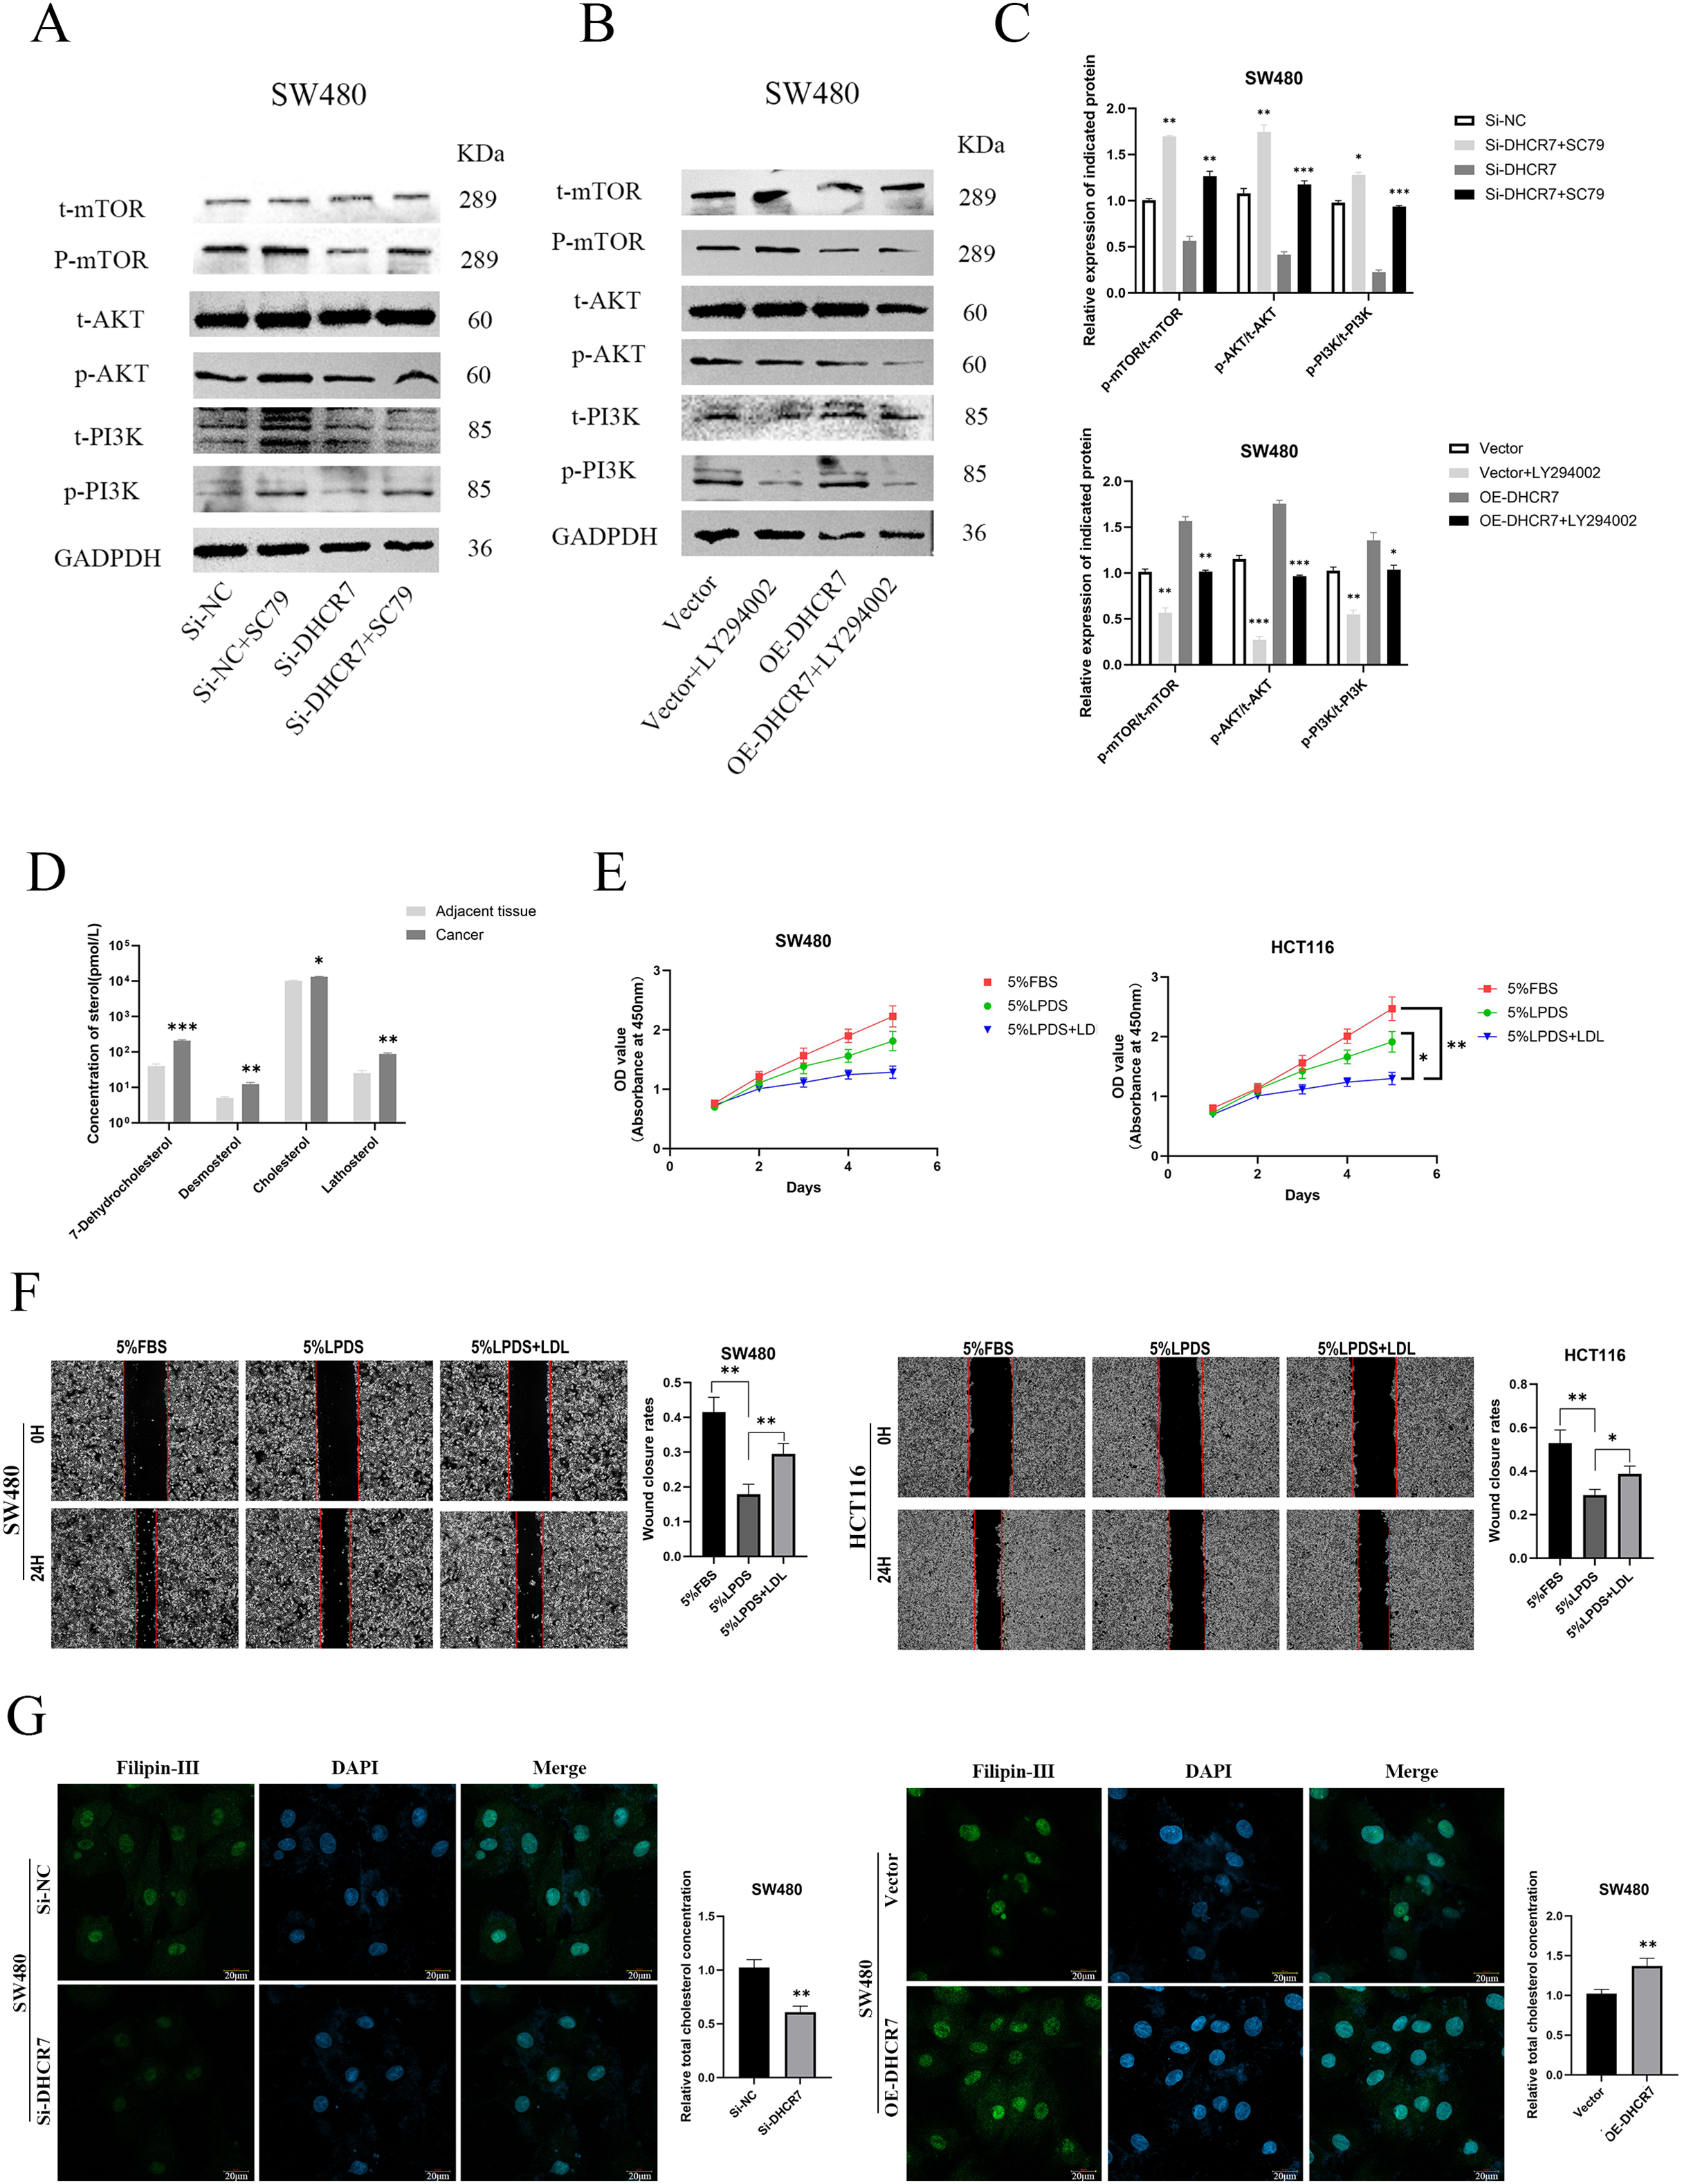
The progression of CRC is associated with elevated cholesterol levels
Changes in the concentrations of sterol molecules in tissues after surgery indicate a marked increase in sterol levels within cancerous tissues by LC-MS(Fig. 11D). Through cholesterol elimination and supplementary recovery experiments, it was verified that the activation of PI3k/AKT pathway is related to cholesterol level, which can indirectly prove that DHCR7 plays a central role in cholesterol anabolism and articipates in the malignant progression of CRC cells such as proliferation (Fig. 11E) and migration (Fig. 11F). Philippine staining demonstrated that altered expression of DHCR7 can affect total cholesterol levels in cells (Fig. 11G).
Discussion
For rapidly proliferating CRC cells, high cholesterol levels are essential to sustain cell membrane biosynthesis and other cellular functions. This phenomenon has been confirmed in clinical studies, where plasma cholesterol levels correlate with the progression of CRC (Bull et al., 2020; Vladimirov et al., 2020). In contrast to the surrounding healthy tissue, CRC tissues exhibited a markedly elevated concentration of cholesterol compared to the healthy counterparts, as depicted in Fig. 1. This finding is consistent with the results of earlier research. Abnormalities in cholesterol metabolism, such as increased cholesterol biosynthesis, enhanced uptake of exogenous cholesterol, and elevated cholesterol esterification, contribute significantly to tumor progression, particularly in promoting cell proliferation, invasion and migration. Moreover, alterations to the tumor microenvironment (TME) further exacerbate these processes (Huang, Song & Xu, 2020). Given the role of cholesterol metabolism in CRC progression, targeting these metabolic pathways could offer promising therapeutic strategies (Jin et al., 2023; Jiang, Jin & Xu, 2024).
Recent research has spotlighted DHCR7 as a critical enzyme involved in cholesterol and vitamin D3 synthesis (Prabhu et al., 2016). The role of DHCR7 in various cancer processes has been demonstrated, including tumor proliferation, ferroptosis, and mitochondrial signaling. On the basis of this information, this study analyzed the TCGA database for data related to metabolic-related genes in CRC to determine their expression levels and prognostic implications. Our findings were further validated in patients with local CRC and tissue microarrays, ultimately selecting DHCR7 as the focus of our investigation. In vitro experiments involving DHCR7 gene deletion and overexpression, along with in vivo studies using nude mouse xenograft models, demonstrated that DHCR7 regulates key aspects of CRC cell biology, including apoptosis, cell cycle progression, proliferation, invasion and migration. These effects are mediated through the PI3K/AKT/mTOR signaling pathway, highlighting the potential therapeutic value of targeting DHCR7 in CRC treatment.
Our findings demonstrate that DHCR7 is crucial for CRC cell proliferation by regulating Cyclin D1 and Cyclin-dependent kinase 4 (CDK4), highlighting the influence of cholesterol metabolism on cancer progression. Normally, Cyclin D1 is tightly regulated to ensure proper cell cycle progression, but in cancer, its activity is often aberrantly increased through various mechanisms. In order to promote cell cycle progression, CDK4 and CDK6 form an active complex that drives the transition from the G1 phase to the S phase (Montalto & De Amicis, 2020). In cancer, overactivation of CDK4 is linked to uncontrolled cell proliferation, genomic instability, and chromosomal aberrations, which contribute to tumor development (Malumbres & Barbacid, 2009; Icard et al., 2019). In our study, cell models with altered DHCR7 expression consistently exhibited changes in Cyclin D1 and CDK4 levels, suggesting that DHCR7 influences the G1/S phase transition. Notably, downregulation of DHCR7 disrupted the normal progression of the cell cycle, an effect that was reversed upon DHCR7 overexpression.
Cholesterol is essential for managing various cellular activities, including cell growth, development, and programmed cell death (Siegel et al., 2023). The enzyme HMG-CoA reductase is pivotal in controlling the rate of cholesterol production from acetyl coenzyme A (Ikonen, 2008). Compounds that hinder HMG-CoA reductase can curb the growth of certain cancer cells by impeding the production of cholesterol (Jiang et al., 2021; Lochhead & Chan, 2013). Research indicates that statins, which are HMG-CoA reductase inhibitors, could be beneficial in cancer therapy (Garcia-Ruiz, Morales & Fernandez-Checa, 2012). However, statins may lead to a shortage of several downstream compounds (Istvan & Deisenhofer, 2001), such as farnesyl pyrophosphate and geranylgeranyl pyrophosphate, which are crucial for isoprenoid synthesis, membrane integrity, and function, potentially causing considerable side effects (Yuan et al., 2024). Focusing on DHCR7, the terminal enzyme in the cholesterol biosynthetic pathway (Fig. 1A), might lead to fewer adverse effects, as it specifically targets cholesterol levels without affecting other mevalonate pathway intermediates. We speculate that DHCR7 could be a promising target for curbing the proliferation of CRC cells. Deregulated apoptosis is a hallmark of cancer (Hanahan, 2022). The intrinsic apoptotic pathway, which is mitochondrial-mediated, is governed by proteins belonging to the BCL-2 protein family (Singh, Letai & Sarosiek, 2019). In tumor cells, the expression of anti-apoptotic BCL-2 proteins is elevated, concurrently suppressing the activity of pro-apoptotic factors like BAX and BAK, thus hindering the demise of cell (Youle & Strasser, 2008). In our study, knockdown of DHCR7 expression affected the expression levels of BAX and BCL-2, leading to a concurrent decrease in both proteins. This alteration may indirectly promote apoptosis activation. Conversely, overexpression of DHCR7 and BCL-2 resulted in a significant upregulation of their expression, and the cell models exhibited pronounced anti-apoptotic characteristics. These observations are consistent with previous reports, such as those by Li et al. (2023) in bladder cancer, where DHCR7 modulates the BAX/BCL-2 ratio and influences apoptosis via this protein family. Similarly, Lopez et al. (2022) demonstrated that apoptosis inhibition in drug-resistant solid tumors is facilitated by the downregulation and inactivation of pro-apoptotic proteins, alongside an anti-apoptotic state induced by BCL-XL overexpression.
This research explores the potential relationship between DHCR7 and the processes of Dekker et al. (2019) migration and invasion in CRC cells. These processes are essential factors in determining the likelihood of local tumor recurrence and the development of distant metastases in individuals with cancer (Tian et al., 2024; Dunne et al., 2016; Shin, Giancotti & Rustgi, 2023). A multitude of studies have shown a strong correlation between the invasive behavior of cancer cells and the levels of key proteins, including E-cadherin (E-Ca), N-cadherin (N-Ca), and MMP-9. These proteins are often used as prognostic indicators for a variety of cancers (Schwartz et al., 2007; Tang et al., 2014). E-Ca and N-Ca are essential components of the calreticulin family, involved in critical processes including cell adhesion, signaling, and tissue development. Changes in E-Ca expression are widely recognized as a hallmark of EMT (Chen et al., 2016). Our research has revealed that DHCR7 enhances the expression levels of N-Ca, and Vimentin. Importantly, the expression of EMT markers, including N-Ca and Vimentin, was substantially decreased upon the suppression of DHCR7. Additionally, MMP-9, a protein critical for maintaining the integrity of the cellular basement membrane, exhibited synchronized changes in response to DHCR7 modulation. Numerous studies have established a close link between the invasive characteristics of cancer cells and the expression levels of key proteins, such as E-Ca, N-Ca, and MMP-9, which are commonly used as predictive biomarkers for a variety of tumors. Specifically, the downregulation of DHCR7 expression is associated with a decrease in MMP-9 levels, while the upregulation of DHCR7 slightly increases the expression of MMP-9. The MMPs are a group of proteolytic enzymes that require zinc, with MMP-9 being one of the most complex types. An elevation in the levels of MMP-2 and MMP-9 in a range of cancers has been associated with poorer patient outcomes (Langers et al., 2012). MMP-9 is a key enzyme involved in the degradation of extracellular matrix (ECM) components and has a substantial impact on a variety of pathophysiological processes (Mondal et al., 2020). Studies have identified a correlation between MMP-9 and cholesterol metabolism. For example, it has been discovered that cholesterol can modulate the expression of MMP-9 through pathways that are dependent on ERK and JNK (Kim et al., 2007). Additionally, MMP-9 participates in the regulation of cholesterol metabolism through the secreted phospholipase A2 pathway, which influences how the liver responds to cholesterol intake from the diet (Hernandez‐Anzaldo et al., 2016). A recent study has shed light on the relationship between cholesterol and cell membrane-associated proteins, particularly adipose plasma membrane-associated proteins (APMAP). The research indicates that an accumulation of cholesterol within cell membranes can modulate the function of APMAPs, which in turn influences the internalization of the epidermal growth factor receptor (EGFR) and diminishes its efflux. This disruption in EGFR dynamics is implicated in the promotion of EMT in prostate cancer cells (Jiang et al., 2019). Consequently, the enzyme DHCR7, which is responsible for reducing cholesterol levels in the cell membrane, appears to exert an interactive effect upstream of the EMT process. These insights further support the notion that DHCR7 can impact the progression of cancer cells by influencing the expression of proteins associated with cell migration, invasion, and EMT. Our investigation delves into the potential regulatory effects of DHCR7 on cellular signaling cascades, specifically focusing on the PI3K/AKT/mTOR pathway, which is crucial for the regulation of cellular processes such as proliferation, apoptosis, invasion, migration, and autophagy (Narayanankutty, 2019; Mortazavi et al., 2022). Overactivation of this pathway is frequently observed in CRC and contributes significantly to its onset and progression (Cirillo et al., 2019). In this study, the downregulation of DHCR7 partially inhibited the activation of this pathway, while DHCR7 overexpression led to a marked increase in the phosphorylation of PI3K, AKT, and mTOR. In vivo experiments further corroborated these findings, demonstrating that reduced DHCR7 expression significantly suppressed tumorigenesis, thus validating the in vitro results.
The PI3K/AKT/mTOR pathway, a central signaling axis regulating cell survival, metabolism, and motility, is frequently hyperactivated in CRC due to PTEN loss or PIK3CA mutations (Narayanankutty, 2019; Mortazavi et al., 2022). This study found that DHCR7 knockout significantly suppressed the phosphorylation levels of PI3K, AKT, and mTOR (Fig. 5E), an effect that could be partially reversed by the AKT activator SC79 (Fig. 11A). Overexpression of DHCR7 activated this pathway (Fig. 7D), while the PI3K inhibitor LY294002 blocked the activation of the signaling pathway induced by DHCR7 overexpression (Fig. 11B). Furthermore, from the perspective of cholesterol reprogramming, knockdown of DHCR7 directly inhibited endogenous cholesterol synthesis in CRC cells, reducing intracellular cholesterol levels. Additionally, exogenous cholesterol supplementation, such as through Low-Density Lipoprotein (LDL), promoted CRC proliferation and enhanced motility (Figs. 11D–11F). Recent studies have highlighted that dietary cholesterol can activate AKT through palmitic acid metabolic reprogramming, providing a strategy to directly target AKT palmitoylation for cancer treatment (Bu et al., 2024). Research by Hillis et al. (2024) demonstrated that during triple-negative breast cancer treatment, the combination of AKT inhibitors and pitavastatin impaired SREBP-2 activation, leading to cholesterol homeostasis imbalance and inducing tumor cell apoptosis. Clear cell renal cell carcinoma (ccRCC) is rich in esterified cholesterol, and inhibition of the exogenous cholesterol channel protein Scavenger Receptor B1 reduced PI3K/AKT signaling, offering a new therapeutic target for ccRCC (Riscal et al., 2021; Zhang et al., 2025). These findings collectively support the conclusion of this study, indicating that alterations in tumor cell cholesterol levels are closely linked to the activation and transmission of the PI3K/AKT pathway.
Conclusion
To summarize, this research marks the inaugural exploration of DHCR7 function in CRC. The results indicate that cholesterol metabolism, mediated by DHCR7, exerts a significant influence on the onset and advancement of CRC, presenting a promising direction for subsequent studies.
Supplemental Information
Baseline and one-way multifactorial analysis of included patients.
List of primary antibodies.
Specific information on antibodies using immunoblotting methods
Environmental Monitoring Indicators for Laboratory Animal Management.
Raw data.
Anonymized patient baseline and survival data, actual measurements of small molecule cholesterol
Cell cycle raw data.
- Original data and three scientific replicates of cell cycle experimental results corresponding to Figure 5B and Figure 7B.
- Required Software: FlowJo™ v11 Software.
- Software Access: Available for download at https://www.flowjo.com/flowjo/download.
Animal Euthanasia Protocol.
Criteria and methods for euthanasia of laboratory animals
Quantitative PCR Report No.1.
The relative expression of GAPDH and DHCR 7 was used by quantitative PCR reaction to compare the difference of DHCR 7 gene expression between carcinoma and adjacent samples, and further investigate the biological correlation of DHCR 7 and clinical samples.
Quantitative PCR Report No.2.
PCR experiment report of siRNA