
Retrospective study: the value of GDF-15 and conventional markers in combination for clinical diagnosis of lung cancer
- Published
- Accepted
- Received
- Academic Editor
- Lesley Anson
- Subject Areas
- Epidemiology, Oncology, Respiratory Medicine, Translational Medicine
- Keywords
- GDF15, Lung cancer, Diagnosis, Biomarker
- Copyright
- © 2025 Ni et al.
- Licence
- This is an open access article distributed under the terms of the Creative Commons Attribution License, which permits using, remixing, and building upon the work non-commercially, as long as it is properly attributed. For attribution, the original author(s), title, publication source (PeerJ) and either DOI or URL of the article must be cited.
- Cite this article
- 2025. Retrospective study: the value of GDF-15 and conventional markers in combination for clinical diagnosis of lung cancer. PeerJ 13:e20281 https://doi.org/10.7717/peerj.20281
Abstract
Lung cancer is a leading cause of morbidity and mortality worldwide, and effective biomarkers for its screening and monitoring are still lacking. This study aims to assess the diagnostic value of Growth Differentiation Factor 15 (GDF15) in lung cancer and its subtypes, compared to conventional biomarkers, to evaluate its potential as a predictive biomarker for lung cancer screening and monitoring. GDF15 levels were measured and analyzed in different subtypes of lung cancer and non-tumor controls. The correlation between GDF15 and the expression of eight conventional biomarkers was assessed by analyzing serum GDF15 levels in the markersnormal groups and the markershigh groups. The superiority of GDF15 in screening and monitoring of lung cancer was confirmed using the receiver operating characteristic (ROC) curve analysis of GDF15, alongside conventional biomarkers. Serum GDF15 levels were significantly higher in all subtypes of lung cancer compared with non-tumor controls, showing significant correlations with the levels of conventional biomarkers. ROC curve analysis demonstrated that GDF15 has superior sensitivity and specificity over conventional biomarkers, highlighting its potential as a promising diagnostic biomarker for lung cancer. GDF15 shows strong potential as a diagnostic tool for lung cancer, outperforming conventional markers. It presents a promising new biomarker for lung cancer monitoring and diagnosis.
Introduction
Lung cancer is the leading cause of cancer-related morbidity and mortality worldwide, with nearly 2.5 million new cases and over 1.8 million deaths annually. It accounts for approximately one in eight (12.4%) of all cancer diagnoses and nearly one in five (18.7%) cancer deaths globally (Bray et al., 2024). Clinically, Lung cancer is classified into two main types: small cell lung cancer (SCLC) and non-small cell lung cancer (NSCLC). The primary subtypes of NSCLC include squamous cell carcinoma (SCC), adenocarcinoma (ADC), and large cell carcinoma (Guo et al., 2021). Common serum biomarkers for lung cancer include carcinoembryonic antigen (CEA), cytokeratin-19 fragment (CYFRA 21-1), neuron-specific enolase (NSE), and squamous cell carcinoma antigen (SCC-Ag). Additionally, mucins such as carbohydrate antigens CA125, CA15-3, CA199, and CA17-4 have been proposed as potential biomarkers (Molina et al., 2008; Schneider, 2010; Wu et al., 2020). However, most standard tumor biomarkers lack specificity for lung cancer, as they can be present with low levels in healthy individuals and elevated in certain benign conditions (Molina et al., 2008; Tufman & Huber, 2010). Due to their low sensitivity and poor specificity, these biomarkers are unsuitable for lung cancer screening, and elevated levels must be interpreted with caution (Wen et al., 2020).
Growth Differentiation Factor 15 (GDF 15), also known as macrophage inhibitory factor-1 (MIC-1), is a member of the transforming growth factor-beta (TGF-β) superfamily. GDF 15 plays various pathophysiological roles in cancer, obesity, cardio-metabolic disease and other diseases (Assadi, Zahabi & Hart, 2020; Wang et al., 2021). Under normal conditions, GDF15 is expressed at low levels in various tissues and in the bloodstream, but its expression significantly increases in response to inflammation, tissue damage, and disease states, including malignant tumors. This makes GDF 15 a stress response molecule (Wang et al., 2021; Asrih et al., 2023; Breit, Brown & Tsai, 2023; Sjøberg et al., 2023; Wang et al., 2023). GDF15 levels rise significantly in the early stages of various cancers, including liver, colorectal, and gastric cancers, and its expression varies with the stages of tumor invasion and metastasis (Li et al., 2016; Wang et al., 2019; Spanopoulou & Gkretsi, 2020; Chen et al., 2021). Although previous studies have found that GDF15 plays an important role in lung cancer proliferation and metastasis (Zhao et al., 2018; Malvi et al., 2019; Lu et al., 2024), few have explored GDF15 as a serum biomarker for lung cancer, and there has been little systematic comparison with commonly used biomarkers (Deng et al., 2021; Xu et al., 2021).
In this study, we measured serum GDF15 levels in lung cancer patients, as well as in normal controls, and patients with pneumonia, and benign tumors, to assess the potential of GDF15 as a biomarker for lung cancer diagnosis. By comparing GDF15 levels with conventional serum markers (CEA, CA125, CA15-3, CA199, CA17-4, CYFRA21-1, NSE, and SCC-Ag), both individually and in combination, we suggest that GDF15 may play a critical role in monitoring and assessing the prognosis of cardiotoxicity in lung cancer patients.
Materials and Methods
Patients and healthy donors
This research was a retrospective study and enrolled a cohort comprising 34 healthy donors, pneumonia group (N = 2), benign tumor group (N = 13) and 205 cancer patients (adenomatous 128, squamous 40, SCLC 37) treated at the Shandong Cancer Hospital and Institute from January 2022 to June 2023. The healthy donors consisted of 30 individuals undergoing routine physical examinations, whom underwent serum GDF15 testing without tumor markers. This approach focused specifically on evaluating the diagnostic relevance of GDF15 in lung cancer while maintaining methodological consistency across the cohort. In addition to the serum GDF15 levels, there were also assessing different combinations of tumor markers in patients with lung cancer and other disease interference groups. Clinical TNM stage of patients with lung cancer was classified according to the 2017 TNM staging standard of the Eighth Edition Cancer Staging Manual of the International Lung Cancer Research Association. Comprehensive clinical data for the 450 patients across various tumor types (Table S1) were extracted from electronic medical records and the Ruimei Laboratory Information System version 6.0 (rmlis, Huangpu District, Shanghai, China), as summarized in Table 1. The participants provided their written informed consent to participate in this study. Informed consent was obtained from all participants prior to the study, with ethical approval granted by the Ethics Committee of the Shandong Cancer Hospital and Institute (approval number: SDTHEC2022003066), aligning with the Declaration of Helsinki.
| Characteristics | No. cases | GDF-15 Concentration, Mean ± SD, pg/mL | t* | P-value |
|---|---|---|---|---|
| Age (cancer patients) | ||||
| ≥59 (59–88) | 126 | 2,829 ± 157.3 | 2.508 | 0.0129 |
| <59 (31–58) | 79 | 2,204 ± 190.5 | ||
| Gender (cancer patients) | ||||
| Male | 132 | 2,682 ± 157.7 | 1.029 | 0.3049 |
| Female | 73 | 2,418 ± 194.6 | ||
| Tumor pathologic type | ||||
| Adenocarcinoma | 128 | 2,663 ± 161.9 | 0.4565 | 0.6342# |
| Squamous | 40 | 2,571 ± 263.4 | ||
| SCLC | 37 | 2,349 ± 267.7 | ||
| Non-cancer type | ||||
| Normal | 34 | 718.9 ± 57.53 | 4.579 | 0.0154# |
| Pneumonia | 2 | 716.1 ± 181.1 | ||
| Benign | 13 | 1,112 ± 152.5 | ||
Data collection
Data for this research were sourced from electronic medical records and the Ruimei Laboratory Information System. The levels of common serum markers (CEA, CA125, CA15-3, CA19-9, CA72-4, CYFRA21-1, NSE, and SCC-Ag) in patients were determined using Electrochemiluminescence on the Cobas e801 analyzer (Roche Diagnostics, GmbH, Mannheim, Germany). The normal range for CA125, CA15-3, CA19-9, CA72-4 were respectively considered to be 0–35, 0–25, 0–39, 0–6.9 U/mL. Regarding CEA, CYFRA21-1, NSE and SCC-Ag, normal levels range from 0–3.4, 0–3.3, 0–17, 0–2.7 ng/mL respectively. The delineation of test range and criteria based on many previous studies and the long-term data accumulation of Roche in hospital detection operation. The sample sizes for each biomarker varied primarily because the diagnostic biomarker panels ordered by different physicians for individual patients differed in scope. All data were transcribed indiscriminately from electronic medical records without selective filtering or bias. The randomness of the dataset was preserved, and no intentional screening was applied.
Enzyme-linked immunosorbent assay (ELISA)
Plasma samples were collected and detected using Human GDF-15 ELISA Kits (ab155432; Abcam, Cambridge, UK). For detailed detection methods, please refer to the kit protocol and our previously published articles (Hao et al., 2024).
Statistical analysis
Statistical analysis was performed using GraphPad Prism version 9.0 (GraphPad Software, La Jolla, CA, USA). Data were analyzed using the unpaired t-test for two groups with normal distribution, the Mann–Whitney test for non-normally distributed data, the Kruskal–Wallis test for multiple groups with non-normally distributed data, and one-way ANOVA for normally distributed datasets. Results are presented as mean values ± standard error of the mean (SEM), and p-values of 0.05 or less were considered significant (****p < 0.0001, ***p < 0.001, **0.001 < p < 0.01, *0.01 < p < 0.05).
Results
Clinical characteristics of the study cohort
The study cohort consisted of 205 lung cancer patients (128 with ADC, 40 with SCC, and 37 with SCLC), along with 34 healthy controls and 13 patients with benign tumors. However, there were only two cases of pneumonia. The demographics and clinical characteristics of these groups are shown in Table 1. Cancers develop from the accumulation of genetic mutations, and patients are generally older, mostly over 50 years old. Therefore, our age distribution analysis was stratified into two groups: those under 59 years old and those 59 years and older. Serum GDF15 levels showed no significant differences based on gender or lung cancer subtypes but were related to patient age (Figs. 1A and 1B, Table 1). Additionally, significant differences were observed in GDF15 serum levels between the healthy controls, benign tumor patients, and lung cancer patients (Fig. 1C, Table 1). More detailed patient characteristics are presented in Table S1.
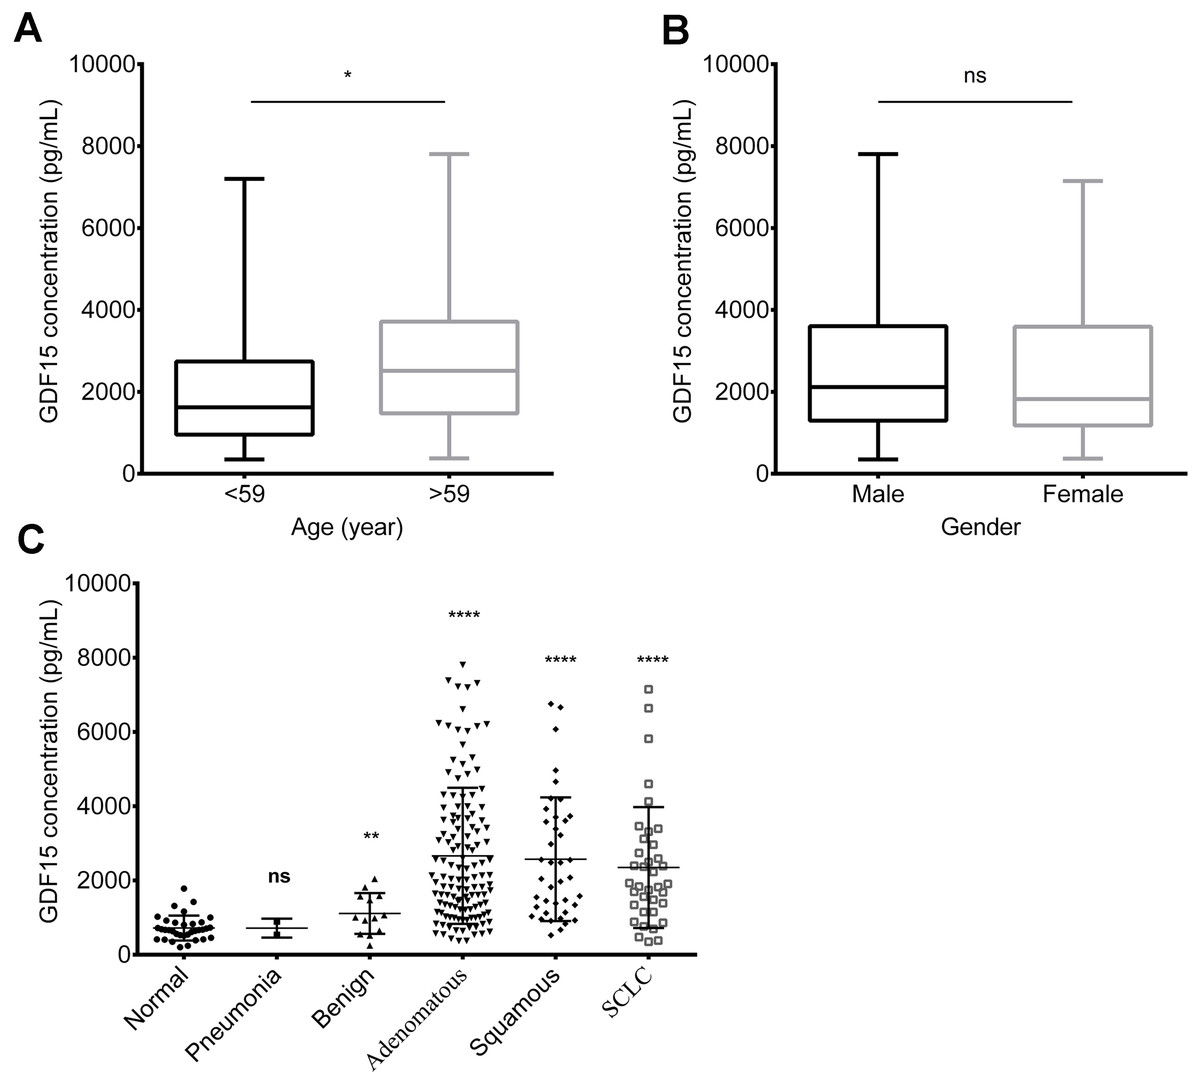
Figure 1: Serum GDF15 levels of lung cancer patients and healthy donors.
(A) Relationship between GDF15 levels and age (A). (B) Relationship between GDF15 levels and gender (B). (C) Serum GDF15 levels in non-cancer samples (including normal controls, pneumonia patients and patients with benign tumors) compared to lung cancer patients (including those with lung squamous cell carcinoma (SCC), lung adenocarcinoma (ADC), and small cell lung cancer (SCLC)). Statistical significance was assessed using an unpaired two-tailed t-test, where * indicates p < 0.05, ** indicates p < 0.01, and **** indicates p < 0.0001.
Limited correlation between GDF15 levels and TNM stage of lung cancer
Patients with advanced stage lung cancer showed slightly higher GDF15 levels compared to those in early stages (TNM stage I or II), particularly in cases of lymph node or distant metastasis (Fig. 2A). However, when T stage, lymph node metastasis, and distant metastasis were analyzed separately, no significant correlation with GDF15 levels was found (Figs. 2B, 2C and 2D). When subdividing the analysis by lung cancer subtypes (ADC, SCC and SCLC), no significant correlation was observed between GDF15 levels with TNM stage, T stage, lymph node metastasis, or distant metastasis (Table 2).
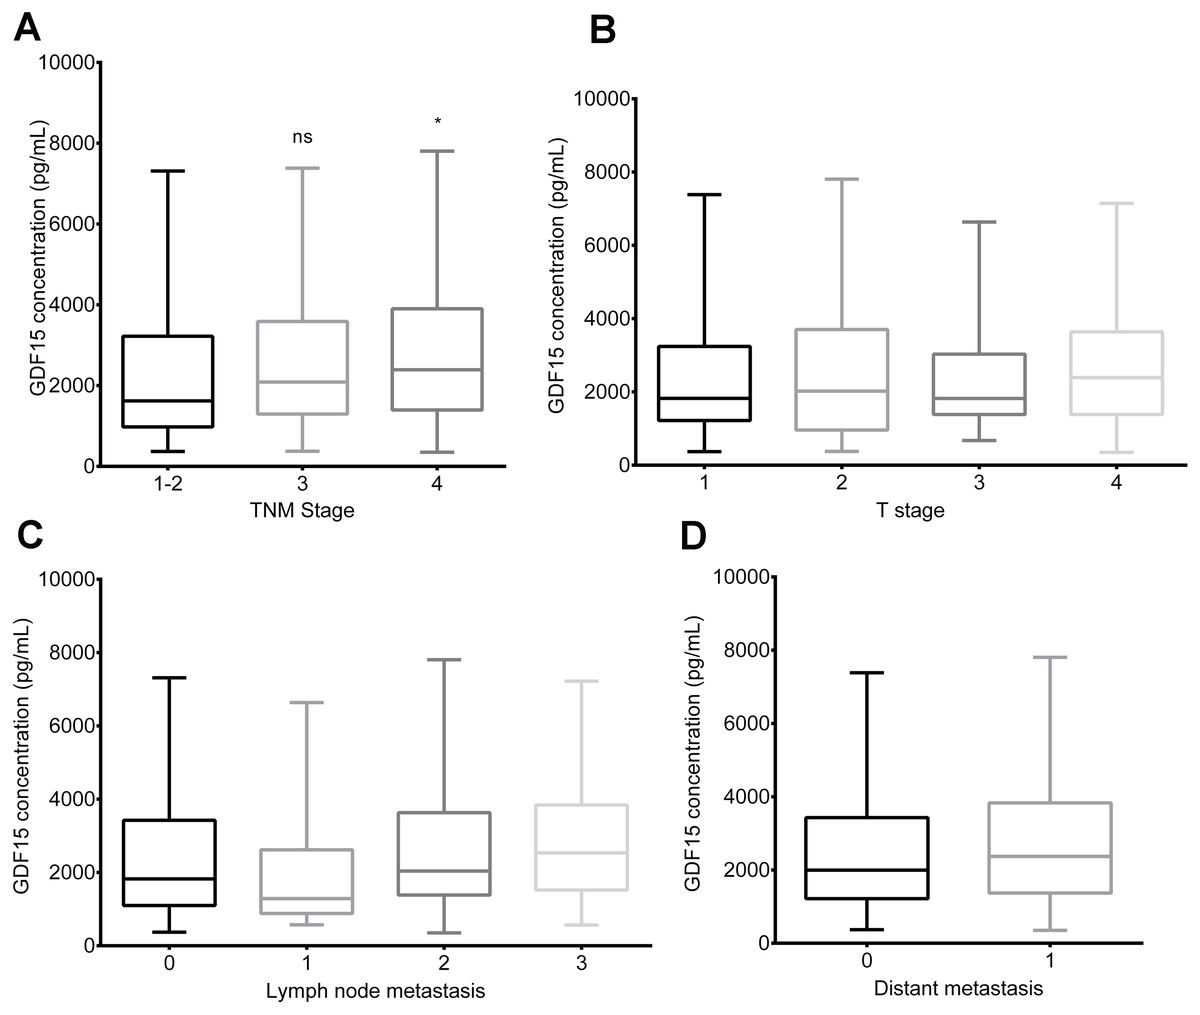
Figure 2: Relationships between GDF15 levels and clinical characteristics in lung cancer patients.
(A) Relationship between GDF15 levels and TNM stage. (B) Relationship between GDF15 levels and T stage. (C) Relationship between GDF15 levels and lymph node metastasis. (D) Relationship between GDF15 levels and distant metastasis in lung cancer patients. Statistical data are expressed as mean ± standard error of the mean (SEM), with significance determined by an unpaired two-tailed t-test: an asterisk (*) indicates p < 0.05.
| Characteristics | GDF-15 Concentration, Mean ± SEM, pg/mL/NO./P value | ||
|---|---|---|---|
| Adenocarcinoma | Squamous | SCLC | |
| T stage | |||
| T1 | 2,223 ± 223.5 N = 46 | 4,297 ± 1,266 N = 3 | 2,541 ± 597.8 N = 4 |
| T2 | 2,580 ± 316.6 N = 40 | 3,132 ± 504.5 N = 12 | 1,837 ± 589.7 N = 9 |
| T3 | 2,937 ± 616.4 N = 11 | 1,895 ± 281.9 N = 9 | 2,418 ± 565.2 N = 9 |
| T4 | 3,177 ± 357.4 N = 21 | 2,289 ± 429.6 N = 15 | 2,663 ± 455.5 N = 14 |
| Not available | 3,634 ± 713.4 N = 10 | 977.5 N = 1 | 1,151.2 N = 1 |
| Lymph node metastasis | |||
| N0 | 2,333 ± 229.9 N = 47 | 2,348 ± 401.3 N = 14 | 1,497 ± 274.6 N = 4 |
| N1 | 1,808 ± 488.2 N = 11 | 881.5 ± 45.39 N = 2 | 3,404 ± 1,098 N = 4 |
| N2 | 3,206 ± 399.4 N = 26 | 2,553 ± 386.9 N = 15 | 1,979 ± 385.3 N = 14 |
| N3 | 3,004 ± 294.8 N = 42 | 3,598 ± 739.3 N = 8 | 2,639 ± 449.9 N = 15 |
| Not available | 865.2 ± 126.3 N = 2 | 1,140.4 N = 1 | — |
| Distant metastasis | |||
| M0 | 2,525 ± 214.1 N = 68 | 2,622 ± 281.9 N = 26 | 1,595 ± 236.2 N = 10 |
| M1 | 2,855 ± 252.1 N = 58 | 2,767 ± 611.1 N = 12 | 2,628 ± 343.1 N = 27 |
| Not available | 1,777 ± 1,031 N = 2 | 7,41.1 ± 216.7 N = 2 | — |
| TNM stage | |||
| I | 2,202 ± 281.3 N = 35 | 1,996 ± 777.4 N = 4 | 1,353 ± 330.5 N = 3 |
| II | 1,671 ± 500.5 N = 6 | 2,632 ± 597.1 N = 6 | 2,740.9 N = 1 |
| III | 3,013 ± 365.3 N = 27 | 2,479 ± 372.3 N = 17 | 1,525 ± 308.1 N = 6 |
| IV | 2,873 ± 244.3 N = 60 | 2,841 ± 567.1 N = 13 | 2,628 ± 343.1 N = 27 |
Correlation of serum GDF15 levels with lung cancer diagnostic biomarkers
To investigate the relationship between GDF15 and other commonly used lung cancer biomarkers, we collected biomarker data for patients corresponding to the GDF15 samples (limited to the results within one week before and after specimen collection. Biomarker data collected beyond this one-week window will be excluded from statistical analysis, due to potential fluctuations in disease progression). These biomarkers included CEA, CA125, CA15-3, CA19-9, CA72-4, CYFRA21-1, NSE, and SCC-Ag, which are commonly used in lung cancer diagnosis and monitoring (Wu et al., 2007). Due to differences in pathological subtypes, the sample sizes for each biomarker varied (Table 3). Based on reference ranges provided by Roche, patients were divided into two groups: the markersnormal group and the markershigh group. Across all biomarkers, GDF15 levels were significantly higher in the high-expression group, with particularly pronounced differences in biomarkers such as CEA, CA125, CYFRA21-1, NSE (Figs. 3A, 3B, 3C and 3E, p < 0.0001) and CA153 (Fig. 3F, p = 0.0002). The serum levels of GDF15 were also correlated with the levels of SCC-Ag (Fig. 3D, p = 0.0314), CA19-9 (Fig. 3G, p = 0.0426) and CA72-4 (Fig. 3H, p = 0.0043), but the statistical significance may not be as strong as other markers due to insufficient specimens.
| Markers | Adenocarcinoma Median (range) NO. | Squamous Median (range) NO. | SCLC Median (range) NO. | Non-cancer Median (range) NO. |
|---|---|---|---|---|
| CEA* | 3.01 (0.51–631) N = 115 | 3.59 (1.3–20.6) N = 35 | 2.92 (1.13–1,687) N = 37 | 1.3 (0.59–3.56) N = 19 |
| CYFRA21-1* | 2.05 (0.47–612) N = 119 | 3.93 (0.94–20.6) N = 35 | 2.32 (0.69–48.3) N = 31 | 1.57 (0.7–3.23) N = 18 |
| NSE* | 15.8 (9.65–211) N = 85 | 16.5 (7.76–50.4) N = 22 | 16.1 (12.3–138) N = 21 | 14.5 (7.95–20.2) N = 14 |
| SCC-Ag* | 0.96 (0.1–7.4) N = 45 | 1.845 (0.42–18.4) N = 26 | 1.015 (0.45–1.62) N = 20 | 0.88 (0.67–2.19) N = 6 |
| CA-125# | 20.6 (8.81–1,144) N = 33 | 15.6 (3.0–56.6) N = 7 | 23.2 (10.7–30.3) N = 3 | 8.79 (8.58–9.54) N = 5 |
| CA-153# | 26.5 (7.03–293) N = 27 | 12.3 (8.47–27.5) N = 7 | 7.98 (7.76–14.6) N = 3 | 1.29 (12.7–12.9) N = 3 |
| CA-199# | 7.86 (1.0–10,000) N = 29 | 13.1 (1.69–29.8) N = 9 | 13.7 (3.16–37.6) N = 6 | 7.2 (3.9–9.65) N = 3 |
| CA-72-4# | 8.2 (1.5–27.1) N = 18 | 1.35 (1.0–5.1) N = 6 | 12.7 (1.0–24.4) N = 2 | 1.0 (1.0–1.0) N = 1 |
| GDF-15& | 2,092 (369.8–7,805) N = 128 | 2,062 (524.4–6,758) N = 40 | 1,908 (350.9–7,147) N = 37 | 689 (203.3–2,046) N = 49 |
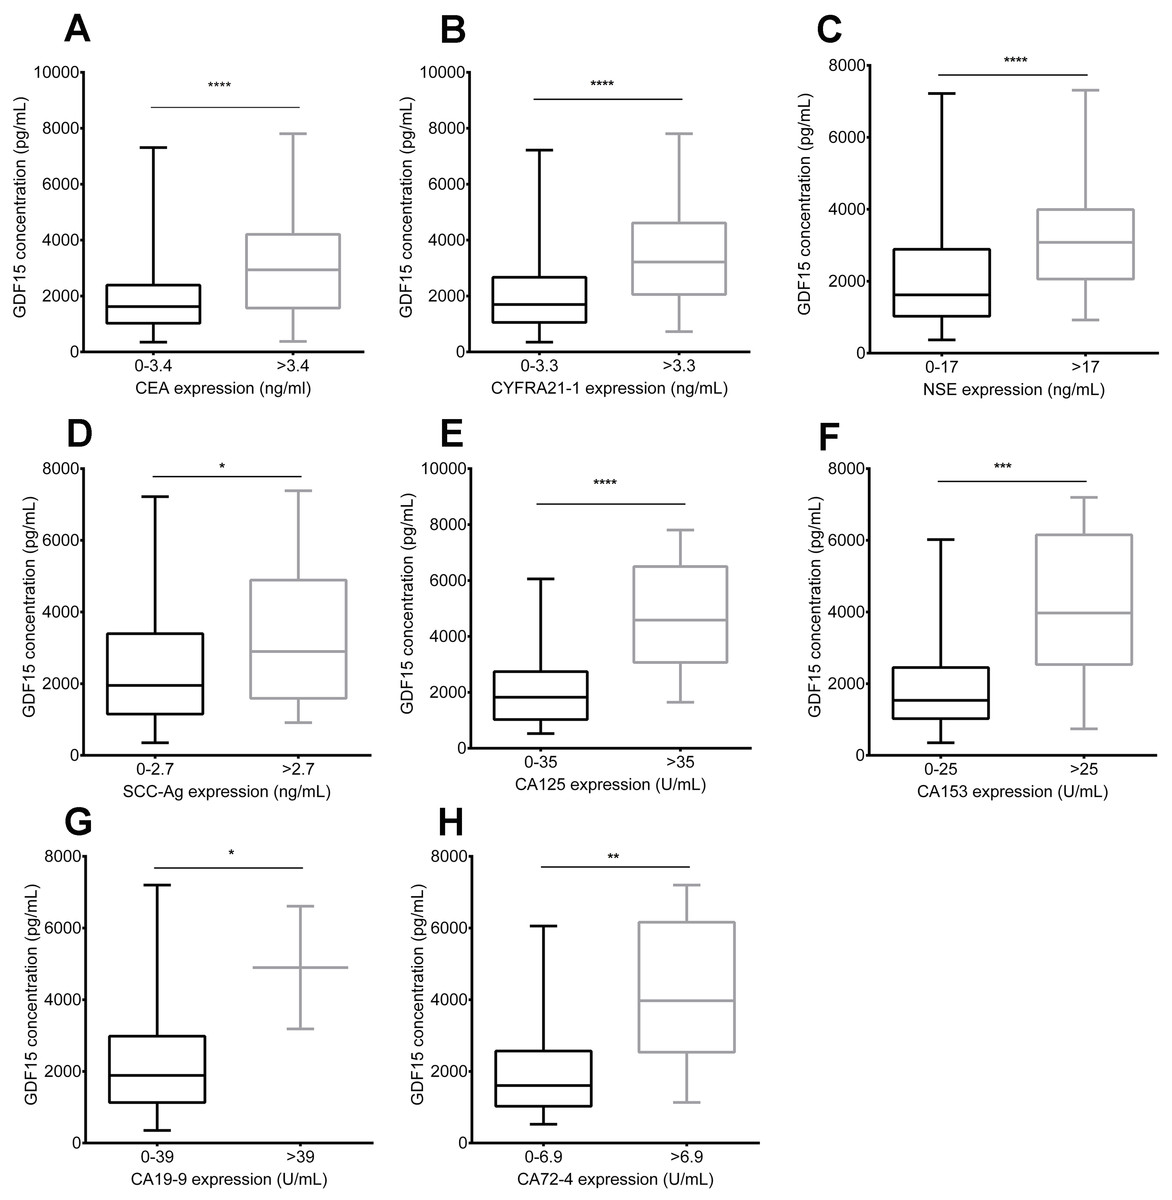
Figure 3: Association between serum GDF15 levels and conventional biomarkers in lung cancer patients.
Comparison of GDF15 levels in the markersnormal group and the markershigh group for the following biomarkers: (A) CEA; (B) CYFRA21-1; (C) NSE; (D) SCC-Ag; (E) CA125; (F) CA15-3; (G) CA19-9; and (H) CA72-4. Data represent mean ± standard error of the mean (SEM), with significance determined by an unpaired t-test, where * signifies p < 0.05, *** signifies p < 0.001, and **** signifies p < 0.0001.
Comparison of GDF15 and conventional biomarkers in lung cancer assessment
Certain cancer biomarkers showed varying diagnostic efficacy depending on the lung cancer subtype. For example, CEA levels were significantly higher in lung adenocarcinoma patients compared to those with SCC and SCLC. NSE levels were significantly higher in SCLC patients compared to those with adenocarcinoma or SCC. CYFRA21-1 and SCC-Ag serum levels were significantly higher in SCC patients compared to those with adenocarcinoma or SCLC. CA125 and CA153 serum levels were also higher in adenocarcinoma patients compared to those in SCC or SCLC patients (Jiang et al., 2023). As expected, all cancer biomarkers were significantly elevated in lung cancer specimens compared to non-tumor groups, with some differences across subtypes (Table 3). While CEA levels were significantly increased in all three subtypes of lung cancer, CYFRA21-1 and SCC-Ag were particularly increased more significantly in lung squamous cell carcinoma. Surprisingly, NSE levels were only slightly elevated in lung cancer specimens compared to the non-tumor groups, with minimal differences between subtypes. Compared with conventional biomarkers, GDF15 levels showed more pronounced differences between lung cancer patients and non-tumor group controls, with no clear correlation to specific lung cancer subtypes (Table 3, Fig. 1C).
GDF15 demonstrates better diagnostic efficacy for lung cancer compared with conventional biomarkers
Previous studies have shown that GDF15 is effective in diagnosis and monitoring various cancers, including liver and lung cancers (Hao et al., 2024). To further assess the advantages of GDF15 in lung cancer detection compared with conventional biomarkers, we conducted receiver operating characteristic (ROC) curve analyses. GDF15 showed strong diagnostic performance, with an area under the curve (AUC) of 0.88 (95% confidence interval [CI] [0.8377–0.9250]), a sensitivity of 80%, and a specificity of 83.02% compared to non-tumor controls. These results were consistent across lung cancer subtypes (Table 4, Figs. 4A, 4B, 4C and 4D), while CEA, CYFRA21-1, and CA125 showed good diagnostic efficacy in lung cancer and corresponding subtypes, SCC-Ag was primarily useful for diagnosing lung squamous cell carcinoma (Table 4, Figs. 4E, 4F, 4G, 4H, 4I, 4J, 4K and 4L). However, NSE had limited diagnostic value for both lung cancer and SCLC subtype, which may be partly due to insufficient sample size (Table 4, Figs. 4M and 4N). Overall, GDF15 has demonstrated superior diagnostic performance in lung cancer and its subtypes compared to conventional biomarkers.
| Diagnostic performance | Cases (non-tumor/cancer) | AUC | 95% CI | Cut-off value | Sensitivity | Specificity | p-value |
|---|---|---|---|---|---|---|---|
| Lung cancer | |||||||
| GDF15/(Normal) | 34/205 | 0.9053 | [0.8634–0.9472] | 1,026 | 0.8098 | 0.8824 | <0.0001 |
| GDF15 | 53/205 | 0.8814 | [0.8377–0.9250] | 1,073 | 0.8 | 0.8302 | <0.0001 |
| CEA | 19/187 | 0.8392 | [0.7582–0.9201] | 1.805 | 0.7647 | 0.7895 | <0.0001 |
| CYFRA 21-1 | 18/186 | 0.7120 | [0.6049–0.8191] | 3.250 | 0.3568 | 1 | 0.003 |
| SCC-Ag | 6/91 | 0.6099 | [0.4269–0.7929] | 1.115 | 0.5275 | 0.8333 | 0.3689 |
| NSE | 14/128 | 0.6468 | [0.5153–0.7782] | 15.35 | 0.5703 | 0.7143 | 0.07196 |
| CA125 | 5/43 | 0.9302 | [0.8562–1.004] | 9.770 | 0.8837 | 1 | 0.00181 |
| ADC | |||||||
| GDF15 | 53/128 | 0.8818 | [0.8333–0.9302] | 1,073 | 0.7969 | 0.8302 | <0.0001 |
| CEA | 19/115 | 0.8121 | [0.7236–0.9006] | 1.805 | 0.7217 | 0.7895 | <0.0001 |
| CA125 | 5/33 | 0.9636 | [0.9043–1.023] | 9.770 | 0.9091 | 1 | 0.00096 |
| SCC | |||||||
| GDF15 | 53/40 | 0.8981 | [0.8361–0.9601] | 1,031 | 0.825 | 0.8113 | <0.0001 |
| CYFRA 21-1 | 18/35 | 0.8135 | [0.7016–0.9254] | 3.510 | 0.5714 | 1 | 0.0002 |
| SCC-Ag | 6/26 | 0.7885 | [0.6140–0.9629] | 1.120 | 0.7692 | 0.8333 | 0.02986 |
| SCLC | |||||||
| GDF15 | 53/37 | 0.8618 | [0.7769–0.9468] | 1,109 | 0.8108 | 0.8302 | <0.0001 |
| NSE | 14/21 | 0.6378 | [0.4540–0.8215] | 16.05 | 0.5238 | 0.7857 | 0.1727 |
Note:
ADC, lung adenocarcinoma; SCC, lung squamous cell carcinoma; SCLC, small cell lung cancer.
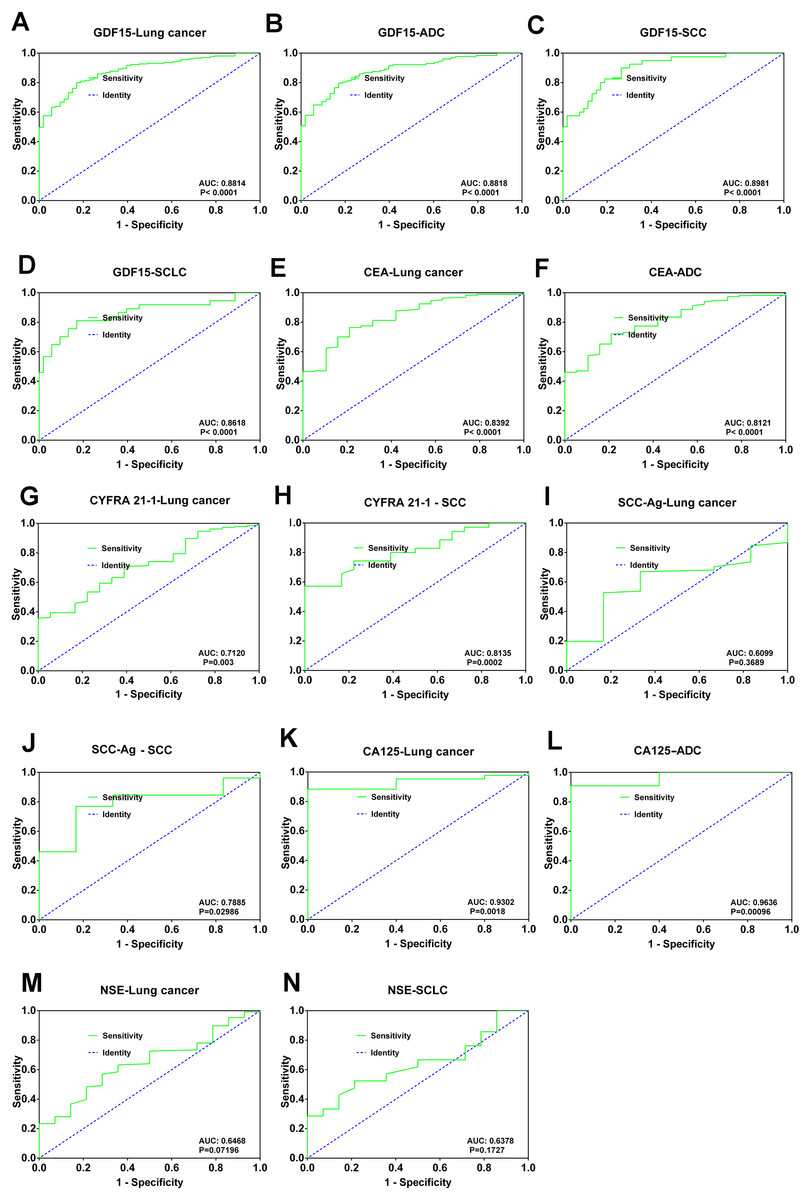
Figure 4: Diagnostic utility of GDF15 levels and conventional biomarkers in lung cancer.
(A) ROC curve showing the AUC and significance of GDF15 in lung cancer. (B) ROC curve for GDF 15 in lung adenocarcinoma (ADC). (C) ROC curve for GDF 15 in lung squamous cell carcinoma (SCC). ROC curve for GDF 15 in small cell lung cancer patients (SCLC). (E and F) ROC curves for CEA in the diagnosis of lung cancer and (ADC) lung adenocarcinoma. (G and H) ROC curves for CYFRA21-1 in the diagnosis of lung cancer and (SCC) lung squamous cell carcinoma. (I and J) ROC curves for SCC-Ag (I and J) in the diagnosis of lung cancer and (SCC) lung squamous cell carcinoma. (K and L) ROC curves for CA125 (K and L) in the diagnosis of lung cancer and (ADC) lung adenocarcinoma.
Discussion
Lung cancer remains the leading cause of cancer-related morbidity and mortality worldwide, yet the sensitivity and specificity of conventional lung cancer biomarkers are inadequate (Bray et al., 2024). In fact, relying on a single antigen biomarker for diagnosis often proves ineffective (Nooreldeen & Bach, 2021). The Chinese Medical Association guideline for clinical diagnosis and treatment of lung cancer (2024 edition) clearly states that biomarker detection is not recommended for lung cancer screening (Oncology Society of Chinese Medical Association, 2024). Therefore, there is a pressing need to identify biomarkers with better specificity and sensitivity for lung cancer.
GDF15 has been shown to be highly expressed in the serum of patients with various cancers, including gastrointestinal tumors, making it a promising biomarker for tumor screening and prognostic monitoring (Spanopoulou & Gkretsi, 2020; Xue et al., 2024). While GDF15 has been shown to be significantly increased in serum samples of patients with various cancers, including lung cancer, studies specifically examining its role in lung cancer have been limited and superficial (Xu et al., 2021; Hao et al., 2024). In this study, we found that serum GDF15 levels were significantly elevated in lung cancer patients compared to normal controls and those with benign lung diseases. GDF15 levels are also strongly correlated with commonly used lung cancer biomarkers such as CYFRA 21-1, CEA, NSE, SCC-Ag, CA125, CA153, CA199, and CA72-4. More importantly, while conventional biomarkers showed biases in detection across different lung cancer subtypes and were often limited in sensitivity and specificity, GDF15 was significantly upregulated in all lung cancer subtypes and displayed better performance in ROC curve analysis, highlighting its advantages in lung cancer detection.
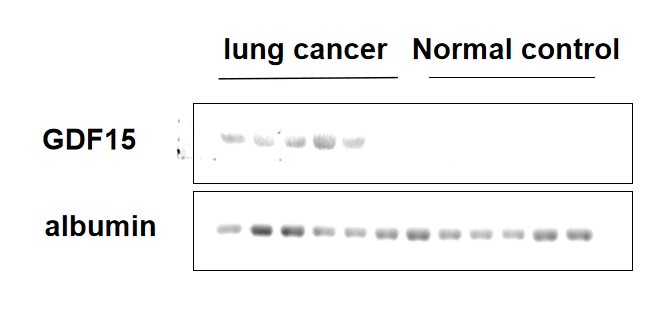
However, it is important to acknowledge certain limitations. ELISA is highly standardized and suitable for high-throughput workflows, the detection of serum molecules is typically performed using ELISA (detection limit: 0.1–10 pg) due to its higher sensitivity compared to methods such as western-blot (detection limit: 0.1–10 ng). Although the detection of GDF15 using western-blot was suboptimal, a trend of upregulated GDF15 expression was observed in the serum of lung cancer patients (Fig. S1). The lung cancer patients in this study were not newly diagnosed, and had undergone one or more combination therapies, such as surgery, radiotherapy, chemotherapy, or targeted therapy. This raises questions about GDF15’s role in lung cancer screening, but it also highlights its potential in cancer treatment monitoring, especially when combined with conventional biomarkers. Additionally, while the study included 49 non-tumor cases, the number of patients with pneumonia and benign tumors was relatively small, which may have influenced these findings. Our study primarily focused on measuring GDF15 levels in the normal control group without collecting additional demographic or clinical data (e.g., age, sex, or other biomarkers), which indeed represents a limitation of this work.
Conclusions
Our large-scale study, particularly focusing on lung cancer subtypes, demonstrated that GDF15 levels in the serum of lung cancer patients were significantly higher than those in non-cancer samples. Furthermore, GDF 15 was found to be consistent with the expression of eight conventional biomarkers and exhibited superior specificity and sensitivity in lung cancer detection.