
Clinical value of serum HBV RNA in patients with chronic hepatitis B during antiviral therapy
- Published
- Accepted
- Received
- Academic Editor
- Vladimir Uversky
- Subject Areas
- Biochemistry, Molecular Biology, Gastroenterology and Hepatology, Infectious Diseases
- Keywords
- Hepatitis B virus, Chronic hepatitis B, HBV RNA, HBeAg, Antiviral therapy
- Copyright
- © 2025 Zhang et al.
- Licence
- This is an open access article distributed under the terms of the Creative Commons Attribution License, which permits using, remixing, and building upon the work non-commercially, as long as it is properly attributed. For attribution, the original author(s), title, publication source (PeerJ) and either DOI or URL of the article must be cited.
- Cite this article
- 2025. Clinical value of serum HBV RNA in patients with chronic hepatitis B during antiviral therapy. PeerJ 13:e20275 https://doi.org/10.7717/peerj.20275
Abstract
Background
The correlation between hepatitis B virus (HBV) RNA, HBV DNA and hepatitis B surface antigen (HBsAg) during antiviral treatment and the clinical value of HBV RNA for virological response and drug discontinuance, are still unknown. This study was to investigate the clinical significance and predicting ability of HBV RNA for hepatitis B e antigen (HBeAg) seroconversion (SR) in chronic hepatitis B (CHB) patients receiving antiviral therapy.
Methods
A total of 138 patients with CHB who were newly diagnosed from January 2023 to December 2023 were enrolled in this study. Patients were divided into the SR group and the non-seroconversion (NSR) group according to HBeAg SR in baseline to the 60th week. The dynamic changes and correlations between HBV RNA, HBV DNA, HBsAg and HBeAg was analyzed between the two groups and the predictive values of them for HBeAg SR were calculated.
Results
The 60th week HBeAg SR rate was 23.9% (33/138), patients treated with tenofovir alafenamide fumarate (TAF) had higher SR rate than others (P < 0.001). After antiviral therapy, the serum HBV RNA levels of SR group decreased significantly than in the NSR group. Baseline HBV RNA levels were significantly correlated with HBV DNA, HBsAg and HBeAg in both groups, but weakened after antiviral therapy. Univariate and multivariate regression analysis showed that the serum HBV RNA levels at the 12th week was an independent predictor of HBeAg SR. The area under the receiver operating characteristic curve (AUROC) of the serum HBV RNA levels at the 12th week had a higher value (AUROC = 0.8039, 95% CI [0.691–0.917]). The cut off value of HBV RNA level with 5.68 lg copies/ml at the 12th week had a sensitivity of 76.47% and a specificity of 72.55% for predicting HBeAg SR.
Conclusions
Baseline HBV RNA levels in CHB patients exhibited a significantly positive correlation with HBV DNA and HBsAg levels, this correlation weakened after antiviral therapy. The serum HBV RNA level at the 12th week could serve as an early predictor for the HBeAg SR in patients with CHB. The CHB patients treated with antiviral drug TAF showed a higher HBeAg SR rate compared to ETV and TDF.
Introduction
The chronic hepatitis B virus (HBV) infection remains a serious threat to the lives and health of the people (Ganem & Prince, 2004; Wang et al., 2014). Globally, HBV-related diseases caused 555,000 deaths each year (GBD 2019 Hepatitis B Collaborators, 2022). There are 22.5% of patients with liver cirrhosis and 39.5% of patients with hepatocellular carcinoma caused by HBV. In China, the percentages of liver cirrhosis and hepatocellular carcinoma patients caused by HBV are 77% and 84%, respectively. The prevalence rate of hepatitis B surface antigen (HBsAg) in the general population in China is 5%–6%, with about 80 million chronic HBV infected patients, including approximately 30 million chronic hepatitis B (CHB) patients (Liu et al., 2019).
Currently, antiviral therapy is recognized as the most effective measure to prevent the progression of CHB and possibly reverse liver cirrhosis. The therapeutic drugs mainly include two categories: nucleoside analogs (NUCs) and interferons (Cusato et al., 2024). NUCs are widely used in clinical practice due to their convenient administration, few side effects, and strong virus-suppressing effects (Lok et al., 2016). For CHB patients treated with NUCs, guidelines from many countries consider serum HBV DNA levels below the lower limit of detection as virological response (Chinese Society of Infectious Diseases, Chinese Medical Association & Chinese Society of Hepatology, Chinese Medical Association, 2019; European Association for the Study of the Liver, 2017; Terrault et al., 2016; Terrault et al., 2018). NUCs are phosphorylated into active NUCs that replace structurally similar nucleosides required in the virus replication process, terminating the elongation and synthesis of HBV DNA chains and inhibiting the activity of viral DNA polymerase and reverse transcriptase, thereby suppressing virus replication. Some studies suggest that the disappearance of serum HBV DNA only indicates the process of viral reverse transcription has been effectively suppressed and does not reflect the transcriptional state of covalently closed circular DNA (cccDNA).
Recently, many researches on CHB have mentioned pre-genomic RNA (pgRNA) which is released into the blood in the form of virus-like particles as a main component of serum HBV RNA (Mak et al., 2023; Patel et al., 2017). Mak et al. (2023) found that changes of serum HBV pgRNA and HBcrAg at 4 weeks predicted HBsAg SR in treated CHB patients. In patients treated with NUCs, even though serum HBV DNA is undetectable before cccDNA depletion or transcriptional silencing, the pgRNA from cccDNA packaged in the nucleocapsid can still be released in the form of RNA virus-like particles which is not blocked by NUCs treatment (Wang et al., 2016). This may be the main reason why it is difficult to achieve clinical cure in CHB patients treated with NUCs. pgRNA is a direct transcript of cccDNA and can accurately reflect the presence of cccDNA in hepatocytes. The detection of serum HBV RNA will provide more direct evidence for the viral replication status and treatment effectiveness in CHB patients (Wang et al., 2016). Traditional virological response is defined based on serum HBV DNA levels, however, clinically there are CHB patients treated with NUCs have negative serum HBV DNA but persistently positive serum HBV RNA. To more accurately assess the antiviral effect, some suggest that the assessment of virological response should be redefined as the sustained disappearance of both serum HBV DNA and HBV RNA (Lu et al., 2017a; Lu et al., 2017b).
In clinical practice, the correlation between HBV RNA, HBV DNA and HBsAg during NUCs treatment and the clinical value of HBV RNA for virological response and drug discontinuance, are still unknown. Moreover, there are no definitive indicators for predicting the seroconversion (SR) of HBsAg or HBeAg (hepatitis B e antigen) of CHB patients after antiviral treatment. In this study, we have conducted a study that aimed to detect HBV RNA in CHB patients treated with NUCs antiviral therapy, explore the correlation between HBV RNA and HBV DNA, HBeAg and HBsAg, assess the predictive ability of HBV RNA for the occurrence of HBeAg SR and whether it can be used as an indicator of virological response.
Materials & Methods
Patients
The standard of diagnosis was in accordance with The Guidelines of Prevention and Treatment for Chronic Hepatitis B (2019 version) formulated by the Chinese Society of Infectious Diseases of the Chinese Medical Association (Chinese Society of Infectious Diseases, Chinese Medical Association & Chinese Society of Hepatology, Chinese Medical Association, 2019). Antiviral drugs for treatment included entecavir (ETV), tenofovir disoproxil fumarate (TDF), and tenofovir alafenamide fumarate (TAF). The exclusion criteria were as follows: patients with other types of viral hepatitis, drug-induced liver injury, autoimmune liver disease, and alcoholic or non-alcoholic fatty liver disease, as well as those who had already progressed to cirrhosis or liver cancer; patients with cardiovascular and cerebrovascular diseases; patients with mental illness. This study included a total of 138 CHB patients from Hangzhou Xixi Hospital between January 2023 to December 2023 and most patients followed up for 60 weeks, with the longest follow-up period up to 120 weeks. Peripheral blood samples were collected from patients at baseline, 12th week, 24th week, 36th week, 48th week, 60th week, 72th week, 84th week, 96th week, 108th week and 120th week during the treatment. Due to the high rate of loss to follow-up, data after 60 weeks are not included in this study. Patients were divided into the HBeAg SR group and the non-seroconversion (NSR) group in 60 weeks according to HBeAg SR in baseline to the 60th week. And the status of SR was long-term for each patient. The studies involving humans were approved by Clinical Research Ethics Committee of the Hangzhou Xixi Hospital (No. LKTZ-2022-72). The studies were conducted in accordance with the local legislation and institutional requirements. All participants provided written informed consent and consented for publication of this study.
Clinical data and laboratory assessments
Clinical data were collected from medical records to obtain general information such as age, gender, duration of HBV infection, family history of hepatitis B, time of initial treatment, etc. Markers of hepatitis B were detected using the Alinity i fully automated chemiluminescent immunoassay analyzer (Abbott, USA), with a lower limit of quantitation for HBsAg of 0.05 IU/ml. The assay type for HBeAg was CLIA and it was semi-quantitative. Serum HBV DNA levels were measured using real-time fluorescent quantitative PCR on the ABI7500 fluorescent quantitative PCR machine, with a lower detection limit of 30 IU/ml. According to the manufacturer’s protocol, 40 µL of serum was lysed with the provided nucleic acid releasing agent and directly added to the PCR reaction mix as the template, bypassing the need for conventional DNA extraction. The Hepatitis B Virus Ribonucleic Acid Quantitative Detection Kit (PCR-fluorescent probe method) of Sansure Biotech Co., Ltd. (Hunan, China) was used for the detection of serum HBV RNA. Viral RNA was extracted from 200 µL of serum using the kit’s magnetic bead-based nucleic acid extraction components according to the manufacturer’s protocol. This kit utilizes reverse transcription of pgRNA within the HBV nucleic acid, combined with a set of specific primers, fluorescent probes designed specifically for the HBV pgRNA sequence and PCR reaction solution, to achieve quantitative detection of HBV pgRNA through changes in fluorescent signals by the real-time fluorescent quantitative PCR detection technology on a fluorescent quantitative PCR machine. HBV RNA levels below 100 copies/ml were considered negative. The primer sequences of HBV DNA and RNA assay were confidential and have not been provided by the company. Liver function tests were conducted using the Beckman Coulter AU5831 fully automated biochemical analyzer to measure alanine aminotransferase (ALT), aspartate aminotransferase (AST), and glutamyl transpeptidase (GGT). The normal ranges for ALT, AST, and GGT are 9–50 U/L, 15–40 U/L, and 10–60 U/L, respectively.
Statistical analysis
Quantitative data within characteristics of patients were described as the median and quartile. The values of HBsAg, HBeAg, HBV DNA, and HBV RNA were converted by logarithmic transformation. Categorical data were described as count and constituent ratio. Comparisons between two groups of categorical variables were tested using the chi-square test. Differential analysis between groups of quantitative data were calculated using wilcox rank-sum test. Correlation analysis between two variables were performed using spearman method. Logistic regressions were used to calculate the odds ratios (OR) and 95% confidence intervals (95% CI) of HBsAg, HBeAg, HBV DNA, and HBV RNA. The receiver operating characteristic (ROC) curve was performed to calculate the area under the curve (AUC) and the optimal predictive value of HBV RNA. The P values < 0.05 were considered statistically significant. All statistical analysis were completed by R software (version 4.2.2).
Results
Baseline characteristics of patients
This study included 138 CHB patients who received initial treatment, including 91 males and 47 females, with an average age of 36 (Table 1). Among them, 47 patients received ETV treatment, 63 patients received TDF treatment, and 28 patients received TAF treatment. Based on whether HBeAg SR occurred during 60 weeks follow-up, the patients were divided into two groups: the HBeAg SR group with 33 patients (23.9%) and the NSR group with 105 patients (76.1%). During the treatment, many cases were loss to follow-up. From the week 12 to the week 60 follow-up, there were 68, 32, 31, 25 and 23 patients participating the follow-up, respectively. Between the two groups, no significant differences in baseline levels of HBV RNA, HBV DNA, HBsAg, PLT, AST, TBIL, ALB, and ALP were observed. The baseline HBeAg level in the SR group was lower than that in the NSR group (NSR: median 2.78 lg IU/ml, IQR 0.67; SR: median 2.31 lg IU/ml, IQR 1.67; P = 0.009), while the baseline ALT (NSR: median 209 U/L, IQR 381; SR: median 286 U/L, IQR 636; P = 0.015) and GGT (NSR: median 65 U/L, IQR 82; SR: median 108 U/L, IQR 119; P = 0.014) levels in the SR group were higher than those in the NSR group, with statistically significant differences.
| Characteristic | Overall (n = 138) | NSR group (n = 105) | SR group (n = 33) | P value |
|---|---|---|---|---|
| Age (years) | 36.00 (31.00, 42.00) | 37.00 (31.00, 42.00) | 35.00 (31.00, 40.00) | 0.476 |
| Gender | 0.602 | |||
| Female | 47 (34%) | 37 (35%) | 10 (30%) | |
| Male | 91 (66%) | 68 (65%) | 23 (70%) | |
| HBsAg (lg IU/ml) | 3.95 (3.52, 4.36) | 3.99 (3.51, 4.37) | 3.86 (3.70, 4.24) | 0.966 |
| HBeAg (lg IU/ml) | 2.73 (1.99, 3.06) | 2.78 (2.41, 3.08) | 2.31 (1.23, 2.90) | 0.009 |
| HBV DNA (lg IU/ml) | 7.38 (6.62, 7.91) | 7.42 (6.61, 7.91) | 7.28 (6.77, 7.80) | 0.788 |
| HBV RNA (lg copies/ml) | 7.23 (6.86, 7.70) | 7.22 (6.86, 7.70) | 7.26 (6.97, 7.70) | 0.901 |
| PLT (U/L) | 175.00 (130.75, 210.50) | 181.00 (133.00, 214.00) | 167.00 (123.00, 199.00) | 0.474 |
| ALT (U/L) | 233.00 (67.25, 470.00) | 209.00 (59.00, 440.00) | 286.00 (195.00, 831.00) | 0.015 |
| AST (U/L) | 119.50 (65.25, 248.00) | 116.00 (61.00, 231.00) | 151.00 (90.00, 351.00) | 0.064 |
| TBIL (U/L) | 18.13 (12.76, 32.01) | 17.67 (12.56, 28.99) | 19.25 (15.16, 41.04) | 0.188 |
| ALB (U/L) | 38.30 (34.68, 41.30) | 38.30 (34.30, 41.70) | 38.40 (35.70, 40.40) | 0.966 |
| ALP (U/L) | 97.50 (77.00, 134.75) | 94.00 (77.00, 140.00) | 100.00 (86.00, 114.00) | 0.834 |
| GGT (U/L) | 72.00 (34.00, 141.00) | 65.00 (33.00, 115.00) | 108.00 (52.00, 171.00) | 0.014 |
| Treatment | <0.001 | |||
| ETV | 47 (34%) | 41 (39%) | 6 (18%) | |
| TAF | 28 (20%) | 12 (11%) | 16 (48%) | |
| TDF | 63 (46%) | 52 (50%) | 11 (33%) |
Changes of serum virological indicators during antiviral treatment
During the 60 weeks period of antiviral treatment with NUCs, the levels of serum HBV RNA and HBV DNA were continuously decreasing and both serum HBV RNA and HBV DNA levels were lower in the SR group compared to the NSR group (Fig. 1A). The HBV DNA levels decreased rapidly in week 24 and were mostly negative by week 36. However, the HBV RNA levels decreased rapidly within the week 36 and stabilized at around four lg copies/ml by week 36. The HBV RNA levels in the SR and NSR group showed a similar trend of change, but the magnitude of the decrease and the absolute values were significantly different (Fig. 1B). The HBV RNA level was not statistically significant at baseline but statistically significant at week 12 (NSR: median 5.95 lg copies/ml, IQR 0.96; SR: median 5.40 lg copies/ml, IQR 0.69; P < 0.001), week 24 (NSR: median 5.20 lg copies/ml, IQR 1.1; SR: median 4.21 lg copies/ml, IQR 0.49; P = 0.013) and week 36 (NSR: median 4.43 lg copies/ml, IQR 1.05; SR: median 3.78 lg copies/ml, IQR .065; P = 0.043). It was indicating that the HBV RNA levels in the SR group declined faster than those in the NSR group within week 36. The lack of differences of HBV RNA levels after 36 weeks may be attributed to the smaller sample size due to loss to follow-up, low levels of HBV RNA, or the decreased medication compliance among patients.
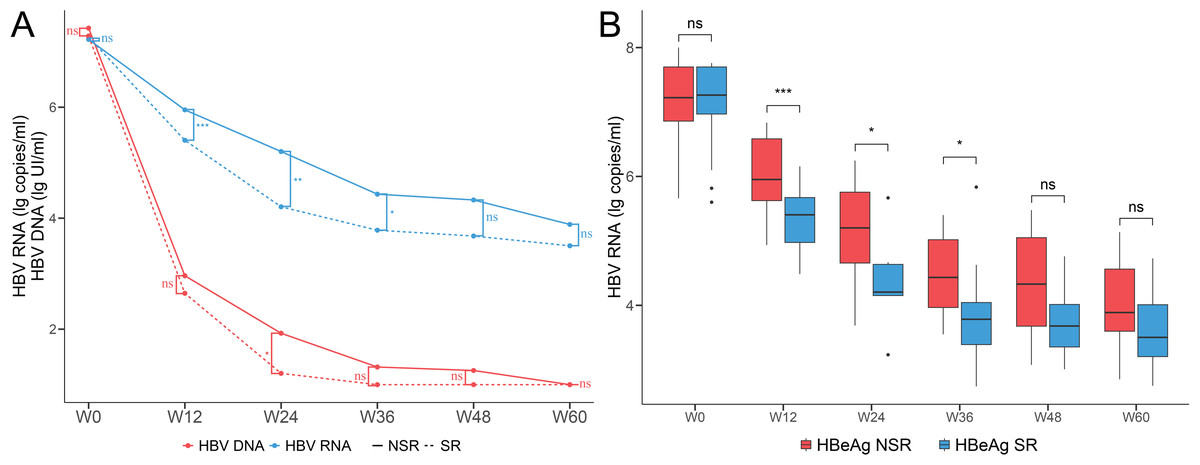
Figure 1: Dynamic changes of serum HBV serum markers levels during antiviral treatment.
(A) Line chart of serum HBV RNA and HBV DNA levels of the SR and NSR group for baseline to week 60. (B) Boxplot of serum HBV RNA levels of the SR and NSR group for baseline to week 60.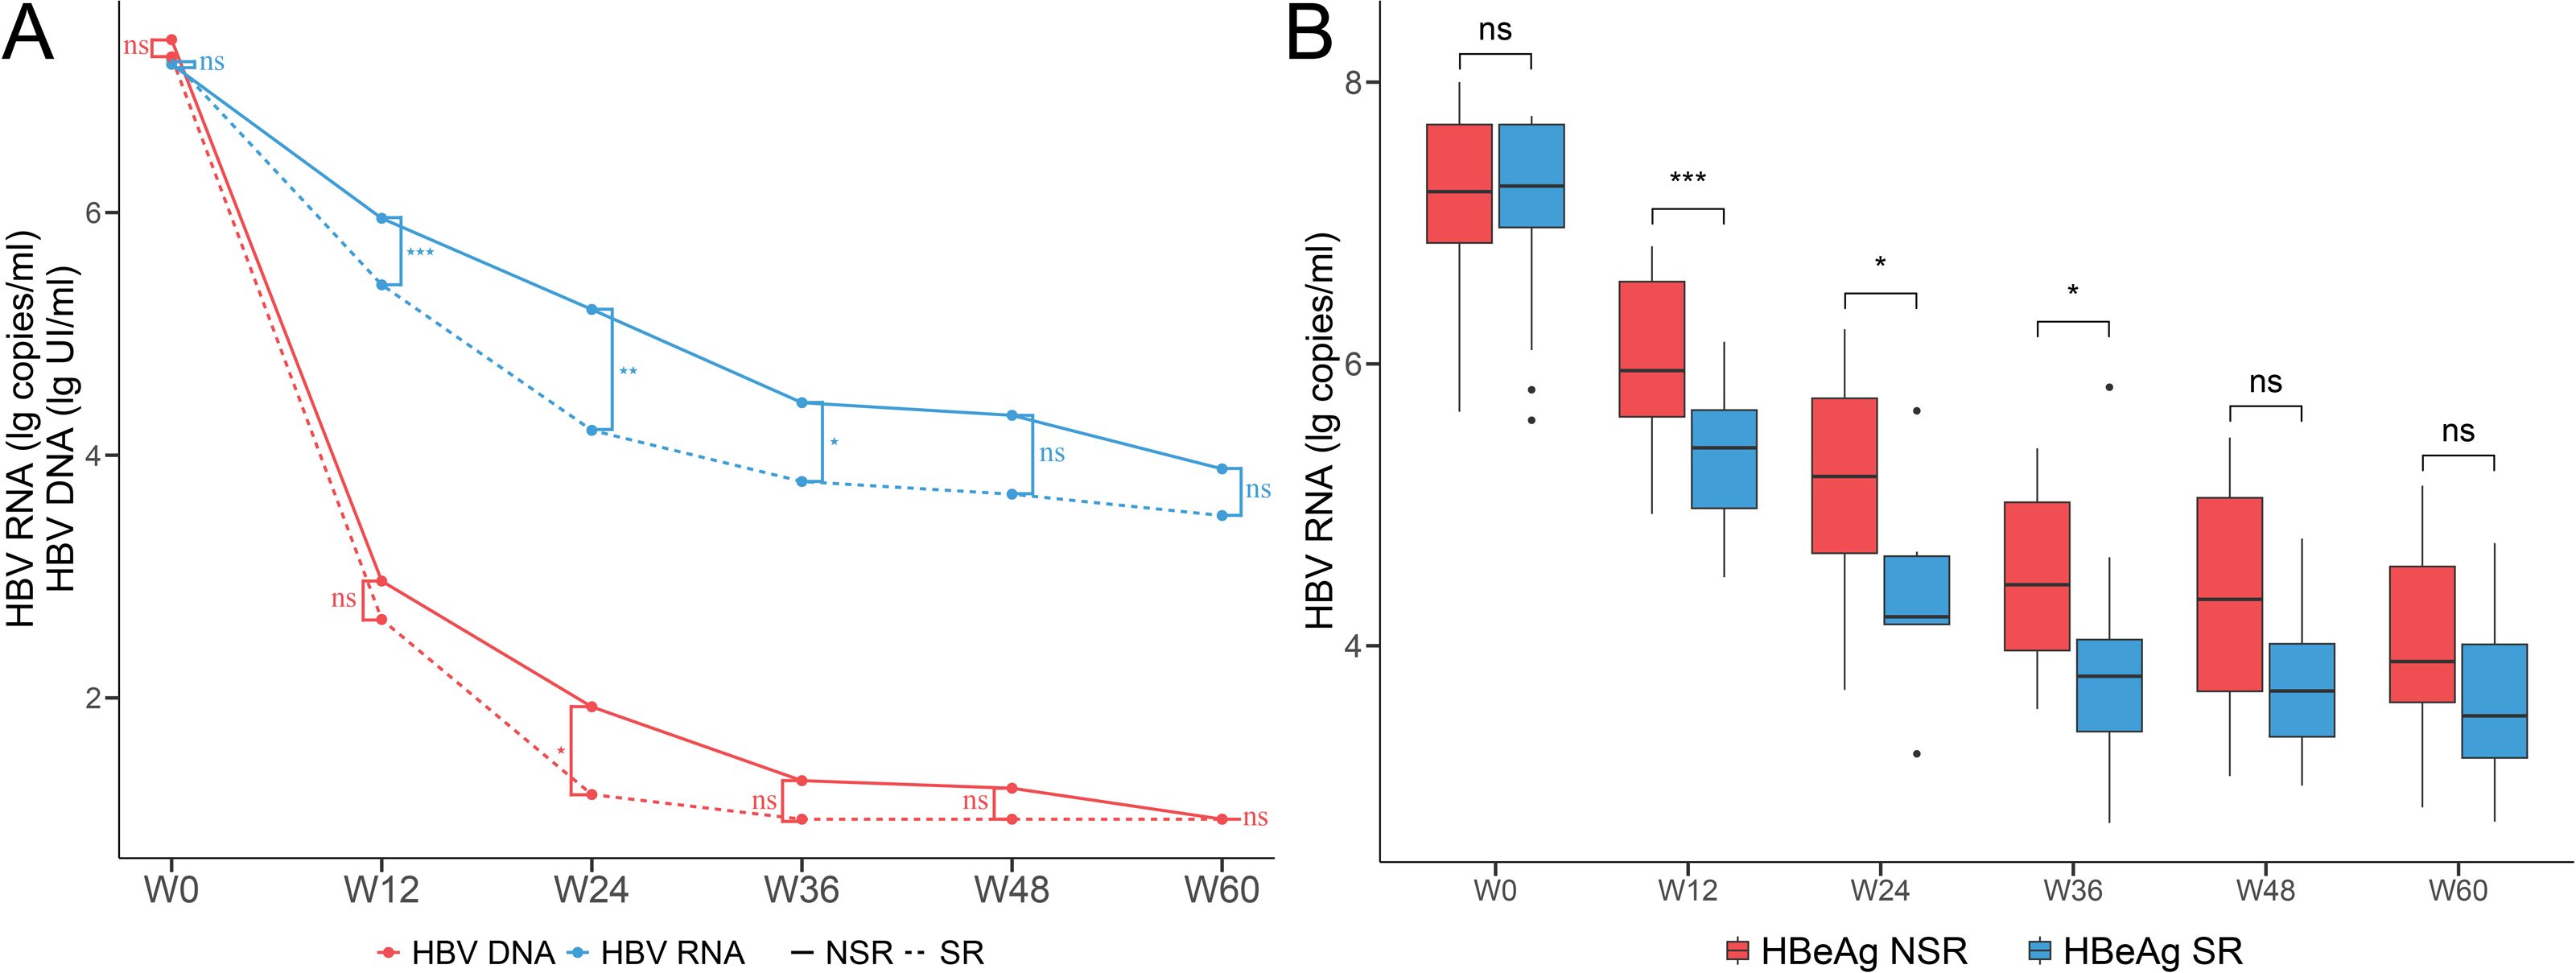
Correlation between serum virological indicators
Baseline levels of HBV RNA in both groups of CHB patients were significantly correlated with HBV DNA and HBsAg, the correlation was stronger in the SR group (SR: HBV RNA vs. HBV DNA, r = 0.74, P < 0.001, Fig. 2A; SR: HBV RNA vs. HBsAg, r = 0.61, P < 0.001, Fig. 2E; NSR: HBV RNA vs. HBV DNA, r = 0.63, P < 0.001, Fig. 2B; NSR: HBV RNA vs. HBsAg, r = 0.55, P < 0.001, Fig. 2F). After antiviral treatment, the correlation between HBV RNA, HBV DNA and HBsAg, gradually weakened in both groups. At week 24, the correlation between HBV RNA and HBV DNA in the SR group was 0.27 (P = 0.52, Fig. 2C), and the correlation between HBV RNA and HBsAg was 0.48 (P = 0.243, Fig. 2G). In the NSR group, the correlation between HBV RNA and HBV DNA was 0.36 (P = 0.083, Fig. 2D), and the correlation between HBV RNA and HBsAg was 0.15 (P = 0.479, Fig. 2H). Baseline levels of HBV RNA in both groups of CHB patients showed a moderate correlation with HBeAg, the correlation was stronger in the SR group (SR: r = 0.46, P = 0.008, Fig. 2I; NSR r = 0.34, P < 0.001, Fig. 2J). After antiviral treatment, the correlation disappeared in the SR group, but maintained a moderate level in the NSR group. At week 24, the correlation in the SR group was −0.31 (P = 0.462, Fig. 2K), and it was 0.42 in the NSR group (P = 0.041, Fig. 2L).
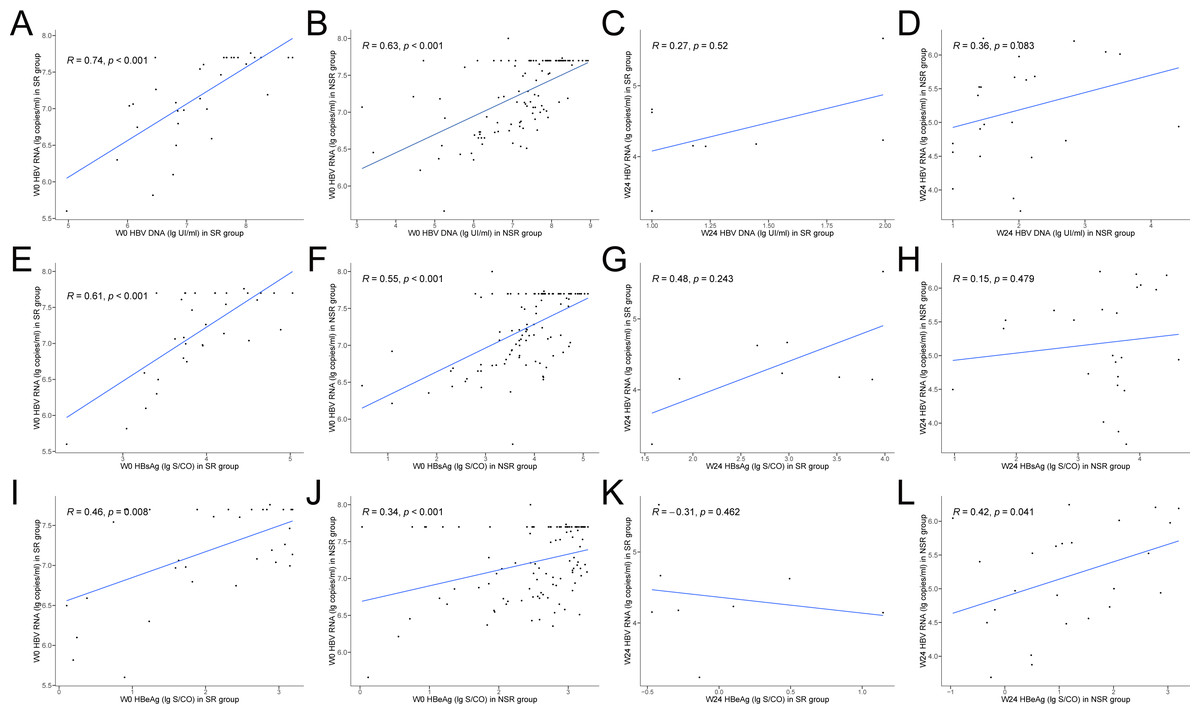
Figure 2: Correlations between serum HBV serum markers levels at baseline and week 24.
Correlations between serum HBV RNA and HBV DNA levels at baseline of (A) the SR group and (B) the NSR group and week 24 of (C) the SR group and (D) the NSR group. Correlations between serum HBV RNA and HBsAg levels at baseline of (E) the SR group and (F) the NSR group and week 24 of (G) the SR group and (H) the NSR group. Correlations between serum HBV RNA and HBeAg levels at baseline of (I) the SR group and (J) the NSR group and week 24 of (K) the SR group and (L) the NSR group.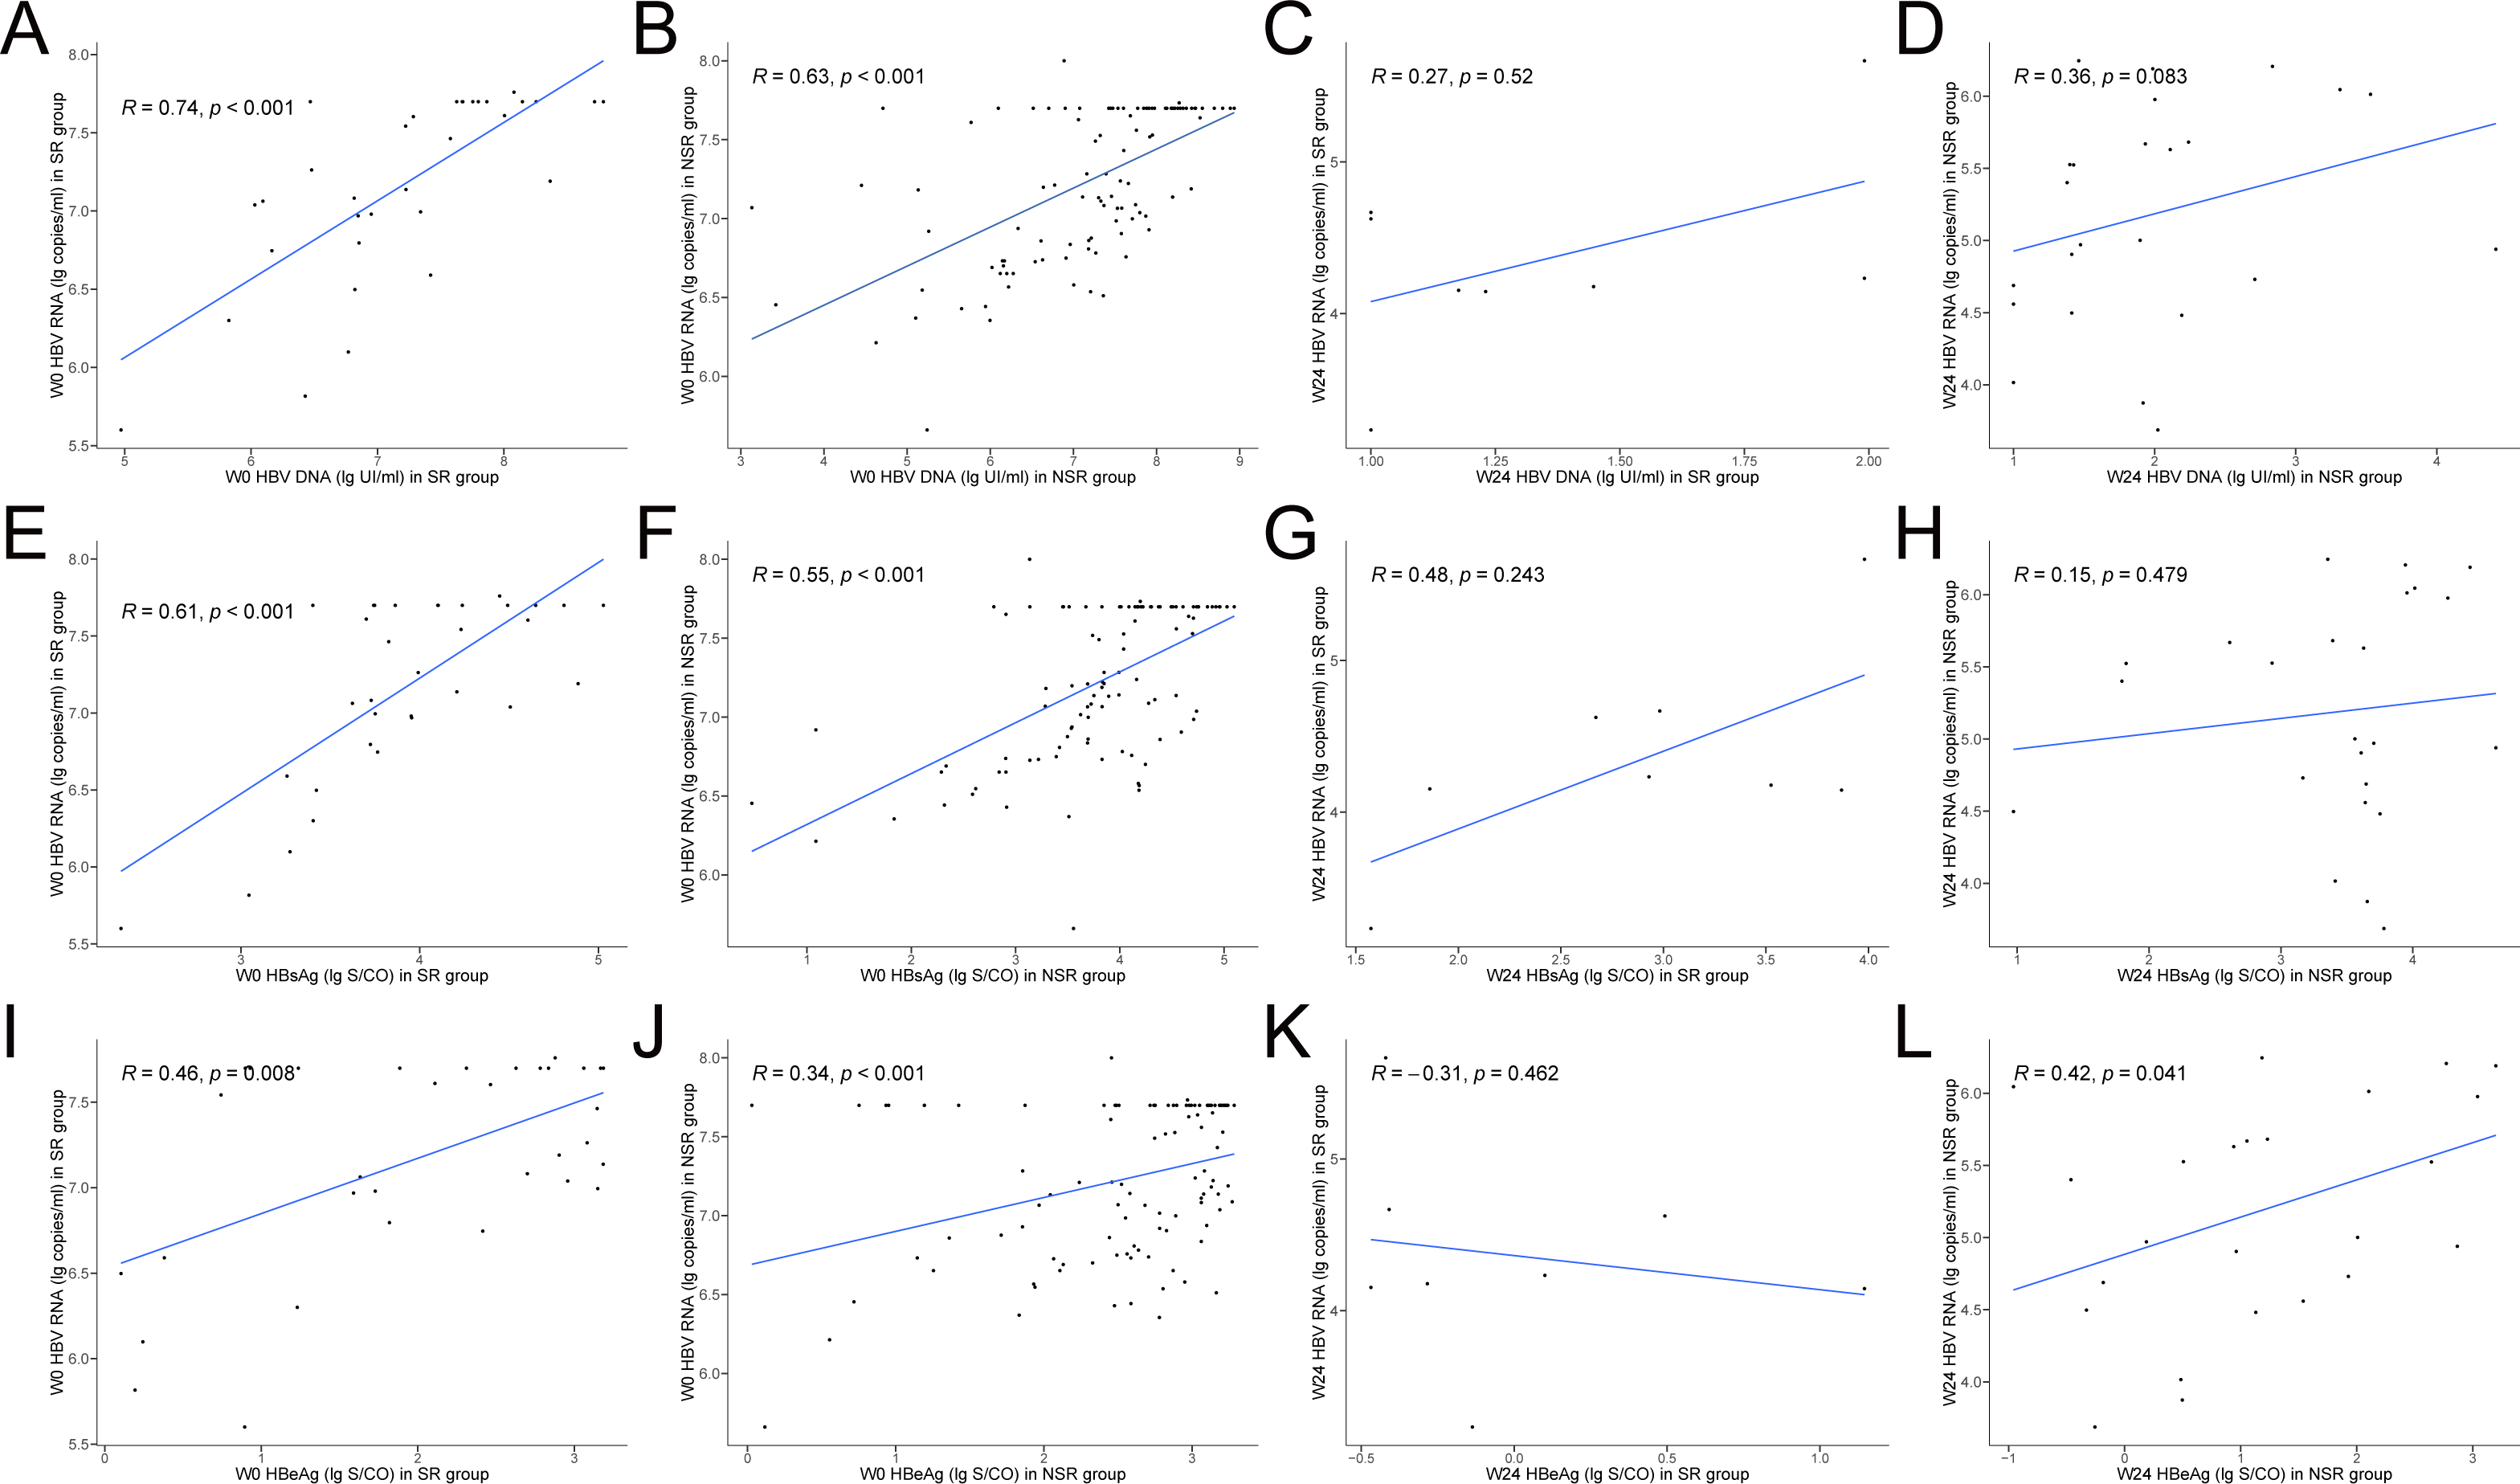
Ability of serum HBV RNA predicting HBeAg SR
Univariate and multivariate regression analyses were conducted to identify factors associated with HBeAg SR of NUCs treatment and found that HBV RNA may be an independent predictor of early HBeAg SR (Table 2). Univariate regression analysis at week 0, 12, and 24 showed that HBV DNA, HBsAg, and HBV RNA were significantly associated with HBeAg SR (P < 0.05). ALT was associated with SR only at baseline. Multivariate analysis further revealed that only HBV RNA maintained significance at week 12. ROC curves were made to assess the predictive ability of early HBV RNA levels for HBeAg SR. The AUROC value for HBV RNA increased from baseline (AUROC = 0.493) (Fig. 3A) to week 12 (AUROC = 0.804) (Fig. 3B) and decreased at week 24 (AUROC = 0.792) (Fig. 3C). The decline in serum HBV RNA levels at week 12 of antiviral treatment (AUROC = 0.804, 95% CI [0.691–0.917]) showed significantly better predictive efficacy for HBeAg SR compared to the decline in HBV DNA (AUROC = 0.634, 95% CI [0.490–0.779]) and HBsAg (AUROC = 0.734, 95% CI [0.606–0.860]) during the same period. Using a cut-off value of a 5.68 lg copies/ml in HBV RNA from baseline to week 12, the sensitivity and specificity for predicting HBeAg SR were 76.47% and 72.55%, respectively. This indicated that the decline in serum HBV RNA levels at week 12 can be used as an early predictor of HBeAg SR.
| Characteristic | Univariate analyses | Multivariate analyses | ||
|---|---|---|---|---|
| OR (95% CI) | P value | OR (95% CI) | P value | |
| Week 0 | ||||
| HBsAg | 1.188 (0.703, 2.008) | 0.520 | 1.167 (0.467, 2.915) | 0.74 |
| HBeAg | 0.5 (0.32, 0.782) | 0.002 | 0.306 (0.161, 0.579) | <0.001 |
| HBV DNA | 1.057 (0.729, 1.533) | 0.769 | 1.381 (0.66, 2.89) | 0.374 |
| HBV RNA | 0.808 (0.38, 1.722) | 0.581 | 0.703 (0.197, 2.518) | 0.585 |
| ALT | 1.001 (1, 1.002) | 0.029 | 1 (0.999, 1.002) | 0.467 |
| GGT | 1.004 (1, 1.008) | 0.04 | 1 (0.995, 1.006) | 0.864 |
| Week 12 | ||||
| HBsAg | 0.271 (0.103, 0.718) | 0.009 | 0.401 (0.102, 1.579) | 0.168 |
| HBeAg | 0.47 (0.278, 0.793) | 0.005 | 0.605 (0.308, 1.185) | 0.139 |
| HBV DNA | 0.617 (0.368, 1.033) | 0.066 | 1.425 (0.742, 2.736) | 0.295 |
| HBV RNA | 0.112 (0.032, 0.389) | <0.001 | 0.159 (0.032, 0.79) | 0.015 |
| ALT | 0.984 (0.961, 1.007) | 0.165 | 0.993 (0.97, 1.017) | 0.564 |
| GGT | 0.995 (0.968, 1.024) | 0.743 | 0.993 (0.958, 1.029) | 0.698 |
| Week 24 | ||||
| HBsAg | 0.543 (0.219, 1.344) | 0.187 | 0.984 (0.213, 4.542) | 0.984 |
| HBeAg | 0.27 (0.081, 0.895) | 0.032 | 0.323 (0.047, 2.201) | 0.218 |
| HBV DNA | 0.14 (0.018, 1.078) | 0.059 | 0.093 (0.003, 2.566) | 0.114 |
| HBV RNA | 0.214 (0.054, 0.842) | 0.027 | 0.117 (0.007, 1.849) | 0.05 |
| ALT | 0.977 (0.919, 1.04) | 0.472 | 0.905 (0.762, 1.076) | 0.221 |
| GGT | 1.011 (0.986, 1.037) | 0.393 | 1.047 (0.988, 1.11) | 0.053 |
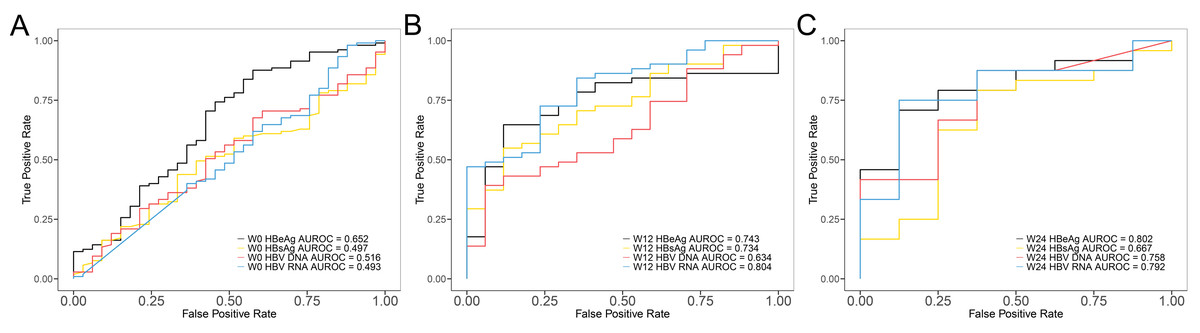
Figure 3: ROC curves of each serum HBV serum markers predicting HBeAg SR.
(A) Baseline, (B) week 12 and (C) week 24.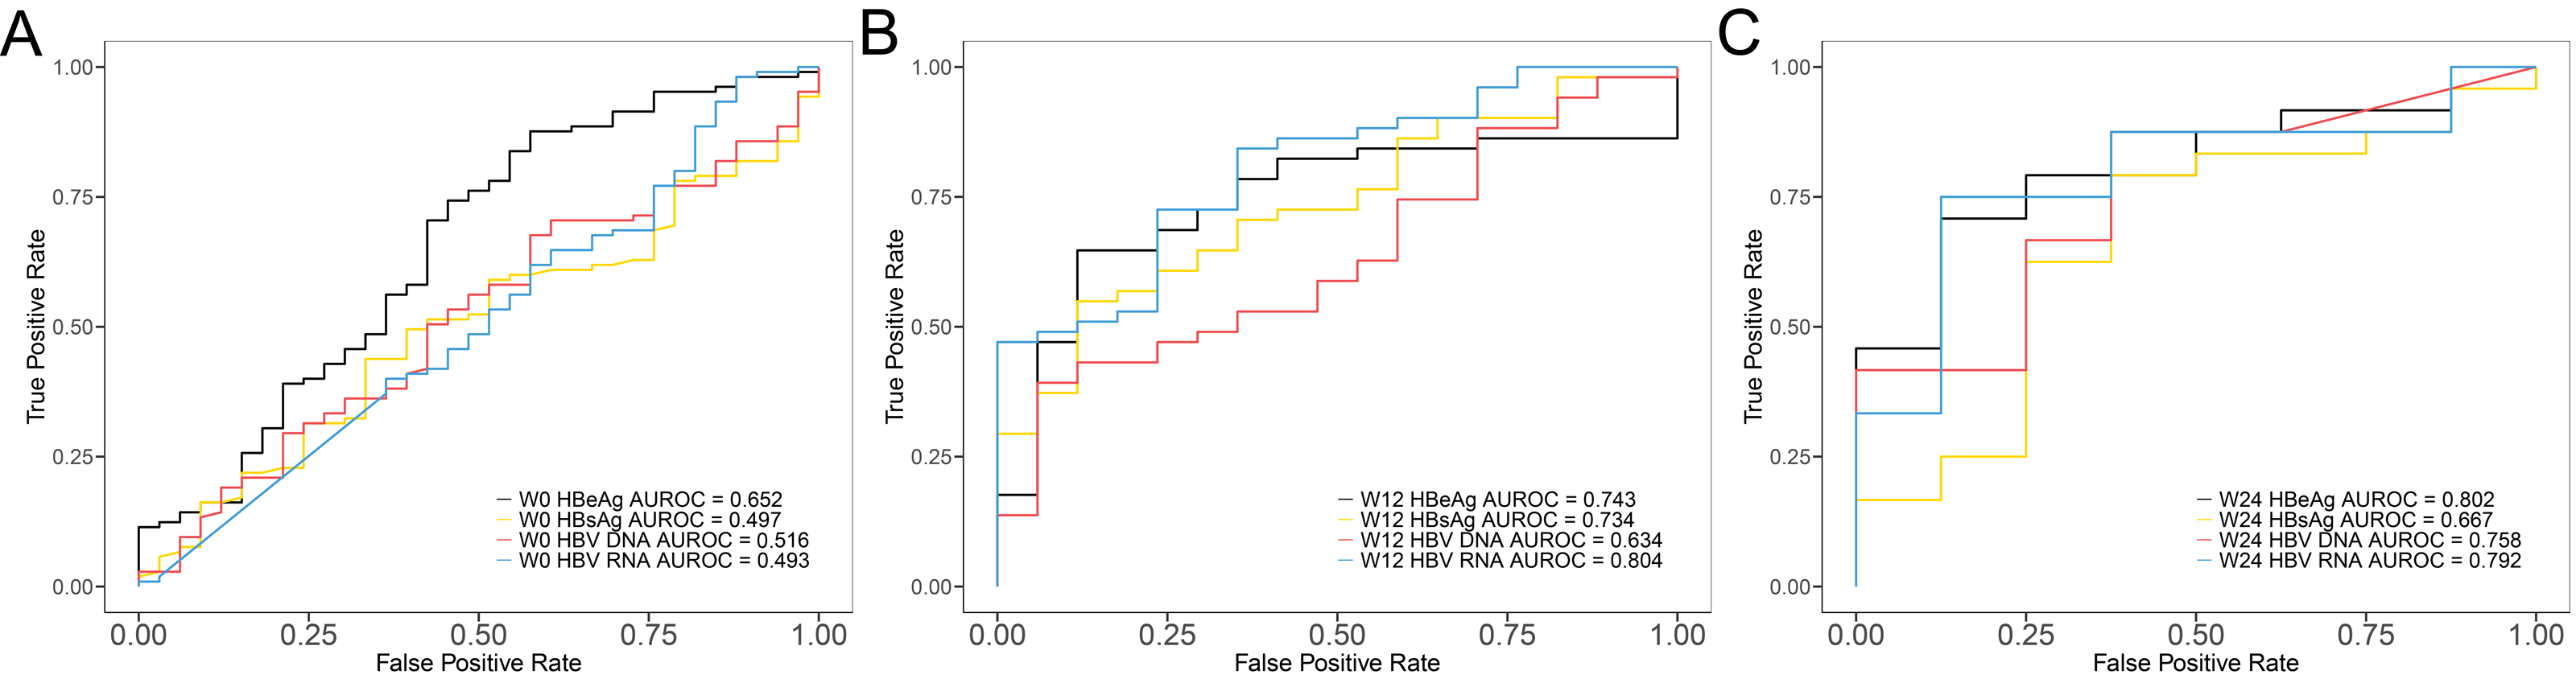
The effects of different antiviral drugs
After antiviral treatment with ETV, TDF, and TAF, the levels of HBV RNA decreased progressively with no significant difference (Fig. 4). Compared with the NSR group, the SR group exhibited a more pronounced decrease in HBV RNA levels. The HBeAg SR rate was 23.9% (33/138), with a SR rate of 57.1% (16/28) in patients receiving TAF treatment, much higher than the 12.8% (6/47) in patients receiving ETV treatment and 17.5% (11/63) in patients receiving TDF treatment. Patients treated with TAF had higher SR rate than others (P < 0.001).
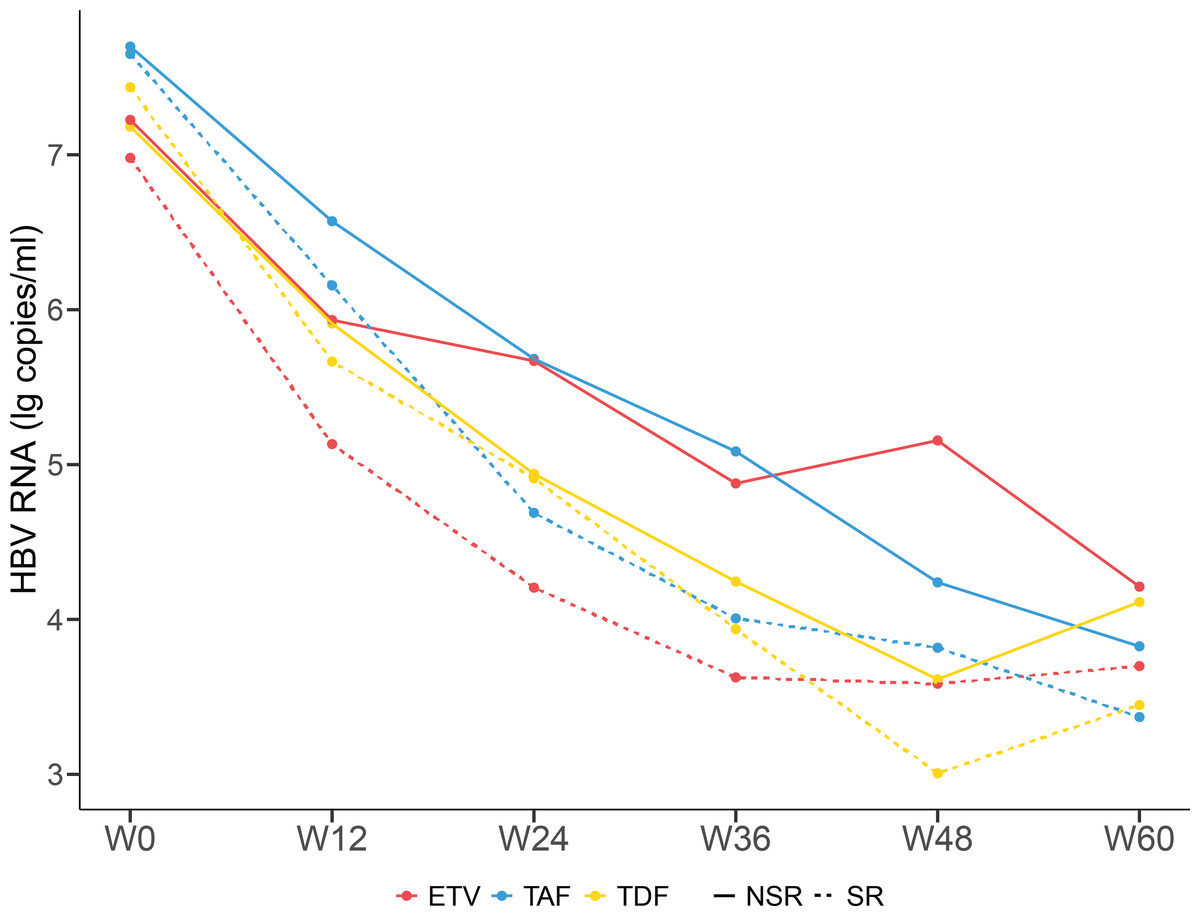
Figure 4: Dynamic changes of serum HBV RNA levels of patients taking different antiviral drugs of the SR group and NSR group.
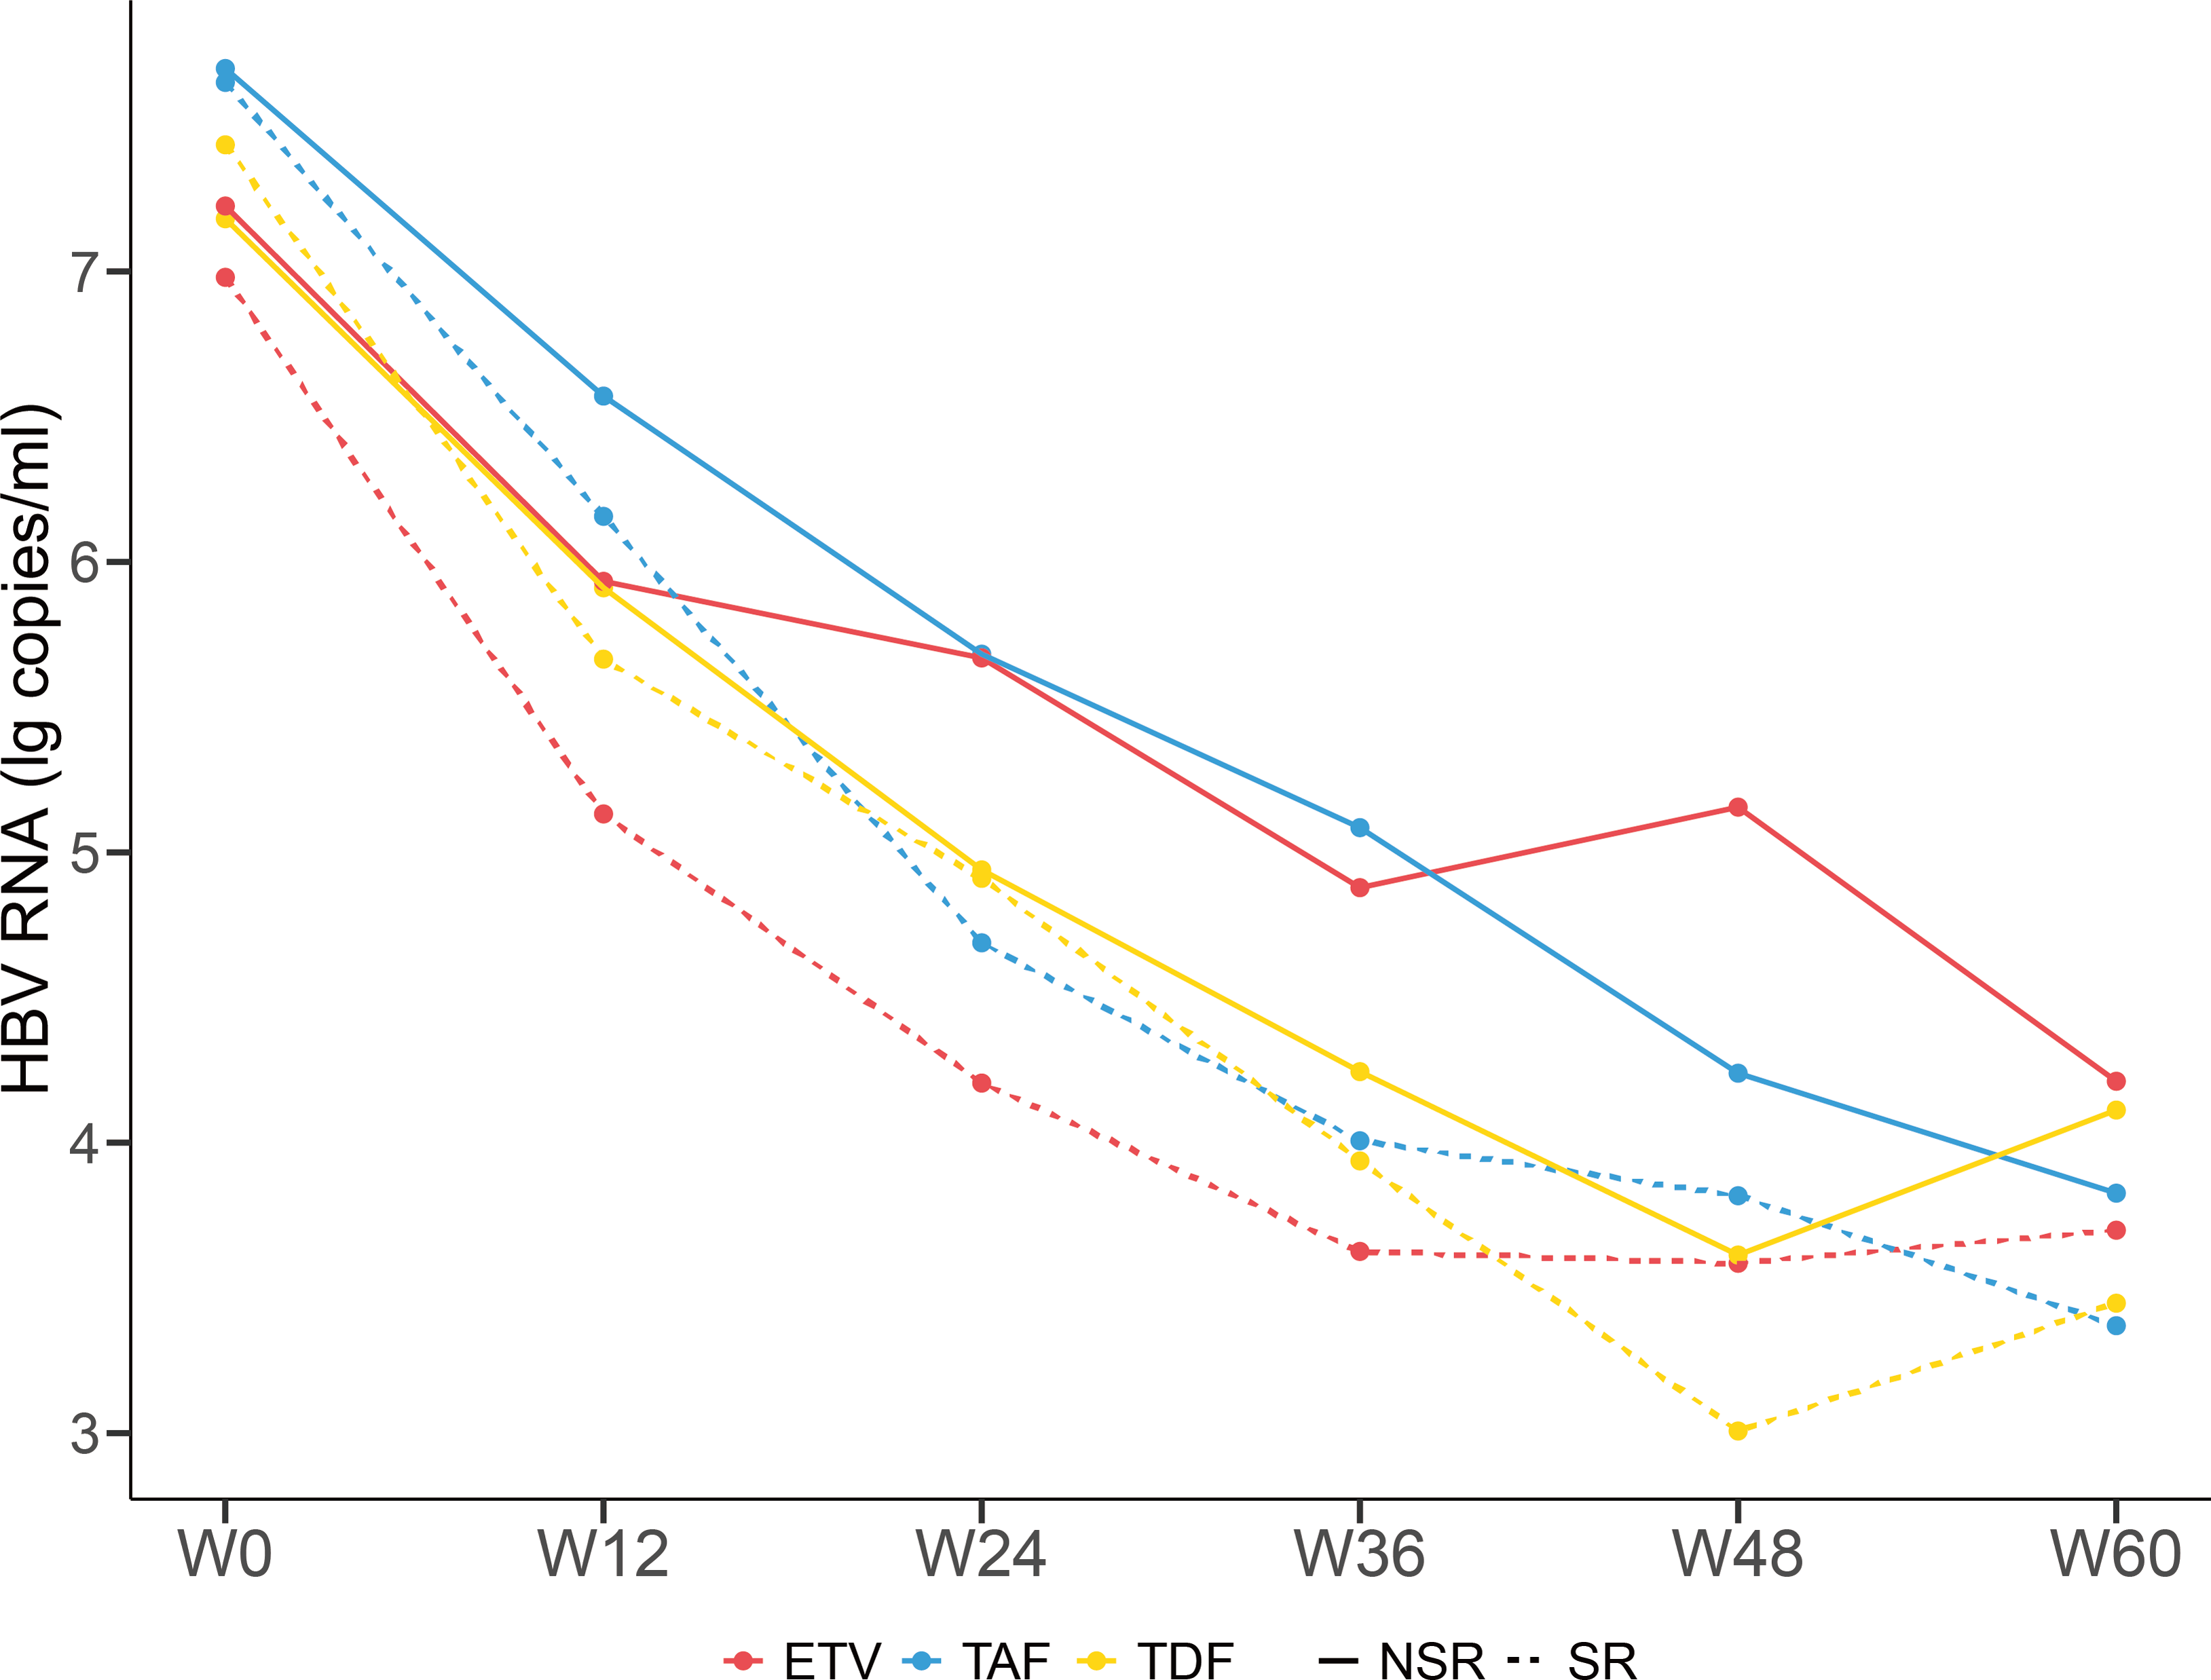
Discussion
As widely known, NUCs treatment can significantly reduce the levels of serum HBV RNA, HBV DNA, HBsAg and HBeAg in CHB patients, indicating that both novel serum markers reflect the changes in HBV DNA replication during antiviral treatment for CHB patients. In our results, the serum HBV DNA levels of most patients were already below the detection limit after six months of treatment, however, few patients achieved HBV RNA SR after 60 weeks of NUCs treatment, suggesting that the decrease in serum HBV RNA levels was slower than that of HBV DNA levels. This indicated that low levels of HBV DNA in patients can still promote disease progression through other viral particles, such as HBV RNA virus-like particles or empty virus particles (Li et al., 2021; Mak et al., 2021). The results of a prospective discontinuation study containing 130 patients showed that serum HBV RNA effectively predicted recurrence after discontinuation of NUCs (Fan et al., 2020). Specifically, patients with undetectable serum HBV RNA at the time of treatment discontinuation exhibited significantly lower cumulative recurrence rates at four years compared to those with detectable HBV RNA. Moreover, patients who were double-negative for both HBV RNA and HBV DNA had a markedly lower clinical recurrence rate (8.0%) than those with single positivity for either marker (31.4%). Although the present study did not directly evaluate treatment discontinuation, these findings from the literature suggest that the persistence of serum HBV RNA may indicate a continued risk of viral rebound, even when HBV DNA is undetectable. Therefore, future studies are warranted to investigate whether HBV RNA negativity could serve as a more reliable criterion for safe treatment discontinuation, highlighting the need for a more comprehensive virological assessment in guiding cessation strategies.
Our results showed that compared with patients who did not achieve HBeAg SR, those who had significantly lower baseline serum HBeAg levels. This was similar to the results of other long-term follow-up cohort studies on CHB patients taking NUCs antiviral treatment in the real world (Luo et al., 2019; Wang et al., 2020). In clinical practice, whether patients achieve HBeAg SR is important for long-term prognosis. Our study showed that more than 90% of CHB patients had HBV DNA levels below the detection limit after 60 weeks of NUCs treatment, but only 23.9% of patients achieved HBeAg SR. Therefore, sustainable negativity of HBV DNA is not enough to use to predict the possibility of HBeAg SR. In patients who achieved HBeAg SR, there was a significant decrease in serum HBV RNA levels. The decrease in serum HBV RNA levels at week 12 after antiviral treatment was significantly better than the concurrent serum markers HBV DNA and HBsAg in predicting the HBeAg SR at week 60 of antiviral treatment. Therefore, compared with other indicators, the most valuable related factor for HBeAg SR is serum HBV RNA level, which is consistent with our research results (Huang et al., 2015). Another study found that in patients, negative HBV RNA at week 48- after antiviral treatment was associated with rapid HBeAg SR (Luo et al., 2019). There are also studies showing that an important factor influencing the decrease in HBV RNA is whether there is a rapid virological response (Liu et al., 2020). It can be speculated that when serum HBV DNA is completely suppressed and difficult to be detected by drugs, the change in serum HBV RNA levels can predict the HBeAg SR. The detection rate of serum HBV RNA in HBeAg-negative patients is lower than that in patients. The correlation between serum HBV RNA and other virological serum indicators is better in CHB patients, which may be due to the more active transcription activity of cccDNA in patients in our hypothesis.
A notable limitation of this study is the progressive loss of participants during follow-up, particularly beyond week 60. Specifically, the number of patients remaining at each time point decreased as follows: 68 at week 12, 32 at week 24, 31 at week 36, 25 at week 48, and 23 at week 60. This attrition likely contributed to the lack of significant differences in HBV RNA levels between the SR and NSR groups after week 36, as reduced sample size diminished statistical power. Additionally, lower HBV RNA levels in later phases and potential variability in medication adherence among remaining participants may have further obscured between-group differences. Although this limits the interpretation of long-term dynamics, the early predictive value of HBV RNA at week 12 remains robust and clinically relevant. Future studies with longer follow-up and strategies to improve retention are warranted. One more limitation of this study is that the number of patients receiving different treatments varied across the groups. The choice of antiviral regimen (ETV, TDF, or TAF) was based on clinical practice and patient-specific factors, which may have introduced selection bias. Although patients receiving TAF showed a significantly higher HBeAg seroconversion rate compared to those on ETV or TDF, the non-randomized design limits causal interpretation of these differences. Confounding factors, such as variations in baseline patient characteristics or physician preference, might have influenced both drug selection and treatment outcomes. Therefore, these findings should be interpreted with caution. We agree that a well-designed randomized controlled trial with head-to-head comparison of these antiviral agents is necessary to confirm the superior efficacy of TAF and to guide clinical decision-making.
Many CHB prevention and treatment guidelines regard the disappearance of serum HBsAg as the ideal therapeutic endpoint for clinical cure. Since the half-life of HBV cccDNA is less than two months, the entry of newly synthesized relaxed circular DNA (rcDNA) into the nucleus and its conversion into cccDNA are crucial for maintaining the cccDNA level within hepatocytes. Theoretically, long-term use of drugs ultimately depletes cccDNA, but CHB patients who receive long-term NUCs treatment still have a low consumption of HBsAg (Chinese Society of Infectious Diseases, Chinese Medical Association & Chinese Society of Hepatology, Chinese Medical Association, 2019; European Association for the Study of the Liver, 2017; Terrault et al., 2018). The serum HBsAg is mainly produced by the transcription of cccDNA. Current research suggests that integrated HBV DNA fragments can also be transcribed and translated to produce HBsAg (Larsson et al., 2015). Despite, some patients have the clearance or continuous silencing of cccDNA, their serum HBsAg may still be weakly positive due to the persistent low-level expression of HBsAg by integrated viral DNA fragments. Studies have shown that HBV RNA is completely transcribed from cccDNA within liver tissue and not affected by HBV DNA integrated into the human genome, thus accurately reflecting the activity of cccDNA within liver tissue (European Association for the Study of the Liver, 2017; Wang et al., 2017). Our results indicated a significant correlation between serum HBsAg and HBV RNA, and this correlation was more pronounced in the SR group, suggesting that, clinically, serum HBV RNA levels may be able to use as a surrogate for cccDNA, but this correlation weakened with antiviral treatment. After antiviral treatment, HBV DNA quickly became negative, but the decline in HBV RNA was slower in the later stages. This may be because the sum of serum HBV DNA and HBV RNA better reflects the active state of cccDNA within the liver tissue of CHB patients (Huang et al., 2018). The correlation between HBV DNA, HBV RNA and cccDNA still need further studies. The results also showed that the levels of HBV RNA progressively decreased after antiviral treatment, but the HBeAg SR rate of TAF treatment was significantly higher than ETV and TDF, indicating that TAF antiviral treatment is more beneficial for reducing serum HBV RNA levels and achieving HBeAg SR.
In summary, CHB patients should not stop antiviral therapy even if HBV DNA levels drop to undetectable levels while HBV RNA levels are still detectable after antiviral treatment. Antiviral therapy should not be discontinued until both HBV DNA and HBV RNA are negative. TAF antiviral therapy is more beneficial for reducing serum HBV RNA levels and achieving HBeAg SR. Serum HBV RNA can predict HBeAg SR, and HBV RNA may serve as a serum surrogate marker for liver tissue HBV cccDNA. Since this study is a prospective study with a short follow-up period, its results still require further validation through long-term studies with larger sample sizes.
Conclusions
Baseline HBV RNA levels in CHB patients exhibited a significantly positive correlation with HBV DNA and HBsAg levels, this correlation weakened after antiviral therapy. The serum HBV RNA level at the 12th week could serve as an early predictor for the SR of HBeAg in patients with CHB. Antiviral drug TAF showed a higher HBeAg SR rate in the treatment of CHB patients compared to ETV and TDF.