
Identification of mitochondrial-related genes to evaluate the immune infiltration and prognosis of lung adenocarcinoma
- Published
- Accepted
- Received
- Academic Editor
- Vladimir Uversky
- Subject Areas
- Biochemistry, Bioinformatics, Cell Biology, Immunology, Oncology
- Keywords
- Lung adenocarcinoma, Mitochondrial-related genes, Prognostic signature, Immune infiltration
- Copyright
- © 2025 Ge et al.
- Licence
- This is an open access article distributed under the terms of the Creative Commons Attribution License, which permits using, remixing, and building upon the work non-commercially, as long as it is properly attributed. For attribution, the original author(s), title, publication source (PeerJ) and either DOI or URL of the article must be cited.
- Cite this article
- 2025. Identification of mitochondrial-related genes to evaluate the immune infiltration and prognosis of lung adenocarcinoma. PeerJ 13:e20262 https://doi.org/10.7717/peerj.20262
Abstract
Background
Mitochondrial dysfunction critically impacts lung adenocarcinoma (LUAD) progression and tumor microenvironment (TME) remodeling, highlighting the urgent need to identify predictive biomarkers with clinical utility.
Methods
RNA-seq data sourced from The Cancer Genome Atlas (TCGA) and Gene Expression Omnibus (GEO) were analyzed to identify mitochondrial-related (MTR) genes associated with LUAD progression. A three-gene prognostic signature, consisting of SFXN1, CPS1, and MTFR2, was developed through univariate, Least Absolute Shrinkage and Selection Operator (LASSO), and multivariate Cox regression analyses. Functional enrichment, immune infiltration, and tumor mutation burden (TMB) analyses were performed to characterize the TME. Experimental studies were conducted in LUAD cell lines via siRNA-mediated knockdown, assessing mitochondrial dynamics, mitochondrial membrane potential (ΔΨm), reactive oxygen species (ROS) levels, and mitochondrial DNA (mtDNA) stability.
Results
The signature stratified patients into high-risk and low-risk groups with significant survival differences (TCGA: HR = 1.476, P < 0.001; GSE31210: P < 0.001; GSE30219: P = 0.001). High-risk patients exhibited features of immunosuppressive TME, including elevated tumor purity, higher TIDE scores, increased TMB, and immune checkpoint expression (CD274, CD276, PDCD1, RELT). Functional analyses revealed that siRNA-mediated knockdown of CPS1 triggered mitochondrial fission, as evidenced by ΔΨm↓/ROS↑. Conversely, SFXN1 knockdown induced mitochondrial fusion accompanied by hyperpolarization (ΔΨm↑/ROS↓). Notably, MTFR2 knockdown promoted mitochondrial fusion, contributing to ΔΨm↑/ROS↓. All three siRNA treatments compromised mtDNA integrity, with CPS1 knockdown uniquely inducing the release of cytosolic mtDNA.
Conclusion
This study has successfully established a mitochondrial-related prognostic signature that predicts survival outcomes and immune phenotypes of LUAD patients, providing a clinically relevant predictive tool and laying the foundation for developing mitochondrial-targeted therapeutic strategies.
Introduction
Lung adenocarcinoma (LUAD), the most prevalent histological subtype of lung cancer, is a significant global health concern, characterized by high incidence and mortality rates (Xia et al., 2022; Bray et al., 2024; Han et al., 2024; Siegel et al., 2025). The etiology of LUAD is multifactorial, involving environmental exposures and genetic susceptibility, with specific risk factors including cigarette smoking, hereditary predisposition, oncogenic virus infections, chronic alcohol consumption, and dietary patterns (Malhotra et al., 2016; Herbst, Morgensztern & Boshoff, 2018; Aredo et al., 2021; LoPiccolo et al., 2024). The majority of LUAD cases are detected at an advanced stage due to the subtle and nonspecific nature of early symptoms. Although advancements in targeted and immune therapy have enhanced the prognosis, LUAD remains a highly aggressive malignancy, with a five-year survival rate remaining at approximately 20% (Spella & Stathopoulos, 2021; Leiter, Veluswamy & Wisnivesky, 2023). These statistics underscore the urgent need to identify novel biomarkers for high-risk populations and to explore innovative therapeutic targets to enhance treatment efficacy and survival rates.
Mitochondria occupy a central position in maintaining cellular bioenergetics and redox homeostasis (Zong, Rabinowitz & White, 2016; Vasan, Werner & Chandel, 2020). Dysregulation of mitochondrial dynamics, particularly imbalances in fusion and fission, has emerged as critical drivers of tumorigenesis and development through promoting oncogenic signaling and metabolic reprogramming (Lennon & Salgia, 2014; Weiner-Gorzel & Murphy, 2021; Sharma et al., 2021; Li et al., 2022). Recent advances in mitochondrial-targeted therapeutics have revealed promising strategies to disrupt cancer cell bioenergetic plasticity, with dual benefits of enhancing chemotherapy sensitivity and synergizing with immune checkpoint inhibitors. Notably, preclinical studies have shown that mitochondrial-targeted compounds can modulate cancer cell energetics and recruit Natural Killer (NK) cells to tumor immune microenvironment (Li et al., 2023a).
Furthermore, single-cell RNA sequencing uncovered mitochondrial gene signatures could guide personalized therapy in LUAD (Zhang et al., 2024b).
Mitochondrial dysfunction has emerged as a critical determinant of immunotherapeutic resistance in LUAD, particularly affecting responses to immune checkpoint inhibitors. Tumor-infiltrating lymphocytes (TILs) within the immunosuppressive tumor microenvironment (TME) frequently exhibit impaired mitochondrial respiration and reduced oxidative phosphorylation capacity, a phenotype tightly associated with T cell exhaustion and impaired cytotoxic function (Yang et al., 2024). For example, PGC-1α is a key regulator of mitochondrial biogenesis, and its upregulation has been shown to enhance the fitness, memory formation, and anti-tumor immunity of CD8+ T cells (Malinee, Pandian & Sugiyama, 2022). Therefore, further research is warranted to elucidate the interaction between mitochondrial function and the immunotherapy for LUAD.
We have developed a novel prognostic model based on mitochondrial-related (MTR) biomarkers, MTFR2, SFXN1, and CPS1. This integrated risk stratification system demonstrates significant clinical utility in predicting overall survival and characterizing immune infiltration patterns in LUAD patients, as validated by comprehensive bioinformatics analyses and independent cohort validation. The MTR risk stratification model holds promise for personalized risk assessment and therapeutic decision-making in LUAD management.
Materials and Methods
Data collection
RNA-seq data and the clinical information of 550 LUAD samples (V36. 0, December 12, 2022) were downloaded from The Cancer Genome Atlas (https://portal.gdc.cancer.gov/), 14 samples were excluded due to incomplete clinical information or survival less than 30 days. In total, 536 samples, comprising 478 tumor samples and 58 healthy samples, were analyzed in the present study. Samples from two datasets, GSE31210 and GSE30219, were applied to validate the hub genes and risk score (https://www.ncbi.nlm.nih.gov/geo/). GSE31210 is annotated by GPL570 and includes 226 tumor samples and 20 healthy samples. GSE30219 is annotated by GPL570, comprising 293 tumor samples and 14 healthy samples. The list of mitochondrial related genes was collected from MitoCarta3.0 database (http://www.broadinstitute.org/mitocarta). The research flowchart was shown in Fig. 1.
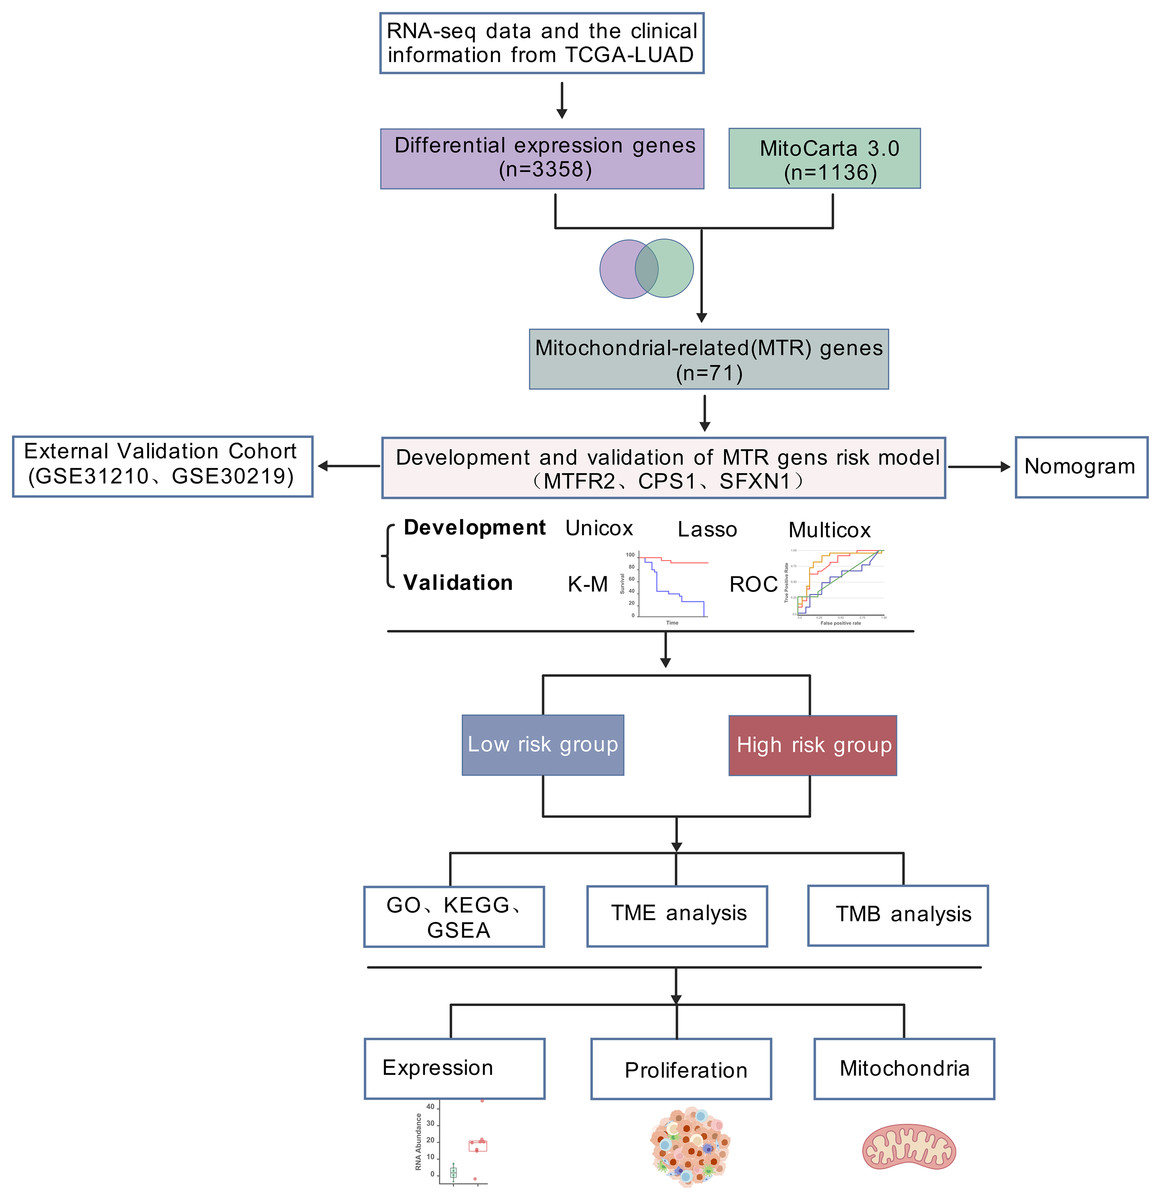
Figure 1: Analytical workflow.
Analytical workflow for mitochondrial-related prognostic model construction in LUAD.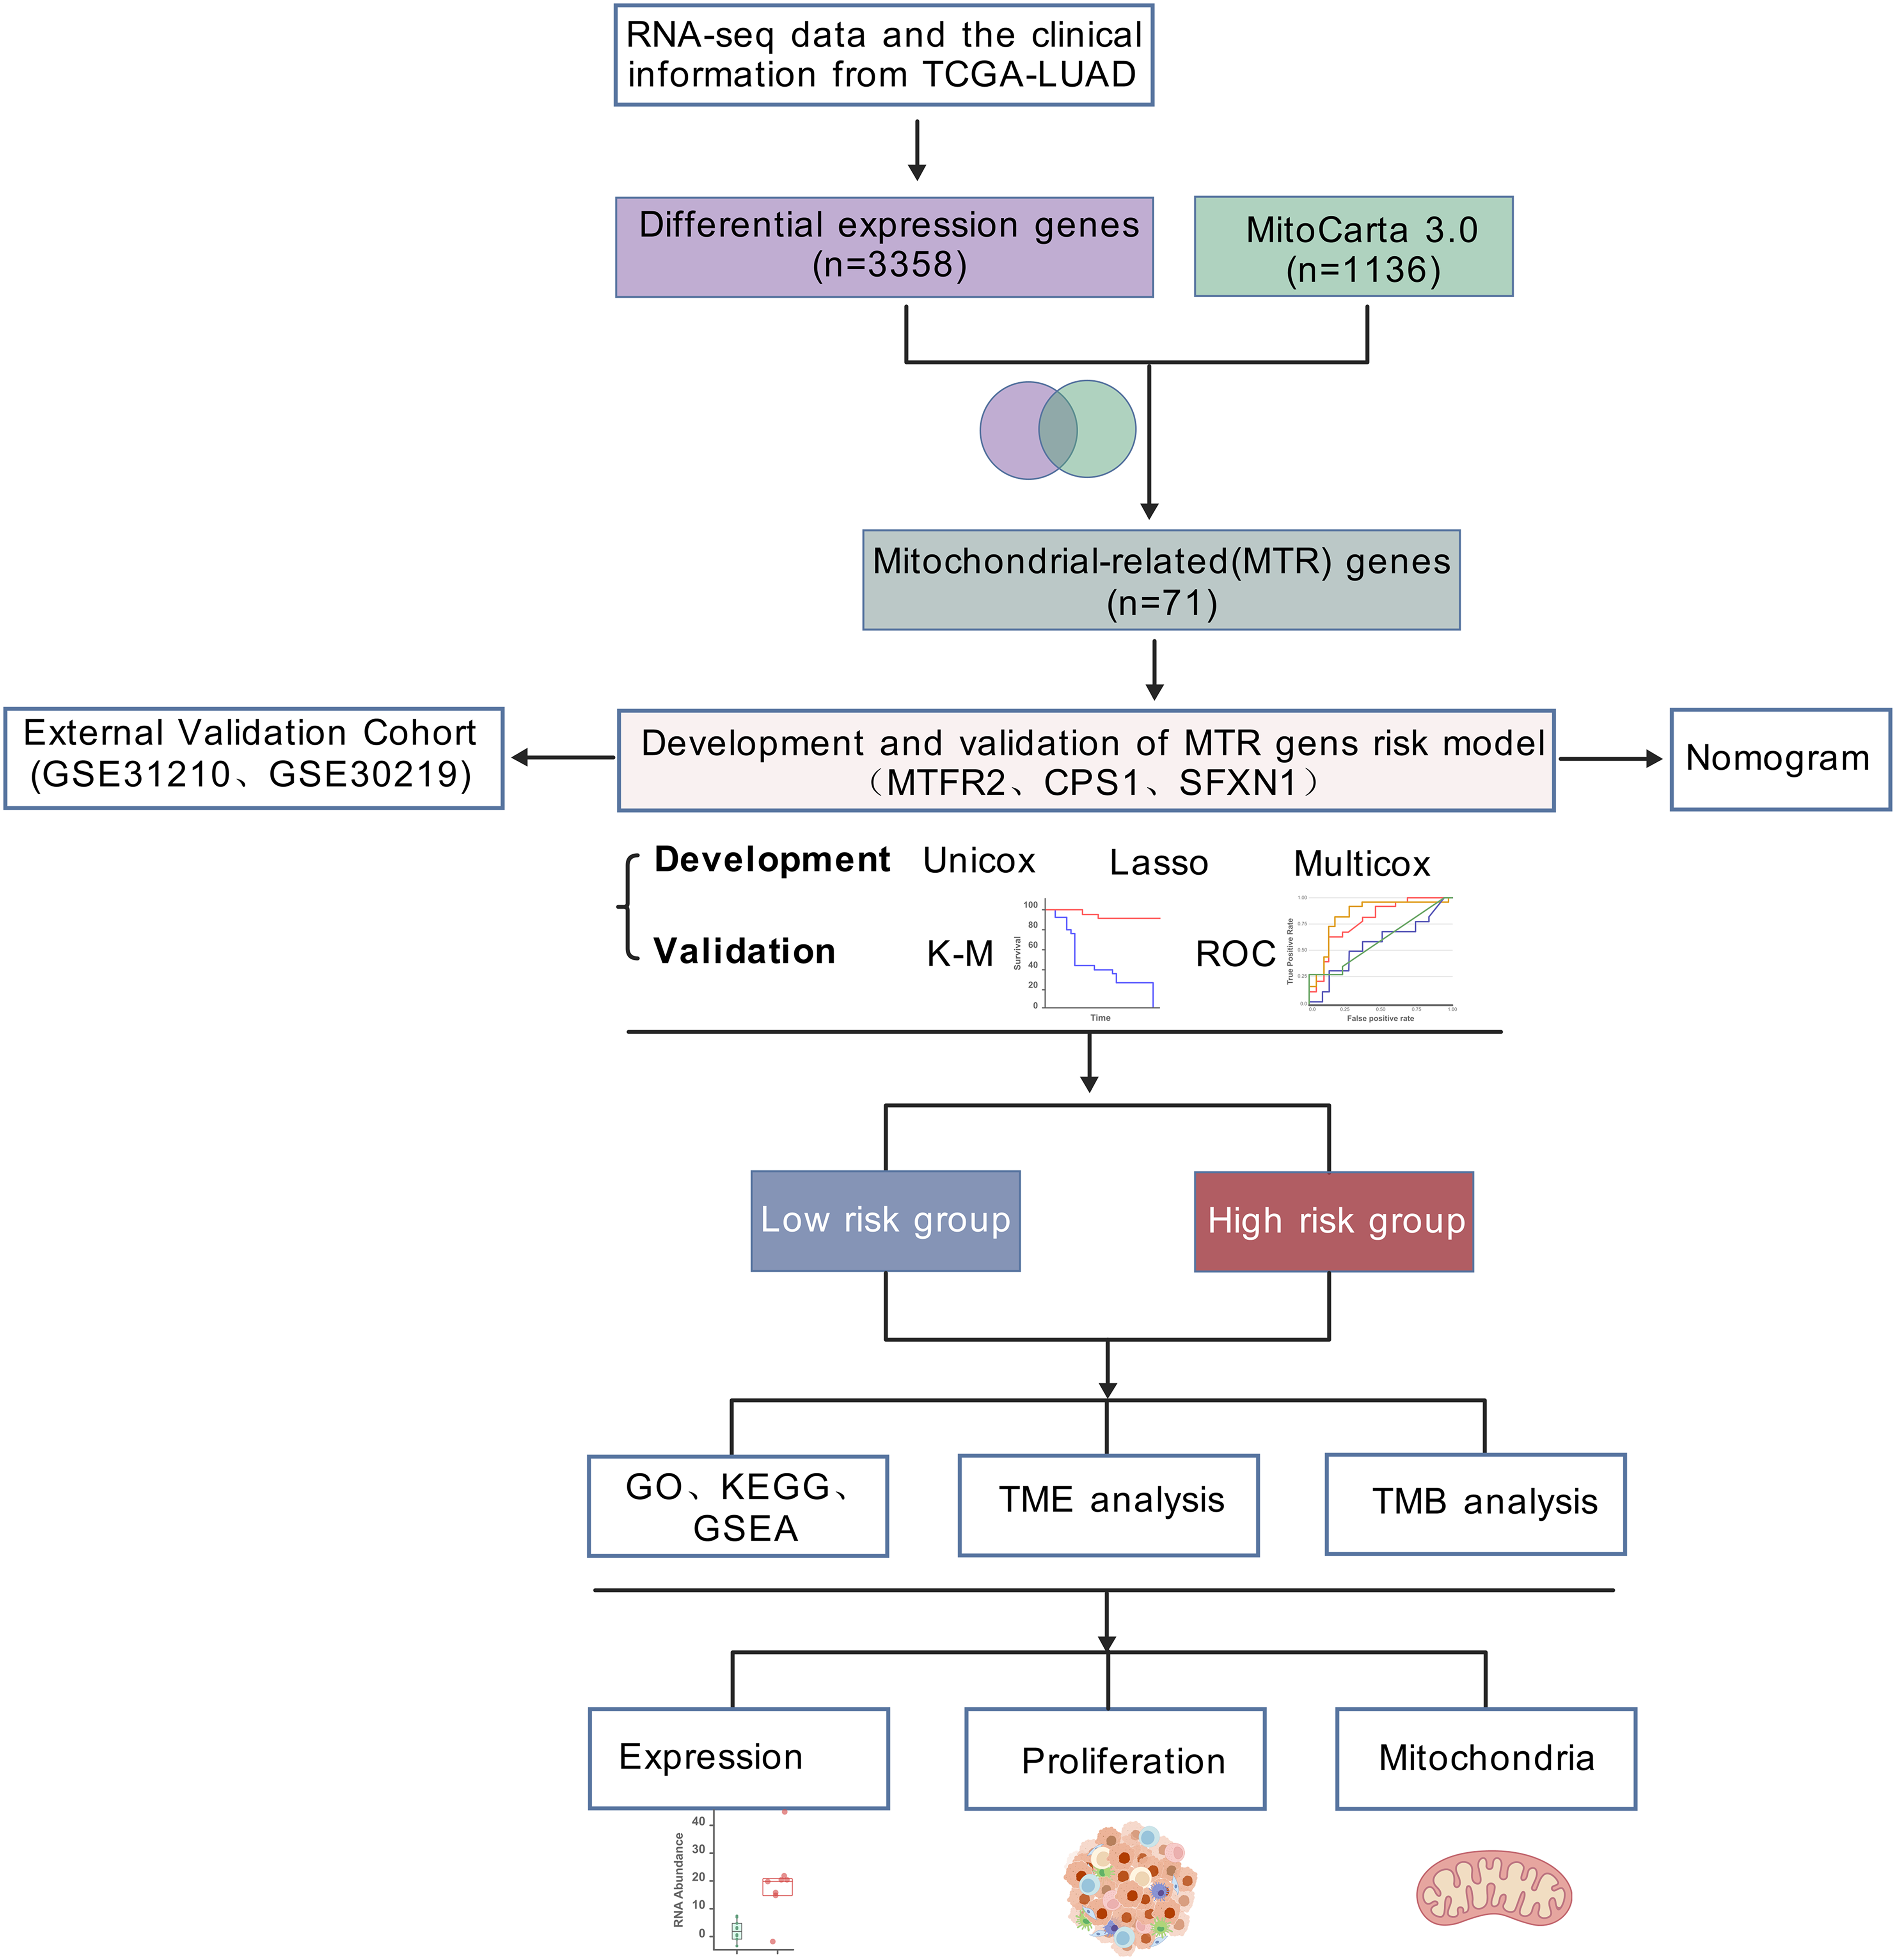
IHC images were retrieved from the Human Protein Atlas (HPA) database (https://www.proteinatlas.org/), a publicly available, peer-reviewed resource for comprehensive human protein expression data (Uhlén et al., 2015).
Differential expression genes analysis
To identify differentially expressed genes (DEGs), we utilized the “DESeq2” (version 1.47.3) package of R (version 4.3.3). Specifically, DEGs were screened under two comparison settings: (1) between normal and tumor samples, and (2) between high-risk and low-risk subgroups derived from the training set. DEGs were defined using the thresholds of |log2 fold change| > 1.5 and adjusted P-value < 0.01. For visualization of the identified DEGs, a volcano plot was generated with the assistance of R’s “ggpubr” (version 0.6.0) and “ggthemes” (version 5.1.0) packages. Additionally, to visualize the overlapping DEGs in both DEGs groups and mitochondrial-related genes, a Venn diagram was constructed using R’s “Ggplot2” (version 3.4.4) and “VennDiagram” (version 1.7.3) packages.
Development and validation of a prognostic mitochondrial-related set
The selection of Mitochondrial-Related (MTR) genes was accomplished through bioinformatics approaches in R, including univariate Cox regression, LASSO regression (Kang et al., 2021; Yi et al., 2022), and multivariate Cox regression. Specifically, the “survival” package (version 3.5.7) was employed to perform univariate and multivariate Cox proportional hazards regression analyses, the “glmnet” package (version 4.1.8) was used to implement Lasso regression for further variable screening to refine the MTR gene set, and the “forestplot” package (version 1.12.1) was utilized to visualize the results of the Cox regression for intuitive presentation of the associations between the selected MTR genes and survival outcomes. The risk score for each individual sample was ascertained. In the selected cohorts, participant samples were stratified into low-risk and high-risk categories utilizing the median risk score as the threshold. The determination of the optimal cutoff point and the generation of Kaplan-Meier (K-M) survival curves were facilitated by the R packages “survival” (version 3.5.7) and “survminer” (version 0.4.97). The predictive accuracy was quantified through the receiver operating characteristic (ROC) curve, risk stratification plot, and the concordance index (C-index). Comprehensive data regarding the prognostic genes were sourced from the Human Gene Database (https://www.genecards.org/), the Cancer Genome Atlas (https://portal.gdc.cancer.gov/) and the National Center for Biotechnology Information (NCBI, https://www.ncbi.nlm.nih.gov/).
Development and validation of a predictive nomogram
A comprehensive analysis was conducted to determine the risk score of clinical parameters such as age, gender, T stage, N stage, M stage, tumor stage. These variables were subjected to univariate Cox regression and multivariate Cox regression to refine the candidate predictors that exhibited a significant relationship with survival (P < 0.05). Utilizing these predictors, nomograms were developed, and corresponding scores were allocated for each variable within the nomogram framework. The aggregate score for each patient was derived by summing the individual scores of the included predictors. The performance of the nomogram model was evaluated using the calibration plots to assess its discriminative power and predictive accuracy. “Survival” and “rms” (version 6.7.0) packages in R were employed.
Analyses of Gene Ontology, Kyoto Encyclopedia of Genes and Genomes, Gene Set Enrichment Analyses
For gene set functional enrichment analysis, the Kyoto Encyclopedia of Genes and Genomes (KEGG) and the Gene Ontology (GO) annotations of genes from the R package “org.Hs.eg.db” (version 3.18.0) were used as the background. We mapped the genes to the background set and performed enrichment analysis using the R package “clusterProfiler” (version 4.10.1) to obtain the gene set enrichment results. For Gene Set Enrichment Analysis (GSEA), the GSEA 4.2.1 software was obtained from the GSEA website (http://software.broadinstitute.org/gsea/index.jsp) (Subramanian et al., 2005). Samples were divided into two groups according to risk levels. Following subsets were downloaded from Molecular Signatures Database (https://www.gsea-msigdb.org/gsea/index.jsp) (Liberzon et al., 2011), including c5.go.cc.v7.4.symbols.gmt, c2.cp.kegg.v7.4.symbols.gmt, c7.immunesigdb.v7.4.symbols.gmt, c7.all.v7.4.symbols.gmt, and c5.go.mf.v7.4.symbols.gmt. These subsets were used to assess related pathways and molecular mechanisms based on gene expression profiles and phenotype groupings. The minimum gene set size was set to 5 and the maximum to 5,000. One thousand re-samplings were performed. P < 0.05 and false discovery rates (FDR) < 0.1 were considered statistically significant.
Analyses of immune landscape in LUAD
TME was characterized by computing stromal scores, immune scores, ESTIMATE scores and tumor purity through R package “estimate” (version 1.0.13). Lists of TME-related biomarkers was extracted from Gene set enrichment analyses (GSEA, https://www.gsea-msigdb.org/gsea/index.jsp). Tumor immune dysfunction and exclusion (TIDE) acted as a vital biomarker for immunotherapy response. Additionally, we assessed whether there was any link between TIDE scores and risk scores.
Immune infiltration analysis
To better characterize the immune cell features in high-risk and low-risk populations, we employed gene expression profiles from microarray processed as previously described in Zhang et al. (2023). Based on these profiles, we applied the single-sample gene-set enrichment analysis (ssGSEA) algorithm to estimate the differential infiltration abundance of 28 distinct immune cell types between the two groups. Spearman correlation analysis was used to elucidate the relationship between risk stratification and immune cell distribution patterns.
The dataset of immune cell signature was retrieved from the Cibersort data (https://cibersortx.stanford.edu/). The relative frequencies of 22 distinct tumor-infiltrating immune cell (TIIC) subtypes were ascertained via the CIBERSORT algorithm. A Spearman test was applied to assess the differences in TIICs’ relative frequencies between high-risk and low-risk groups.
Tumor mutation burden and immune checkpoint gene differences analysis
The somatic mutation data were downloaded from TCGA GDC data portal 2.0 database (https://portal.gdc.cancer.gov/). The R package “maftools” (version 2.18.0) was then used to draw a waterfall plot to illustrate the mutation landscape in LUAD patients with the high- and low-risk group and calculate the TMB score for each sample. In addition, identifying the relationship between high and low risk scores and the expression levels of common immune checkpoints.
Cell culture and transfection
Human LUAD cell lines A549, PC9, and H1299, together with the normal human pulmonary epithelial cell line BEAS-2B, were sourced from the China Center for Type Culture Collection (CCTCC, Shanghai, China). All cell lines were authenticated using short tandem repeat (STR) profiling and confirmed to be free of mycoplasma contamination before experimentation. Cell maintenance was performed in RPMI 1,640 medium supplemented with 10% fetal bovine serum (FBS; Vazyme, Nanjing, China). Cultures were kept in a humidified incubator at 37 °C with a 5% CO2 atmosphere.
siRNA targeting specific genes were synthesized by Beijing Tsingke Biotechnology Co., Ltd. (see Table S1 for sequences). Transfection was performed using Lipo8000™ Transfection Reagent (Beyotime, Jiangsu, China) according to the manufacturer’s protocol. Lentivirus infection was screened with puromycin (1 μg/ml).
RNA extraction and quantitative real-time PCR
Total RNA was isolated from LUAD cells and BEAS-2B cells using an RNA extraction kit (Beyotime, Jiangsu, China). With 1 μg of total RNA as template, reverse transcription into complementary DNA (cDNA) was carried out using HiScript III RT SuperMix for qPCR (Vazyme, Nanjing, China). The synthesized cDNA was then amplified using the same qPCR SuperMix from Vazyme. For normalization of gene expression, β-actin served as the internal control. Relative RNA levels of the target genes were determined via the 2−ΔΔCT method. All experiments were run in triplicate, and primer sequences are provided in Table S2.
Flow cytometry
Cells were resuspended in pre-cooled Staining Buffer (Proteintech, Wuhan, China) and adjusted to 106 cells/mL. A 100 μL aliquot of the cell suspension was transferred to polypropylene tubes, followed by adding an appropriate volume of fluorochrome-labeled antibody to each tube; the cell-antibody mixture was then incubated for 30 min at room temperature in the dark. After incubation, cells were washed twice with Staining Buffer via centrifugation (1,200 rpm, 5 min at 4 °C). Fluorescence signals were detected using a Beckman CytoFLEX S flow cytometer, and subsequent data were analyzed and visualized using FlowJo software.
Mitotracker, TMRM, ROS and Hoechst staining
Cells were stained with Mitotracker (Invitrogen, Waltham, MA, USA), Tetramethylrhodamine (TMRM) (Thermo Fisher Scientific, Waltham, MA, USA), ROS (Beyotime, Jiangsu, China) and Hoechst 33342 (Yeasen, Shanghai, China) yielding a final concentration of 200 nM for 30 min, 100 nM for 30 min, 10 µM for 20 min, 0.5 µg/mL for 10 min before live cell imaging or flow cytometry respectively. The cells were then collected and washed with PBS three times, followed by FACS or fluorescence microscope analysis. Fluorescence in live cells was captured by confocal microscopy or plotted using the FlowJo software. Perform at least three biological replicates for each condition.
mtDNA localization
Cells were stained with Mitotracker (Invitrogen, Waltham, MA, USA), PicoGreen (Yeasen, Shanghai, China), and Hoechst 33342 (Yeasen, Shanghai, China) at final concentrations of 200 nM for 30 min, 3 µL/mL for 1 h, and 0.5 µg/mL for 10 min, respectively. Wash with PBS three times and then analyze with confocal microscopy. Perform at least three biological replicates in each case.
Quantitative PCR and mtDNA copy number analysis
Extract DNA components from cytoplasm using a DNA extraction kit, and detect the expression levels of mtDNA markers ND1 using qPCR; Use TERT as internal reference. The primer sequences are listed in Table S2.
Statistical analysis
All statistical analyses were performed utilizing R statistical software (version 4.3.3; R Foundation for Statistical Computing) and GraphPad Prism 8 (GraphPad Software Inc., San Diego, CA, USA). Continuous variables with normal distribution were compared between groups using Student’s independent t-test, while categorical variables were analyzed through Pearson’s chi-square test. Nonparametric Spearman’s rank correlation coefficient was employed to assess bivariate associations between continuous variables. Survival outcomes were evaluated through Kaplan-Meier methodology with log-rank testing for univariate analysis, followed by multivariable Cox proportional hazards regression modeling to adjust for potential confounding factors. All statistical tests were conducted using two-tailed comparisons, with a probability threshold of P < 0.05 defining statistical significance.
Results
Analytical workflow for mitochondrial-related prognostic model construction in LUAD
The general workflow employed in this study was illustrated in Fig. 1. Our workflow began with processing RNA-seq data from the TCGA-LUAD cohort (n = 550), and identifying 3,358 differentially expressed genes (DEGs) with statistical significance. By intersecting these DEGs with mitochondrial genes in MitoCarta 3.0 (n = 1,136), 71 mitochondrial-associated DEGs were obtained. Next, we developed a prognostic signature using univariate Cox, LASSO regression, and multivariate Cox analyses. Subsequently, we constructed a clinical nomogram integrating the risk score and clinicopathological factors. Model validation was performed via survival analysis, ROC curves, and external GEO datasets (GSE31210 and GSE30219). Functional enrichment and TME analyses were conducted in risk-stratified subgroups. Finally, mitochondrial functions of identified biomarkers were experimentally validated.
Development of a mitochondrial-related risk model in LUAD
Through rigorous quality control of TCGA-derived LUAD cohorts (n = 550), we established an analytical cohort comprising 478 tumor samples and 58 adjacent normal tissues with complete clinical annotations and minimum 30-day survival data. Systematic differential expression analysis (|log2FC| > 1.5, adj. P < 0.01) identified 3,358 protein-coding DEGs, including 2,214 upregulated and 1,134 downregulated transcripts in LUAD vs normal controls (Fig. 2A). Bioinformatic integration with 1,136 mitochondrial genes from MitoCarta3.0 database revealed 71 putative mitochondrial-associated DEGs in LUAD (Fig. 2B). Univariate Cox proportional hazards regression (P < 0.01 threshold) identified 14 DEGs with prognostic significance for overall survival (OS) (Fig. 2C). Subsequent LASSO regression and multivariate Cox analysis refined the prognostic signature to three core mitochondrial-related (MTR) genes: SFXN1, CPS1, and MTFR2 (Figs. 2D–2F, Table 1).
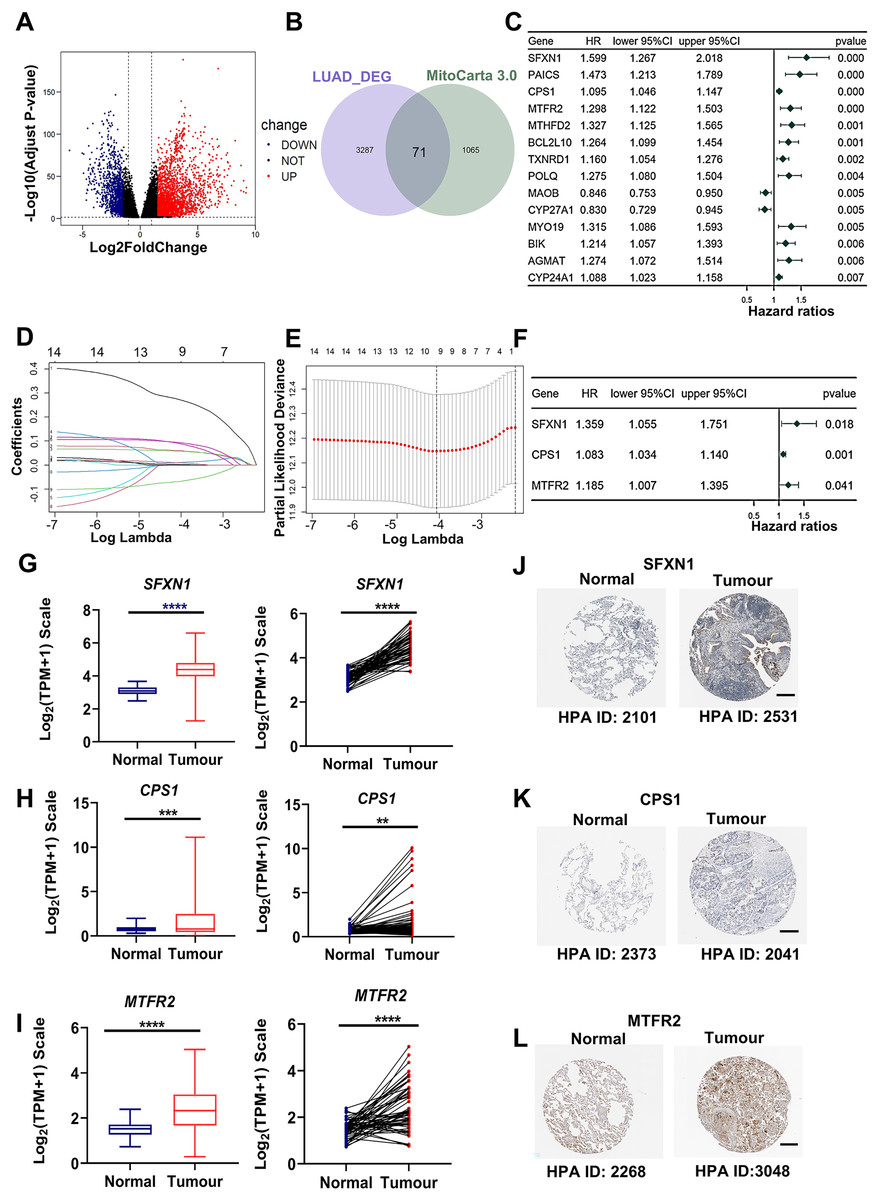
Figure 2: Development of a mitochondria-related (MTR) risk model in LUAD.
(A) Volcano plot depicting 3,358 differentially expressed genes (DEGs) in LUAD (red: upregulated; blue: downregulated; black: non-significant). Dashed lines indicate |log2FC| > 1.5 and adj. P < 0.01 thresholds. (B) Venn diagram illustrating intersection between LUAD-associated DEGs and mitochondrial-related genes (MTRs). (C) Forest plot of 14 candidate MTR-DEGs with significant prognostic value (univariate Cox regression, P < 0.01). (D–F) LASSO coefficient profiles (D), cross-validation curve for optimal λ selection (E), and multivariate Cox regression coefficients (F) for final model construction. (G–I) mRNA expression validation of SFXN1 (G), CPS1 (H), and MTFR2 (I) in TCGA LUAD vs. normal tissues. (J–L) Representative immunohistochemistry images from HPA database showing protein expression patterns in paired LUAD and normal tissues. For specific sources, please refer to the Materials & Methods: Data Collection section. Scale bars: 200 μm. **P < 0.01, ***P < 0.001, ****P < 0.0001.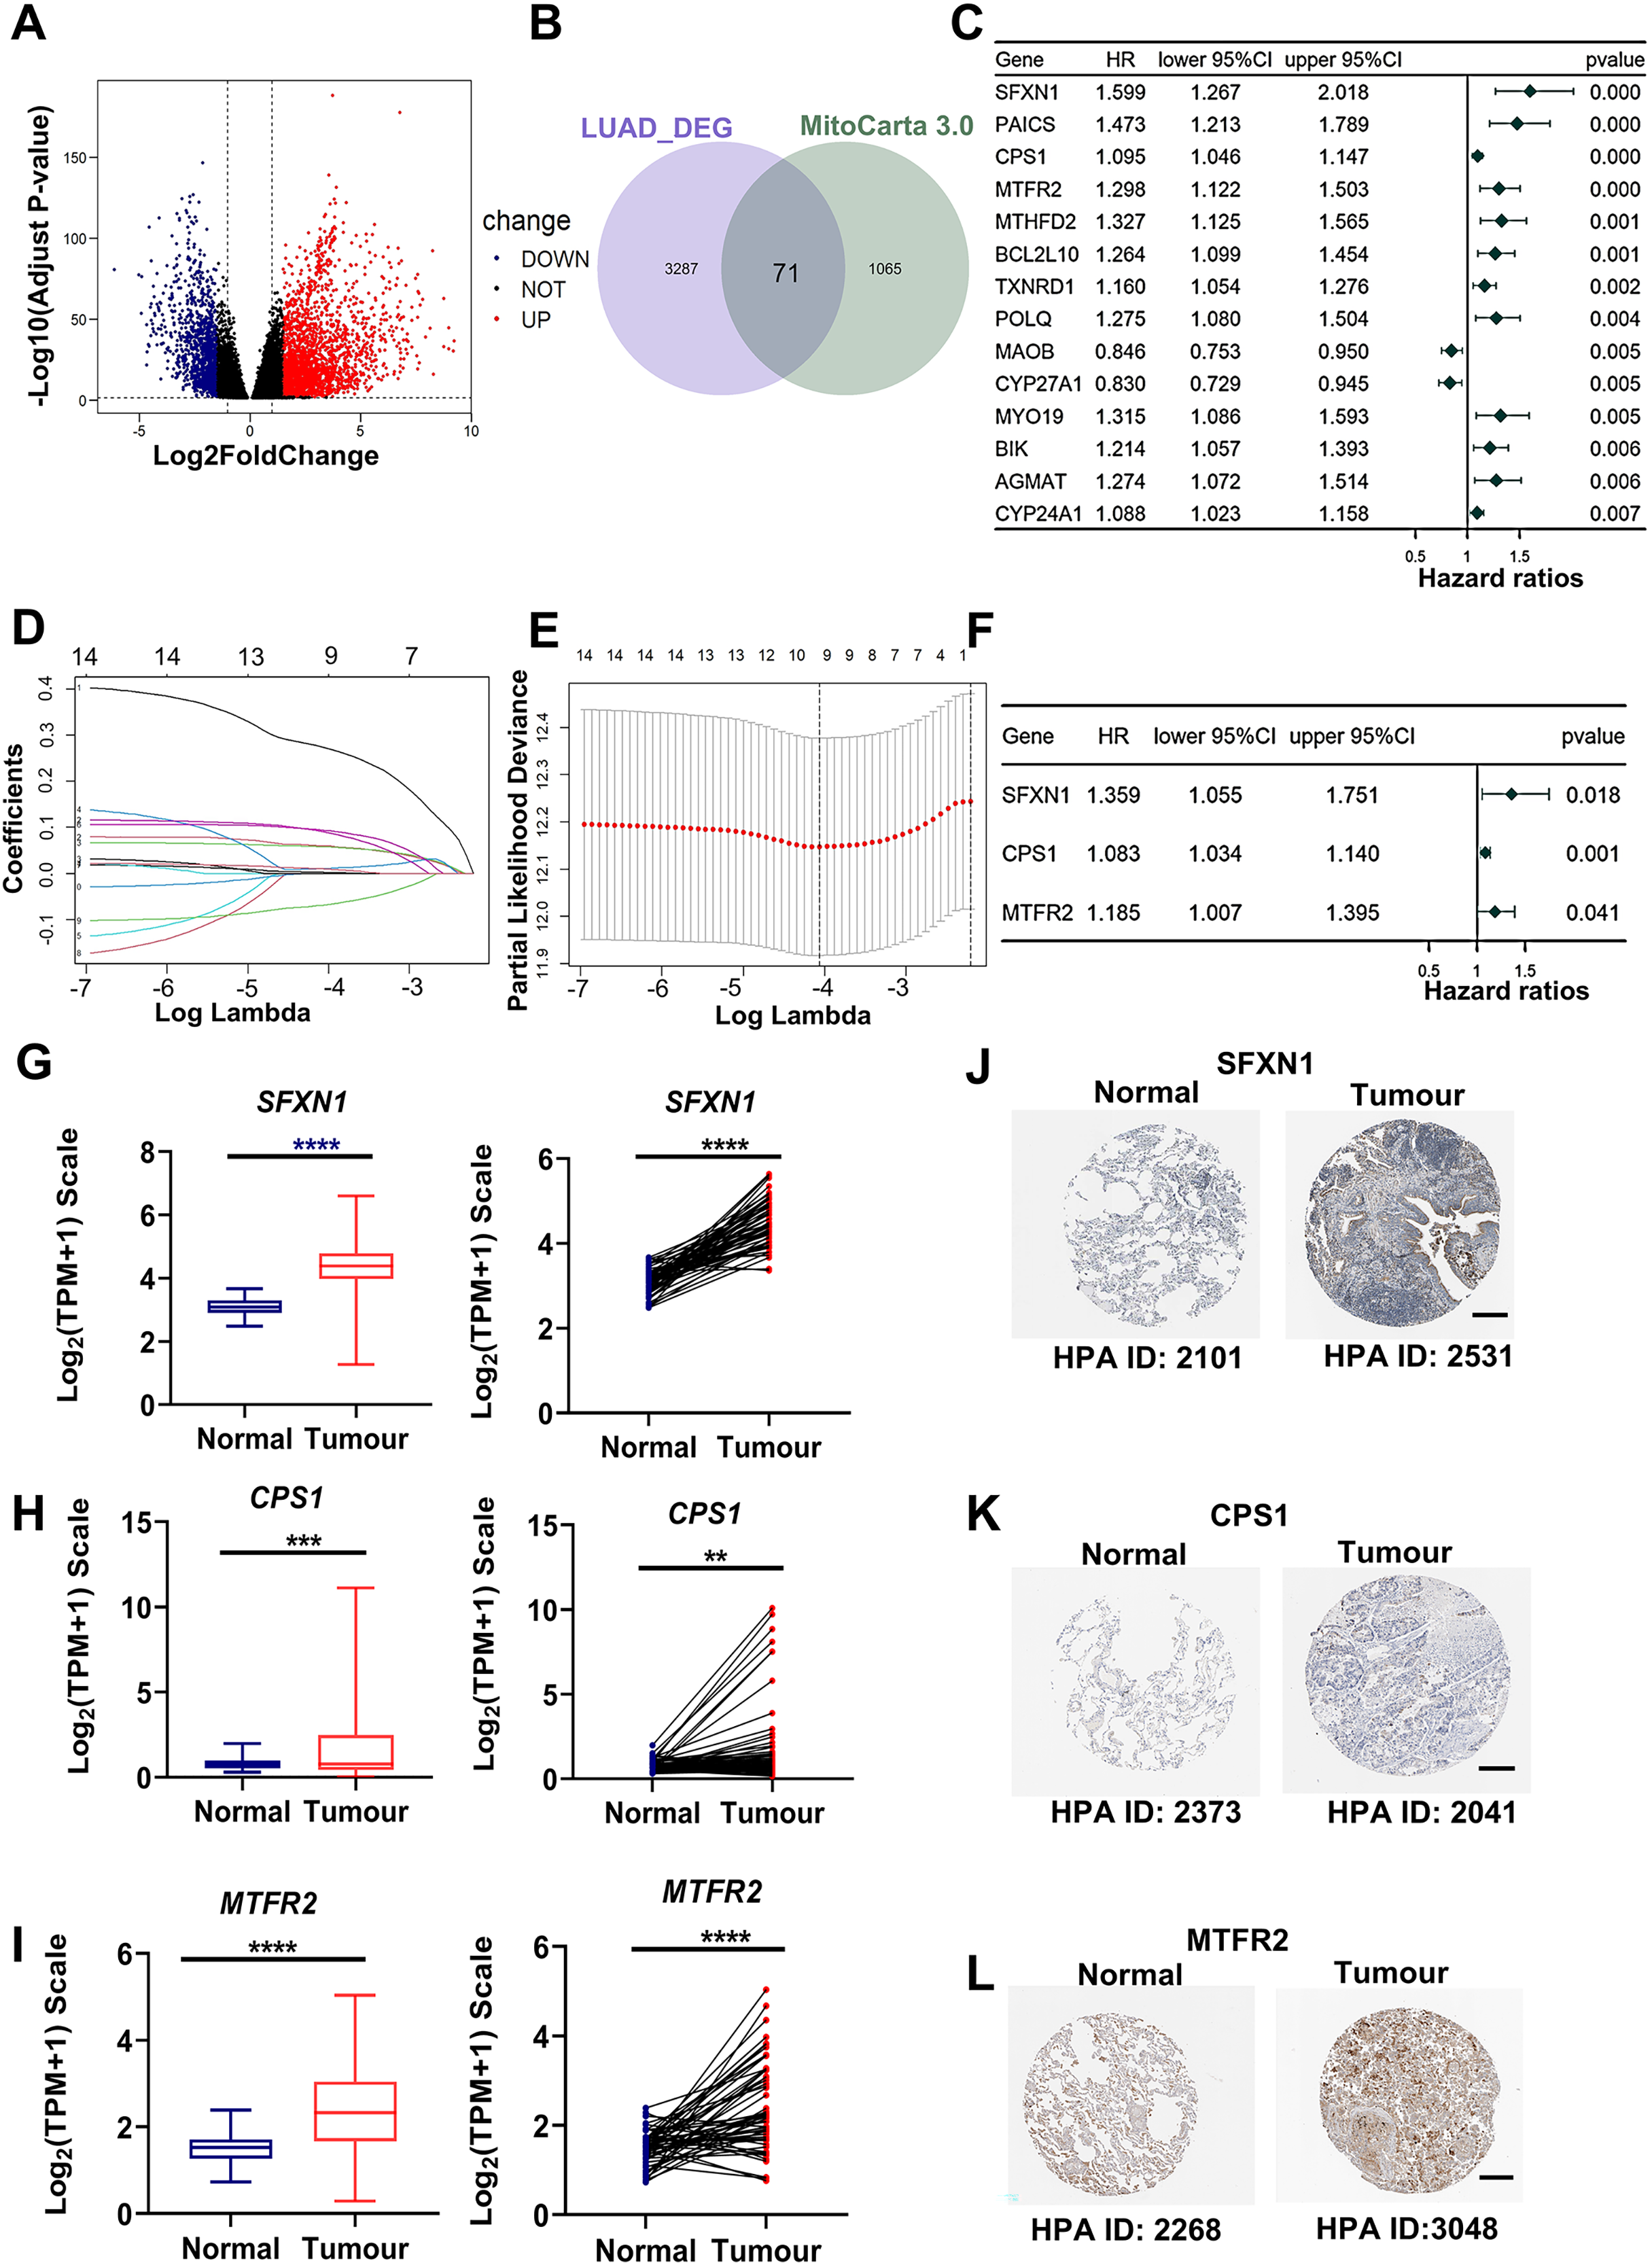
| Gene symbol | Gene ID | Full name | Mitochondrial location | Function |
|---|---|---|---|---|
| CPS1 | 1,373 | Carbamoyl-phosphate synthase 1 | Mitochondrial matrix | This mitochondrial enzyme catalyzes ammonia carbamoylation, initiating the urea cycle for nitrogen homeostasis. Structurally, it may constitute a core nucleoid component. Three splice variants encode isoforms with differential mitochondrial targeting, where truncation impairs localization. Clinically, mutations correlate with severe neonatal hyperammonemia and transplant-related veno-occlusive complications. |
| MTFR2 | 113,115 | Mitochondrial fission regulator 2 | Mitochondrial membrane | Predicted to be involved in aerobic respiration and mitochondrial fission. |
| SFXN1 | 94,081 | Sideroflexin 1 | Mitochondrial inner membrane | Enables L-alanine transmembrane transporter activity and L-serine transmembrane transporter activity. Involved in L-alanine transport; L-serine transport; and serine import into mitochondrion. |
Transcriptomic analysis confirmed elevated mRNA levels of SFXN1, CPS1, and MTFR2 in LUAD (Figs. 2G–2I). Immunohistochemical analysis based on HPA datasets revealed concordant protein overexpression patterns in LUAD specimens compared to adjacent normal controls (Figs. 2J–2L). Kaplan-Meier survival curves with log-rank testing demonstrated significantly reduced OS in LUAD patients with higher MTFR2 (log-rank P < 0.001), or with higher SFXN1 (log-rank P = 0.005) (Figs. S1A, S1B). Furthermore, although the traditional median cutoff failed to demonstrate the prognostic value of CPS1 (log-rank P = 0.294), patients with CPS1 expression in the top 20% had significantly shorter overall survival than those in the bottom 20% (log-rank P = 0.018). Additionally, we used X-tile (3.6.1) software to objectively determine the optimal cutoff value for CPS1 expression (CPS1 = 7.33) to stratify patients into high and low expression groups, and the log-rank test showed a P value of less than 0.001 (Figs. S1C–S1E).
Patients were stratified into high-risk and low-risk subgroups based on the median risk score, which in both training and validation cohorts was computed based on the following formula:
Figs. 3A–3D presents an integrated visualization of clinical-molecular correlations, featuring: (a) risk score distribution, (b) survival status/time alignment, (c) risk stratification patterns, and (d) heatmap of the three-gene expression profile. Kaplan-Meier analysis confirmed significantly shorter OS in high-risk patients (log-rank P < 0.001; Fig. 3E). Time-dependent ROC analysis demonstrated robust accuracy for 1-year (AUC = 0.712), 3-year (AUC = 0.647), and 5-year (AUC = 0.615) survival prediction (Fig. 3F). External validation in GSE31210 and GSE30219 cohorts consistently supported the prognostic stratification (P < 0.001, P = 0.001; Figs. S3A–S3E). The model maintained predictive performance in validation sets, with GSE31210 showing AUCs of 0.652 (1-year), 0.600 (3-year), and 0.725 (5-year) (Fig. S2F), and GSE30219 achieving AUCs of 0.827 (1-year), 0.755 (3-year), and 0.784 (5-year) (Fig. S3F). These multi-cohort validations confirm the clinical generalizability of our MTR risk stratification framework.
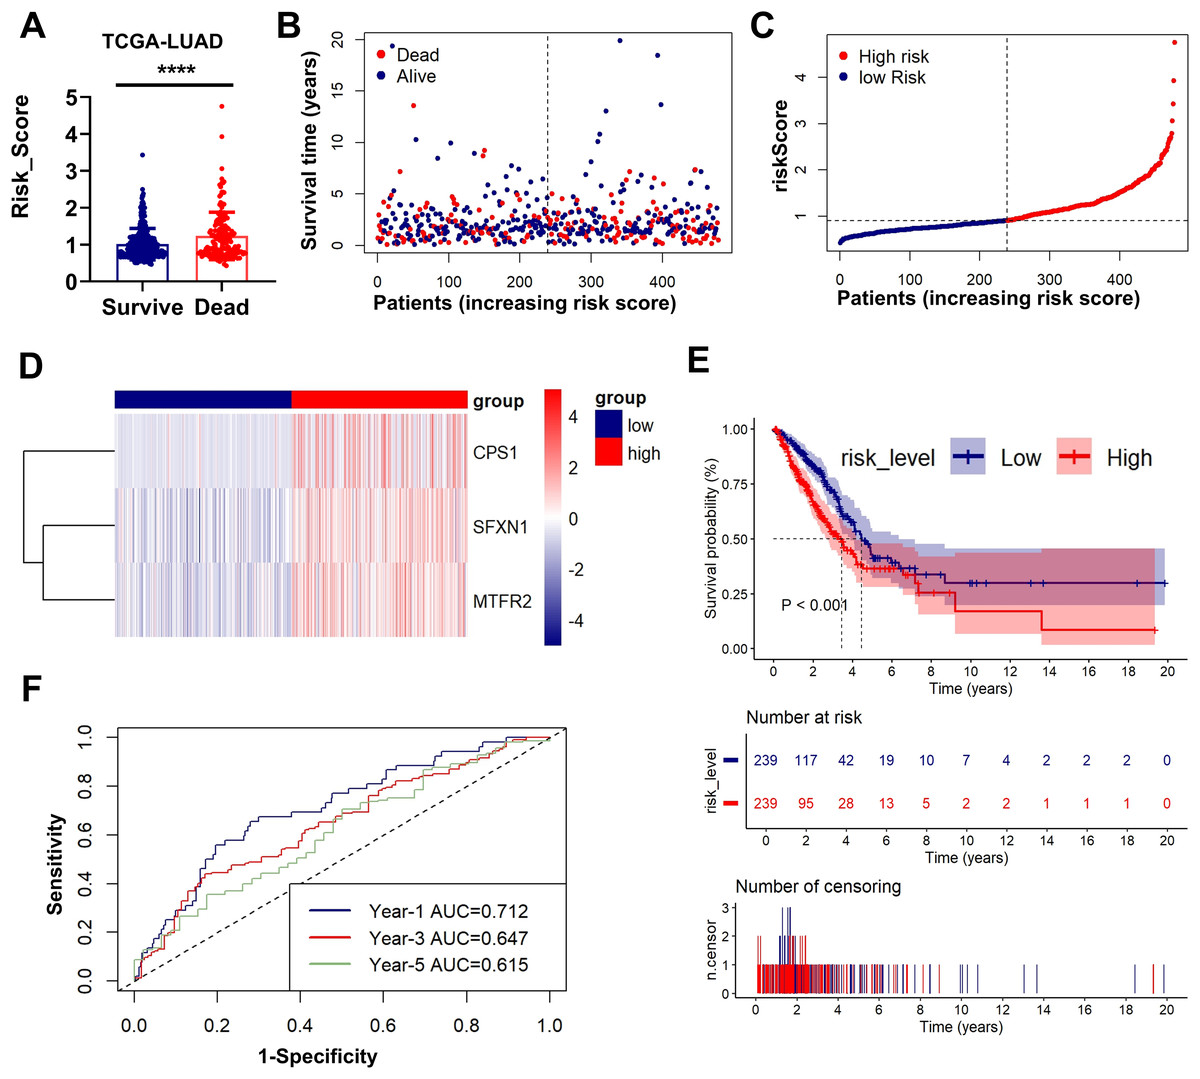
Figure 3: Prognostic performance and external validation of the risk stratification model.
(A) The bar chart compares the risk scores of patients with different prognostic outcomes. (B) Survival status/time matrix. (C) Risk score distribution ordered by prognostic value. (D) Three-gene expression heatmap. Dashed line indicates median risk cutoff. (E) Kaplan-Meier curves comparing OS between risk subgroups (log-rank P < 0.001). (F) Time-dependent ROC curves with AUC values at 1-/3-/5-year intervals. **P < 0.01, ****P < 0.0001.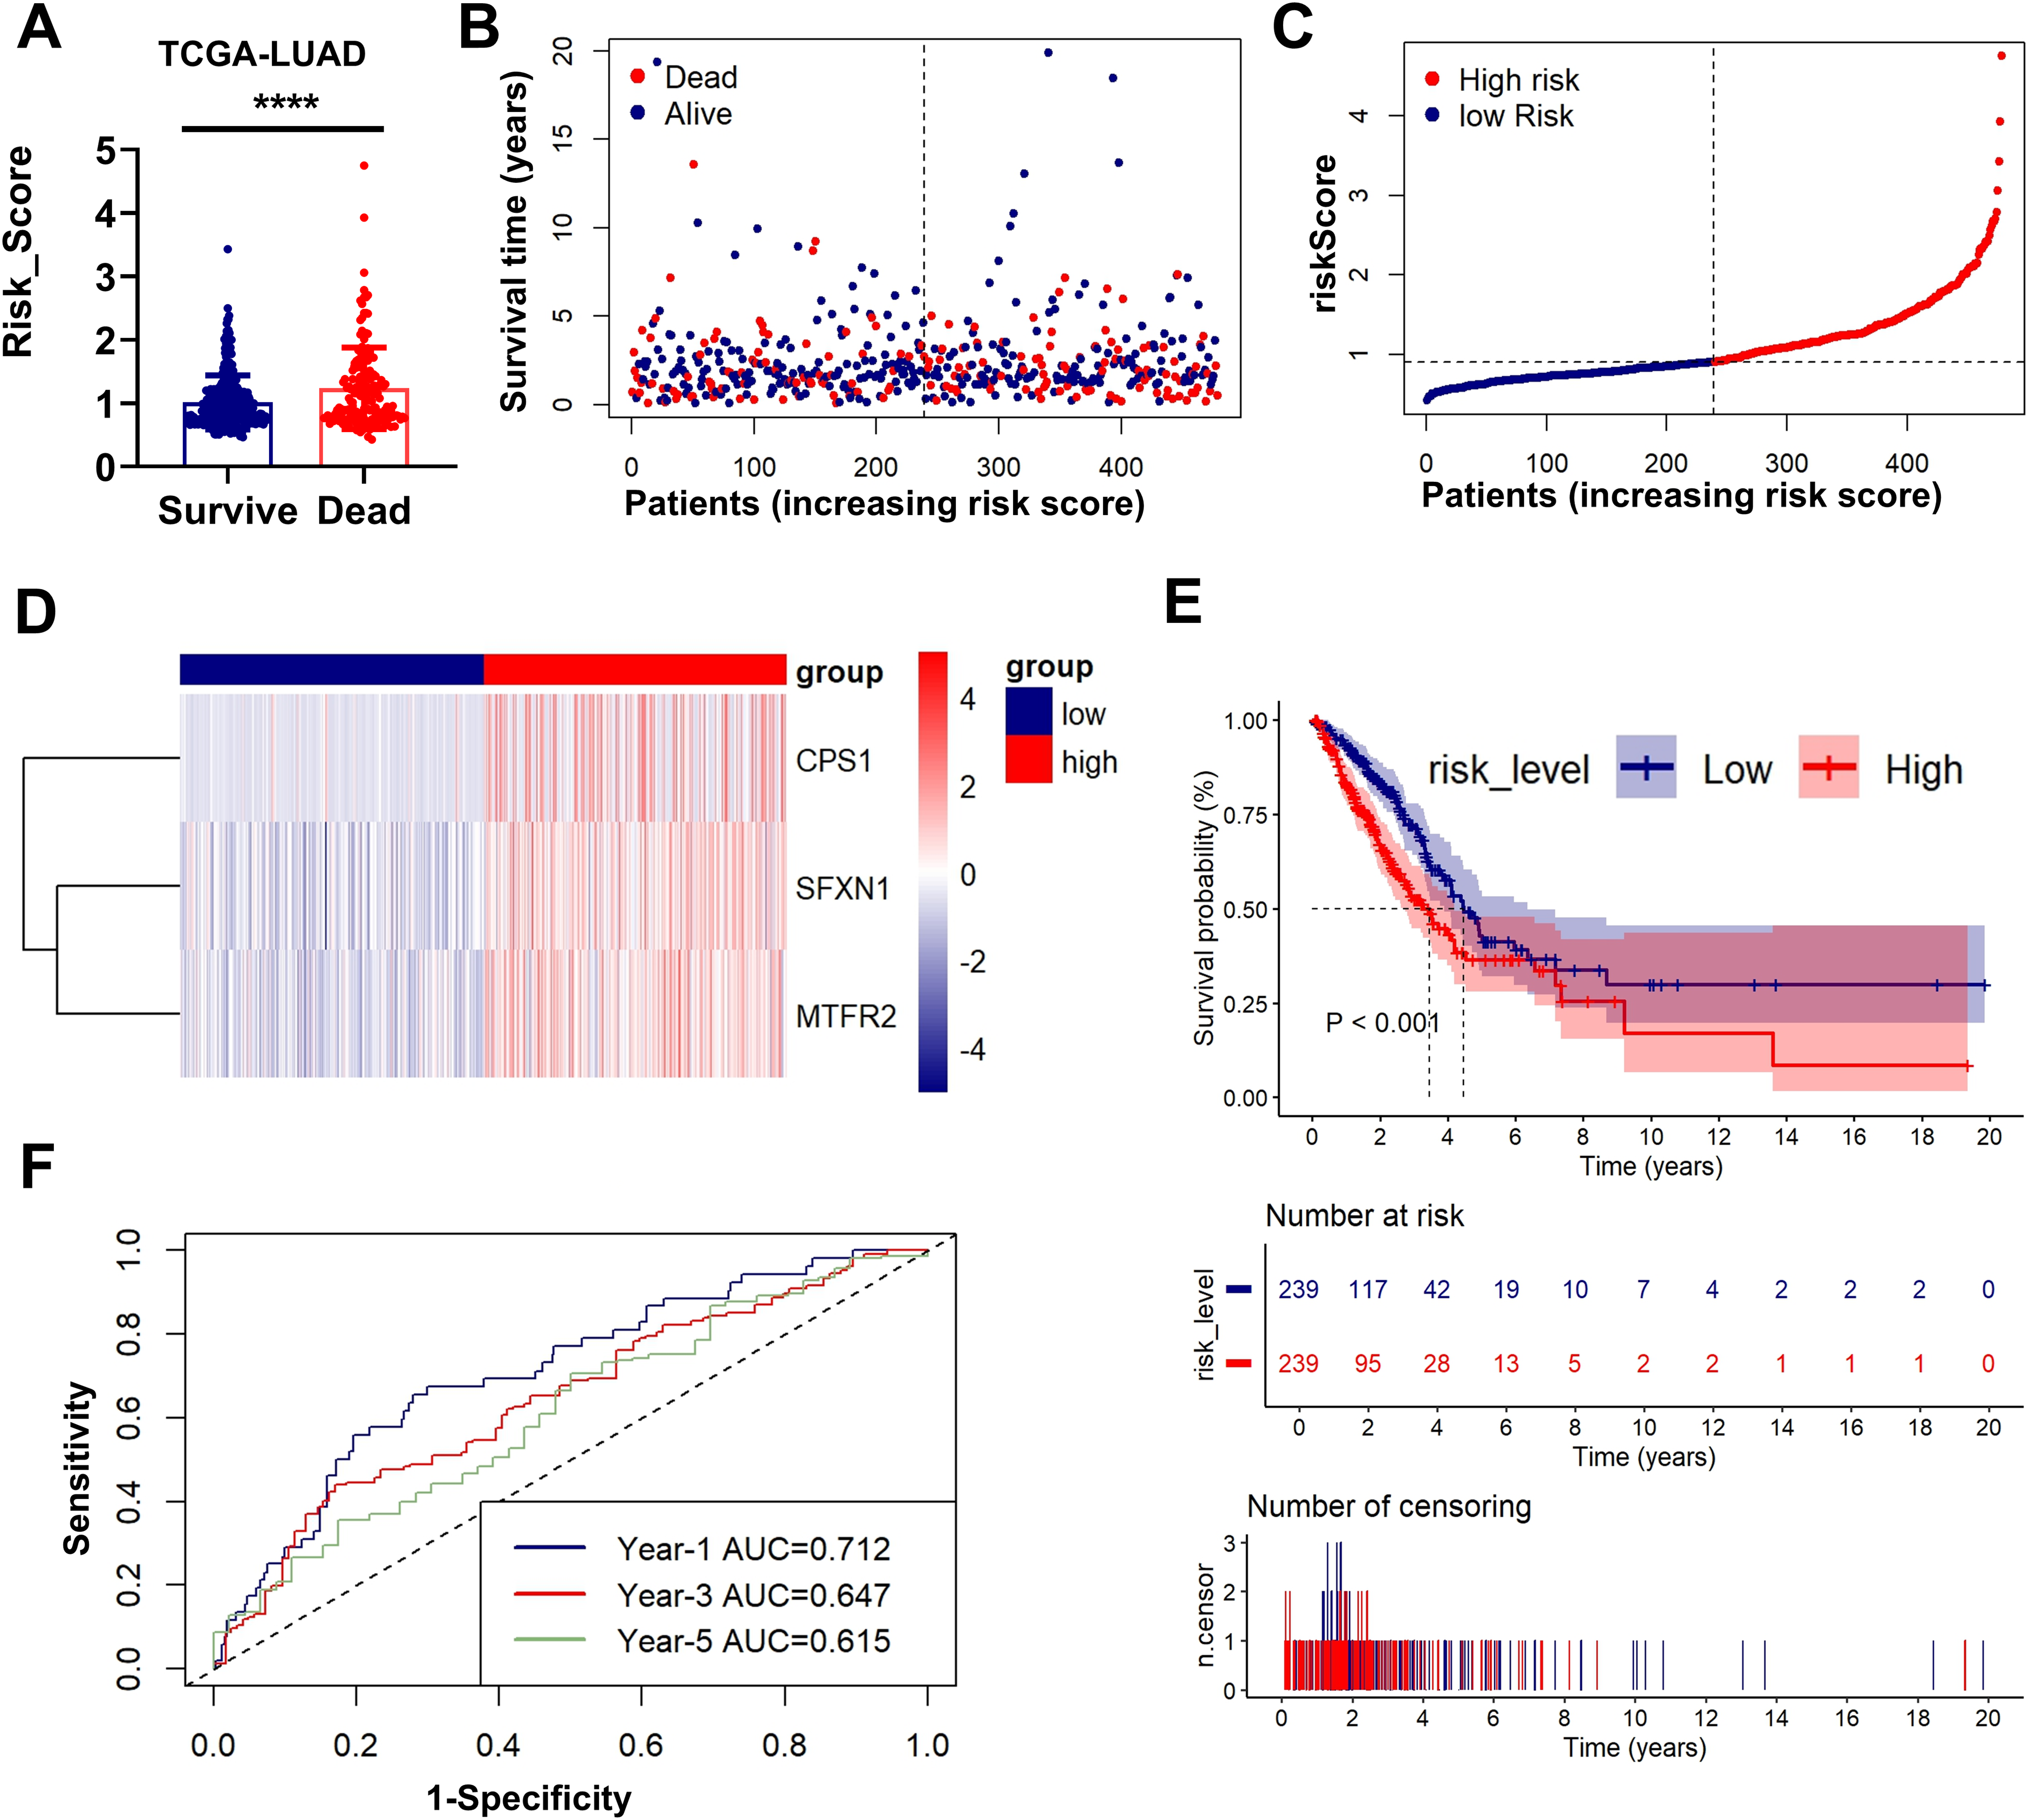
Clinical correlation and prognostic nomogram development
Clinical correlation analysis revealed significant relationships between risk scores and key demographic-clinical parameters, which were visualized using circular visualization and bar charts (Fig. 4A, Figs. S4A–S4F, Table 2). Male patients exhibited higher risk scores than females (Mann-Whitney P < 0.001), and advanced-stage (III–IV) tumors were markedly enriched in the high-risk subgroup ( P < 0.001). However, no significant age-dependent risk stratification was observed (P = 0.734). Univariable and multivariable Cox regression adjusted for TNM stage, age, and gender confirmed the risk score as an independent prognostic indicator (HR = 1.476, 95% CI [1.088–2.002]; P = 0.0123), outperforming conventional clinical parameters (Fig. S4J, Fig. 4B, Tables 3, 4). We developed an innovative prognostic nomogram integrating the MTR risk signature with clinicopathological variables, demonstrating strong concordance between predicted and observed survival probabilities at 1-, 3-, and 5-year intervals (Figs. 4C, 4D). The model achieved a C-index of 0.680 (95% CI [0.656–0.703]), signifying robust clinical applicability.
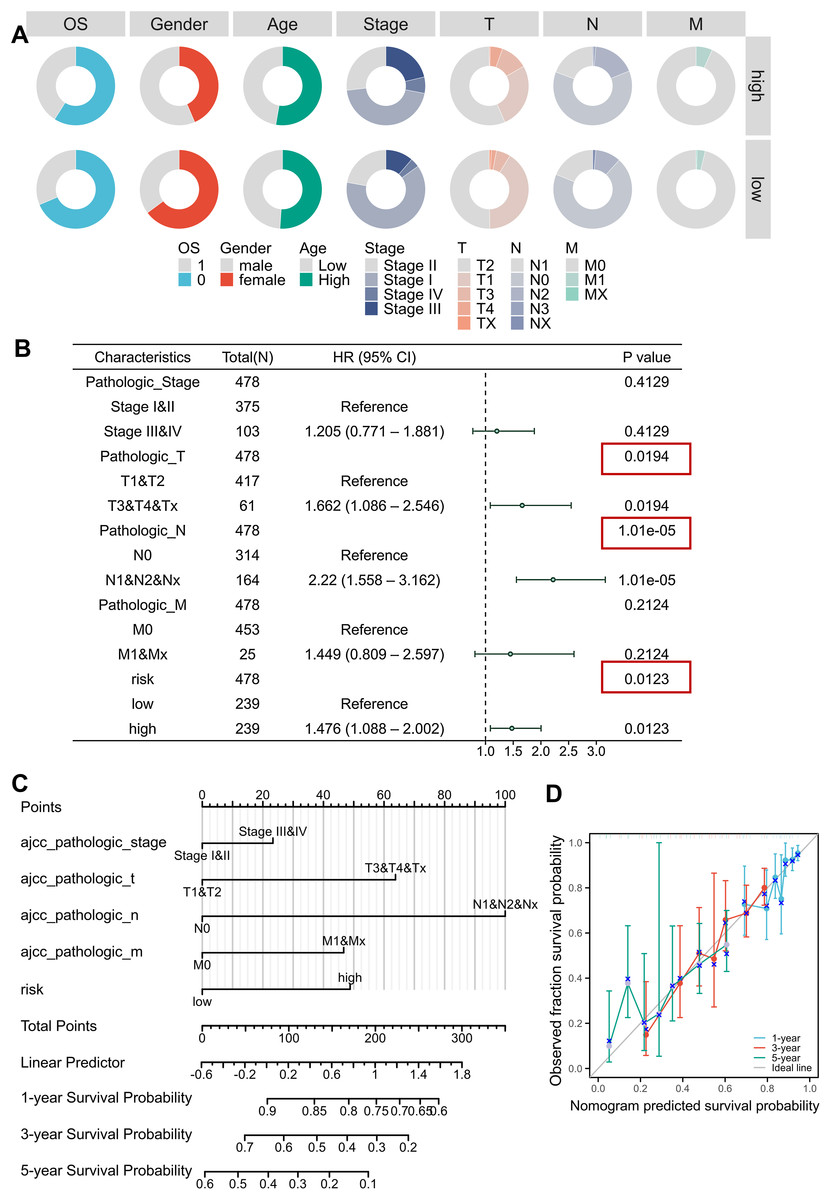
Figure 4: Clinical correlation and prognostic nomogram development.
(A) Circular visualization of baseline characteristics stratified by risk subgroups. (B) Forest plots from multivariate Cox regression analyses. Red boxes highlight risk score significance. (C, D) Prognostic nomogram integrating mitochondrial risk score (MRS) with clinical parameters. Calibration curves (inset) show predicted vs observed 1-/3-/5-year survival probability concordance.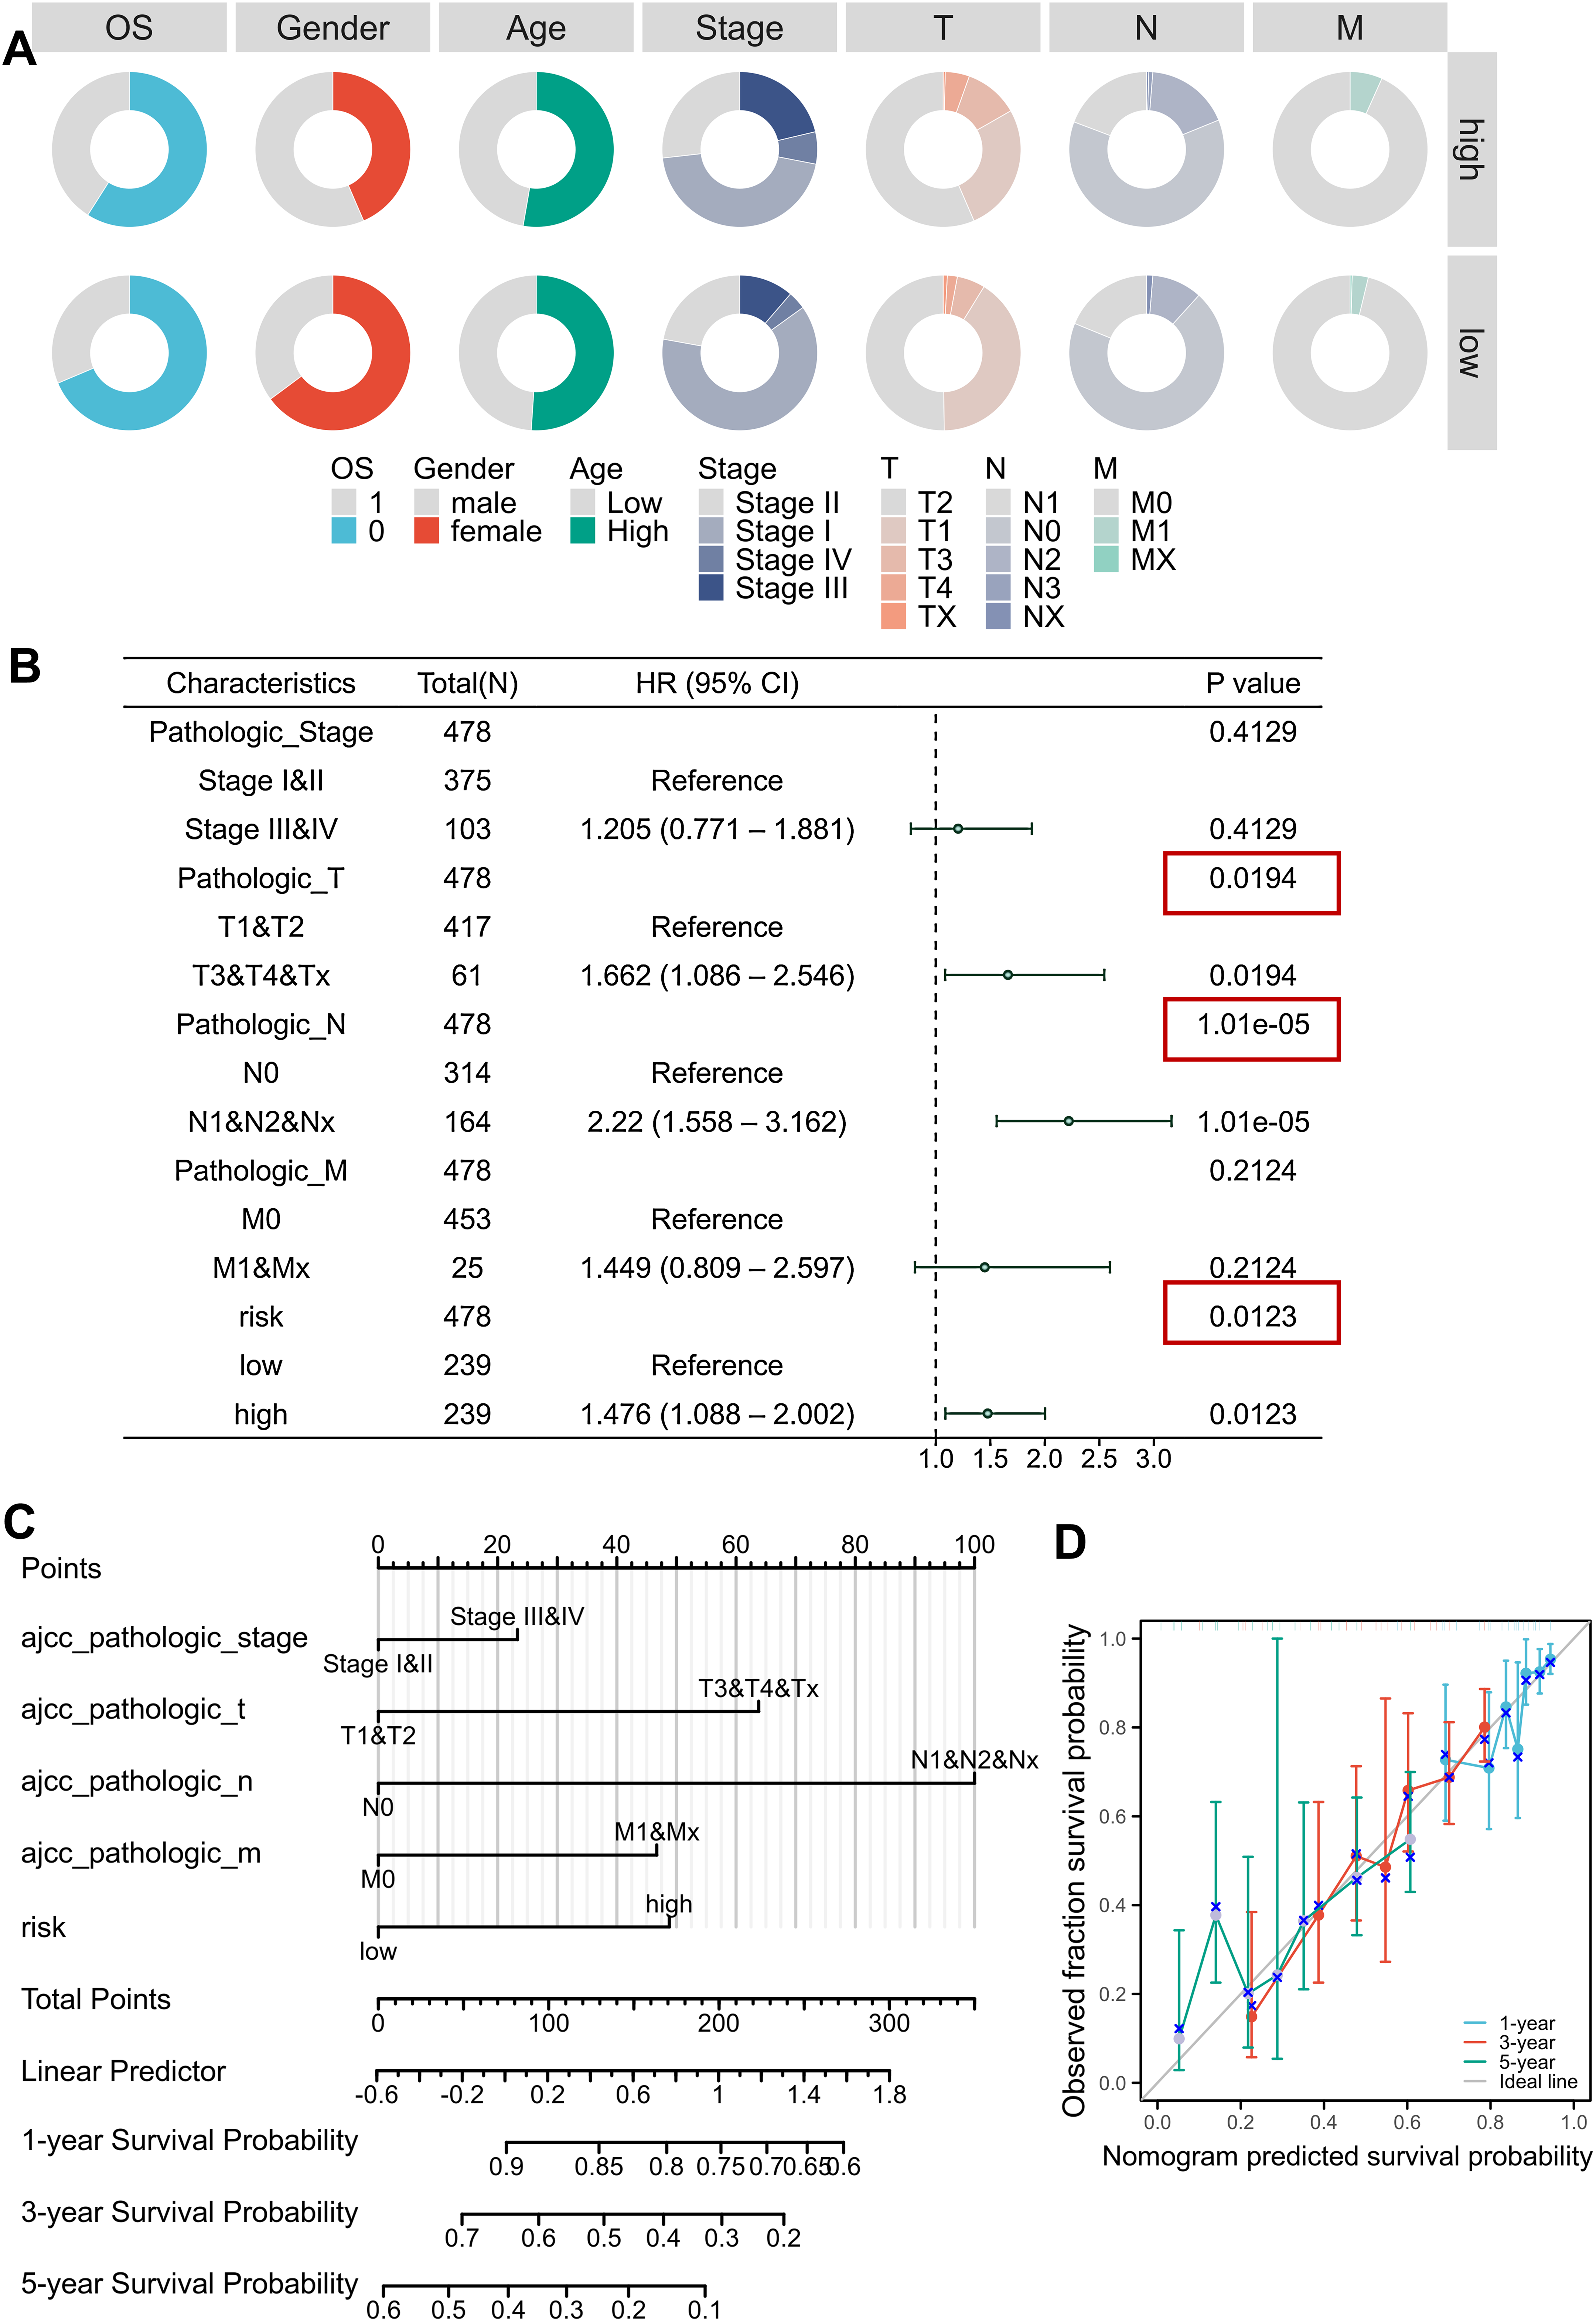
| Characteristics | High (n = 239) | Low (n = 239) | P value |
|---|---|---|---|
| OS, n (%) | 0.029 | ||
| Dead | 98 (20.5%) | 75 (15.7%) | |
| Alive | 141 (29.5%) | 164 (34.3%) | |
| Gender, n (%) | <0.001 | ||
| Male | 135 (28.2%) | 84 (17.6%) | |
| Female | 104 (21.8%) | 155 (32.4%) | |
| Age, median (IQR) | 66 (59, 72) | 66 (59, 73) | 0.734 |
| Pathologic_Stage, n (%) | <0.001 | ||
| Stage I | 108 (22.6%) | 150 (31.4%) | |
| Stage II | 64 (13.4%) | 53 (11.1%) | |
| Stage III | 51 (10.7%) | 27 (5.6%) | |
| Stage IV | 16 (3.3%) | 9 (1.9%) | |
| Pathologic_T, n (%) | 0.004 | ||
| T1 | 64 (13.4%) | 98 (20.5%) | |
| T2 | 135 (28.2%) | 120 (25.1%) | |
| T3 | 27 (5.6%) | 14 (2.9%) | |
| T4 | 12 (2.5%) | 5 (1%) | |
| Tx | 1 (0.2%) | 2 (0.4%) | |
| Pathologic_N, n (%) | 0.079 | ||
| N0 | 148 (31%) | 166 (34.7%) | |
| N1 | 46 (9.6%) | 45 (9.4%) | |
| N2 | 42 (8.8%) | 25 (5.2%) | |
| N3 | 2 (0.4%) | 0 (0%) | |
| Nx | 1 (0.2%) | 3 (0.6%) | |
| Pathologic_M, n (%) | 0.141 | ||
| M0 | 223 (46.7%) | 230 (48.1%) | |
| M1 | 16 (3.3%) | 8 (1.7%) | |
| Mx | 0 (0%) | 1 (0.2%) |
Note:
Bold indicates P value ≤ 0.05 was considered statistically significant.
| Variables | Patient (n = 478) | HR | 95% CI | P value |
|---|---|---|---|---|
| Gender | ||||
| Female | 259 | Reference | ||
| Male | 219 | 1.148 | [0.852–1.548] | 0.3652 |
| Age (years) | ||||
| ≥65 | 266 | Reference | ||
| <65 | 212 | 0.879 | [0.649–1.189] | 0.402 |
| Pathologic stage | ||||
| Stage I & II | 375 | Reference | ||
| Stage III & IV | 103 | 2.598 | [1.893–3.565] | 3.38E−09 |
| Pathologic T | ||||
| T1 & T2 | 417 | Reference | ||
| T3 & T4 & Tx | 61 | 2.278 | [1.552–3.342] | 2.58E−05 |
| Pathologic N | ||||
| N0 | 314 | Reference | ||
| N1 & N2 & Nx | 164 | 2.635 | [1.951–3.558] | 2.57E−10 |
| Pathologic M | ||||
| M0 | 453 | Reference | ||
| M1 & Mx | 25 | 2.329 | [1.389–3.904] | 0.0013 |
| Risk level | ||||
| Low | 239 | Reference | ||
| High | 239 | 1.656 | [1.225–2.238] | 0.001 |
Note:
Bold indicates P value ≤ 0.05 was considered statistically significant.
| Variables | Patient (n = 478) | HR | 95% CI | P value |
|---|---|---|---|---|
| Pathologic stage | ||||
| Stage I & II | 375 | Reference | ||
| Stage III & IV | 103 | 1.205 | [0.771–1.881] | 0.4129 |
| Pathologic T | ||||
| T1 & T2 | 417 | Reference | ||
| T3 & T4 & Tx | 61 | 1.662 | [1.086–2.546] | 0.0194 |
| Pathologic N | ||||
| N0 | 314 | Reference | ||
| N1 & N2 & Nx | 164 | 2.220 | [1.558–3.162] | 1.01E−05 |
| Pathologic M | ||||
| M0 | 453 | Reference | ||
| M1 & Mx | 25 | 1.449 | [0.809–2.597] | 0.2124 |
| Risk level | ||||
| Low | 239 | Reference | ||
| High | 239 | 1.476 | [1.088–2.002] | 0.0123 |
Note:
Bold indicates P value ≤ 0.05 was considered statistically significant.
Functional enrichment analysis of DEGs in high risk and low risk groups
Comparative transcriptomic profiling between high-risk and low-risk subgroups identified 600 DEGs meeting stringent thresholds (|log2FC| > 1.5, Benjamini-Hochberg adj. P < 0.01), comprising 387 upregulated and 213 downregulated transcripts in high-risk patients (Figs. 5A, 5B). Functional enrichment analysis demonstrated striking pathway polarization. GO analysis revealed high-risk-specific enrichment in fibrinogen complex and extracellular region at the cellular component level. Molecular function terms predominantly mapped to receptor regulator activity and signal release, while biological process centered on regulation of hormone levels and receptor ligand activity. KEGG pathway analysis identified eight significantly enriched pathways, including Neuroactive ligand-receptor interaction, complement and coagulation cascades, GABAergic synapse, vascular smooth muscle contraction, steroid hormone biosynthesis, biosynthesis of amino acids, NOD-like receptor signaling pathway and Toll-like receptor signaling pathway (Figs. 5C, 5D). GSEA results showed that the high-risk status was significantly associated with extracellular membrane bounded organelle, fibrinogen complex, mitochondrial protein containing complex, outer mitochondrial membrane protein complex and immune related pathways (Figs. S5A–S5D).
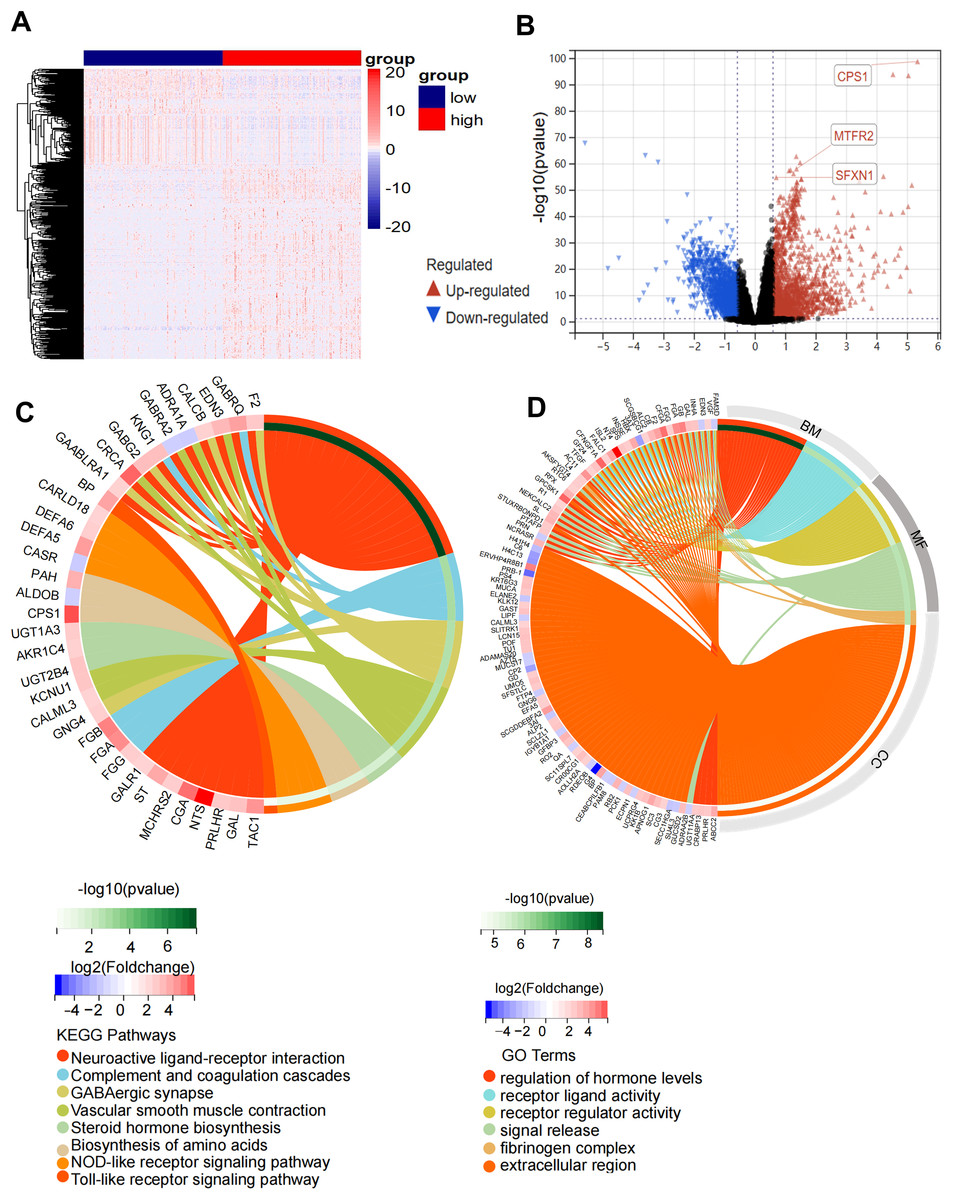
Figure 5: Functional enrichment analysis of the DEGs in high-risk and low-risk groups.
(A) Heatmap of 600 DEGs (rows) across risk-stratified samples (columns). (B) Volcano plot discriminating DEGs (red: upregulated; blue: downregulated) with threshold lines at |log2FC| = 1.5 and −log10(P) = 2. (C) Circular visualization of KEGG pathway enrichment and molecular interactions (top 8 pathways). (D) Circular visualization of GO pathway analysis (top 6 pathways).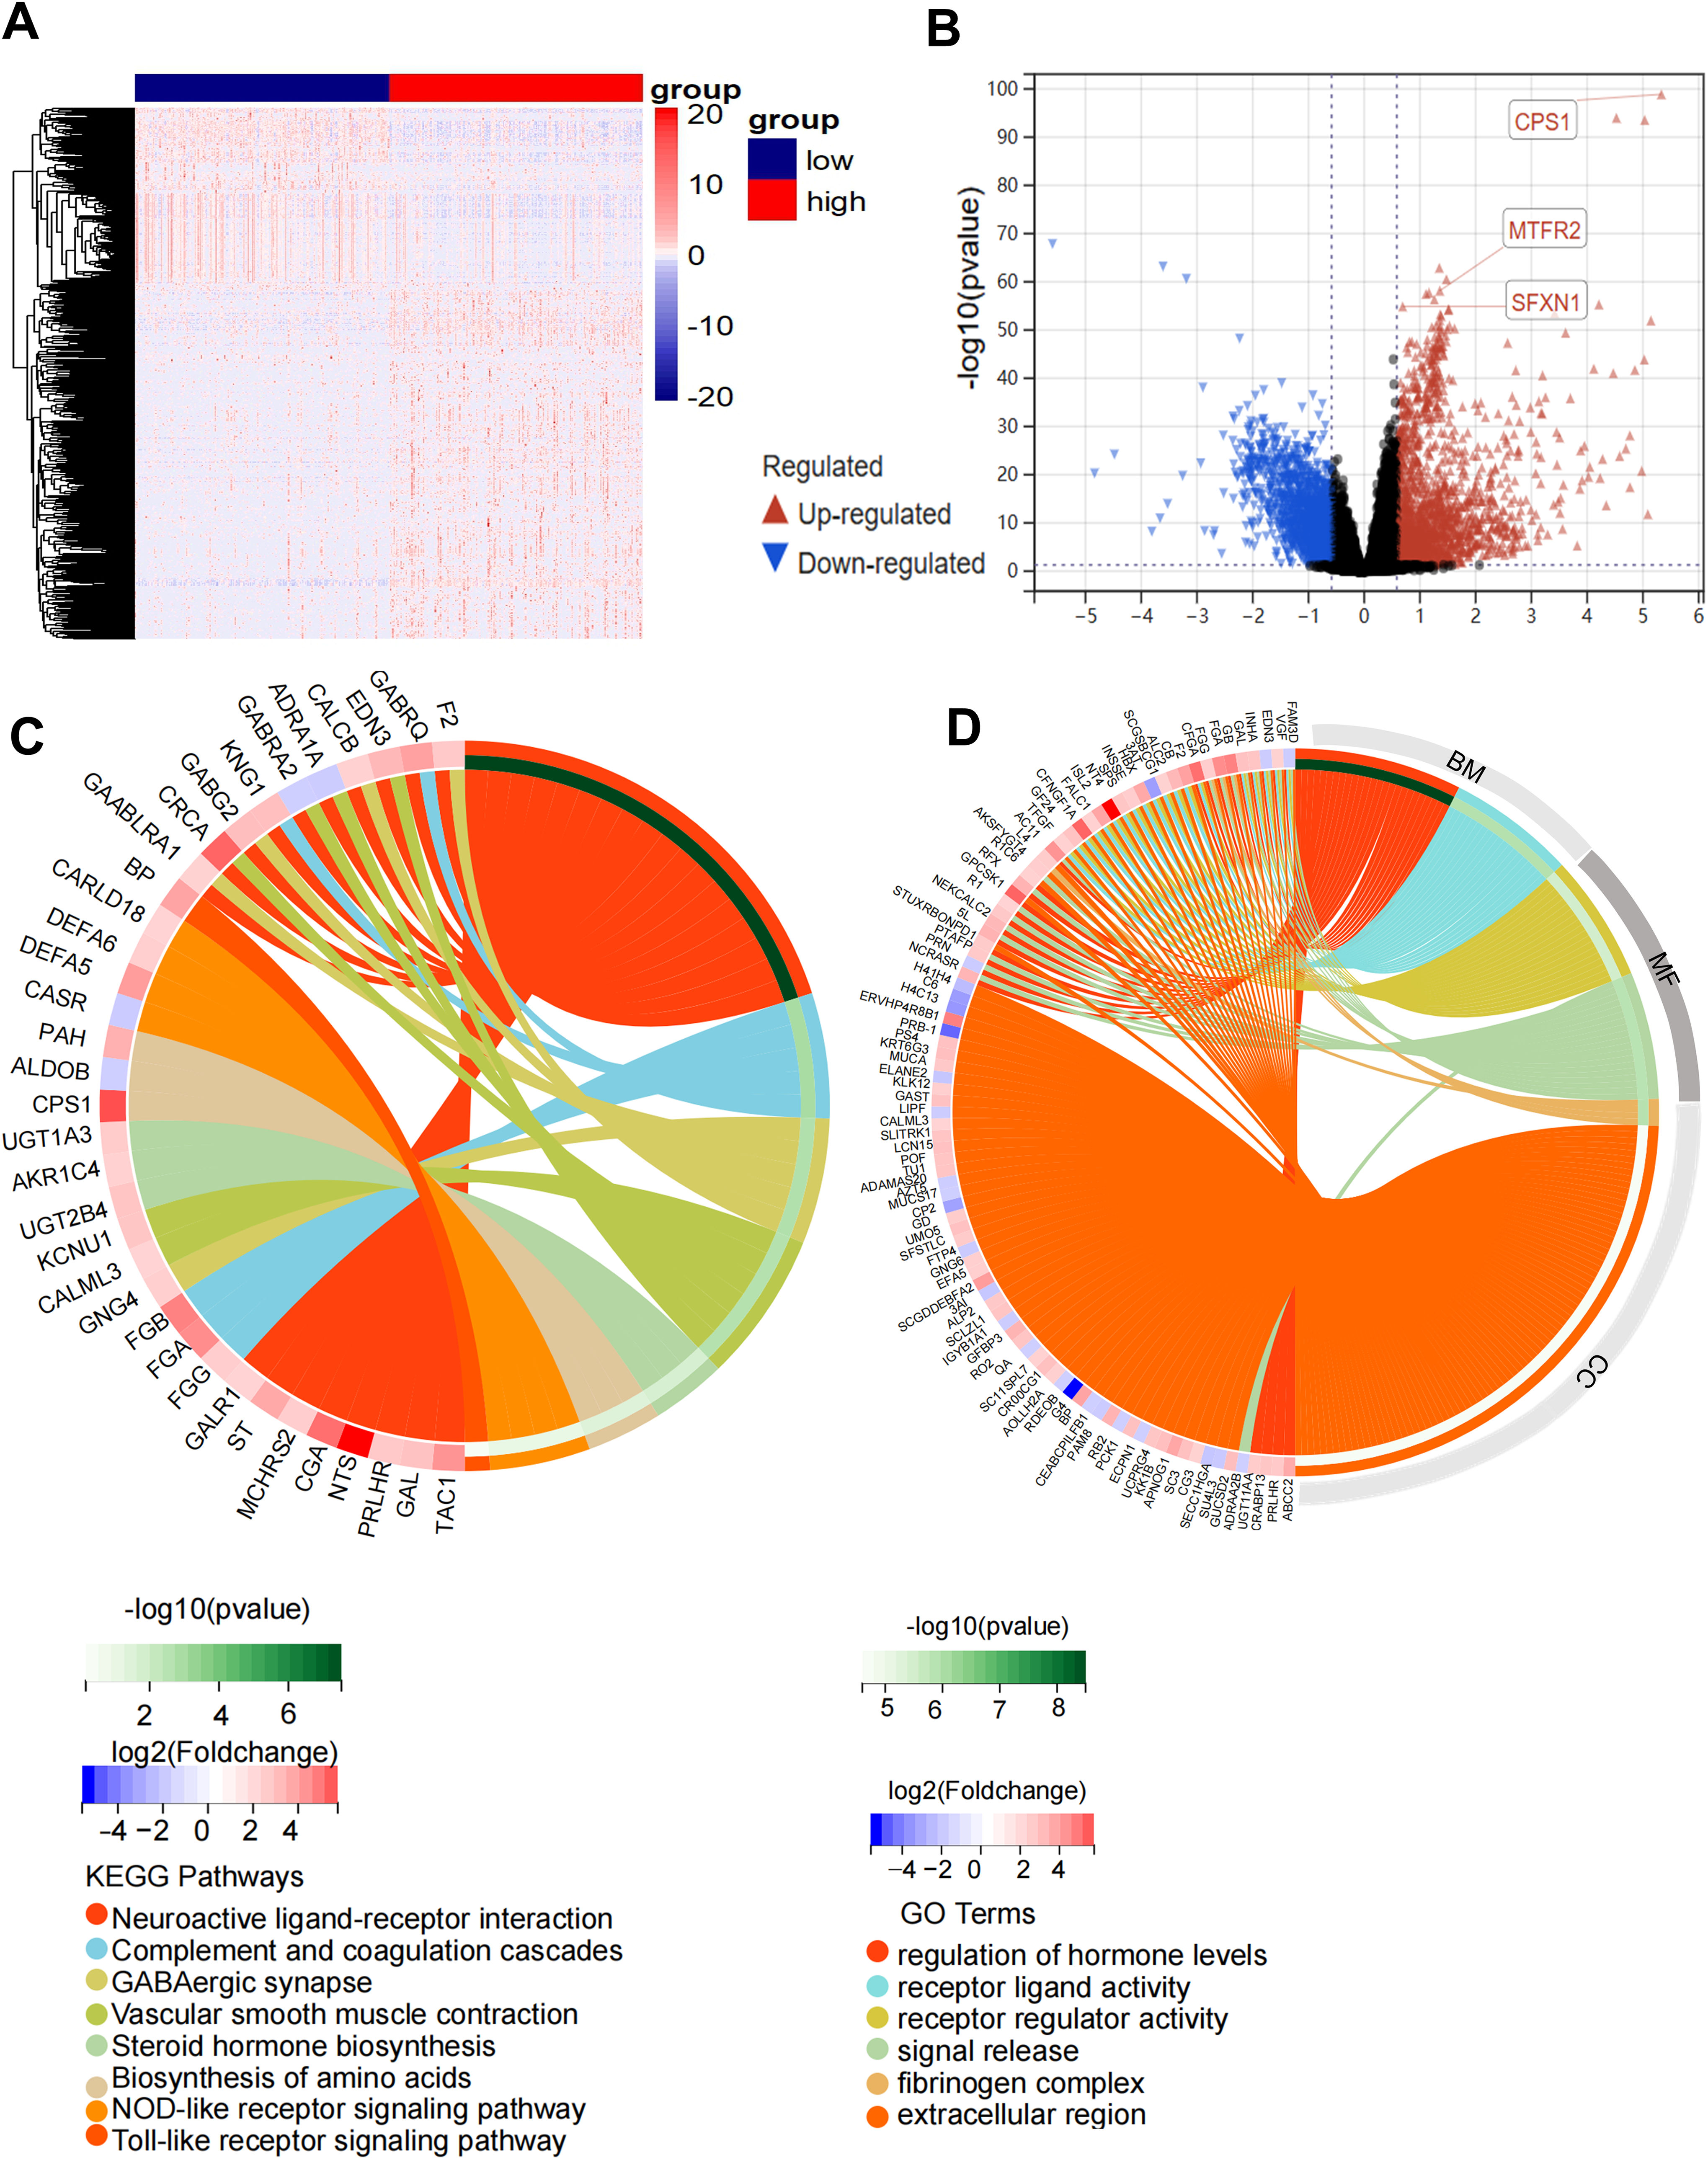
Association between MTR risk scores and immune landscape in LUAD
We performed bioinformatics analysis to determine the effects of mitochondrial function on TME. The high-risk group exhibited higher tumor purity but lower stromal score, immune score, and Estimate score than the low-risk group. Moreover, the MTR risk score was significantly associated with Tumor Immune Dysfunction and Exclusion (TIDE) scores (Fig. 6A), suggesting impaired immune surveillance in high-risk tumors. To further confirm the correlation of MTR signatures expression with the immune microenvironment, the proportion of tumor infiltrating immune subsets was analyzed using CIBERSORT algorithm, and the immune cell profiles in LUAD samples were constructed.
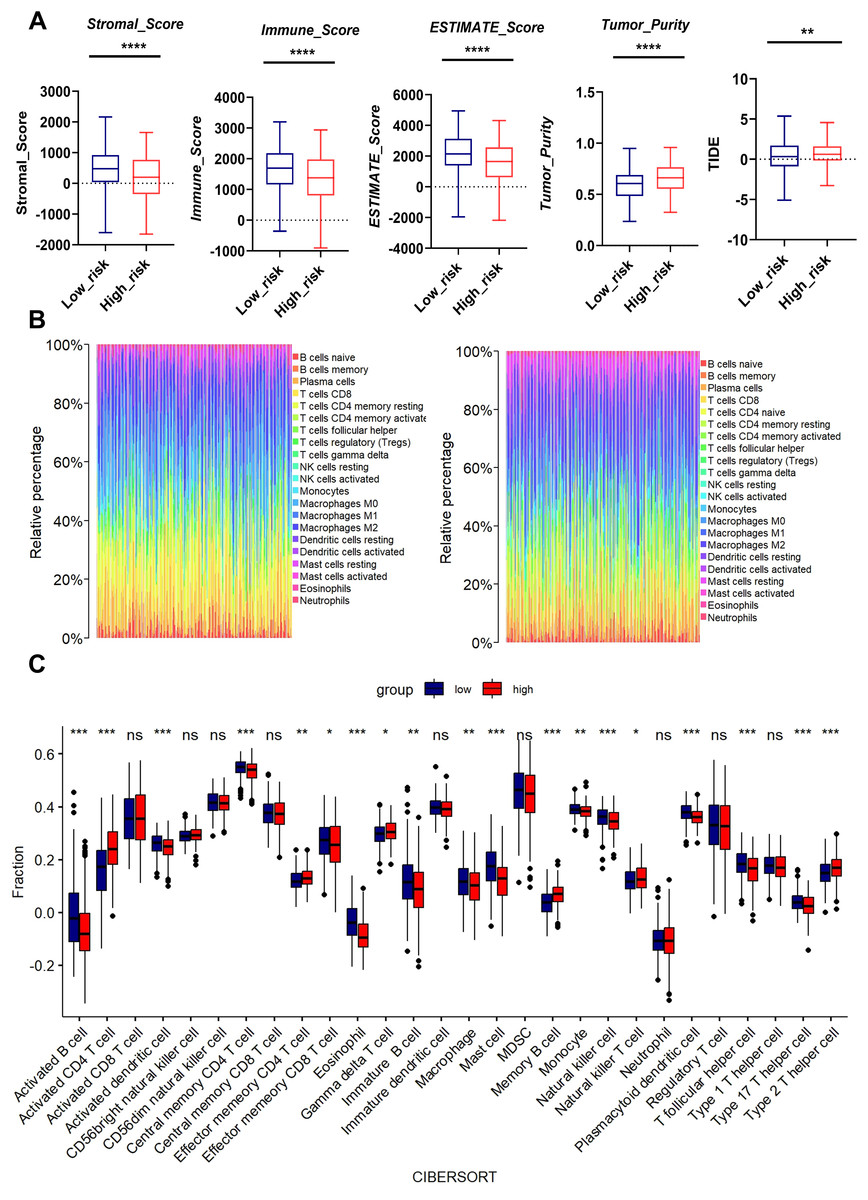
Figure 6: Association between MTR risk scores and immune landscape in LUAD.
(A) Distribution of tumor purity, stromal score, immune score, estimate score and TIDE in the low-risk and high-risk groups. (B) Barplot showing the proportion of 21 kinds of TICs in LUAD tumor samples of the low-risk and high-risk groups. (C) CIBERSORT analysis of the low-risk and high-risk groups. ns represents no significance, *P < 0.05, **P < 0.01, ***P < 0.001, ****P < 0.0001.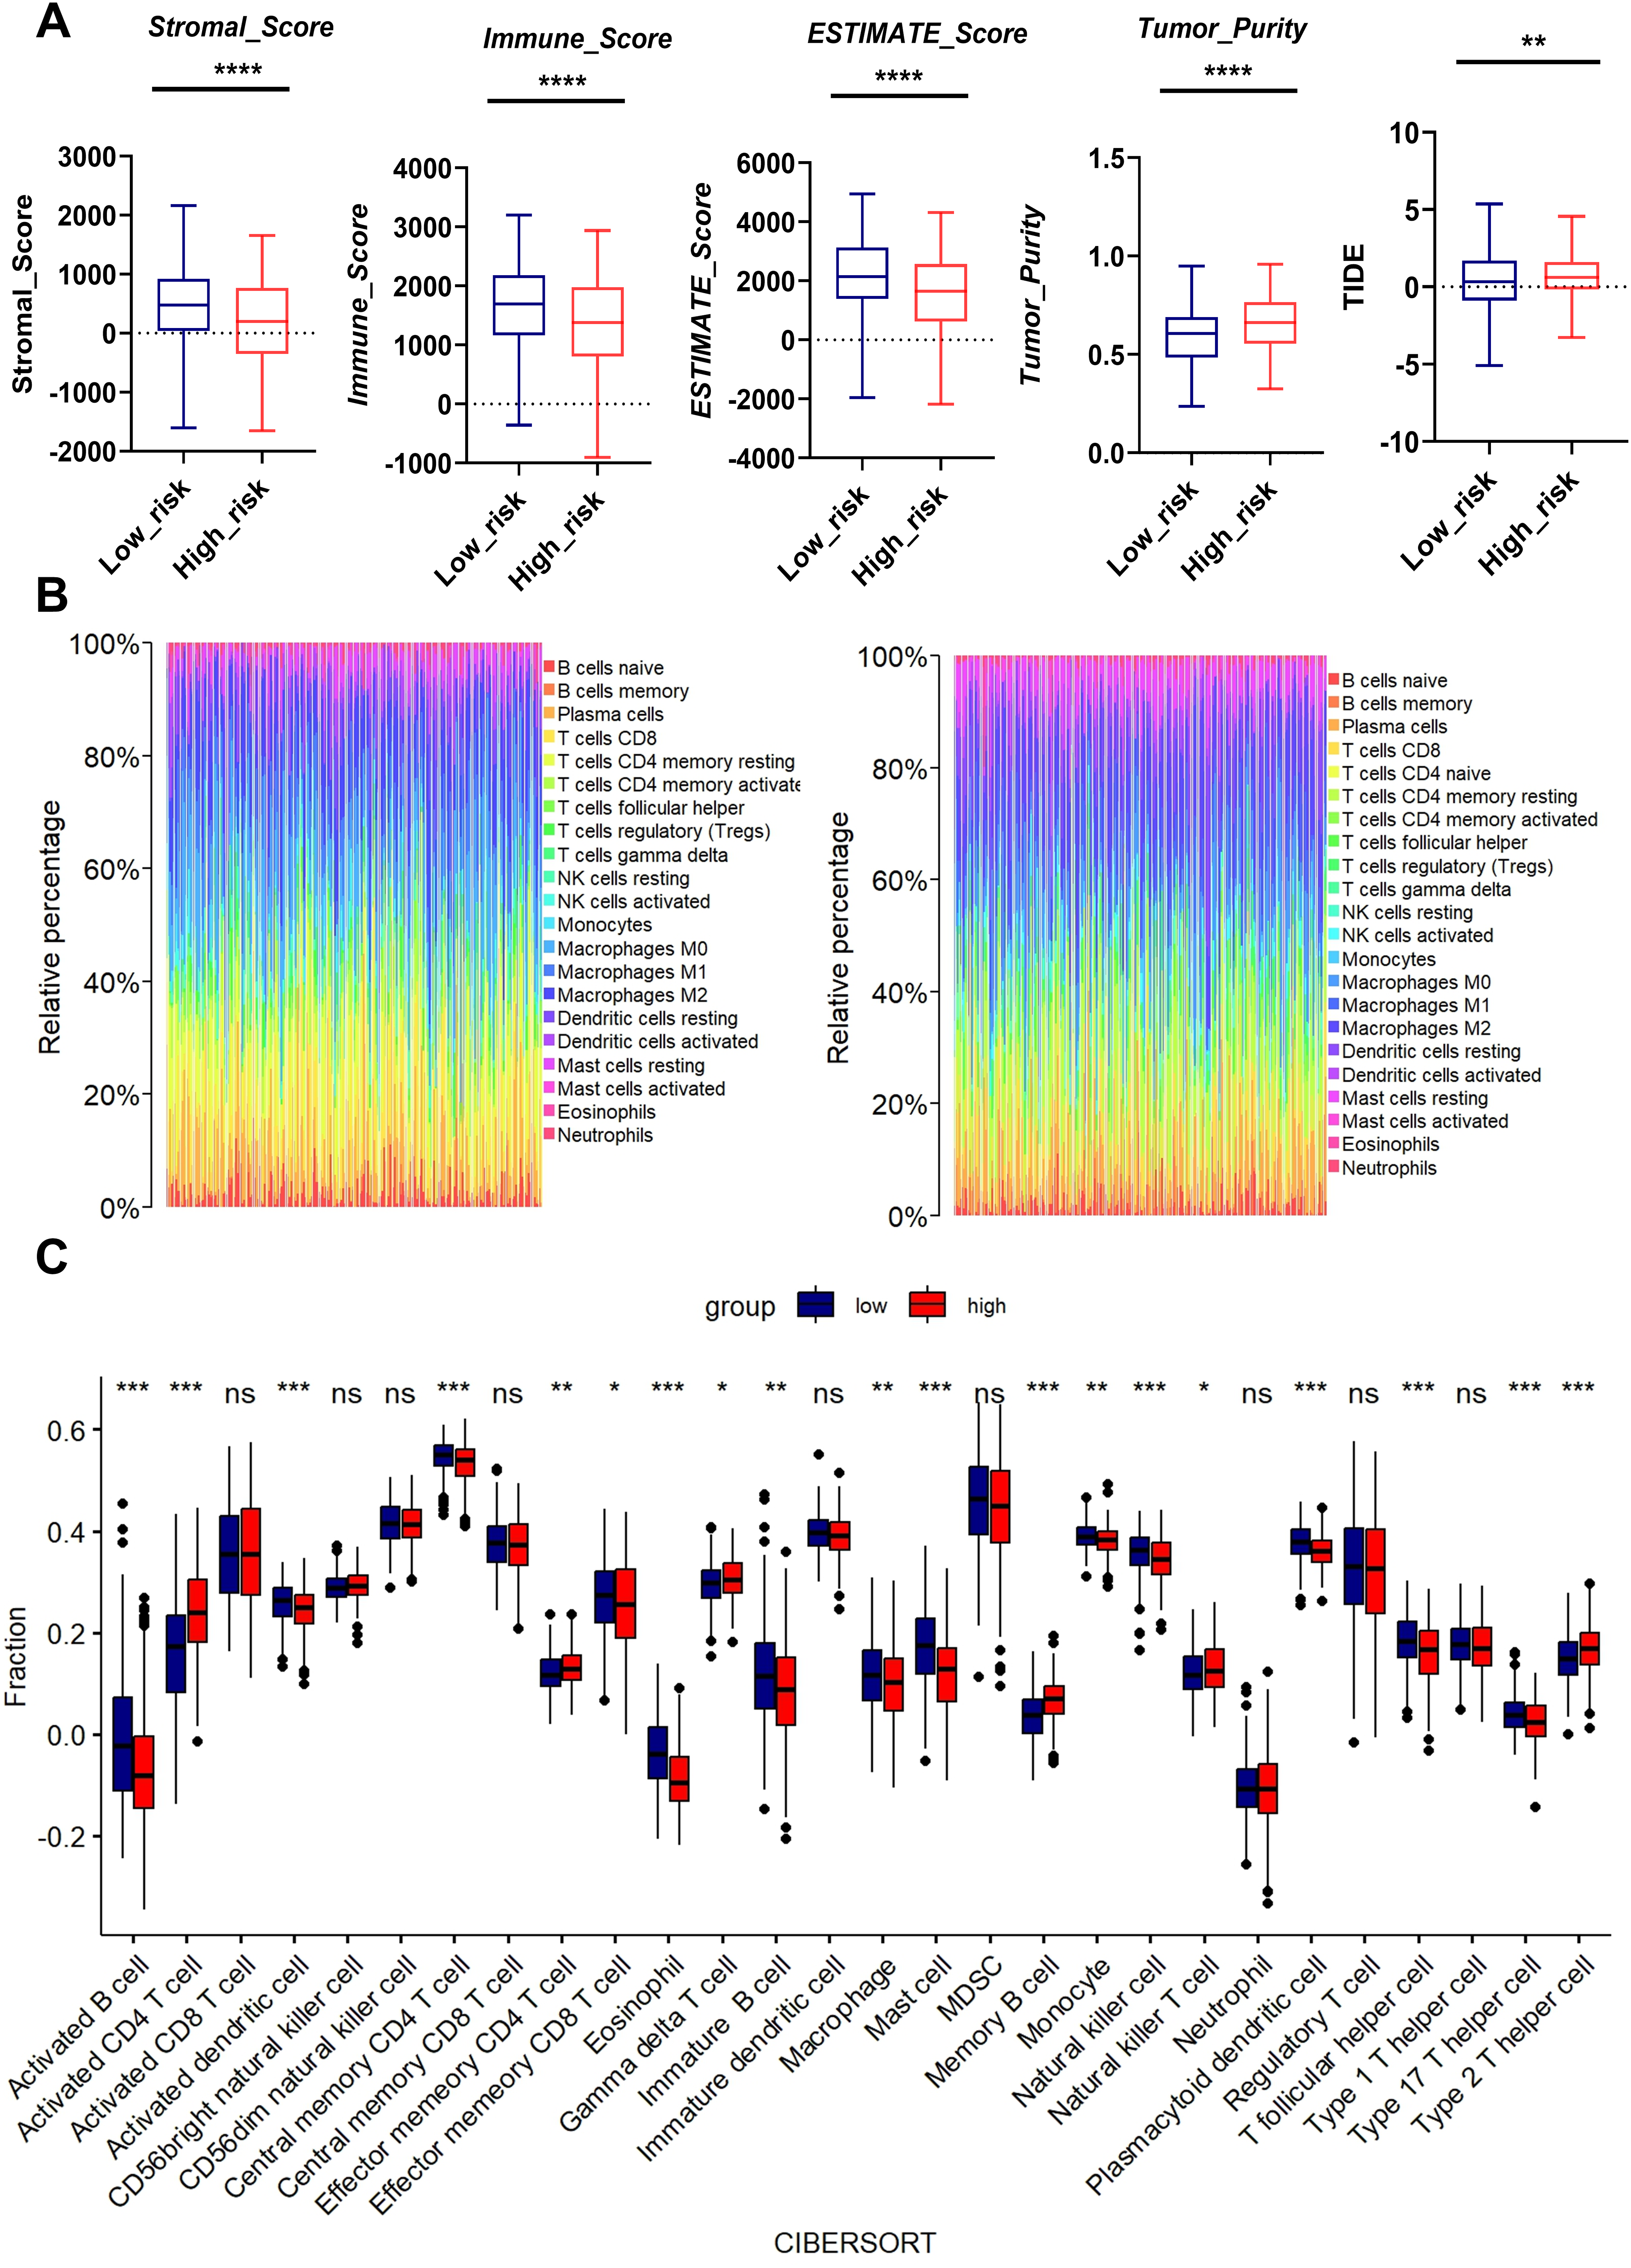
We found through rainbow plots, CIBERSORT-based bulk immune cell infiltration analysis, and single immune cell correlation analysis respectively that levels of activated CD4+ T cells, memory B cells, effector memory CD4+ T cells, and Type 2 T helper cells were elevated in the high-risk group (Figs. 6B, 6C, Fig. S6). By contrast, the risk score was negatively associated with the abundance of innate immune cells, including macrophages, activated B cells, activated dendritic cells, central memory CD4+ T cells, Natural killer T cells, and Type 17 helper cells (Figs. 6B, 6C, Fig. S7). A heatmap was generated to display the correlation between 21 kinds of tumor-infiltrating immune cells. The numeric value in each tiny box represented the P value of correlation between two types of cells (Fig. S8).
Mutation status and immune checkpoint markers of LUAD patients in high risk and low risk groups
As shown in Figs. 7A, 7B, the top 20 most frequently mutated genes in high-risk and low-risk group were presented. TP53, TTN, MUC16, CSMD3, RYR2, ZFHX4, LRP1B, USH2A, KRAS, SPTA1, XIRP2, FLG and NAV3 were the common high-frequency mutation genes in both groups (Figs. 7A, 7B).
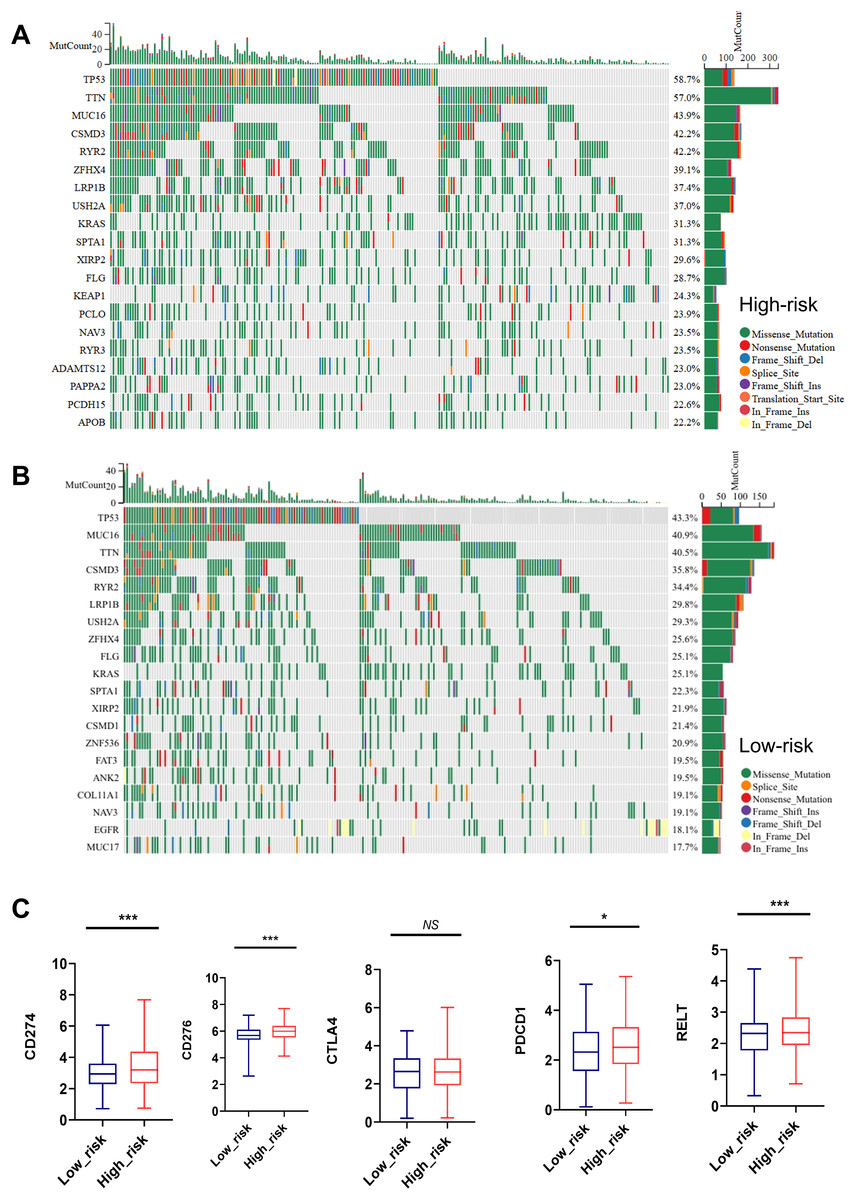
Figure 7: Mutation status and immune checkpoint markers of LUAD patients in high-risk and low-risk groups.
(A, B) Top 20 high-frequency mutated genes in high-risk and low-risk group were presented. (C) Expression of immune checkpoint markers such as CD274, CD276, PDCD1, RELT, and CTLA4 in the low-risk and high-risk groups. NS represents no significance, *P < 0.05, ***P < 0.001.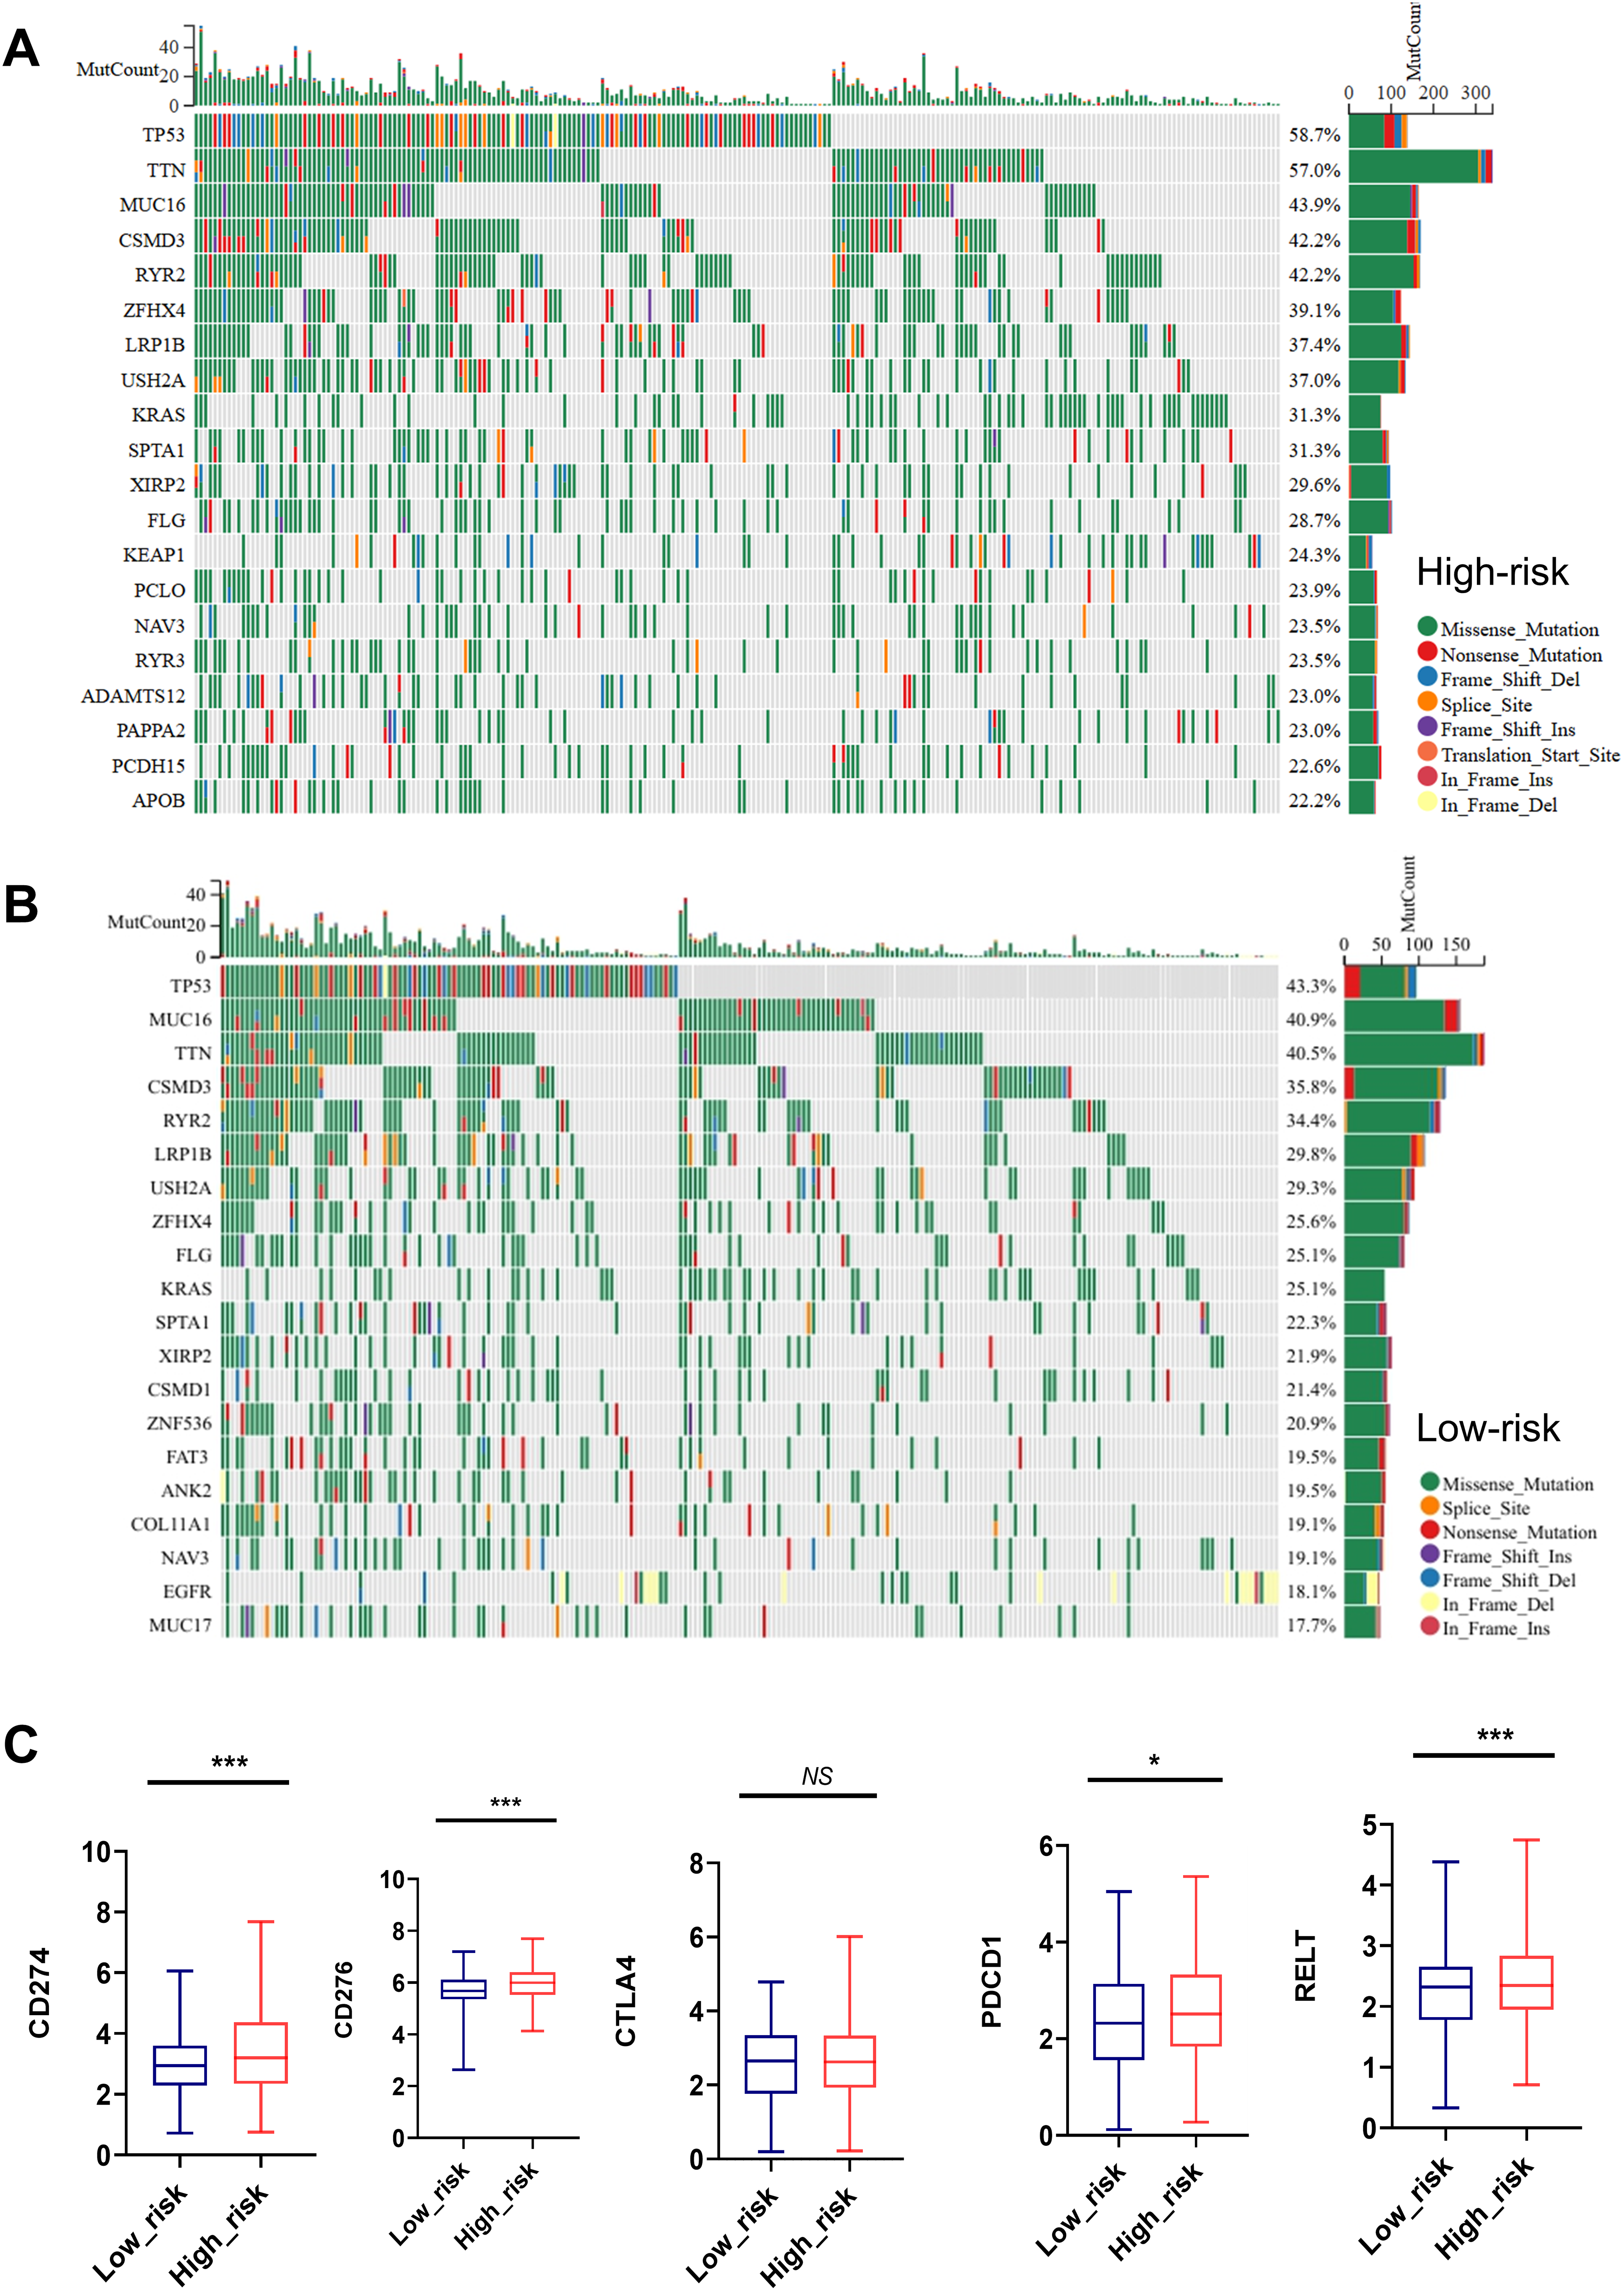
Importantly, the high-risk group showed remarkedly elevated expression of immune checkpoint markers such as CD274, CD276, PDCD1, and RELT, indicating a close relationship between MTR index and immune therapy tolerance (Fig. 7C).
Experimental verification of MTR genes expression and mitochondrial functions in LUAD
Previously, through bioinformatics analysis, we initially screened and identified three key MTR genes—SFXN1, CPS1, and MTFR2—that are potentially associated with the occurrence and development of LUAD, immune regulation, and mitochondrial function. However, the accuracy of bioinformatics predictions still needs further confirmation through experimental verification. Moreover, there is a lack of direct experimental evidence regarding how these genes specifically regulate mitochondrial morphology, function, and genomic stability in LUAD cells. To substantiate our bioinformatic findings, we systematically evaluated MTR gene expression and mitochondrial functional alterations in LUAD models. Quantitative RT-PCR analysis revealed consistent upregulation of SFXN1, CPS1, and MTFR2 across malignant cell lines (A549, H23, H1975, H1299, PC9) compared to normal bronchial epithelium (BEAS-2B) (Figs. 8A–8C). To elucidate the functional consequences of MTR gene dysregulation, we performed siRNA-mediated knockdown followed by comprehensive mitochondrial phenotyping (70–85% efficiency at 72 h post-transfection, Figs. 8D–8I, Fig. S9). CPS1 knockdown induced fission-dominant morphology with reduced ΔΨm↓, but elevated ROS and enhanced mtDNA extrusion. SFXN1 knockdown resulted in mitochondrial fusion, ΔΨm↑, and ROS suppression. MTFR2 knockdown increased mitochondrial fusion, ΔΨm, and ROS accumulation. All perturbations significantly reduced the copy number of mtDNA, with CPS1 knockdown uniquely promoting cytosolic mtDNA release (Figs. 9, 10). These results demonstrate gene-specific modulation of mitochondrial dynamics and genome maintenance.
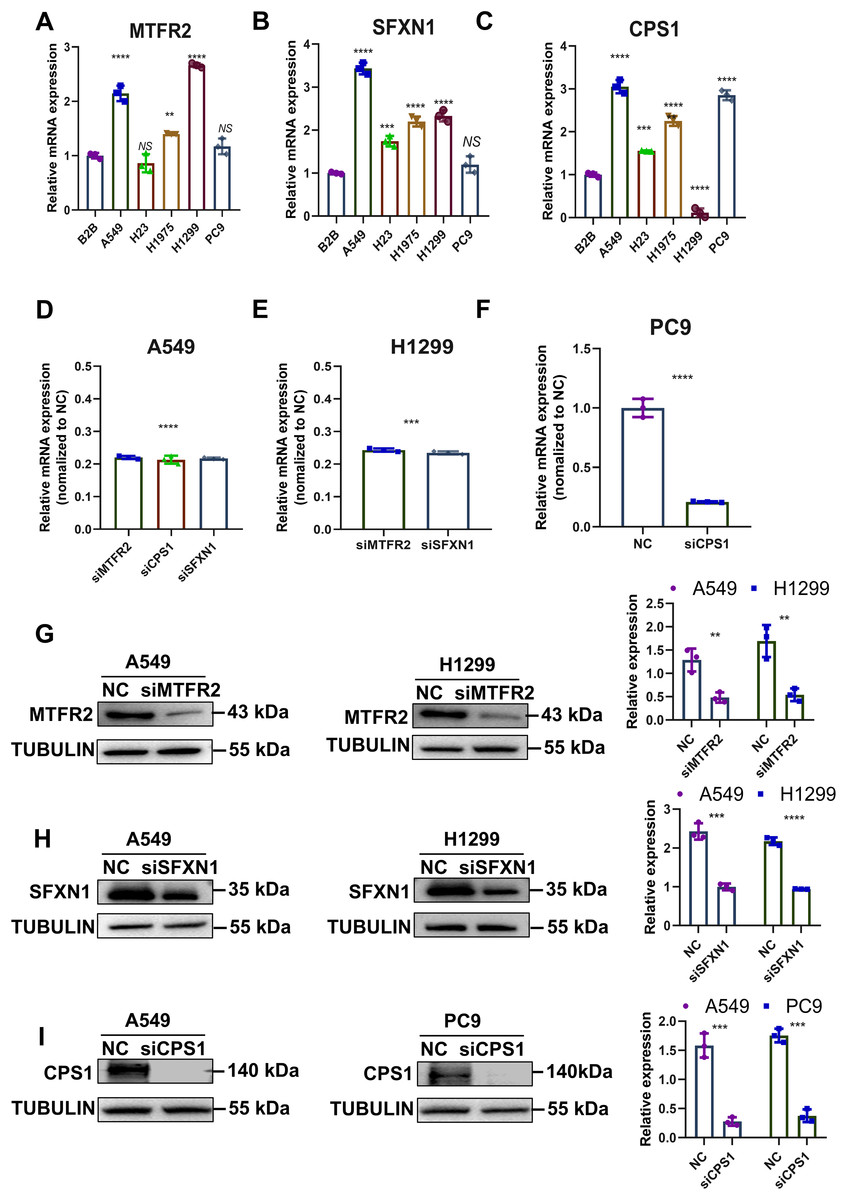
Figure 8: Experimental verification of MTR genes expression in LUAD.
(A–C) Relative mRNA levels of SFXN1, CPS1, and MTFR2 across normal bronchial epithelial cells (BEAS-2B) and five LUAD cell lines (A549, H23, H1975, H1299, and PC9), normalized to ACTB as an internal control, with BEAS-2B as the reference (Data are represented as mean ± SD, n = 3, analyzed by one-way ANOVA). (D–F) Efficiency of siRNA transfection in LUAD cell lines by qPCR analysis, normalized to ACTB as an internal control, with NC as the reference (Data are represented as mean ± SD, n = 3, analyzed by two-tailed Student’s t-test)). (G–I) Efficiency of siRNA transfection in LUAD cell lines by Western Blotting, normalized to TUBULIN as an internal control (Data are represented as mean ± SD, n = 3, analyzed by two-tailed Student’s t-test). NS represents no significance, **P < 0.01, ***P < 0.001, ****P < 0.0001.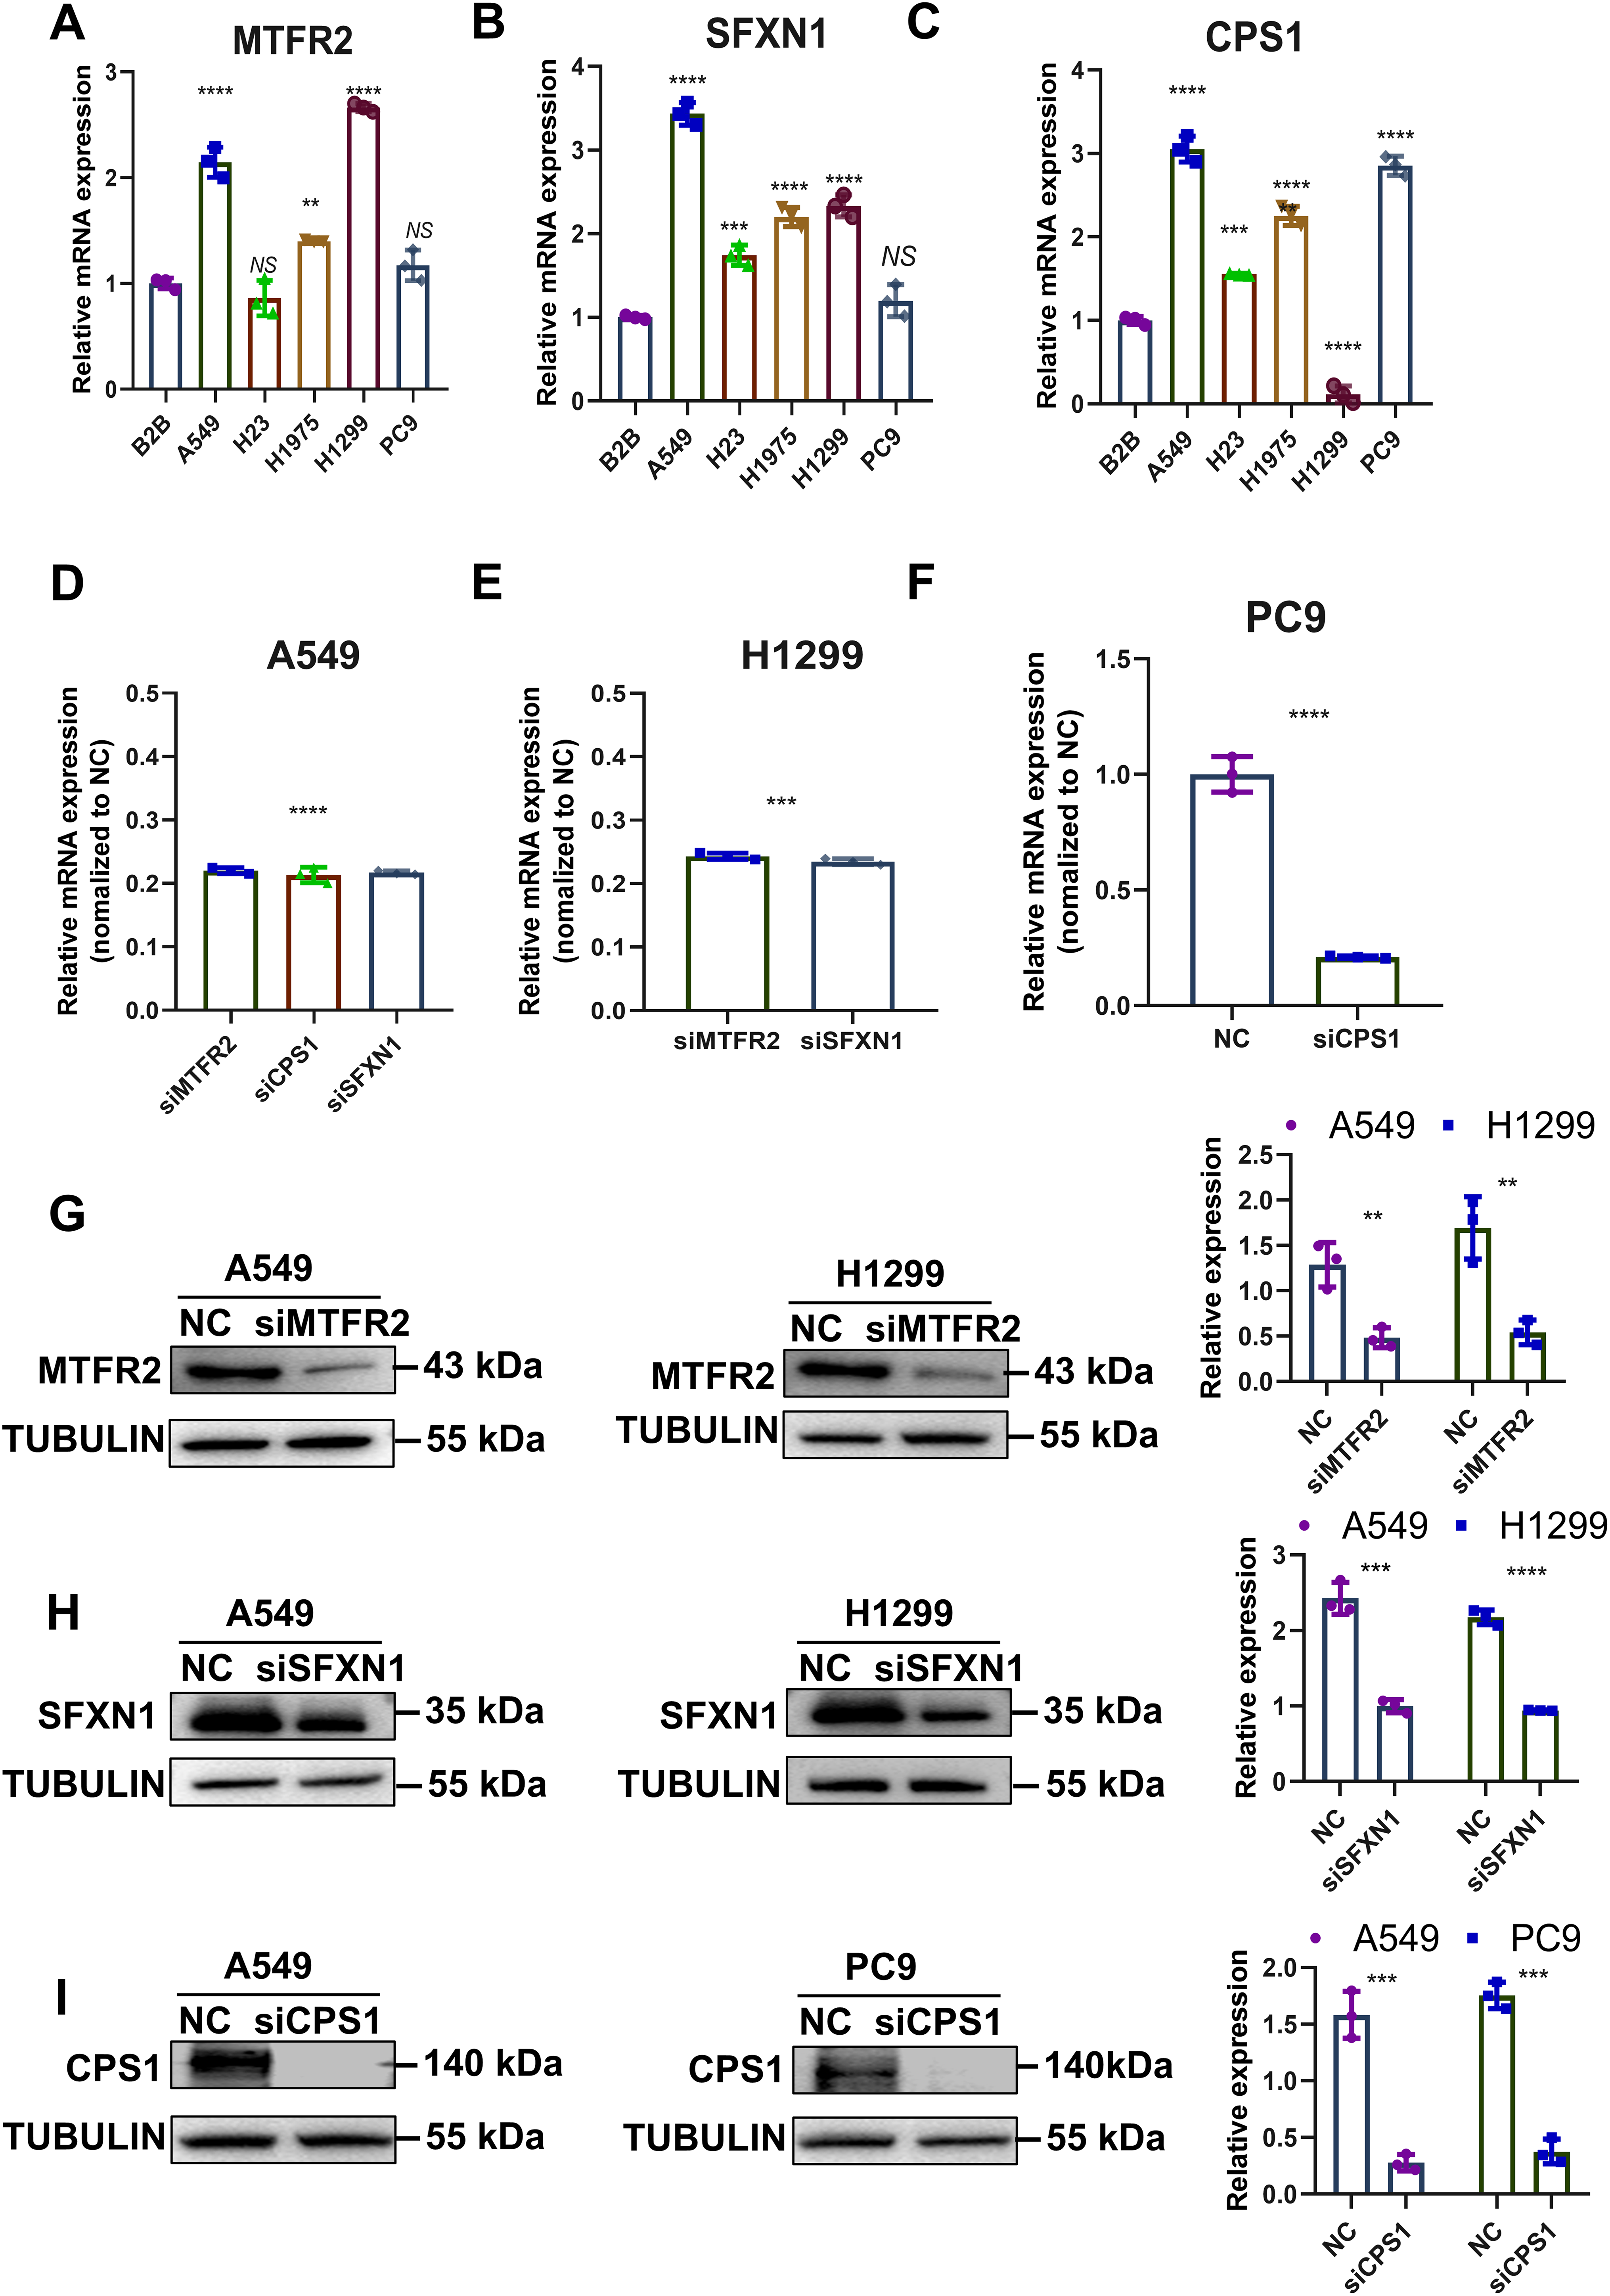
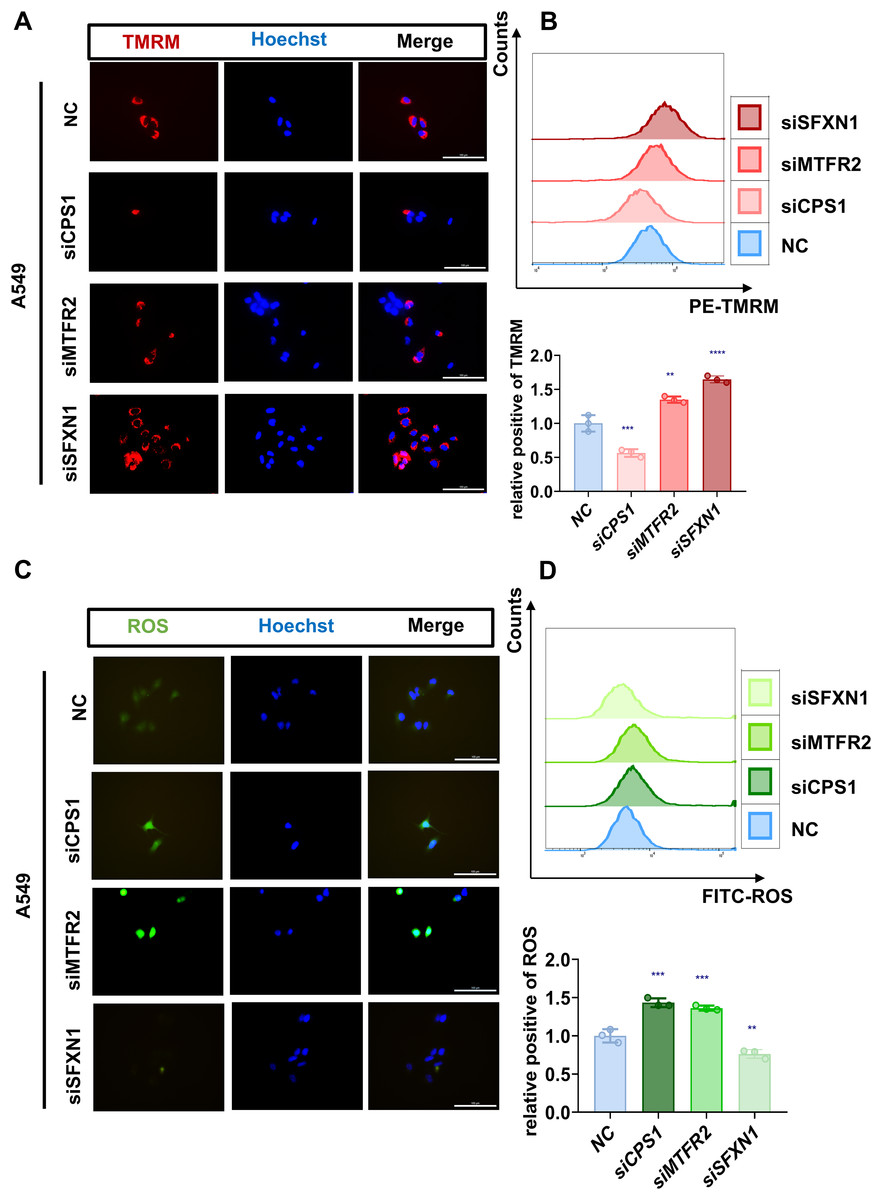
Figure 9: Experimental verification of MTR genes mitochondrial functions in LUAD.
(A, B) Mitochondrial membrane potential of NC and CPS1/MTFR2/SFXN1 knockdown cells was detected by confocal microscopy and flow cytometry after being stained with 20 nM Tetramethylrhodamine (TMRM, red) for 30 min. Nuclei were visualized by Hoechst (blue). Scale bar, 100 µm. At least 3 repeats for each condition. Quantitative analysis of relative positive rates from flow cytometric analysis of TMRM in NC and CPS1/MTFR2/SFXN1 knockdown cells, normalized to NC (data presented as mean ± SD, n = 3, analyzed by one-way ANOVA). (C, D) ROS levels of NC and CPS1/MTFR2/SFXN1 knockdown cells were detected by confocal microscopy and flow cytometry after being stained with 10 μM ROS (green) for 20 min. Nuclei were visualized by Hoechst (blue). Scale bar, 100 µm. At least 3 repeats for each condition. Quantitative analysis of relative positive rates from flow cytometric analysis of ROS in NC and CPS1/MTFR2/SFXN1 knockdown cells, normalized to NC (data presented as mean ± SD, n = 3, analyzed by one-way ANOVA). **P < 0.01, ***P < 0.001, ****P < 0.0001.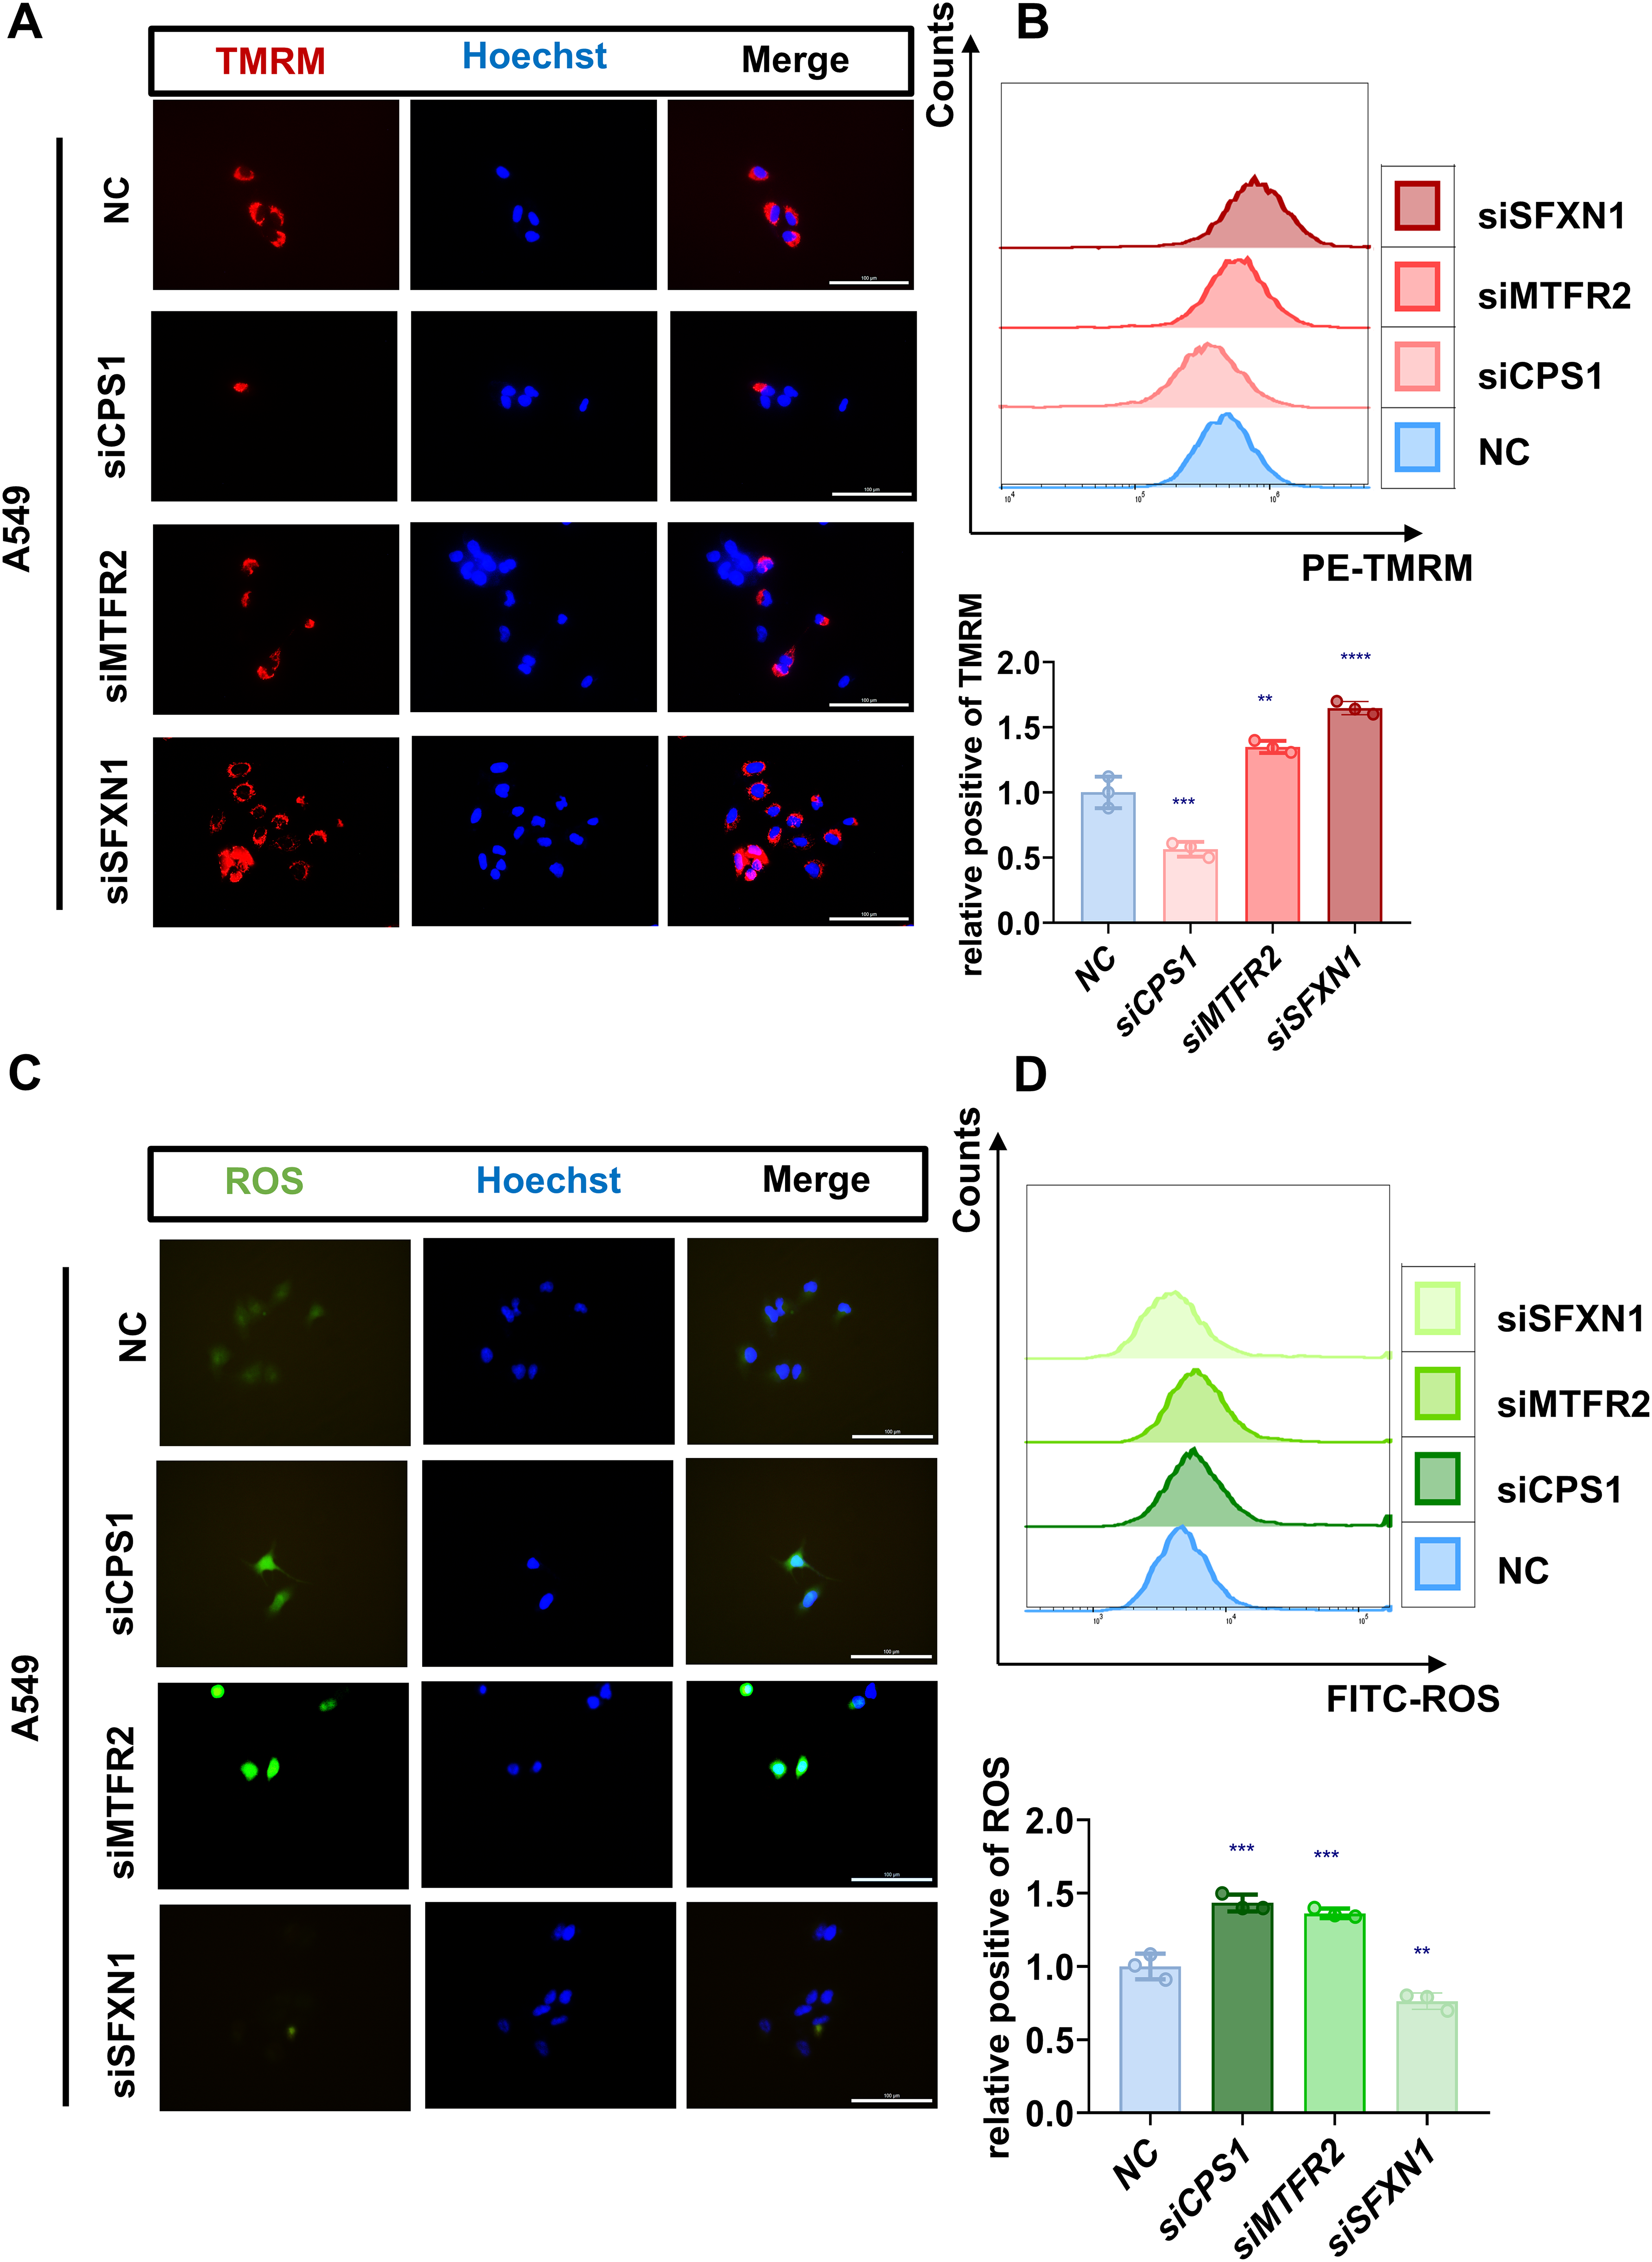
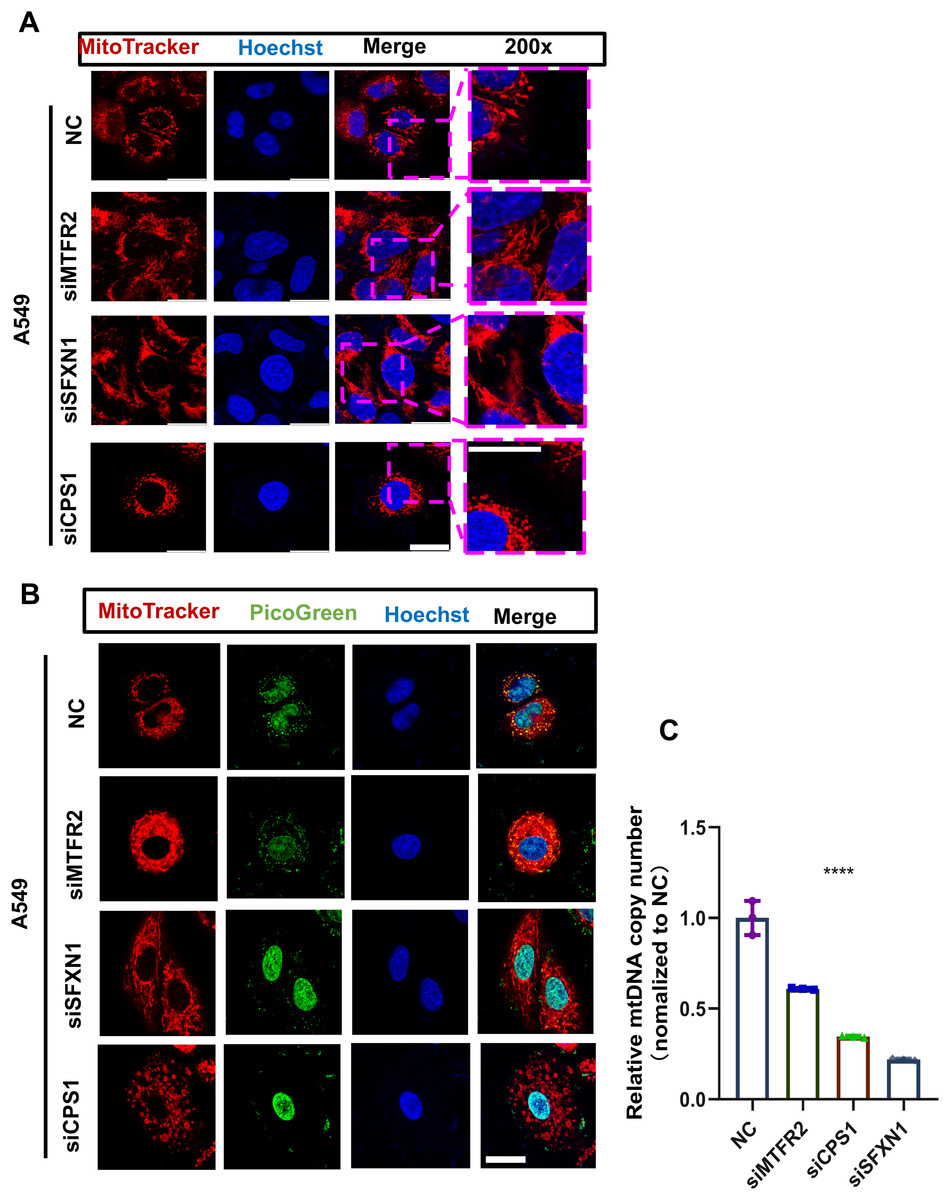
Figure 10: MTR genes modulate mitochondrial ultrastructure and mtDNA stability in LUAD.
(A) The mitochondrial ultrastructure of NC and CPS1/MTFR2/SFXN1 knockdown cells was detected by confocal microscopy after being stained with 200nM Mitotracker (red) for 30 min. Nuclei were visualized by Hoechst (blue). Scale bar, 20 µm. At least 3 repeats for each condition. (B) The mitochondrial ultrastructure and mtDNA of NC and CPS1/MTFR2/SFXN1 knockdown cells were imaged with confocal microscopy after being stained with 200 nM Mitotracker (red) for 30 min or Picgreen (green) for 1 h. Nuclei were visualized by Hoechst (blue). Scale bar, 20 µm. At least 3 repeats for each condition. (C) Quantitative PCR and mtDNA(ND1) copy number analysis of NC and CPS1/MTFR2/SFXN1 knockdown cells. Results were normalized to TERT, with NC as the reference (Data are represented as mean ± SD, n = 3, analyzed by two-tailed Student’s t-test). ****P < 0.0001.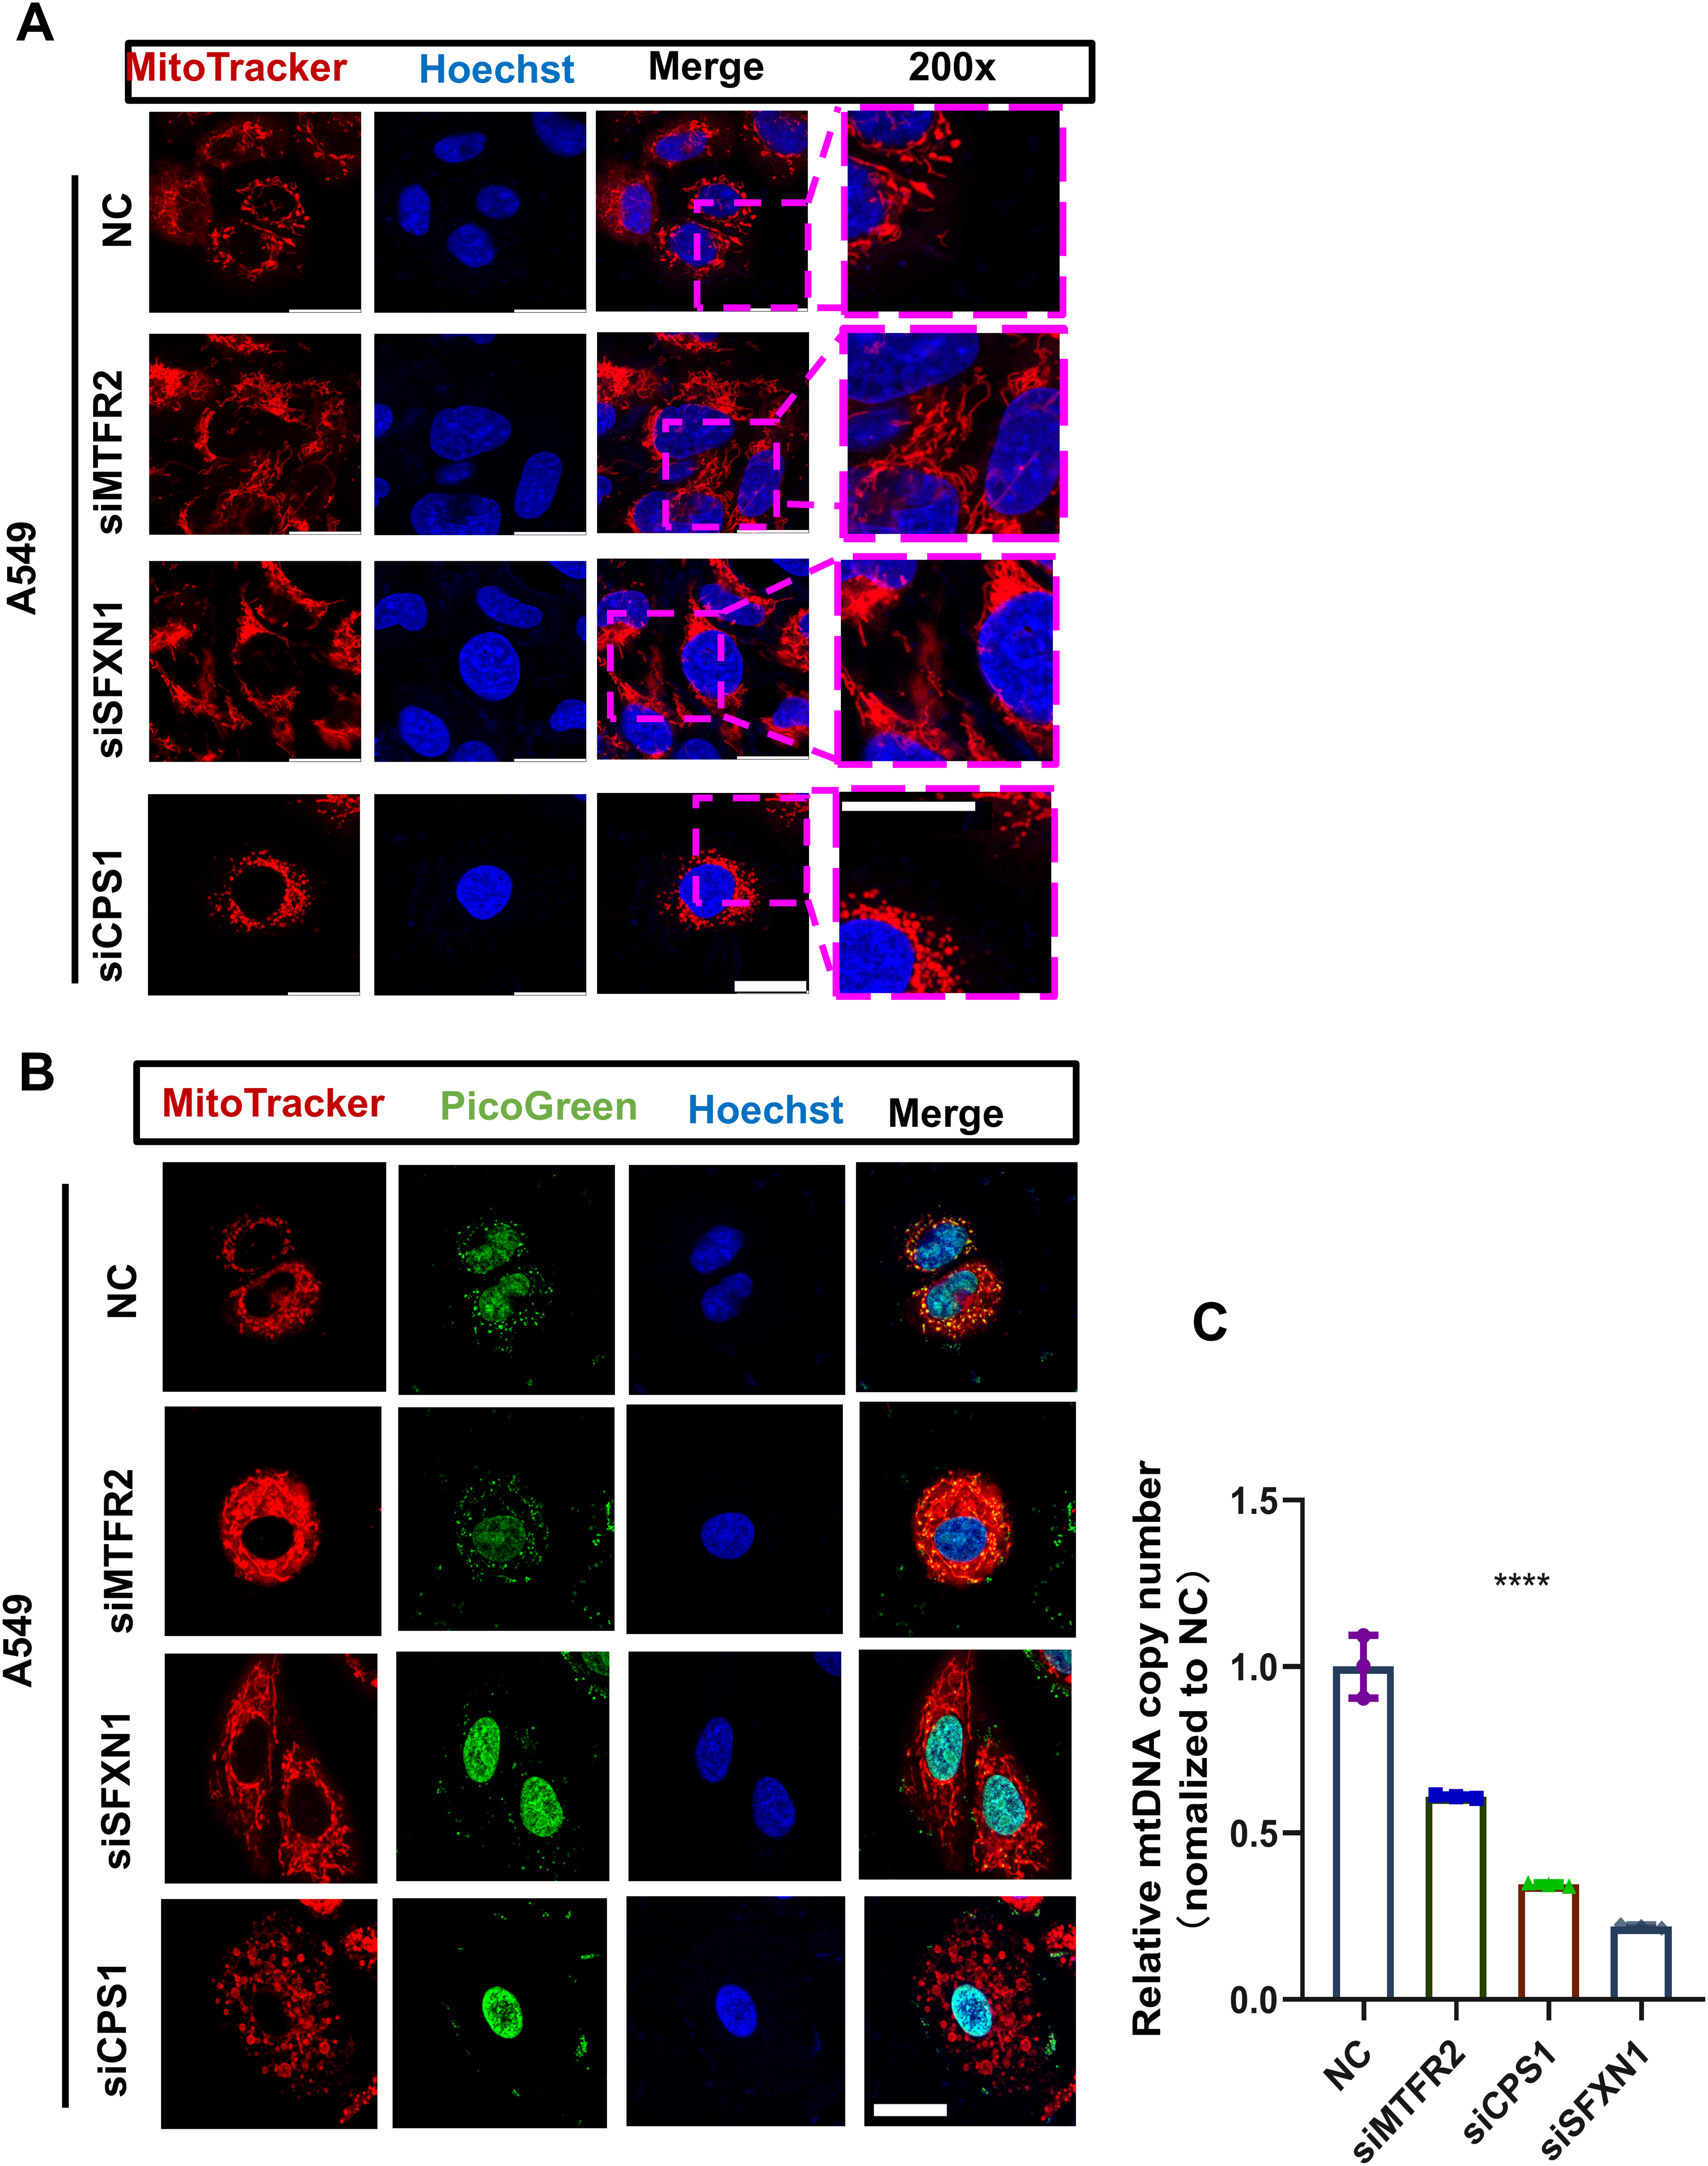
Discussion
LUAD is a prevalent and highly malignant subtype of lung cancer, posing a severe threat to global public health. Currently, genetic testing for LUAD primarily relies on tissue biopsies. In recent years, liquid biopsies have demonstrated tremendous application prospects. Liquid biopsies, which encompass circulating tumor cells (CTCs), circulating tumor DNA (ctDNA), and circulating tumor RNA (ctRNA), not only facilitate disease diagnosis and the selection of targeted therapies but also enable the detection of minimal residual disease (MRD) and the monitoring of tumor recurrence (Jahangiri, 2024). Beyond peripheral blood, urine-based biomarkers have also shown great potential in the early diagnosis of LUAD (Liu et al., 2024). Although emerging sequencing technologies and methylation detection have improved the sensitivity and specificity of DNA analysis (Ohyama et al., 2024; Chen & Er Saw, 2024; Gonzalez et al., 2024), the aforementioned diagnostic approaches still suffer from limitations such as high invasiveness and difficulties in dynamic monitoring. Therefore, there is an urgent need to identify more reliable biomarkers for predicting the prognosis of LUAD patients.
Mounting evidence has shown that mitochondria play a crucial role in the entire process of tumor development, including cell growth, apoptosis, and metabolism (Kroemer & Pouyssegur, 2008; Burke, 2017; Porporato et al., 2018; Missiroli et al., 2020; Liu et al., 2023; Alberghina, 2023). Mitochondria are the powerhouses of the cell, responsible for energy production through ATP synthesis, and generation of ROS, calcium homeostasis, and apoptosis regulation (Willems et al., 2015; Bock & Tait, 2020; Garbincius & Elrod, 2022). Dysfunction of mitochondria has been associated with various cancers, including LUAD. For example, mtDNA mutations can lead to abnormal energy metabolism, remodeling tumor microenvironment and promoting tumor growth and metastasis (Taylor & Turnbull, 2005; Smith, Whitehall & Greaves, 2022). Moreover, mitochondrial dysfunction contributes to chemoresistance in LUAD (Guaragnella, Giannattasio & Moro, 2014; Xie et al., 2021). Released mtDNA can act as damage-associated molecular patterns (DAMPs), activating innate immune receptors and stimulating antitumor immune responses (Bao et al., 2019; Cheng et al., 2020; Li et al., 2023b). Thus, targeting mitochondria has emerged as a potential therapeutic strategy for LUAD.
Current prognostic models for LUAD primarily rely on clinical parameters, which fail to capture the molecular heterogeneity and complexity of the disease. The integration of molecular signatures related to mitochondria and immune interactions holds great potential to improve prognostication accuracy and guide personalized treatment decisions. We analyzed RNA-seq data from the TCGA cohort (n = 550) and identified 3,358 DEGs, intersecting with MitoCarta 3.0 mitochondrial-related genes (n = 1,136) to obtain 71 mitochondrial-associated DEGs. Through univariate Cox, LASSO regression, and multivariate Cox analyses, a prognostic signature with three core genes was developed: SFXN1, CPS1, and MTFR2.
MTFR2 is a protein-coding gene involved in aerobic respiration and mitochondrial fission. It is overexpressed in several cancers, including gastric cancer, oral squamous cell carcinoma, and hepatocellular carcinoma (Zhu et al., 2021; Lai et al., 2024). MTFR2 forms an immunosuppressive microenvironment and is linked to poor prognosis. In hepatocellular carcinoma, MTFR2 redirects the energy metabolism of tumor cells from oxidative phosphorylation (OXPHOS) to aerobic glycolysis. This process leads to massive accumulation of lactic acid in the tumor microenvironment (TME), accompanied by a significant reduction in extracellular pH, thereby creating an acidic microenvironment. The acidic condition directly impairs the proliferation, cytotoxicity, and cytokine-secreting capacity of effector T cells, while simultaneously promoting the infiltration of regulatory T cells and enhancing their immunosuppressive functions. However, its role and mechanisms in LUAD remain unclear (Zhang et al., 2024a). CPS1 is overexpressed in certain cancers, such as LUAD with LKB1 inactivation. While mediating ammonia detoxification, CPS1 directs nitrogen resources toward DNA synthesis, thereby endowing cancer cells with a proliferative advantage (Kim et al., 2017). In contrast, effector T cells lack CPS1, which prevents them from competing effectively for pyrimidine resources, ultimately impairing their proliferation and cytotoxic functions. These highlight CPS1 as a potential therapeutic target and prognostic biomarker (Chen et al., 2024). SFXN1 is a mitochondrial serine transporter involved in one-carbon metabolism. SFXN1 is upregulated in LUAD and associated with poor prognosis. SFXN1 knockdown significantly reduced cell proliferation and migration, potentially through the inhibition of ERK phosphorylation and CCL20 expression (Li et al., 2024). Targeting SFXN1 reduced the infiltration of Foxp3+ Tregs and inhibited tumor growth, suggesting that SFXN1 may serve as a potential therapeutic target in LUAD (Dang et al., 2022). Transcriptomic validation and immunohistochemical analysis confirmed their overexpression in LUAD tissues. CPS1 silencing induced mitochondrial fission, reduced membrane potential, elevated ROS, and enhanced mtDNA extrusion. SFXN1 depletion promoted elongated mitochondria with hyperpolarization and ROS suppression. MTFR2 knockdown increased fusion, ΔΨm and ROS accumulation. Our results provided mechanistic insights into how these genes influence mitochondrial morphology, function, and mtDNA dynamics in LUAD cells.
Nevertheless, it is imperative to recognize certain limitations in the present study. This study investigated the changes in mitochondrial dynamics, ΔΨm and ROS levels in LUAD cell lines following siRNA-mediated knockdown of SFXN1, CPS1, and MTFR2 genes, with comparisons made to negative control groups. However, rescue experiments were not performed to conversely validate that the observed alterations in mitochondrial function and cellular phenotypic changes were specifically induced by gene silencing. RNA sequencing, when compared to real-world data, demonstrates inadequate universality. Therefore, we should augment our analytical scope to incorporate single-cell sequencing and bulk sequencing to measure transcript levels within each individual cell of a sample. These allow a representation of expression profiles in specific subpopulations of cells and provides a new opportunity to probe cancer biology in a high-resolution and dynamic manner (Nojima, Yao & Suzuki, 2025). Furthermore, the paucity of real-world data and over-reliance on public datasets may introduce biases. Notably, batch effects inherent in TCGA and GEO datasets could also lead to potential deviations in the study outcomes. The precise molecular mechanisms governing the interactions between these genes and immune cells in the TME have not yet been clarified. Ultimately, the clinical applicability of our model necessitates additional validation in patient-derived xenograft models and prospective clinical cohorts (Kang et al., 2024; Lee et al., 2024).
Conclusions
Our study found MTR genes SFXN1, CPS1, and MTFR2 play a critical pro-tumor role in LUAD prognosis and TME shaping. These genes link to immunosuppressive TME and poor survival, while their knockdown inhibits LUAD by disrupting mitochondrial homeostasis and impairing mtDNA integrity. The developed MTR risk model and nomogram offer promising tools for patient stratification and guide individualized treatment strategies. Further deciphering the complex interplay between mitochondrial function and tumor-immune is meaningful.
Supplemental Information
TCGA clinical data for LUAD patients.
RNA-seq data and the clinical information of LUAD samples are available at The Cancer Genome Atlas (https://portal.gdc.cancer.gov), and the hub genes and risk score (https://www.ncbi.nlm.nih.gov/geo).
Mitochondrial genes data (mitochondrial genes expression profile).
The list of mitochondrial related genes was collected from MitoCarta3.0 database (https://www.broadinstitute.org/mitocarta/mitocarta30-inventory-mammalian-mitochondrial-proteins-andpathways).
Supplemental File S4 with quantitative data.
Quantitative qPCR and Flow Cytometry data are available in the Supplemental File S4 with quantitative data.
Original data of qPCR.
an independent PDF version of Forest Plots in Fig. 2C.
W. have additionally provided an independent PDF version of Forest Plots in Fig. 2, which has been uploaded along with the revised manuscript. The PDF format supports high-definition zooming, allowing you to view the graphic details and data information more carefully.
an independent PDF version of Forest Plots in Fig. 2F.
W. have additionally provided an independent PDF version of Forest Plots in Fig. 2, which has been uploaded along with the revised manuscript. The PDF format supports high-definition zooming, allowing you to view the graphic details and data information more carefully.