
Comparison of the clinical usefulness of CXCL-8 and common clinical tumor markers for esophageal cancer diagnosis
- Published
- Accepted
- Received
- Academic Editor
- Vladimir Uversky
- Subject Areas
- Biochemistry, Cell Biology, Oncology, Surgery and Surgical Specialties
- Keywords
- Esophagus cancer, CXCL-8, Biomarker, Chemokines
- Copyright
- © 2025 Lu et al.
- Licence
- This is an open access article distributed under the terms of the Creative Commons Attribution License, which permits using, remixing, and building upon the work non-commercially, as long as it is properly attributed. For attribution, the original author(s), title, publication source (PeerJ) and either DOI or URL of the article must be cited.
- Cite this article
- 2025. Comparison of the clinical usefulness of CXCL-8 and common clinical tumor markers for esophageal cancer diagnosis. PeerJ 13:e20079 https://doi.org/10.7717/peerj.20079
Abstract
Background
This study aimed to investigate serum CXC motif chemokine ligand 8 (CXCL-8) as a potential biomarker for diagnosing esophageal cancer (EC).
Methods
Patients diagnosed with EC (n = 141) were enrolled at the Department of Thoracic Surgery, Fujian Medical University Union Hospital, from July through December 2023. Sixty cases were early esophageal cancer (EEC), whereas 81 were advanced (AEC) based on diagnostic criteria. Healthy volunteers (n = 75) were recruited as controls. Serum CXCL-8 levels were quantified using an enzyme-linked immunosorbent assay. Levels of carcinoembryonic antigen (CEA), cytokeratin 19 fragment (Cyfra211), and squamous cell carcinoma antigen (SCC) were assessed using a chemiluminescent microparticle immunoassay. Clinical and pathological attributes of patients with EC were documented and analyzed. Diagnostic efficacies of CXCL-8, CEA, Cyfra211, and SCC for EC were evaluated using receiver operating characteristic (ROC) curves.
Results
Serum concentrations of CXCL-8, CEA, Cyfra211, and SCC were significantly higher in patients with EC than in controls (P < 0.05). In the EC group, areas under the curves (AUCs) for CXCL-8, CEA, Cyfra211, and SCC were 0.906, 0.707, 0.705, and 0.797, respectively. The combined application of CXCL-8+CEA, CXCL-8+Cyfra211, and CXCL-8+SCC yielded AUCs of 0.931, 0.940, and 0.950, respectively, and was significantly higher than that of the combination of CEA+Cyfra211+SCC (0.854). In EEC, the diagnostic performance of CXCL-8 was similar to that in the EC group. The sensitivity of CXCL-8 was greater than that of CEA, Cyfra211, and SCC alone, and the combination of the three markers (P < 0.05).
Conclusions
CXCL-8 could be used to distinguish patients with EC from healthy controls, including EEC.
Introduction
Esophageal cancer (EC) is the ninth most prevalent malignancy globally and the sixth leading cause of cancer-related mortality (Sung et al., 2021). As of 2020, the incidence of EC has reached 604,000 new cases worldwide, culminating in 544,000 deaths, with approximately half of the fatalities recorded in China. Despite a notable increase in the survival rate from 20.9% to 30.3% over the preceding decade (Zeng et al., 2018), a significant proportion of EC cases evade early symptomatic detection, often manifesting in advanced stages upon diagnosis, thereby leading to diagnosis at an advanced stage and consequently poor prognosis (Orringer et al., 2007). However, early detection and timely intervention, however, are associated with significantly improved survival rates and reduced mortality (Freeman & Chu, 2005). Currently, endoscopy serves as the primary diagnostic modality for EC, but its widespread use is limited by several drawbacks, including high cost, invasiveness, the need for highly trained personnel, and a considerable rate of missed diagnoses (Lundell, 2010; Vantanasiri et al., 2024). Accordingly, the development of non-invasive approaches, particularly the use of body fluid samples for early tumor biomarker screening, has emerged as a key focus of ongoing clinical research. Although carcinoembryonic antigen (CEA) and squamous cell carcinoma antigen (SCC-Ag) are currently used in clinical settings for EC diagnosis and prognostic tracking, their sensitivity and specificity fall short of ideal values (Kosugi et al., 2004; Vallbohmer & Lenz, 2006). Moreover, the Guidelines for the Diagnosis and Treatment of Esophageal Cancer (2022) underscore the imperative of clinically establishing specific serum tumor markers for esophageal squamous cell carcinoma (ESCC) (National Health Commission of the People’s Republic of China, 2022). Accordingly, the identification of highly sensitive and specific biomarkers for the early diagnosis of early esophageal cancer (EEC) has become a critical objective in current clinical research efforts.
Chemokines, characterized as small-molecule cytokines or signaling proteins, are secreted by cells and categorized into four major subfamilies: CC, CXC, XC, and CX3C. CXCL-8, also known as interleukin-8 (IL-8), falls to the CXC subfamily (Lei et al., 2023). Elevated levels of CXCL-8 have been reported in a range of malignancies, including breast cancer, colorectal cancer, non-small cell lung cancer, gastric cancer and melanoma (Hosono et al., 2017). Recent studies have further elucidated the role of CXCL-8 in esophageal cancer. For example, CXCL-8 derived from tumor-associated macrophages (TAMs) has been shown to promote the migration and invasion of ESCC cells (Hosono et al., 2017). In addition, the clinical significance of the CXCL-8/CXCR-2 axis in ESCC has been highlighted, with elevated CXCL-8 expression correlating with lymph node metastasis and poor prognosis (Hosono et al., 2017; Lukaszewicz-Zajac, Paczek & Mroczko, 2020). Previous investigations conducted by our research team identified serum CXCL-8 as a potential biomarker for the diagnosis and prognosis of colorectal cancer (CRC) (Zhengyuan et al., 2022). This prompted us to explore the possibility of using CXCL-8 as a candidate biomarker for tumors affecting other segments of the digestive tract, such as esophageal malignancies. Currently, there is a paucity of clinical studies evaluating CXCL-8 as a biomarker for the diagnosis and progression assessment of EC. The objective of this study was to assess the potential of CXCL-8 as a biomarker for the early diagnosis and prognostic evaluation of EC.
Methods
Study participants
This study included 141 patients with EC (115 men and 26 women; median age (interquartile range): 62 (39–87) years) who were admitted to the Department of Thoracic Surgery at Fujian Medical University Union Hospital (Fuzhou, China) between July 1 and December 31, 2023 and met the diagnostic criteria. EEC refers to cancer limited to the mucosal and submucosal layers, regardless of its size or the presence of lymph node metastasis. In accordance with the specified guideline parameters, the EEC cohort consisted of 60 individuals, comprising 10 females and 50 males, with a median age of 59 years and an interquartile range of 39–79 years. The control group comprised 75 healthy volunteers, including 22 females and 53 males, with a median age of 58 years and an interquartile range of 38–87 years. Clinicopathological data of patients with EC were recorded, including tumor location, tumor size, tumor differentiation, tumor, node, metastasis (TNM) staging according to the American Joint Committee on Cancer classification guidelines (Edge & Compton, 2010), and nerve and vascular invasion. Among the enrolled patients in our study, the majority were diagnosed with esophageal squamous cell carcinoma (SCC). Specifically, all but 10 patients had SCC; these 10 cases represented other histological subtypes, including adenocarcinoma and rare pathological variants. Participants were excluded if they met any of the following criteria: incomplete or missing clinical data; immunodeficiency; mental illness; pregnancy; hematologic disorders; chronic liver or kidney disease; autoimmune diseases; long-term corticosteroid therapy; or significant concurrent infections involving other organs. The study protocol was approved by the Institutional Review Board of Fujian Medical University Union Hospital (FJMUUH), and all participants provided written informed consent before undergoing the procedures. This study was reviewed and approved by the local Ethics Committee of Fujian Medical University Union Hospital with the approval number: No. 2023KY260, dated December 31st, 2023, which waived the requirement for informed consent.
Detection of CXCL-8, CEA, cytokeratin 19 fragment (Cyfra211), and SCC in serum
Venous blood samples (5 mL) were collected from all participants before any medical intervention. The blood samples were centrifuged at 3,000 rpm for 10 min to separate the serum, which was stored frozen at −80 °C until assessment. The serum CXCL-8 concentration was determined via an enzyme-linked immunosorbent assay (ELISA) kit (Quantikine ELISA Human CXCL-8/IL-8 Immunoassay, Abingdon, R&D Systems, UK) in accordance with the manufacturer’s instructions. Serum levels of CEA, Cyfra211, and SCC were measured by CMIA (chemiluminescent microparticle immunoassay) on a Cobas6000 analyzer (Roche Diagnostics, Mannheim, Germany) following the manufacturer’s instructions. The established reference cut-off values were as follows: 5.0 ng/mL for CEA, 3.30 ng/mL for Cyfra211, and 1.5 ug/L for SCC.
Statistical analysis
Statistical analyses were performed using GraphPad Prism (version 5.0; GraphPad Software Inc., San Diego, CA, USA) and SPSS (version 21.0; IBM, Armonk, NY, USA). The data distribution for the markers CXCL8, CEA, Cyfra211, and SCC in the groups of patients with EC or EEC and in the control group deviated from normal according to the Shapiro-Wilk test. Therefore, a nonparametric statistical analysis was performed. The Mann-Whitney U test was used to compare two groups, whereas the Kruskal-Wallis test was used to compare three or more groups. Receiver operating characteristic (ROC) curves were constructed to assess the diagnostic characteristics of CXCL-8, CEA, Cyfra211, and SCC. The Youden index guided the determination of optimal cut-off values for distinguishing between the healthy control group and patients, whereas binary logistic regression facilitated the combined analysis. Logistic regression was used to evaluate the relationship between variables and EC occurrence. Spearman’s rank method was used to ascertain the correlation between serum CXCL-8, CEA, Cyfra211, and SCC concentrations and clinicopathological features. Statistical significance was defined as P < 0.05.
Results
Comparison of serum concentrations of CXCL-8, CEA, Cyfra211, and SCC between EC patients and healthy controls
The concentrations of CXCL-8, CEA, Cyfra211, and SCC in the serum of patients with EEC and EC were significantly elevated compared to those in the healthy controls (P < 0.01, Figs. 1–4). This observation indicates a prominent association between these markers and the presence of EC.
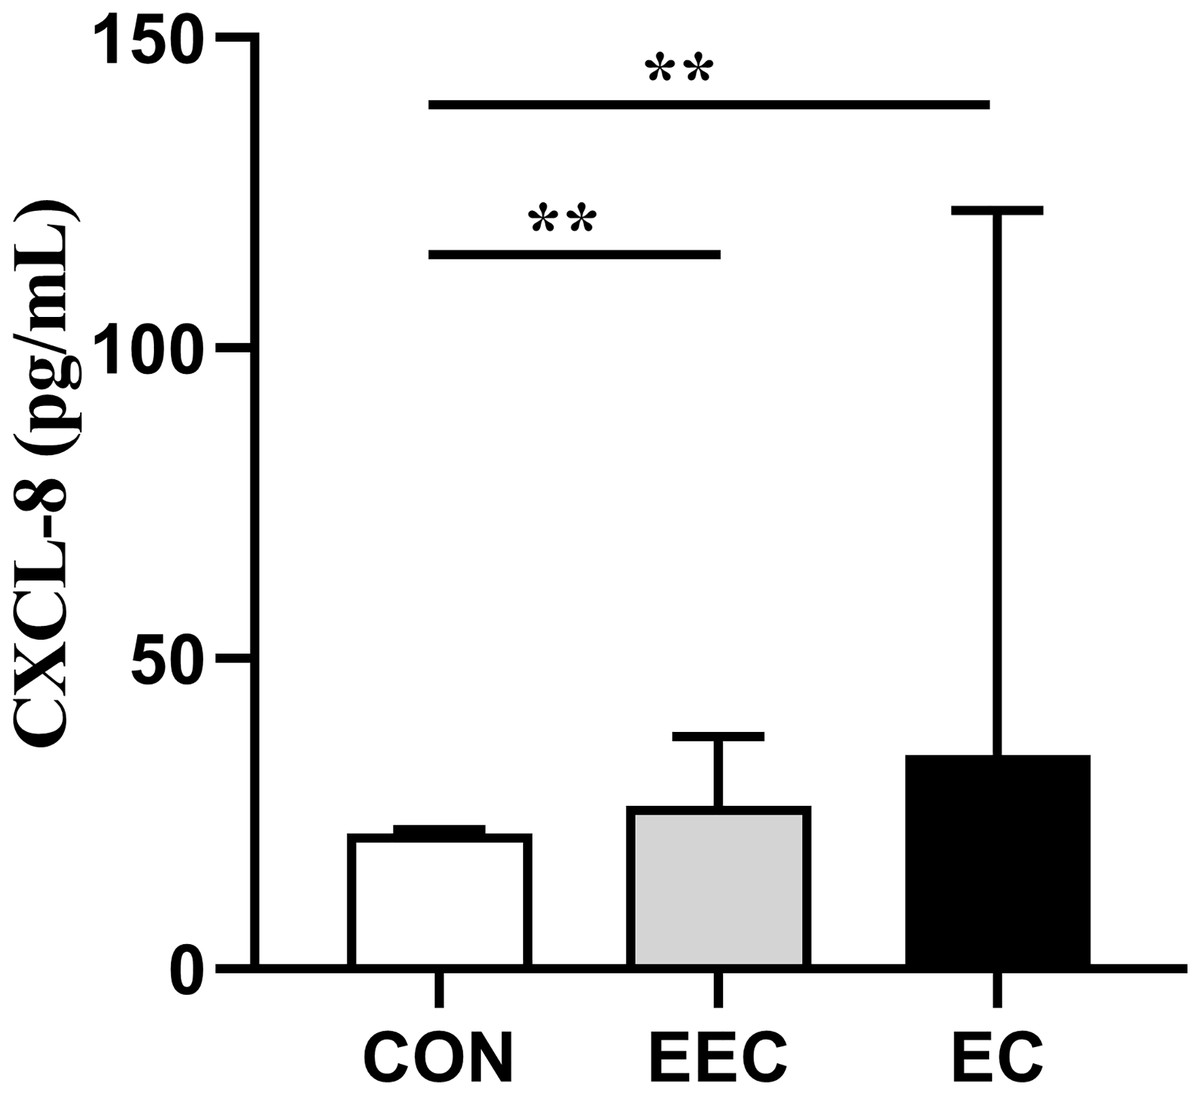
Figure 1: Serum concentrations of CXCL-8 in patients with esophageal cancer (EC; n = 141), early esophageal cancer (EEC; n = 60), and healthy controls (CON; n = 75).
Data are presented as median with interquartile range. Asterisks (**) indicate P < 0.01 compared to the control group.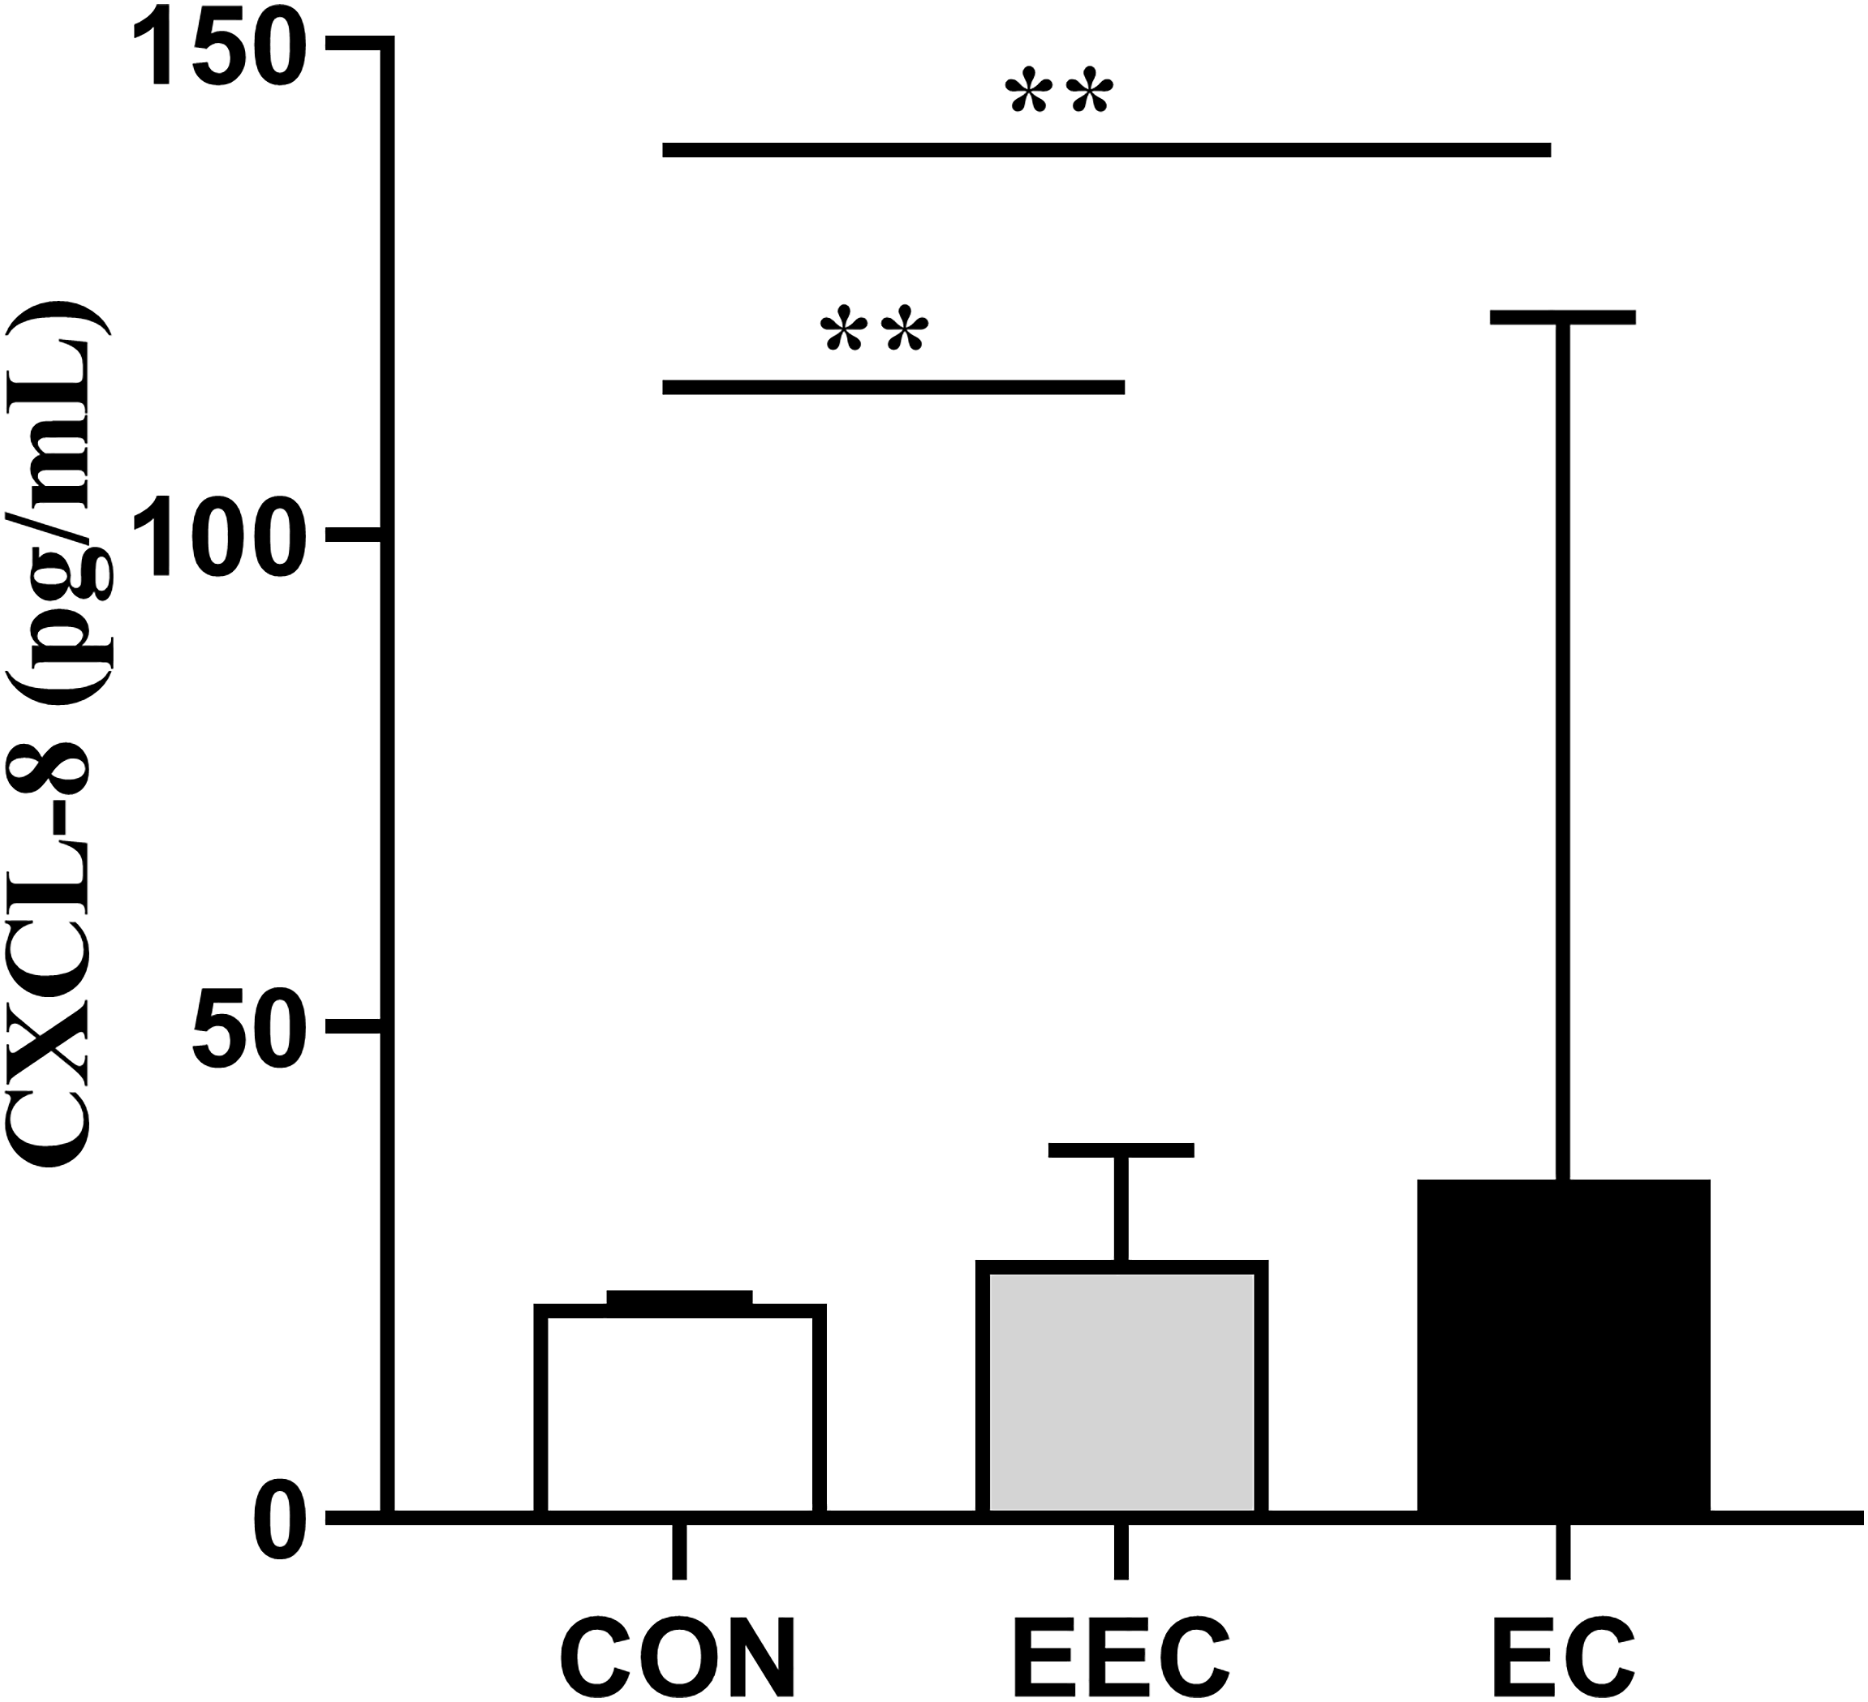
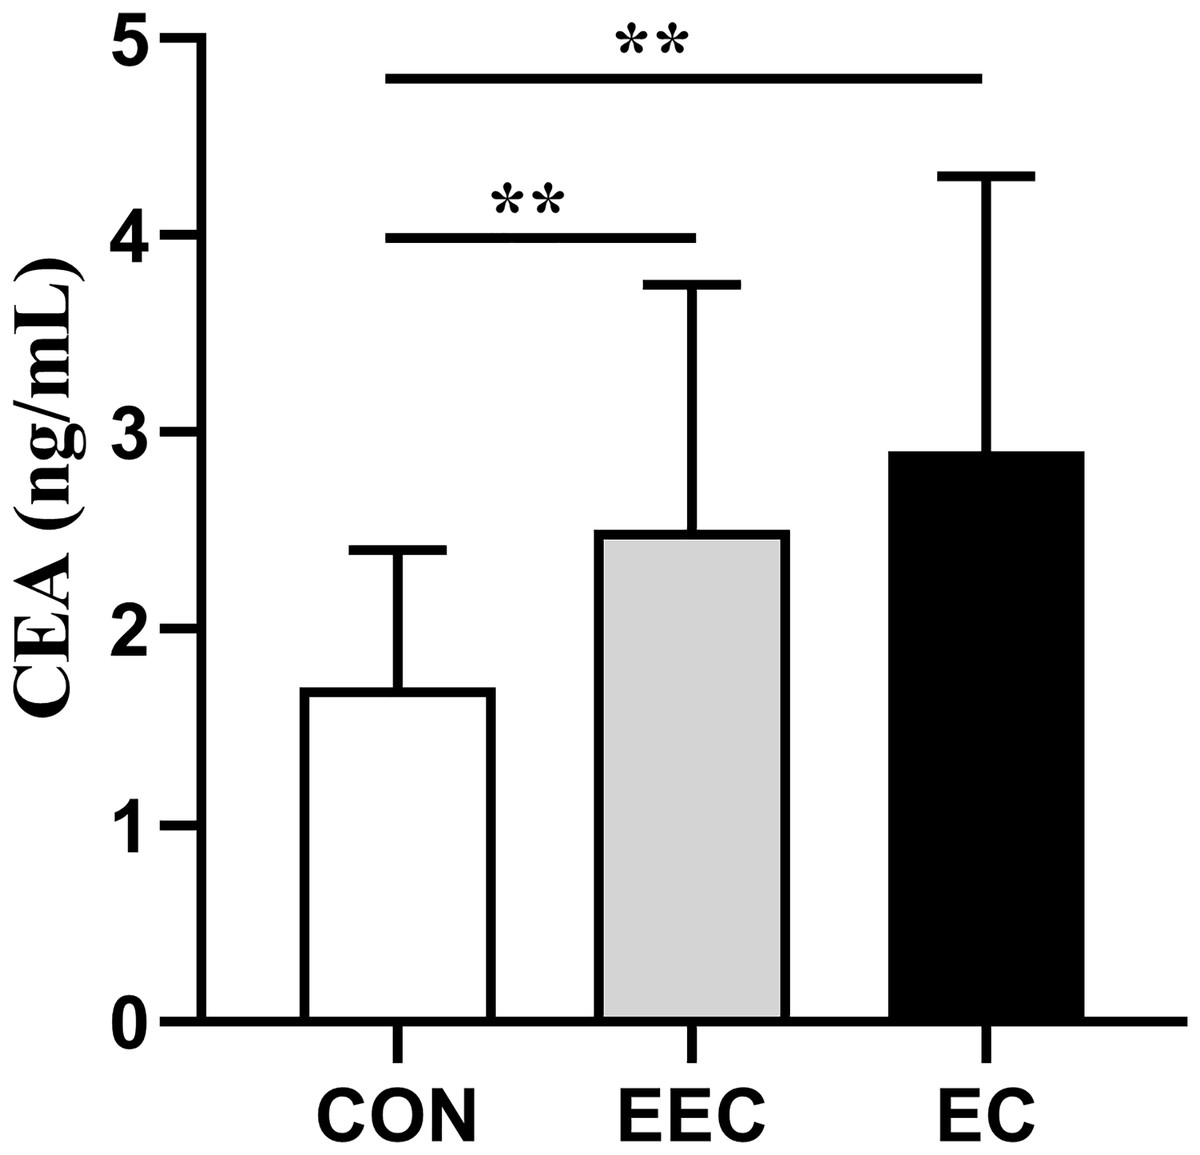
Figure 2: Serum concentrations of CEA in patients with esophageal cancer (EC; n = 141), early esophageal cancer (EEC; n = 60), and healthy controls (CON; n = 75).
Data are presented as median with interquartile range. Asterisks (**) indicate P < 0.01 compared to the control group.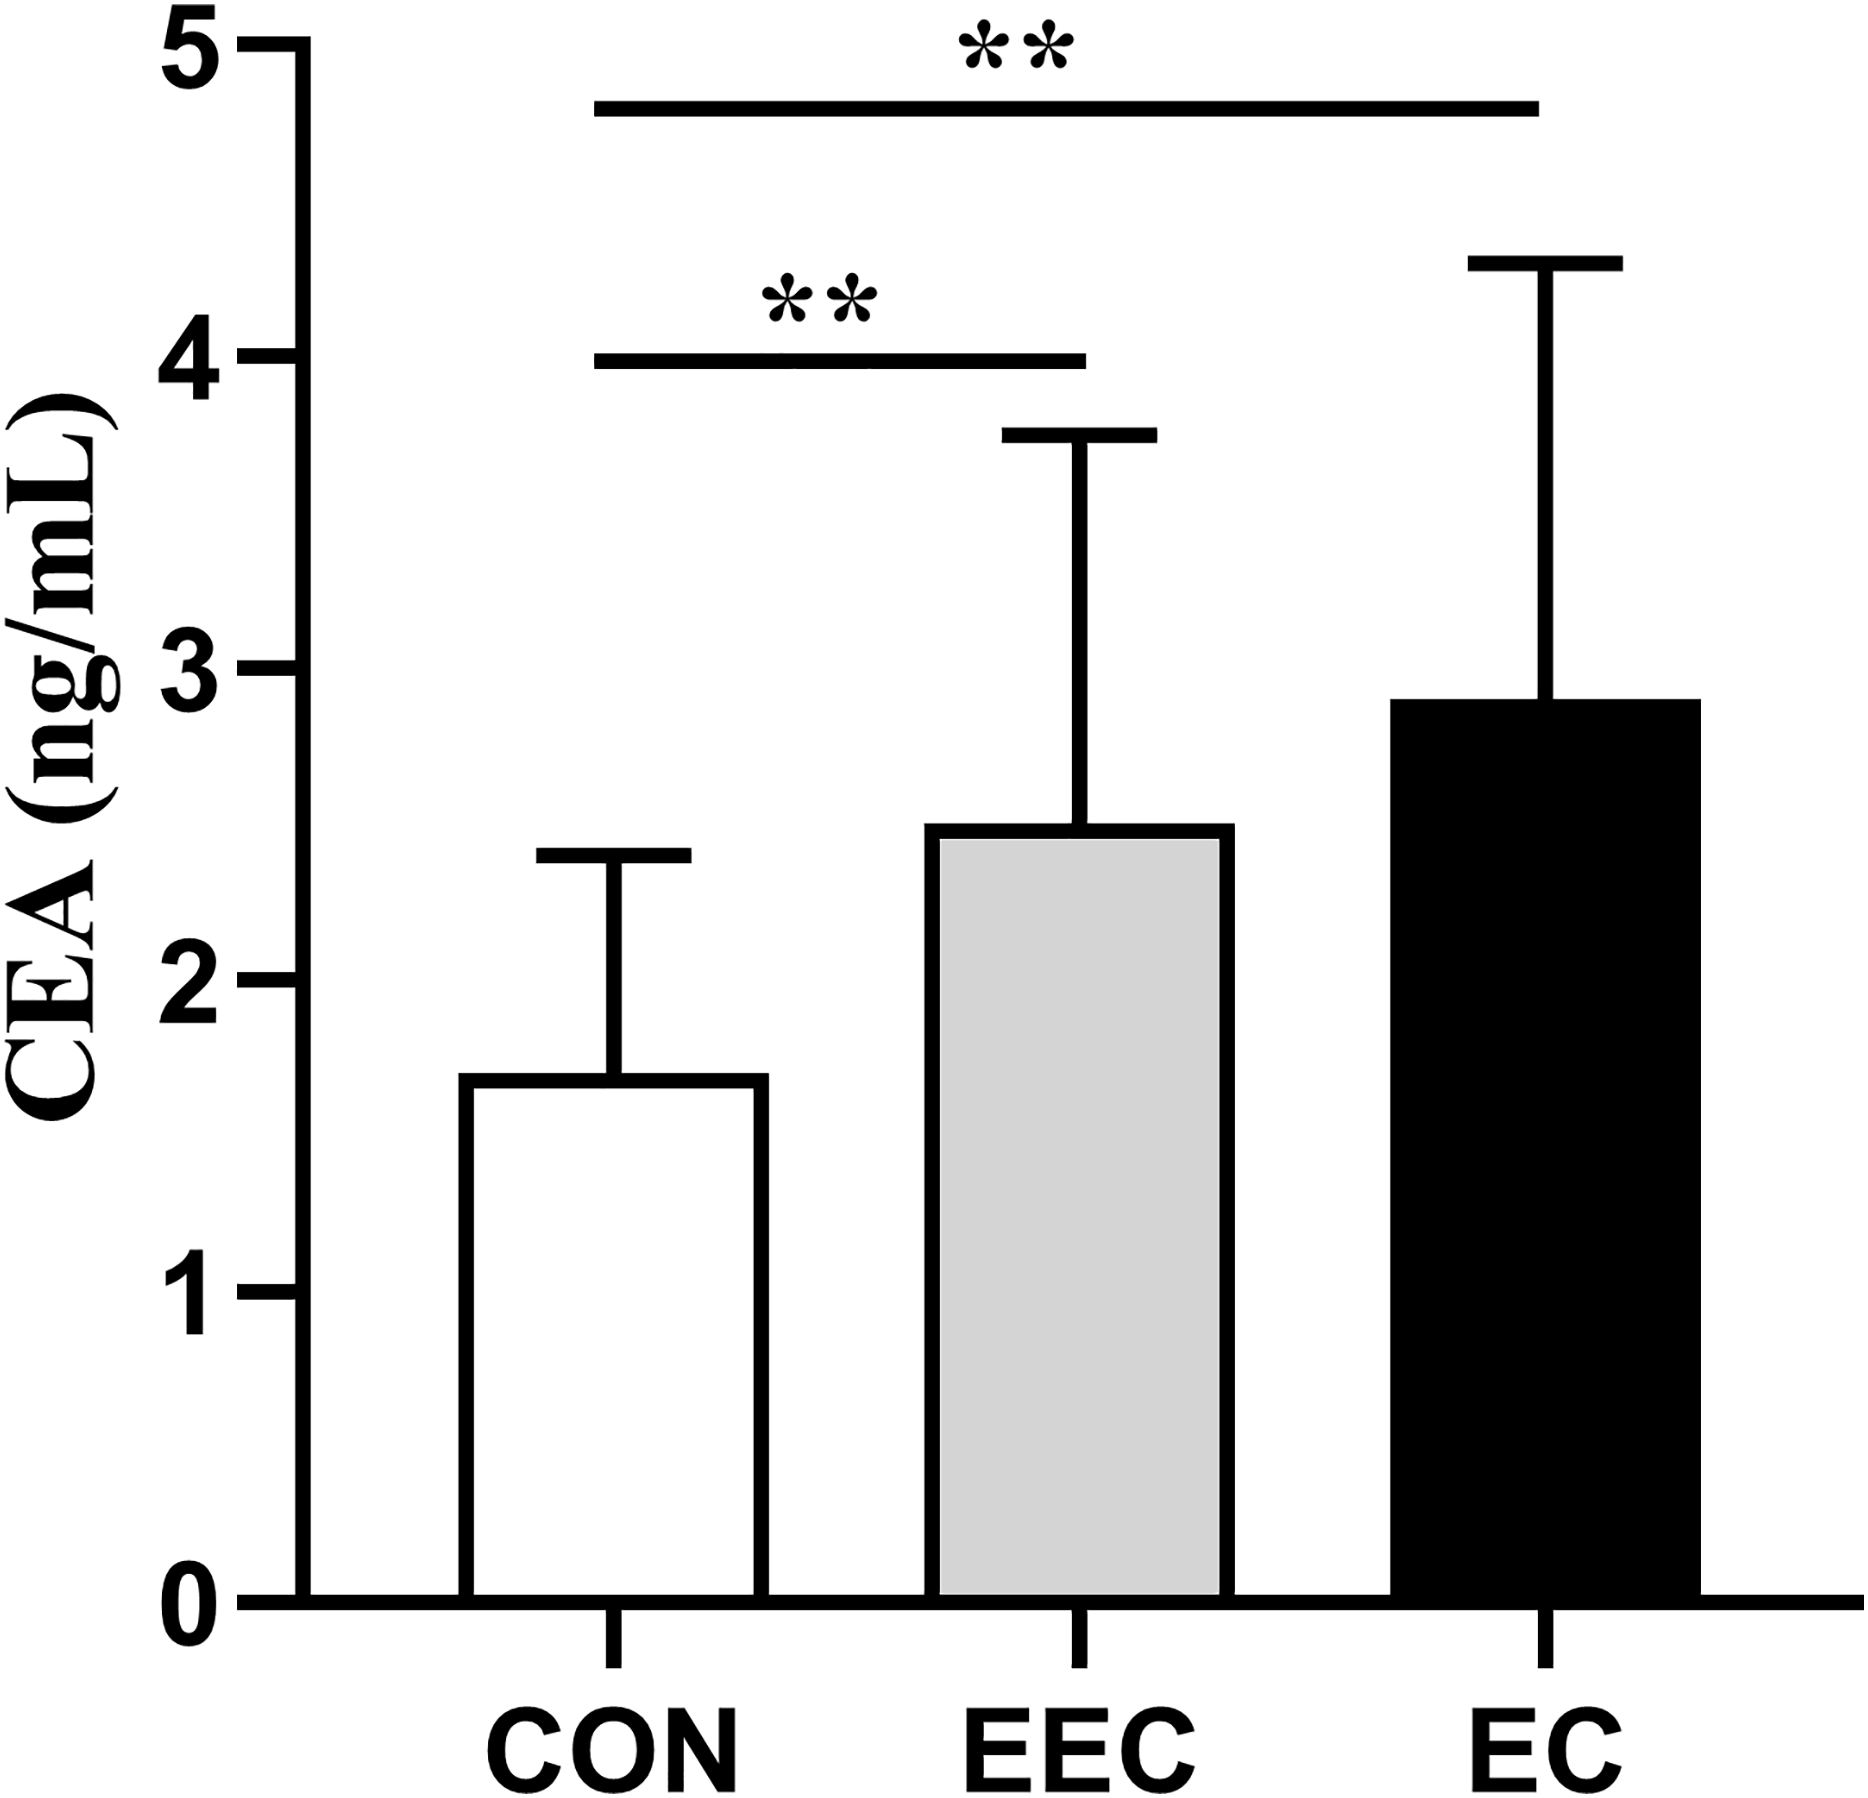
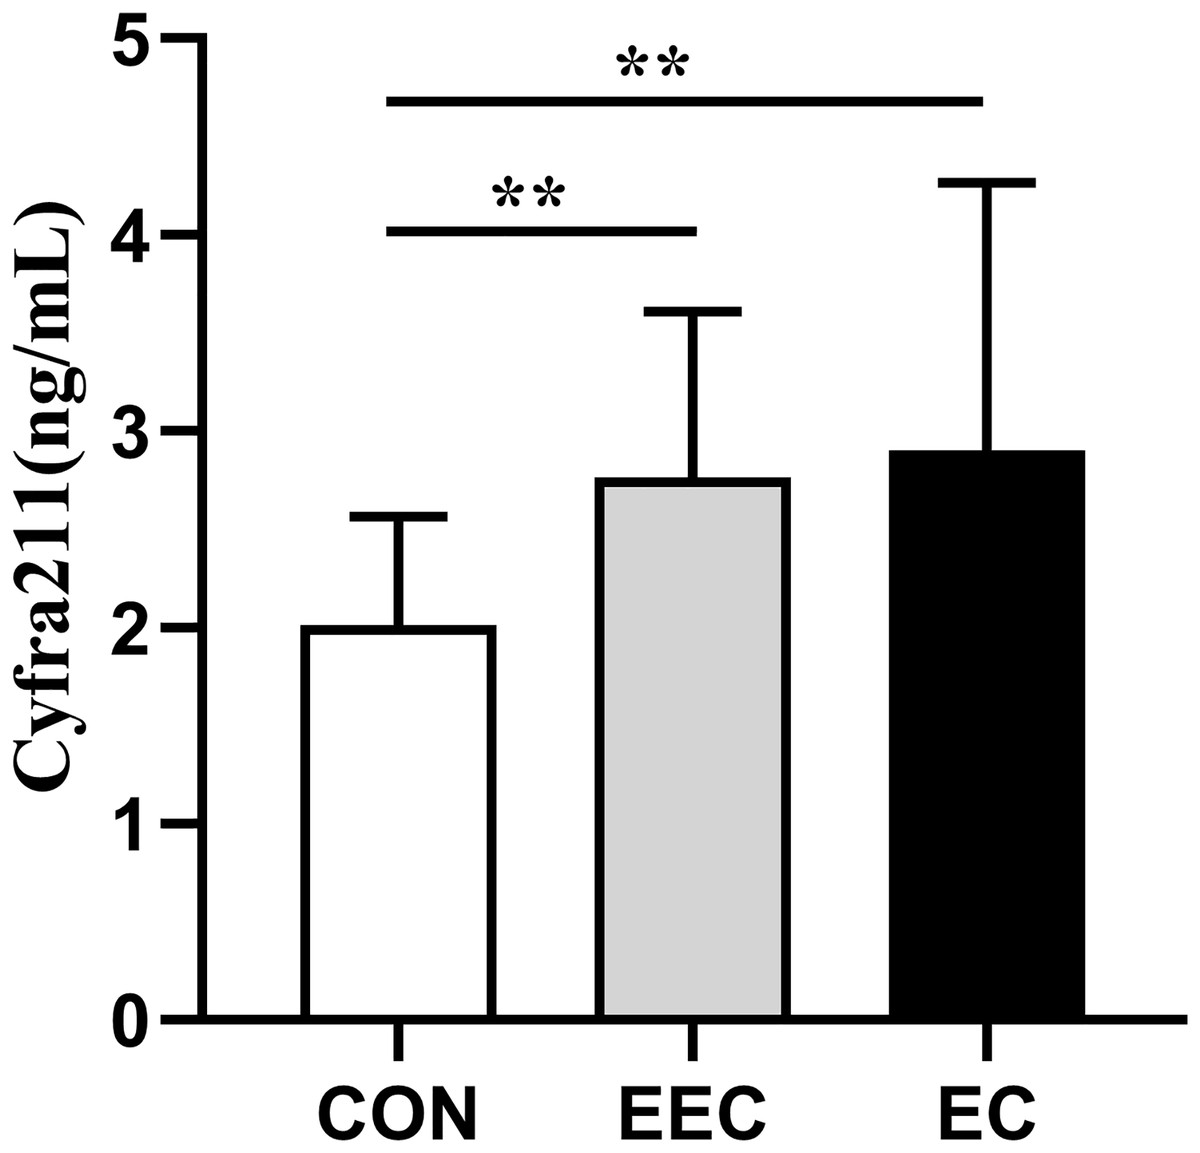
Figure 3: Serum concentrations of Cyfra211 in patients with esophageal cancer (EC; n = 141), early esophageal cancer (EEC; n = 60), and healthy controls (CON; n = 75).
Data are presented as median with interquartile range. Asterisks (**) indicate P < 0.01 compared to the control group.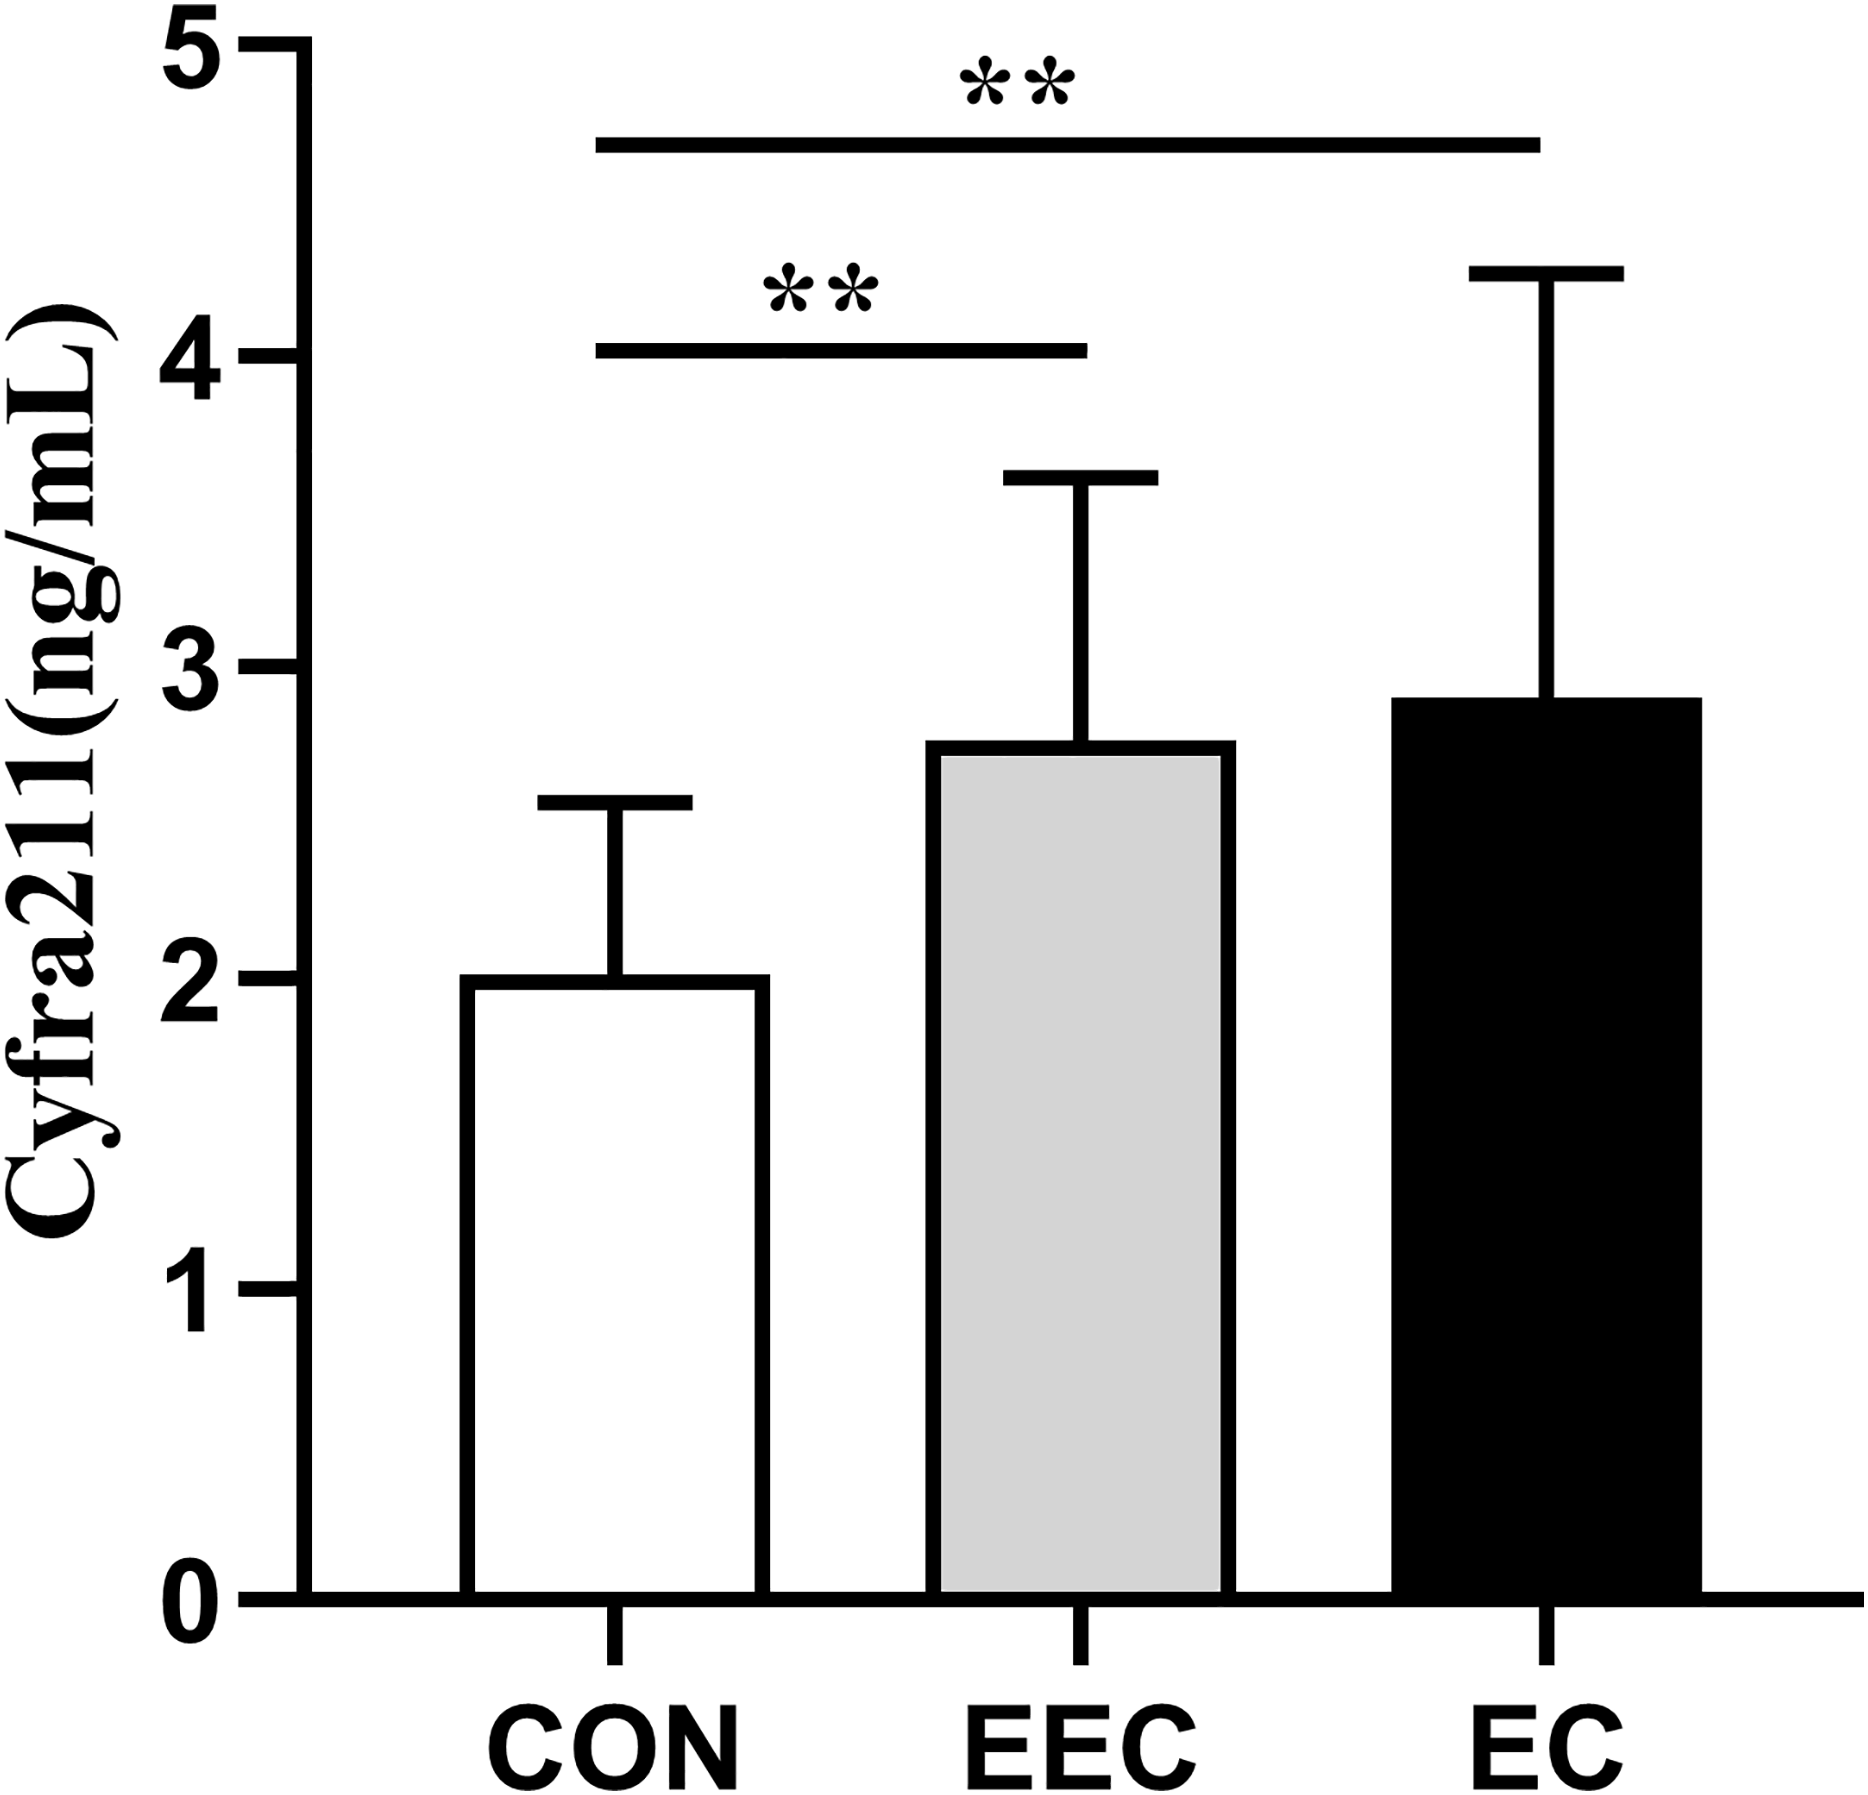
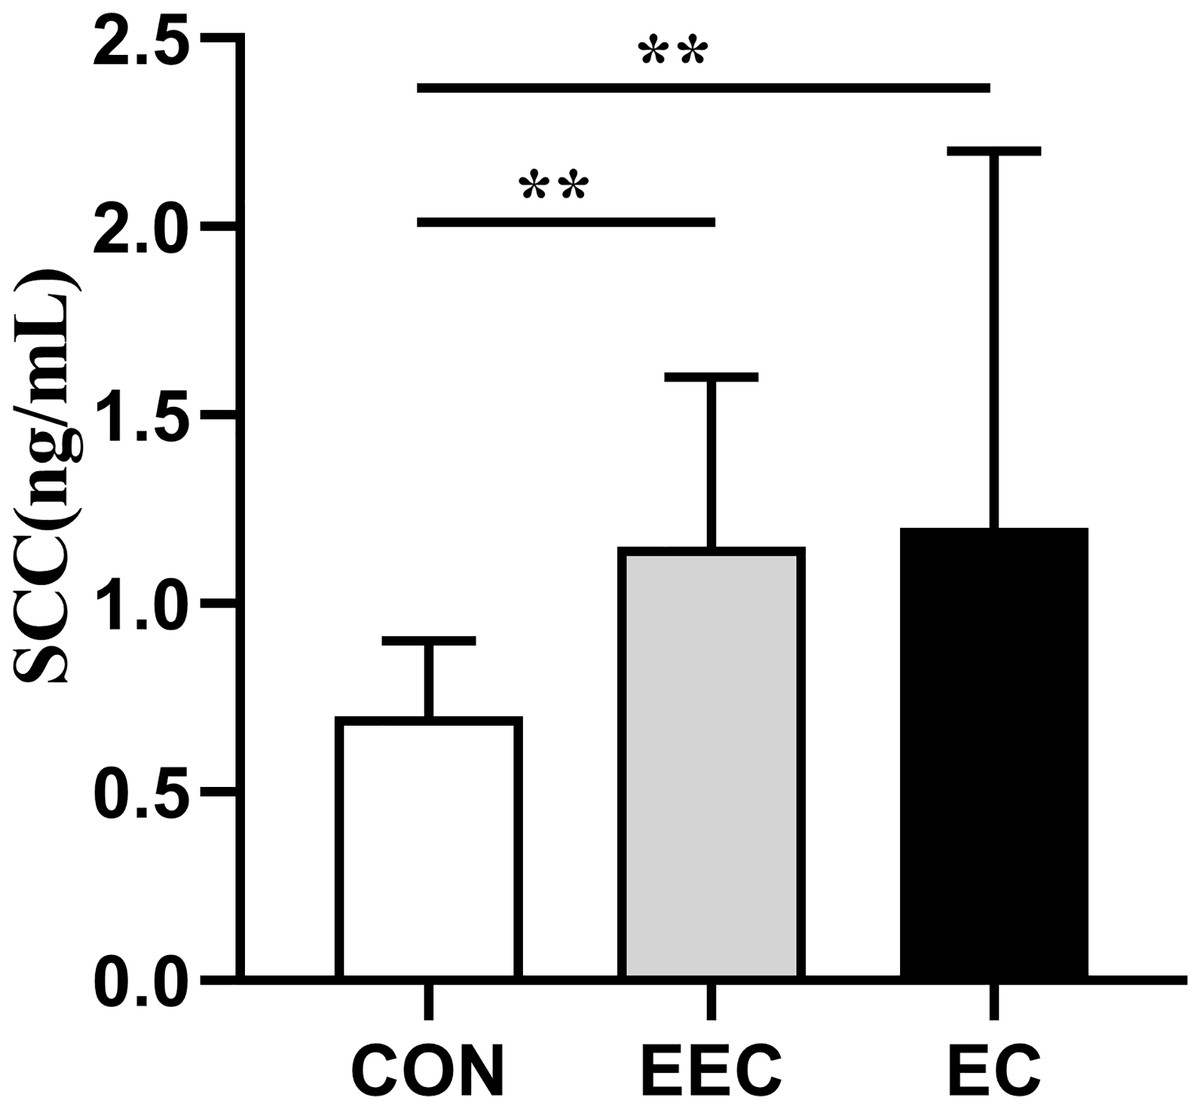
Figure 4: Serum concentrations of SCC in patients with esophageal cancer (EC; n = 141), early esophageal cancer (EEC; n = 60), and healthy controls (CON; n = 75).
Data are presented as median with interquartile range. Asterisks (**) indicate P < 0.01 compared to the control group.
CXCL-8 as a potential biomarker for EC diagnosis
The diagnostic utility of CXCL-8 as an EC biomarker was evaluated and compared with those of CEA, Cyfra211, and SCC, which are the most commonly used serum biomarkers for EC diagnosis. The areas under the ROC curves (AUCs) for CXCL-8, CEA, Cyfra211, and SCC as diagnostic parameters for EC were 0.907, 0.707, 0.705, and 0.797, respectively. Among them, CXCL-8 exhibited the highest AUC. When CXCL-8 was combined with CEA, Cyfra211, or SCC, the AUC values were 0.931, 0.940, and 0.950, respectively, which were significantly higher than those obtained for the combined use of CEA, Cyfra211, and SCC (AUC: 0.854; Table 1 and Fig. 5).
| Variable | Cut-off | AUC | Sensitivity (%) | Specificity (%) | 95% Confidence interval | |
|---|---|---|---|---|---|---|
| Upper limit | Lower limit | |||||
| CXCL-8 | 23.99 | 0.907 | 75.89 | 91.20 | 86.86 | 94.49 |
| CEA | 5.00 | 0.707 | 19.86 | 100 | 63.91 | 77.56 |
| Cyfra211 | 3.30 | 0.705 | 39.01 | 97.33 | 63.80 | 77.25 |
| SCC | 1.50 | 0.797 | 35.46 | 100 | 73.87 | 85.48 |
| CXCL-8+CEA | 0.931 | 80.85 | 96.00 | 89.89 | 96.23 | |
| CXCL-8+Cyfra211 | 0.940 | 83.69 | 98.67 | 90.96 | 96.97 | |
| CXCL-8+SCC | 0.950 | 90.78 | 90.67 | 92.10 | 97.83 | |
| CEA+Cyfra211+SCC | 0.854 | 69.50 | 94.67 | 80.40 | 90.45 | |
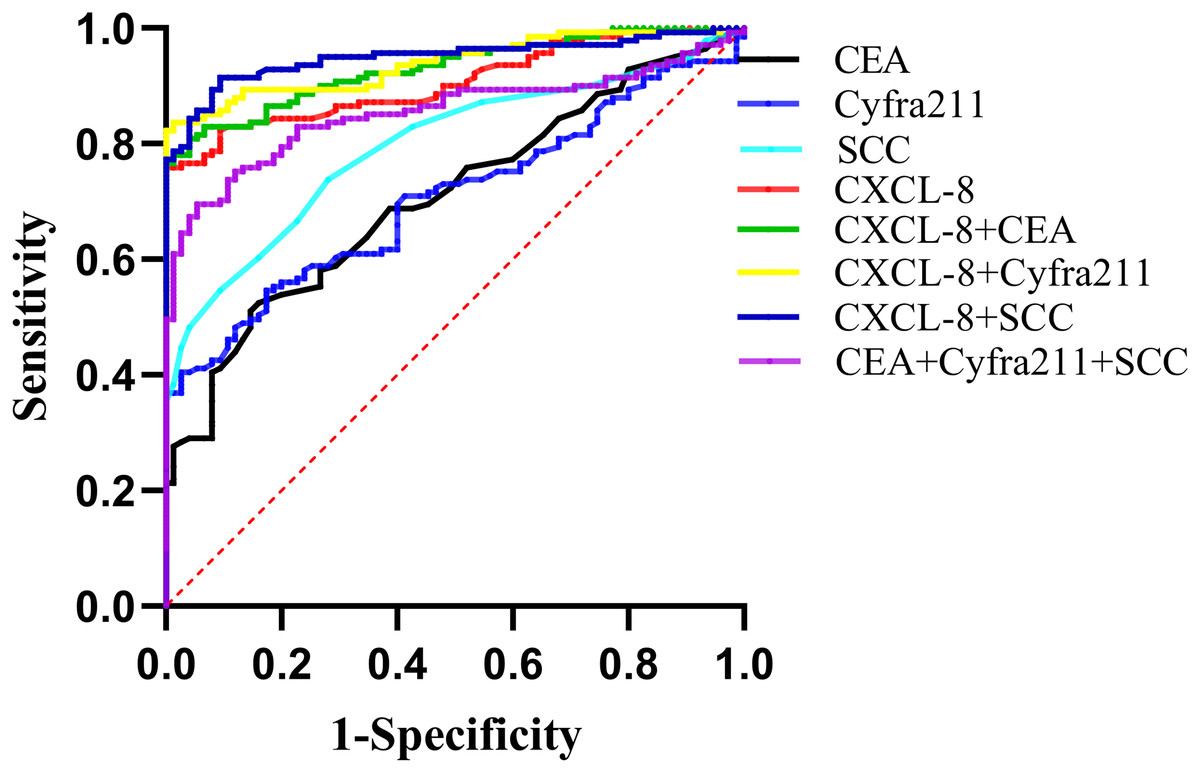
Figure 5: Receiver operating characteristic (ROC) curves illustrating the diagnostic performance of CXCL-8, CEA, Cyfra211, SCC, and their combinations in distinguishing patients with EC from healthy controls.
Areas under the curve (AUCs) and diagnostic parameters are provided in Table 1.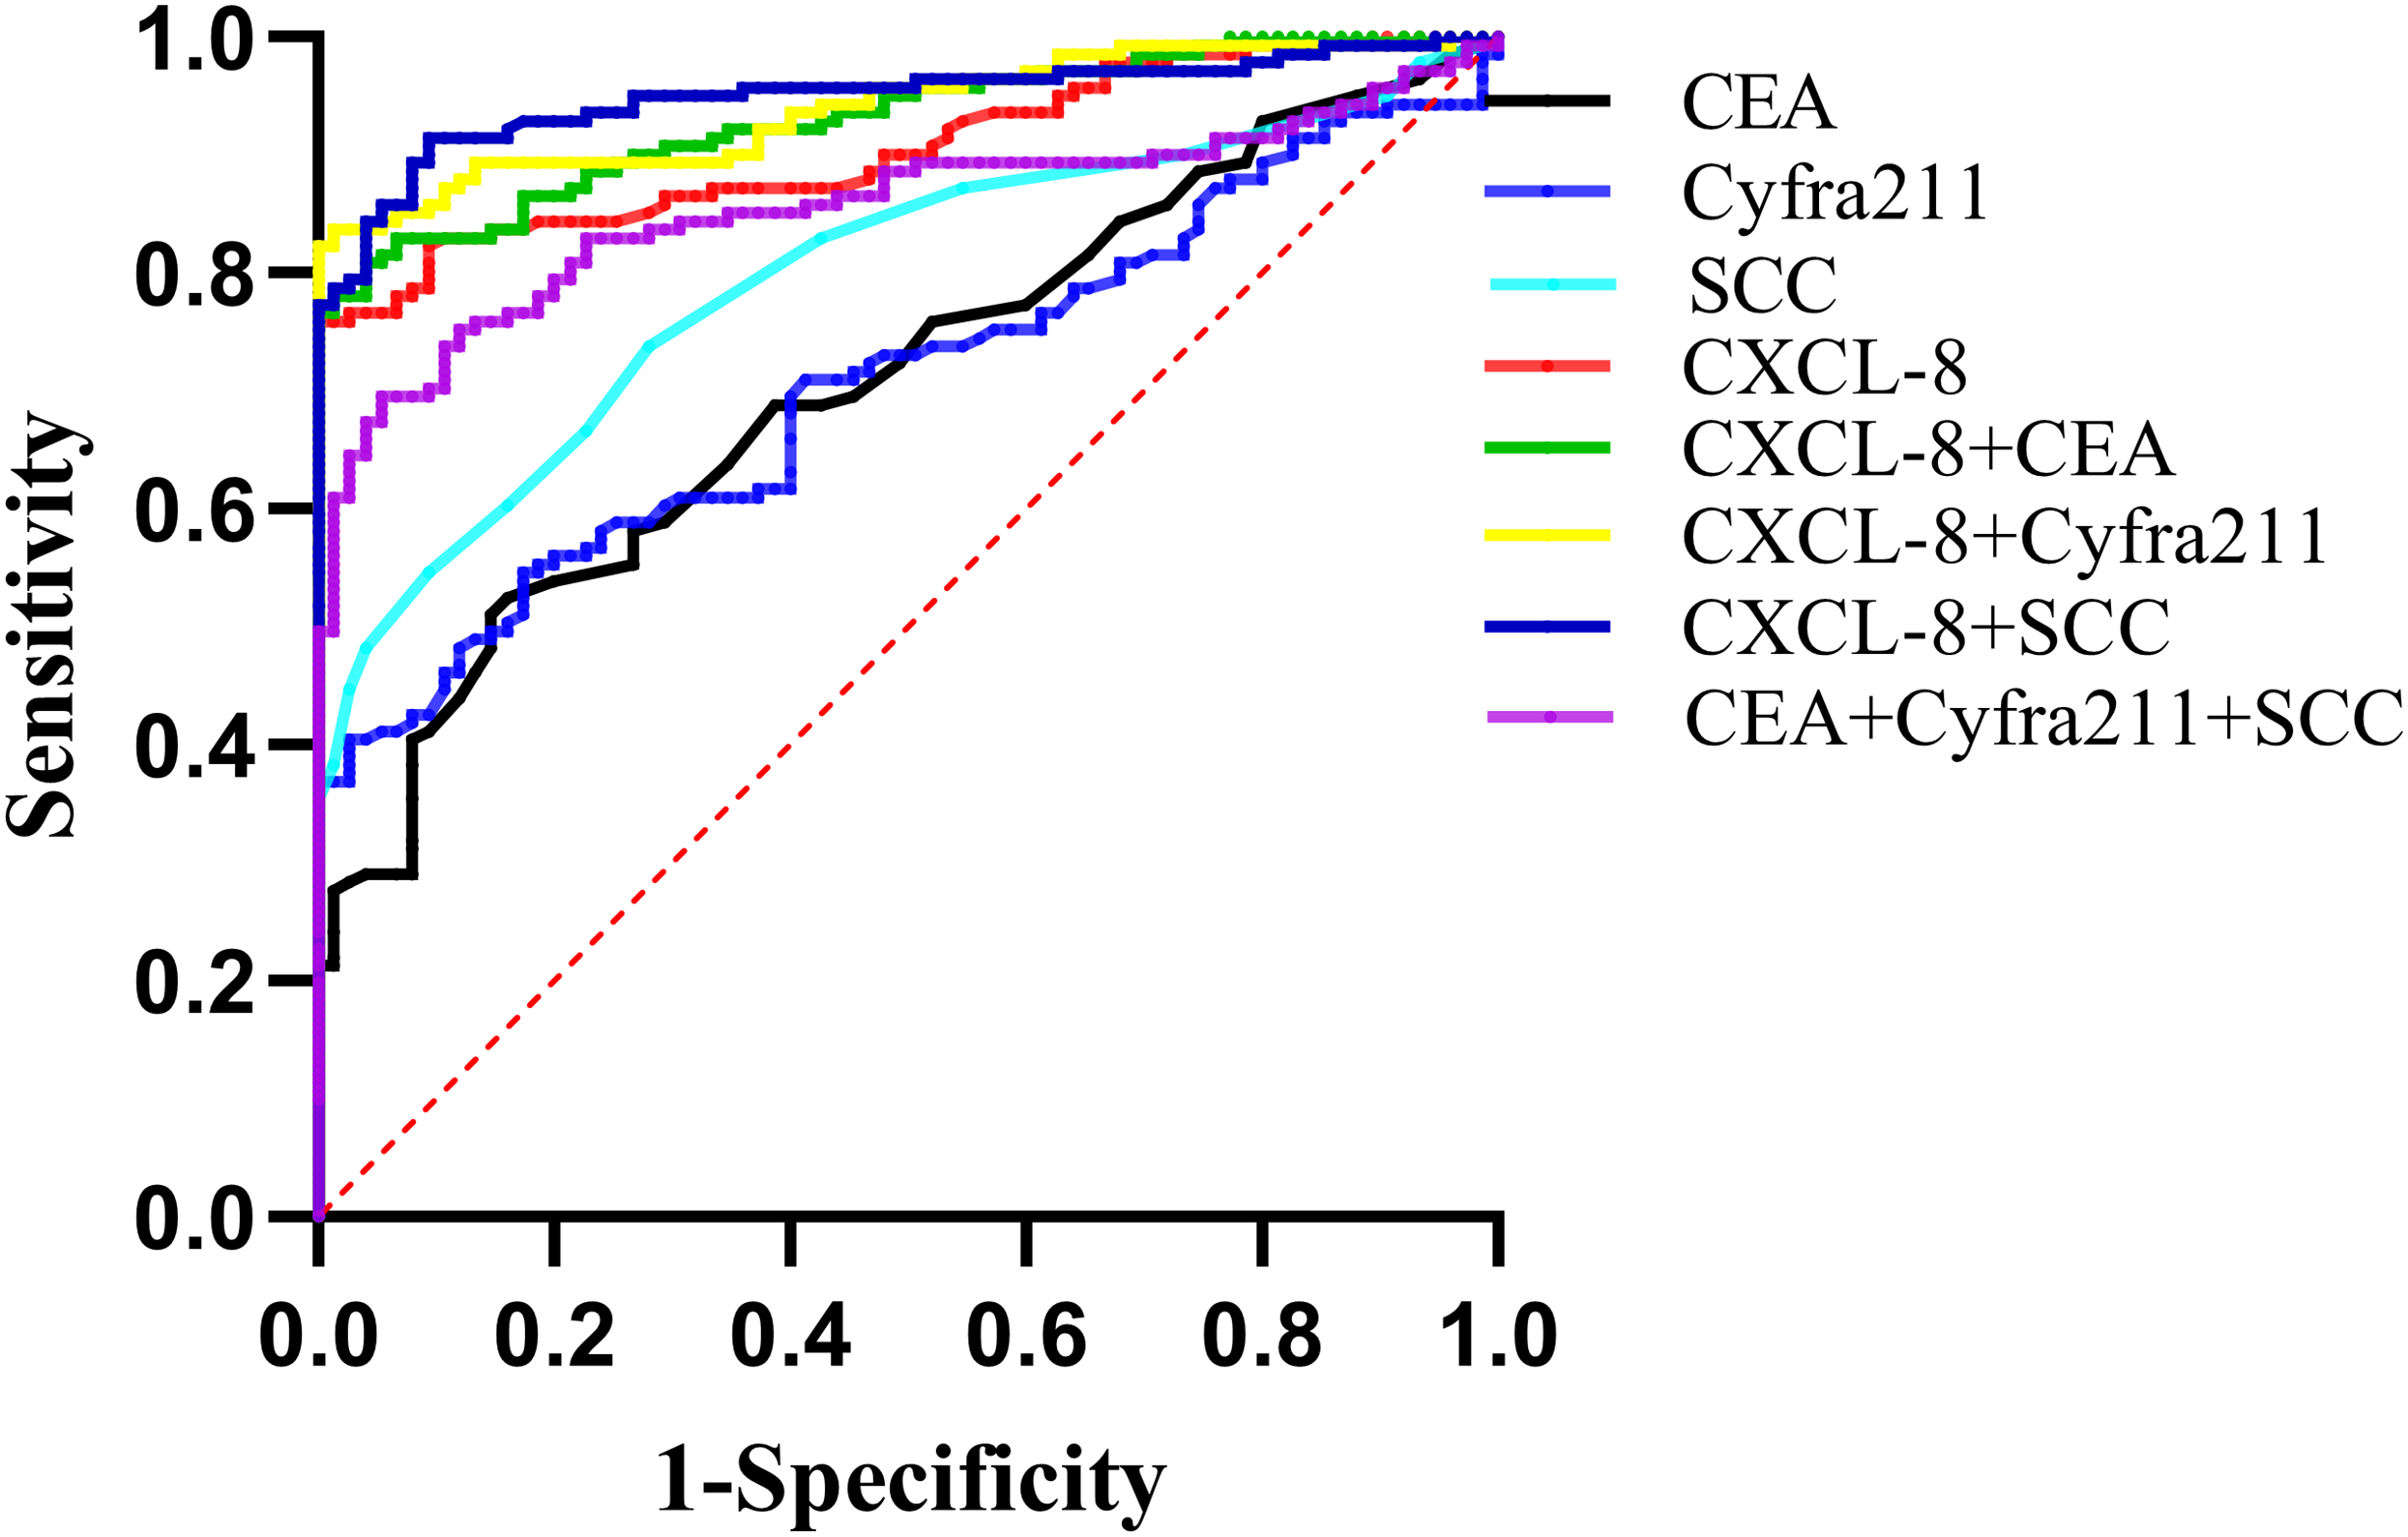
At a critical value of 23.99 for CXCL-8, the diagnostic sensitivity was 75.89%, which was significantly higher than those of CEA (19.86%), Cyfra211 (39.01%), and SCC (35.46%). When distinguishing patients with EC from healthy controls, the use of CXCL-8 alone exhibited higher sensitivity than the combined use of CEA+Cyfra211+SCC. When CEA, Cyfra211, and SCC were combined with CXCL-8, the sensitivities of CXCL-8+CEA, CXCL-8+Cyfra211, and CXCL-8+SCC were higher than those of CEA+Cyfra211+SCC. Furthermore, the diagnostic sensitivity was the highest when CXCL-8 was combined with SCC, reaching 90.78% (Table 1).
The AUC values of CXCL-8, CEA, Cyfra211, and SCC as diagnostic parameters for EEC were 0.883, 0.660, 0.674, and 0.810, respectively. Among them, CXCL-8 exhibited the highest AUC. When CXCL-8 was combined with CEA, Cyfra211, or SCC, the AUC values were 0.895, 0.911, and 0.932, respectively, which were significantly higher than those obtained with the combined use of CEA+Cyfra211+SCC (AUC: 0.854; Fig. 6 and Table 2). Additionally, our results suggested that CXCL-8 alone had better sensitivity for discriminating EEC from the control group than CEA, Cyfra211, or SCC (Table 2).
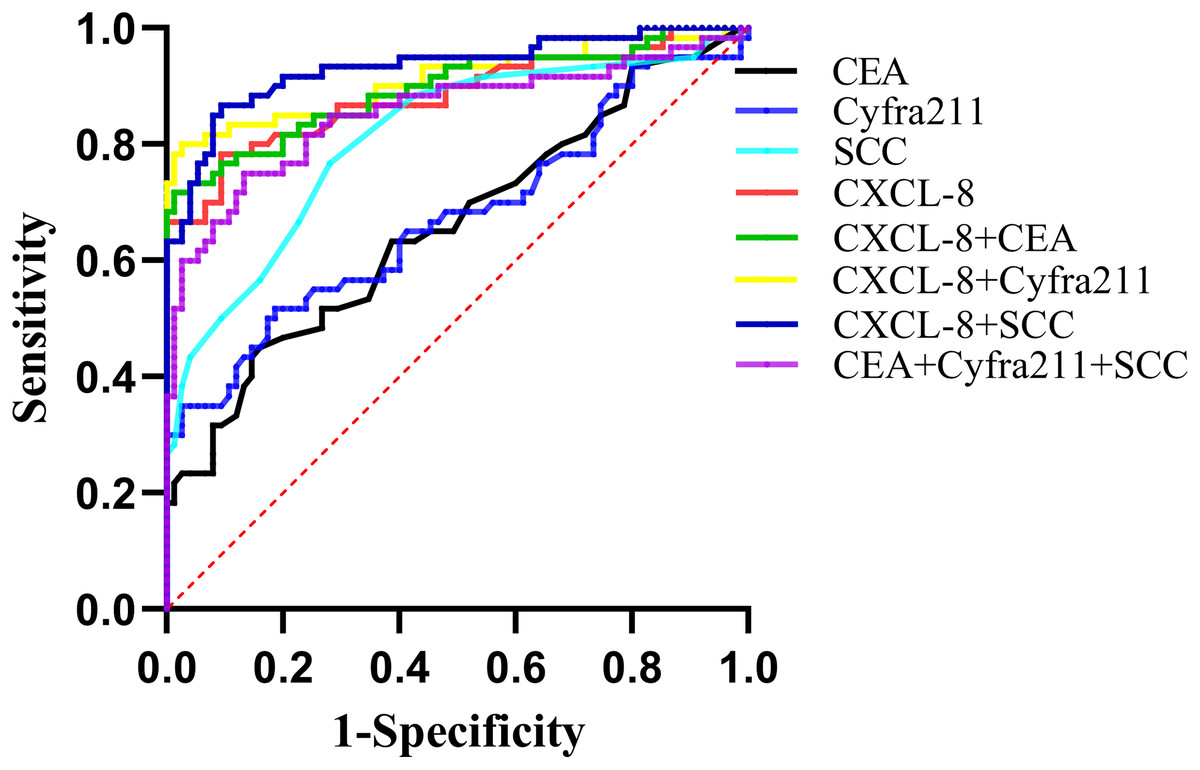
Figure 6: ROC curves demonstrating the diagnostic performance of CXCL-8, CEA, Cyfra211, SCC, and their combinations in differentiating patients with EEC from healthy participants.
Detailed diagnostic parameters are provided in Table 2.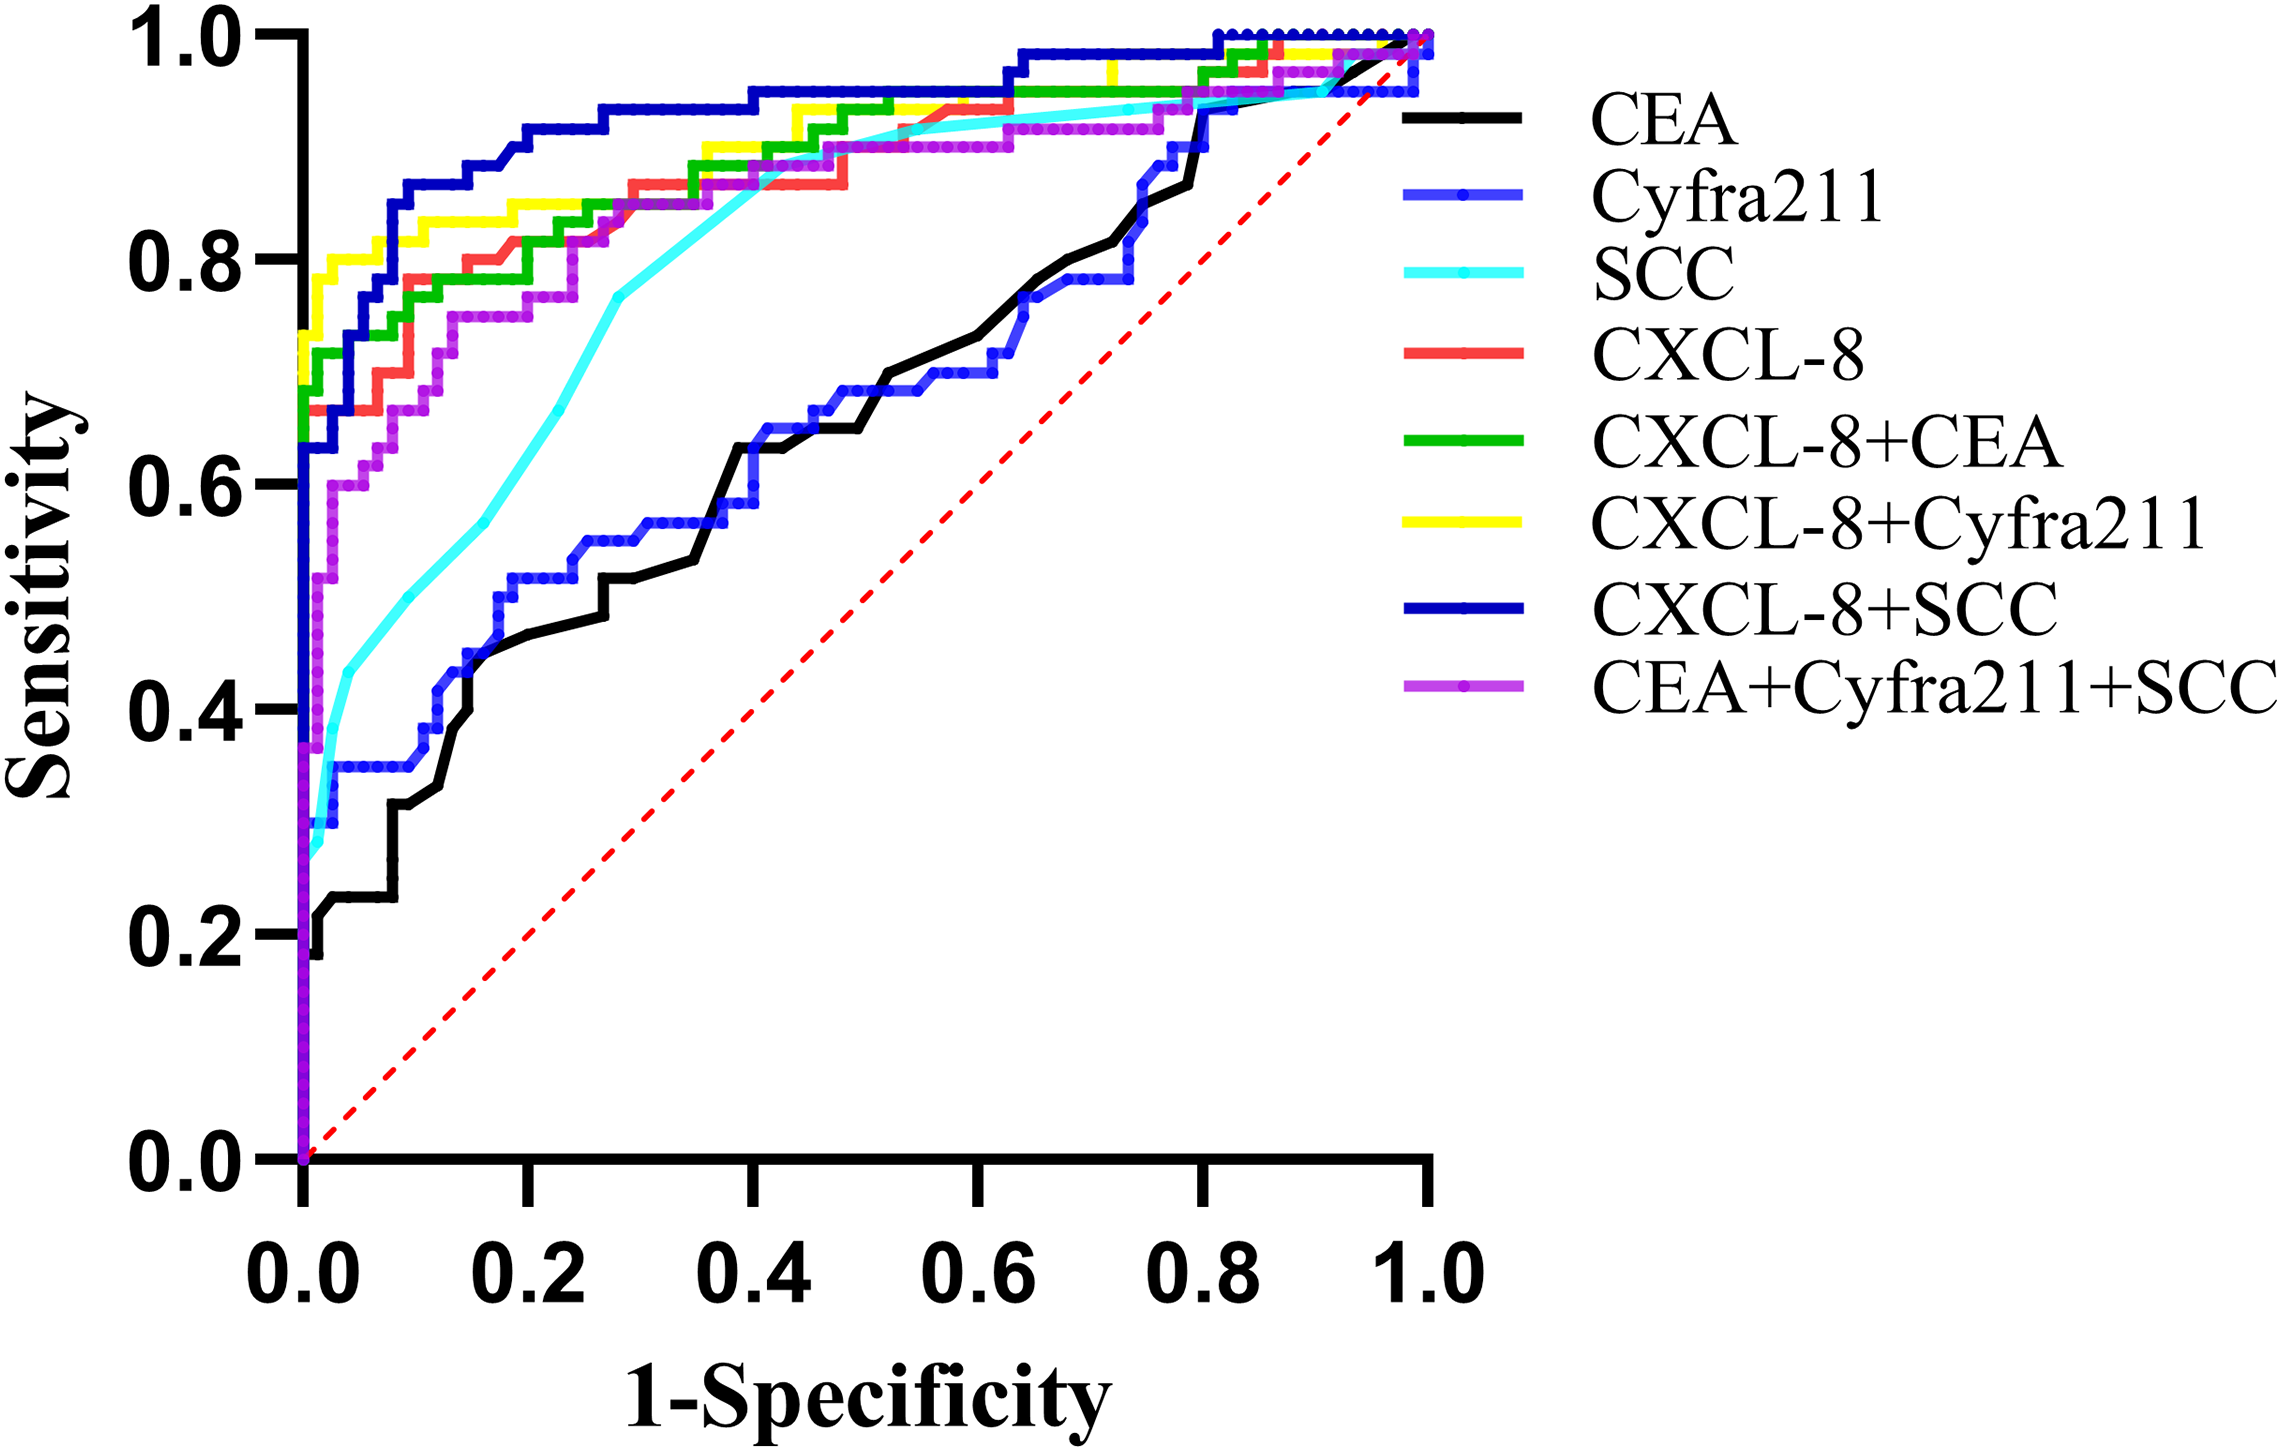
| Variable | Cut-off | AUC | Sensitivity (%) |
Specificity (%) |
95% Confidence interval | |
|---|---|---|---|---|---|---|
| Upper limit | Lower limit | |||||
| CXCL-8 | 23.99 | 0.883 | 66.67 | 98.67 | 82.22 | 94.53 |
| CEA | 5.00 | 0.660 | 18.33 | 98.67 | 56.64 | 75.36 |
| Cyfra211 | 3.30 | 0.674 | 33.33 | 97.33 | 57.96 | 76.84 |
| SCC | 1.50 | 0.810 | 28.33 | 97.33 | 73.47 | 88.48 |
| CXCL-8+CEA | 0.895 | 71.67 | 98.67 | 83.75 | 95.32 | |
| CXCL-8+Cyfra211 | 0.911 | 80.00 | 97.33 | 85.52 | 96.61 | |
| CXCL-8+SCC | 0.932 | 86.67 | 90.67 | 88.72 | 97.71 | |
| CEA+Cyfra211+SCC | 0.854 | 75.00 | 86.67 | 78.37 | 92.34 | |
Taken together, these results indicate that serum CXCL-8 levels may represent an improved novel biochemical marker for the diagnosis of EC, especially EEC, compared with conventional tumor markers.
Performance of CXCL-8, CEA, Cyfra211, and SCC for predicting EC occurrence risk via cut-off values
The correlation between the selected risk factors and EC risk was initially assessed using univariate analysis to identify the risk factors that subsequently met the criteria for inclusion in the multivariate model. All of these biomarkers demonstrated a positive association with an elevated risk of EC and were included in the multivariate analysis. Finally, elevated levels of CXCL-8 (P = 0.001, OR = 3.276) and SCC (P = 0.005, OR = 11.665) were identified as significant risk factors for esophageal cancer (Table 3).
| Multivariable | 95% Confidence Interval | |||
|---|---|---|---|---|
| P-value | OR | |||
| Gender | ||||
| Male vs female | 0.007 | 6.385 | 1.388 | 29.367 |
| Age | 0.000 | 1.156 | 1.067 | 1.253 |
| CEA | 0.287 | 1.217 | 0.848 | 1.747 |
| Cyfra211 | 0.208 | 1.577 | 0.776 | 3.205 |
| SCC | 0.005 | 11.665 | 2.066 | 65.851 |
| CXCL-8 | 0.007 | 1.829 | 1.183 | 2.830 |
Association between serum concentrations of CXCL-8, CEA, Cyfra211, and SCC and clinicopathological features in patients with EC
After evaluating the diagnostic utility of serum CXCL-8 levels in EC, we assessed the relationship between these markers and the clinicopathological features of patients with EC. The findings revealed that serum CXCL-8 levels significantly increased in relation to the TNM stage (P = 0.000), T stage (P = 0.000), N stage (P = 0.000), M stage (P = 0.000), neural invasion (P = 0.001), and vascular invasion (P = 0.001) (Table 4). Moreover, patients with EC with a tumor size ≥5 cm showed significantly higher SCC concentrations than those with a tumor size <5 cm (P = 0.022) (Table 4). Additionally, CEA levels were associated with the TNM stage (P = 0.002), Cyfra211 levels were associated with N stage (P = 0.000), and SCC antigen concentrations were associated with histological grade (P = 0.040).
| EC group | No. | CXCL-8 (pg/mL) | CEA (ng/mL) | Cyfra211 (ng/mL) | SCC (ng/mL) |
|---|---|---|---|---|---|
| Gender | |||||
| Male | 115 | 36.13 (25.21–122.09) | 2.90 (1.80–4.40) | 3.00 (1.89–4.55) | 1.20 (0.90–2.20) |
| Female | 26 | 38.76 (25.46–150.05) | 2.65 (1.53–3.45) | 2.83 (2.00–3.57) | 1.05 (0.80–1.95) |
| Mann-Whitney test (p) | 0.815 | 0.184 | 0.676 | 0.239 | |
| Age | |||||
| <60 | 55 | 46.86 (26.80–145.96) | 2.60 (1.60–4.30) | 2.60 (1.64–3.60) | 1.20 (0.80–2.20) |
| >=60 | 86 | 35.57 (24.63–117.97) | 3.05 (1.88–4.43) | 2.98 (2.05–4.56) | 1.20 (0.80–2.13) |
| Mann-Whitney test (p) | 0.312 | 0.259 | 0.164 | 0.651 | |
| TNM stage | |||||
| I + II | 60 | 27.06 (23.11–37.49) | 2.50 (1.60–3.75) | 2.77 (1.88–3.61) | 1.15 (0.90–1.60) |
| III | 32 | 49.89 (30.14–122.26) | 3.65 (3.05–5.23) | 3.27 (2.36–5.55) | 1.50 (0.80–2.58) |
| IV | 49 | 63.70 (31.51–334.57) | 2.40 (1.60–4.20) | 3.11 (1.84–4.56) | 1.20 (0.80–3.00) |
| Kruskal-Wallis test (p) | 0.000 | 0.002 | 0.245 | 0.300 | |
| T stage | |||||
| T1 + 2 | 32 | 24.92 (22.64-30.59) | 2.50 (1.63-4.10) | 2.64 (1.80-4.11) | 1.05 (0.90-1.58) |
| T3 | 94 | 39.83 (27.36-117.76) | 3.10 (1.80-4.33) | 2.91 (2.06-4.45) | 1.35 (0.80-2.53) |
| T4 | 15 | 145.51 (38.78-145.51) | 2.50 (1.50-6.00) | 3.11 (1.37-3.44) | 1.00 (0.50-1.80) |
| Kruskal-Wallis test (p) | 0.000 | 0.560 | 0.603 | 0.086 | |
| N stage | |||||
| N0 | 50 | 27.50 (23.92–38.63) | 2.50 (1.58–3.65) | 2.40 (1.75–3.59) | 1.20 (0.90–1.65) |
| N1 | 30 | 32.85 (24.13–228.18) | 3.40 (2.15–4.70) | 4.69 (2.77–6.75) | 1.30 (0.90–1.95) |
| N2 + 3 | 61 | 63.70 (31.85–207.38) | 2.90 (1.85–4.35) | 2.90 (1.98–3.76) | 1.20 (0.80–3.30) |
| Kruskal-Wallis test (p) | 0.000 | 0.207 | 0.000 | 0.598 | |
| M stage | |||||
| M0 | 102 | 31.27 (24.67–63.54) | 3.00 (1.78–4.30) | 2.82 (1.97–3.79) | 1.20 (0.80–2.20) |
| M1 | 39 | 145.51 (31.74–367.99) | 2.30 (1.80–4.40) | 3.12 (1.92–4.80) | 1.20 (0.90–2.70) |
| Mann-Whitney test (p) | 0.000 | 0.950 | 0.552 | 0.685 | |
| Histological grade | |||||
| High + Moderate | 117 | 37.72 (25.70–136.68) | 3.00 (1.85–4.40) | 2.95 (2.02–4.27) | 1.30 (0.90–2.25) |
| Low | 24 | 30.44 (23.97–48.48) | 2.40 (1.45–3.70) | 2.30 (1.88–4.25) | 1.05 (0.80–1.55) |
| Kruskal-Wallis test (p) | 0.391 | 0.248 | 0.391 | 0.040 | |
| Vascular invasion | |||||
| Absent | 72 | 30.34 (24.10-48.96) | 2.65 (1.60-4.30) | 2.78 (1.76-4.09) | 1.10 (0.80-1.58) |
| Present | 56 | 58.49 (28.14-154.86) | 3.00 (1.98-4.40) | 2.86 (2.25-3.77) | 1.45 (0.83-2.78) |
| Unknown | 13 | 195.78 (30.42-336.95) | 3.20 (2.10-3.95) | 4.91 (2.26-7.33) | 1.30 (0.85-3.05) |
| Kruskal-Wallis test (p) | 0.001 | 0.562 | 0.073 | 0.069 | |
| Nerve invasion | |||||
| Absent | 76 | 30.38 (24.56–48.96) | 2.65 (1.63–4.10) | 2.87 (1.88–3.77) | 1.20 (0.80–2.08) |
| Present | 52 | 67.65 (27.37–223.10) | 3.25 (1.83–4.85) | 2.73 (2.02–4.09) | 1.25 (0.83–2.20) |
| Unknown | 13 | 195.78 (30.42–336.95) | 3.20 (2.10–3.95) | 4.91 (2.26–7.33) | 1.30 (0.85–3.05) |
| Kruskal-Wallis test (p) | 0.001 | 0.572 | 0.093 | 0.730 | |
| Tumorsize (cm) | |||||
| <5 | 78 | 31.64 (24.63–78.75) | 2.70 (1.60–4.35) | 2.82 (1.89–3.98) | 1.10 (0.80–1.60) |
| ≥5 | 63 | 39.86 (27.28–195.78) | 3.00 (1.90–4.30) | 3.03 (2.03–4.80) | 1.40 (0.90–2.70) |
| Mann-Whitney test (p) | 0.073 | 0.386 | 0.552 | 0.022 |
Note:
Data are presented as median (interquartile range). Statistical tests (Mann-Whitney or Kruskal-Wallis) were applied, with P-values indicating significant associations (P < 0.05). Bold indicates statistically significant difference.
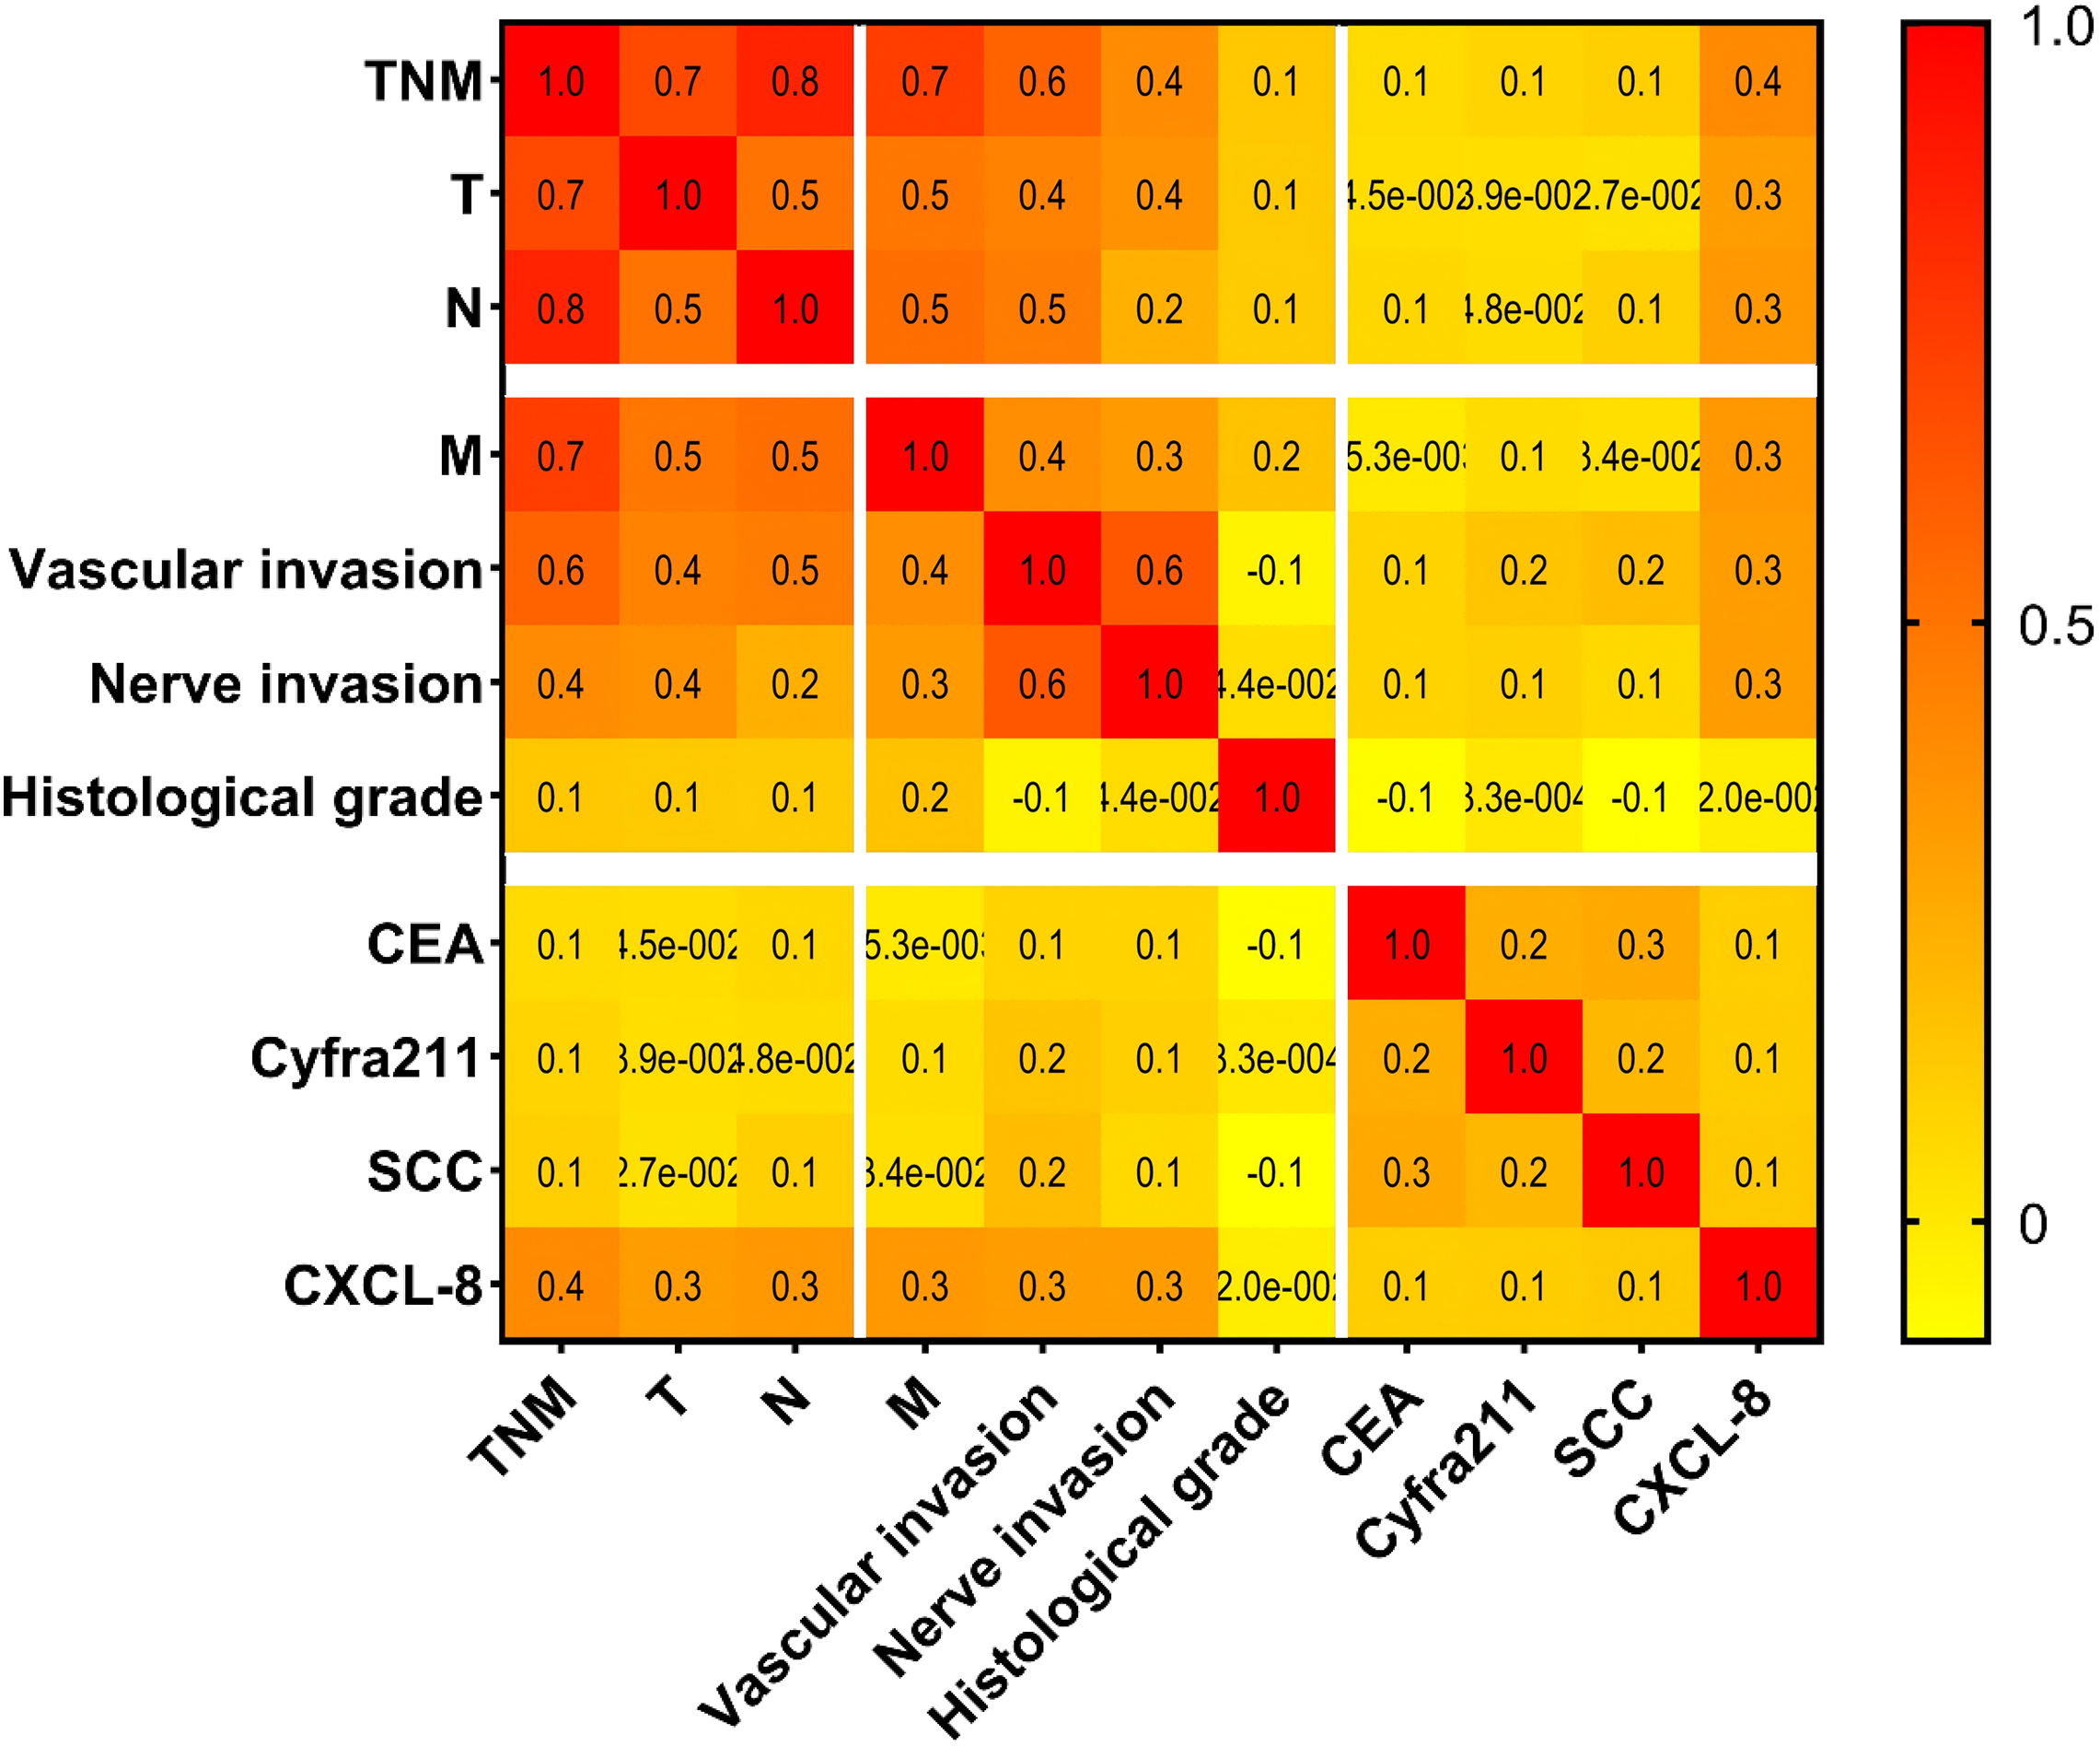
To evaluate the association between the markers and clinicopathological features of EC, Spearman’s rank correlation test was applied (Fig. 7). The results showed a significant correlation was observed between serum CXCL-8 levels and the TNM stage (r = 0.4), T stage (r = 0.3), N stage (r = 0.3), M stage (r = 0.3), neural invasion (r = 0.3), and vascular invasion (r = 0.3) in patients with ECs (Fig. 7).
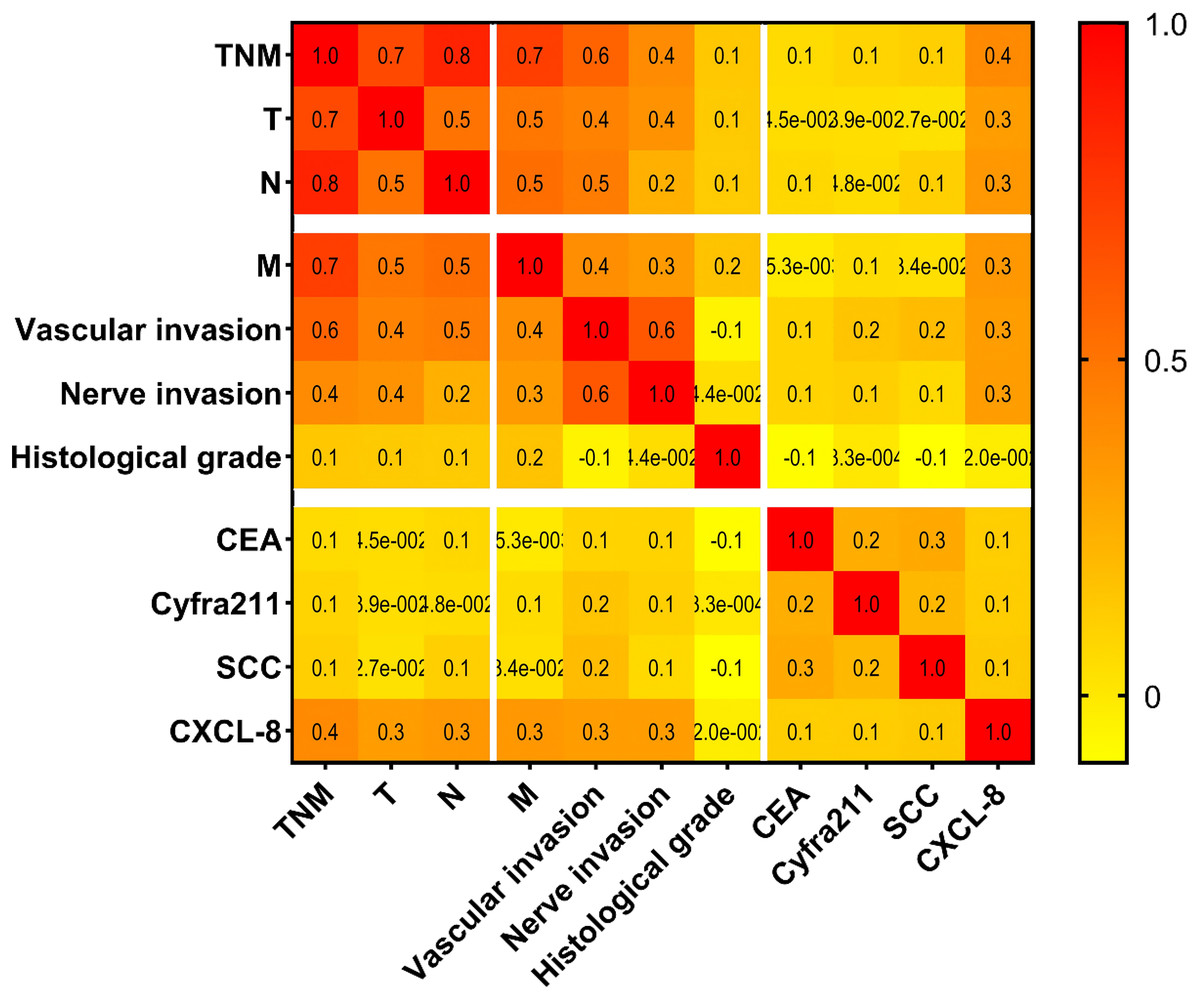
Figure 7: Correlations between serum concentrations of tested proteins and pathological characteristics among patients with EC.
In summary, these findings suggest that serum CXCL-8 levels are closely associated with the clinicopathological status of patients with EC.
Discussion
Early detection is pivotal to enhance the survival rates and prognoses of patients with EC. However, the identification of EEC is frequently hindered by the lack of overt clinical symptoms. Although endoscopy is the primary diagnostic modality, its utility for early diagnosis is limited (Qu et al., 2024). The detection of blood tumor markers has attracted considerable attention due to its convenience, rapidity, and minimally invasive nature, enabling large-scale screening efforts (Zheng et al., 2021). At present, the most commonly used tumor markers for esophageal cancer in clinical practice include CEA, Cyfra21-1, and SCC antigen. However, their sensitivity and specificity are suboptimal, particularly for early diagnosis (Zheng et al., 2021; Xiao-Bing et al., 2014). As a constituent of the chemokine family, CXCL-8 has been implicated in the pathogenesis of chronic inflammation and cancer, exerting a pivotal influence on tumor prediction and initiation (Basit Saleem, Kai & Asma, 2012). Prior investigations have underscored the significant role of CXCL-8 in tumor angiogenesis and invasion, and its association with distant metastasis of EC (Wu et al., 2019; Mengxing et al., 2022). Nevertheless, these studies have predominantly focused on assessing the expression levels of CXCL-8 in EC cell lines and tissues, with the relatively limited investigation of the prospective utility of CXCL-8 as a biomarker for the diagnosis and prognosis of EC.
Our findings demonstrate that serum CXCL-8 levels are significantly elevated in patients with EC compared to healthy controls, exhibiting high sensitivity and AUC values. Furthermore, combining CXCL-8 with conventional tumor markers significantly enhances diagnostic accuracy, suggesting that CXCL-8 may serve as a valuable addition to existing diagnostic panels for EC. These results highlight the potential of CXCL-8 to facilitate earlier detection and improve clinical outcomes. However, it is important to balance the increased sensitivity achieved through marker combination against the modest reduction in specificity, as this trade-off may lead to overdiagnosis and unnecessary follow-up. In clinical practice, the selection and combination of biomarkers should be tailored to the specific context and patient population to optimize diagnostic performance while minimizing false-positive results. Logistic regression analysis identified serum CXCL-8 level as a significant risk factor for EC onset. Furthermore, previous studies have corroborated CXCL-8 as a statistically significant predictive factor for colorectal cancer risk. In summary, serum CXCL-8 as a tumor marker for EC diagnosis exhibits promising prospects, particularly in comparison to traditional markers such as CEA, CYFRA211, and SCC.
The TNM staging system is a primary classification framework widely employed for the assessment of EC, delineating tumor growth (T), lymph node metastasis (N), and the presence of metastasis (M). Previous studies have demonstrated a negative association between lymph node metastasis, vascular invasion, and the prognosis of patients with EC (Wang et al., 2016). Presently, limited attention has been directed towards exploring the relationship between serum CXCL-8 levels and the clinicopathological characteristics of patients with EC. One study, constrained by limitations in the experimental sample size, failed to establish a significant correlation between serum CXCL-8 levels and TNM staging in esophageal cancer (Marta et al., 2019). In contrast, our findings indicated a significant correlation between serum CXCL-8 levels and TNM staging, vascular invasion, and neural invasion in individuals diagnosed with EC, suggesting the potential implication of CXCL-8 in the progression and invasiveness of EC. Consequently, the use of CXCL-8 as a prognostic marker for EC is promising. Although our study did not specifically evaluate the prognostic value of CXCL-8 with respect to survival outcomes, future research should incorporate long-term follow-up to assess the prognostic significance of CXCL-8 in patients with esophageal cancer.
Despite these important findings, our study has several limitations. First, this was a single-center prospective study with a relatively small sample size, which may have introduced a selection bias. Secondly, although we controlled for some clinical factors, other potential confounding factors may have influenced our results, necessitating further research to validate our findings. Additionally, this study primarily focused on the potential application of CXCL-8 in the diagnosis of EC, and its value in treatment monitoring, prognosis assessment, and other aspects requires further investigation. Future studies should involve larger, multicenter cohorts and investigate longitudinal changes in CXCL-8 levels during treatment and follow-up.
In conclusion, these findings suggest that serum CXCL-8 levels serve as a more effective blood-derived biomarker for EC diagnosis than common clinical markers or possibly a suitable adjunct. Remarkably, a significant correlation was observed between serum CXCL-8 levels and the clinicopathological features of patients with EC, thereby heightening the prospects of this marker as a promising prognostic indicator.