
In vivo assessment of pharmacokinetic interactions of empagliflozin and henagliflozin with sorafenib: an animal-based study
- Published
- Accepted
- Received
- Academic Editor
- Anurag Paranjape
- Subject Areas
- Biochemistry, Molecular Biology, Drugs and Devices, Oncology, Pharmacology
- Keywords
- Hepatocellular carcinoma, Type 2 diabetes mellitus, Sorafenib, Empagliflozin, Henagliflozin, Drug–drug interaction
- Copyright
- © 2025 Du et al.
- Licence
- This is an open access article distributed under the terms of the Creative Commons Attribution License, which permits using, remixing, and building upon the work non-commercially, as long as it is properly attributed. For attribution, the original author(s), title, publication source (PeerJ) and either DOI or URL of the article must be cited.
- Cite this article
- 2025. In vivo assessment of pharmacokinetic interactions of empagliflozin and henagliflozin with sorafenib: an animal-based study. PeerJ 13:e19662 https://doi.org/10.7717/peerj.19662
Abstract
Background
Sorafenib is a multi-targeted tyrosine kinase inhibitor (TKI) used for the treatment of advanced renal cell carcinoma, hepatocellular carcinoma (HCC), and radioactive iodine-resistant thyroid carcinoma. Notably, glucose transporters sodium-glucose cotransporter 2 (SGLT2) and glucose transporter 1 are highly expressed in HCC and functionally promote tumorigenicity, which increase the possibility of coadministration of TKIs with SGLT2 inhibitors. Therefore, this study aimed to investigate the pharmacokinetic profiles of coadministration of sorafenib with novel SGLT2 inhibitors, either empagliflozin or henagliflozin and to explore their potential mechanisms.
Methods
Male Sprague-Dawley (SD) rats were divided into seven groups (n = 6) that received: sorafenib (1), empagliflozin and sorafenib (2), henagliflozin and sorafenib (3), empagliflozin (4), sorafenib and empagliflozin (5), henagliflozin (6), sorafenib and henagliflozin (7). Blood samples were collected at multiple time points to measure plasma drug concentrations using UPLC-MS/MS, and pharmacokinetic parameters were calculated. In addition, messenger RNA (mRNA) expression was measured by quantitative polymerase chain reaction (RT-qPCR) to explore underlying mechanisms of interaction. Data analyses were conducted using DAS 2.1.1 software. A P-value of < 0.05 was used as the level of statistical significance.
Results
The study revealed that sorafenib slightly increased the plasma concentration-time curves (AUC0–t and AUC0–∞) of empagliflozin, whereas the apparent clearance (CLz/F) and apparent volume of distribution (Vz/F) significantly decreased. Similarly, sorafenib increased the AUC0–t, AUC0–∞ and the maximum plasma concentrations (Cmax) of henagliflozin and decreased the CLz/F. Besides, coadministration of empagliflozin decreased the CLz/F, increased the AUC0–∞ and Cmax of sorafenib When coadministered with henagliflozin, the AUC0–t and AUC0–∞ of sorafenib significantly increased by 67% and 80%, respectively, accompanied by decrease in the CLz/F. Furthermore, PCR results demonstrated that sorafenib decreased the expression of Ugt2b7 in intestinal tissue. Empagliflozin and henagliflozin inhibited Oatp1b2 expression in the liver and P-gp expression in the liver and intestines.
Conclusions
These pharmacokinetic interactions provide valuable insights for future studies on optimizing the dosing regimens of sorafenib in combination with empagliflozin or henagliflozin, potentially reducing toxicity risks and improving the safety of coadministration in clinical settings.
Introduction
Several tyrosine kinase inhibitors (TKIs), antiangiogenic antibodies, and immune checkpoint inhibitors are the standard first-line therapies for advanced hepatocellular carcinoma (HCC). HCC, the principal histologic type of liver cancer (comprising 75–85% of cases), is the second leading cause of cancer related deaths globally and has an incidence of 850,000 new cases per year (Sung et al., 2021). Since HCC symptoms are frequently discovered when the disease has progressed, these patients are not candidates for curative care. Fortunately, systemic therapeutic options for people with HCC are finally advancing (Forner, Reig & Bruix, 2018).
Sorafenib is a multiple TKI that can facilitate apoptosis, mitigate angiogenesis, and suppress tumor cell proliferation to extend the total median survival in patients with advanced HCC. Currently, sorafenib is an efficient first-line treatment for late-stage HCC (Llovet et al., 2022). The sorafenib HCC Assessment Randomized Protocol clinical trials established sorafenib as the first chemical to exhibit a survival advantage in a phase 3, double-blind trial compared to a placebo. The median overall survival for patients in the sorafenib group was 10.7 months, while it was 7.9 months in the control group (HR 0.69, 95% confidence interval [0.55–0.87], P < 0.001) (Llovet et al., 2008). Sorafenib demonstrated a comparable survival advantage in a parallel trial done among the Asia-Pacific population (Cheng et al., 2009). Accordingly, sorafenib remains an effective treatment for advanced hepatocellular carcinoma and is well-tolerated.
Sorafenib is primarily metabolized in the liver through N-oxidation mediated by cytochrome P450 (CYP) 3A4, resulting in the formation of pharmacologically active sorafenib N-oxide. Subsequently, it is converted into inactive glucuronides by the enzymatic activity of uridine diphosphate-glucuronosyltransferase (UGT) 1A9 and UGT1A1 (Miners et al., 2017). However, previous study indicated that inhibiting the breakdown of sorafenib through the CYP3A4 pathway does not result in an elevation in sorafenib levels. This finding aligns with the conclusion that 15% of the administered dose was removed from the body through glucuronidation, while less than 5% was eliminated as oxidative metabolites (Lathia et al., 2006). Therefore, compared to CYP3A4, the fraction of metabolism of sorafenib through UGT1A9 and UGT1A1 is predominant; thus, activation or inhibition of this mechanism can impact the pharmacokinetics and efficacy of sorafenib (Gong et al., 2017). Sorafenib is a highly effective inhibitor of UGT1A1 and UGTs 1A7–1A10 reported to date (Korprasertthaworn et al., 2019), and hence coadministered with drug substrates of UGT1A may result in drug–drug interactions (DDIs). The clinical implications of this inhibition are uncertain, and caution should be taken when administering medicines metabolized by these enzymes to patients receiving sorafenib due to the possibility for drug-drug interactions.
Type 2 diabetes mellitus (T2DM) increases the likelihood of developing HCC in people with primary liver disease, independent of the etiology of the disease (Huang et al., 2023; Simon et al., 2018). Research has demonstrated that individuals with T2DM have a 2.5–4 times greater likelihood of acquiring HCC. Hence, patients with HCC should prioritize the prevention and treatment of T2DM as important therapy goals. Sodium-glucose cotransporter 2 (SGLT2) inhibitors are a novel type of oral hypoglycemic agents that effectively inhibit glucose reabsorption in the proximal tubules of the kidney. This leads to the excretion of glucose in the urine and subsequently lowers blood glucose levels in patients with T2DM (Plaz Torres et al., 2022).
However, the administration of drugs that particularly target the metabolic pathways of SGLT2 inhibitors, either by inhibiting or inducing UGT, can lead to substantial alterations in the levels of exposure to SGLT2 inhibitors, as a previous study showed that sorafenib and donafenib significantly changed the pharmacokinetic parameters of dapagliflozin and canagliflozin (He et al., 2023, 2022). However, different SGLT2 inhibitors have different metabolic pathways. For example, dapagliflozin and canagliflozin are metabolized by UGT1A, whereas empagliflozin and henagliflozin are mostly metabolized by UGT2B. Therefore, empagliflozin and henagliflozin were selected for this study.
Empagliflozin is a powerful and specific inhibitor of SGLT2, which has received approval for treating T2DM in many regions including the EU, USA, and Japan (Frampton, 2018, 2022). Treatment with empagliflozin has been associated with a drop in glycated hemoglobin levels in individuals diagnosed with type 2 diabetes. Additionally, it has been observed to lead to decreases in weight and blood pressure. Furthermore, it has been found to lower the occurrence of cardiovascular death events by 18% in a diverse group of patients with chronic kidney disease (Fauchier, Fauchier & Angoulvant, 2021; Herrington et al., 2023; Santos-Gallego et al., 2021; Wanner et al., 2016). Therefore, empagliflozin is an effective therapeutic drug that is widely used in T2DM. Empagliflozin was absorbed quickly and reached its highest levels in the body within 1.0–2.0 h following a single oral dose (Scheen, 2014). Approximately 11–19% of the empagliflozin dose is eliminated in urine unchanged, and the elimination rate of empagliflozin through the kidneys is not affected by the dosage (Scheen, 2014). Empagliflozin metabolism in humans primarily occurs by glucuronidation by UGT1A3, UGT1A8, UGT1A9, and UGT2B7, as suggested by in vitro research. Empagliflozin is metabolized via the human uptake transporters organic anion transporters (OATs) 3, organic anion transporting polypeptides (OATP) 1B1, OATP1B3, P-glycoprotein (P-gp), and breast cancer resistance protein (BCRP), but not OAT1, organic cation transporter (OCT) 2, and is unlikely to modulate CYP 450 enzymes.
Henagliflozin was the first SGLT2 inhibitor to be developed independently in China. A multicenter, randomized, double-blind, placebo-controlled, phase 3 trial evaluate the efficacy of henagliflozin at doses of 5 and 10 mg as monotherapy. The treatment effectively controlled glycemic levels, resulted in weight loss, lowered blood pressure, and was generally well tolerated (Lu et al., 2021). Henagliflozin is a substrate of P-gp and BCRP, metabolized by UGT2B4/7, UGT1A9, UGT1A3, UGT1A6, and eliminated both by the fecal (50%) and renal (30%) routes (Chen et al., 2021; Zhang et al., 2021).
T2DM is increasingly replacing viral- and alcohol-related causes as major pathogenic promotors of HCC. In particular, several laboratory studies have indicated that SGLT2 inhibitors have anti-proliferative activity by attenuating the uptake of glucose in several tumor cell lines, including HCC cells (Kaji et al., 2018; Scafoglio et al., 2018). These findings from laboratory and early clinical studies suggest that SGLT2 inhibitors may offer a potential new strategy for the treatment of HCC, especially for patients with T2DM. Therefore, in clinical management, it is more and more extensive to apply multikinase inhibitors and SGLT2 inhibitors, which enhances the probability of administering sorafenib-empagliflozin and sorafenib-henagliflozin together.
Hence, the objective of the study is to assess the potential DDIs of sorafenib-henagliflozin and sorafenib empagliflozin interactions in order to predict possible negative pharmacokinetic implications. The study involved several key steps to assess the pharmacokinetic interactions between sorafenib, empagliflozin, and henagliflozin. Rats were divided into different treatment groups, receiving either sorafenib alone or in combination with empagliflozin or henagliflozin. Blood samples were collected at various time points, and the plasma concentrations of the drugs were measured using ultra-performance liquid chromatography-tandem mass spectrometry (UPLC-MS/MS), developed in this study. Additionally, quantitative real-time PCR (qRT-PCR) was performed on liver and intestine tissues to assess the gene expression of key enzymes involved in drug metabolism. Pharmacokinetic parameters were then calculated, and statistical analyses were conducted to evaluate the significance of the observed drug interactions. The materials used, experimental procedures, and validation methods were carefully applied to ensure the accuracy and reliability of the data. We present the following article in accordance with the ARRIVE 2.0 reporting checklist.
Materials and Methods
Animals
Healthy adult male Sprague-Dawley (SD) rats, aged 10–12 weeks and weighing 230 ± 30 g, were supplied by Beijing Huafukang Biotechnology Co., Ltd. (Beijing, China; license number SCXK (Jing) 2019-0008). All experimental procedures were reviewed and approved by the Animal Ethics Committee of Hebei General Hospital (Shijiazhuang, China) (No. 202328).
The rats were housed under controlled experimental conditions (23 ± 2 °C, 12-h dark-light cycle, relative humidity of 50 ± 10%) and were acclimatized for a week to affirm their health condition and minimize any influence. All rats were given free access to water, and the diet was prohibited for 12 h before administration.
Materials
Sorafenib (purity ≥ 98%, Lot C15090388) and donafenib (purity 99.9%, ZZS-20-X261-A1) were purchased from Shanghai Zhen Zhun Biotechnology Co., Ltd. (Shanghai, China). Empagliflozin (J19HS174525, ≥98%) was purchased from Shanghai Yuan ye Bio-Technology Co. Ltd. (Shanghai, China). Henagliflozin (purity ≥ 99%) was kindly provided by the Jiangsu Hengrui Medicine Co., Ltd. (Jiangsu, China). The internal standard (IS), dapagliflozin (purity ≥ 99%, Lot K1704045), was acquired from Shanghai Aladdin Biochemical Technology Co., Ltd. (Shanghai, China).
Dimethyl sulfoxide (DMSO) was obtained from Beijing Solarbio Science Technology Co., Ltd. (Beijing, China). HPLC-grade acetonitrile, methyl tert-butyl ether, formic acid, and ammonium acetate were provided by Fisher Scientific (Pittsburgh, PA, USA). All experiments were conducted using ultrapure water, which was supplied by Wahaha Group Co., Ltd. (Hangzhou, China).
Pharmacokinetic study in rats
The experimental animals were randomly divided into seven drug treatment groups (n = 6). The doses were chosen by converting the clinically recommended doses for patients to animal doses. The animal equivalent dose was determined by dose-by-factor method: Human equivalent dose (mg/kg) = Animal does (mg/kg) × Km ratio (Km = 6.2 in rats) (Nair & Jacob, 2016). Sorafenib was suspended in 0.5% sodium carboxymethyl cellulose (CMC-Na) with 5% DMSO, whereas empagliflozin and henagliflozin were suspended in 0.5% CMC-Na. Groups I, Groups IV and Groups VI were administered sorafenib 100 mg/kg, empagliflozin 2.5 mg/kg, or henagliflozin 1 mg/kg by gavage, respectively. Group II received empagliflozin 2.5 mg/kg daily by gavage for 7 consecutive days, followed by sorafenib at 100 mg/kg; whereas Group III received henagliflozin 1 mg/kg daily by gavage for 7 consecutive days, followed by sorafenib at 100 mg/kg by gavage. Groups V and VII received sorafenib (100 mg/kg) daily by gavage for 7 consecutive days, followed by empagliflozin 2.5 mg/kg (Group VI) or henagliflozin 1 mg/kg (Group VII) by gavage (Table 1).
| Study design | Group no. | Treatment description |
|---|---|---|
| The influence of empagliflozin or henagliflozin on the sorafenib pharmacokinetics | ||
| Sorafenib alone | Groups I | Sorafenib 100 mg/kg alone |
| Empagliflozin + Sorafenib | Groups II | Empagliflozin 2.5 mg/kg for 7 consecutive days + Sorafenib 100 mg/kg |
| Henagliflozin + Sorafenib | Groups III | Henagliflozin 1 mg/kg for 7 consecutive days + Sorafenib 100 mg/kg |
| The influence of sorafenib on the empagliflozin pharmacokinetics | ||
| Empagliflozin alone | Groups IV | Empagliflozin 2.5 mg/kg alone |
| Sorafenib + Empagliflozin | Groups V | Sorafenib 100 mg/kg for 7 consecutive days + Empagliflozin 2.5 mg/kg |
| The influence of sorafenib on the henagliflozin pharmacokinetics | ||
| Henagliflozin alone | Groups VI | Henagliflozin 1 mg/kg alone |
| Sorafenib + Henagliflozin | Groups VII | Sorafenib 100 mg/kg for 7 consecutive days + Henagliflozin 1 mg/kg |
A total of 100 μL of the blood was collected into heparinized test tubes at the following time points: 0, 0.5, 1, 2, 3, 4, 5, 6, 7, 8, 10, 12, 24, 48, 72, 96, 120, and 144 h for sorafenib; 0, 0.083, 0.167, 0.25, 0.33, 0.5, 0.75, 1, 2, 4, 6, 8, 10, 12 h for empagliflozin; and 0, 0.25, 0.5, 1, 1.5, 2, 2.5, 3, 4, 6, 8, 10, 12, 24, and 48 h for henagliflozin analysis. Blood samples were centrifuged at 3,500 rpm for 10 min, and the supernatant was collected and stored at −80 °C until processing for UPLC-MS/MS.
Following blood collection, rat liver and intestinal tissues were collected for molecular analysis on the seventh day post-treatment with the corresponding drugs for each group. The rats were anesthetized with chloral hydrate and were euthanized after that. The tissues were stored immediately at −80 °C until use.
Instruments and analytical conditions
The blood concentration of sorafenib was determined using our previously published article regarding the LC-MS/MS method (He et al., 2022). Empagliflozin and henagliflozin were quantified using UPLC-MS/MS with an LC-30A ultra-performance liquid chromatograph (Shimadzu, Kyoto, Japan) connected to a Sciex Triple Quad 5500 tandem triple quadrupole mass spectrometer (Sciex, Framingham, MA, USA). Chromatographic separation was performed on a Welch Boltimate column (2.1 mm × 100 mm, 2.7 μm), with the temperature maintained at 45 °C by gradient elution. The mobile phase composed of water containing 0.1% formic acid, 5 mM ammonium acetate (phase A), and acetonitrile (phase B). The flow rate was 0.25 mL/min and the gradient elution procedure was as follows: 0–1 min, 55% B; 1–2 min, 55–95% B; 2–3.5 min, 95% B; 3.5–3.6 min, 95–55% B; 3.6–4.1 min, 55% B. The injection volume was 6 μL.
The analytes were ionized using positive electrospray ionization and detected using multiple reaction monitoring (MRM). The m/z transitions ions for quantification were from 451.2→70.9 for empagliflozin, 455.3→290.9 for henagliflozin and 426.1→167.2 for dapagliflozin, respectively (Fig. 1). The conditions of the mass spectrometer were given as follows: ion source gas 1, 60.0 psi; ion source gas 2, 50.0 psi; curtain gas, 25.0 psi; source temperature, 500 °C; ion spray voltage, 5,500 V.
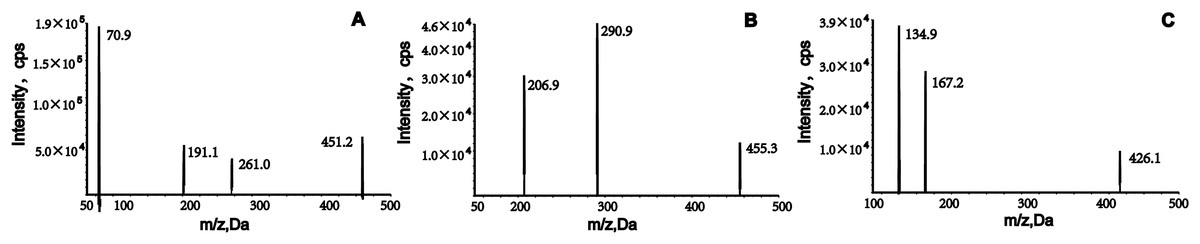
Figure 1: Product ion mass spectrum of empagliflozin, henagliflozin, and dapagliflozin.
Preparation of calibration standards and quality control (QC) samples
Empagliflozin (1 mg/mL), henagliflozin (1 mg/mL), and IS (1 mg/mL) were separately prepared by dissolving them in DMSO. Working solutions for calibration were obtained by diluting the stock solutions with acetonitrile-water. Calibration standards were prepared by spiking 5 μL of the working solution with 45 μL of blank rat plasma. The final concentrations of the calibration curves were 5, 50, 200, 500, 1,000, and 2,000 ng/mL for empagliflozin and 5, 50, 200, 500, 1,000, and 2,000 ng/mL for henagliflozin. QC samples with concentrations of 15, 800, and 1,500 ng/mL for empagliflozin and 10, 800, and 1,500 ng/mL for henagliflozin were prepared independently in the same way. Stock solutions, working solutions, calibration standards, and QCs were stored at −20 °C until analysis.
Plasma sample preparation
The IS working solution (5 µL) was added to 50 µL of plasma sample, followed by the addition of 250 μL methyl tert-butyl ether (MTBE). After vortexing for 1 min, the tubes were centrifugated for 10 min at 12,000 rpm. The supernatant was then transferred to a clean centrifuge tube and evaporated to dryness under a stream of nitrogen at room temperature. The residue was re-dissolved in 100 μL of 50% acetonitrile-water and briefly vortexed for 1 min, after 6 μL was injected into the UPLC-MS/MS for analysis.
Method validation
The method was comprehensively validated according to the guidelines of the M10 Bioanalytical Method Validation and Study Sample Analysis for the US Food and Drug Administration (2022). The following elements were evaluated during the method validation process: selectivity, calibration curve, lower limit of quantification (LLOQ), accuracy, precision, matrix effects, recovery, and stability.
Selectivity
To assess selectivity, blank plasma samples from six different rats were analyzed, along with samples spiked with analytes at the LLOQ and IS, as well as actual rat plasma samples following empagliflozin or henagliflozin administration. Method specificity required blank sample responses at analyte retention times to be less than 20% of LLOQ and less than 5% of IS values, thereby controlling for endogenous matrix effects.
Linearity and LLOQ
Empagliflozin and henagliflozin calibration curves were evaluated over a concentration range of 5–2,000 ng/mL. These curves were generated by plotting the peak area ratio of the target analyte to the IS against the weighted plasma concentration (1/x2), with the relationship analyzed using linear least-squares regression. For each calibration standard, accuracy and precision were required to fall within ±20% of LLOQ and within ±15% at all other concentration levels.
Accuracy and precision
Accuracy and precision values were determined using six replicates of low, medium, and high QC concentrations. RSD was used to express intra- and inter-day precision, and RE was used to express intra- and inter-day accuracy. The RSD and RE should be within ±15% of the nominal concentration, except for the LLOQ, where it should be ±20%.
Matrix effect and extraction recovery
The matrix effect was evaluated by analyzing three replicates of QCs samples, each prepared using a matrix from six different sources. To evaluate the matrix effect for each analyte, the peak areas of three QC concentrations in post-extracted blank plasma were compared to those of the corresponding analytes in a pure acetonitrile-water solution.
At three QC levels, extraction recovery was determined by comparing the peak areas of pre-extraction samples to those of post-extracted samples.
Stability
The stability of analytes in rat plasma was evaluated using six replicates of QC samples at low, medium, and high concentrations. Stability assessments were conducted under four conditions: 4 h at room temperature (25 °C), 6 h in the autosampler (15 °C), 30 days at −80 °C, and after three freeze-thaw cycles (−80 °C to 25 °C).
Quantitative real-time PCR (qRT-PCR) analysis
Frozen livers and intestines of rats were isolated using the TRNzol extraction method to extract total RNA, according to the manufacturer’s guidelines. Total RNA solution (2 μL) was taken and analyzed by Bio Tek Epoch (Bio Tek Instruments, Inc, Winooski, VT, USA) to determine the RNA concentration and purity using a 260/280 nm absorbance ratio. RNA samples (1 μg of RNA samples were converted to complementary DNA (cDNA) using the FastKing RT Kit. NADPH was served as an internal reference for normalization. PCR assays were performed using the SLAN-96S Real-time PCR system (Shanghai Hongshi Medical Technology Co., Ltd., Shanghai, China) under the following conditions: initial denaturation at 95 °C for 15 min, followed by 40 cycles of 95 °C for 10 s and 60 °C for 32 s. Data analysis was conducted by 2−∆∆CT method. The PCR primer sequences used for amplification are listed in Table 2.
| Gene | Forward primer | Reverse primer |
|---|---|---|
| Ugt1a7 | 5′ AGTGTCCGTTTGGTTGTT-3′ | 5′-TTCCATCGCTTTCTTCTC-3′ |
| Ugt2b7 | 5′-GCTCACATGGTAGCCAAAGG-3′ | 5′-GGTCATGGTGAATGGCTGAC-3′ |
| Abcb1a | 5′-TCTGGTATGGGACTTCCTTGGT-3′ | 5′-TCCTTGTATGTTGTCGGGTTTG-3′ |
| Abcg2 | 5′-TGAAGAGTGGCTTTCTAGTCCG-3′ | 5′-TTGAAATTGGCAGGTTGAGGTG-3′ |
| Oatp1b2 | 5′-GCTGATTGGAATTGGCTGCTT-3′ | 5′-GGTGAAGGTCCAGTGGGTGA-3′ |
| NAPDH | 5′-GCCTTCCGTGTTCCTACC-3′ | 5′-GCCTGCTTCACCACCTTC-3′ |
Statistical analysis
The number of animals (n = 6) was estimated using the resource equation method (Arifin & Zahiruddin, 2017). For or one-way analysis of variance (ANOVA), the minimun n = 10/k + 1 (k = number of groups, and n = number of subjects per group). In this study to compare the pharmacokinetic parameters between two treatment groups (experiment and control), the sample sizes per group are: the minimun n = 10/2 + 1 = 6. Non-compartmental analysis of plasma concentration–time data was performed using DAS 2.1.1 Software (Mathematical Pharmacology Professional Committee of China, Shanghai, China). The pharmacokinetic analysis included the area under the concentration-time curve (AUC), maximum plasma concentration (Cmax), time to reach Cmax (Tmax), elimination half-life (t1/2), plasma clearance volume per time unit (CLz/F), apparent volume of distribution (Vz/F), and mean residence time (MRT). Pharmacokinetic variables were expressed as geometric mean values and standard deviation. SPSS software (SPSS Inc., Chicago, IL, USA) was used to statistically analyze the pharmacokinetic parameters. Levene’s test was used to assess the homogeneity of variances between groups, with a p-value threshold of 0.05. When variances were found to be equal (P > 0.05), t-tests were applied. In cases where variances were unequal (P < 0.05), the Satterthwaite correction was applied to adjust for unequal variances. Differences between the parameters which showed significant deviation from normality were tested with the Mann-Whitney U test.
Results
Method development
Liquid–liquid extraction with ethyl acetate was used to process the samples because it provided better extraction than methyl tert-butyl ether. To obtain good peak symmetry, high detection sensitivity, and shortened retention times, we optimized many liquid chromatographic conditions, such as column type and mobile phase. Separation of analytes and the internal standard (IS) was achieved using a Welch Boltimate column (2.1 mm × 100 mm, 2.7 μm) maintained at 45 °C. The aqueous phase (A), containing 5 mM ammonium acetate and 0.1% formic acid, significantly improved chromatographic signals and peak profiles for empagliflozin and henagliflozin. In the organic phase (B), acetonitrile exhibited stronger elution capacity compared to methanol. A gradient elution method was implemented, starting with 55% acetonitrile at a flow rate of 0.25 mL/min, which enhanced detection sensitivity and reduced retention time. Mass spectrometry analysis was conducted in positive and multiple reaction monitoring (MRM) modes, with ion monitoring transitions at m/z 451.2→70.9, 455.3→290.9, and 426.1→167.2, respectively (Fig. 1). Further details on the optimization of mass parameters are provided in Table 3.
| Experimental setting | Empagliflozin | Henagliflozin | Dapagliflozin |
|---|---|---|---|
| MRM transition | 451.2→70.9 | 455.3→290.9 | 426.1→167.2 |
| Delustering potential (DP), V | 70 | 130 | 80 |
| Collision energy (CE), V | 22 | 38 | 30 |
| Collision cell exit potential (CXP), V | 14 | 14 | 10 |
| Entrance potential (EP), V | 10 | 10 | 8 |
Method validation
Selectivity
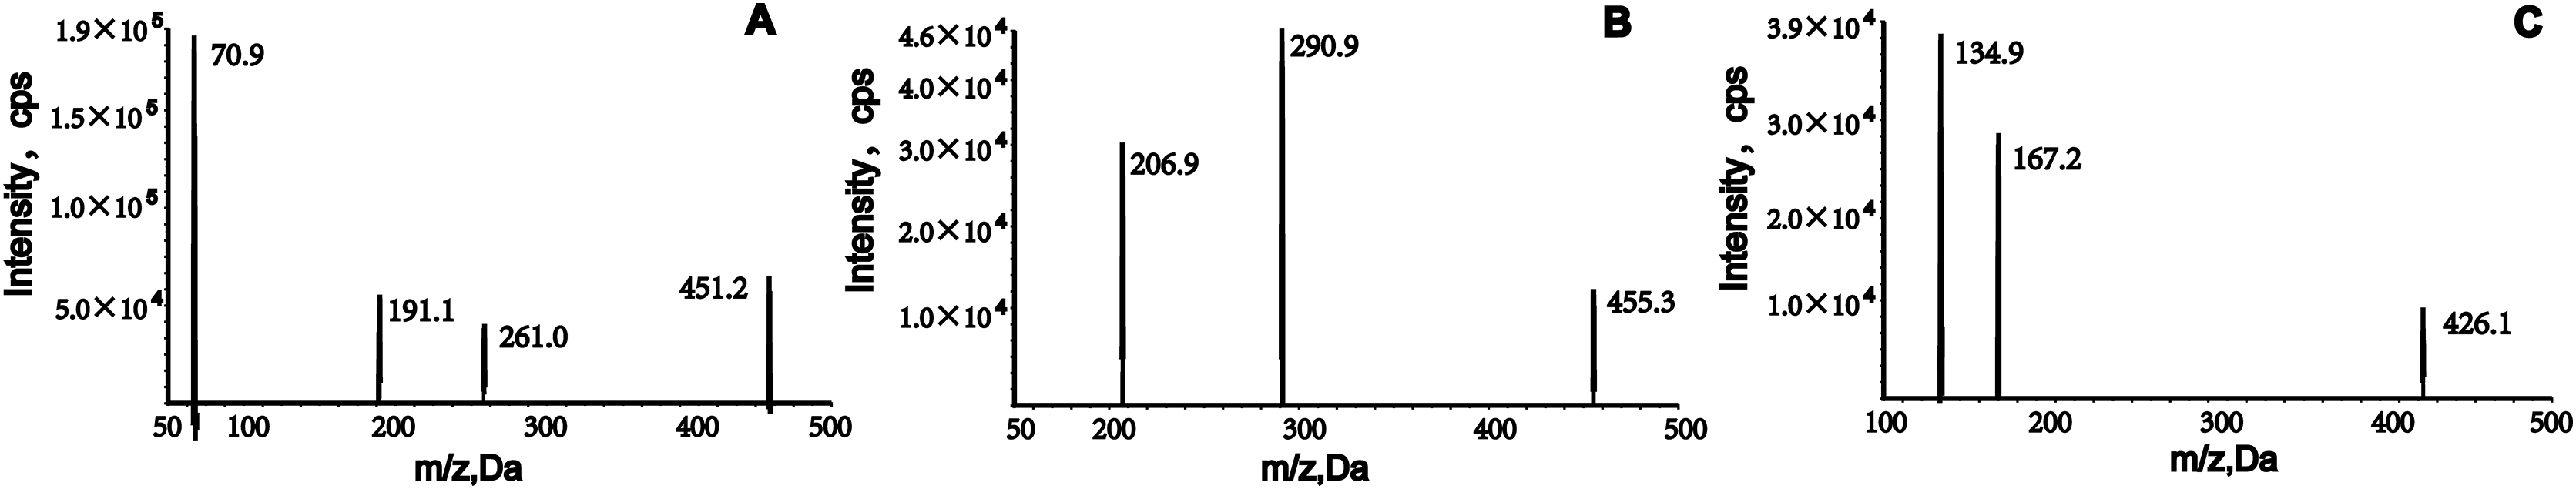
To assess selectivity, six blank plasma samples from different rats were compared with plasma samples spiked with analytes and IS, as well as plasma samples from rats treated with empagliflozin or henagliflozin. Chromatograms were obtained from an unmodified blank sample, blank plasma spiked with analytes at the LLOQ and IS, and plasma samples from drug-treated rats (Fig. 2). The retention times of analytes in spiked samples were identical to those in drug-treated rat samples, demonstrating no interference from endogenous substances in rat plasma.
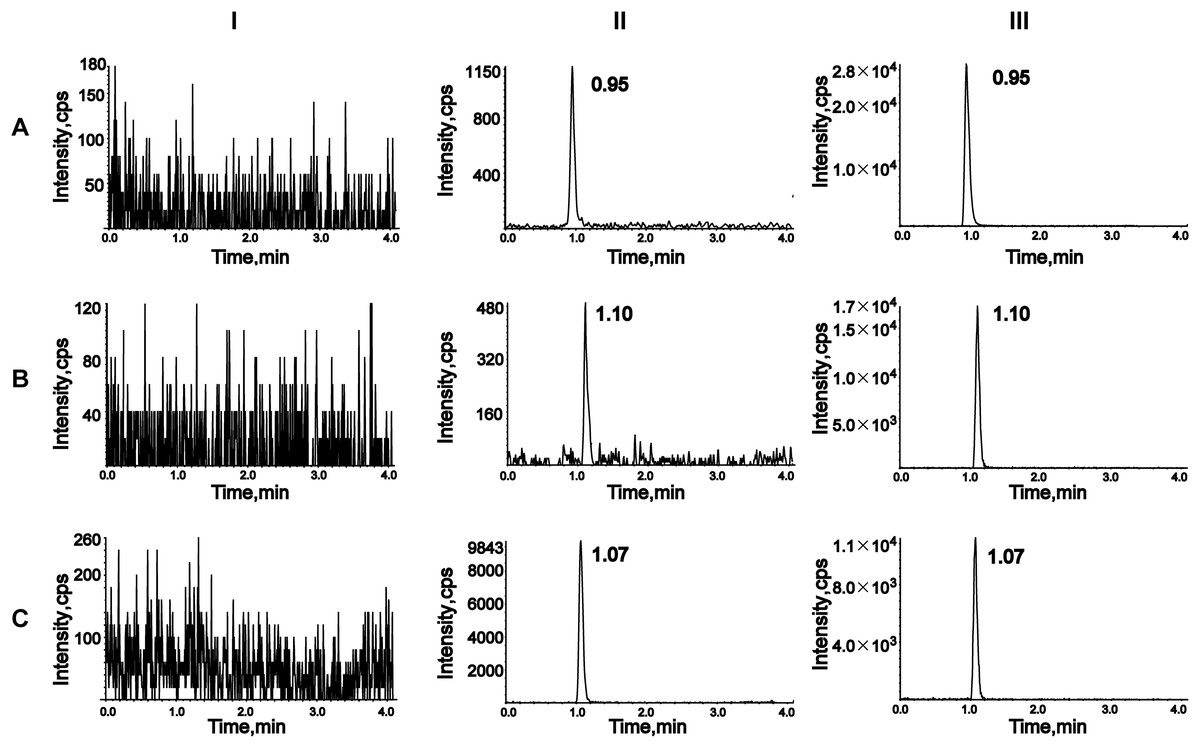
Figure 2: Representative chromatograms of empagliflozin (A), henagliflozin (B), and dapagliflozin (C).
I, a blank rat plasma sample; II, a blank rat plasma sample spiked with the working solution at LLOQ level and IS; III, a rat plasma sample after oral administration of 2.5 mg/kg empagliflozin and 1 mg/kg henagliflozin.
Calibration curve and LLOQ
Calibration curves for empagliflozin and henagliflozin were established using linear regression analysis over concentration ranges of 5–2,000 ng/mL. The equations for the curves were Y = 0.00129X + 0.000603 (r = 0.999) for empagliflozin and Y = 0.00196X + 0.00976 (r = 0.999) for henagliflozin. At all concentrations, including the LLOQ, the precision (RSD) and accuracy (RE) of the measured values were within 15% of the nominal concentrations, meeting the required criteria.
Precision and accuracy
The precision and accuracy of QC samples at low, medium, and high concentrations, and for the LLOQ samples are reported in Table 4. The intra- and inter-day precision values were no greater than 9.35%, and the accuracies ranged from −5.46% to 4.40% for all investigated analyte concentrations in rat plasma. These results indicate that the proposed method is reproducible.
| Analyte | Concentration (ng/mL) |
Intra-Day (n = 6) | Inter-Day (n = 18) | ||||
|---|---|---|---|---|---|---|---|
| Mean ± SD | RSD (%) | RE (%) | Mean ± SD | RSD (%) | RE (%) | ||
| Empagliflozin | 5 | 5.06 ± 0.27 | 5.44 | 1.10 | 5.04 ± 0.40 | 8.00 | 0.87 |
| 15 | 15.57 ± 0.68 | 4.39 | 3.78 | 15.32 ± 1.31 | 8.54 | 2.11 | |
| 800 | 826.00 ± 23.59 | 2.86 | 3.25 | 835.17 ± 37.61 | 4.50 | 4.40 | |
| 1,500 | 1,506.67 ± 78.15 | 5.19 | 0.44 | 1,502.22 ± 93.65 | 6.23 | 0.15 | |
| Henagliflozin | 5 | 4.96 ± 0.73 | 7.55 | −0.8 | 4.82 ± 0.43 | 8.84 | −3.53 |
| 10 | 10.08 ± 0.67 | 6.62 | 0.75 | 10.04 ± 0.94 | 9.35 | 0.39 | |
| 800 | 756.33 ± 19.86 | 2.60 | −5.46 | 767.00 ± 35.96 | 4.69 | 4.13 | |
| 1,500 | 1,448.33 ± 39.71 | 2.74 | −3.44 | 1,462.78 ± 64.43 | 4.40 | −2.48 | |
Matrix effects and extraction recovery
The matrix effects and recovery results are detailed in Table 5. Empagliflozin exhibited a matrix effect of 109% and henagliflozin showed values ranging from 96% to 100%, indicating no significant matrix interference in rat plasma. Recovery rates, normalized using the IS peak area, fell within the range of 95% to 111%, with an RSD below 6% for all analytes. These results highlight the efficiency, reliability, and reproducibility of the liquid–liquid extraction method.
| Analyte | Concentration (ng/mL) |
Matrix effect | Extraction recovery | ||
|---|---|---|---|---|---|
| Mean ± SD (%) | RSD (%) | Mean ± SD (%) | RSD (%) | ||
| Empagliflozin | 15 | 109.17 ± 3.70 | 3.39 | 100.50 ± 3.36 | 3.35 |
| 800 | 109.65 ± 3.27 | 2.98 | 111.98 ± 1.33 | 1.18 | |
| 1,500 | 109.07 ± 0.74 | 0.68 | 108.25 ± 4.97 | 4.59 | |
| Henagliflozin | 10 | 96.69 ± 2.43 | 2.51 | 101.59 ± 1.87 | 1.84 |
| 800 | 99.43 ± 1.26 | 1.27 | 101.26 ± 1.45 | 1.43 | |
| 1,500 | 100.77 ± 8.72 | 8.65 | 95.58 ± 5.35 | 5.60 | |
Stability
Stability of the target analytes in QC samples was assessed under four conditions: room temperature, 15 °C in the autosampler, −80 °C, and three freeze-thaw cycles (Table 6). For all conditions, the RE values were within 7%, and the RSD was less than 10%, confirming the excellent stability achieved with this method.
| Analyte | Conditions | Concentration (ng/mL) |
Mean ± SD (ng/ml) | Precision (RSD%) | Accuracy (RE%) |
|---|---|---|---|---|---|
| Empagliflozin | Autosampler (15 °C) for 6 h | 15 | 15.72 ± 0.78 | 4.95 | 4.78 |
| 800 | 853.00 ± 50.88 | 5.96 | 6.63 | ||
| 1,500 | 1,558.33 ± 99.48 | 6.38 | 3.89 | ||
| Room temperature for 4 h | 15 | 14.90 ± 0.91 | 6.14 | −0.67 | |
| 800 | 837.67 ± 29.62 | 3.54 | 4.71 | ||
| 1,500 | 1,533.33 ± 37.77 | 2.46 | 2.22 | ||
| −80 °C for 30 days | 15 | 15.23 ± 1.43 | 9.38 | 1.56 | |
| 800 | 833.17 ± 38.43 | 4.61 | 4.15 | ||
| 1,500 | 1,473.33 ± 93.31 | 6.33 | −1.78 | ||
| Three freeze–thaw cycles (−80 °C to 25 °C) |
15 | 14.90 ± 0.91 | 6.14 | −0.67 | |
| 800 | 853.17 ± 38.25 | 4.48 | 6.65 | ||
| 1,500 | 1,516.67 ± 97.50 | 6.43 | 1.11 | ||
| Henagliflozin | Autosampler (15 °C) for 6 h | 10 | 9.57 ± 0.87 | 9.07 | −4.33 |
| 800 | 784.83 ± 31.98 | 4.07 | −1.90 | ||
| 1,500 | 1,436.67 ± 29.44 | 2.05 | −4.22 | ||
| Room temperature for 4 h | 10 | 9.97 ± 0.73 | 7.28 | −0.28 | |
| 800 | 763.00 ± 31.79 | 4.17 | −4.63 | ||
| 1,500 | 1,470.00 ± 59.67 | 4.06 | −2.00 | ||
| −80 °C for 30 days | 10 | 9.89 ± 0.95 | 9.57 | −1.12 | |
| 800 | 789.17 ± 38.83 | 4.92 | −1.35 | ||
| 1,500 | 1,468.33± 53.45 | 3.64 | −2.11 | ||
| Three freeze–thaw cycles (−80 °C to 25 °C) |
10 | 9.83 ± 0.95 | 9.70 | −1.70 | |
| 800 | 770.83 ± 18.66 | 2.42 | −3.65 | ||
| 1,500 | 1,508.33 ± 72.78 | 4.83 | 0.56 |
Pharmacokinetic interactions
The influence of empagliflozin and henagliflozin on the pharmacokinetics of sorafenib
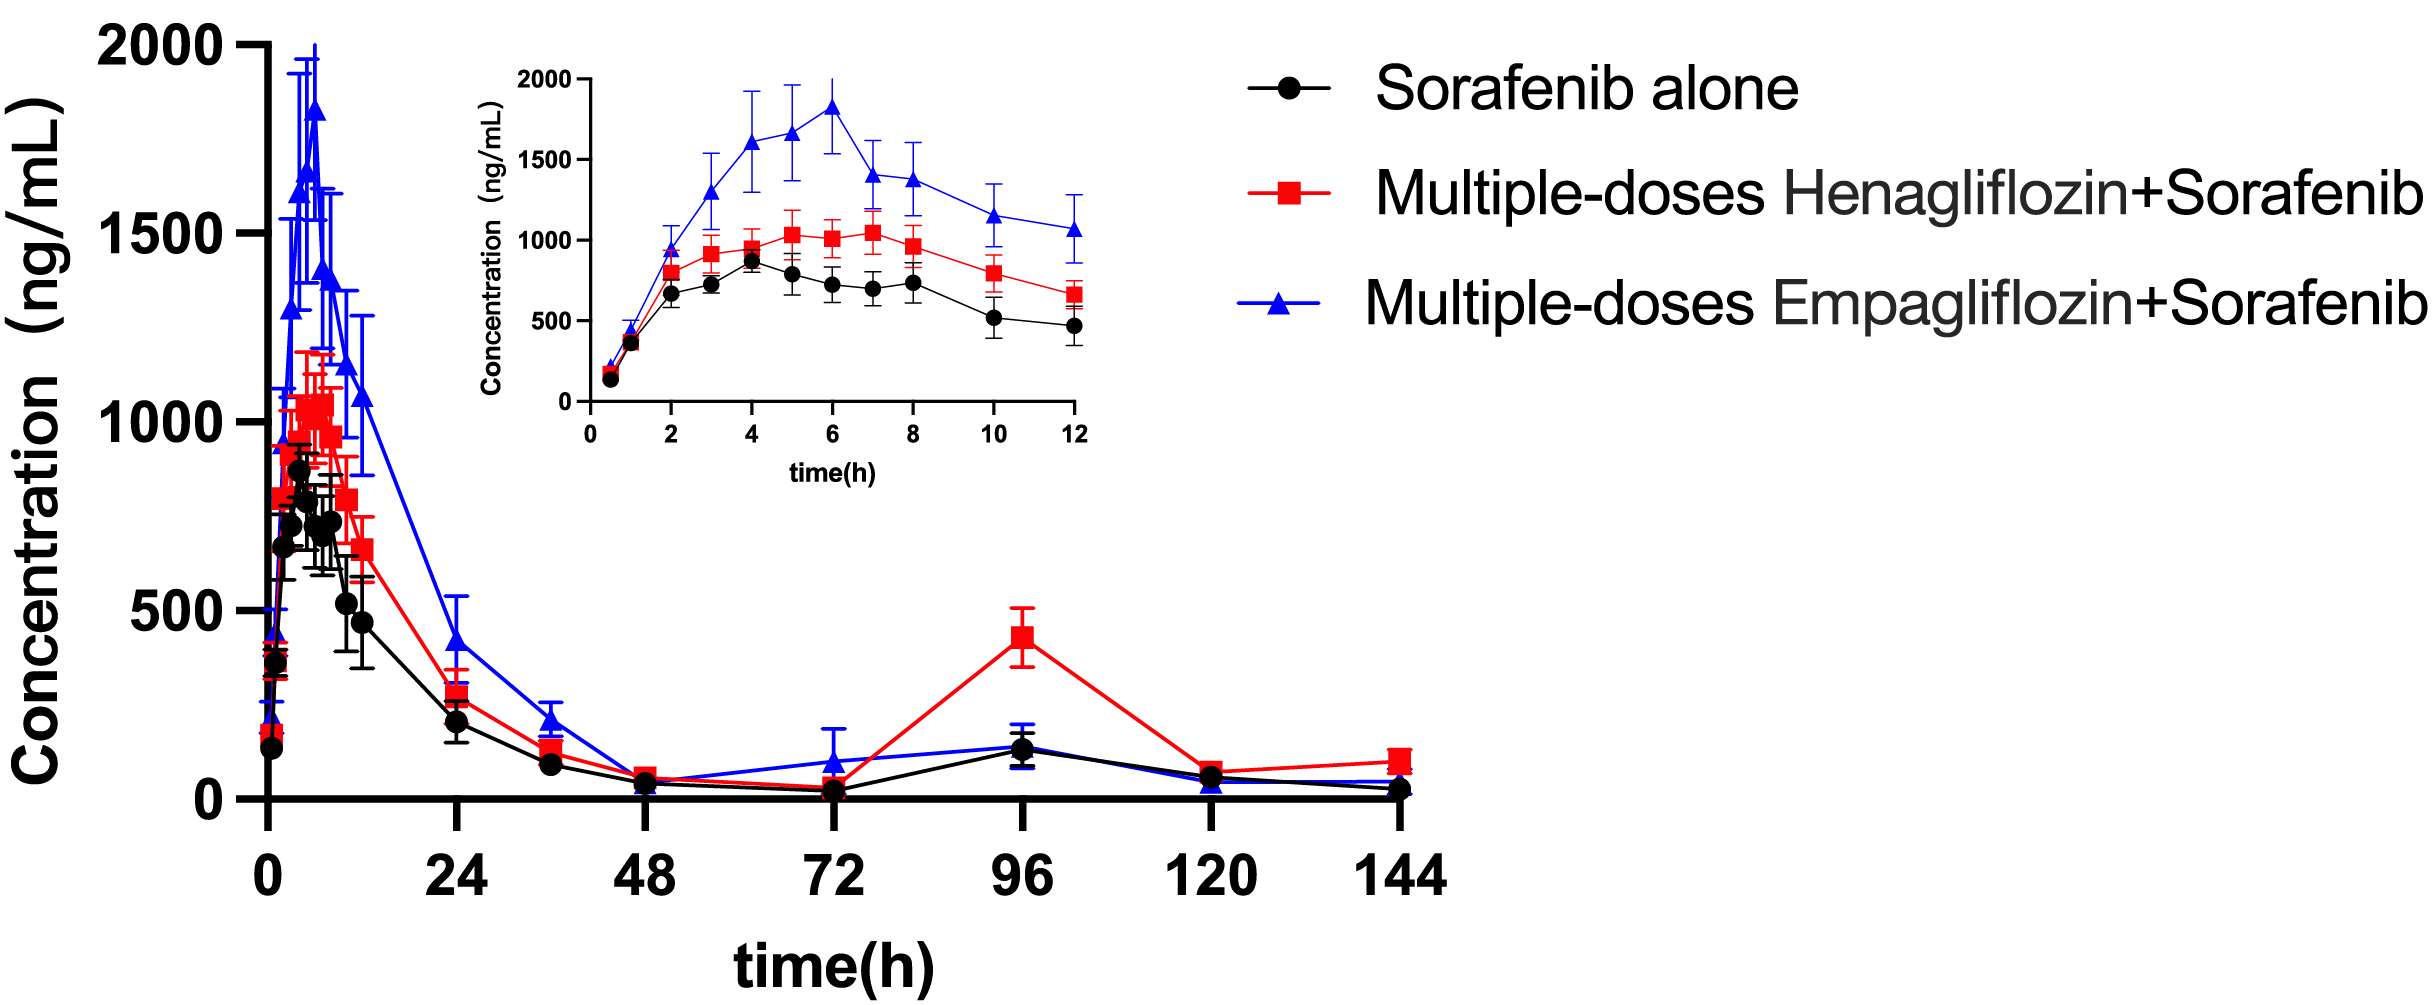
The mean concentration–time profiles for sorafenib administered alone and in combination with multiple doses of empagliflozin or henagliflozin are shown in Fig. 3. The main pharmacokinetic parameters of sorafenib obtained using non-compartmental methods are summarized in Table 7. After the administration of empagliflozin to rats, the Cmax, AUC0–t and AUC0–∞ of sorafenib increased by 92% (P = 0.019), 84% (P = 0.037), and 93% (P = 0.043) of that of the sorafenib alone group, respectively. The CLz/F of sorafenib were significantly decreased by 45% (P = 0.037) compared in control group.
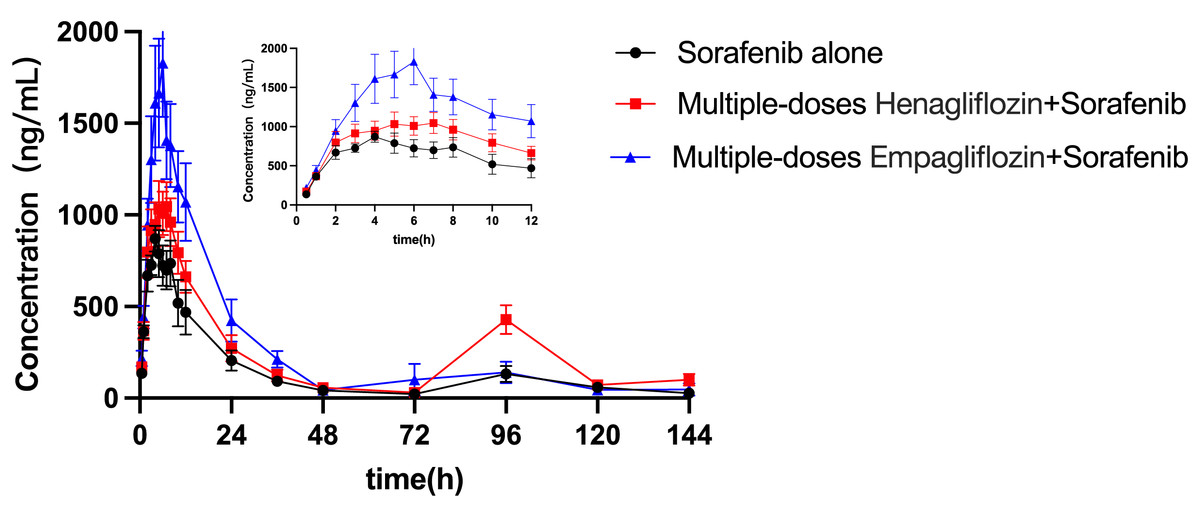
Figure 3: Mean plasma concentration–time profiles of sorafenib after oral administration alone and following multiple doses of empagliflozin or henagliflozin (n = 6).
| Parameters (Unit) | Sorafenib (100 mg/kg) | ||
|---|---|---|---|
| Alone | After empagliflozin | After henagliflozin | |
| AUC0–t (μg/L*h) | 20,034.83 ± 9,089.00 | 36,992.26 ± 14,722.99* | 33,531.19 ± 7,464.47* |
| AUC0–∞ (μg/L*h) | 20,648.20 ± 9,598.13 | 39,936.00 ± 17,942.31* | 37,215.92 ± 8,570.39** |
| Cmax (μg/L) | 967.17 ± 175.53 | 1,859.17 ± 760.53* | 1,231.17 ± 285.26 |
| Tmax (h) | 4.33 ± 2.07 | 5.50 ± 0.84 | 5.67 ± 2.58 |
| t1/2 (h) | 18.74 ± 4.85 | 47.56 ± 32.23 | 28.58 ± 21.71 |
| CLz (L/h/kg) | 5.82 ± 2.59 | 3.20 ± 2.01* | 2.81 ± 0.65* |
| Vz (L/kg) | 93.83 ± 63.20 | 201.55 ± 161.11 | 110.19 ± 73.12 |
| MRT0–t (h) | 37.22 ± 11.42 | 28.72 ± 11.50 | 51.01 ± 11.10 |
| MRT0–∞ (h) | 40.46 ± 13.37 | 39.80 ±2 2.93 | 65.97 ± 24.79 |
When coadministered with henagliflozin, the AUC0–t and AUC0–∞ of sorafenib significantly increased by 67% (P = 0.035) and 80% (P = 0.042), respectively. Furthermore, the CLz/F of sorafenib was significantly decreased by 55% (P = 0.037) compared with that in the sorafenib alone group. However, no significant difference was observed among the groups in the following pharmacokinetic parameters of sorafenib: Cmax, Tmax, t1/2z, Vz/F, MRT0–t, and MRT0–∞. In addition, 96 h after SOR gavage, the pharmacokinetic curves showed a second absorption peak as the concentration of SOR in rats increased again.
The influence of sorafenib on the pharmacokinetics of empagliflozin
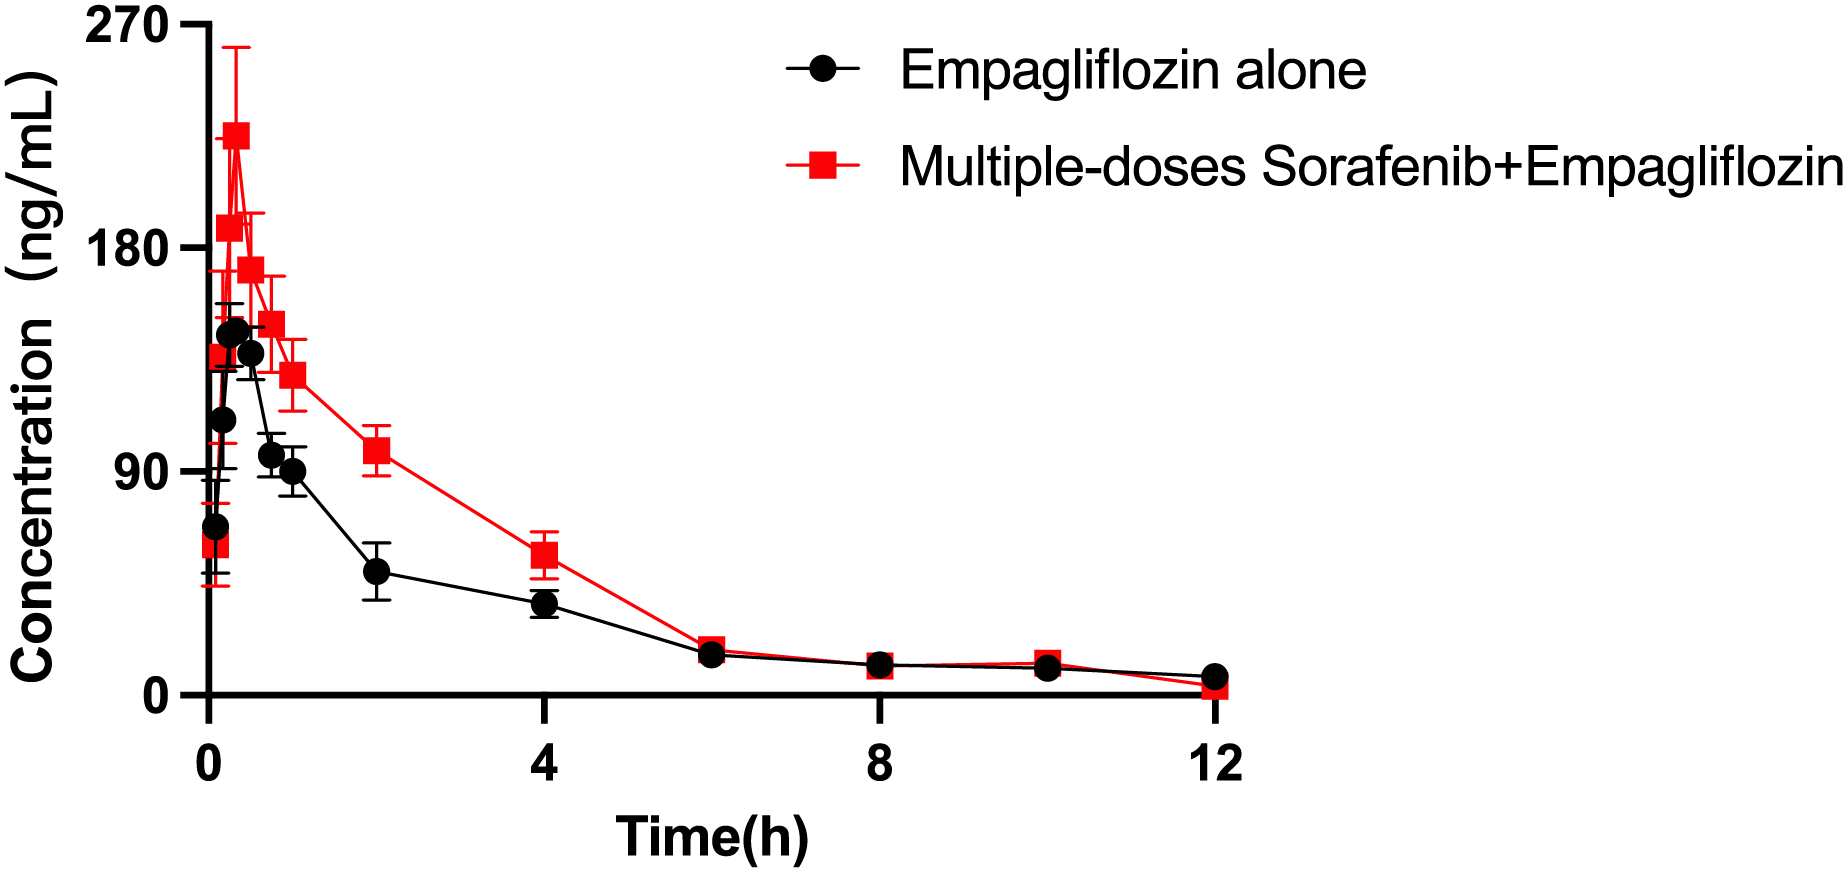
The mean plasma concentration–time curves of empagliflozin when administered alone and when coadministered with sorafenib are presented in Fig. 4, and the main pharmacokinetic parameters of empagliflozin are displayed in Table 8. When coadministered with sorafenib, the AUC0–t and AUC0–∞ of empagliflozin increased by 44.65% (P = 0.009) and 30.59% (P = 0.044), respectively. The Vz/F of empagliflozin were significantly decreased by 50.68% (P = 0.024) compared to control group. In the group of rats receiving both drugs, Cmax was higher than that in the control group, but the difference was not statistically significant.
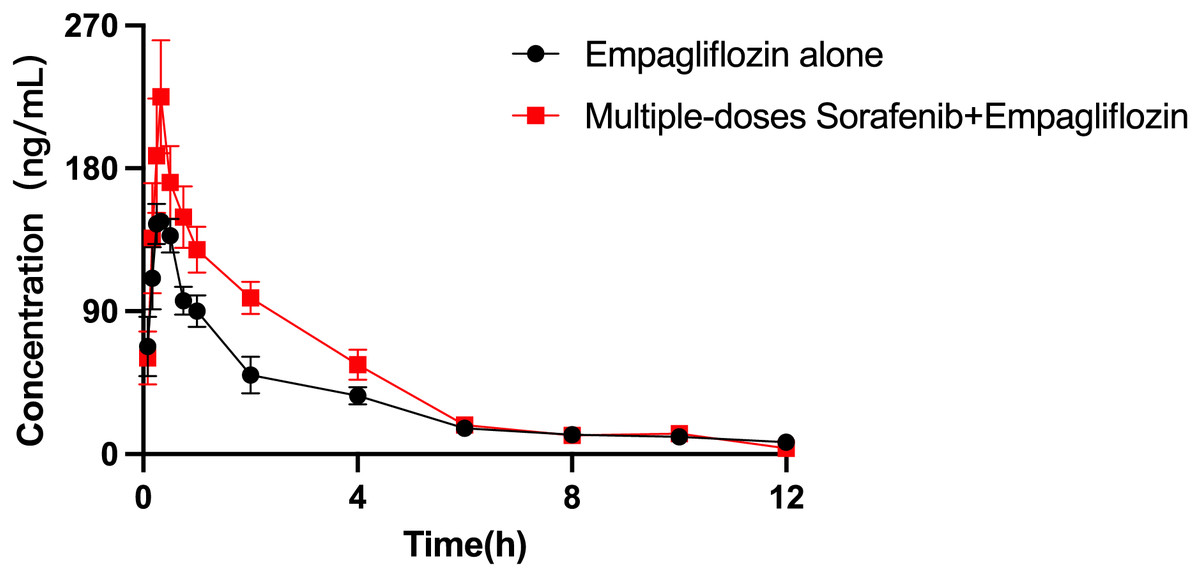
Figure 4: Mean plasma concentration–time profiles of empagliflozin after oral administration alone and following multiple doses of sorafenib (n = 6).
| Parameters (Unit) | Empagliflozin (2.5 mg/kg) | |
|---|---|---|
| Alone | After sorafenib | |
| AUC0–t (μg/L*h) | 389.31 ± 76.86 | 563.12 ± 109.87** |
| AUC0–∞ (μg/L*h) | 448.43 ± 101.99 | 585.59 ± 104.18* |
| Cmax (μg/L) | 172.50 ± 16.26 | 231.17 ± 78.51 |
| Tmax (h) | 0.28 ± 0.12 | 0.40 ± 0.17 |
| t1/2 (h) | 5.03 ± 2.29 | 3.14 ± 1.09 |
| CLz (L/h/kg) | 5.84 ± 1.45 | 4.38 ± 0.75 |
| Vz (L/kg) | 40.92 ± 16.03 | 20.18 ± 8.16* |
| MRT0–t (h) | 3.20 ± 0.29 | 2.86 ± 0.21* |
| MRT0–∞ (h) | 5.42 ± 2.07 | 3.44 ± 0.52 |
The influence of sorafenib on the pharmacokinetics of henagliflozin
The arithmetic means of the plasma concentrations of henagliflozin after oral administration alone or following multiple doses of sorafenib are presented in Fig. 5. The main pharmacokinetic parameters are listed in Table 9. When henagliflozin and sorafenib were administered, the AUC0–t and AUC0–∞ of henagliflozin increased by 79.1% (P = 0.002) and 77.7 % (P = 0.002), respectively. The CLz/F of henagliflozin was significantly decreased by 55% (P = 0.002) compared to control group. There were no significant differences between Tmax, t1/2, Vz/F, MRT0–t and MRT0–∞.
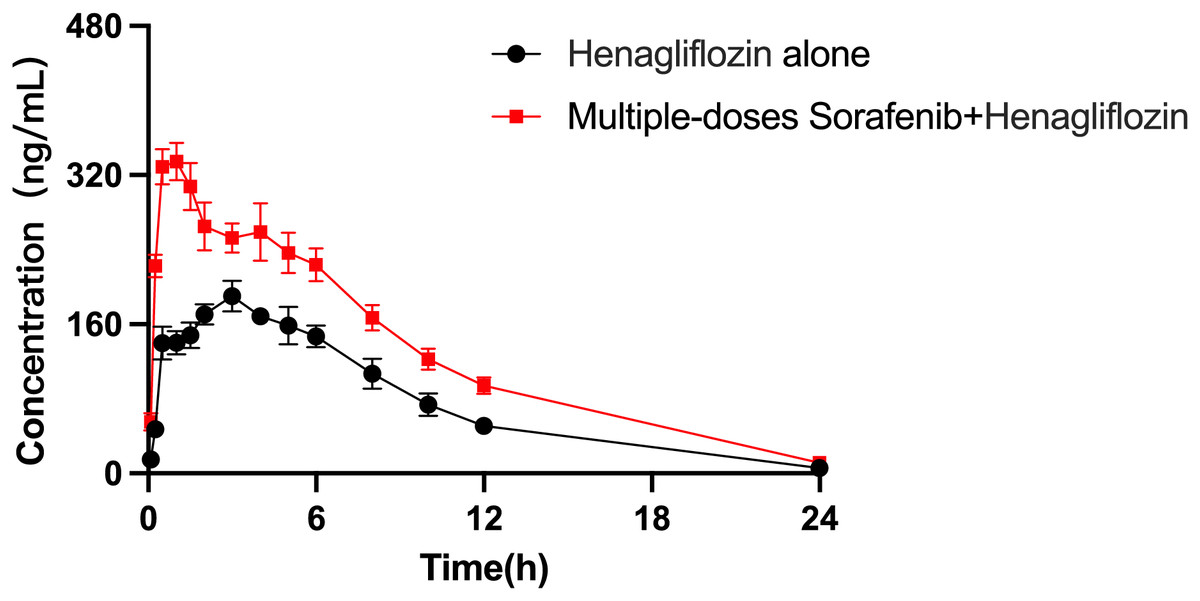
Figure 5: Mean plasma concentration–time profiles of henagliflozin after oral administration alone and following multiple doses of sorafenib (n = 6).
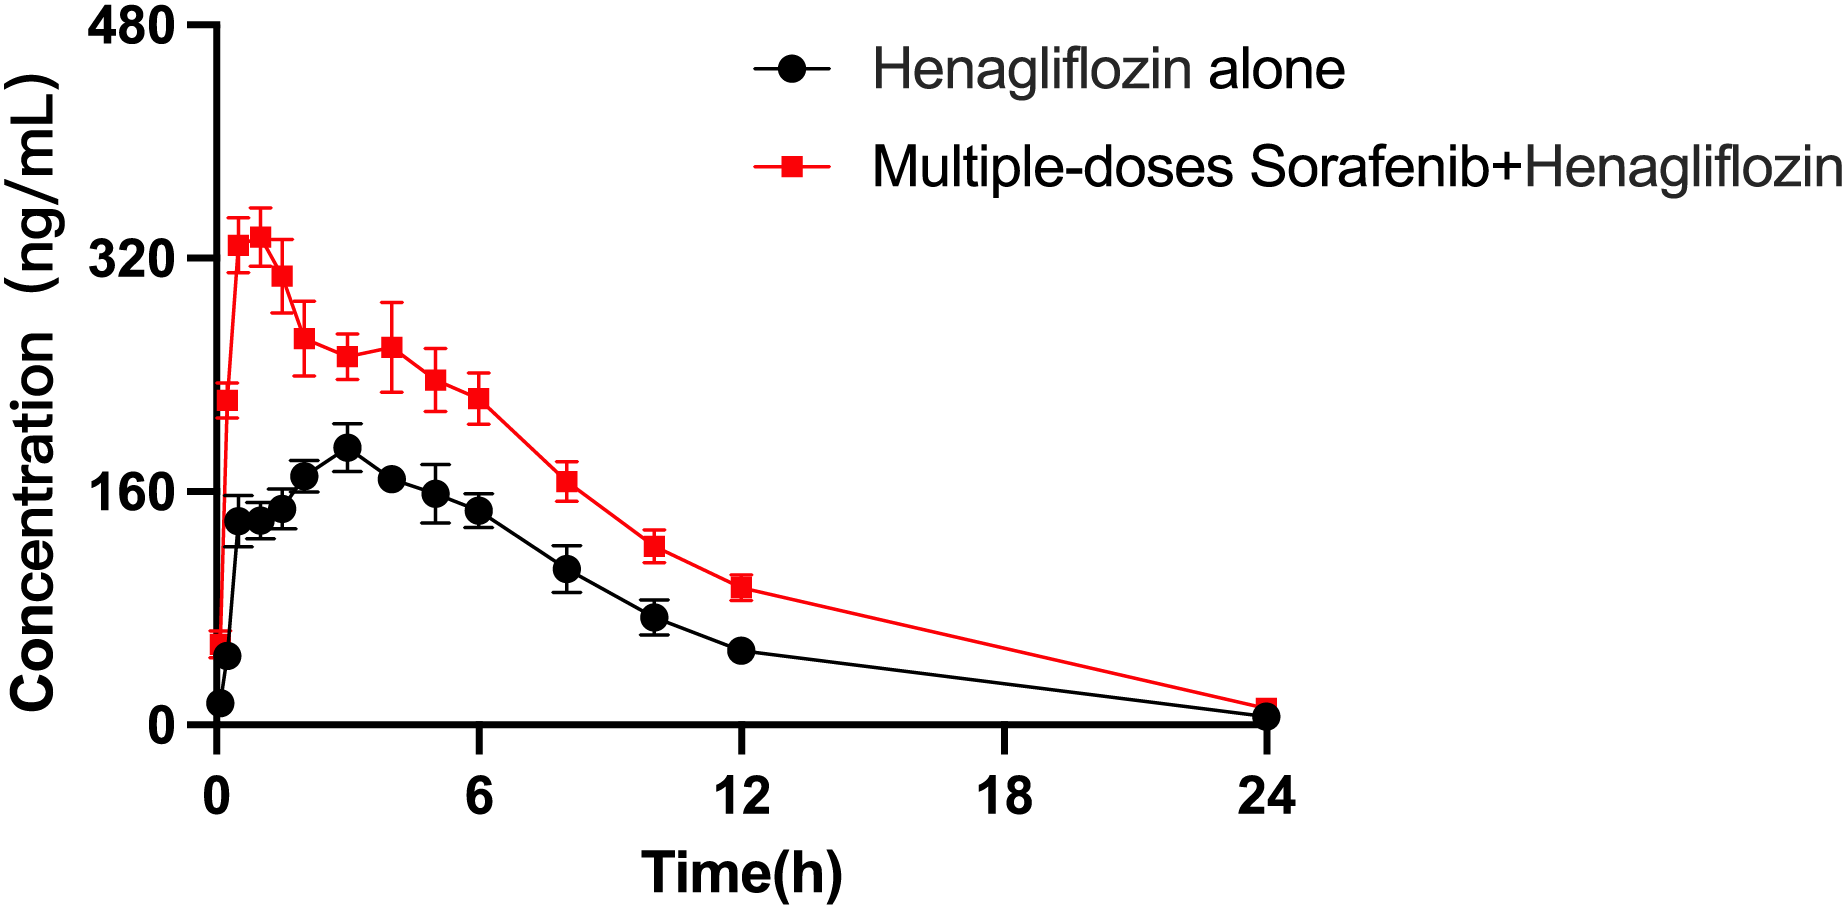
| Parameters (Unit) | Henagliflozin (1 mg/kg) | |
|---|---|---|
| Alone | After sorafenib | |
| AUC0–t (μg/L*h) | 1,924.34 ± 376.44 | 3,452.28 ± 804.60** |
| AUC0–∞ (μg/L*h) | 1,947.08 ± 367.13 | 3,460.48 ± 801.20** |
| Cmax (μg/L) | 197.17 ± 36.94 | 357.67 ± 54.49** |
| Tmax (h) | 3.25 ± 1.67 | 1.33 ± 1.36 |
| t1/2 (h) | 5.11 ± 3.62 | 5.10 ± 1.31 |
| CLz (L/h/kg) | 0.53 ± 0.1 | 0.30 ± 0.05** |
| Vz (L/kg) | 3.88 ± 2.8 | 2.25 ± 0.77 |
| MRT0–t (h) | 7.84 ± 1.68 | 9.36 ± 3.63 |
| MRT0–∞ (h) | 8.49 ± 2.86 | 9.49 ± 3.57 |
Notes:
Pharmacokinetic parameters are expressed as the mean ± standard deviation.
Messenger RNA (mRNA) expression in rat liver and intestines
The relative mRNA expression levels in the liver and intestine of the rats are shown in Fig. 6. After the administration of sorafenib for seven consecutive days, the mRNA expression of Ugt2b7 in the intestine downregulated by 68.3% (P = 0.017); however, it did not significantly affect the expression of Ugt2b7 in the liver (Fig. 6A). The effect of empagliflozin after multiple doses on the mRNA expression of Ugt1a7 in liver decreased by 40.07% (P = 0.023) and demonstrated no significant inhibition in intestine. The mRNA expression of P-gp decreased by 61.19% (P = 0.036) and 22.77% (P = 0.042) in liver and intestine, respectively, and with a depression of 37.43% (P = 0.028) about that of Oatp1b2 (Fig. 6B). When treated with multiple doses of henagliflozin, the results revealed that the mRNA expression levels of P-gp and Oatp1b2 in rat liver were obviously decreased by 27.1% (P = 0.022) and 38.4% (P = 0.019), respectively. In addition, in intestine, the mRNA expression levels of P-gp shown a decreased by 43.2% (P = 0.018, Fig. 6C). However, there was no significant change in the expression of Ugt1a7 in either the liver or the intestine.
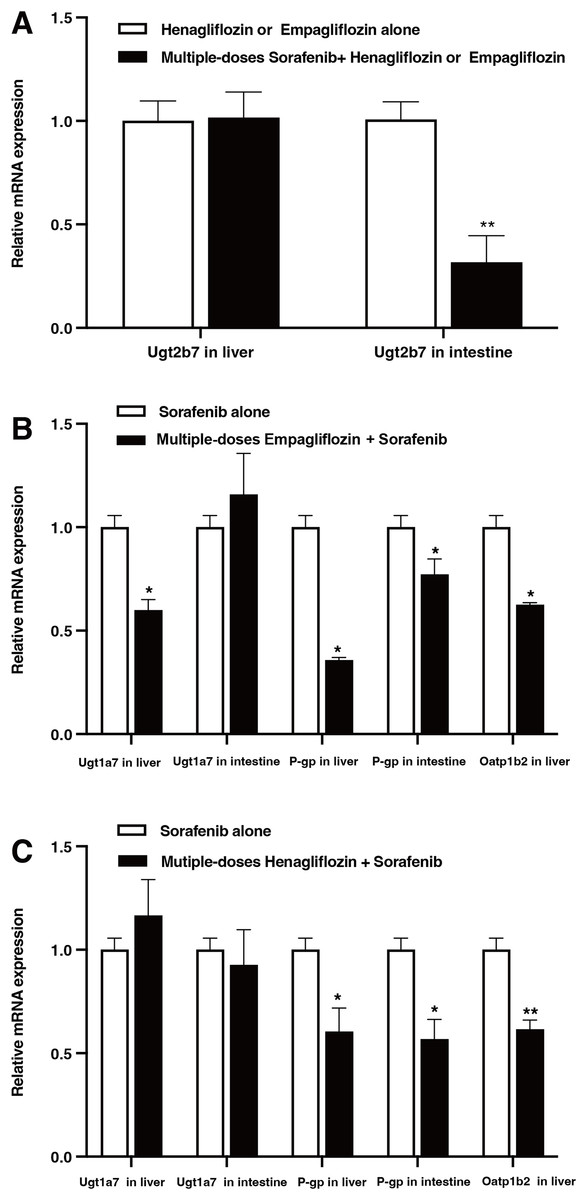
Figure 6: Relative mRNA expression in liver and intestine.
(A) Effect of multiple-doses sorafenib administration on mRNA expression of Ugt2b7 in liver and intestine; (B) effect of multiple-doses empagliflozin administration on mRNA expression of Ugt1a7 in liver and P-gp in liver and intestine; (C) effect of multiple-doses henagliflozin administration on mRNA expression of Ugt1a7 and P-gp in liver and intestine and Oatp1b2 in liver; *P < 0.05 **P < 0.01.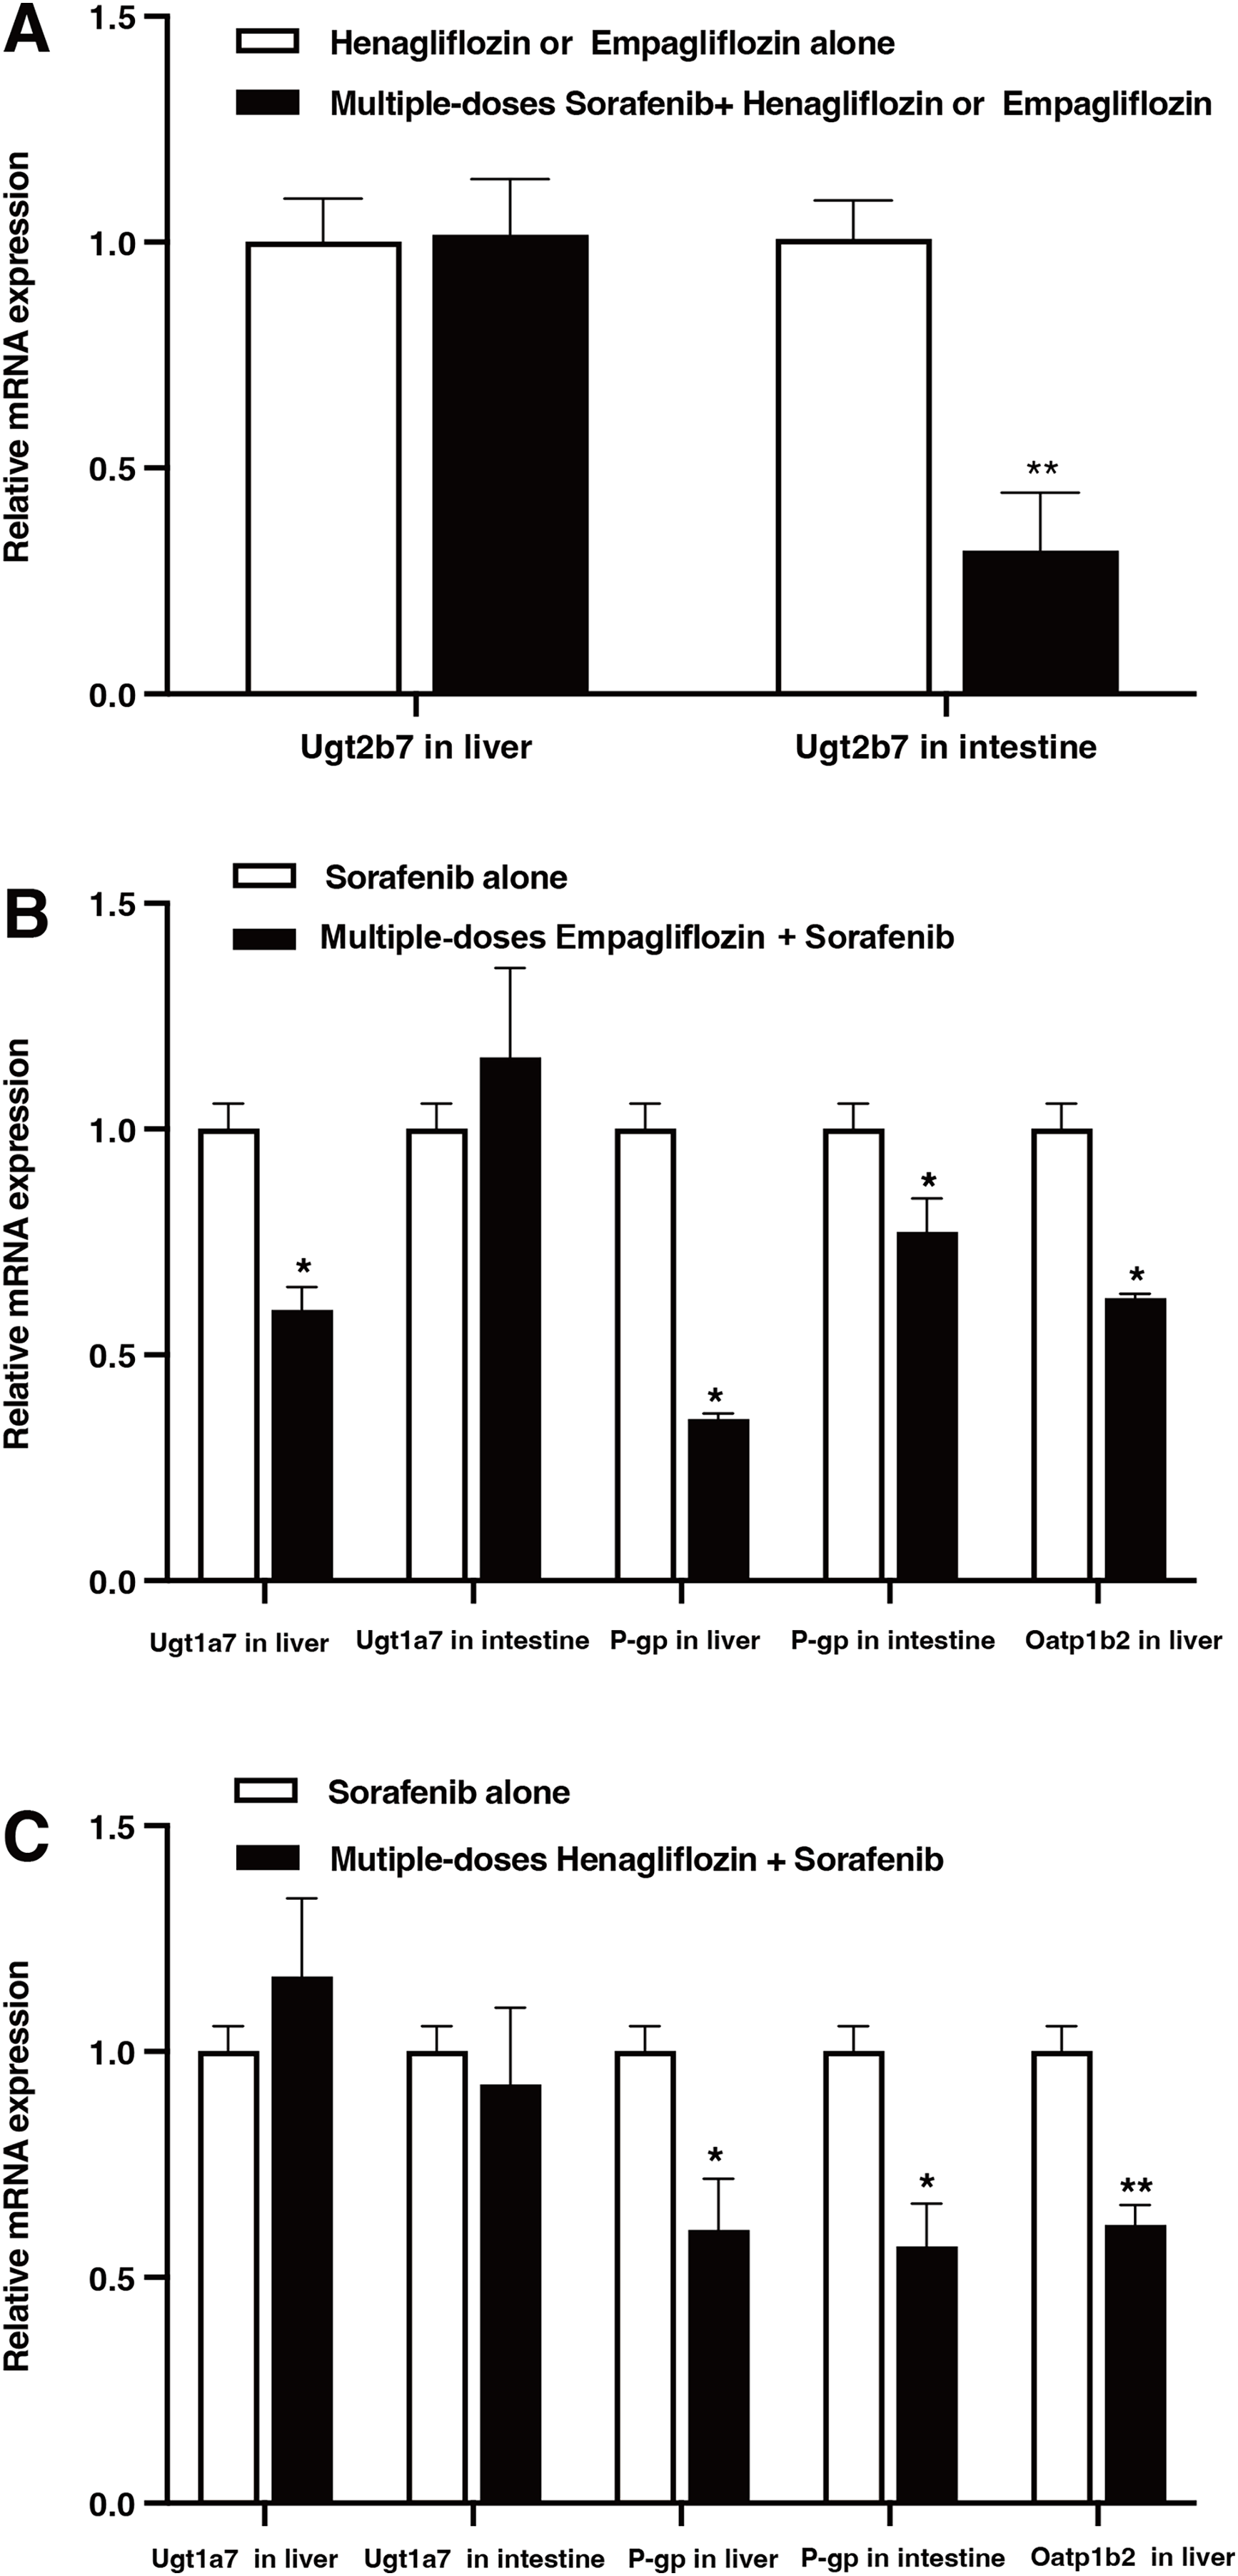
Discussion
Our previous study indicated that coadministration of multiple doses of sorafenib or donafenib resulted in increased systemic exposure to dapagliflozin (He et al., 2023, 2022). Owing to the possibility of sorafenib being used concomitantly with SGLT2 (empagliflozin or henagliflozin) in patients with HCC, we conducted this study to examine the significant interaction between these three drugs. This study reveals that coadministration of empagliflozin and henagliflozin resulted in increased exposure to sorafenib. Compared with the control group, the empagliflozin and sorafenib groups displayed a nearly 93% increase in AUC of sorafenib and a 92% higher Cmax. Similarly, henagliflozin increased the AUC of sorafenib by 80%, accompanied by decrease in the CLz/F, suggesting an increase in bioavailability of the drug. Importantly, these results highlight the potential for increased bleeding risk when these drugs are used concurrently, underscoring the need for careful dose adjustment and clinical monitoring.
Effects of empagliflozin and henagliflozin on sorafenib pharmacokinetics
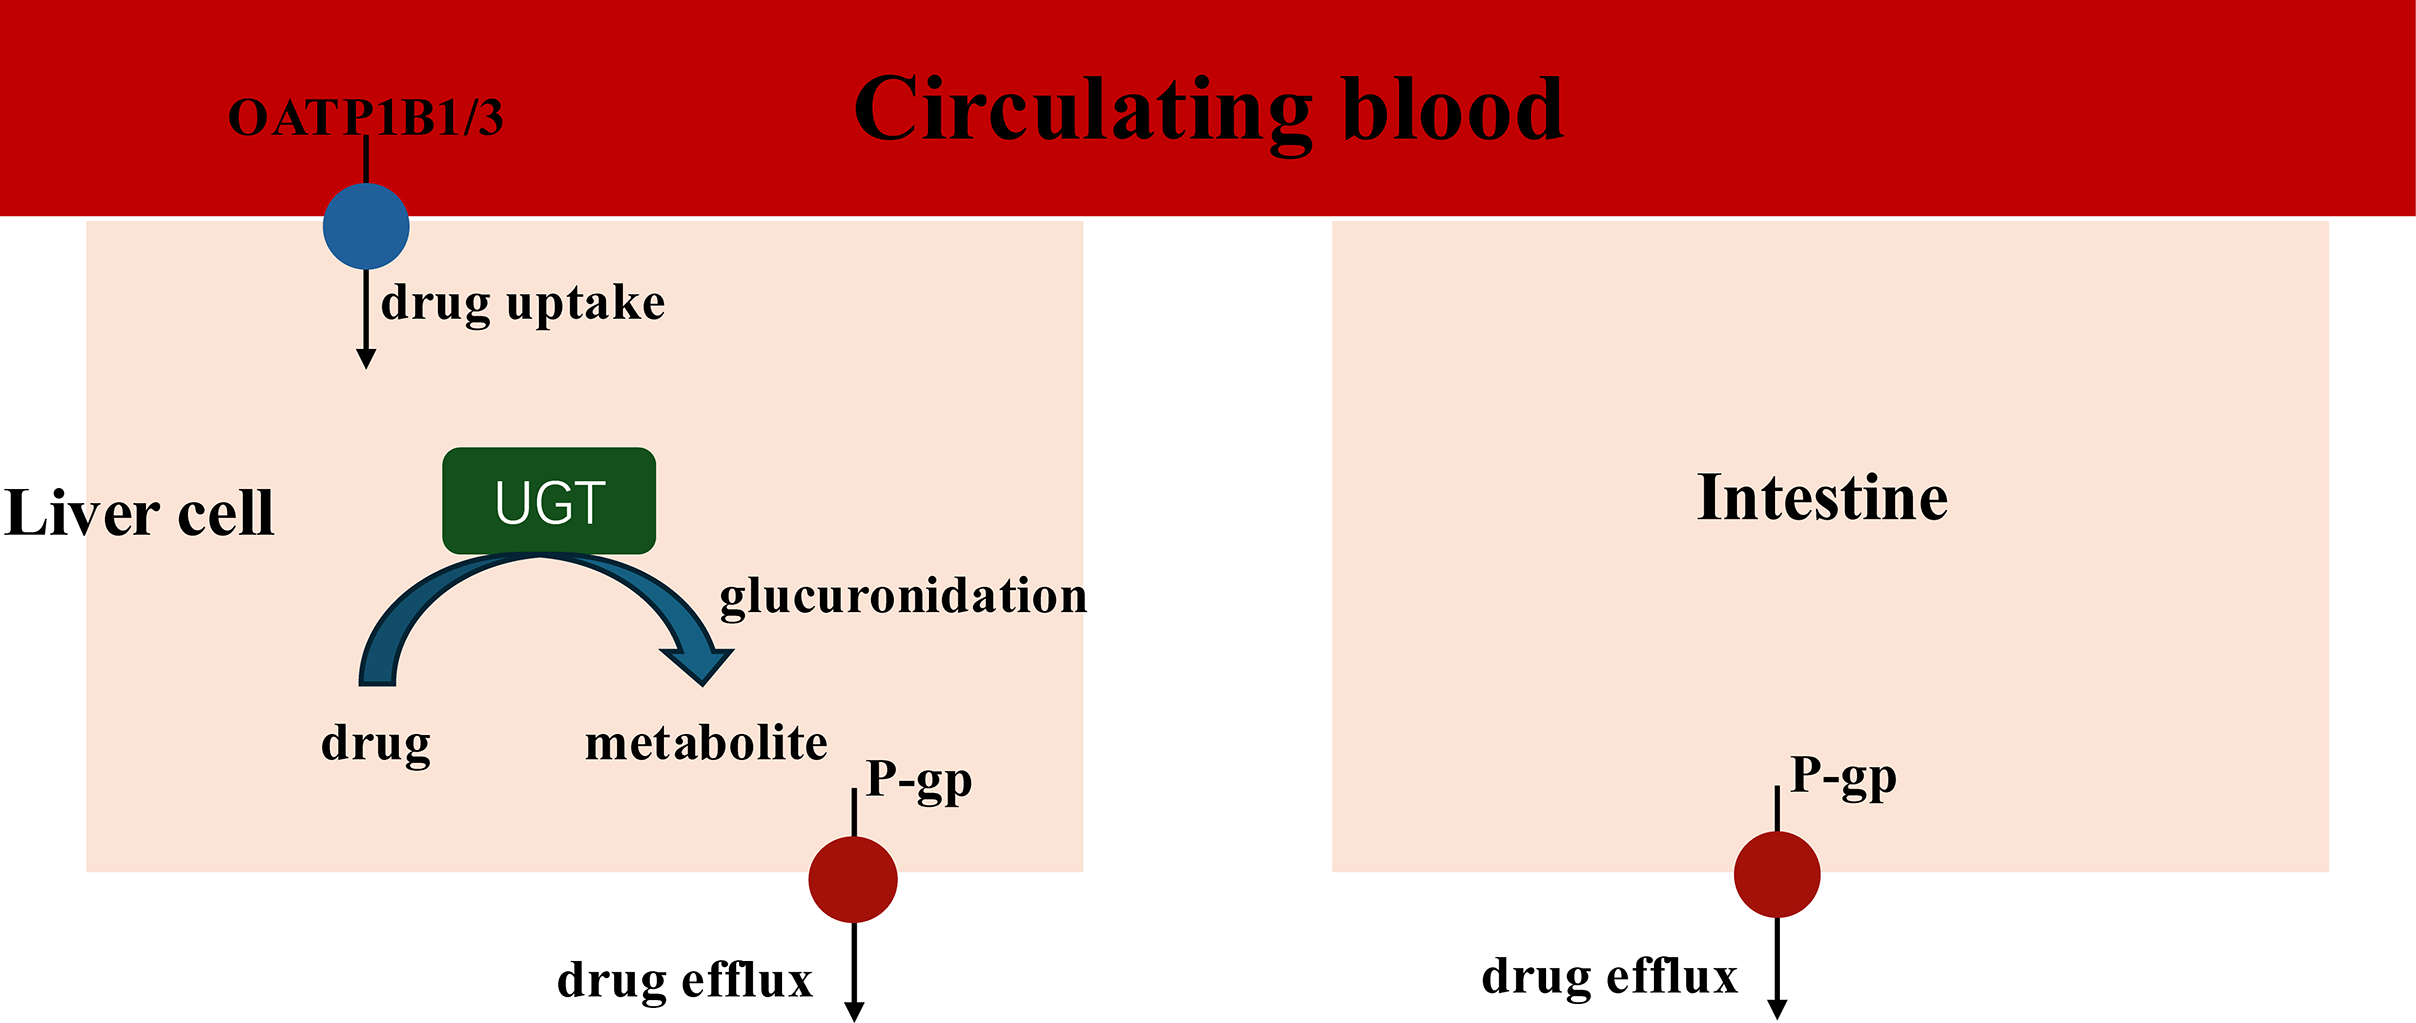
When coadministration with empagliflozin or henagliflozin, the increased exposure to sorafenib may be due to increased absorption in the intestine and inhibition of hepatic uptake. Sorafenib undergoes hepatic metabolism largely through two pathways: phase I oxidation, which is mediated by CYP3A4, and phase II conjugation, which is mediated by UGT1A9 (Gong et al., 2017). In addition, UGT1A9 is a pseudogene and is not expressed in rats, with its functions being compensated by Ugt1a7 in rats. Therefore, we assess the mRNA expression of Ugt1a7in rat to evaluate its role in the pharmacokinetic interactions (Dong et al., 2018). Similar with dapagliflozin, the PCR results indicated that empagliflozin suppressed the expression of Ugt1a7 in the liver of rats, which may affect the glucuronidation of sorafenib by UGT1A9 and enhance Cmax (He et al., 2022). The PCR results showed that the mRNA expression of Ugt1a7 in the liver and intestine was not inhibited by henagliflozin in vivo, which may suggest that the metabolism mediated by UGT1A9 of sorafenib was not suppressed by henagliflozin. Therefore, transporters may have a significant impact on the overall elimination of sorafenib (Fig. 7).
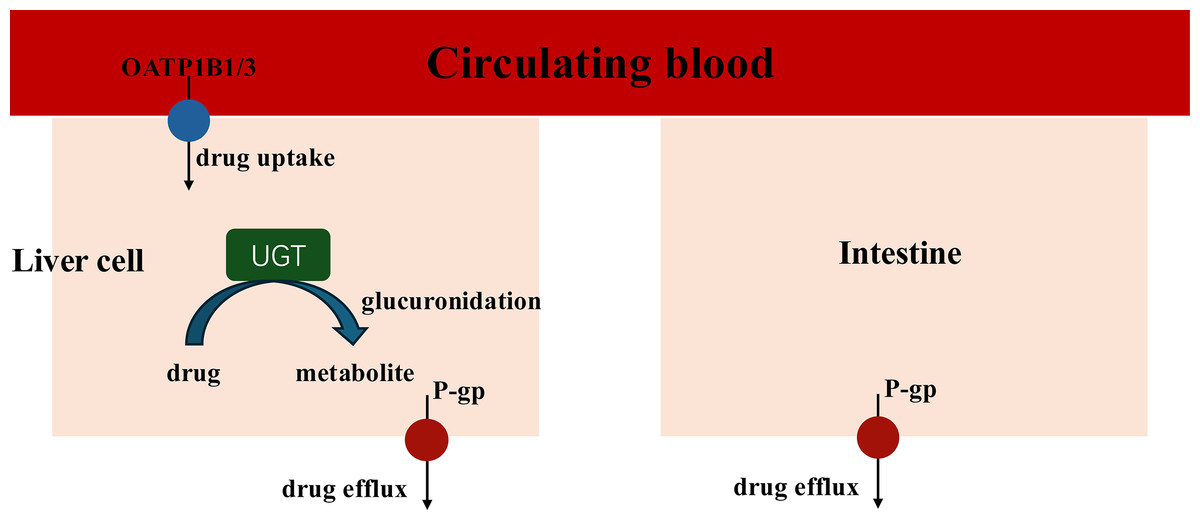
Figure 7: Key Interaction Pathways of UGT, OATP1B2, and P-gp.
The absorption of sorafenib, a P-gp substrate, may be influenced by this efflux transporter; thus, coadministration with another substrate or inhibitor of P-gp might result in a clinically significant DDI during the absorption process in intestine (Azam et al., 2020). For example, a previous study showed that the coadministration of paracetamol or morphine resulted in higher exposure to sorafenib, mostly due to P-gp (Karbownik et al., 2020a, 2021). In this study, empagliflozin and henagliflozin were substrates of P-gp, which indicates that increased exposure to sorafenib may be due to competition for the P-gp transport pathway. Furthermore, according to the PCR results, the decreased mRNA expression of P-gp in the liver and intestine after the administration of empagliflozin or henagliflozin for seven consecutive days might also be responsible for these changes. Sorafenib is absorbed into liver cells through OATP1B1 transporters. It is then metabolized by CYP3A4 to make sorafenib-N-oxide and conjugated by UGT1A9 to produce sorafenib-glucuronide (Zimmerman et al., 2012). Inhibition of OATP1B1 inhibits the hepatic uptake mechanism and leads to increased levels of sorafenib in the plasma (Vasilyeva et al., 2015). Thus, we speculate that the increased AUC of sorafenib when incubated with empagliflozin or henagliflozin is due to a decrease in hepatic OATP1B1 uptake, which is also consistent with the mRNA expression in vivo. Additionally, empagliflozin, as a substrate of OATP, may compete with sorafenib, which may also be responsible for the increased exposure to sorafenib.
According to FDA guidelines, an inducer or inhibitor of these key enzymes and transporters is typically associated with the toxicity or altered efficacy of a drug that is a substrate of a transporter and is used to assess or predict the risk of toxicity changes in DDI studies (Center for Drug Evaluation and Research (CDER), 2020). Understanding whether a drug is a substrate or inhibitor of these key enzymes and transporters can explain some clinical consequences. In conclusion, the increased systemic exposure of sorafenib may enhance the effective of anti-tumor treatment and fight with drug resistance in cancer cells (Tang et al., 2020). However, on the other hand, the higher Cmax could be associated with the severity of such adverse events, such as hand-foot syndrome, alopecia, diarrhoea, hypertension, and hypocalcaemia, sacrificing quality of life for patients (Jian et al., 2020). Therefore, when these drugs are coadministered in clinical practice, doctors and pharmacists should pay more attention to this potential DDI.
Effects of sorafenib on empagliflozin pharmacokinetics
An increase in AUC and decrease in CLz/F and Vz/F of empagliflozin were observed in rats for coadministration with sorafenib. First, empagliflozin and sorafenib are substrates of both P-gp and OATP, which means that comparison of the same transport pathway may contribute to increased exposure to empagliflozin (Fig. 7). In addition, coadministration of sorafenib with multiple doses increased plasma exposure to empagliflozin, which is consistent with the changes in pharmacokinetic parameters for tapentadol or dapagliflozin due to UGT1A9 when coadministration with sorafenib. Sorafenib is a highly effective inhibitor of UGT1A9 in vitro and in vivo analysis (Ge et al., 2019; He et al., 2022; Miners et al., 2017). Therefore, it is conceivable that sorafenib inhibits empagliflozin metabolism by UGT1A9. Furthermore, multiple doses of sorafenib inhibited the mRNA expression of UGT2B7, which was also associated with increased exposure to empagliflozin. In summary, the observed changes in empagliflozin pharmacokinetics may be due to inhibition of the metabolic pathways of empagliflozin. However, after oral administration of empagliflozin, approximately 60% of the parent drugs is eliminated unchanged in the urine, while each metabolite has a systemic exposure of less than 10% of the total drug-related material, which means that metabolic enzymes may play a relatively weak role in the process. Thus, inhibition of metabolic enzymes contributed to a slight increase in the duration of exposure. This fact may be verified by a continuation of the clinical study. This design is clinically meaningful, which may provide a valuable insight for clinical combination of these drugs and enhancing the safety of combination therapies. The clinical significance of this interaction cannot be overlooked, as the increased bioavailability of empagliflozin may help glycemic control but may also lead to more toxic effects.
Effect of sorafenib on henagliflozin pharmacokinetics
This study showed that exposure to henagliflozin increased significantly after administration of sorafenib for consecutive 7 days, however, no significant change was observed in the t1/2 of henagliflozin. The AUC and Cmax of henagliflozin increased significantly, demonstrating that the bioavailability of orally administered drugs significantly increased in rats. Interestingly, it is obvious that sorafenib showed a larger increase in the bioavailability of henagliflozin than empagliflozin, which may be because metabolic enzymes contribute to a different percentage of drug metabolism. Henagliflozin undergoes glucuronidation by UGT2B4/7, UGT1A9, UGT1A3, and UGT1A6, and the proportion of metabolites is wide; thus, metabolic enzymes play a vital role in metabolism. Thus, the inhibition of henagliflozin metabolism may noticeably affect systemic exposure. A previous study demonstrated that sorafenib increases the AUC and Cmax of dapagliflozin, presumably due to UGT1A9-mediated DDIs (He et al., 2022). In contrast to the well-known inhibition of UGT1A, sorafenib decreased UGT2B expression in the intestine, which may decrease drug metabolism, increase drug absorption, and enhance bioavailability. Sorafenib has no effect on UGT2B in the liver; thus, a diminished glucuronidation pathway of sorafenib mediated by UGT1A may also compensate for the enhanced metabolic pathway mediated by UGT2B, causing no significant change in the t1/2 of henagliflozin (Osborne et al., 2021).
In addition to the effects of metabolic enzymes, protein transporters, including P-gp /ABCB1 and BCRP /ABCG2, may play crucial roles in the absorption of this process. Sorafenib and henagliflozin, substrates of both P-gp and BCRP, may competitively decrease the functional expression of transporters when coadministered, which may also affect the absorption of henagliflozin. Coadministration of these drugs alters the pharmacokinetic profile of each drug due to DDIs, potentially leading to complex consequences, including heightened risk of severe adverse effects, reduced therapeutic efficacy, or challenges related to tolerability. Given the alterations in the AUC, Cmax, or CLz/F of henagliflozin when taken with sorafenib, doctors should be mindful of the possibility of this DDI and monitor complete blood counts closely when sorafenib and henagliflozin are coadministered.
However, it is crucial to address these limitations of this study. First, no experimental animal models for HCC and T2DM have been established to evaluate DDI. It is our understanding that the effect of cancer on hepatic and renal function might downregulate CYPs and UGTs, which may change drug pharmacokinetics, impaire the clearance of drugs (Cvan Trobec et al., 2015; Vasilogianni et al., 2022). Diabetic animals showed that T2DM increases exposure to sorafenib (Karbownik et al., 2020b). Thus, coadministration of these drugs may result in a strong pharmacokinetic-based DDI (Center for Drug Evaluation and Research (CDER), 2020). Futhermore, we acknowledge that further validation of protein expression was not conducted in this study. Additionally, the levels of sorafenib glucuronide were not quantified, and the pharmacokinetic profiles of sorafenib, empagliflozin, and henagliflozin may differ between rats and humans. In summary, the results provide essential information about the DDI potential of investigational drugs and can inform future clinical DDI studies, and by the way, all of these DDI studies in rats should be further evaluated in clinical settings to provide useful information about adjusting dose with concomitant drugs.
Conclusion
In this study, we developed and validated a sensitive, rapid, reliable, and accurate UPLC–MS/MS method for the simultaneous quantification of empagliflozin and henagliflozin in rat plasma. The results showed that coadministration of these drugs enhanced systemic exposure and oral bioavailability in rats. Increased exposure to SGLT2 inhibitors, as a DDI effect, may result in a better response to anti-hyperglycemic treatment or increase the risk of side effects. Our study may provide a reference to help adjust the dose appropriately and avoid toxicity effects in patients. However, all of these DDI studies in rats should be further evaluated in clinical settings.