
Serum miR-15a-5p may predict recurrence of atrial fibrillation after catheter ablation: a single center retrospective study
- Published
- Accepted
- Received
- Academic Editor
- Rohit Upadhyay
- Subject Areas
- Biochemistry, Genetics, Molecular Biology, Cardiology, Global Health
- Keywords
- Atrial fibrillation, MiR-15a-5p, Recurrence, Radiofrequency catheter ablation, Predict
- Copyright
- © 2025 Ruan et al.
- Licence
- This is an open access article distributed under the terms of the Creative Commons Attribution License, which permits using, remixing, and building upon the work non-commercially, as long as it is properly attributed. For attribution, the original author(s), title, publication source (PeerJ) and either DOI or URL of the article must be cited.
- Cite this article
- 2025. Serum miR-15a-5p may predict recurrence of atrial fibrillation after catheter ablation: a single center retrospective study. PeerJ 13:e19618 https://doi.org/10.7717/peerj.19618
Abstract
Background
There is still a lack of an easily obtainable, sensitive, and specific biomarker for predicting the recurrence of atrial fibrillation (AF) after radiofrequency catheter ablation (RFCA). In the present study, we aimed to investigate the predictive value of serum miR-15a-5p as a biomarker of recurrence in AF patients undergoing RFCA.
Methods
Forty-three consecutive AF patients indicated for RFCA and 20 non-AF subjects were enrolled. The levels of serum miR-15a-5p and PICP, PIIINP, MMP-9, and sST2 were detected. Then, linear regression analysis, binary logistic regression analysis, and receiver operating characteristic (ROC) analysis were used to investigate the correlation between the expression level of serum miR-15a-5p and the degree of myocardial fibrosis and assess the value of serum miR-15a-5p for predicting postoperative recurrence of AF.
Results
There was a significant difference in age, CK-MB, uric acid (UA), left atrial diameter (LAD), history of coronary heart disease (CAD), and left ventricular ejection fraction (LVEF) between the AF group and the control group (p < 0.05). Compared with the control group, the level of serum miR-15a-5p, MMP-9, PICP, PIIINP, and sST2 was higher in the AF group (p < 0.05 or p < 0.01). miR-15a-5p had a significant and positive relationship with the level of the four serum fibrosis biomarkers (p < 0.05). Compared with paroxysmal AF, persistent AF had a higher increase in serum miR-15a-5p expression level (p < 0.001). Compared with the non-recurrent, the expression level of serum miR-15a-5p in the recurrent patients was significantly increased (p < 0.01). ROC analysis showed that the AUC of serum miR-15a-5p for predicting AF recurrence was 0.823 (95% CI [0.668–0.979], p < 0.01), and the cutoff value was 1.5224, with a sensitivity of 71.4% and specificity of 86.1%.
Conclusions
The high expression of serum miR-15a-5p in AF patients was related to the degree of myocardial fibrosis and the recurrence of AF after RFCA, which indicated that serum miR-15a-5p could be used as a serum biomarker for predicting AF recurrence after RFCA.
Introduction
Atrial fibrillation (AF) is the most common persistent arrhythmia, with approximately 59.7 million patients worldwide (including atrial flutter) as of 2019 (Mensah, Roth & Fuster, 2019). Myocardial fibrosis is related with various cardiovascular diseases, including arrhythmia, heart failure and sudden death (Barton et al., 2023; Ambale-Venkatesh et al., 2019). Accumulating researches indicate that the development of myocardial fibrosis and AF have a mutually reinforcing effect. AF can alter the original structural characteristics of the atrium, leading to the occurrence of myocardial fibrosis. Timely intervention in AF patients may prevent the progression of myocardial fibrosis and even reverse left atrial remodeling (Kowallick et al., 2019). Structural remodeling such as myocardial fibrosis provides a structural basis for the occurrence and development of AF. Radiofrequency catheter ablation (RFCA) can effectively cure AF, but AF recurrence after RFCA remains high. Structural atrial remodeling has been shown to be closely associated with the recurrence of AF. However, the mechanism of atrial remodeling is complex, involving inflammatory response, oxidative stress, high sympathetic nervous system excitability, and overactivation of the renin angiotensin aldosterone system. Screening a novel biomarker for predicting atrial fibrillation recurrence will help stratify patients.
Gadolinium contrast delayed contrast-enhanced magnetic resonance imaging (LGE-MRI) is commonly used in clinical practice to evaluate the severity of left atrial myocardial fibrosis and predict the outcome of AF ablation (Siebermair, Kholmovski & Marrouche, 2017). However, due to the high cost of LGE-MRI and the high demand for professional knowledge from evaluators, it has not been widely applied. Therefore, it is particularly important to find an easily obtainable, sensitive and specific biomarker that can evaluate atrial fibrosis and further predict the recurrence of AF undergoing RFCA.
MiRNAs are involved in physiological and pathological processes such as cell differentiation, proliferation, apoptosis, and tissue damage repair. They have been demonstrated to be closely related to cardiovascular diseases and have emerged as novel biomarkers for the diagnosis, treatment, or prediction of the progression of such diseases (Barwari, Joshi & Mayr, 2016). MiR-15a-5p interacts with various signaling pathways involved in inflammation, apoptosis, and fibrosis (Liu & Guan, 2024). Circulating miR-15a-5p has been found to be a biomarker of myocardial fibrosis in patients with hypertrophic cardiomyopathy (Fang et al., 2015). Li et al. (2019) found that miRNA-15a may be directly related to the Smad7 gene and may be involved in the pathogenesis of AF. In previous study, we measured the expression of miR-15a-5p and Smad7 in the left atrial appendage tissue of AF patients and indicated that miR-15a-5p regulated myocardial fibrosis in AF by targeting Smad7 (He et al., 2021). However, the relationship between miR-15a-5p mediated myocardial fibrosis and AF recurrence after RFCA has not been elucidated so far.
Based on our previous research, the current study aimed to identify the differences of serum miR-15a-5p expression between patients with and without AF, and analyze the correlation between serum miR-15a-5p expression levels and the degree of myocardial fibrosis. Most importantly, the relationship between serum miR-15a-5p expression and AF recurrence after RFCA would be further evaluated to confirm whether serum miR-15a-5p might be implicated for predicting AF recurrence.
Materials & Methods
Subjects
A total of 43 consecutive patients with paroxysmal or persistent AF (AF group) who underwent RFCA at the Affiliated Taizhou People’s Hospital of Nanjing Medical University were enrolled. In which, 16 with paroxysmal AF, 27 with persistent AF. Meanwhile, 20 non-AF patients were selected as Control group. The diagnosis of AF was mainly based on the criteria listed in the 2020 ESC Guidelines for the diagnosis and management of atrial fibrillation developed in collaboration with EACTS (Hindricks et al., 2021). Exclusion criteria included the following: an age less than 18 years, infectious condition, acute coronary syndrome, severe valvular heart disease, hematological diseases, left atrium and/or left atrial appendage thrombus, expected survival of less than 1 year. The study was approved by the Ethics Committee of the Affiliated Taizhou People’s Hospital of Nanjing Medical University (KY2023-080-01) and written consents were obtained from all patients. All patients underwent RFCA using CARTO three-dimensional mapping system (CARTO 3; Biosense Webster, Inc.) as we described previously (Ruan et al., 2022).
Sample collection
Four ml of fasting venous blood from all patients was collected in the morning prior to RFCA. The serum was separated after a centrifugation (CF1524R, SCILOGEX, USA) with 3,000 g for 10 min at 4 °C, then transferred into Eppendorf tubes and frozen at −80 °C for serum exosome extraction (Wayen Biotech, Shanghai, China), real time fluorescence quantitative reverse transcription polymerase chain reaction (RT-qPCR) (Hongshitech, Shanghai, China) and enzyme-linked immunosorbent assay (ELISA) experiments.
Serum exosome extraction
Exosomes were isolated from the serum. Briefly, 50 ul of total exosome isolation reagent (EIQ3; Wayen Biotech, Shanghai, China) was added to the serum (200 ul), incubated at 4 °C for 30 min. The mix was centrifuged at 3,000 g for 10 min, then the supernatant was removed and 200 µL of 1 × PBS was added to the precipitate. Another centrifugation at 3,000 g for 10 min was performed to remove the residual supernatant. Finally, 100 µL of 1 × PBS was added to the precipitate, and the mix was incubated at 4 °C for 30 min. Then, exosomes were resuspended by shaking. For transmission electron microscopy (TEM) of the exosomes, five µL of the sample was dropped onto a copper grid and precipitated for 5 min. After draining the grid with filter paper, 10 µL of 2% uranyl acetate was added and incubated for 1 min. The excess uranyl acetate was removed and the morphology of exosomes was identified by a FEI Talos F200 transmission electron microscope (FEI, USA). The particle size distribution and level of exosomes were measured by nanoparticle tracking analysis (NTA) using the ZetaView NanoAnalyzer (PARTICLE METRIX, GER).
RNA extraction
A total of 200 µL resuspended exosomes was mixed with 700 µl of QIAzol reagent (217004; Angfeibio Biotech, Guangzhou, China) and incubated for 5 min at room temperature. Then, 140 µl of chloroform were added and incubated for 2 min at room temperature, following with a centrifugation at 12,000 g for 15 min at 4 °C. 500 µl of upper phase were obtained and mixed with 750 µl of 100% ethanol. Then the mixture was centrifuged at 8,000 g for 15 s at temperature and washed with 700 µl RWT solutions following by 500 µl RPE solutions. After that, 14 µL of RNA-free water was added, followed by a centrifugation at 12,000 g for 1 min. Finally, the RNA was extracted and quantified by Nano Drop 2000 bioanalyzer (Thermo Fisher Scientific, Waltham, MA, USA).
qRT-PCR for miR-15a-5p quantification
A sample of two µL of total RNA from serum exosomes was reversely transcribed into cDNA using the reverse transcription kit (Applied Biosystems) (reverse transcription program: 37 °C for 60 min, 85 °C for 5 min). Then qRT-PCR was performed using the Thermo Fisher Scientific RealTime PCR System (Thermo Fisher Scientific). eight µl of cDNA (Sangon Biotech, Shanghai, China), 10 µl of 2 × miRNA-qPCR master mix (Sangon Biotech, Shanghai, China), two ul of forward and reverse primers (RiboBio, Guangzhou, China) were added. The reaction conditions were 95 °C for 30s, followed by 40 cycles of 95 °C for 5 s, 60 °C for 30 s. The expression level of miR-15a-5p was calculated using the 2−ΔΔCt method. U6 was selected as the internal reference. Primers were shown in Table 1.
ELISA for quantifying serum MMP9, PICP, PIIINP and sST2
The level of serum MMP9, PICP, PIIINP and sST2 was quantified using a Human ELISA Kit (ab100610; Abcam, Cambridge, UK) according to the manufacturer’s instructions. Briefly, 100 µL of the MMP9 (Proen Bio, Tianjing China), PICP (Qunxian Tech, Guangzhou China), PIIINP (Qunxian Tech, Guangzhou China) or sST2 (Besoon, Shenzhen, China) standards and sample were added to wells of a microtiter plate pre-coated with the capture antibody and incubated for 2 h at room temperature. After that, the plates were washed three times and 100 µL of biotinylated MMP9, PICP, PIIINP or sST2 antibody were added for 1 h at room temperature. Wells were washed an additional five times and 90 µL of TMB substrate reagent were added for 15 min in the dark at room temperature. Subsequently, 50 µL of stop solution was added and the optical density (OD) at 450 nm was measured using an ELISA reader.
Follow up
All patients were followed up by telephone or outpatient visits for 6 months after RFCA, and Holter monitor was performed at 3 and 6 months, respectively. Antiarrhythmic drugs (Propafenone or Amiodarone) and anticoagulants (Rivaroxaban) were used during the blanking period (3 months after RFCA). AF, atrial flutter, and atrial tachycardia that occurred 3 months after RFCA and lasted for ≥ 30 seconds was defined as AF recurrence.
| Gene | Forward | Reverse |
|---|---|---|
| miR-15a-5p | CGCGTAGCAGCACATAATGG | AGTGCAGGGTCCGAGGTATT |
| U6 | AGAGAAGATTAGCATGGCCCCTG | ATCCAGTGCAGGGTCCGAGG |
Statistical analysis
SPSS version 27.0 statistical software (IBM Corp. Armonk, NY, USA) and GraphPad Prism 9.0 Software (GraphPad Software Inc., San Diego, CA, USA) were used for statistical analyses. Gpower software was used to for pre-estimation of sample size. The distribution of data was assessed by Shapiro–Wilk test. Continuous variables that followed a normal distribution were presented as mean ± SD, and were compared using independent t test. Continuous variables that do not conform to a normal distribution were represented by M (Q1, Q3) and compare with Mann–Whitney U test. Categorical variables were represented by as number and percentage. The chi square test was used correspondingly. Linear regression for continuous variables and logistic regression for categorical variables were used for correlation analysis. The receiver operating characteristic (ROC) curve was used to evaluate the predictive value of serum exosomes miR-15a-5p for AF recurrence after RFCA. A value of p < 0.05 was considered as statistically significant.
Results
Comparison of baseline characteristics between AF group and control group
As shown in Table 2, there was no statistically significant difference between AF group and Control group in gender, C-reactive protein (CRP), serum creatinine (SCr), alanine aminotransferase (ALT), triglyceride (TG), total cholesterol (TC), high density lipoprotein cholesterol (HDL-C), low density lipoprotein cholesterol (LDL-C)L, history of hypertension and history of diabetes (p > 0.05), but there was statistically significant difference in age, CK-MB, uric acid (UA), left atrial diameter (LAD), left ventricular ejection fraction (LVEF), and history of coronary heart disease (CHD) (p < 0.05).
| Characteristics | Control group (n = 20) | AF group (n = 43) | t/χ2/z value | p value |
|---|---|---|---|---|
| Sex, male (%) | 12 (60.00) | 27 (62.80) | 0.045 | 0.83 |
| Age (years) | 54.50 (47.25, 62.75) | 66.00 (53.00, 73.00) | 2.764 | 0.01 |
| CRP (mg/l) | 0.61 (0.40, 3.18) | 1.04 (0.40, 3.08) | 0.664 | 0.51 |
| SCr (umol/l) | 70.10 (56.03, 80.60) | 73.90 (67.00, 85.20) | 1.787 | 0.07 |
| ALT (U/L) | 18.50 (14.00, 29.25) | 22.00 (15.00, 32.00) | 1.020 | 0.31 |
| CK-MB (U/L) | 7.5 (6.25, 9.75) | 10.00 (8.00, 12.00) | 2.558 | 0.01 |
| UA (mmol/l) | 316.50 (262.50, 372.50) | 362.00 (314.00, 444.00) | 2.082 | 0.04 |
| TG (mmol/l)) | 1.13 (0.77, 2.01) | 1.21 (0.74, 1.70) | −0.458 | 0.65 |
| TC (mmol/l) | 4.50 (±0.71) | 4.56 (±1.22) | −0.235 | 0.82 |
| HDL (mmol/l) | 1.20 (±0.19) | 1.20 (±0.29) | −0.191 | 0.85 |
| LDL (mmol/l) | 2.79 (±0.63) | 2.76 (±0.86) | 0.176 | 0.86 |
| LAD (mm) | 35.00 (33.25, 38.00) | 45.00 (42.00, 49.00) | 5.532 | 0.00 |
| LVEF (%) | 69.55 (±2.35) | 61.86 (±7.97) | 4.211 | 0.00 |
| Hypertension (%) | 8 (40.00) | 22 (51.20) | 0.682 | 0.41 |
| CAD (%) | 0 (0.00) | 5 (11.60) | 2.526 | 0.03 |
| Diabetes mellitus (%) | 3 (15.00) | 7 (16.30) | 0.017 | 0.87 |
Notes:
- CRP
-
C-reactive protein
- SCr
-
serum creatinine
- ALT
-
Alanine transaminase
- UA
-
uric acid
- TC
-
triglyceride
- TC
-
total cholesterol
- HDL-C
-
high density lipoprotein cholesterol
- LDL-C
-
low density lipoprotein cholesterol
- LAD
-
Left atrial diameter
- LVEF
-
Left ventricular ejection fraction
- CAD
-
coronary artery disease
Identification of serum exosomes
The identification and level determination of serum exosomes were performed by transmission electron microscopy (TEM), nanoparticle tracking analysis (NTA), and miRNeasy Mini Kit (Fig. 1). The TEM result of serum exosome was shown in Fig. 1A, in which typical sac-like vesicles were seen. The result of the NTA was shown in Fig. 1B. The median diameter of the exosome was 129.1 nm, and the dispersion index (Span value) was 60.9 nm, which was consistent with the exosome diameter and confirmed the presence of exosomes in the sample. Total serum exosomal mRNA was extracted by miRNeasyRNA kit and its level was measured. As shown in Fig. 1C, the total serum exosomal RNA level measured in this study ranged from 8.6 to 207.5 ng/ml, and the quartiles were 13.9 ng/ml, 18.6 ng/ml and 28.1 ng/ml, respectively.
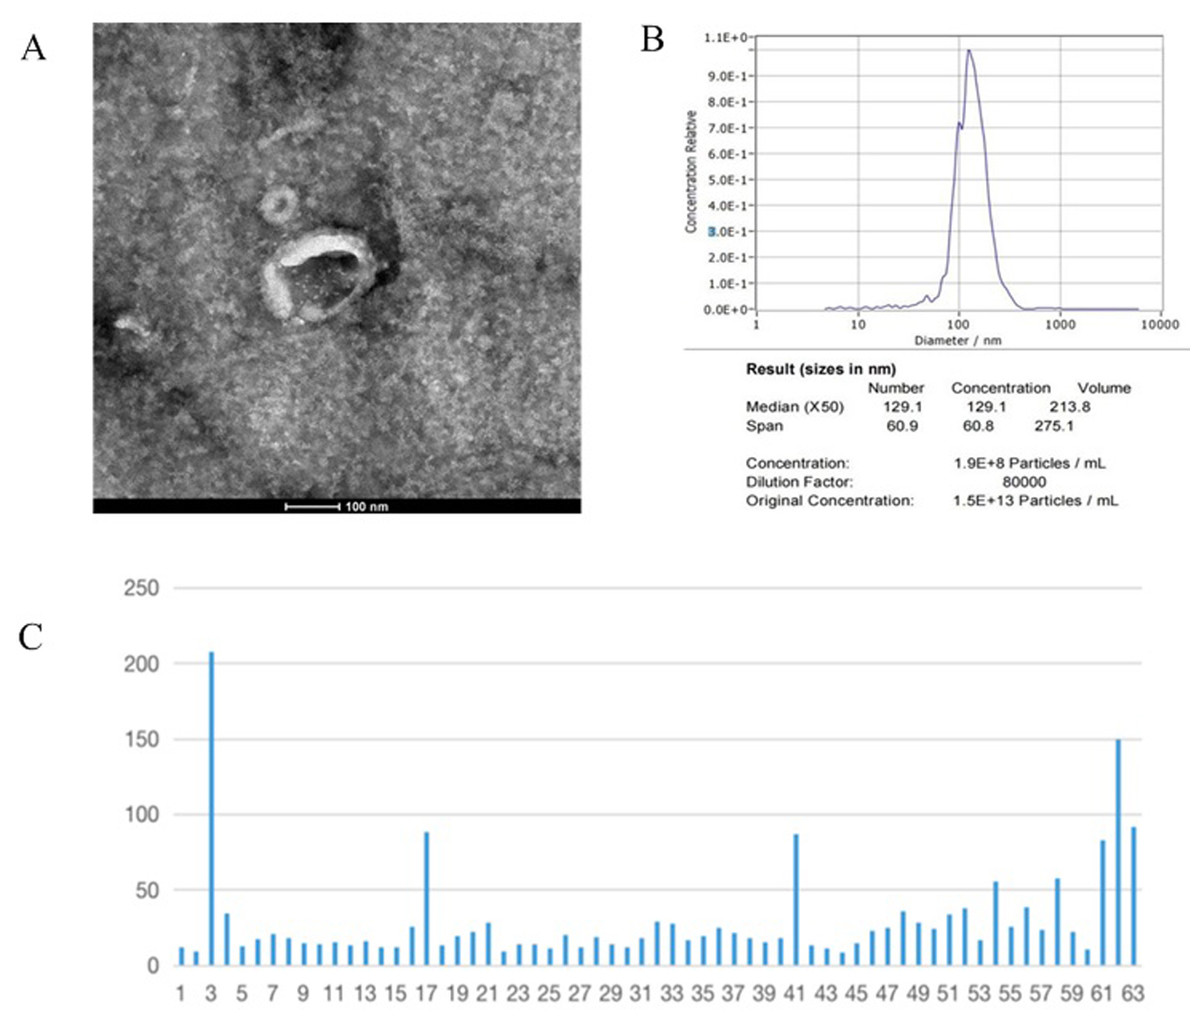
Figure 1: Identification of serum exosomes.
(A) The TEM result of serum exosome, in which typical sac-like vesicles were seen. (B) The result of the NTA. (C) Total concentration of serum exosomal mRNA.
Comparison of serum exosomal miR-15a-5p and serum fibrosis marker between AF group and Control group
The level of serum exosomal miR-15a-5p and fibrosis marker levels in AF group and Control group were shown in Fig. 2. Compared with Control group, the expression levels of serum miR-15a-5p and serum MMP-9 PICP, PIIINP, sST2 were significantly higher in AF group (p < 0.01 or p < 0.001).
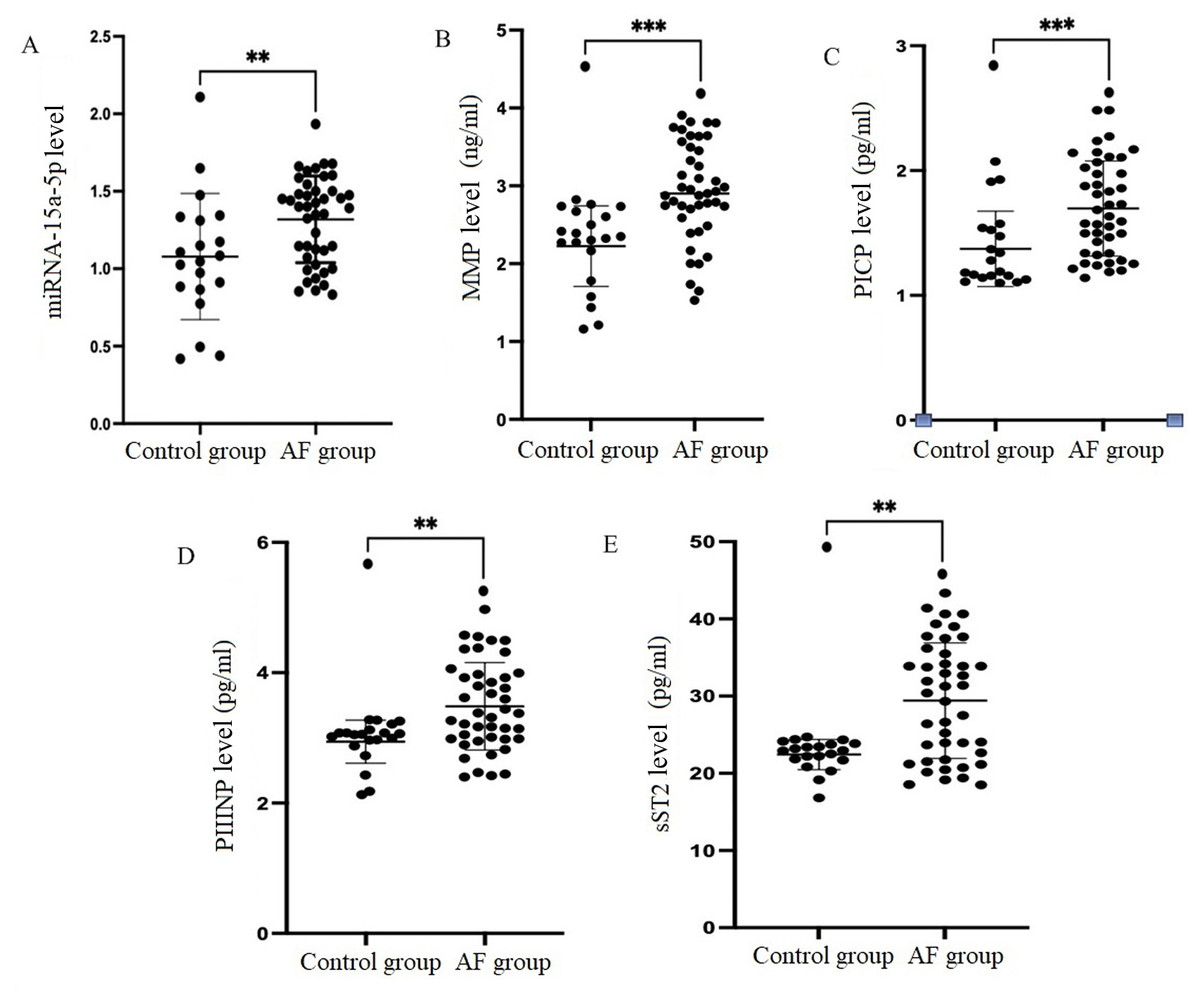
Figure 2: Comparison of serum exosomal miR-15a-5p and serum fibrosis marker between AF group and Control group.
(A) Serum miRNA-15a-5p expression level, (B) serum MMP level, (C) serum PICP level, (D) serum PIIINP level, (E) serum sST2 level, *p < 0.05, **p < 0.01, ***p < 0.001.
Linear regression results of clinical differential indicators and serum fibrosis indicators
As shown in Table 3, age, CK-MB, UA and history of CAD were not related to the level of four serum biomarkers. LAD had a positive relation with serum PICP level (p < 0.05), but is not related to the level of the other three serum biomarkers (p > 0.05). There was a significantly and positively relation between serum miR-15a-5p and four serum fibrosis biomarkers (p < 0.05).
Analysis of AF type and serum exosomal miR-15a-5p expression level
Among 43 AF patients, there were 16 cases of paroxysmal AF and 27 cases of persistent AF. Compared with paroxysmal AF (1.18 ± 0.24), the expression level of miR-15a-5p in persistent AF (1.56 ± 0.14) was significantly increased (p < 0.001) (Fig. 3). The linear regression results indicated that AF type had a significant positive relation with the expression level of serum miR-15a-5p (R2 = 0.438, F = 31.98, p < 0.001) (Table 4).
The predictive value of serum exosomal miR-15a-5p expression level for predicting AF recurrence
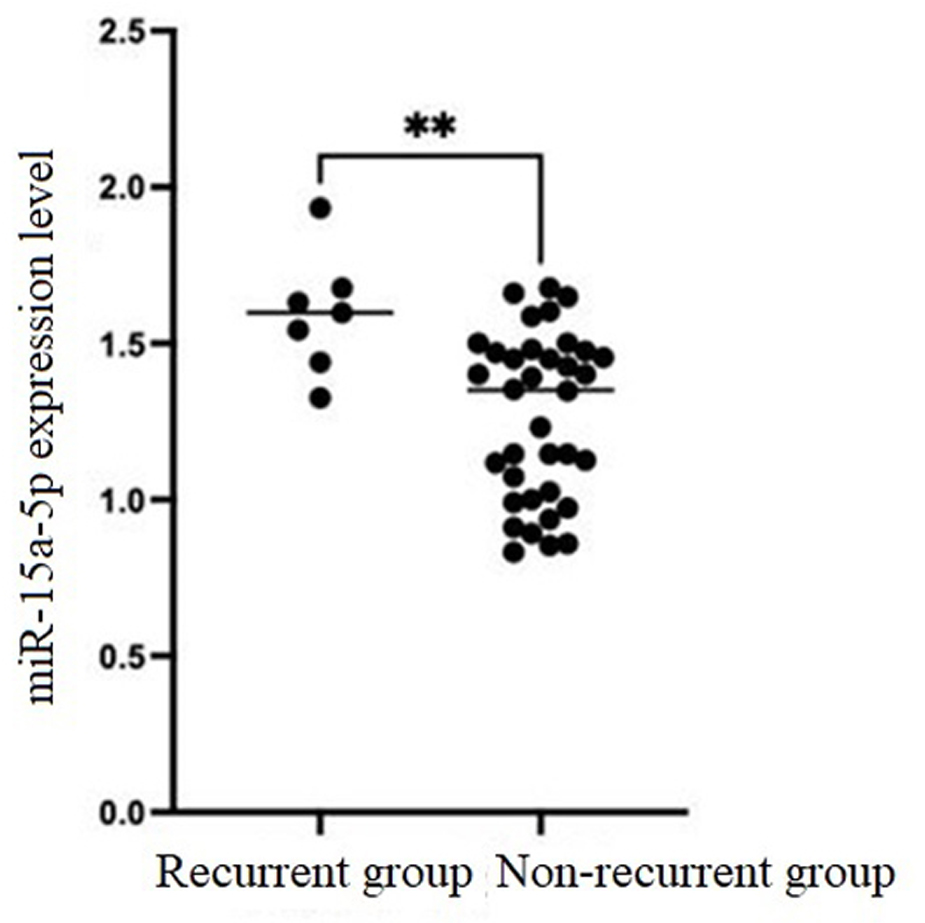
According to the results of Holter monitor performed at 3 and 6 months after RFCA, seven patients were identified as AF recurrence. Compared with non-recurrent group [1.35 (1.01, 1.47)], the expression level of serum miR-15a-5p in recurrent group [1.60 (1.44, 1.68)] was significantly increased (p < 0.01). Binary logistic regression showed that the expression level of serum miR-15a-5p was positively correlated with postoperative recurrence of AF (R2 = 1, 349.58, B = 7.208, p < 0.05) (Fig. 4). ROC results showed that the AUC of serum miR-15a-5p for predicting AF recurrence was 0.823 (95% CI [0.668–0.979], p < 0.01), and the cutoff value was 1.5224, with a sensitivity of 71.4% and specificity of 86.1% (Fig. 5).
| Parameter | MMP9 | PICP | PIIINP | sST2 | ||||
|---|---|---|---|---|---|---|---|---|
| B | F | B | F | B | F | B | F | |
| (constant) | 1.560 | 1.485 | 2.903 | 8.799 | ||||
| Age (years) | −0.003 | 0.722 | −0.005 | 0.238 | −0.008 | 0.312 | −0.154 | 0.057 |
| CK-MB (U/L) | 0.013 | 0.615 | −0.010 | 0.476 | −0.021 | 0.386 | 0.387 | 0.134 |
| UA (mmol/l) | 0.000 | 0.856 | 0.000 | 0.274 | 0.001 | 0.367 | 0.011 | 0.155 |
| LAD (mm) | 0.030 | 0.063 | 0.023 | 0.014 | 0.029 | 0.054 | 0.302 | 0.062 |
| LVEF (%) | −0.008 | 0.583 | −0.005 | 0.503 | −0.012 | 0.356 | 0.053 | 0.710 |
| CAD (%) | −0.140 | 0.660 | −0.327 | 0.071 | −0.169 | 0.566 | −4.335 | 0.174 |
| miR-15a-5p | 0.508 | 0.047 | 0.367 | 0.011 | 0.470 | 0.047 | 6.787 | 0.009 |
| R2 | 0.219 | 0.246 | 0.240 | 0.291 | ||||
| F | 2.204 | 2.565 | 2.484 | 3.227 | ||||
| p | 0.048 | 0.023 | 0.047 | 0.006 | ||||
Notes:
- UA
-
uric acid
- LAD
-
Left atrial diameter
- LVEF
-
Left ventricular ejection fraction
- CAD
-
coronary artery disease
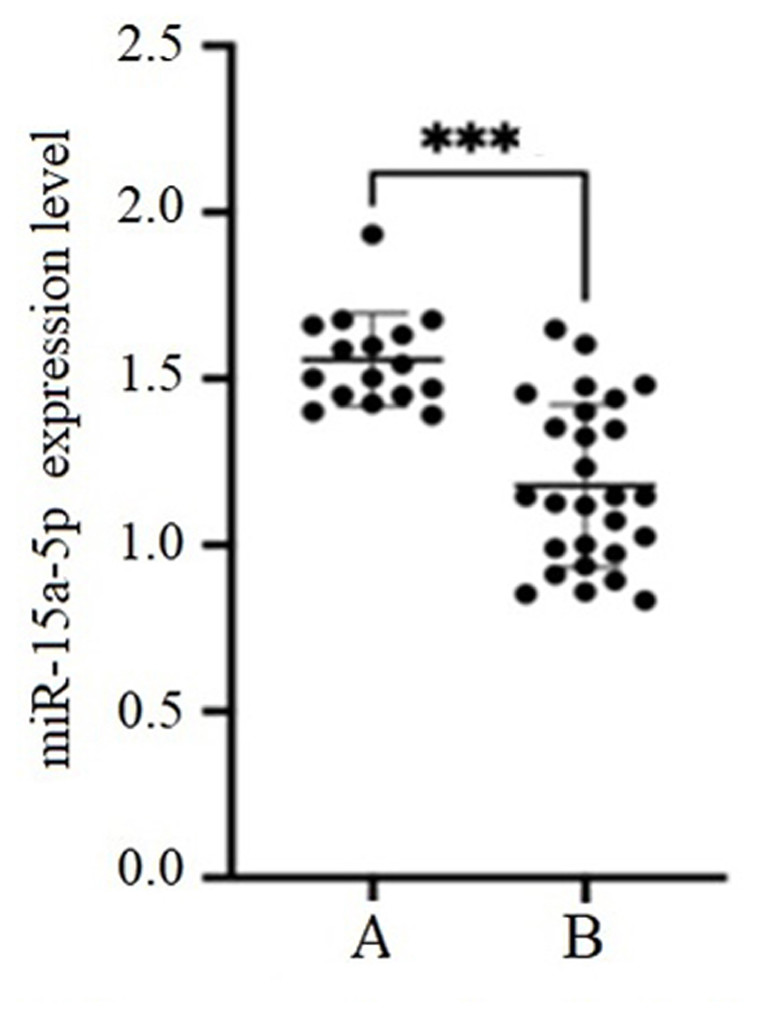
Figure 3: Comparison of the expression level of miR-15a-5p between paroxysmal AF and persistent AF.
(A) persistent AF, (B) paroxysmal AF, ***p < 0.001.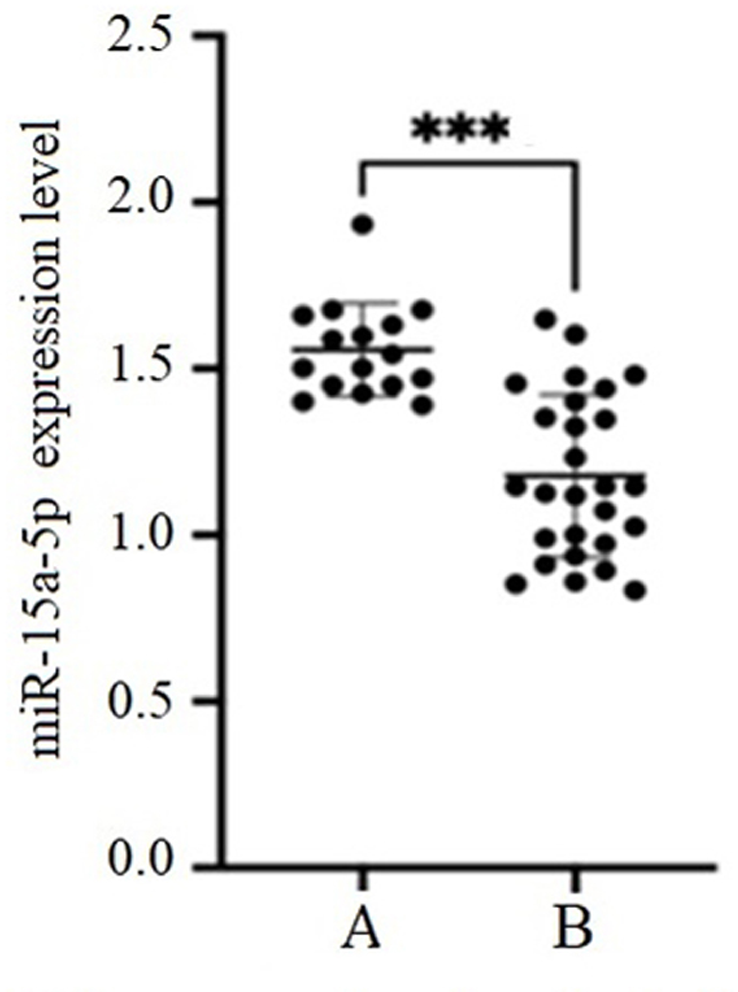
Discussion
The production and secretion of exosomes largely depend on the cellular conditions of cardiomyocytes. When AF occurs, cardiomyocytes in the atrium and their microenvironment are in different pathological states, which may lead to changes in the contour of exosomes and their contents in atrial tissue and circulation (Roldán et al., 2012). Siwaponanan et al. (2019) studied the distribution of circulating microparticles by multicolor flow cytometry and found that the level of circulating microparticles in AF patients was significantly higher than that in sinus rhythm patients, which suggested that exosomes and their contents might play an important role in promoting AF.
At present, many studies have confirmed that the differential expression of exosomal miRNA is related to the degree of atrial fibrosis. Researches indicated that miR-21 could enhance TGF-β1/Smad signaling pathway in AF-induced atrial fibrosis by down-regulating Smad7 and promote the occurrence of atrial fibrosis (He et al., 2016). Liu et al. (2020) analyzed pericardial fluid samples from AF patients and found three significantly down-regulated exosomes DEmiRNAs: miR-382-3p, miR-3126-5p and miR-450a-2-3p, suggesting that the above miRNAs may be potential regulators of cardiac fibrosis in patients with AF. Lage et al. (2023) showed that the expression level of plasma exosome miR-451a in AF patients was decreased, and it was related to severe atrial fibrosis and postoperative recurrence of patients. Although previous studies have demonstrated the correlation between the differential expression of exosomal miRNAs and the degree of atrial fibrosis and the pathways affected, there are still a large number of differentially expressed exosomal miRNAs and the specific pathways involved that need to be further explored.
| Parameter | B | R2 | F | p |
|---|---|---|---|---|
| (constant) | 1.178 | 0.438 | 31.98 | 0.000 |
| Persistent AF | 0.379 | |||
| Proxysmal AF | 0 |
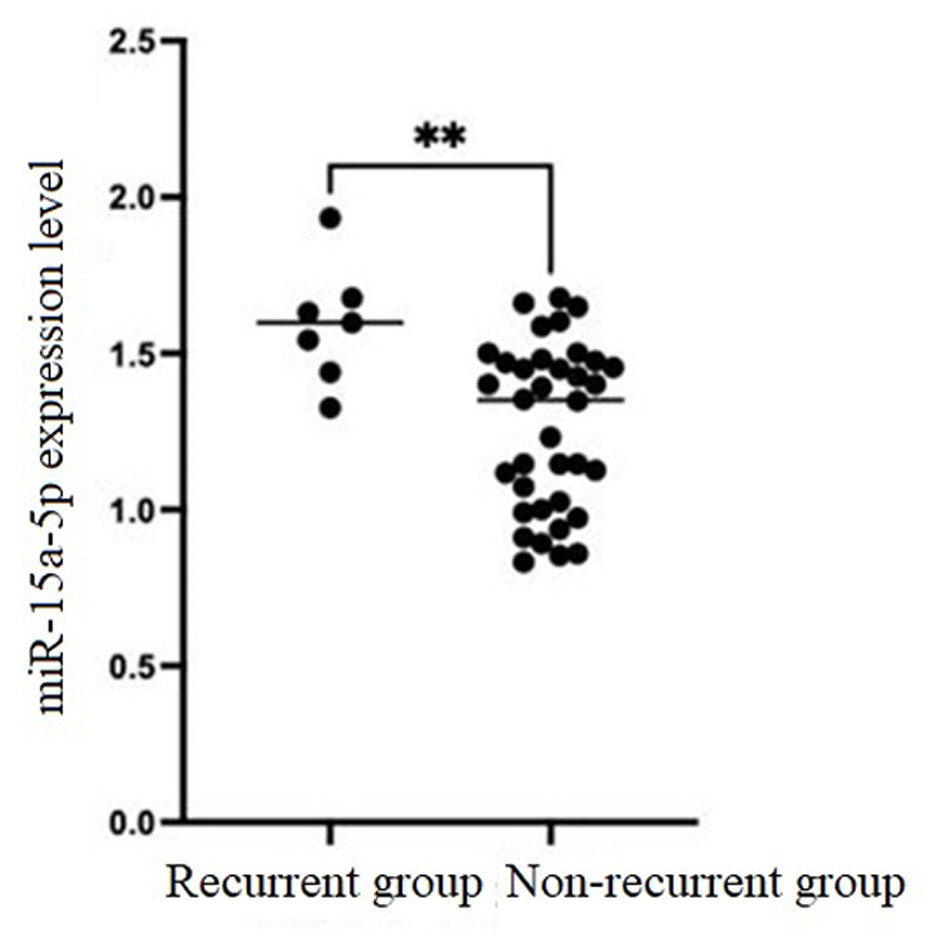
Figure 4: Comparison of serum miR-15a-5p expression level between non-recurrent group and recurrent group, ** p < 0.01.
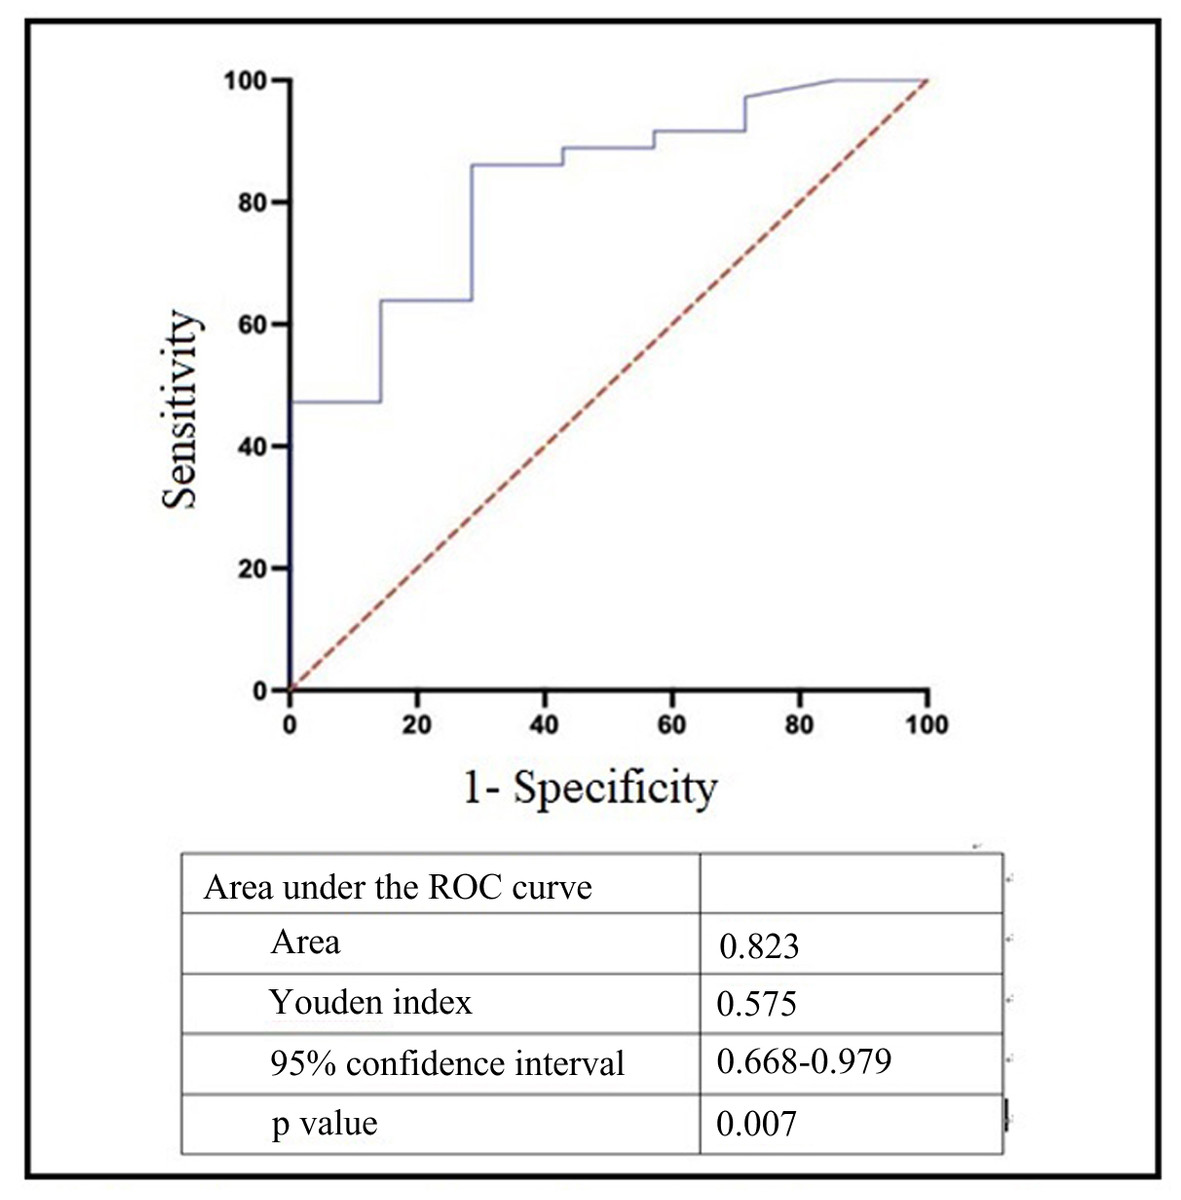
Figure 5: Receiver operating characteristic curve of serum miR-15a-5p expression level for predicting AF recurrence.
Our previous studies have confirmed the correlation between miR-15a-5p in left atrial appendage tissue and AF myocardial fibrosis (He et al., 2021). However, in clinical practice, blood samples are easier to obtain compared to left atrial appendage tissue. Given the important role of exosomes and their contents in promoting AF, and the characteristics of high level and stability, serum exosomes were selected as the study samples. On the basis of previous studies, this study further analyzed the correlation between the expression level of serum exosome miR-15a-5p and the degree of AF myocardial fibrosis and the recurrence after ablation, and explored whether serum exosome miR-15a-5p could be used as a serum biomarker to predict the recurrence of AF after ablation.
The present study showed that the level of serum miR-15a-5p, MMP-9, PICP, PIIINP, and sST2 were increased statistically in AF group compared with the control group. Linear regression showed that the expression level of serum miR-15a-5p could significantly positively affect the level of the four serum fibrosis biomarkers. LAD could positively affect the level of serum PICP, but was not related to the level of the other three serum biomarkers. It was suggested that the high expression of serum miR-15a-5p and the increase of LAD were positively related with AF myocardial fibrosis.
Compared with paroxysmal AF, the expression level of miR-15a-5p in non-paroxysmal AF was significantly increased. Linear regression showed that AF type had a significant positive effect on the expression level of serum exosome miR-15a-5p. The results indicated that the expression level of serum exosome miR-15a-5p was related to the degree of AF myocardial fibrosis. If the degree of AF fibrosis increased, the expression level of serum exosome miR-15a-5p increased.
Compared with the non-recurrent group, the expression level of serum exosome miR-15a-5p in the recurrent group was significantly increased. Binary logistic regression showed that the expression level of serum miR-15a-5p was positively correlated with postoperative recurrence of AF. ROC results indicated that the AUC of serum miR-15a-5p for predicting AF recurrence was 0.823 (95% CI [0.6688–0.979], p < 0.01), and the cutoff value was 1.5224, with a sensitivity of 71.4% and specificity of 86.1%. Our results indicated that serum miR-15a-5p could serve as a biomarker for predicting AF recurrence after ablation.
Conclusions
Our results indicated that the high expression of serum miR-15a-5p in AF patients was related to the degree of myocardial fibrosis and the recurrence of AF after RFCA, and suggested that serum miR-15a-5p could be used as a serum biomarker for predicting AF recurrence after RFCA. However, the sample size was small and this was a retrospective, single center study, which may have selection bias and confounding factors. A larger sample size and multicenter prospective study should be performed to confirm our results.