
Construction and validation of a prognostic model for colorectal cancer based on migrasome-related long non-coding RNAs
- Published
- Accepted
- Received
- Academic Editor
- Kenta Nakai
- Subject Areas
- Bioinformatics, Cell Biology, Gastroenterology and Hepatology, Oncology
- Keywords
- Colon adenocarcinoma, Migrasomes, LncRNA, Prognostic model
- Copyright
- © 2025 Lv et al.
- Licence
- This is an open access article distributed under the terms of the Creative Commons Attribution License, which permits using, remixing, and building upon the work non-commercially, as long as it is properly attributed. For attribution, the original author(s), title, publication source (PeerJ) and either DOI or URL of the article must be cited.
- Cite this article
- 2025. Construction and validation of a prognostic model for colorectal cancer based on migrasome-related long non-coding RNAs. PeerJ 13:e19443 https://doi.org/10.7717/peerj.19443
Abstract
Background
Colon adenocarcinoma (COAD) is a globally prevalent and deadly malignancy of the digestive system. Recently, migrasomes have gained significant attention as important regulators of tumor cell migration and metastasis. The current research developed a highly accurate prognostic model using migrasome-related long non-coding RNAs (lncRNAs) in COAD, providing new insights for prognostic assessment and immunotherapy of COAD patients.
Methods
RNA sequencing data from COAD patients were acquired from The Cancer Genome Atlas Program (TCGA) database to construct a prognostic lncRNA model based on known migrasome-related genes (MRGs). The model’s predictive accuracy was then assessed using concordance index (C-index) analysis, nomograms, principal component analysis, and receiver operating characteristic curves. Gene Ontology (GO) and Kyoto Encyclopedia of Genes and Genomes (KEGG) enrichment analyses were conducted to identify significant differences in biological functions and signaling pathways associated with differentially expressed genes in the high-risk subgroup. A comprehensive evaluation of the model incorporated clinical-pathological features, tumor microenvironment, and chemotherapy sensitivity. The expression levels of prognostic genes in COAD patients were validated via quantitative reverse transcription polymerase chain reaction (RT-qPCR). Furthermore, the role of LCMT1-AS1 in colorectal cancer was examined through CCK-8 assays, colony formation assays, and Transwell experiments.
Results
Migrasome-related lncRNAs were identified as robust prognostic predictors for COAD. Multivariate analysis revealed that the risk score derived from these lncRNAs is an independent prognostic factor for COAD. Patients in the low-risk group exhibited significantly longer overall survival (OS) compared to those in the high-risk group. Accordingly, the nomogram prediction model we developed, which integrates clinical features and risk scores, demonstrated excellent prognostic performance. In vitro experiments further showed that LCMT1-AS1 promotes the proliferation and migration of COAD cells.
Introduction
Colorectal adenocarcinoma (COAD) is a highly prevalent malignant tumor with a high rate of mortality worldwide, particularly in developed countries (Bray et al., 2024). According to global cancer statistics, in 2020, COAD ranked third in cancer incidence after breast and lung cancers but ranked second among the main causes of cancer-related deaths (Siegel, Giaquinto & Jemal, 2024). The development of COAD is influenced by multiple factors, including environmental influences and genetic predisposition, which together facilitate oncogene activation as well as the inactivation of tumor suppressor genes, resulting in various malignant phenotypes, such as cell proliferation and metastasis (Dekker et al., 2019). Although recent advancements in treatment combinations (e.g., chemotherapy, radiotherapy, and surgery) have enhanced patient survival, the high rates of recurrence and metastasis in COAD continue to yield a low 5-year survival rate (Van Cutsem et al., 2016). However, there remains a critical gap in the identification of reliable biomarkers and therapeutic targets that can accurately predict the prognosis and treatment response of COAD patients, especially those with metastatic disease. This highlights the urgent need for new molecular markers and models that could improve the precision of diagnosis and treatment, enabling more personalized approaches to COAD care.
Recent studies have highlighted the importance of migrasomes in cancer metastasis, and their role in colorectal cancer progression has gained increasing attention. Migrasomes have recently been identified as a type of extracellular vesicle structure that is closely associated with cell migration and microenvironment signaling (Ma et al., 2015). These specialized vesicular structures form on filamentous protrusions during cell migration and are capable of enriching and releasing various signaling molecules, including proteins and RNA, which influence the behavior of surrounding cells (Cai & Shen, 2024). The discovery of migrasomes has opened new avenues in cancer research, as these structures are not only involved in cell migration but also in modulating tumor progression and metastasis. However, their role in COAD and their potential as prognostic biomarkers remain largely unexplored. Recently, migrasomes’ involvement in cancer has attracted significant attention, especially for its role in tumor metastasis. Studies indicate that migrasomes not only contribute to tumor invasion and metastasis but may also transmit pro-cancer signals within the tumor microenvironment, thereby supporting the survival and proliferation of tumor cells (Zhang et al., 2024). This has led to the hypothesis that migrasomes may play a critical role in the aggressiveness and metastatic potential of COAD. In COAD, the formation and release of migrasomes may be linked to tumors’ aggressiveness and metastatic potential. Hence, elucidating the biological functions of migrasomes can provide new insights for diagnosing and treating cancer (Qin et al., 2022).
In addition to migrasomes, recent studies have also emphasized the critical role of long non-coding RNAs (lncRNAs) in regulating various cellular processes, including metastasis, in COAD (all abbreviations are listed in Table 1). LncRNAs which are over 200 nucleotides long, representa group of RNA molecules that do not encode proteins but are crucial for regulating gene expression (Rinn & Chang, 2012). Recently, their involvement in cancer, particularly in COAD, has attracted considerable attention. Numerous studies have underscored lncRNAs’ significance in tumorigenesis, progression, and metastasis (Chen et al., 2017). Despite the growing body of research, the specific lncRNAs associated with migrasomes in COAD have not been comprehensively studied. This gap in knowledge presents an opportunity to explore the potential of migrasome-related lncRNAs (MRLs) as novel prognostic biomarkers and therapeutic targets in COAD. lncRNAs can regulate the expression of cancer-related genes through various mechanisms, such as acting as competitive endogenous RNAs (ceRNAs) that bind competitively to miRNAs, thereby affecting the expression of target genes (Kopp & Mendell, 2018). Furthermore, some lncRNAs have been shown to regulate the cell cycle, promote tumor cell proliferation and invasion, and even enhance chemotherapy resistance, making them potential therapeutic targets (Bhan, Soleimani & Mandal, 2017). Therefore, in-depth research into the mechanisms of lncRNAs in COAD can not only aid in understanding the pathogenesis of the disease but may also provide a theoretical basis for developing personalized treatment strategies.
| COAD | Colorectal adenocarcinoma |
| MRLs | Migrasome-related long non-coding RNAs |
| MRGs | Migrasome-related genes |
| TME | Tumor microenvironment |
| TCGA | The Cancer Genome Atlas |
| AJCC | American Joint Committee on Cancer |
| PCA | Principal component analysis |
| GO | Gene Ontology |
| KEGG | Kyoto Encyclopedia of Genes and Genomes |
| GSEA | Gene Set Enrichment Analysis |
| TMB | Tumor mutational burden |
| IC50 | Half-maximal inhibitory concentration |
| ROC | Receiver operating characteristic |
| AUC | Area under the curve |
| LASSO | Least absolute shrinkage and selection operator |
| qRT-PCR | Quantitative reverse transcription polymerase chain reaction |
| FBS | Fetal bovine serum |
| ANOVA | Analysis of variance |
| CIBERSORT | Cell type identification by estimating relative subsets of RNA transcripts |
| TIDE | Tumor immune dysfunction and exclusion |
Currently, the mechanisms by which migrasomes regulate tumors are not fully understood, and the role of MRLs in COAD remains unexplored. This study aims to fill this gap by investigating the role of MRLs in COAD through bioinformatics analysis and experimental validation. We aim to develop a prognostic model based on MRLs that can assess the prognosis, tumor microenvironment (TME), and drug treatment sensitivity of COAD patients. Moreover, our study will explore the potential of MRLs as novel biomarkers for COAD, ultimately contributing to more accurate prognostic assessments and more effective, personalized treatments for COAD patients.
Materials and Methods
Data acquisition and MRLs screening
High clinical and pathological information as well as high-throughput RNA sequencing data for 39 normal colorectal tissues and 396 COAD tissues were acquired from The Cancer Genome Atlas (TCGA) database (https://portal.gdc.cancer.gov/). The expression data for lncRNA and mRNA were then normalized, while clinical information, including age, sex, survival time, survival status, AJCC stage and stage (T, N, M), were collected. Previous research identified nine migrasome-related genes (MRGs) (Qin et al., 2022; Zhao et al., 2019; Zheng et al., 2023). Pearson correlation coefficients were used to identify lncRNAs associated with MRG expression, with p < 0.001 and correlation coefficient r > 0.4 selected as screening criteria. The “limma” package was eventually used to analyze the normalized data before visualizing the results with the “ggalluvial” package.
Prognostic model development and validation for MRLs
After randomly assigning clinical samples to training and testing cohorts, univariate Cox regression analysis was performed on the training group, using p < 0.001 as the significance threshold to identify seven potential candidate MRLs. In this case, overfitting was minimized by applying the Least Absolute Shrinkage and Selection Operator (LASSO), thereby selecting only the most relevant predictive factors. Multivariable Cox regression analysis identified four MRLs based on which a risk feature model was constructed for predicting the survival rate of COAD patients. The risk score was then calculated as follows:
In the risk model, N represents the number of prognosis-associated lncRNAs, Coef refers to the regression coefficients calculated using multivariable Cox regression analysis, and Expi denotes each lncRNA’s expression level. Correlation studies were conducted using data from the four MRLs, with the relationships subsequently visualized on a heatmap. Using the prognostic model, risk scores were calculated for both the training and testing groups, with the median score subsequently selected for classifying samples into low-risk and high-risk groups. Risk curves were generated prior to visualization with the “pheatmap” tool in R. Kaplan-Meier (K-M) survival analysis as well as receiver operating characteristic (ROC) curve analysis were performed using the “survminer” and “timeROC” packages.
The “survival” and “RMS” packages were used to develop predictive plots which combined risk levels and clinical pathological features for estimating the 1-, 3-, and 5-year survival probabilities for COAD patients. The relationship between expected survival rates and observed outcomes were eventually compared using calibration curves.
Principal component analysis and functional enrichment analysis
Principal component analysis (PCA), a technique that is widely applied for dimensionality reduction, was performed for extracting primary feature components, with the “scatterplot3d” tool in R subsequently used to visualize differences between the low-risk and high-risk groups.
These two categories were then compared using the “limma” package to identify differentially expressed genes (DEGs), with a false discovery rate of <0.05 and a |log2(fold change)|of >1 selected as selection criteria (Ritchie et al., 2015). For functional enrichment analysis, enriched Kyoto Encyclopedia of Genes and Genomes (KEGG) pathways and Gene Ontology (GO) were assessed using the “clusterProfiler” package. GO analysis provides insights into cellular components (CC), molecular functions (MF), and biological processes (BP), while KEGG analysis integrates genomic, chemical, and functional data to analyze biological pathways. Additionally, the “limma” package was used for gene set enrichment analysis (GSEA), with GO and KEGG enrichment analysis for differentially expressed lncRNAs between the two risk groups subsequently conducted with the “enrichplot”, “org.Hs.eg.db”, “limma”, and “clusterProfiler” packages. Functional enrichment was considered significant at p < 0.05.
Tumor mutational burden and tumor immune analysis
Tumor mutation burden (TMB) is defined as the number of mutations per million bases and serves as a key biomarker in tumor progression and immunotherapy response. Mutation data for COAD were obtained from TCGA and analyzed using the “maftools” package to compare TMB differences between high- and low-risk groups and visualize the top 15 mutated genes. Survival analysis was conducted to evaluate its prognostic significance.
To explore immune characteristics, we used the CIBERSORT algorithm to estimate immune cell infiltration and assessed immune checkpoint expression differences between risk groups. Additionally, we performed Tumor Immune Dysfunction and Exclusion (TIDE) analysis (http://tide.dfci.harvard.edu/) to predict tumor immune escape. TIDE scores were compared between the high- and low-risk groups to evaluate potential differences in response to immune checkpoint blockade therapy. Statistical comparisons were performed using “limma” and “ggpubr”, with significance levels set at *p < 0.05, **p < 0.01, and **p < 0.001.
Prediction of potential drugs for the treatment of COAD
To predict potential antitumor drugs for treating colorectal cancer patients, we calculated the half-maximal inhibitory concentration (IC50) of antitumor drugs obtained from the Genomics of Drug Sensitivity in Cancer (GDSC) website. The “limma,” “ggpubr,” and “ggplot2” packages were employed to identify antitumor drugs that may be effective in treating colorectal cancer tumors.
Cell culture and CRC patient samples
Human COAD cell lines HCT116, DLD-1, SW620, and RKO and the normal human intestinal epithelial cell line NCM460 were used in this study. The selection of these cell lines was based on their genetic background, invasiveness, and relevance to COAD progression. Specifically, HCT116 and RKO exhibit high invasiveness, SW620 originates from lymph node metastases, and DLD-1 represents a well-characterized COAD model. The normal cell line NCM460 was used as a control.
Cells were obtained from Wuhan Pricella Biotechnology Co., Ltd. (Wuhan, China). All cell lines were authenticated before use, and routine mycoplasma contamination tests were conducted to ensure experimental validity. HCT116 and DLD-1 cells were cultured in RPMI-1640 medium, while SW620 and RKO cells were maintained in high-glucose DMEM medium. All culture media were supplemented with 10% fetal bovine serum (FBS) and 100 U/mL penicillin-streptomycin. Cells were incubated at 37 °C in a humidified atmosphere with 5% CO2.
For clinical sample validation, 20 paired colorectal adenocarcinoma (COAD) tumor tissues and adjacent normal tissues were collected from patients who underwent surgical resection at The Fourth Affiliated Hospital of Harbin Medical University. The inclusion and exclusion criteria for patient selection were as follows:
Inclusion criteria: (1) Patients with histologically confirmed primary COAD; (2) No history of preoperative chemotherapy, radiotherapy, or targeted therapy; (3) Availability of complete clinical and follow-up data; (4) Patients who provided written informed consent. Exclusion criteria: (1) Patients diagnosed with metastatic COAD at the time of surgery; (2) Patients with prior malignancies or concurrent cancers; (3) Presence of severe systemic diseases affecting study outcomes; (4) Poor RNA quality or insufficient tissue samples for further analysis. This study was approved by the Institutional Review Board (IRB) of The Fourth Affiliated Hospital of Harbin Medical University (Approval Reference No.: YXLLSC-2018-01). All procedures followed the International Ethical Guidelines for Biomedical Research Involving Human Subjects.
RNA extraction and cDNA synthesis
Total RNA was extracted from cells and tissue samples using TRIzol reagent (Takara, Shiga, Japan) following the manufacturer’s protocol. RNA concentration and purity were assessed with a NanoDrop 2000 spectrophotometer (Thermo Fisher Scientific, Waltham, MA, USA), ensuring an A260/A280 ratio between 1.8 and 2.0. Subsequently, 1 µg of total RNA was converted to cDNA using the ReverTra Ace™ qPCR RT Kit (Toyobo Bio, Osaka, Japan). The reverse transcription reaction was performed at 37 °C for 15 min and terminated by heating at 85 °C for 5 s. The resulting cDNA was stored at −20 °C for future experiments.
Quantitative reverse transcription polymerase chain reaction
Quantitative reverse transcription polymerase chain reaction (two-step RT-qPCR) was conducted using the SYBR Green PCR kit (2× S6 Universal SYBR qPCR Mix, EnzyArtisan, Shanghai, China) on a QuantStudio™ 6 Flex real-time PCR system (Applied Biosystems, Waltham, MA, USA). Each reaction had a total volume of 10 µL, comprising 5 µL of SYBR Green mix, 0.5 µL of each primer, 1 µL of diluted cDNA template, and 3 µL of nuclease-free water. The PCR conditions included pre-denaturation at 95 °C for 30 s, followed by 40 cycles of 95 °C for 5 s and 60 °C for 30 s. Reaction specificity was confirmed by melt curve analysis.
Primer design and data analysis
All primers were designed using Primer-BLAST, and their specificity was verified using NCBI BLAST. The primers were synthesized by Synbio Technologies (Beijing, China). The sequences of primers used for PCR amplification in this study are listed below:
AC004846.1, forward: 5′-ATCCGTGTGGGTGCTCCTTCC-3′,
reverse: 5′- CGCTGGTACTTCGTTGCCTCTG-3′;
AC010789.2, forward: 5′-CCACCATGAAGAGAAAAGCAGG-3′,
reverse: 5′-TTTCTCTGACCAGTGCTTGTTCTG-3′;
ZEB1-AS1, forward: 5′-TGTCGGAGTTGGAAAGGGAC-3′,
reverse: 5′-CTACTAAGGAGGCTGCTGGC-3′;
LCMT1-AS1, forward: 5′-GTTTCTGCTTGCTGGTCGC-3′,
reverse: 5′-TGGATTCTCTGCCCTTTGCC-3′;
Vimentin, forward: 5′-AGGCAAAGCAGGAGTCCACTGA-3′,
reverse: 5′- ATCTGGCGTTCCAGGGACTCAT-3′;
E-cadherin, forward: 5′-GCCTCCTGAAAAGAGAGTGGAAG-3′,
reverse: 5′-TGGCAGTGTCTCTCCAAATCCG-3′.
Each sample was tested in triplicate, with β-actin serving as the internal reference control. Relative expression levels were determined using the 2−ΔΔCt method. The expression differences of MRLs were assessed using t-tests. Graphs were generated using GraphPad Prism (version 9.5.1).
RNA transfection by lipofectamine
The LCMT1-AS1-set shRHA was synthesized by Applied Biological Materials company (Richmond, BC, Canada). Oligonucleotide transfection was conducted using MaxFect Lipo 3000 Transfection Reagent according to the manufacturer’s protocol. Forty-eight hours post-transfection, cells were harvested for further analysis. Knockdown efficiency was confirmed by RT-qPCR.
Proliferation assay
The CCK-8 assay was conducted to evaluate cell proliferation. A total of 2,000 transfected HCT116 and RKO cells were seeded into 96-well plates. CCK-8 reagent was added at specified time points and incubated at 37 °C for 1 h. Absorbance was measured at 450 nm.
A colony formation assay was conducted to evaluate cell growth. A total of 400 transfected HCT116 and RKO cells were seeded into six-well plates and maintained until colonies formed. Colonies were then fixed with paraformaldehyde for 30 min and stained with crystal violet. The number of colonies was counted for further analysis.
Transwell migration assay
A tumor cell migration assay was conducted following the manufacturer’s instructions. Briefly, cells were collected, resuspended in serum-free medium, and seeded onto Transwell inserts at a density of 100,000 cells per well. The inserts were then placed into lower chambers filled with 600 μL of medium containing 10% FBS and incubated at 37 °C for 24 h. Cells on the upper surface of the Transwell insert were removed with a cotton swab, while cells that had migrated to the underside were fixed with 4% paraformaldehyde and stained with 0.1% crystal violet. Images were captured from five random areas, and cells were counted to determine the average number of migrated cells.
Statistical analysis
Cox regression, Pearson correlation coefficients, and K-M survival analysis were conducted using R (version 4.4.1; https://www.r-project.org/). Comparisons among groups were performed using GraphPad Prism software (version 9.5.1), with statistical tests conducted using analysis of variance (ANOVA). Correlation analysis was carried out using Spearman correlation coefficients. A p-value that is not significant (ns) is indicated as non-significant. A p-value less than 0.05 (*) indicates statistical significance, while p-values less than 0.01 (**) and 0.001 (***) indicate higher degrees of significance.
Results
Identification of MRLs associated with prognosis in COAD
Based on the TCGA-COAD data, 16,876 lncRNAs were identified. Using the expression profiles of the nine MRGs obtained from previous studies, the expression profiles of MRGs were then extracted from the TCGA-COAD dataset. Through correlation analysis between colorectal cancer lncRNAs and MRGs, a total of 2,317 MRLs were identified (|or| > 4, p < 0.001). The relationship between MRLs and MRGs in COAD patients was illustrated in a Sankey diagram (Fig. 1). Overall, 377 COAD patients were randomly divided into a training (N = 189) or a testing group (N = 188), and as shown in Table 2, the two groups were not significantly different in terms of their clinical characteristics. Analysis of the training set using univariate Cox regression models identified seven MRLs (p < 0.001) significantly associated with COAD patients’ prognosis (Fig. 2A). This was followed by LASSO regression analysis to screen for overfitting MRLs before investigating any potential association between four MRLs (AC004846.1, AC010789.2, ZEB1-AS1, LCMT1-AS1) and the clinical outcomes of COAD patients based on multivariate Cox regression analysis (Figs. 2B, 2C). Correlations between these four MRLs and MRGs were visualized in a heatmap (Fig. 2D).
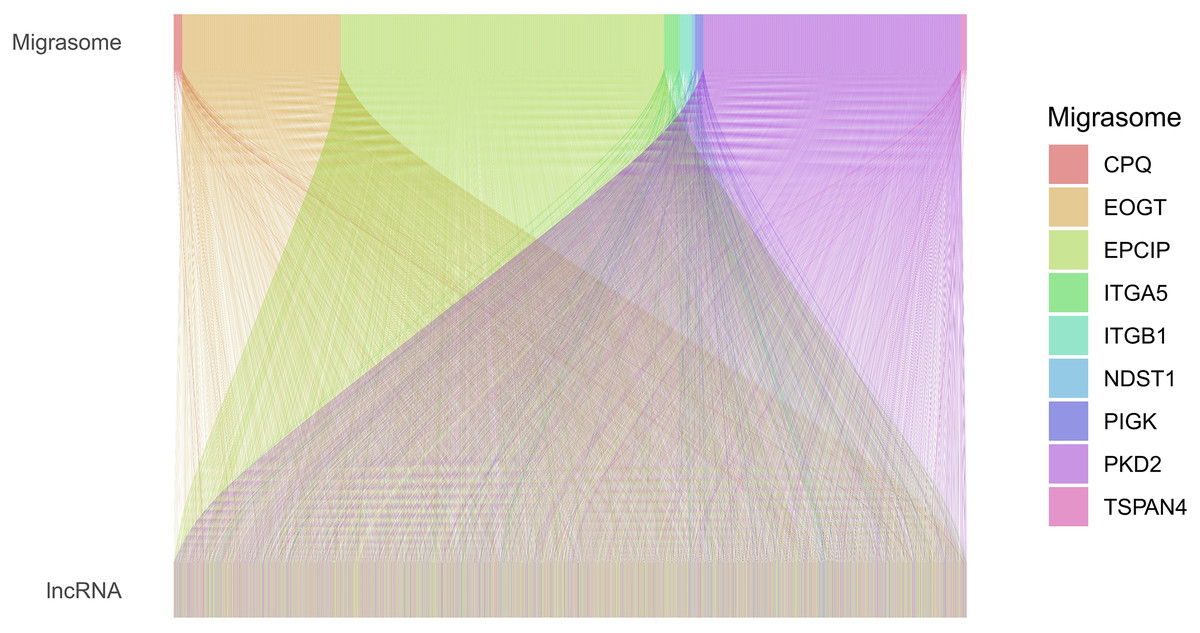
Figure 1: Sankey diagram of the relationships between MRGs and MRLs.
The associations between MRLs and MRGs. The width of the lines connecting the MRGs and MRLs indicate the strength of their association. Wider lines represent stronger links.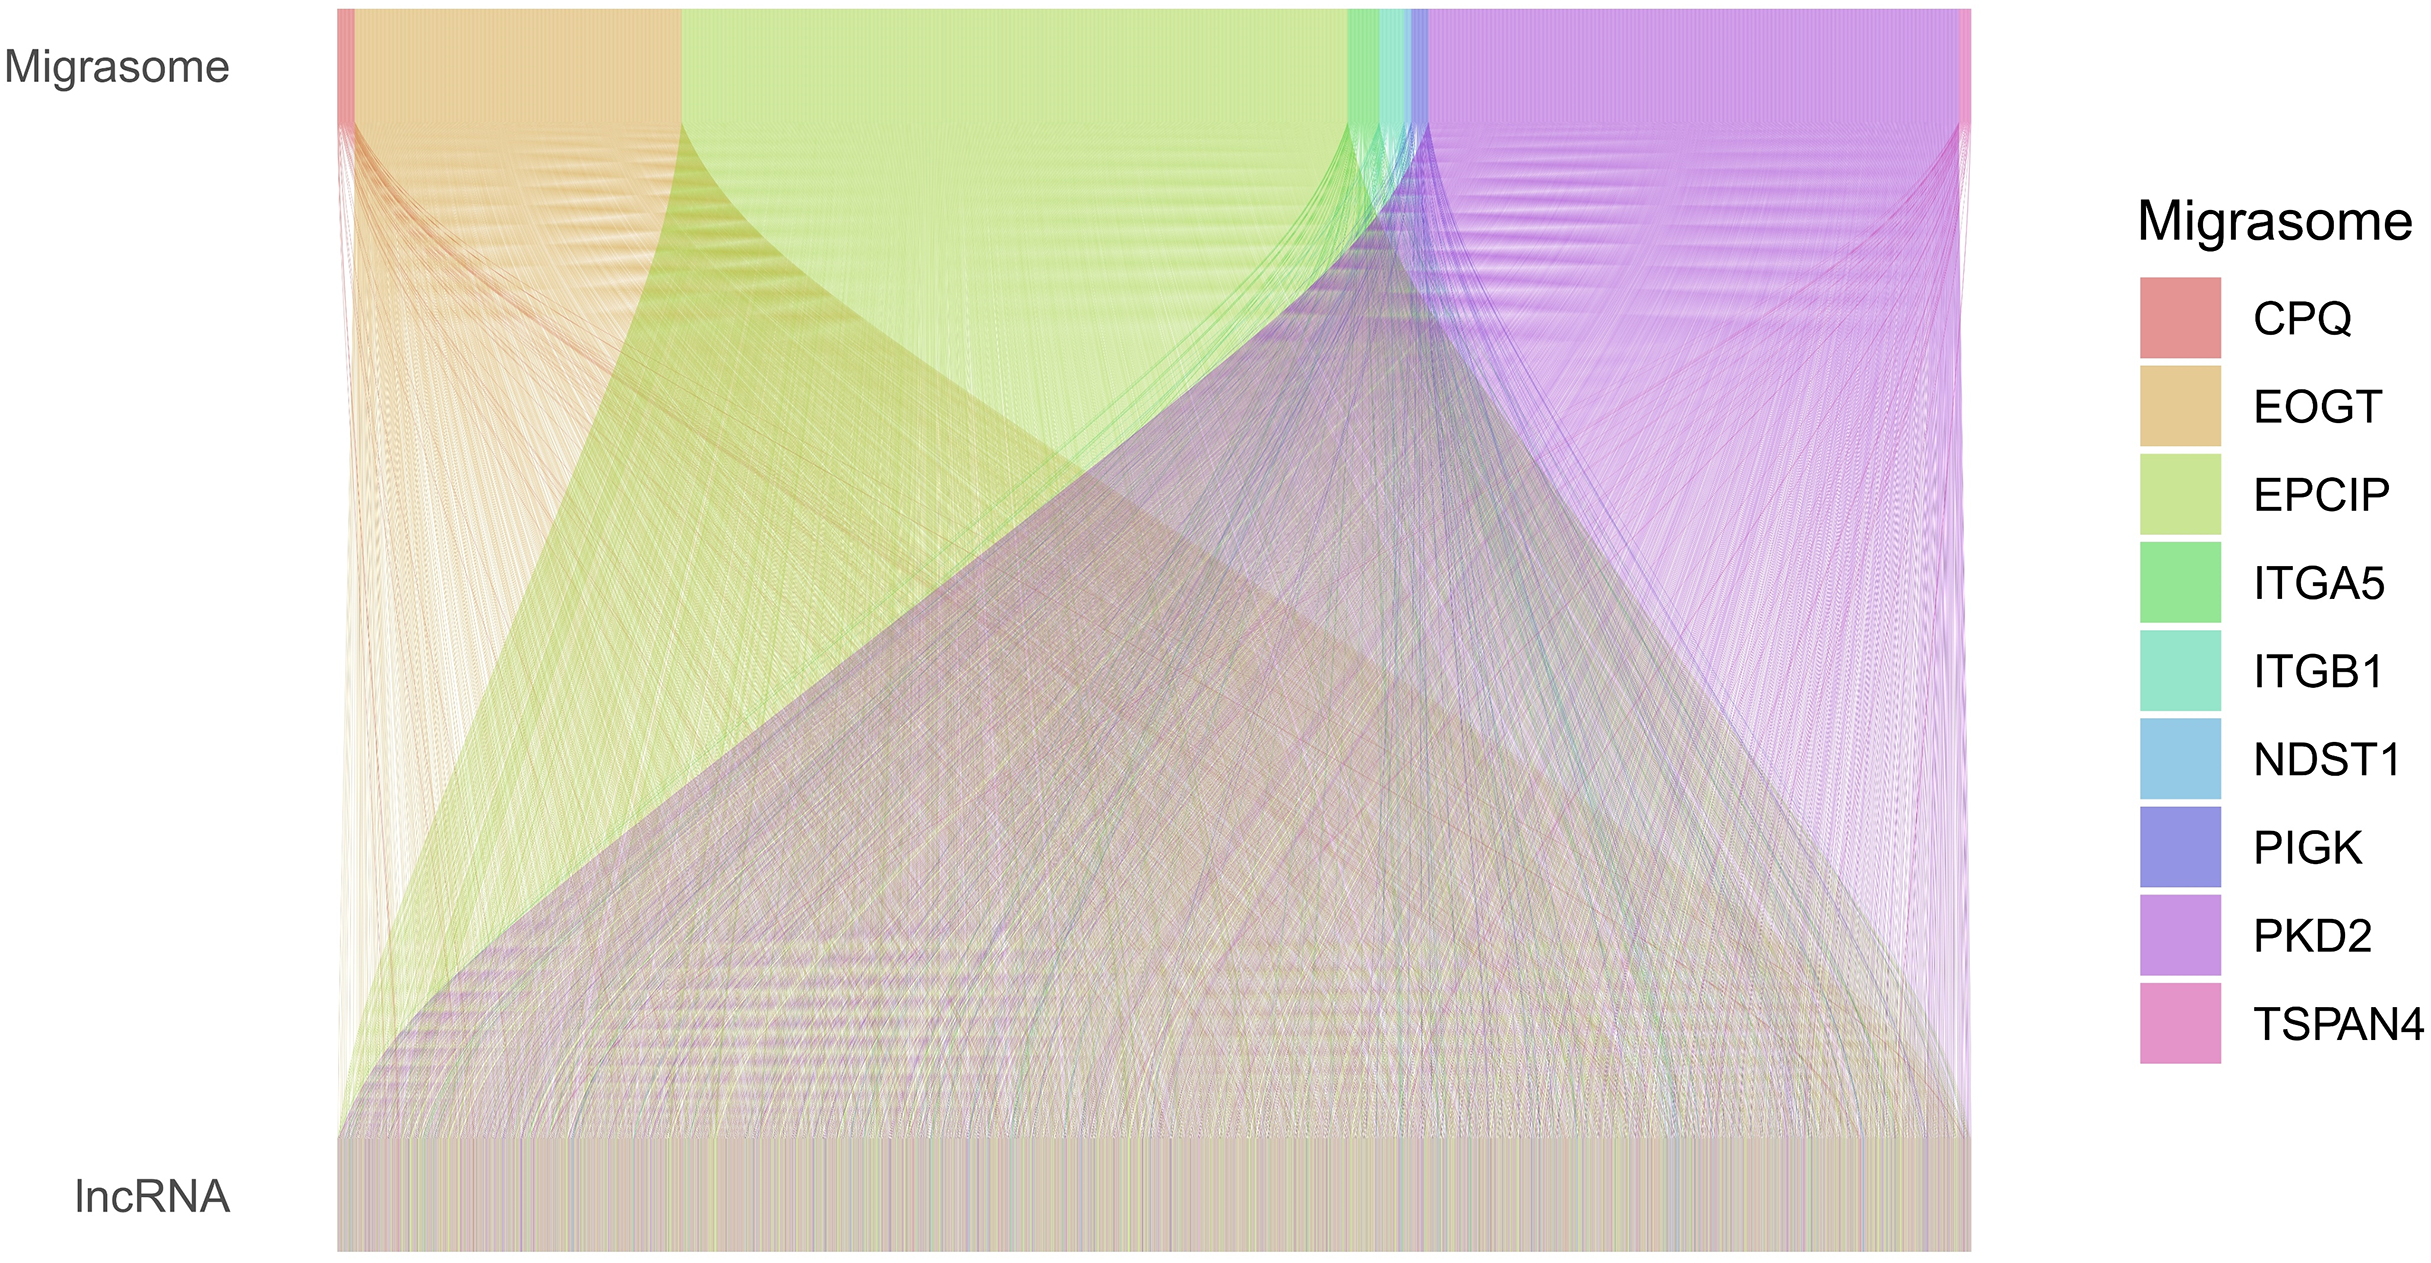
| Covariates | Type | Total | Test | Train | P value |
|---|---|---|---|---|---|
| Age | ≤65 | 155 (41.11%) | 77 (40.96%) | 78 (41.27%) | 1 |
| >65 | 222 (58.89%) | 111 (59.04%) | 111 (58.73%) | ||
| Gender | Female | 179 (47.48%) | 85 (45.21%) | 94 (49.74%) | 0.4377 |
| Male | 198 (52.52%) | 103 (54.79%) | 95 (50.26%) | ||
| Stage | Stage I | 64 (16.98%) | 32 (17.02%) | 32 (16.93%) | 0.914 |
| Stage II | 147 (38.99%) | 75 (39.89%) | 72 (38.1%) | ||
| Stage III | 101 (26.79%) | 47 (25%) | 54 (28.57%) | ||
| Stage IV | 54 (14.32%) | 26 (13.83%) | 28 (14.81%) | ||
| Unknown | 11 (2.92%) | 8 (4.26%) | 3 (1.59%) | ||
| T | T1 | 9 (2.39%) | 4 (2.13%) | 5 (2.65%) | 0.8947 |
| T2 | 67 (17.77%) | 36 (19.15%) | 31 (16.4%) | ||
| T3 | 257 (68.17%) | 127 (67.55%) | 130 (68.78%) | ||
| T4 | 44 (11.67%) | 21 (11.17%) | 23 (12.17%) | ||
| M | M0 | 279 (74.01%) | 138 (73.4%) | 141 (74.6%) | 0.9776 |
| M1 | 54 (14.32%) | 26 (13.83%) | 28 (14.81%) | ||
| Unknown | 44 (11.67%) | 24 (12.77%) | 20 (10.58%) | ||
| N | N0 | 225 (59.68%) | 115 (61.17%) | 110 (58.2%) | 0.5699 |
| N1 | 86 (22.81%) | 44 (23.4%) | 42 (22.22%) | ||
| N2 | 66 (17.51%) | 29 (15.43%) | 37 (19.58%) |
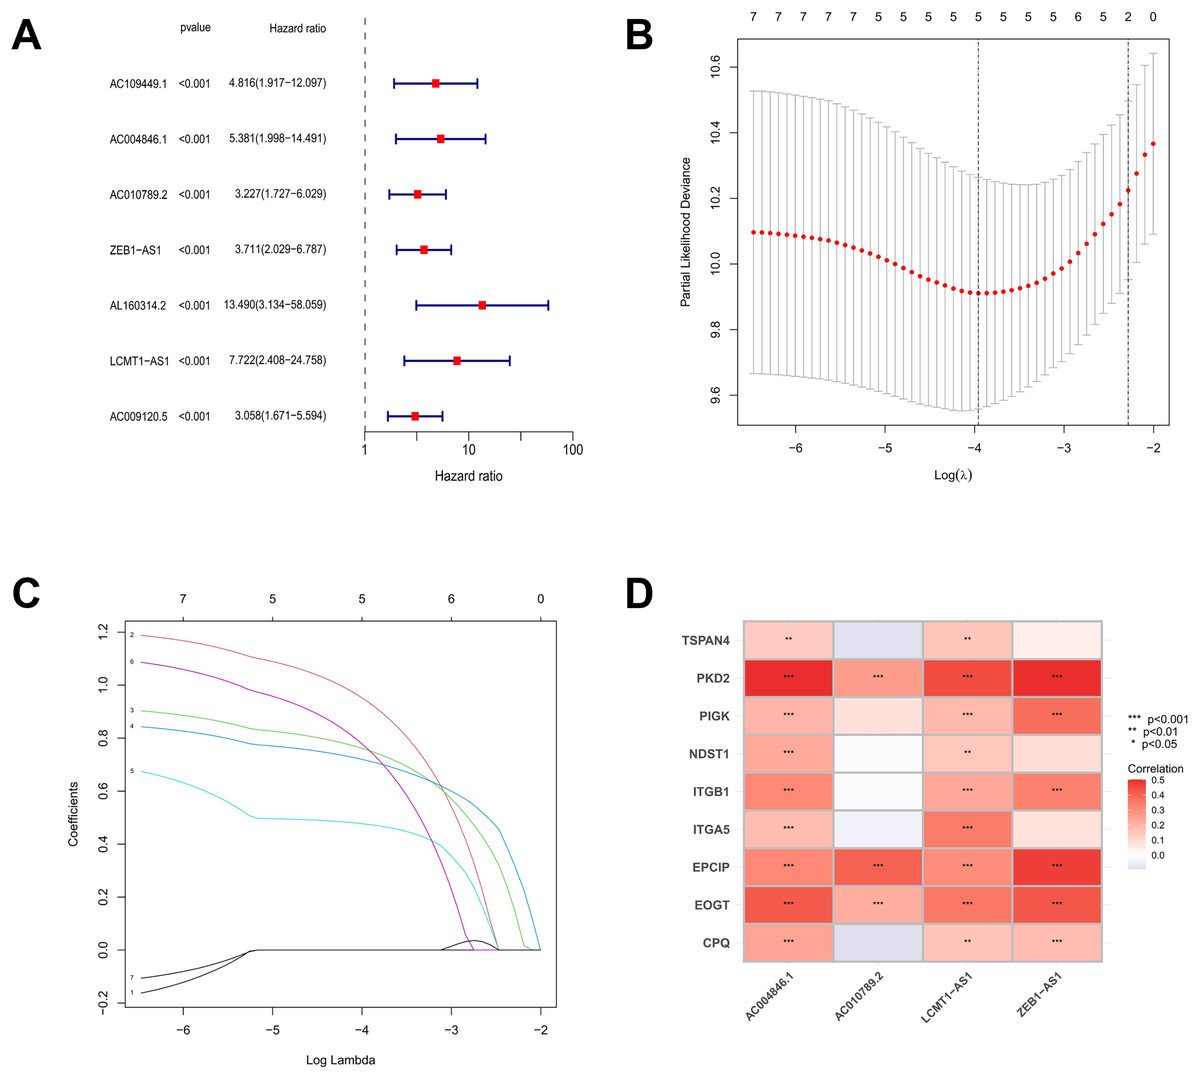
Figure 2: The screening and identification process of MRLs.
(A) Univariate Cox regression analysis identified seven migrasome-associated lncRNAs (MRLs). (B, C) LASSO regression and multivariate Cox analyses were used to identify four MRLs. (D) The heatmap visualizes the correlation between the four identified lncRNAs and migrasome-related genes. *p < 0.05; **p < 0.01; ***p < 0.001.
Prognostic model development and assessment for MRLs
Using the following risk score formula, a novel prognostic model was developed for the MRLs:
Risk scores were calculated for each patient in both the training and testing sets. Based on these scores, patients were categorized into high-risk and low-risk groups, using the median risk score as the cutoff value (Fig. 3A). Patients in the high-risk group exhibited a higher mortality rate compared to those in the low-risk group (Fig. 3B). Additionally, the heatmap demonstrated significant differences in MRL expression levels between the two patient groups (Fig. 3C), with the expression levels of the four MRLs being significantly higher in the high-risk group. K-M survival curve analysis revealed that the overall survival (OS) time for COAD patients in the high-risk group was significantly shorter than that of the low-risk group (Fig. 4A). To further validate the predictive ability of the MRL risk score, ROC analysis was conducted based on the risk model and clinical characteristics. The area under the ROC curve (AUC) effectively demonstrated the accuracy of this risk score. In the training set, we calculated AUC values for three different time points: 1 year (0.744), 3 years (0.760), and 5 years (0.861) (Fig. 4B). Similarly, the AUC values in the testing set were 0.665, 0.646, and 0.628, respectively. Furthermore, the AUC value of the MRL risk score (0.762) was higher than those for age (0.627), tumor stage (0.684), and gender (0.487) (Fig. 4C). These results indicate that the MRL risk score has good predictive ability for the prognostic outcomes of COAD patients.
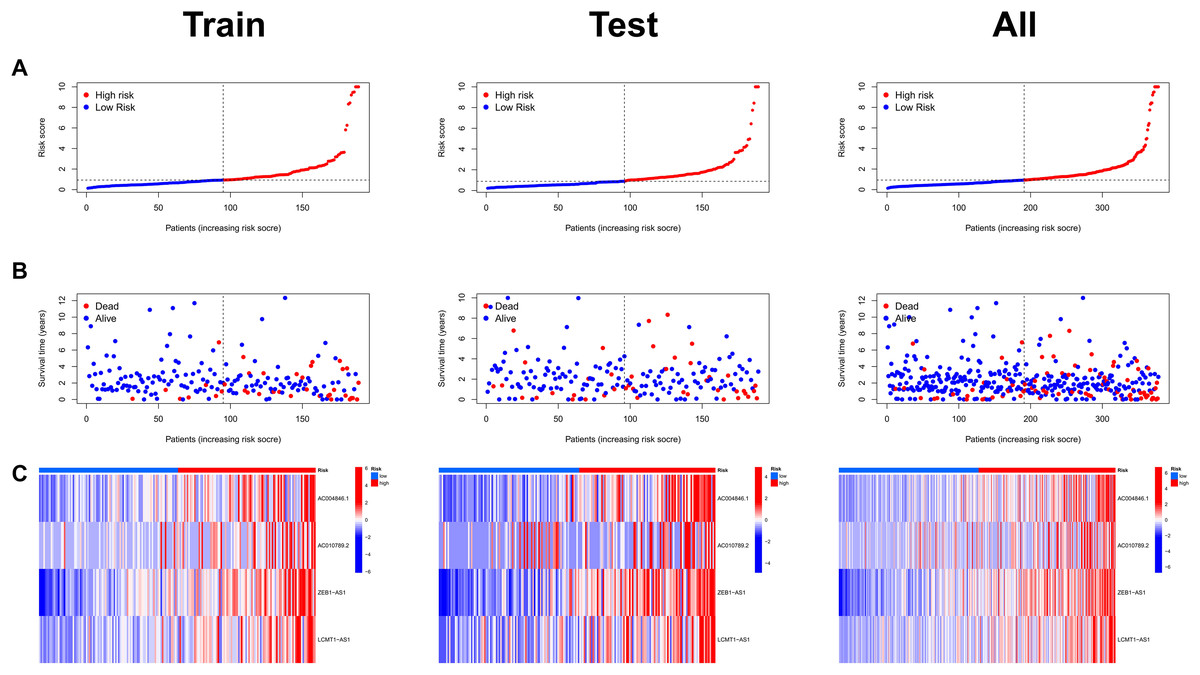
Figure 3: Assessment of the MRLs prognostic model.
(A) Distribution of risk scores in the high-risk and low-risk groups. (B) The distribution of survival time and status in the high-risk and low-risk groups for COAD patients is shown. (C) The heatmap demonstrates the expression of the four identified lncRNAs.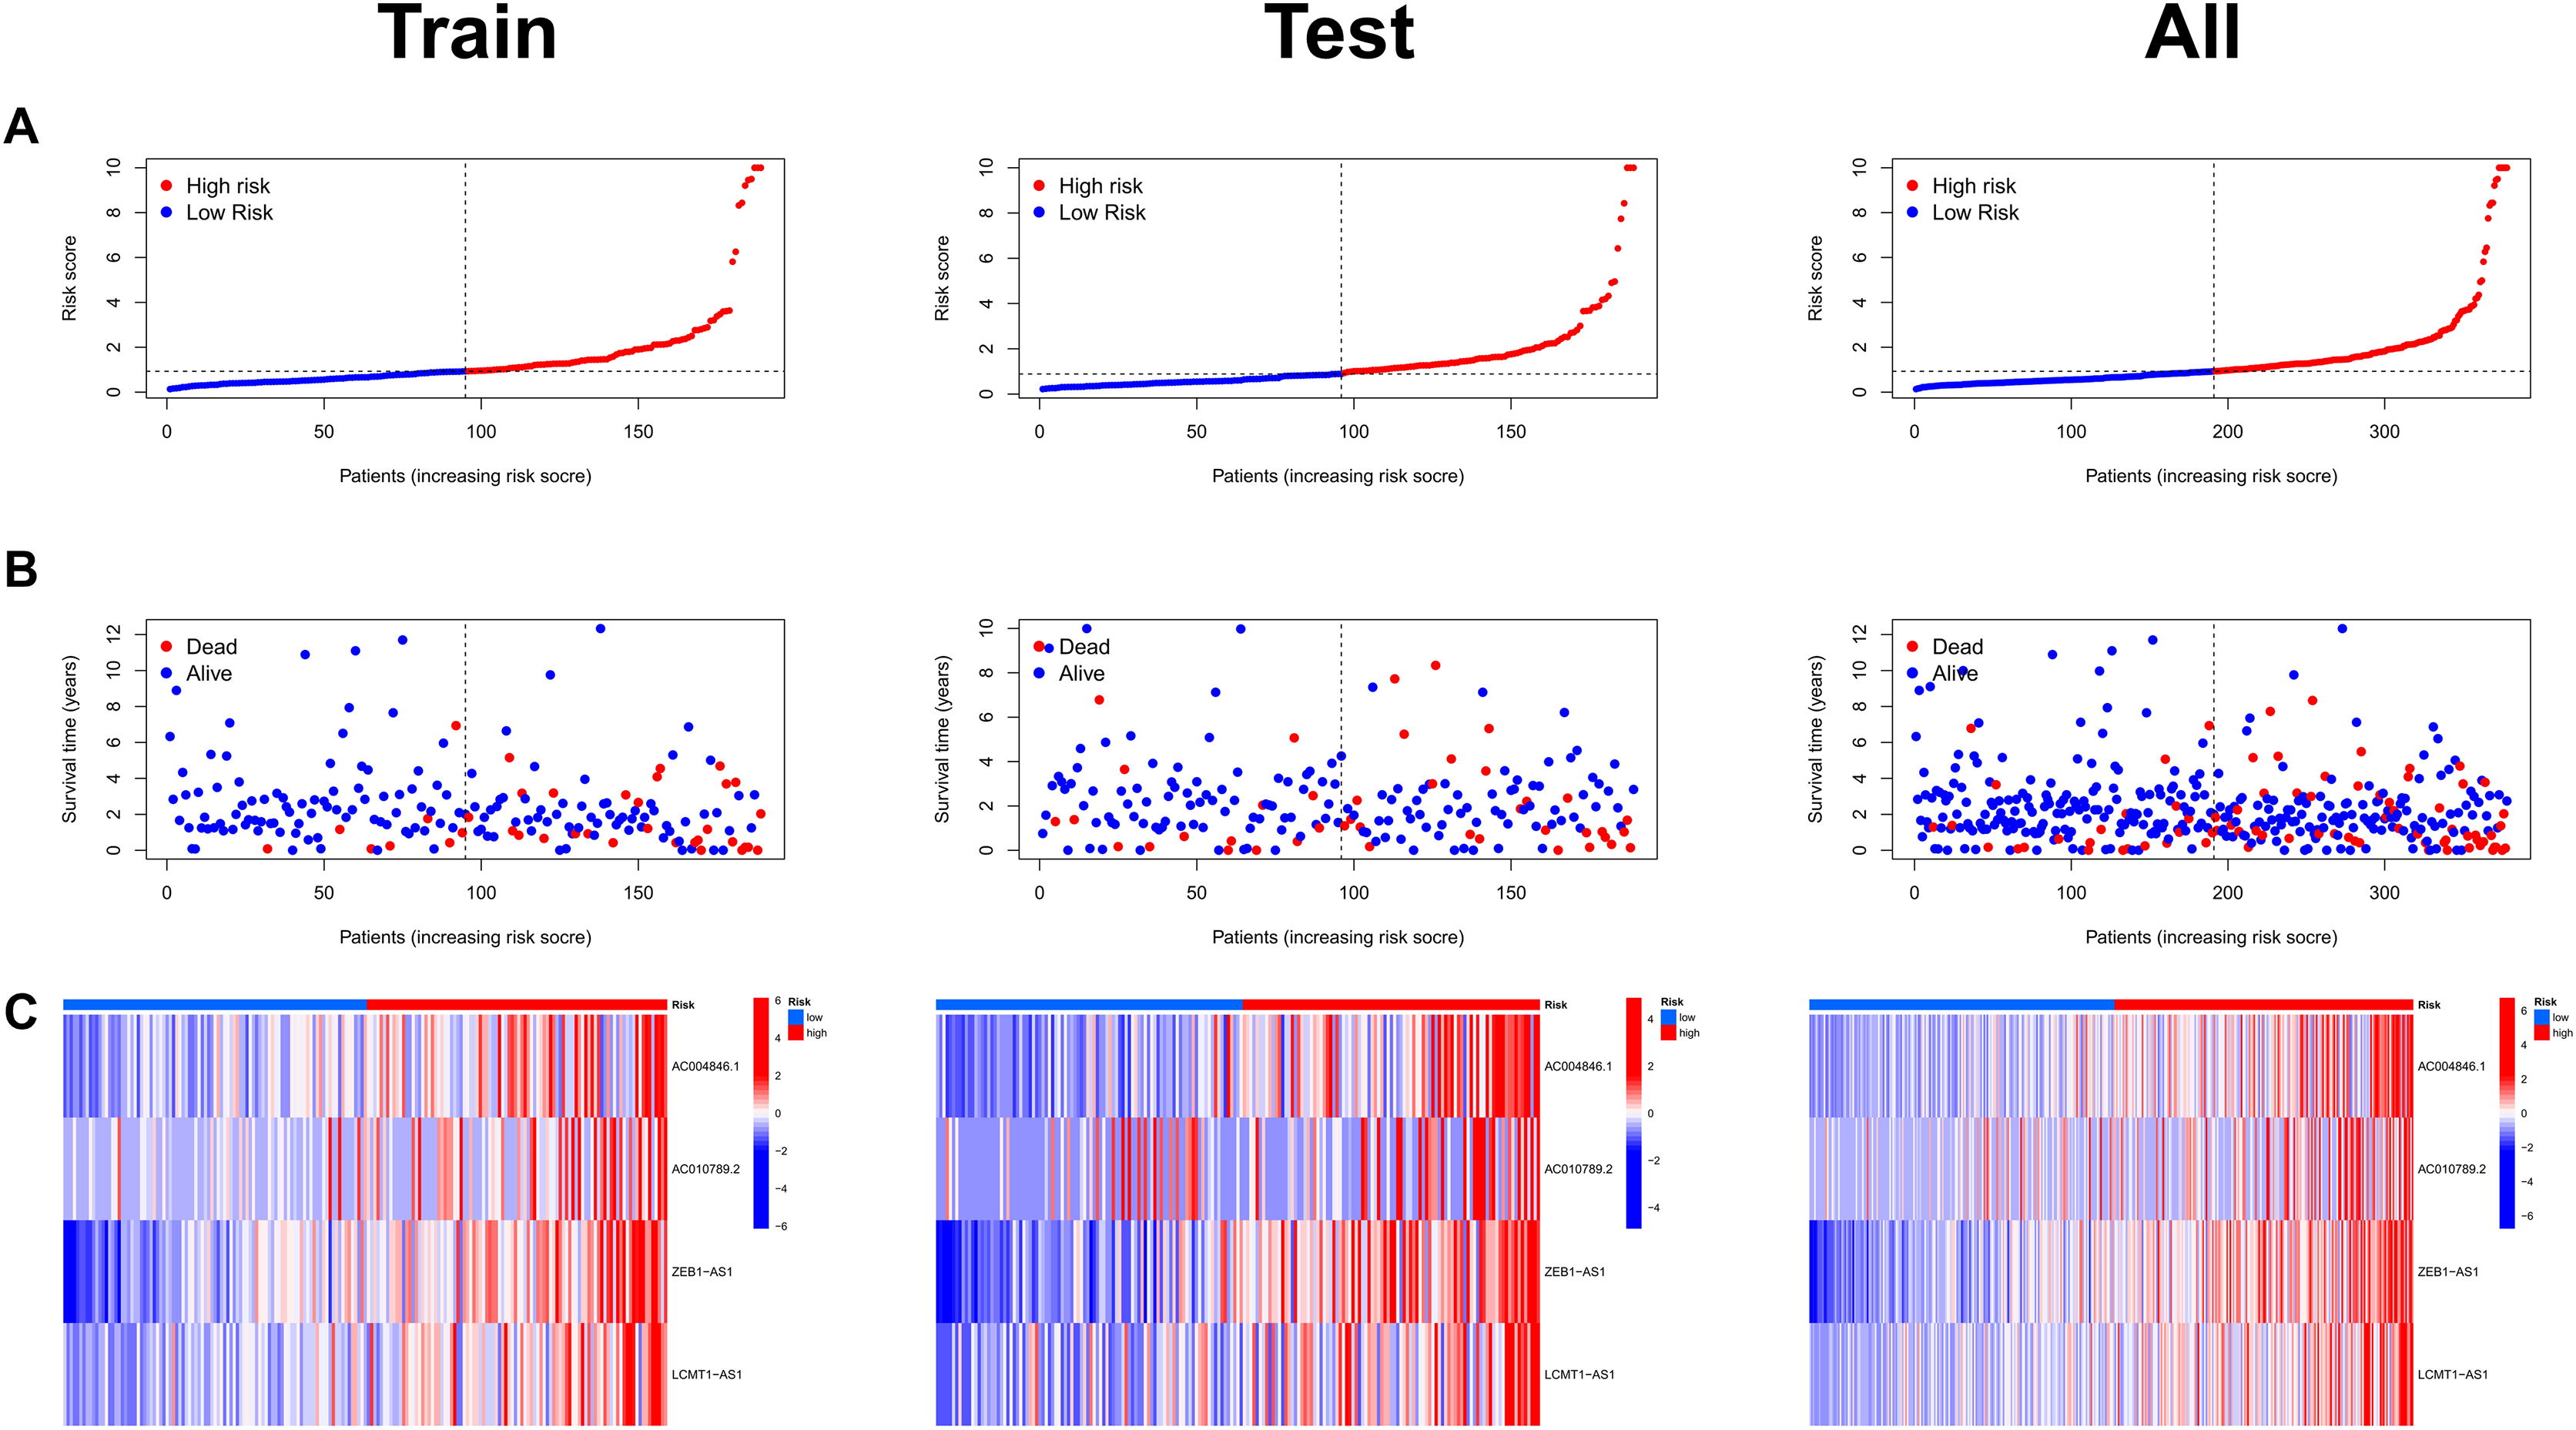
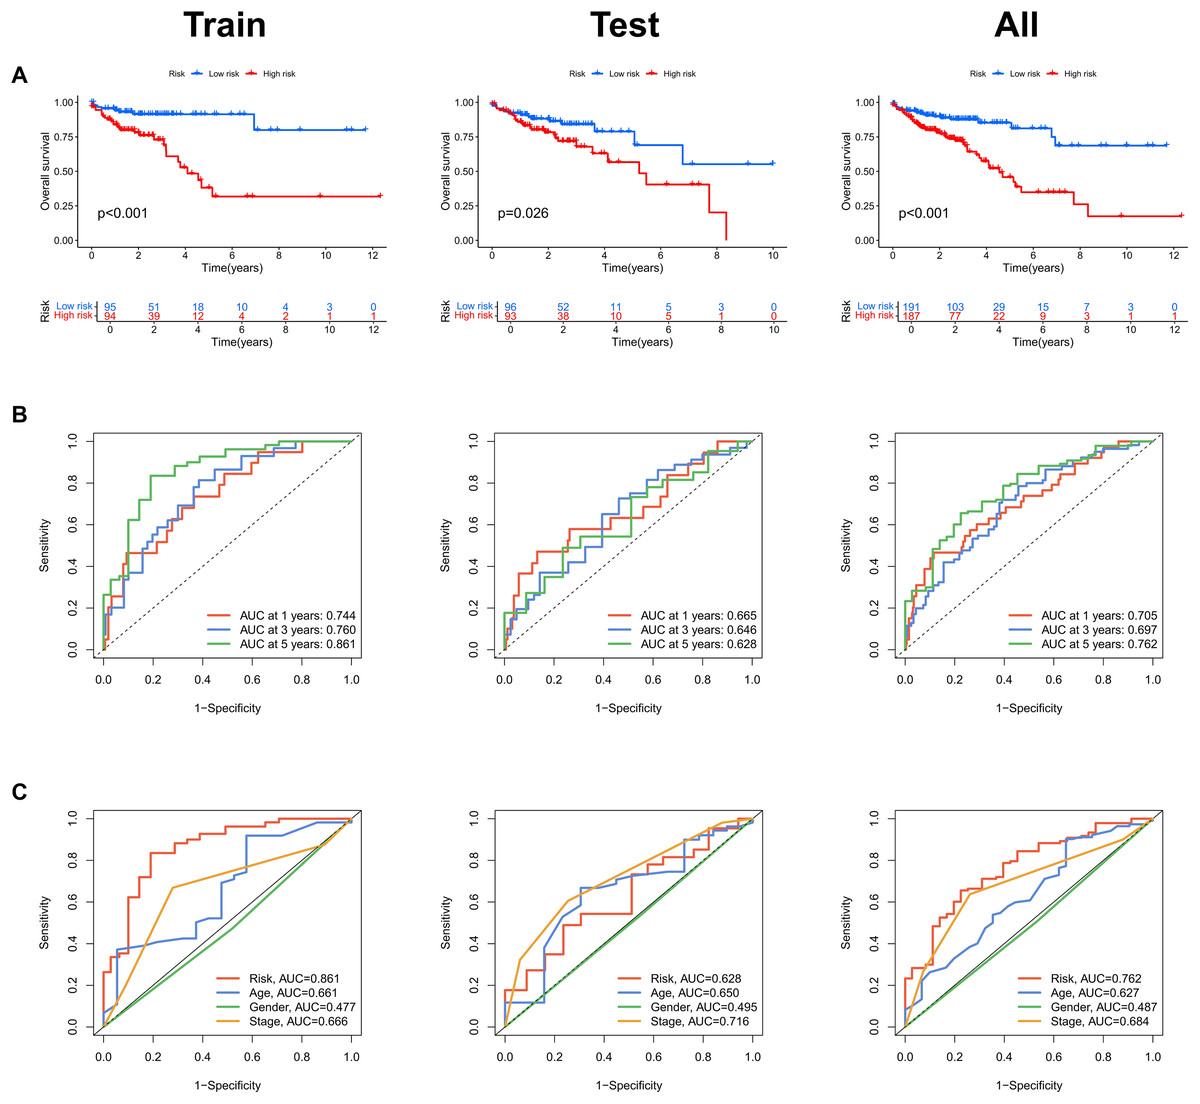
Figure 4: Assessment of the MRLs prognostic model.
(A) Kaplan-Meier survival analysis shows the overall survival (OS) time for high-risk and low-risk groups of COAD patients based on the TCGA dataset. (B) AUC values for 1-, 3-, and 5-year survival outcomes are presented. (C) ROC curves of common clinical parameters.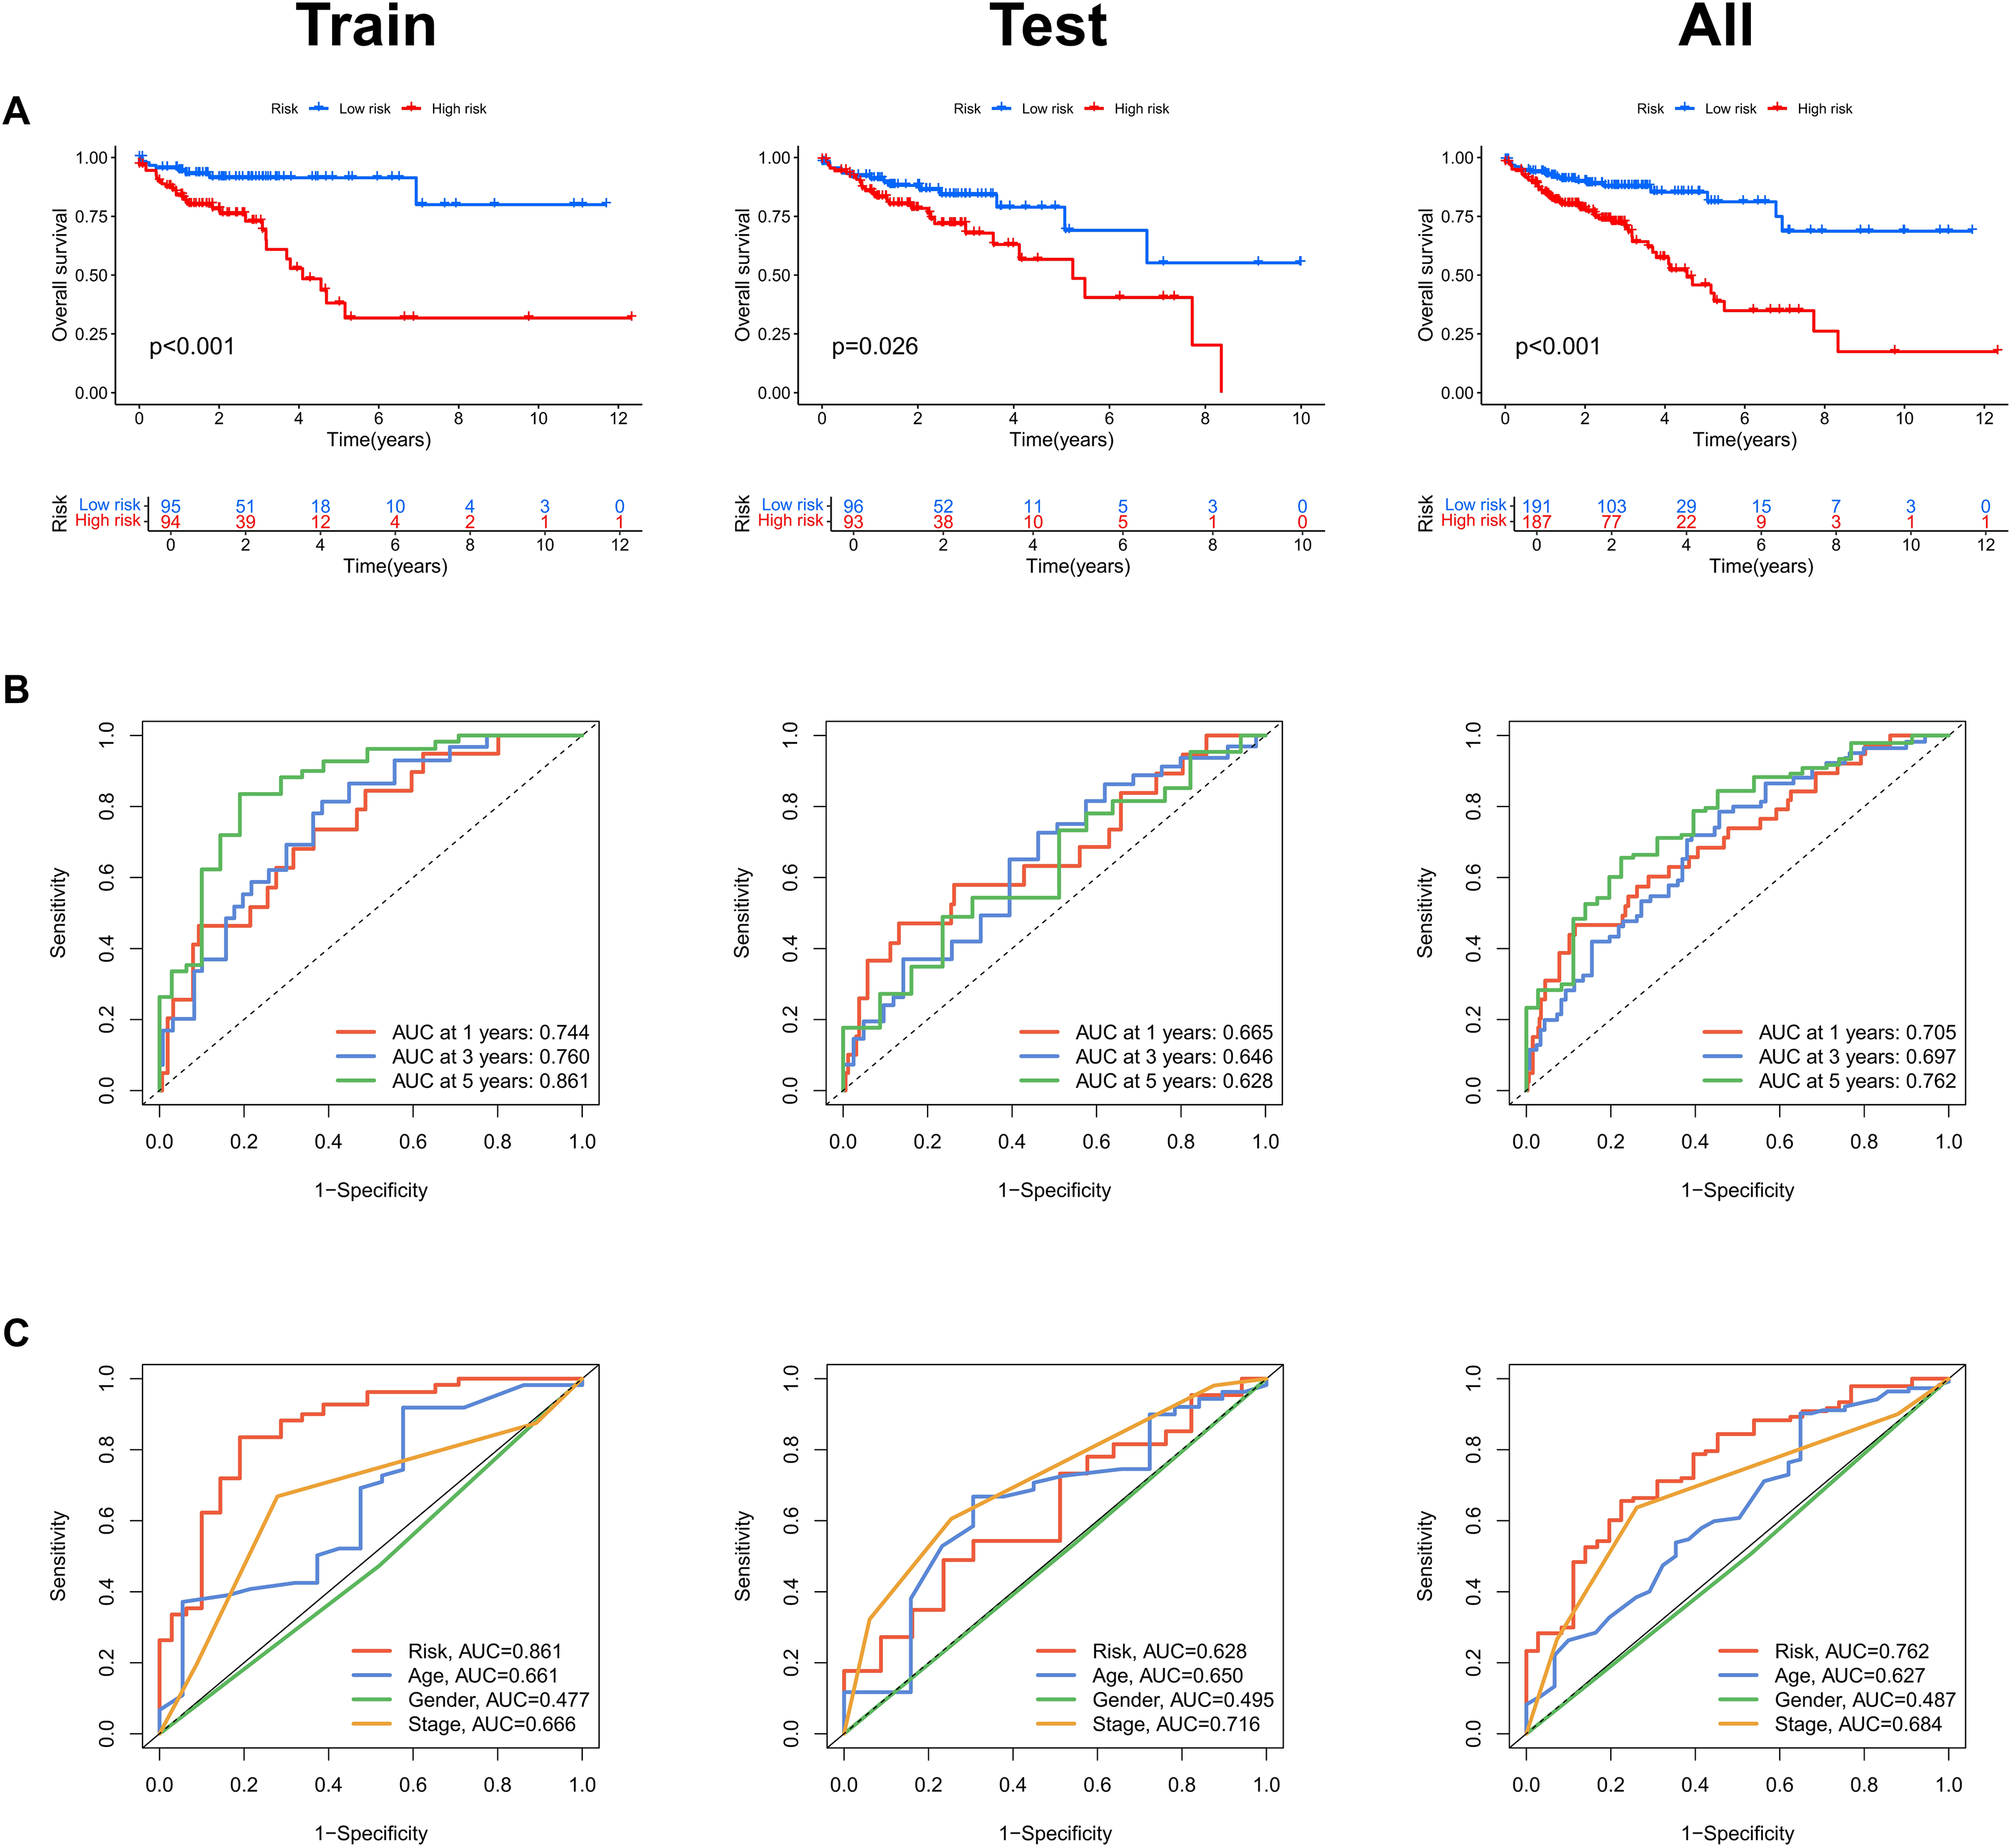
Evaluation of the MRLs prognostic model in COAD patients
We conducted univariate and multivariate Cox regression analyses to assess the correlation between the MRLs risk score and the prognosis as well as clinical characteristics of COAD patients. The results indicated that the MRLs risk score (p < 0.001) could serve as an independent prognostic factor, similar to age (p < 0.001) and tumor stage (p = 0.041) (Figs. 5A, 5B). We constructed a nomogram model that integrates clinical characteristics and risk scores to predict the survival rates of COAD patients at 1 year, 3 years, and 5 years (Fig. 6). The calibration plot demonstrated that the nomogram model exhibited excellent predictive performance (Fig. 7A). Moreover, the MRLs risk score showed a higher concordance index (C-index) compared to other risk factors, further validating its superior predictive capability (Fig. 7B).
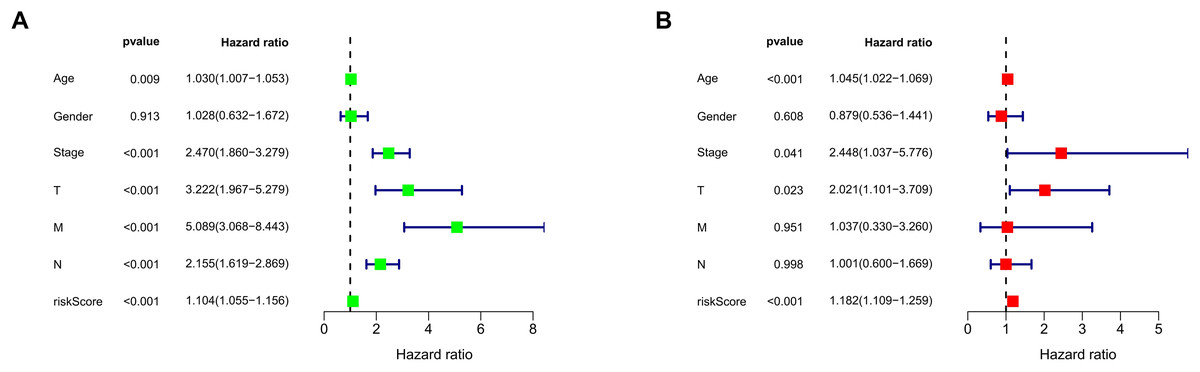
Figure 5: Evaluation of the MRLs prognostic model.
(A, B) Univariate and multivariate Cox regression analyses of the MRLs risk score and clinical characteristics in COAD patients.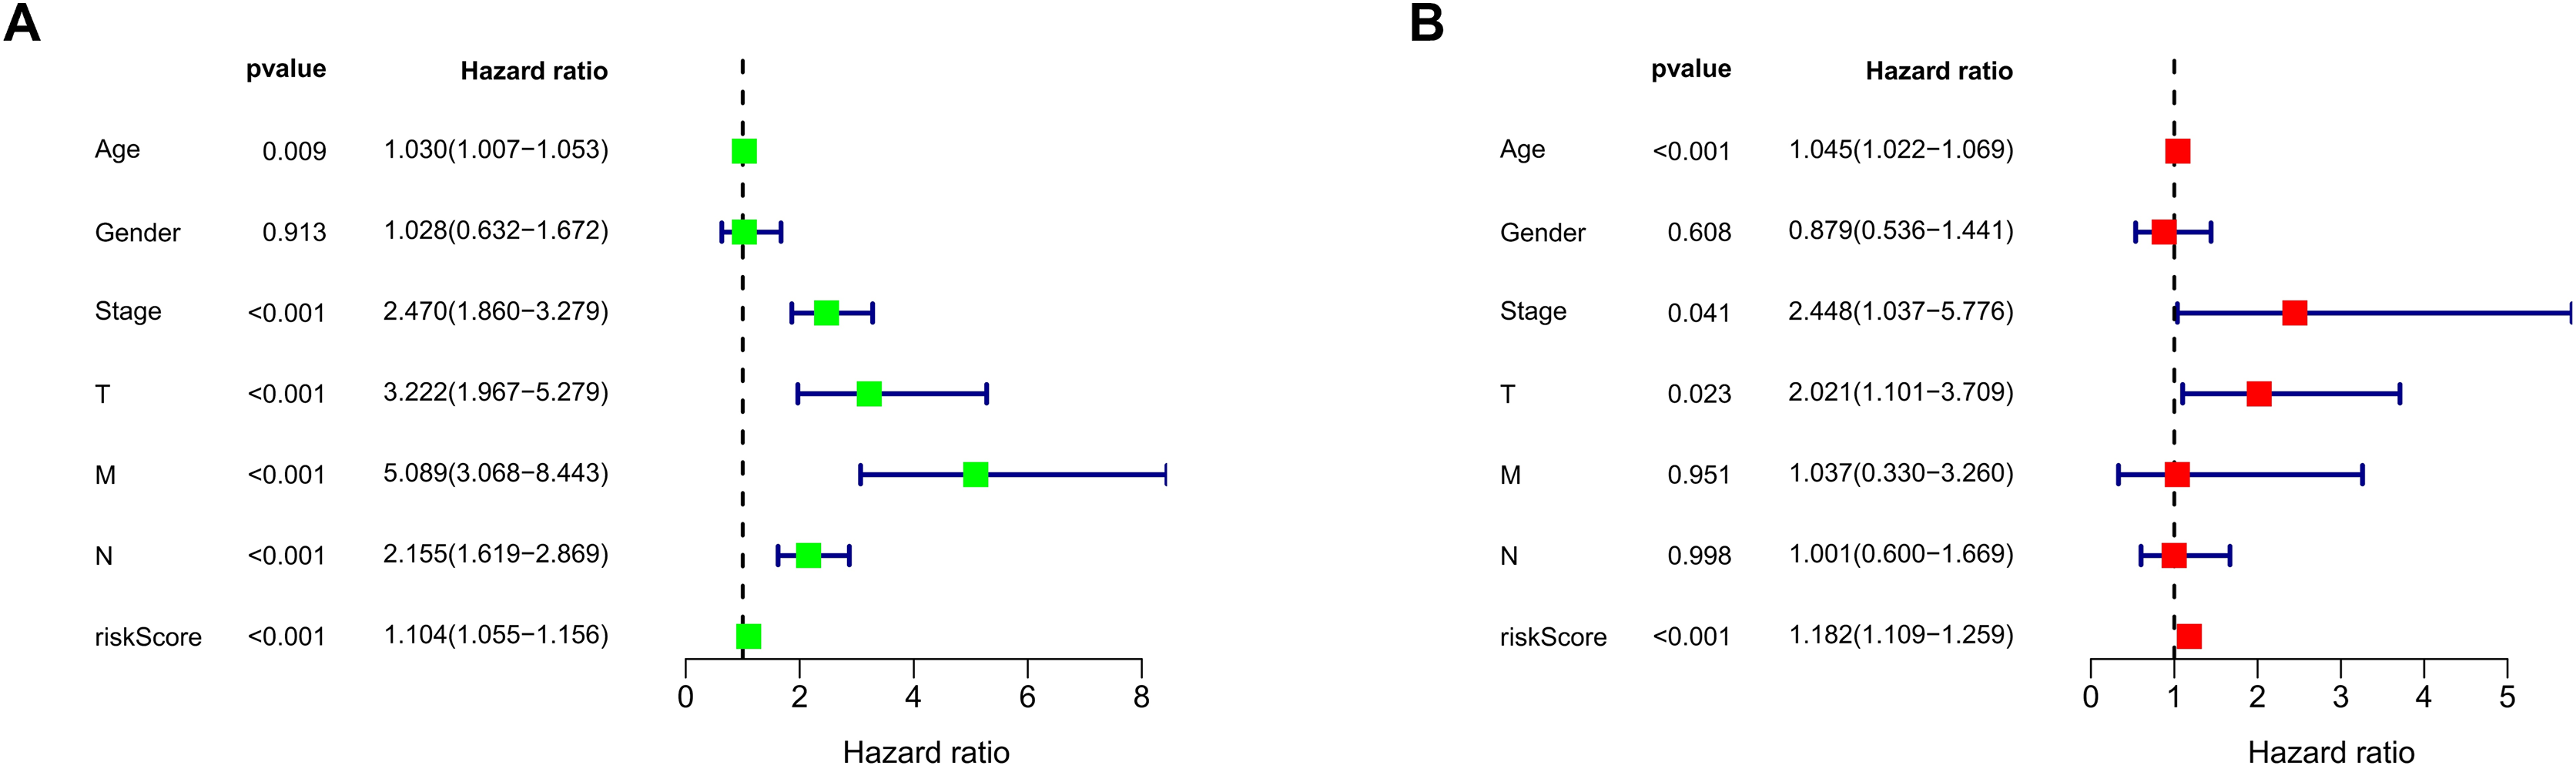
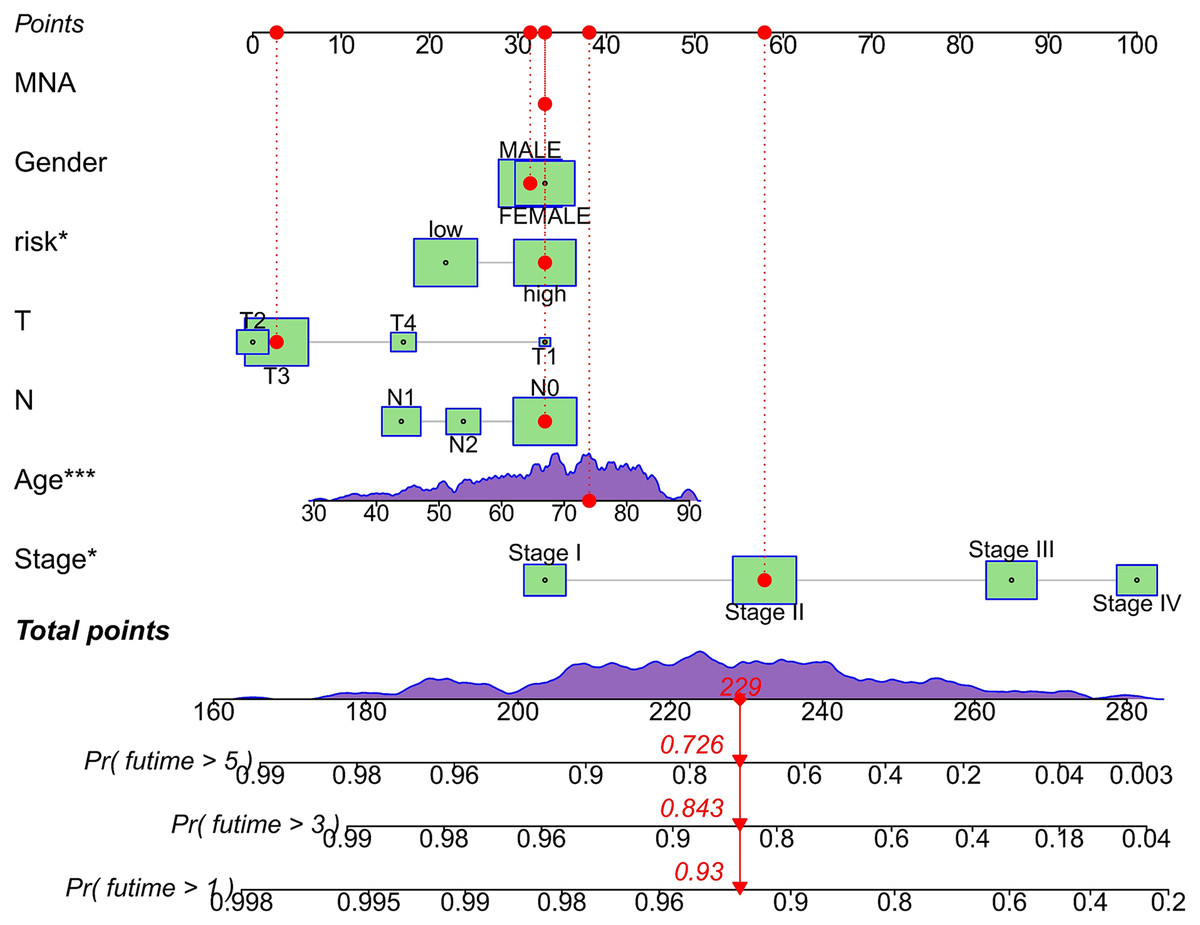
Figure 6: Evaluation of the MRLs prognostic model.
Nomogram incorporating MRLs and common clinical parameters. *p < 0.05; ***p < 0.001.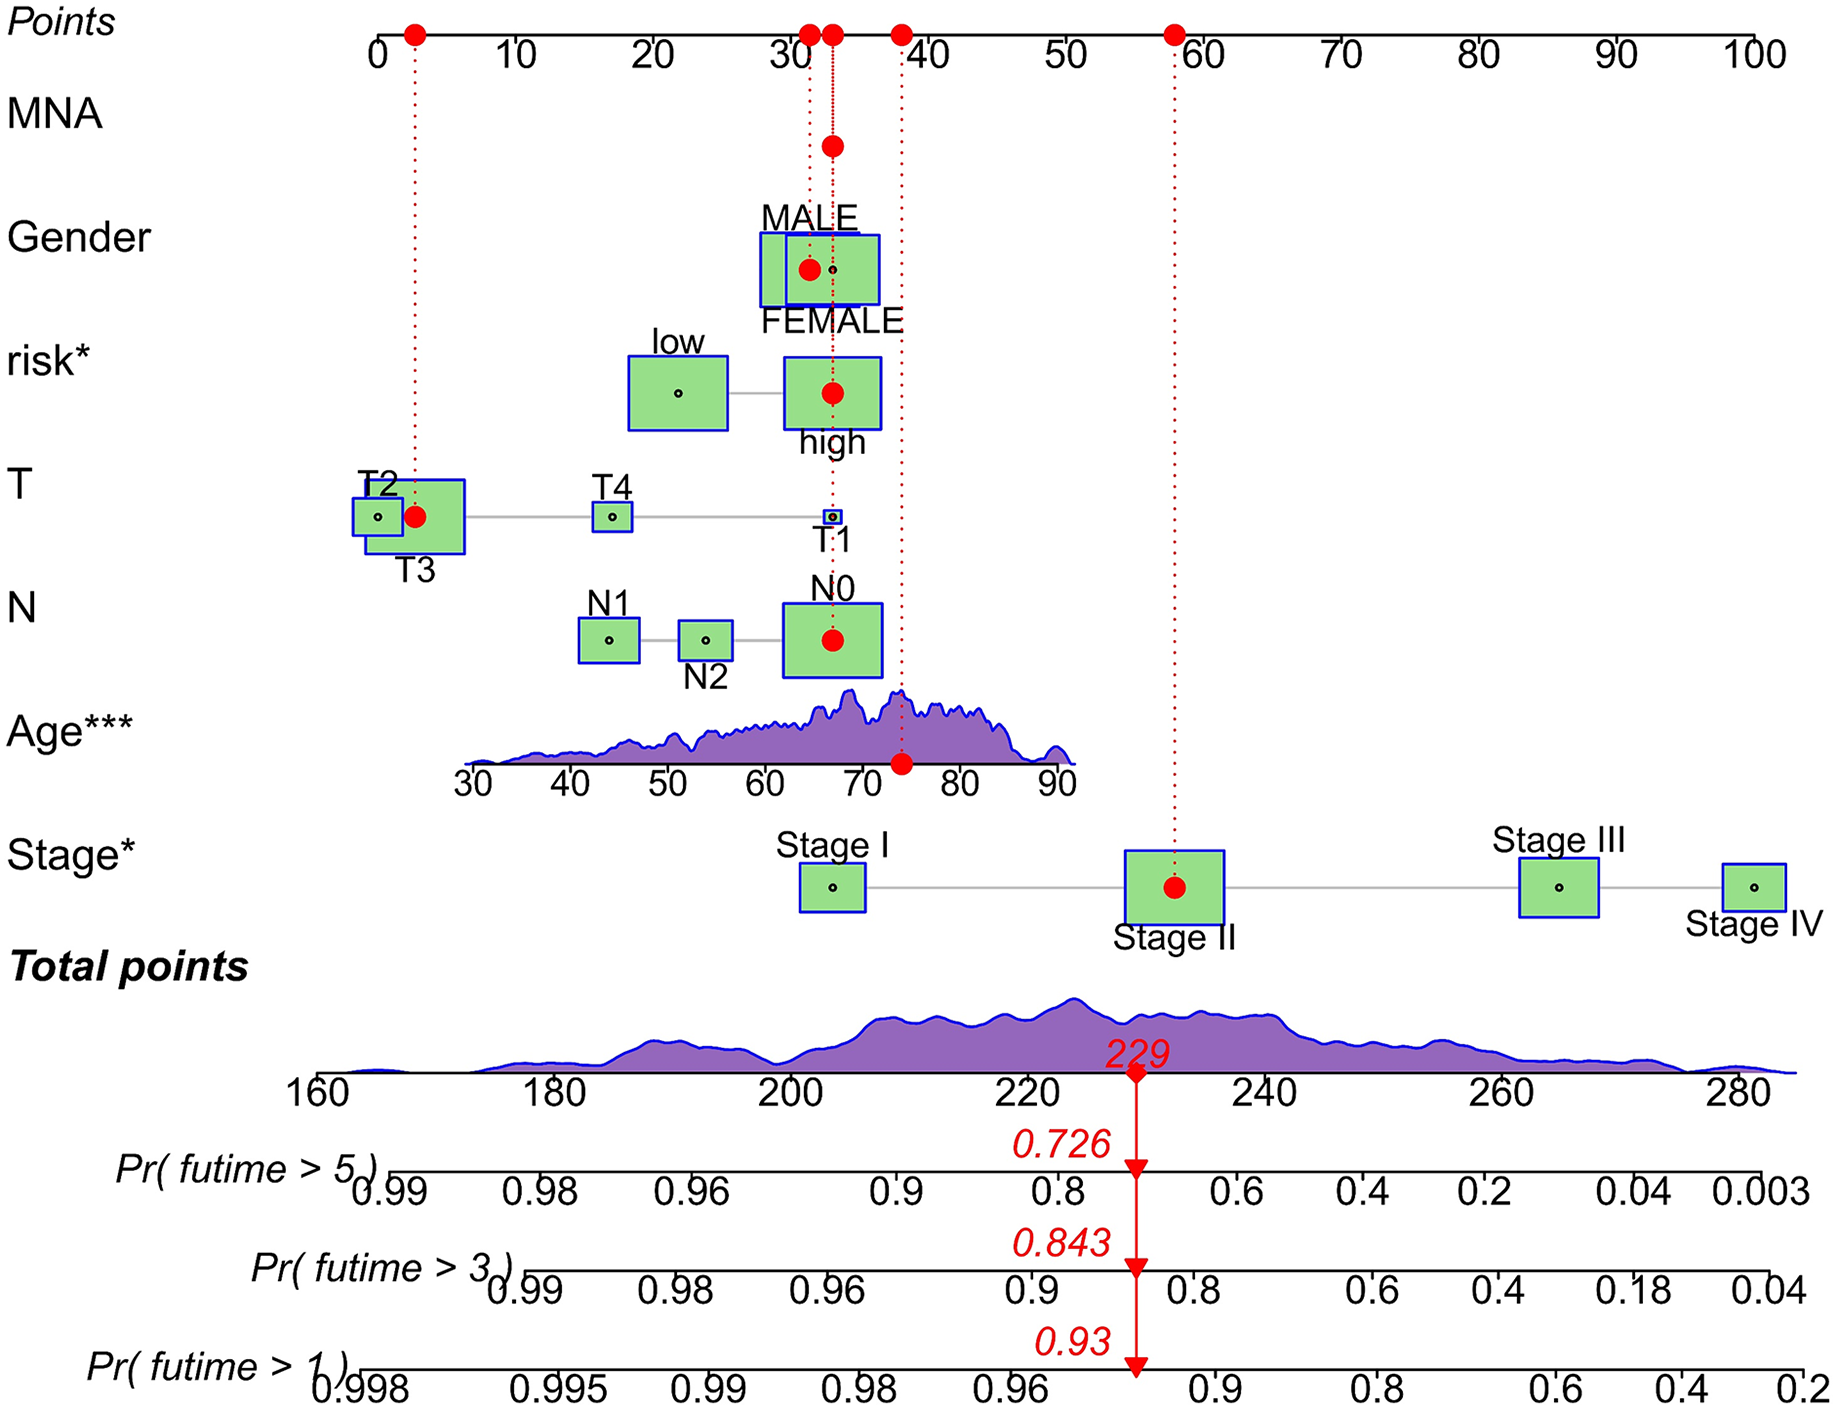
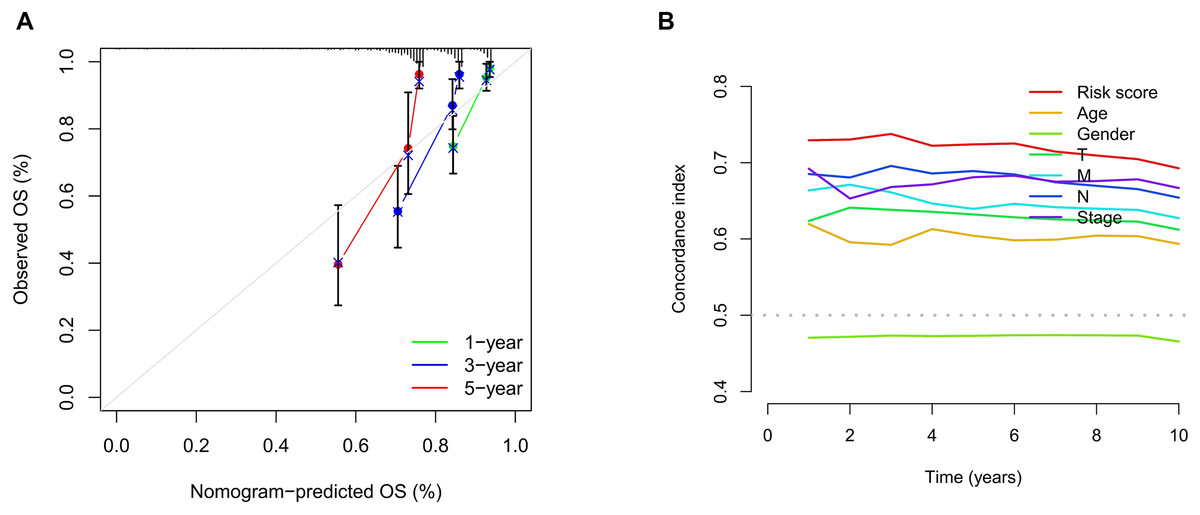
Figure 7: Evaluation of the MRLs prognostic model.
(A) Calibration curves were generated to evaluate the accuracy of the nomogram. (B) C-index curves were used to evaluate the discriminatory ability of the risk score and other clinical factors at each time point.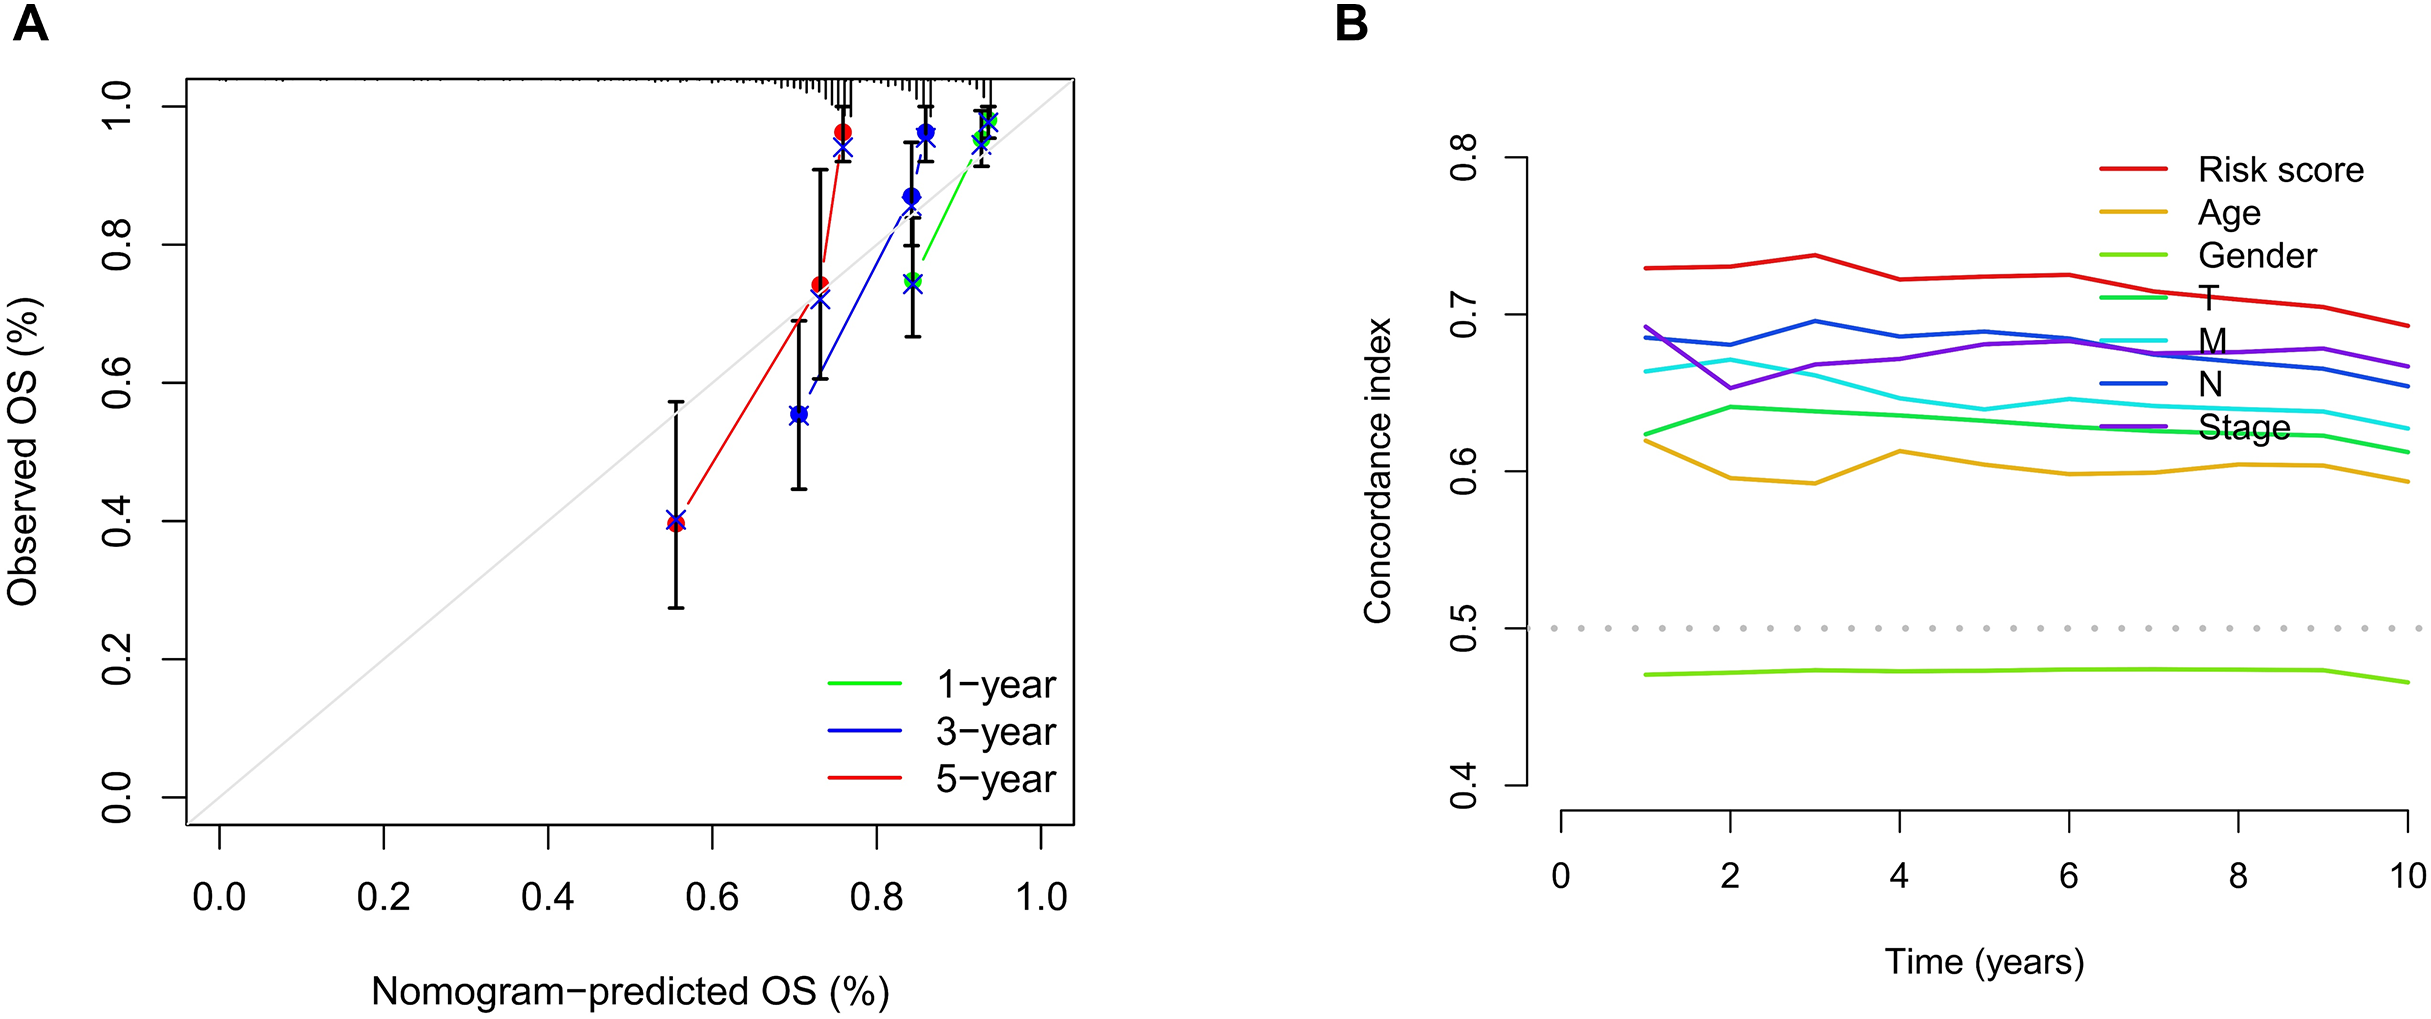
Clinical characteristic subgroups of the MRLs prognostic model and PCA
The significance of the MRLs prognostic model for clinical subgroups was further assessed by assigning patients to three subgroups based on sex (male and female), age (≤65 years and >65 years) and tumor stage (I–II and III–IV), with their survival outcomes subsequently analyzed. The results indicated that prognosis was not significantly affected by factors such as age, gender, or tumor stage (Figs. 8A–8F).
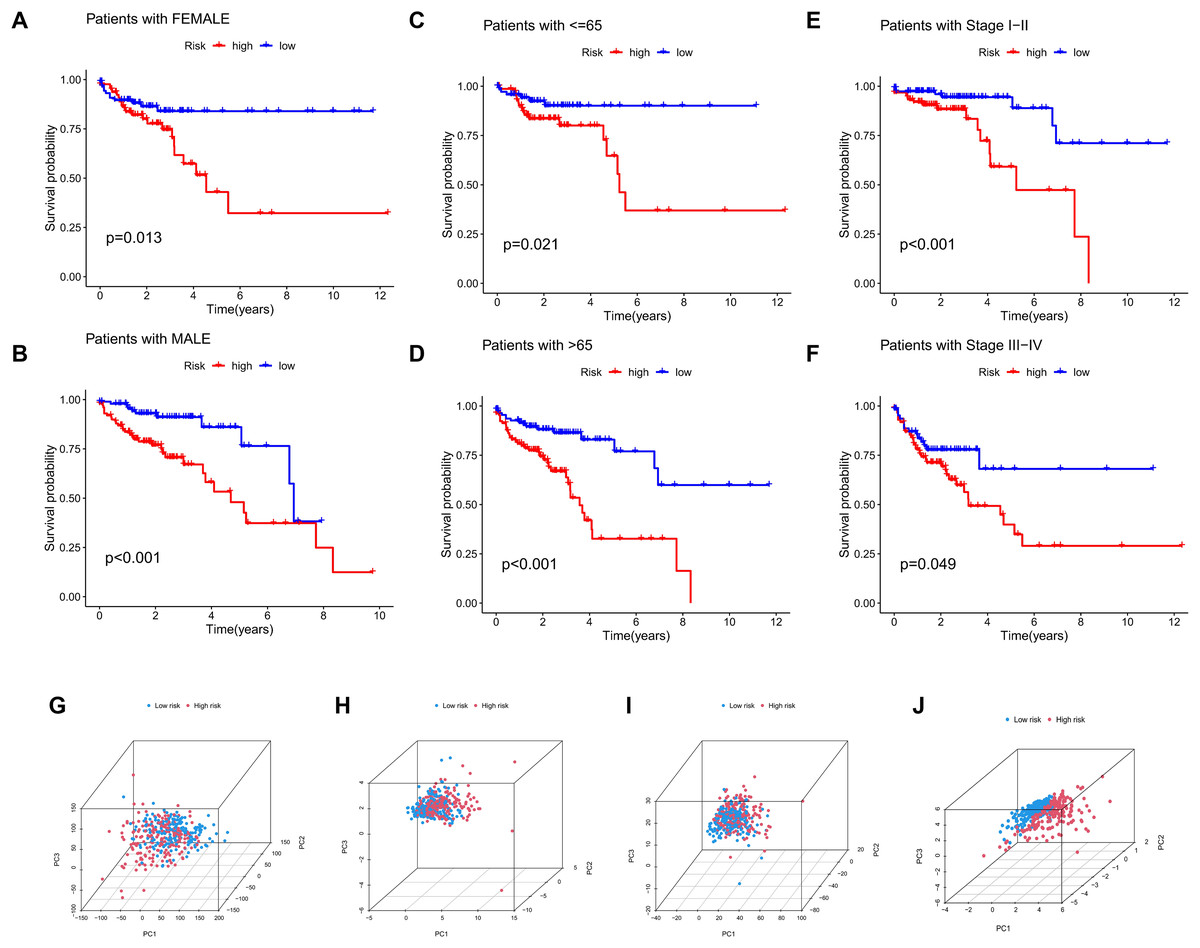
Figure 8: Subgroup survival analysis and PCA.
(A, B) Subgroup survival analysis stratified by gender. (C, D) Subgroup survival analysis stratified by age. (E, F) Subgroup survival analysis stratified by stage. (G) Distribution of samples based on the expression of all genes. (H) Distribution of samples based on the expression of the 9 MRGs. (I) Distribution of samples based on the expression of all lncRNAs. (J) Distribution of samples based on the expression of the 4 MRLs.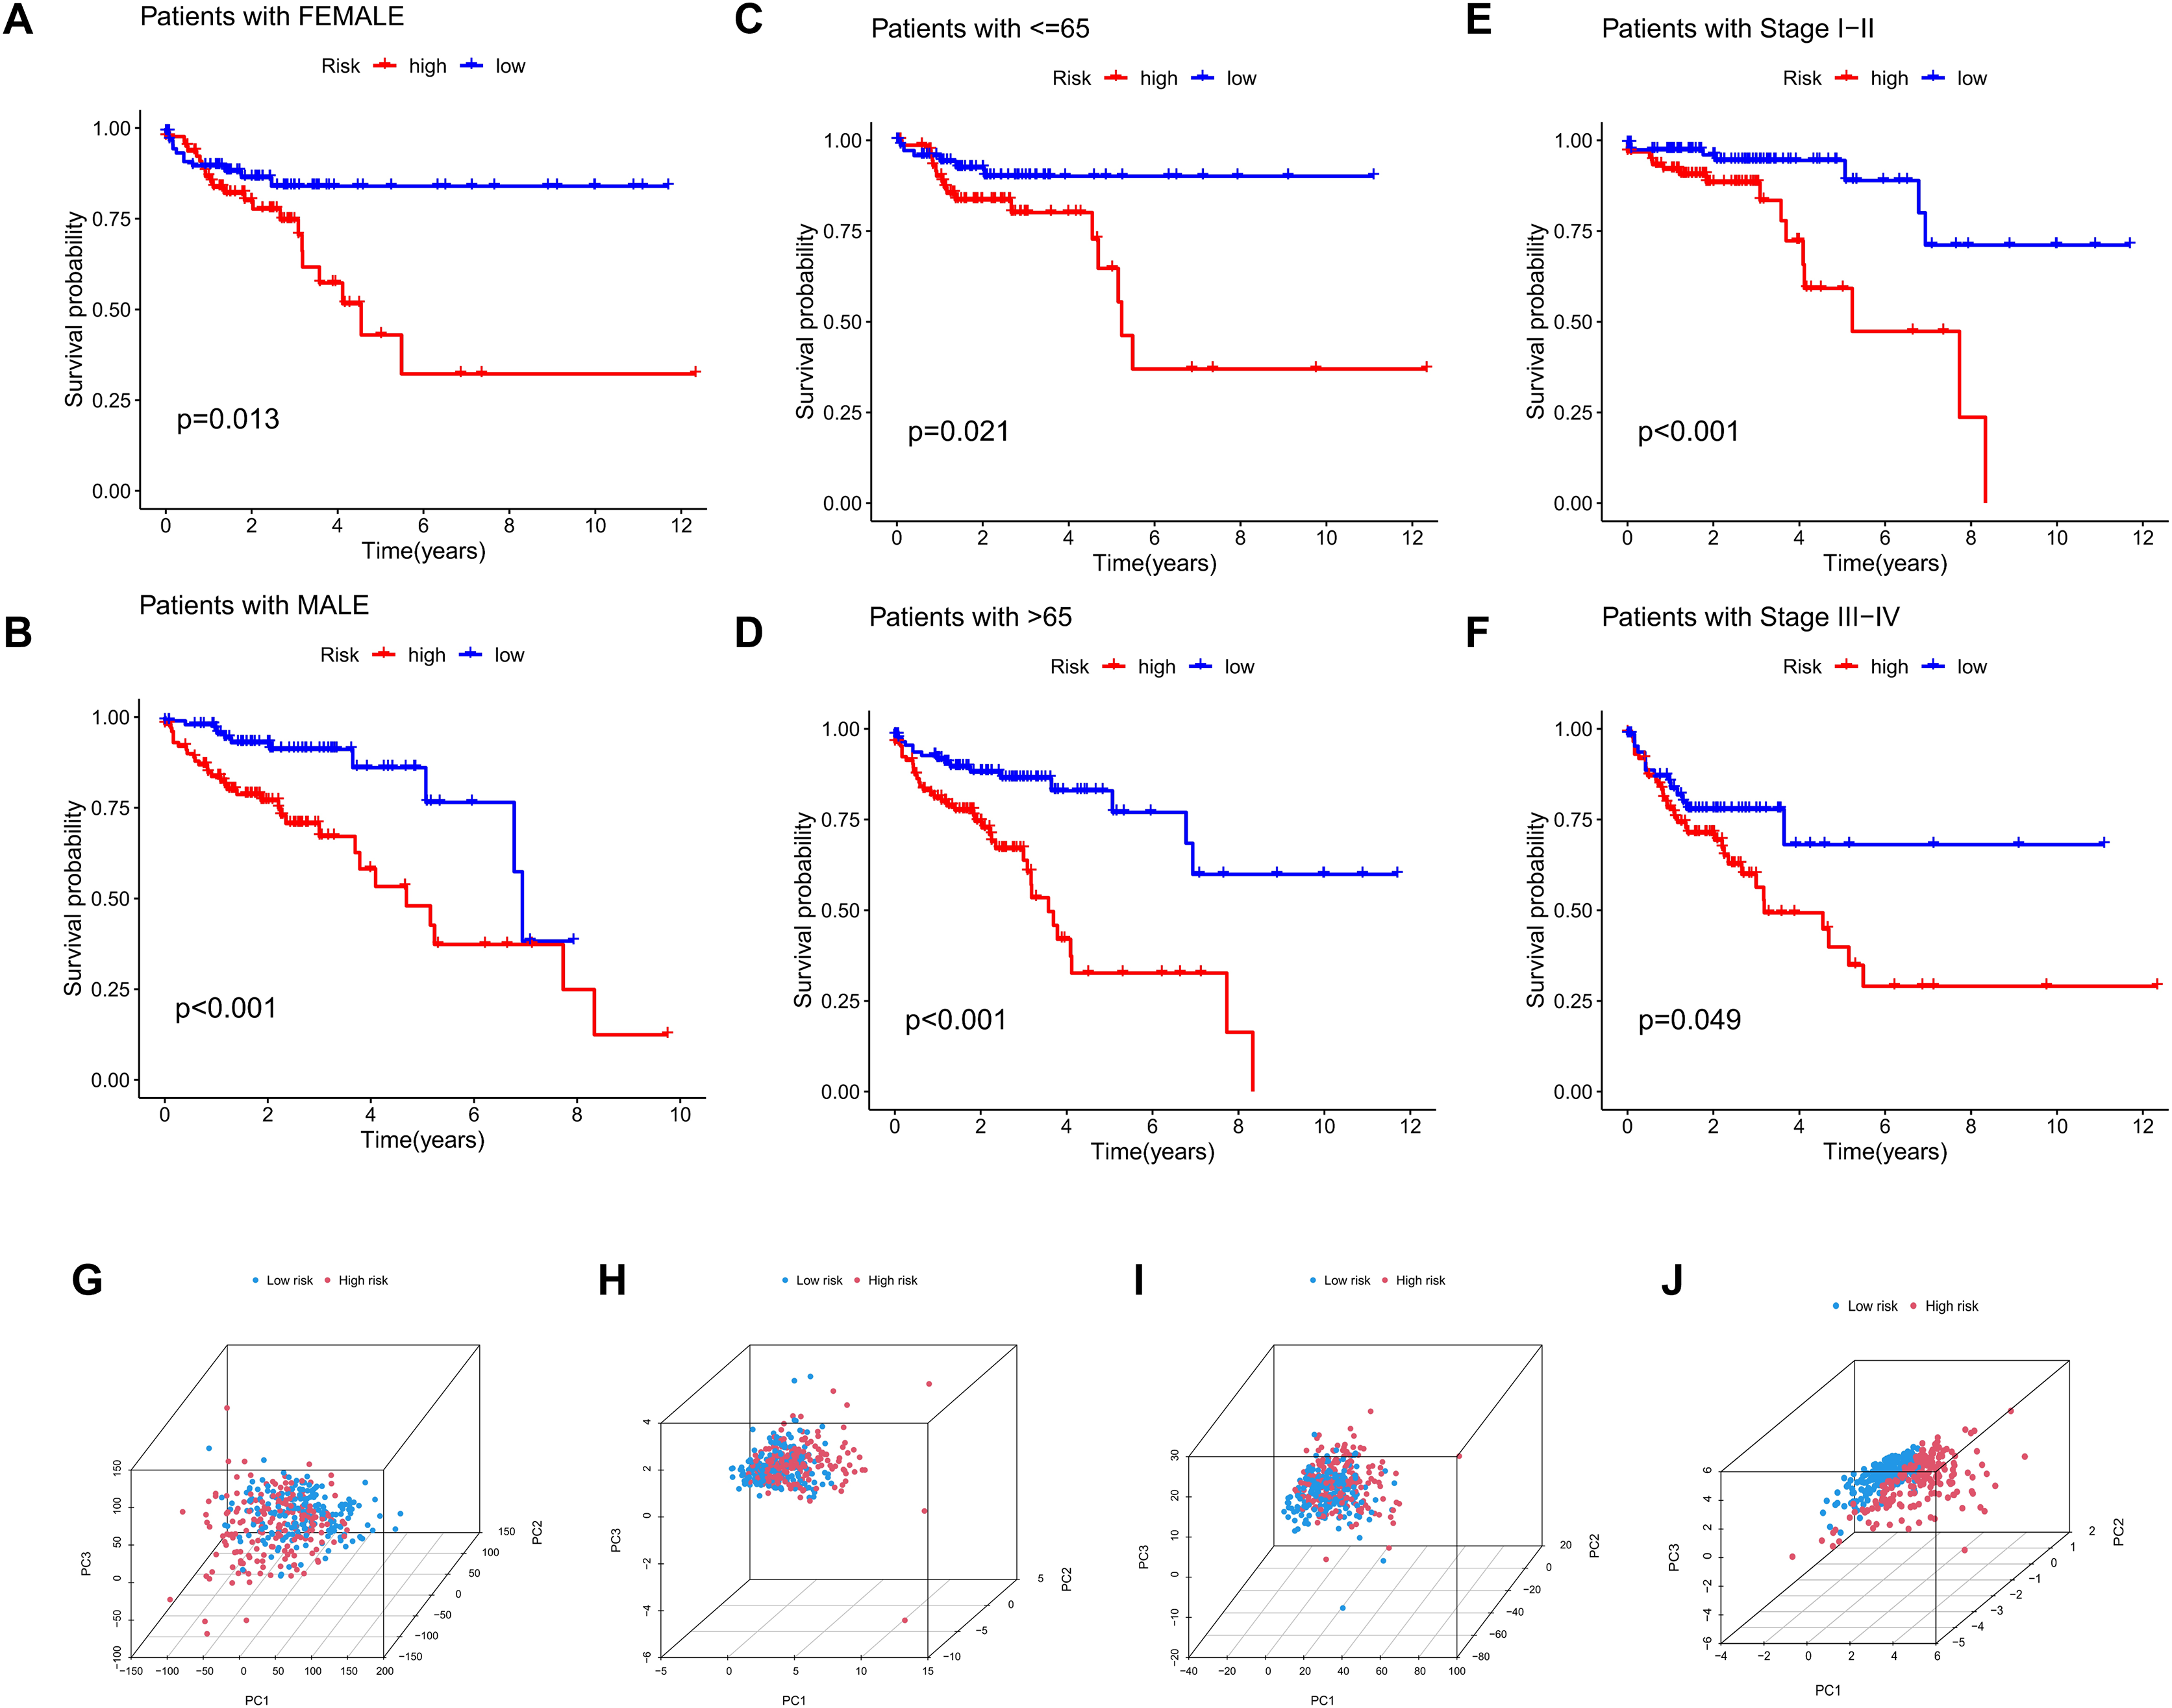
Four gene sets involving all genes, migrasome-related genes, model lncRNAs, and migrasome-related lncRNAs, were analyzed using PCA to determine their potential in distinguishing between risk groups of patients, with the results presented in Figs. 8G–8J. The analysis demonstrated that low-risk and high-risk patients could not be differentiated using three gene sets (all genes, migrasome-related genes, and migrasome-related lncRNAs), whereas the PCA plot for model lncRNAs revealed a clear separation between these groups. These findings indicate that model lncRNAs possess superior discriminative ability, effectively distinguishing high-risk from low-risk populations.
Enrichment analysis of the MRLs prognostic model
To investigate the functional relevance and signaling pathways associated with the prognostic model, we conducted GO functional analysis, KEGG enrichment analysis, and GSEA on the differentially expressed genes between the high-risk and low-risk groups. The GO enrichment analysis indicated significant biological activities of the model-related genes in the extracellular matrix, connective tissue development, and molecular interactions, which may be related to tissue repair, structural stability, and cellular development (Fig. 9A). The KEGG enrichment analysis revealed several pathways significantly associated with cell migration, adhesion, and signaling, particularly those closely related to the cytoskeleton, PI3K-Akt signaling pathway, focal adhesion, and extracellular matrix interactions (Fig. 9B). The GSEA demonstrated that functions such as extracellular matrix remodeling, plasma membrane protein complexes, and receptor complexes were significantly enriched in the high-risk group, indicating more active intercellular signaling, cell adhesion, and invasive biological processes. At the pathway level, cell adhesion molecules, cytokine-receptor interactions, and immune response-related pathways were significantly enriched. In contrast, the functional enrichment of the low-risk group focused on ribosomes and the respiratory chain, with metabolic pathways such as the tricarboxylic acid (TCA) cycle, oxidative phosphorylation, and ribosome biogenesis significantly enriched, suggesting that cellular metabolic functions and protein synthesis in the low-risk group were in a healthy state (Figs. 10A–10D).
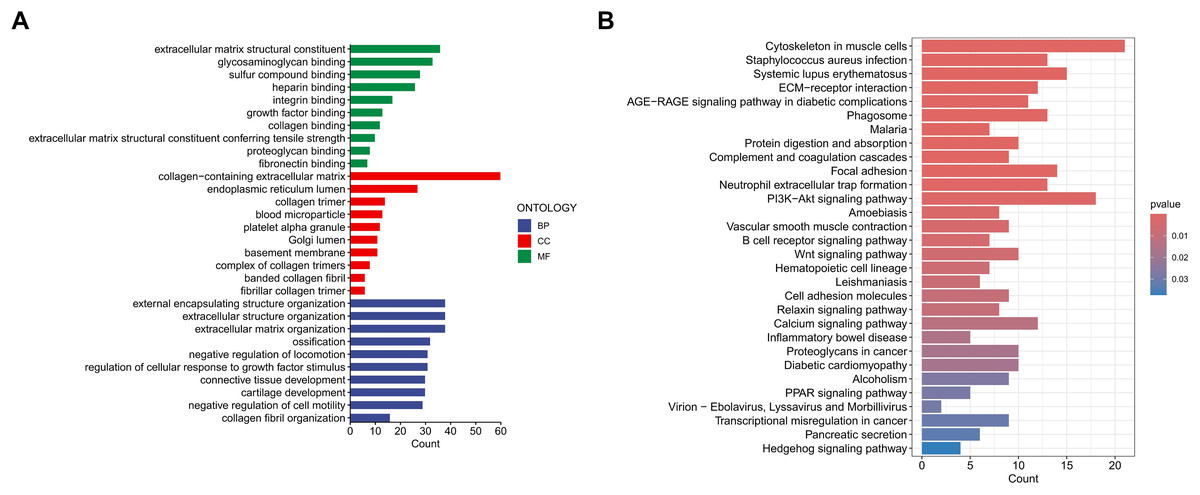
Figure 9: Enrichment analysis of the MRLs prognostic model.
(A, B) Gene Ontology (GO) and Kyoto Encyclopedia of Genes and Genomes (KEGG) pathway enrichment analysis.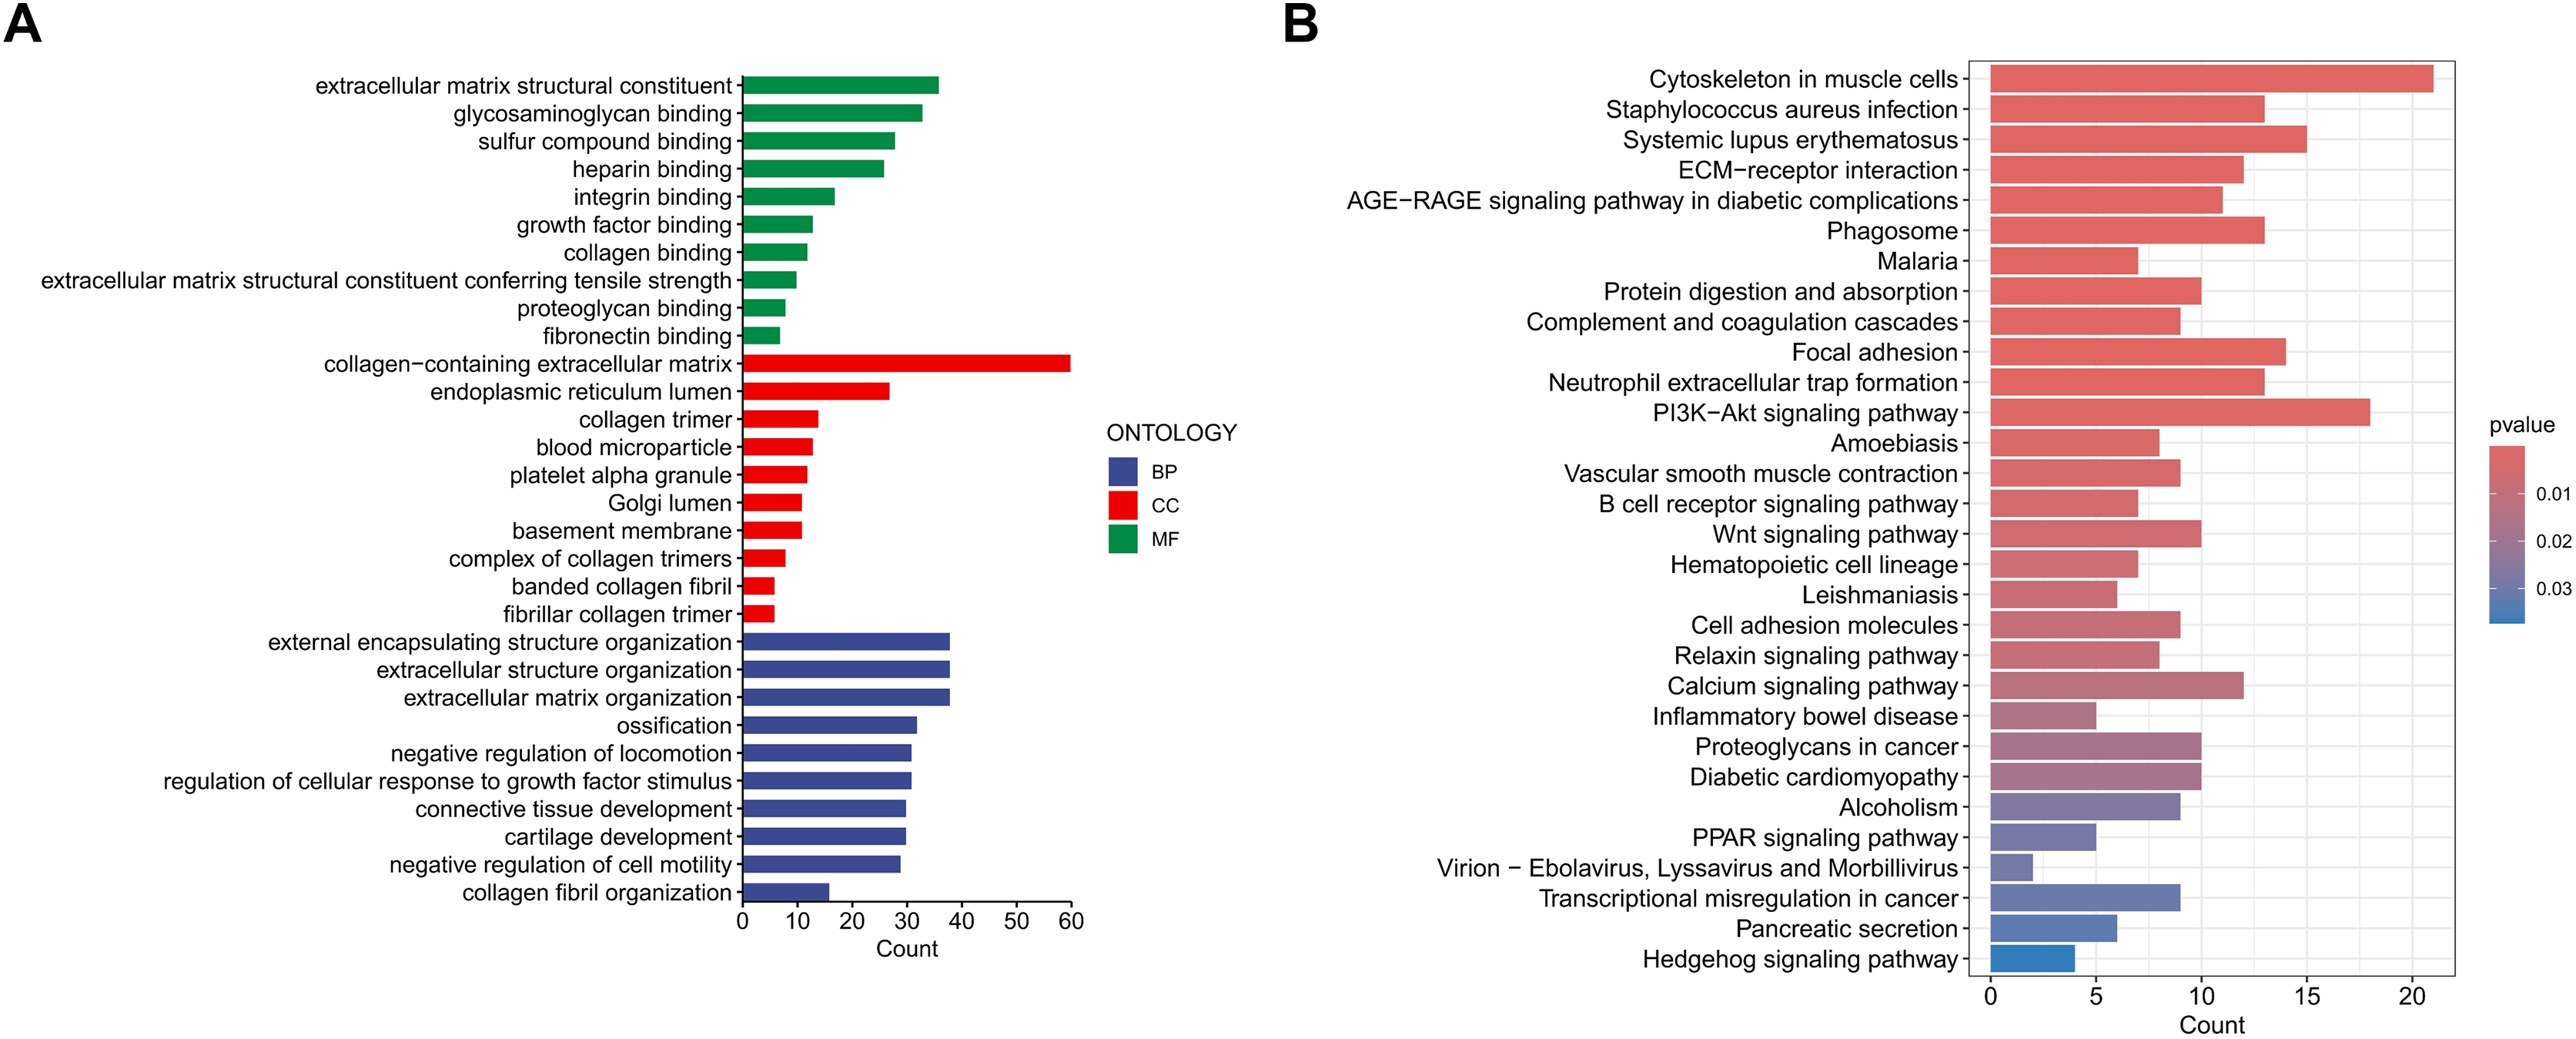
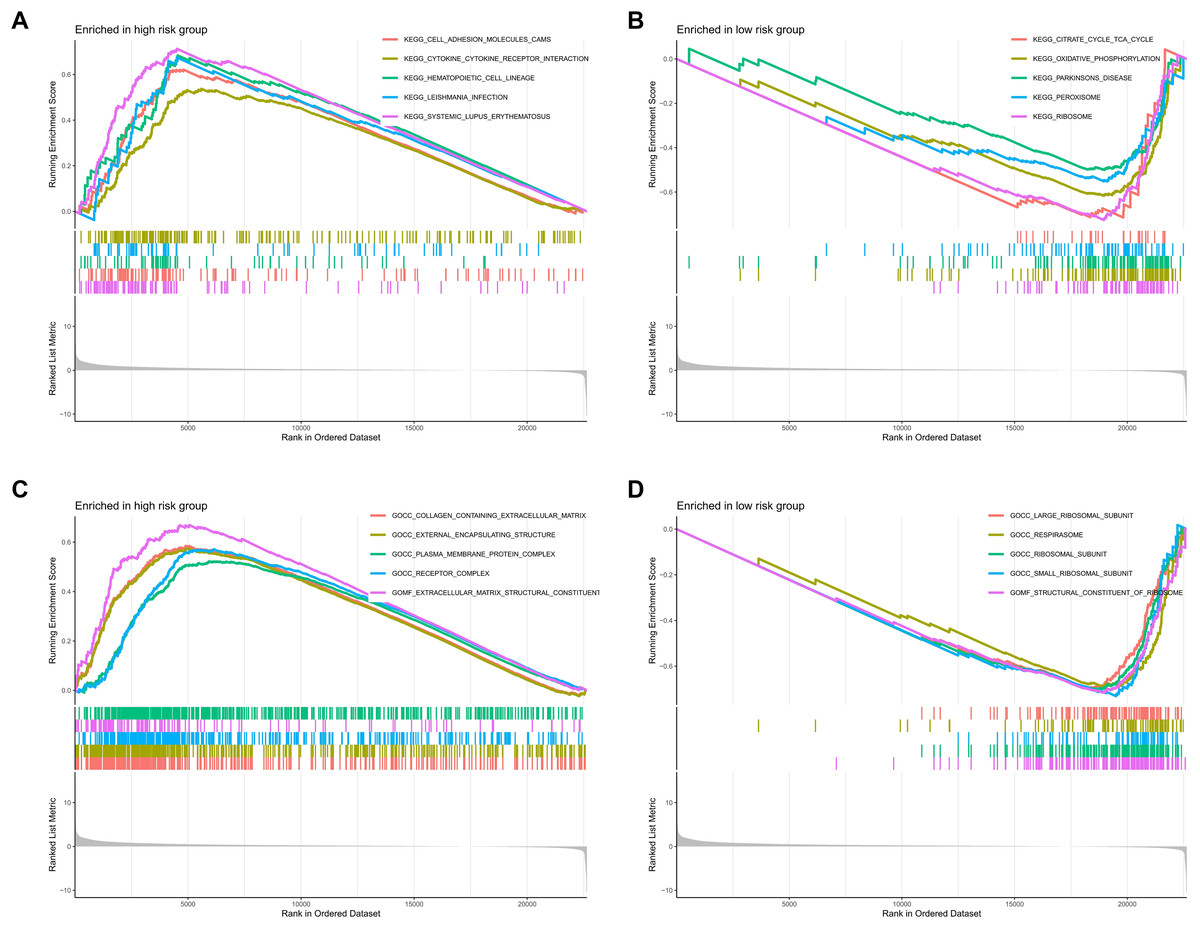
Figure 10: Enrichment analysis of the MRLs prognostic model.
(A, B) GSEA analysis revealed the enrichment of signaling pathways in the two groups. (C, D) GSEA analysis revealed the enrichment of functional pathways in the two groups.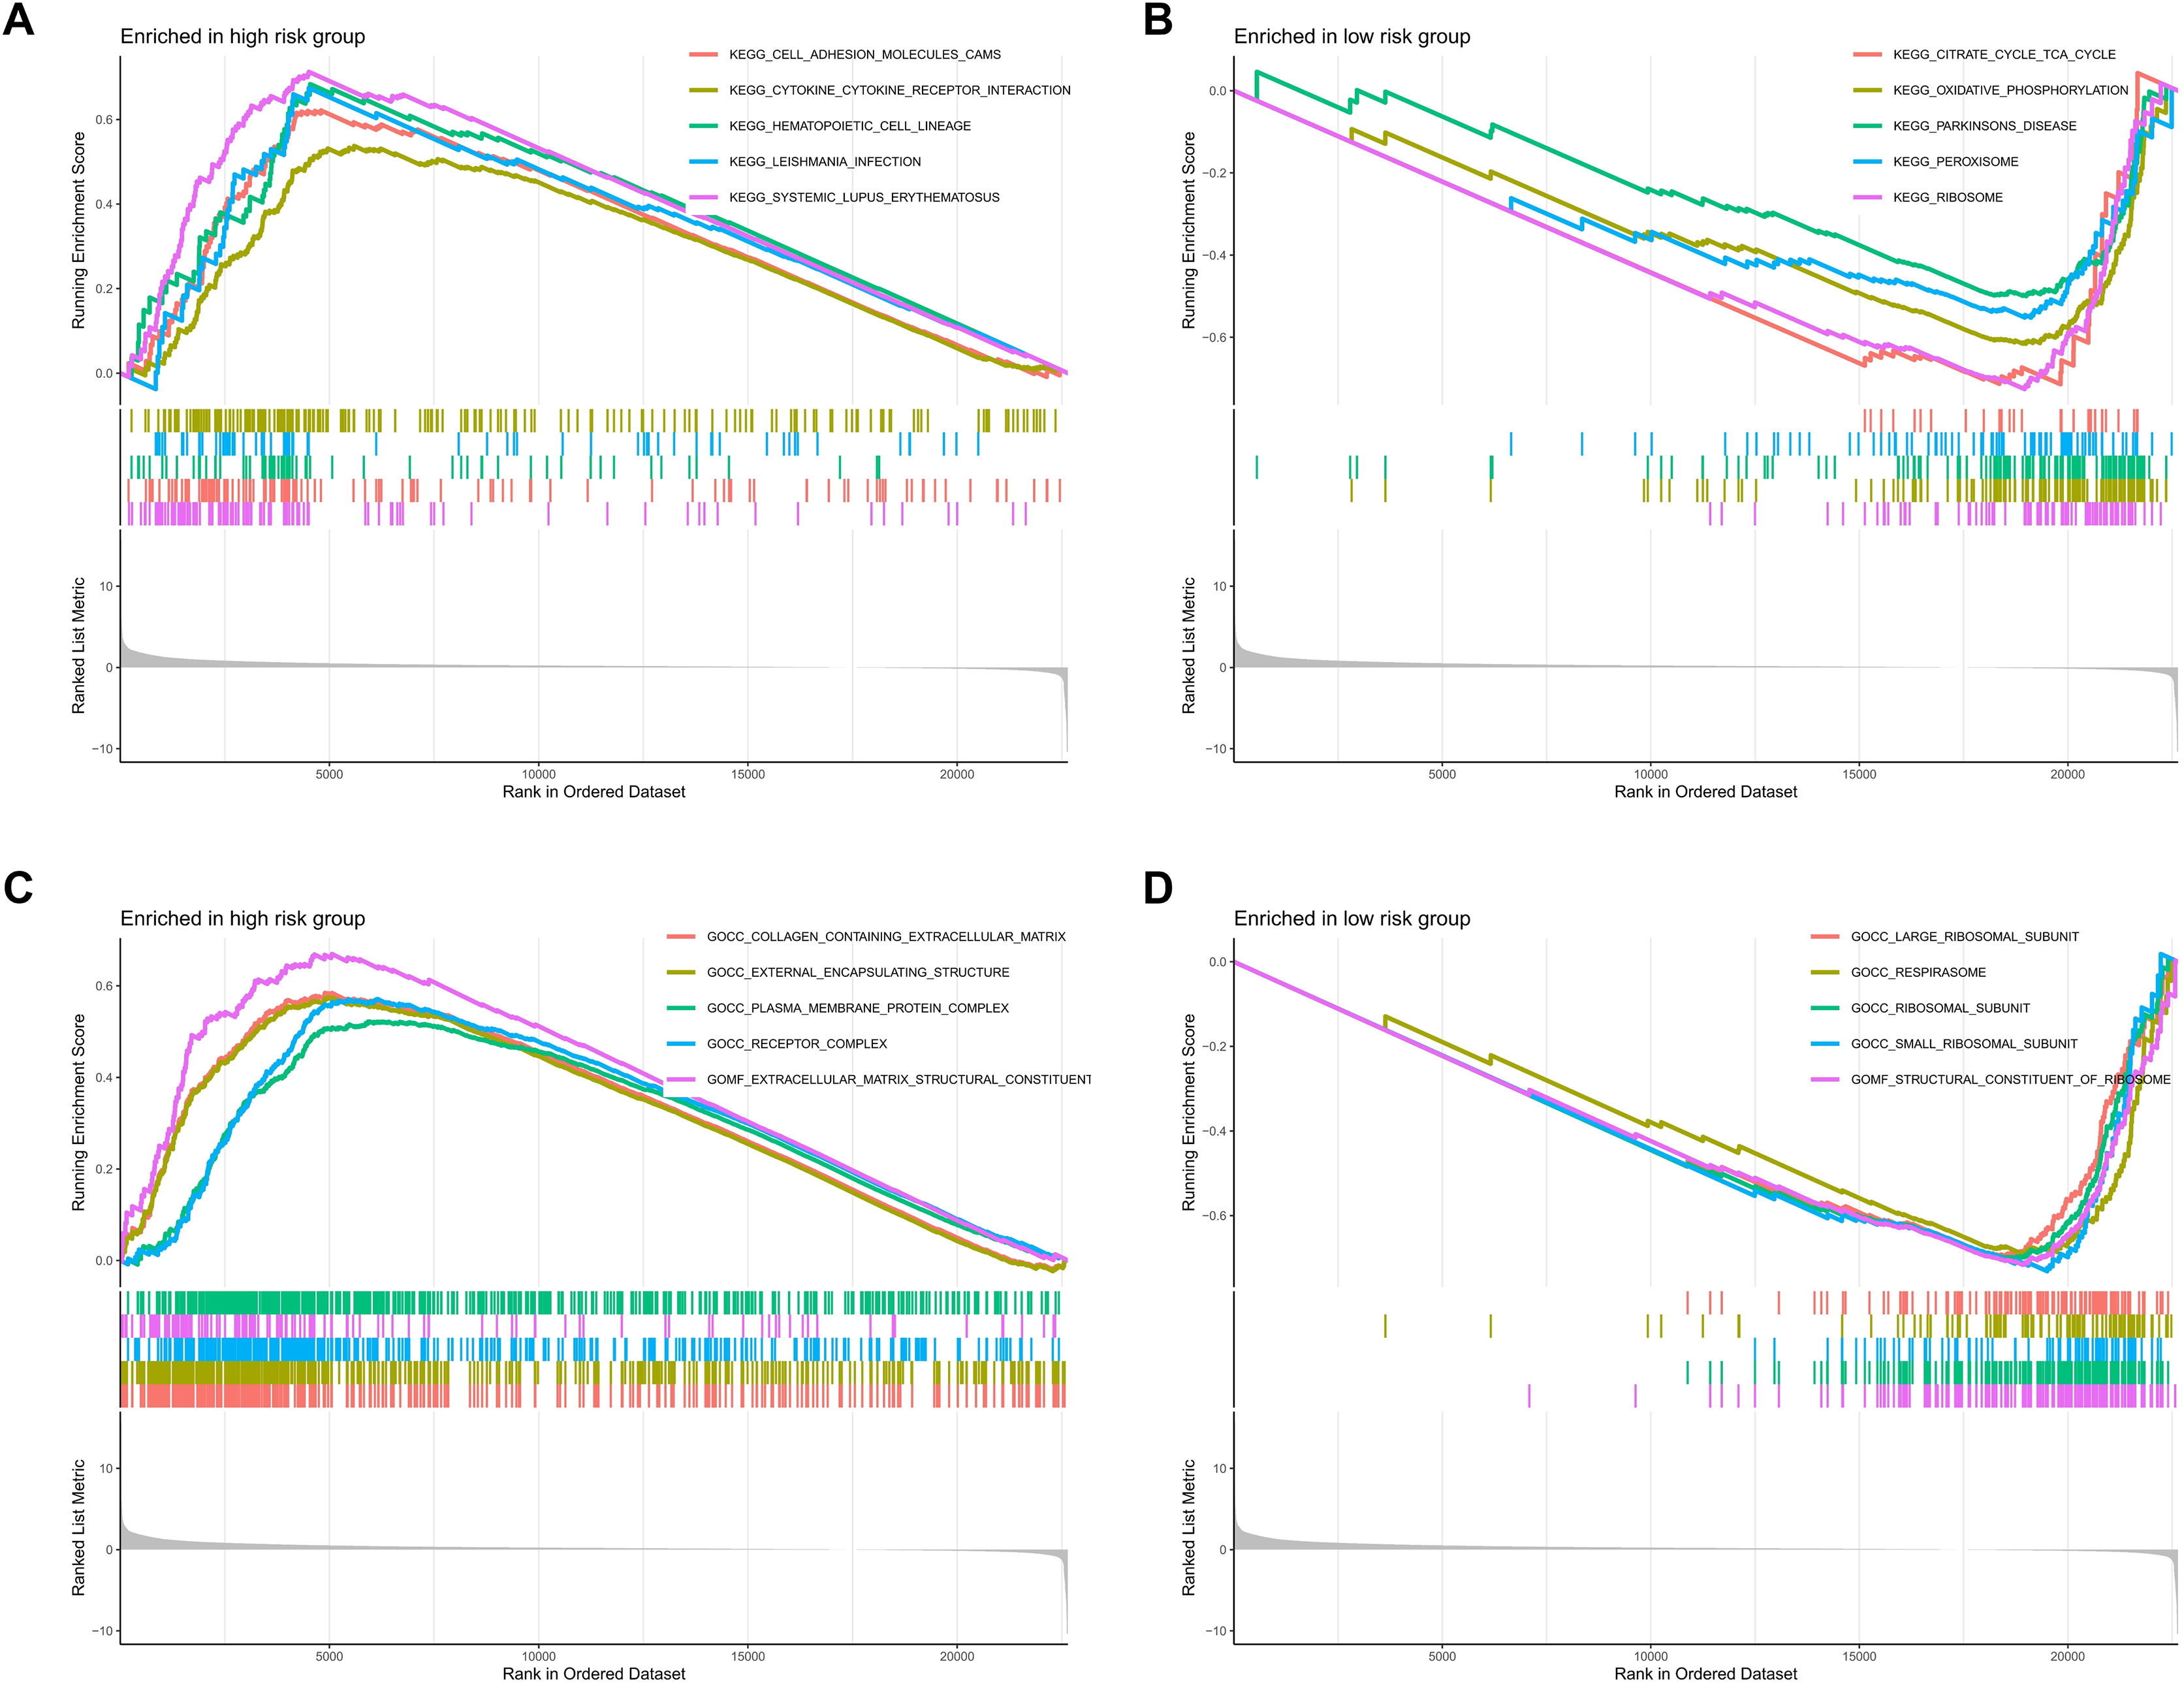
TMB and immune correlation analysis
TMB quantifies the number of genetic mutations within a tumor. Elevated TMB levels are often linked to enhanced immune responses and can serve as predictors for immunotherapy efficacy. Utilizing somatic mutation data from TCGA, TMB scores were calculated, highlighting the 15 genes with the highest mutation frequencies. The waterfall plot results indicate that the mutation frequency of these 15 genes is higher in the high-risk group compared to the low-risk group. Approximately 97.73% of COAD patients in the high-risk group exhibited TMB, with the most common mutated genes being APC (70%), TP53 (62%), TTN (48%), KRAS (43%), and PIK3CA (26%) (Fig. 11A). In the low-risk group, about 93.18% of COAD patients were affected, with APC (73%), TP53 (52%), TTN (43%), KRAS (42%), and PIK3CA (33%) as the top five genes with the highest mutation frequency (Fig. 11B). Furthermore, additional analyses showed that TMB scores in the high-risk group were significantly greater than those in the low-risk group, indicating an increase in genetic mutation levels (Fig. 11C). To assess the predictive value of risk scores for the prognosis of COAD patients, we categorized patients into high and low mutation groups based on the median TMB of each sample. Kaplan-Meier analysis revealed that patients in the low mutation group had better survival outcomes compared to the high mutation group (Fig. 11D). When combining TMB with risk scores for survival analysis, significant differences in survival outcomes were observed among the four groups (p < 0.001), with patients exhibiting high TMB and high risk showing the poorest survival outcomes (Fig. 11E). These results suggest that risk scores possess good predictive value for the prognosis of COAD patients.
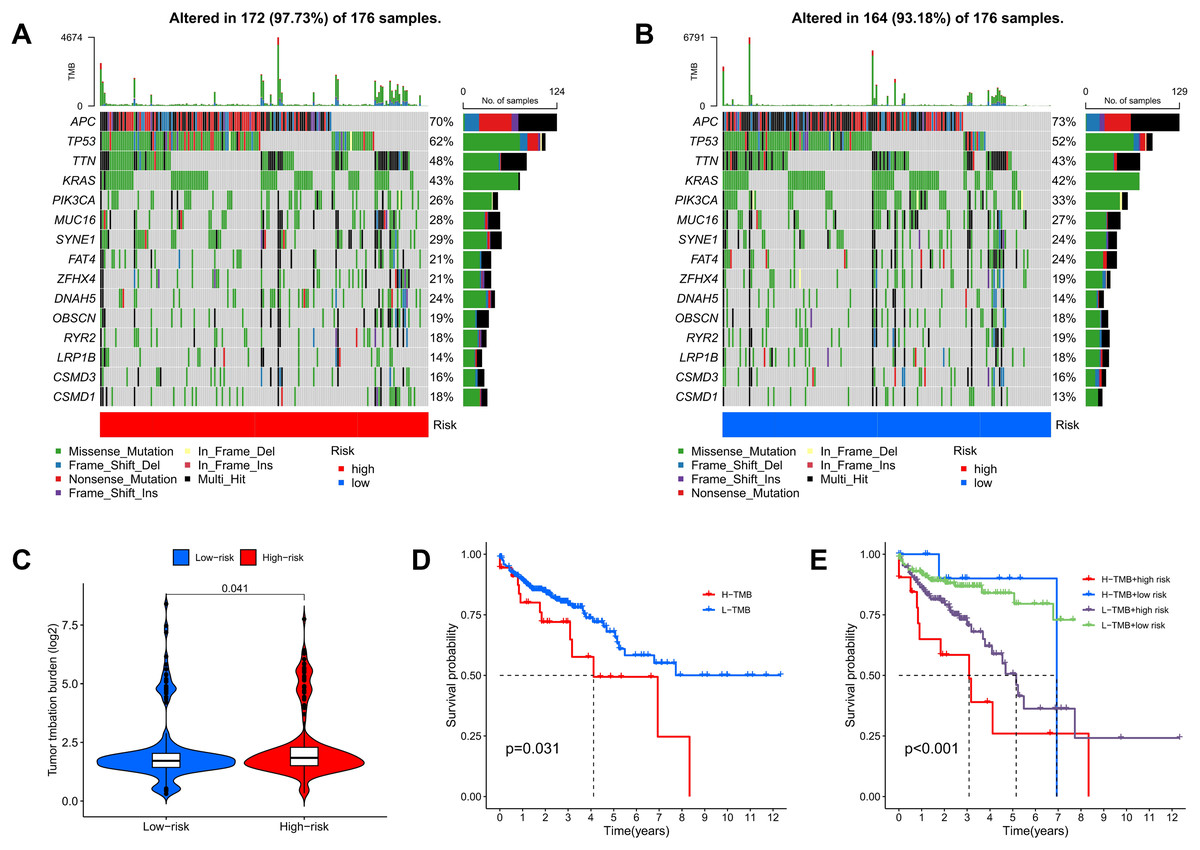
Figure 11: TMB and immune correlation analysis.
(A, B) The top 15 most frequently mutated genes in high-risk and low-risk patients are shown. (C) The TMB values of the high-risk and low-risk groups. (D) The overall survival curves show the differences between the high mutation group and the low mutation group. (E) The overall survival curves compare the four distinct subgroups.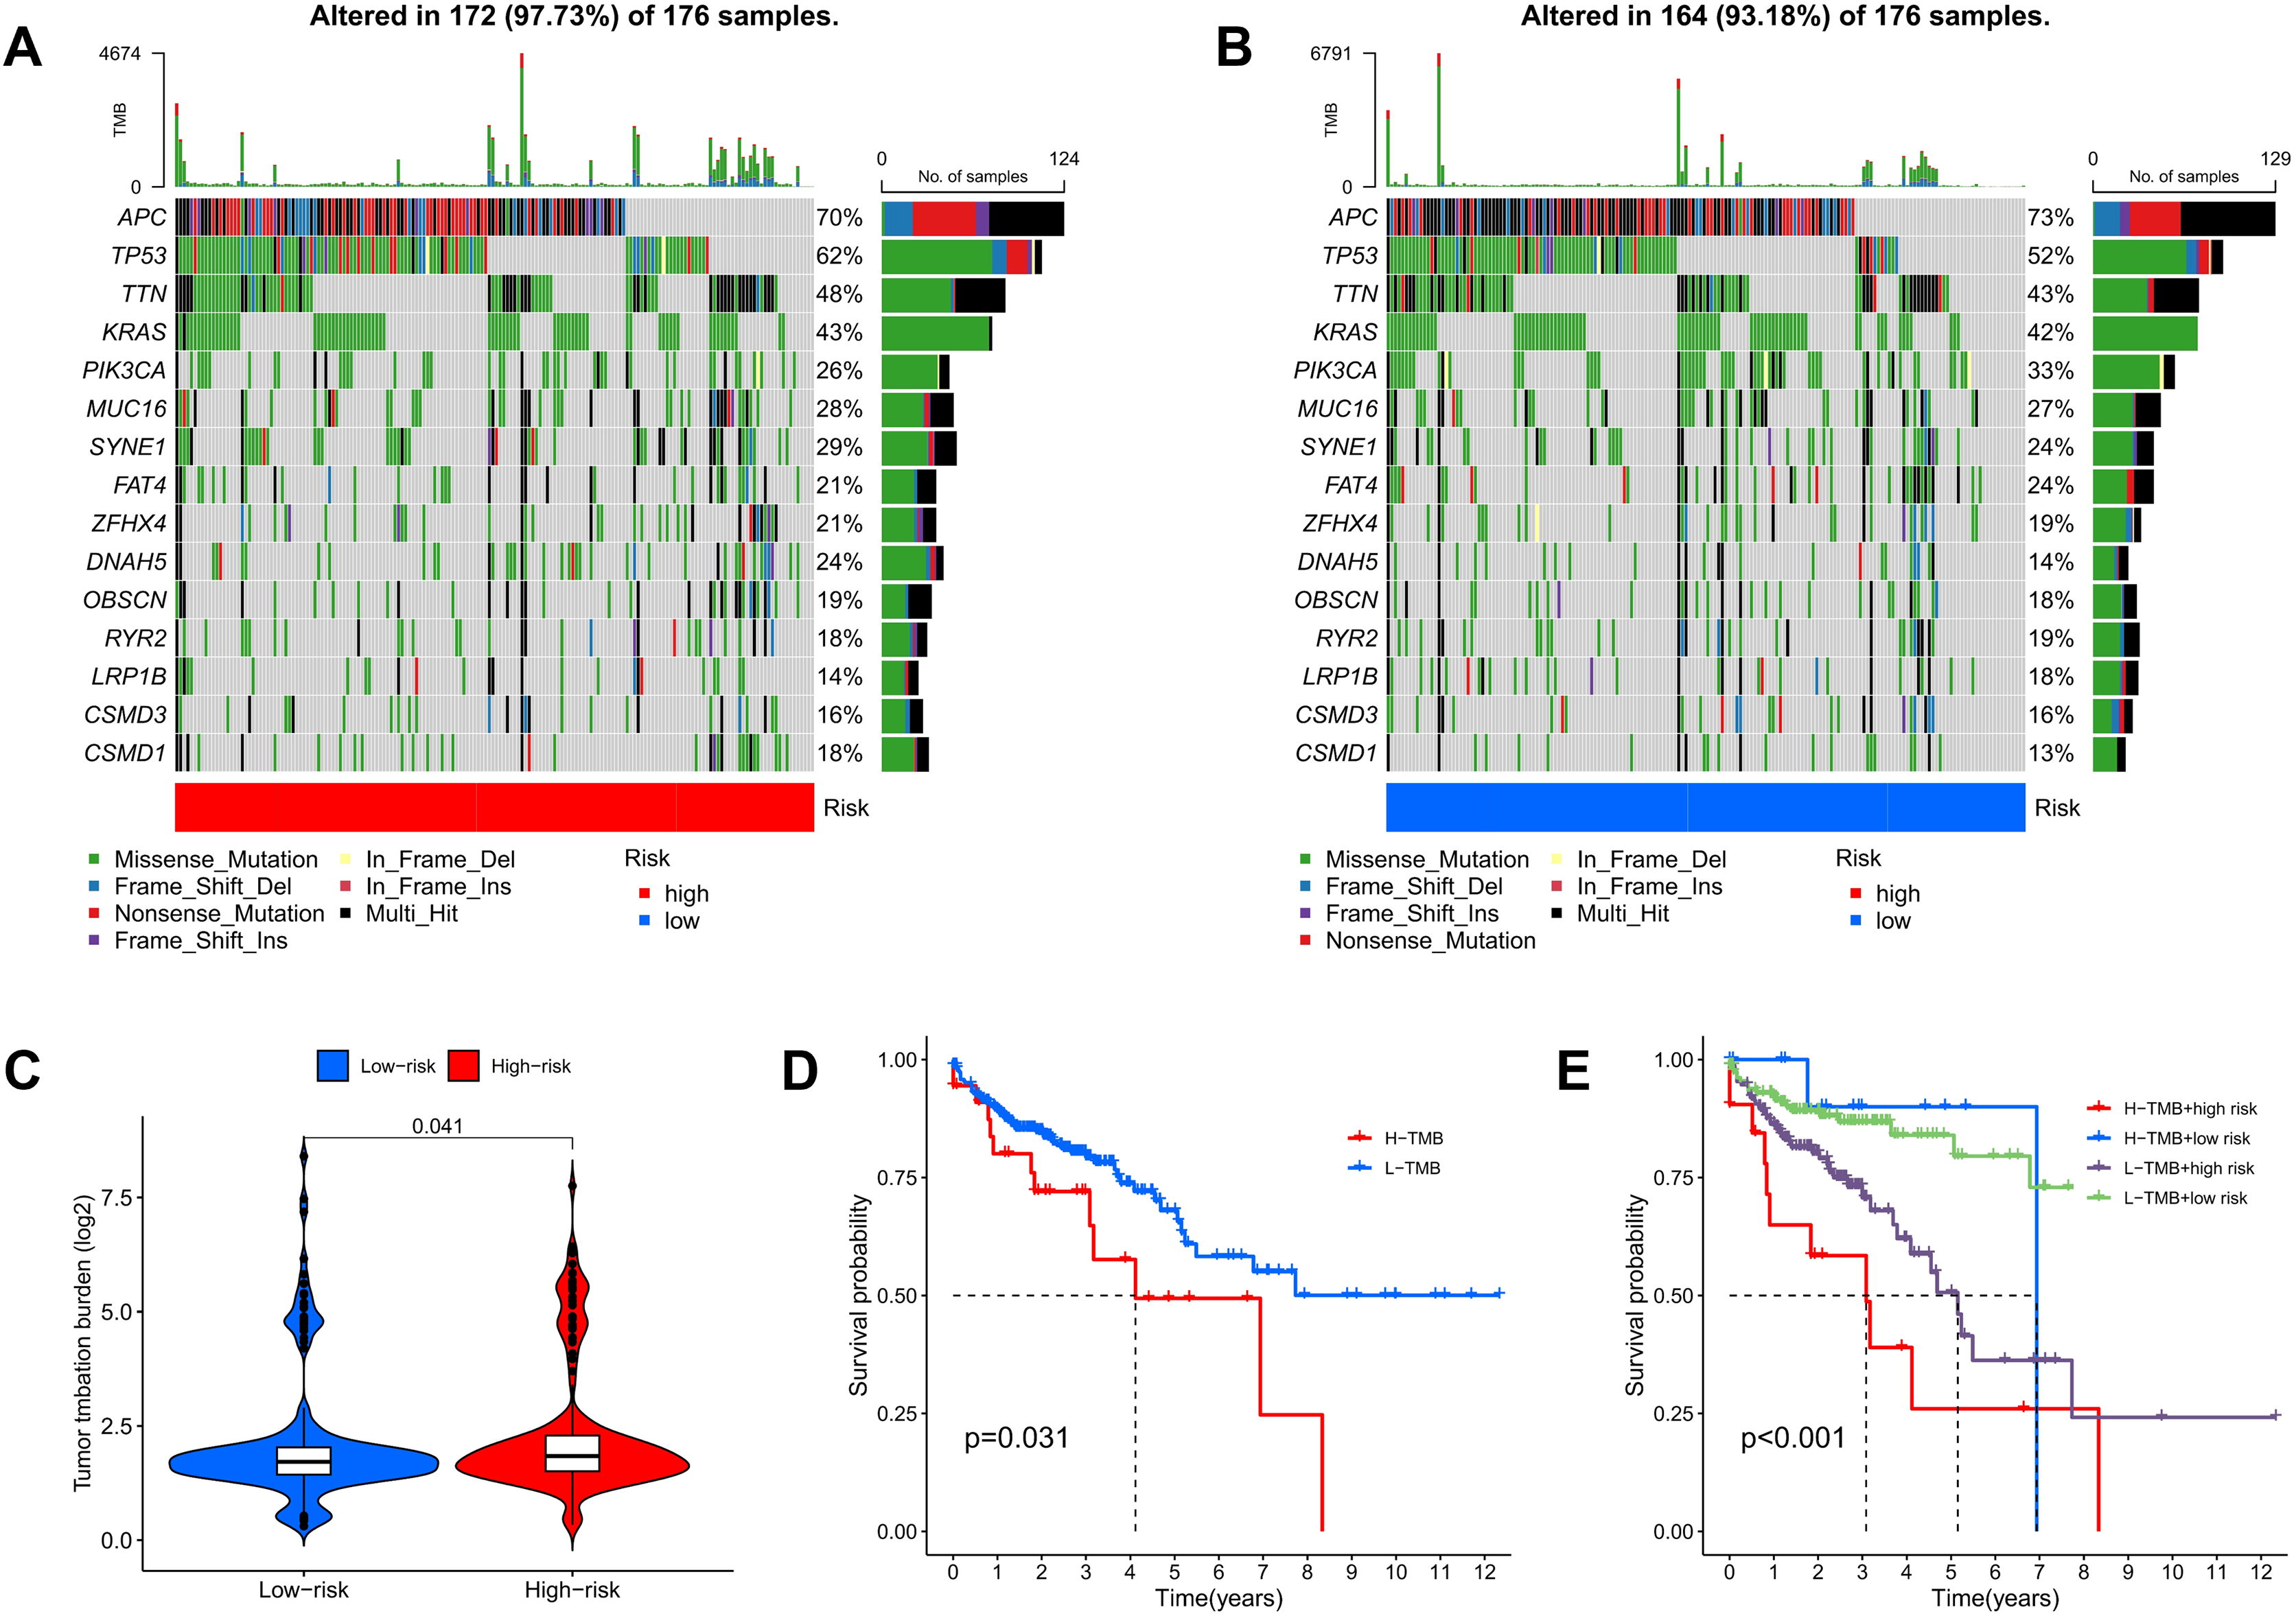
Analysis of tumor microenvironment differences revealed significant disparities between high-risk and low-risk groups. Compared to the low-risk group, samples from the high-risk group showed higher levels of stromal and immune cells, suggesting that tumor growth, invasion, and metastasis are more likely to occur in high-risk patients (Fig. 12A). TIDE analysis results showed that the TIDE score was significantly higher in the high-risk group than in the low-risk group, suggesting that high-risk patients may have stronger immune evasion capabilities and potential resistance to immune checkpoint inhibitor therapy (Fig. 12B). Immune infiltration analysis indicated a higher proportion of naïve B cells in the high-risk group, implying that these patients face a stronger immune challenge, while the low-risk group had a higher proportion of memory B cells, indicating a more effective immune response and potentially better prognosis (Fig. 12C). Analysis of immune-related functional differences revealed marked differentiation between high-risk and low-risk groups across several immune functions. The high-risk group scored higher on certain immunosuppressive mechanisms, such as co-inhibition of antigen-presenting cells (APCs) and pro-inflammatory cells, suggesting that this group may be more prone to immunosuppression and inflammation promotion. This state could enable tumor cells to evade immune surveillance and accelerate disease progression. In contrast, the low-risk group demonstrated relatively high scores for B cells and CD8+ T cells, indicating that these immune effector cells play a more active role. CD8+ T cells are critical for anti-tumor immunity, suggesting that the low-risk group may have stronger anti-tumor immune responses (Fig. 12D).
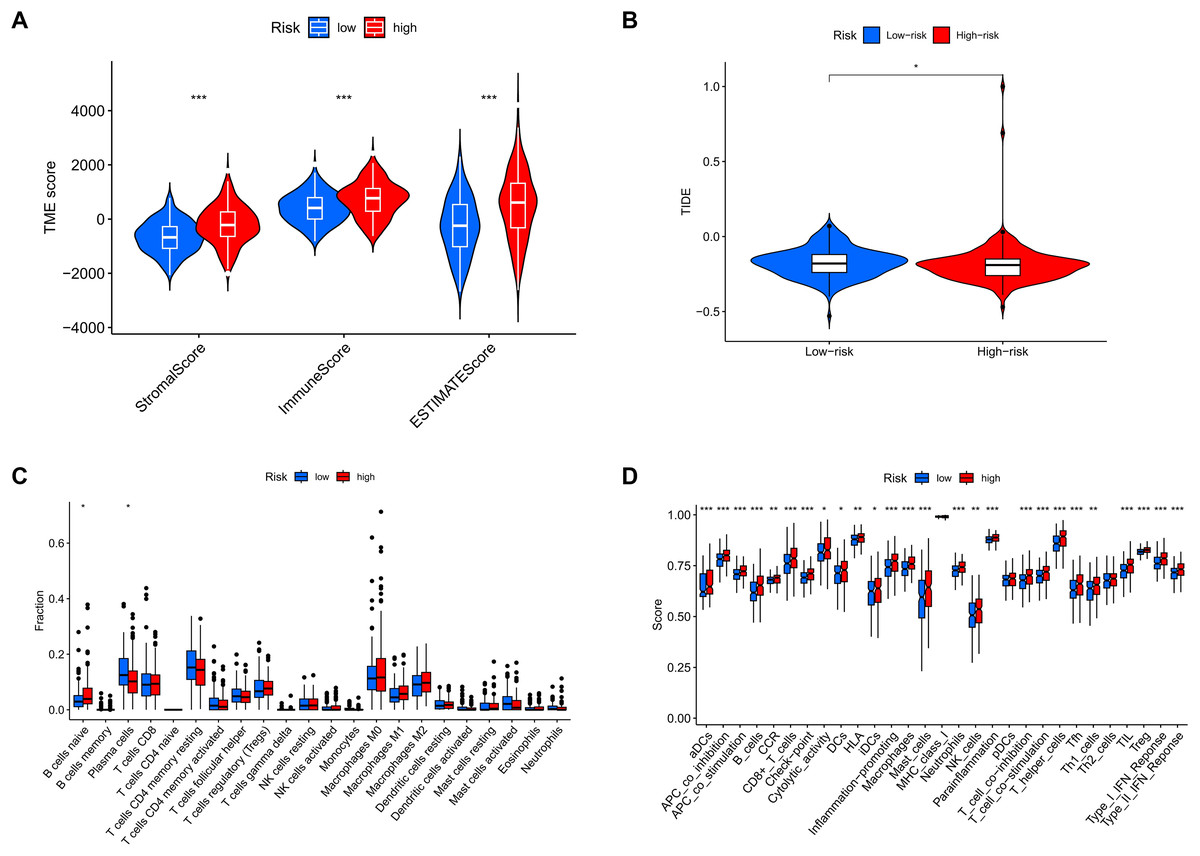
Figure 12: MRLs risk scores were used to predict the tumor microenvironment and immunotherapy outcomes.
(A) Differences in tumor microenvironment (TME) scores between the high-risk and low-risk groups were analyzed. (B) TIDE scores between high-risk and low-risk groups. (C) Differences in immune cell types between the high-risk and low-risk groups. (D) Differences in immune-related functions between the high-risk and low-risk groups. *p < 0.05; **p < 0.01; ***p < 0.001.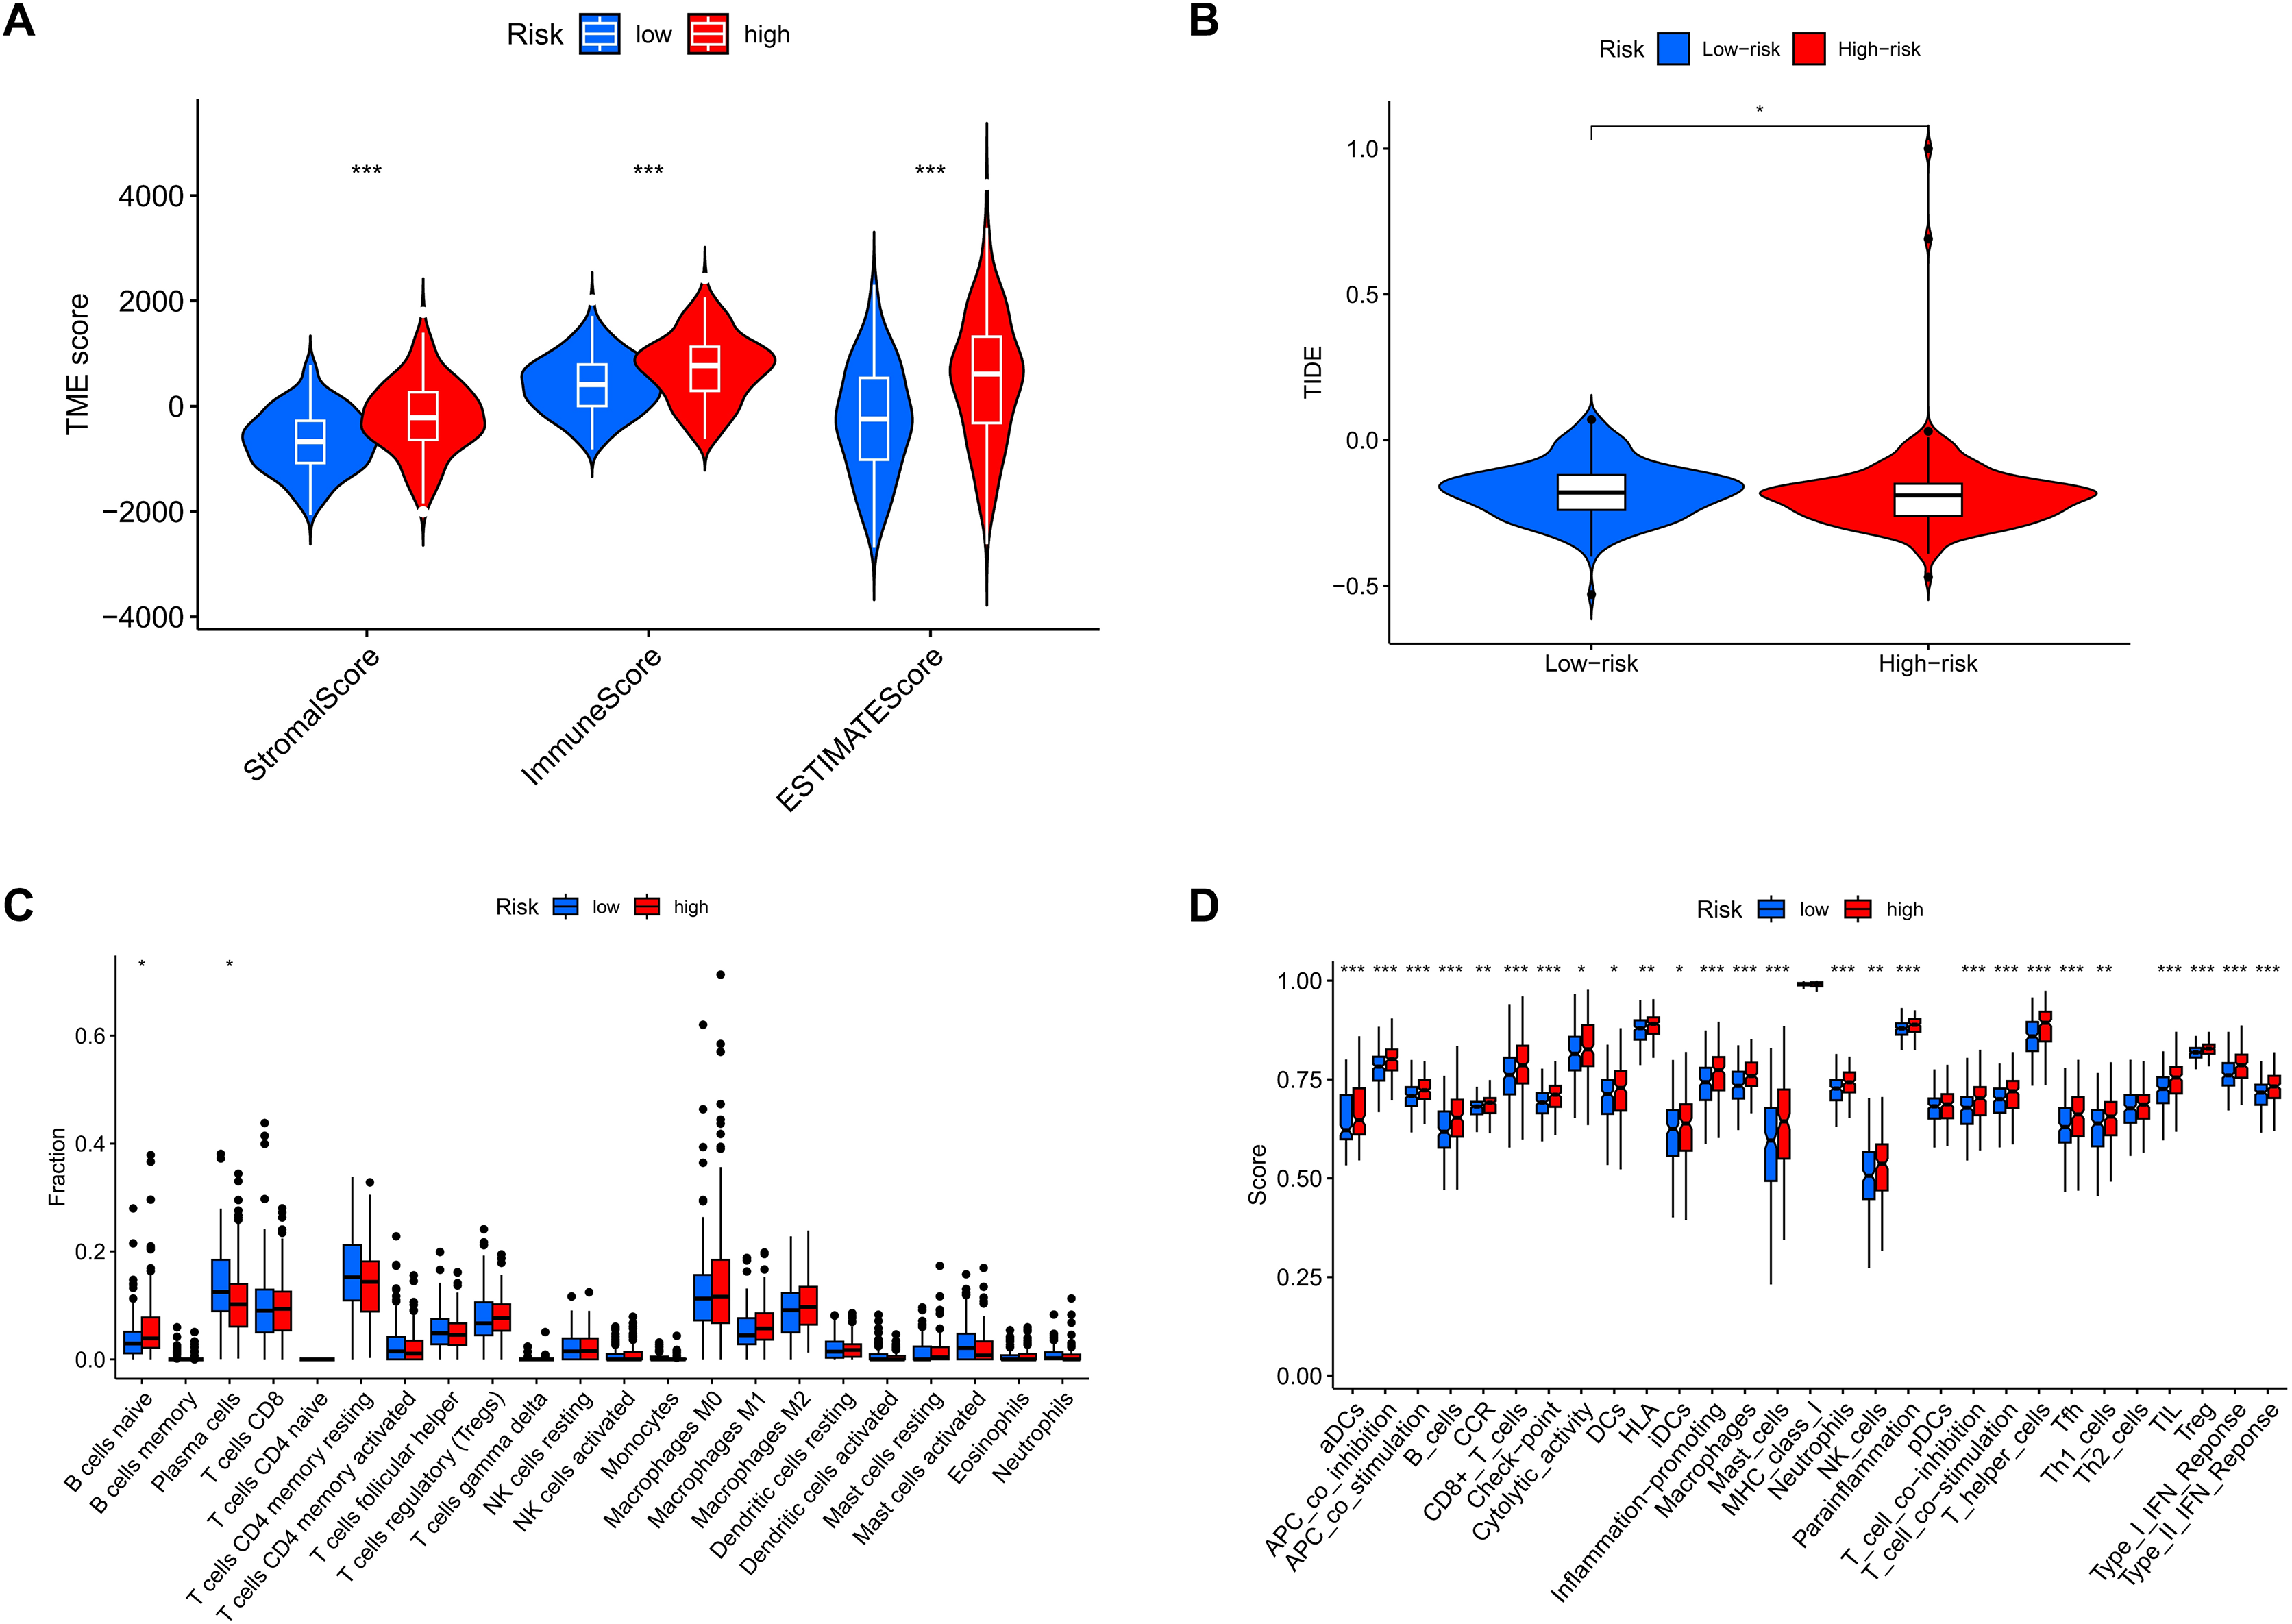
Correlations between the MRLs prognostic model and sensitivity to targeted therapy drugs
To further investigate the relationship between the MRLs prognostic model and drug sensitivity, we compared the IC50 of various drugs between the high-risk and low-risk groups using box plots. Among the eight drugs assessed, significant differences were found between the two groups (p < 0.05). The results indicated that patients in the high-risk group exhibited greater sensitivity to Cediranib, Dasatinib, Entospletinib, and Ruxolitinib (Figs. 13A–13D), while those in the low-risk group were more sensitive to Dabrafenib, Erlotinib, Oxaliplatin, and Sorafenib (Figs. 13E–13H). These findings suggest that our MRLs-associated prognostic model may serve as a valuable predictor of drug sensitivity.
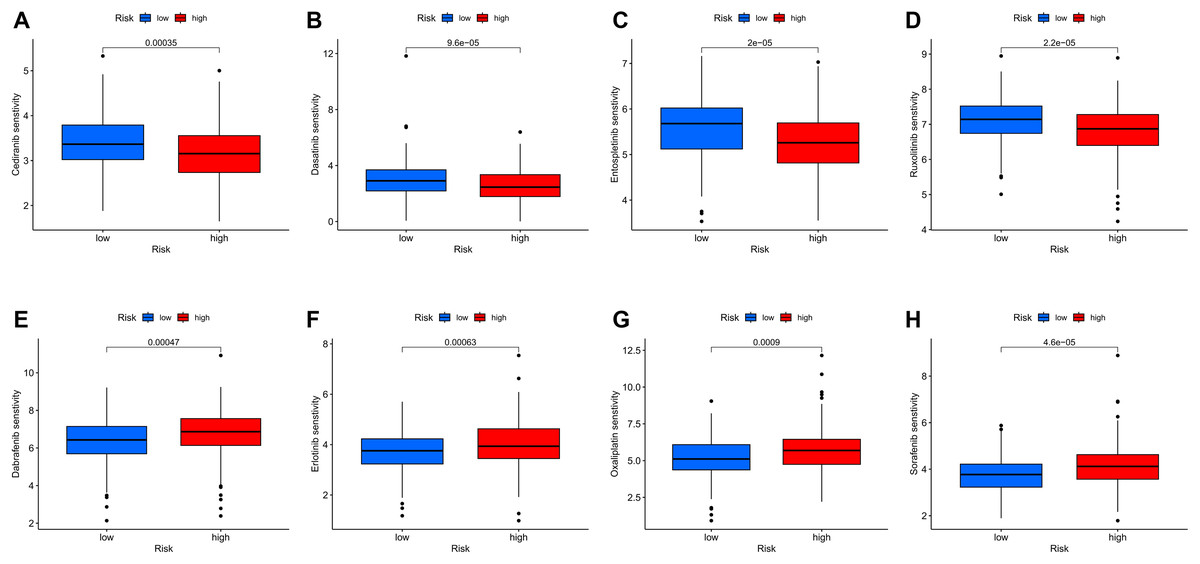
Figure 13: Variations in IC50 values of different immunotherapy drugs were analyzed based on risk scores.
(A) Cediranib. (B) Dasatinib. (C) Entospletinib. (D) Ruxolitinib. (E) Dabrafenib. (F) Erlotinib. (G) Oxaliplatin. (H) Sorafenib.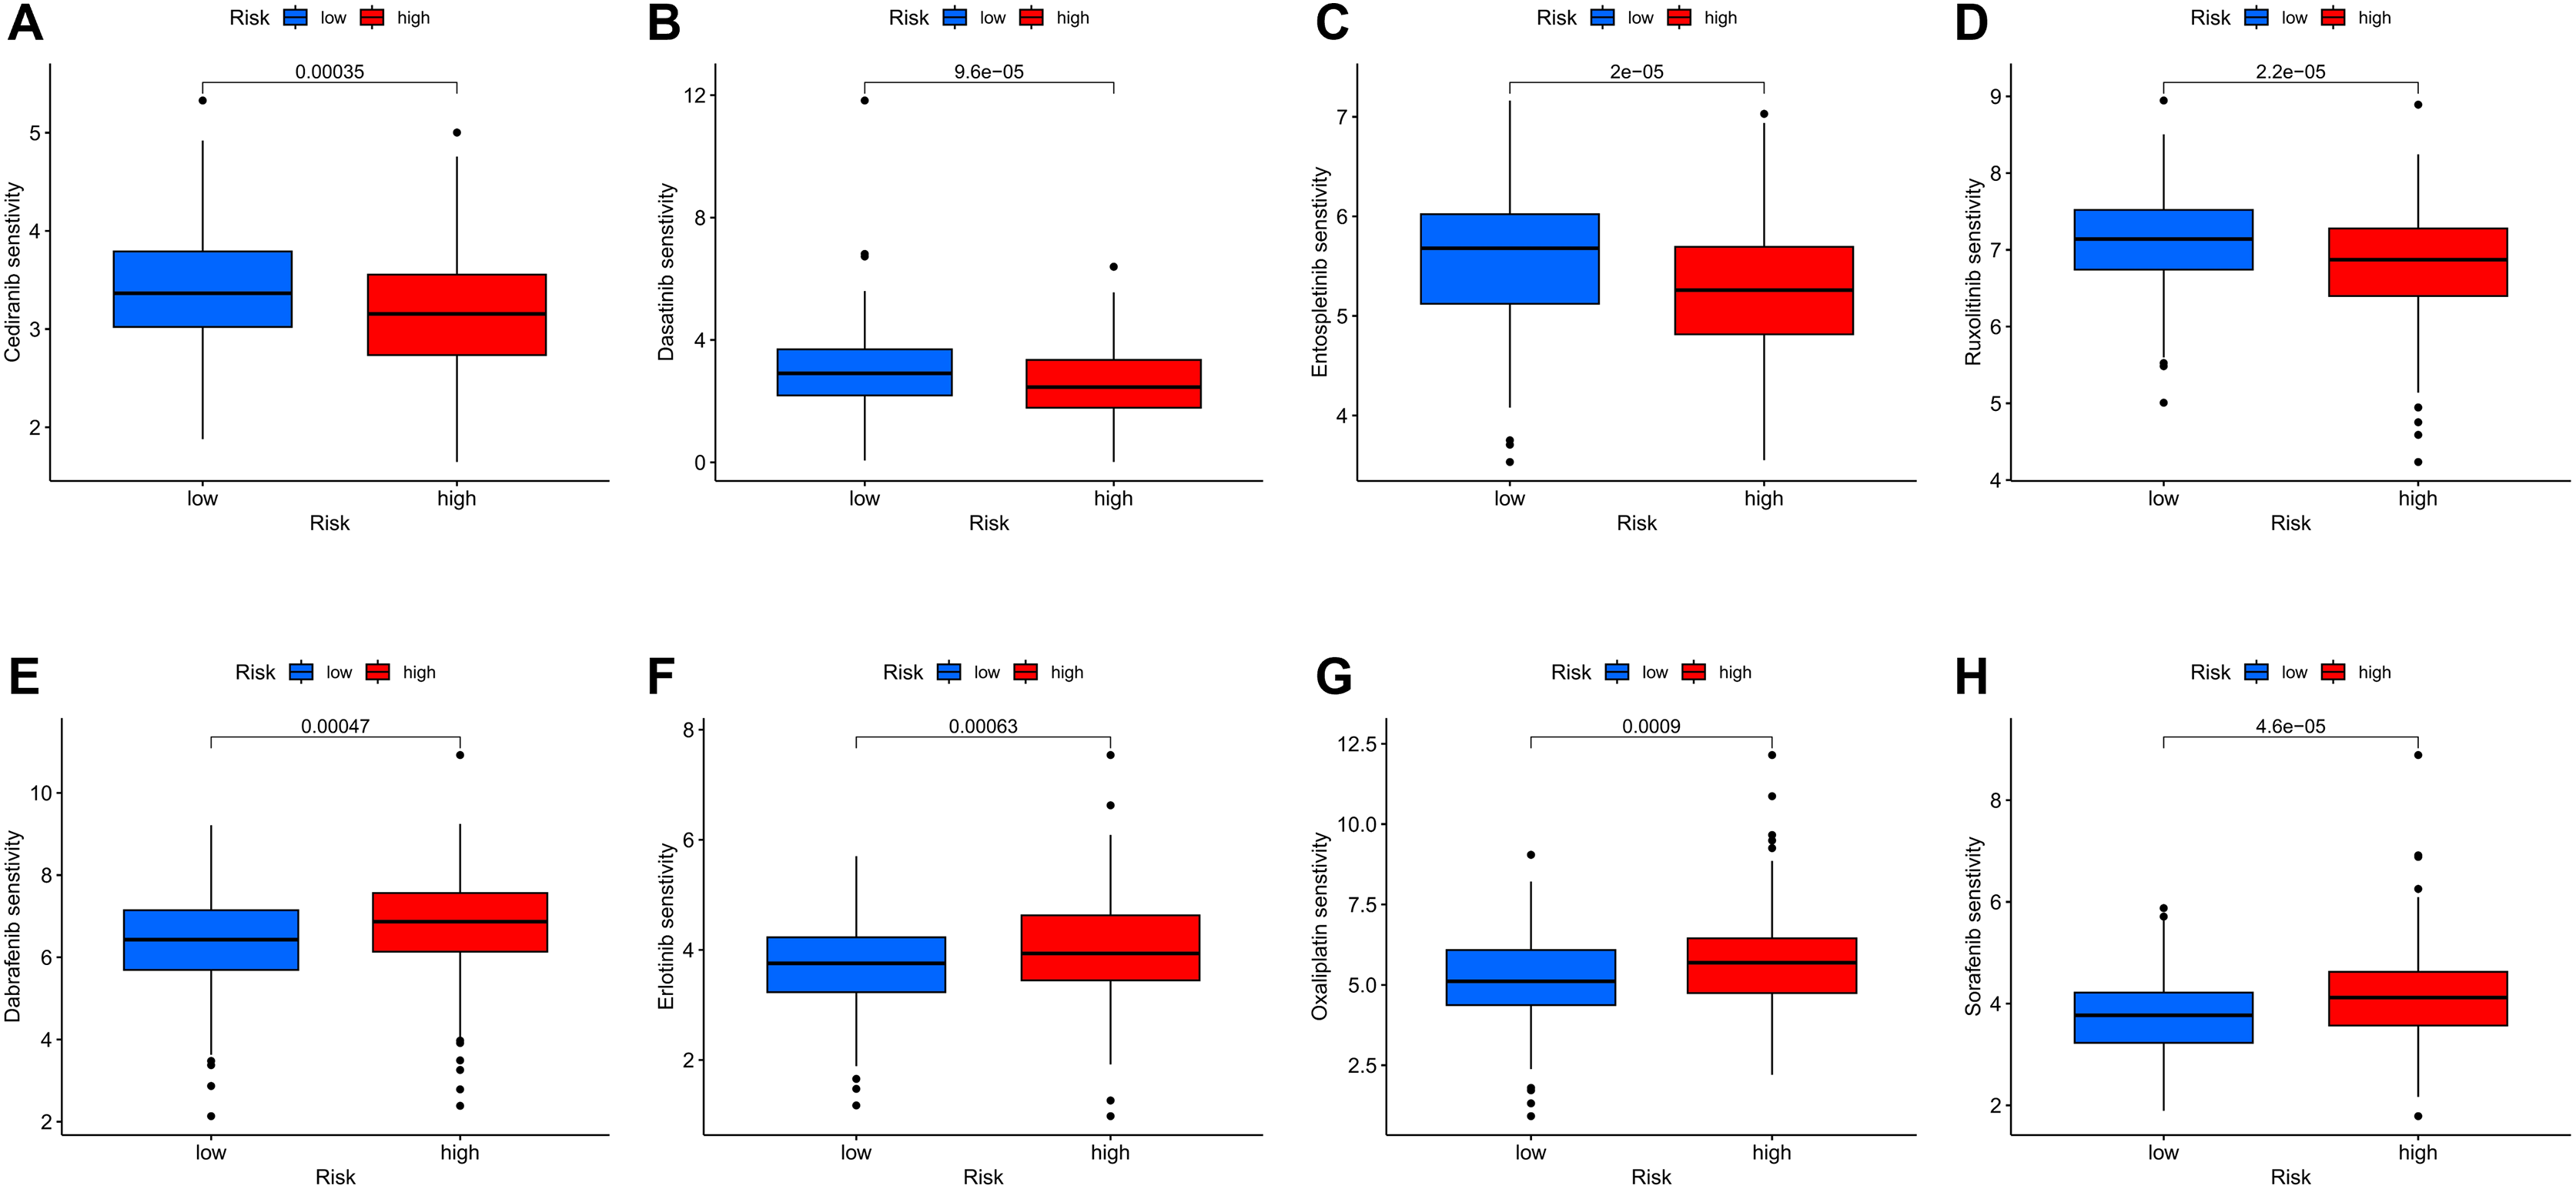
Validation of genes in the MRLs prognostic model
We first evaluated the expression levels of four MRLs in colorectal cancer cell lines (HCT116, DLD-1, SW620, RKO) compared to the normal colorectal cell line NCM460. Notably, the expression levels of the four MRLs were significantly higher in the HCT116 and RKO cell lines (Fig. 14A). Subsequently, we analyzed the expression of these MRLs in 20 pairs of colorectal cancer tissues and adjacent normal tissues. As illustrated in Figs 14B–14E, the expression levels of the four MRLs in tumor tissues were elevated compared to those in adjacent normal tissues. These experimental results further confirm the reliability of the risk model.

Figure 14: Validation of genes in the MRLs prognostic model.
(A) Expression analysis of four MRLs in five cell lines. (B–E) Expression analysis of four MRLs in human tissues. *p < 0.05; **p < 0.01; ***p < 0.001.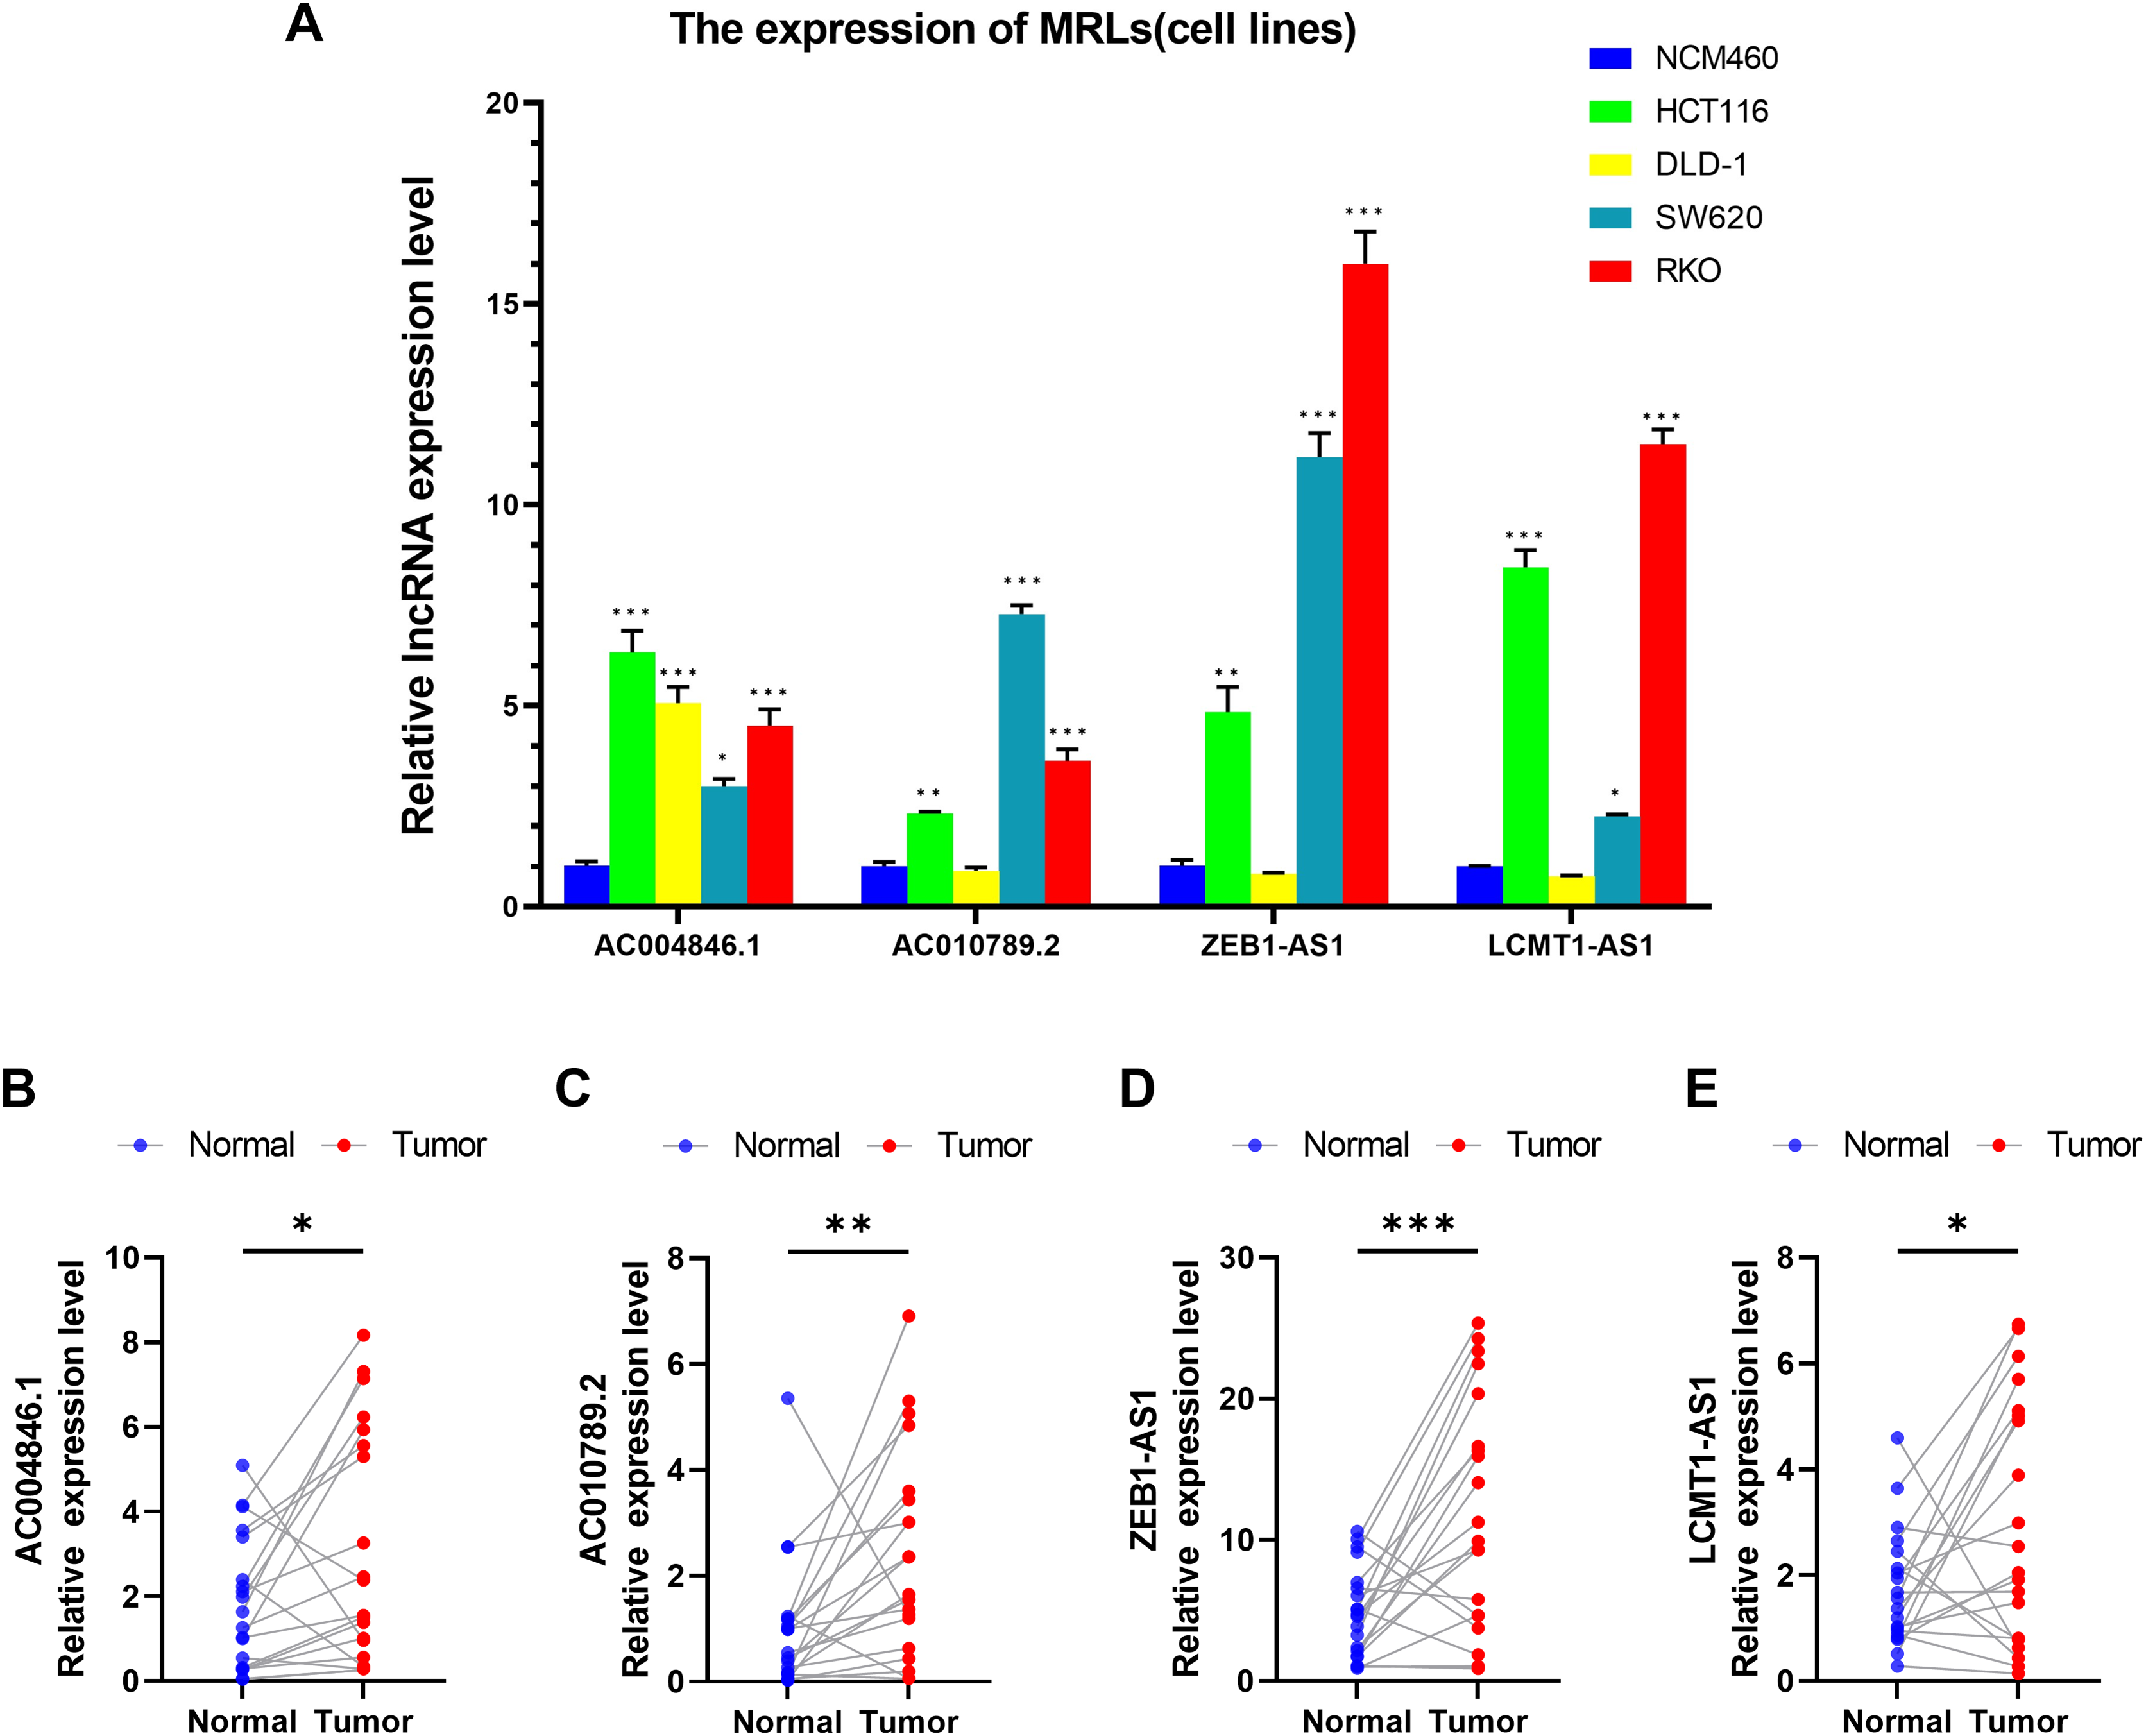
LCMT1-AS1 enhances the proliferation and migration of COAD cells
Among the four lncRNAs in the model, LCMT1-AS1 has limited prior research. To investigate its effect on COAD, we knocked down LCMT1-AS1 in HCT116 and RKO cells, which exhibit high expression of this gene. The efficiency of the transient knockdown was confirmed by RT-qPCR (Fig. 15A). Following LCMT1-AS1 knockdown, Vimentin expression decreased while E-cadherin expression increased in HCT116 and RKO cells (Fig. 15B), suggesting that LCMT1-AS1 may play a role in promoting epithelial-mesenchymal transition (EMT). Knocking down LCMT1-AS1 may inhibit EMT, thereby suppressing the migratory and invasive abilities of colorectal cancer cells.
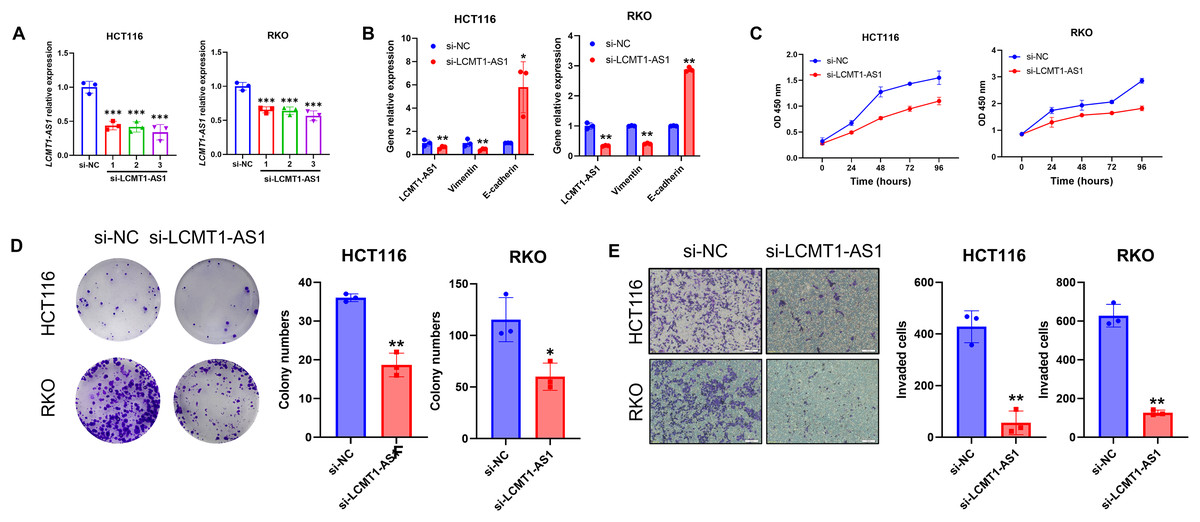
Figure 15: LCMT1-AS1 enhances the proliferation and migration of COAD cells.
(A) The efficiency of transient knockdown was validated by RT-qPCR. (B) The expression levels of Vimentin and E-cadherin. (C) CCK-8 assay results. (D) Colony formation assay results. (E) Transwell assay results. *p < 0.05; **p < 0.01; ***p < 0.001.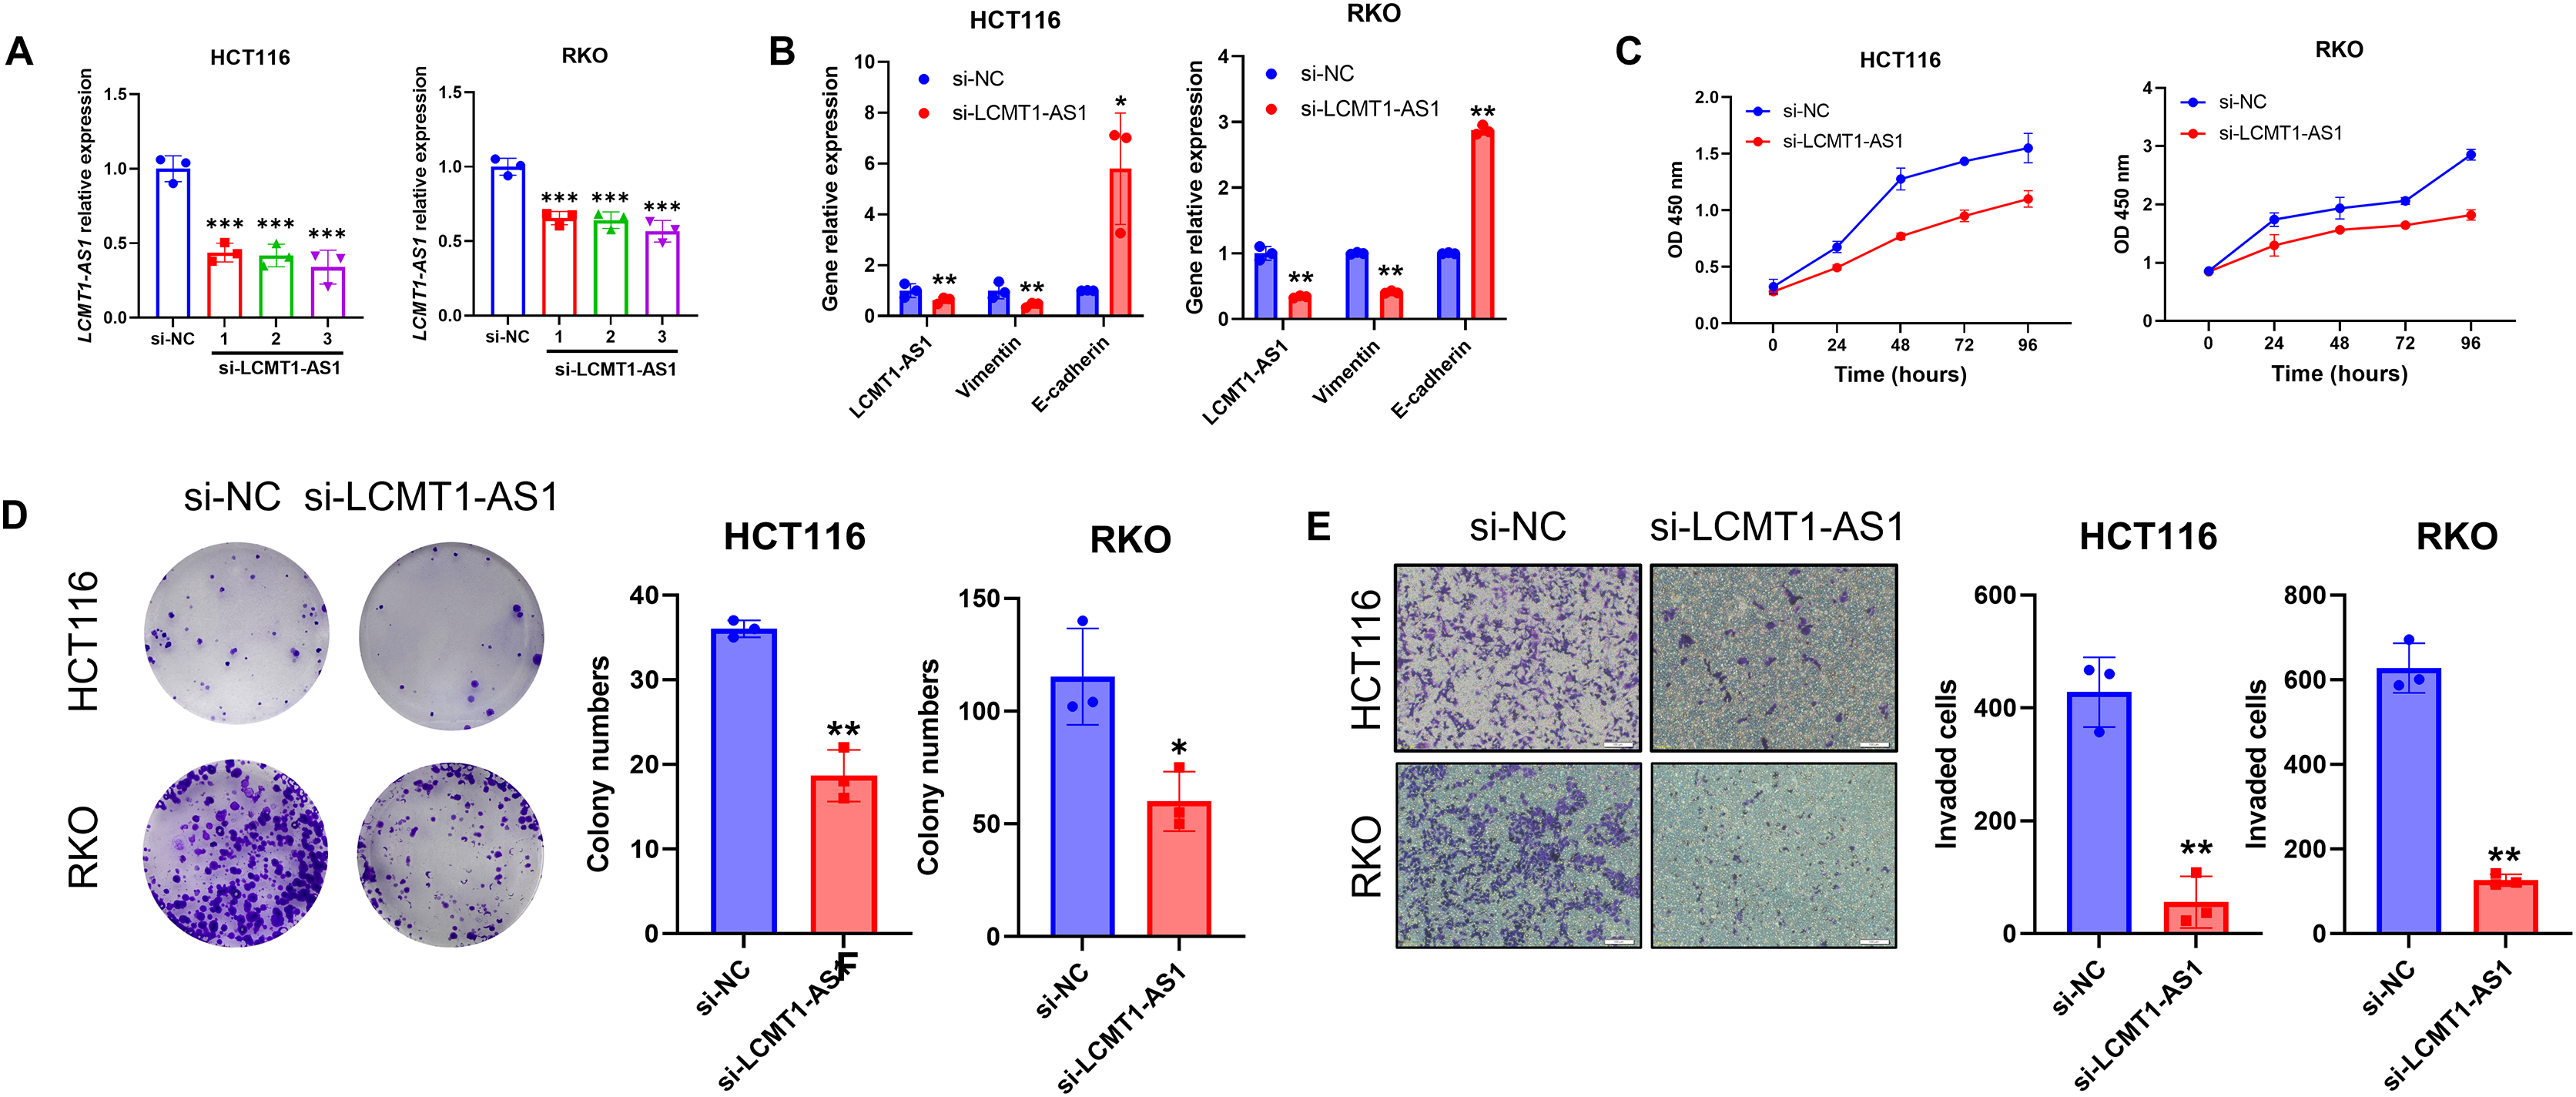
To assess the proliferation of HCT116 and RKO cells, we conducted CCK-8 and colony formation assays. As shown in results, LCMT1-AS1 knockdown significantly inhibited the growth of these cells (Figs. 15C, 15D). Additionally, Transwell assays were performed to evaluate the effect of LCMT1-AS1 on COAD cell migration. The results indicated that LCMT1-AS1 knockdown reduced the migratory ability of HCT116 and RKO cells (Fig. 15E).
Discussion
As one of the malignancies with the highest incidence and mortality rates globally, COAD presents significant challenges in prevention and treatment, particularly in metastatic and advanced stages (Bray et al., 2024; Siegel, Giaquinto & Jemal, 2024). Although recent advancements in targeted therapies and immunotherapy have provided new treatment options for some patients, the overall efficacy of these approaches remains limited (Cervantes et al., 2023; Ganesh et al., 2019). Furthermore, the recurrence rate and risk of metastasis in COAD are notably high, adversely affecting patients’ long-term survival and quality of life. Therefore, further investigation into the molecular mechanisms underlying COAD and the role of the tumor microenvironment is essential for developing more precise and effective treatment strategies, ultimately improving patient prognosis and survival rates (Guinney et al., 2015; Xiao & Yu, 2021).
Migrasomes are a newly discovered type of extracellular vesicle structure that has become a focal point in the study of cell migration and intercellular communication since their initial report by Professor Yu Li’s team in 2015 (Ma et al., 2015). Unlike conventional extracellular vesicles, migrasomes form at the tips of filopodia and lamellipodia, playing a critical role in cellular communication by transporting bioactive molecules, including proteins, RNA, and lipids (Ma et al., 2015). The role of migrasomes in cancer progression has garnered significant attention, particularly regarding their potential involvement in tumor invasion and metastasis. Several studies suggest that migrasomes contribute to tumor progression by modulating the tumor microenvironment and facilitating intercellular signaling (Deng et al., 2024). However, the specific mechanisms through which migrasomes regulate tumor development remain largely unexplored. Our study, therefore, aimed to investigate MRLs and their potential involvement in COAD progression, an area that has not been previously addressed.
In this study, we identified four MRLs as potential biomarkers for COAD prognosis. Instead of merely reporting statistical findings, it is crucial to explore the biological relevance of these lncRNAs. Previous studies have indicated that AC004846.1 is involved in various lncRNA-based prognostic models (Dai et al., 2022; Lin et al., 2023). AC010789.2 has been implicated in cuproptosis-related regulatory networks in COAD (Liang et al., 2023; Yang et al., 2023). The role of ZEB1-AS1 in COAD has gradually been elucidated, highlighting its multifaceted regulatory function in tumor progression. ZEB1-AS1 acts as a ceRNA by serving as a “sponge” that binds competitively to microRNAs (miRNAs), thereby preventing these miRNAs from inhibiting their target genes. Research by Ni et al. (2020) demonstrated that ZEB1-AS1 can bind to miR-455-3p, reducing the inhibitory effect of miR-455-3p on oncogenes such as ZEB1, which leads to the upregulation of ZEB1. This mechanism is particularly significant in COAD because ZEB1, a key transcription factor involved in EMT, promotes the EMT process through its elevated expression, thereby enhancing the migration and invasion capabilities of tumor cells (Schwab et al., 2024). Additionally, ZEB1-AS1 can further enhance the proliferation and survival of cancer cells by activating the Wnt/β-catenin signaling pathway (Lv et al., 2018). High expression of ZEB1-AS1 is closely associated with malignant phenotypes and poor prognosis in COAD patients, indicating that it is not only a critical factor in COAD progression but also holds potential as a diagnostic and therapeutic target (Chen & Shen, 2020).
Similarly, LCMT1-AS1, an antisense lncRNA, remains largely unstudied, yet our findings suggest its involvement in promoting COAD cell proliferation and migration. One possible explanation for this is that LCMT1-AS1 may regulate LCMT1 expression through transcriptional interference or chromatin remodeling mechanisms. Given that other lncRNAs have been shown to modulate gene expression through ceRNA interactions or epigenetic modifications, future research should focus on elucidating whether LCMT1-AS1 operates through similar mechanisms in COAD. Functional experiments involving LCMT1-AS1 knockdown or overexpression in COAD models will be essential to confirm its role in tumorigenesis.
Our findings also revealed that high-risk COAD patients exhibited a significantly higher tumor mutation burden (TMB) compared to low-risk patients. This aligns with the hypothesis that higher mutation rates may enhance tumor antigenicity, making tumors more immunogenic and potentially more responsive to immune checkpoint inhibitors (Goodman et al., 2017). Consequently, TMB is widely utilized to predict the efficacy of immunotherapy in patients, particularly in solid tumors like COAD (Cristescu et al., 2018). In this study, TMB scores were generated from TCGA somatic mutation data, revealing that the TMB in the high-risk group was significantly greater than in the low-risk group, indicating a higher level of gene mutations among high-risk patients. This difference in mutation frequency is also reflected in the 15 most frequently mutated genes, where the mutation rates of APC, TP53, TTN, KRAS, and PIK3CA in high-risk COAD patients were significantly elevated compared to the low-risk group. Notably, mutations in APC and TP53, both important tumor suppressor genes, often promote tumorigenesis, while mutations in KRAS and PIK3CA are associated with signaling pathways that regulate cell proliferation and survival. The accumulation of mutations in these genes may lead to a more aggressive tumor phenotype (Yamamoto & Imai, 2015). High TMB and a greater frequency of gene mutations can activate a series of immune responses, increasing the number of neoantigens and thereby enhancing the immune system’s ability to recognize and eliminate tumor cells. Studies have shown that tumors with higher TMB typically exhibit better responsiveness to immunotherapy, as the increased number of mutated peptides can be presented as neoantigens to immune cells (Hou, Yi & Zhu, 2022). Furthermore, high TMB is associated with poorer survival prognosis, as an increased mutational burden may accelerate cancer progression and metastasis (Samstein et al., 2019). Therefore, the elevated TMB in high-risk patients suggests they may be more suitable candidates for immunotherapy, while also warranting attention to their potential prognostic risks.
The TME plays a crucial role in tumor progression, influencing both immune evasion and therapeutic resistance. Our immune analysis revealed that the high-risk group exhibited elevated levels of naïve B cells, while the low-risk group had a higher proportion of memory B cells and CD8+ T cells. This suggests that the immune landscape differs between risk groups, with the low-risk group potentially mounting a more effective anti-tumor immune response. The presence of CD8+ T cells, which are key players in anti-tumor immunity, may contribute to the improved prognosis observed in low-risk patients (Gajewski, Schreiber & Fu, 2013). Additionally, we observed increased immune suppression in high-risk patients, characterized by elevated co-inhibition of antigen-presenting cells (APCs) and pro-inflammatory cell signaling. This may indicate that tumors in the high-risk group actively suppress immune surveillance, allowing for more aggressive tumor progression. Understanding the molecular interactions between MRLs and immune cell activity could provide further insights into the role of MRLs in shaping the TME.
Functional enrichment analysis highlighted several pathways associated with migrasome-related lncRNAs. GO analysis revealed that MRLs were significantly enriched in pathways related to extracellular matrix (ECM) organization, integrin binding, and collagen-containing ECM, suggesting a potential role in cell adhesion and migration. The KEGG analysis further identified significant enrichment in PI3K-Akt and Wnt signaling pathways, both of which are well-known regulators of tumor growth and metastasis (He et al., 2021; Huang et al., 2021; Yu et al., 2021). These findings provide a foundation for future mechanistic studies to determine whether MRLs influence these pathways directly or act through intermediary regulatory factors.
In summary, our study provides a novel perspective on the role of migrasome-associated lncRNAs in COAD. Unlike previous studies that have primarily focused on ferroptosis- and cuproptosis-related lncRNAs, our work highlights a previously uncharacterized molecular axis linking migrasomes and lncRNAs. By integrating transcriptomic data, survival analysis, and functional annotation, we propose a new prognostic model that could enhance risk stratification and treatment strategies for COAD patients. Future studies should focus on experimentally validating the mechanistic roles of these lncRNAs and exploring their potential as therapeutic targets. Additionally, integrating single-cell RNA sequencing and spatial transcriptomics approaches could provide deeper insights into the spatial dynamics of MRL expression within the TME.
Certainly, our study has several limitations. Firstly, migrasomes are a newly discovered organelle structure, and research on them is still limited. We only included nine MRGs, which may restrict the comprehensiveness of our findings. Secondly, the lncRNA expression profiles and clinical sample data utilized in this study were sourced solely from the TCGA database; an over-reliance on a single database may lead to discrepancies between predicted results and actual conditions. Thirdly, while we assessed the expression levels of MRLs in 20 pairs of clinical samples and four colon cancer cell lines using RT-qPCR, the sample size is relatively small. Conducting larger-scale studies with sufficient sample sizes will enhance the validation of this model’s accuracy and generalizability.
For future research, it would be beneficial to focus more on migrasomes and explore a broader range of variable lncRNAs. This will further increase the value of migrasomes in future cancer research, enhancing their potential as prognostic markers and therapeutic targets. Additionally, further investigation into the molecular mechanisms of these lncRNAs in cancer progression will provide more insights and refine our current understanding.
Conclusion
In summary, our study identified four migrasome-related lncRNAs and developed a novel prognostic model based on these genes, which can independently and accurately predict the prognosis of colorectal adenocarcinoma patients. The model demonstrated strong predictive power, as indicated by significant correlations with patient survival outcomes, tumor characteristics, and treatment response. Furthermore, we integrated this prognostic model with clinical characteristics, enabling clinicians to implement more precise, stratified management for COAD patients.
Our results also indicate that the model may offer valuable insights into predicting the response of COAD patients to immunotherapy. Additionally, the identification of drugs that target high-risk and low-risk COAD populations provides a promising avenue for therapeutic intervention, suggesting that the model could guide personalized treatment plans. Importantly, this model’s predictive capability was validated across multiple analysis methods, including survival analysis and ROC curve analysis, which underscores its robustness and potential clinical applicability.
In conclusion, our findings offer new avenues for both prognostic prediction and therapeutic strategies in COAD, which could significantly improve patient outcomes. However, the study’s limitations, including the reliance on data from a single database and a relatively small sample size for the experimental validation, call for further investigation and larger-scale studies to refine the model’s accuracy and generalizability.