
SK4 potentially modulates the alternative splicing profile associated with papillary thyroid cancer development in BHT101 cells
- Published
- Accepted
- Received
- Academic Editor
- Vladimir Uversky
- Subject Areas
- Cell Biology, Genomics, Molecular Biology, Oncology
- Keywords
- PTC, SK4, RNA-seq, DEGs, Alternative splicing, DNA damage, Spliceosome
- Copyright
- © 2025 Wupuer et al.
- Licence
- This is an open access article distributed under the terms of the Creative Commons Attribution License, which permits using, remixing, and building upon the work non-commercially, as long as it is properly attributed. For attribution, the original author(s), title, publication source (PeerJ) and either DOI or URL of the article must be cited.
- Cite this article
- 2025. SK4 potentially modulates the alternative splicing profile associated with papillary thyroid cancer development in BHT101 cells. PeerJ 13:e19391 https://doi.org/10.7717/peerj.19391
Abstract
Papillary thyroid cancer (PTC) is an ever-increasing cancer type worldwide, and greatly decreases the life quality and affects survival time of patients during its development and progression, but the underlying mechanisms and key factors for PTC progression are not clear. Recent studies demonstrated the potassium channel protein SK4 participates in the progression of many cancers, while it lacks the molecular mechanism study for SK4 function. In this study, we performed functional and molecular explorations for SK4 by overexpressing its level in thyroid cancer BHT101 cells. Cellular proliferation and invasion experiments were performed to assess the influences of SK4 on cell behaviors. Further, whole transcriptome sequencing (RNA-seq) analysis helped us systematically investigated the targets of SK4, including differentially expressed genes (DEGs) and regulated alternative splicing events (RASEs), and validated several related DEGs and RASEs by RT-qPCR experiment. In thyroid cancer patients, SK4 expression was completely lost in normal tissues and significantly increased in every stage of tumor tissues compared with normal tissues, which probably results from the low DNA methylation level at its promoter region. Consistent with previous study, SK4 overexpression (SK4-OE) promoted proliferation and invasion ability of BHT10 cells compared with negative control (NC). By analyzing the RNA-seq data, we detected dozens of DEGs and found that up DEGs were enriched in negative regulation of apoptotic progress, including VTCN1, MSX1, FATE1, TEK, and PRAMEF2. More importantly, we found SK4-OE globally changed the alternative splicing (AS) pattern and identified 1,639 RASEs. The genes of RASEs were enriched in DNA damage/repair, viral process, translation, and mRNA splicing pathways, which were tightly associated with the pathogenesis and progression of cancers. The splicing regulatory genes from regulated alternative splicing genes (RASGs) could partly explain the reason of global AS dysregulation by SK4-OE in BHT101 cells. Finally, we found the expression of VTCN1, EDN1, SLC29A4, RP11-473M20.16, and CH507-513H4.4 were validated by RT-qPCR, as well as the AS pattern of TMEM116. In summary, we highlight that SK4-regulated AS pattern probably is a novel regulatory mechanism for SK4 in PTC. The identified DEGs and RASEs, as well as SK4 itself, could be used as potential therapeutic targets for PTC treatment in future.
Introduction
Thyroid cancer, with papillary thyroid cancer (PTC) as the most incident type, is a commonly diagnosed and ever-increasing cancer type worldwide, with 586,000 new cases in 2020, although the survival rate of PTC patients is high (Sung et al., 2021). Meanwhile, the high incidence of PTC suggests that promising therapeutic techniques and more individualized treatment approach, including molecular targeting therapies, are needed to achieve better therapeutic results and longer survival time (Brito, Hay & Morris, 2014). The molecular pathogenesis of PTC has been studied, which identified the mitogen-activated protein kinase (MAPK) and PI3K-AKT-MTOR pathways’ involvement in PTC promotion (Xing, Haugen & Schlumberger, 2013). The PTC-associated aggressive variants, including mutations from BRAF, TP53, PTC3, and PTC1, have been reviewed and associated with higher rates of recurrence and metastasis (Coca-Pelaz et al., 2020). Other studies also highlighted the important roles of epigenetic alternations and immune microenvironment on the pathogenesis and progression of PTC (Prete et al., 2020; Xing, 2013). Thus, further studies should be performed to deeply explore the molecular targets of PTC to improve the efficiency of diagnosis and treatment.
Tumor microenvironment, including immune cell infiltration, extracellular matrix, and other secreted factors or molecules, plays an essential role in the progression of cancers (Anderson & Simon, 2020). Among these factors, metal ions have attracted increasing attention due to their wide range of functions and applications in tumor development and therapy (Hu et al., 2022; Tokar, Benbrahim-Tallaa & Waalkes, 2010). For mechanisms, metal ions, interacting with their partnering proteins, could induce downstream signaling pathways, alter the osmotic or metabolism balance, and damage the DNA (Liu et al., 2021). The association between metals and thyroid cancer (TC) has been established as the TC incidence is significantly increased in volcanic areas that have heavy metals in the environment (Malandrino et al., 2020), as well as the known cognition that metal ions are enriched in thyroid gland (Van Gerwen et al., 2022). One recent study demonstrated that thyrospheres exposed to metals showed an increase of proliferation by activating the ERK1/2 pathway (Giani et al., 2021). These results indicate that the metal ions and their interacting proteins tightly involve in the pathogenesis and development of PTC. However, the underlying mechanisms and the functions of individual metal ion and protein are largely unknown.
Among the metal ion channels that contain transmembrane proteins, we paid attention to the potassium channels that regulate cancer cell behaviors and are used as therapeutic targets (Huang & Jan, 2014). Among the potassium channel proteins, we focused on KCa3.1 or SK4, also known as KCNN4, a part of the potentially heterotetrameric voltage-independent potassium channel. Its aberrant expression is associated with multiple kinds of cancers. In breast cancer mice model with SK4-deficient treatment, the cell cycle progression and proliferation rate were significantly reduced in SK4-deficient samples, indicating that SK4 activity is crucial for cell cycle control in breast cancer (Steudel et al., 2017). In PTC, it has been reported that SK4 is upregulated in PTC patients, and its silencing in PTC cell lines inhibited cell proliferation, invasion, and migration, and promoted expression of apoptotic genes (Wen et al., 2020). However, how SK4 modulates the oncogenic programs is largely unknown.
In this study, we aim to explore how SK4 regulates the cancer cell behaviors of PTC cells by using multiple experimental strategies and bioinformatics analysis. By overexpressing SK4 in BHT101 cells, we investigated the influence of SK4 on cellular proliferation and invasion. Most importantly, we performed whole transcriptome sequencing (RNA-seq) experiment to decipher the underlying mechanisms of SK4 regulation on PTC cancer cells. Solid validation experiments also confirmed the downstream targets of SK4, including differentially expressed genes and alternative splicing genes. Meanwhile, we also systematically analyzed the expression pattern and associated tumor microenvironment using public databases. In summary, our study highlights the potential regulatory mechanisms of SK4 in PTC cancer cells, and the identified molecular targets of SK4 could be used as possible therapeutic targets for PTC treatment in future.
Materials and Methods
Cloning and plasmid construction
To construct SK4 overexpression plasmid, we selected the transcript NM_002250 from National Center for Biotechnology Information (NCBI) database as the target. The pcDNA3.1 plasmid was used as the vector, and the pcDNA3.1-SK4 was purchased from Youbio Biotech (Changsha, China). The empty pcDNA3.1 plasmid was used as negative control.
Cell culture and transfections
The BHT101 cell line was purchased from Pricella (CL-0617, Pricella, Wuhan, China), validated by short tandem repeat (STR) profiling, and tested negative for mycoplasma. The BHT101 cells were cultured in DMEM high sugar basic culture medium (PM150210, Pricella, Wuhan, China) with 10% fetal bovine serum (FBS), 100 µg/mL streptomycin, and 100 U/mL penicillin at 37 °C with 5% CO2. Plasmid transfection of BHT101 cells was performed using Lipofectamine 2000 (Invitrogen, Waltham, MA, USA) according to the manufacturer’s protocol. The transfected cells were then harvested after 48 h for following analysis.
Western blot assay
The BHT101 cells were first lysed in ice-cold PBS buffer (0.1% SDS, 0.5% NP-40 and 0.5% sodium deoxycholate) with a protease inhibitor (Roche, Basel, Switzerland) for 30 min. The lysed cells were then boiled for 10 min with 1X SDS sample buffer and separated on 10% SDS-PAGE. With TBST buffer (20 mM Tris-buffered saline and 0.1% Tween-20) containing 5% non-fat milk powder for 1 h at room temperature, membranes were incubated with primary antibody: SK4 antibody (1:5000, 23271-1-AP, ProteinTech, Rosemont, IL, USA) and glyceraldehyde-3-phosphate dehydrogenase (GAPDH) (1:10000, 60004-1-Ig, ProteinTech, Rosemont, IL, USA), and then with Horseradish preoxidase (HRP)-conjugated secondary antibody (anti-mouse 1:10000, BOSTER Bio, Pleasanton, CA, USA). Then the samples were detected using the enhanced chemiluminescence (ECL) reagent (170506, Bio-Rad, Hercules, CA, USA).
Cell proliferation assay
The proliferation capacity of the BHT101 cells was assessed by a CCK8 assay (HY-K0301, MCE, New Jersey, USA), which was performed according to the manufacturer’s instructions. The absorbance was measured at 450 nm using an enzyme-linked immunosorbent assay plate reader (FC, Thermo Fisher Scientific, Waltham, Massachusetts, USA). Each experiment was performed in triplicate at least.
Cell invasion assay
We performed in vitro invasion assay using transwell chambers (3422, Corning, Corning, NY, SA). The transwell chambers were precoated with a thin layer of Matrigel (356234, BD Biosciences, Franklin Lakes, NJ, USA), diluted for 1:8 using serum-free medium, 100 ul diluted matrigel in chambers was incubated for 1 h at 37 °C and 5% CO2 and removed unsolidified supernatant. BHT101 cells in 0.2 ml serum-free medium were added to the inserts. We then inserted the transwell chambers in this medium with 600 ul 10% FBS (10091148, Gibco, Waltham, MA, USA) in the lower chamber for 48 h at 37 °C and 5% CO2. After that, cells on the upper membrane surface were removed, and the cells on the lower chamber were fixed by 4% paraformaldehyde (P0099, Beyotime, Shanghai, China) for 20 min, and stained by 0.1% crystal violet (C0121, Beyotime, Shanghai, China). We finally counted the invasion cells under inverted microscope (MF52-N, Mshot, Gangzhou, Guangdong Province, China) at 200 × magnification.
RNA extraction from BTH101 cells
Total RNA was extracted by the TRIZOL (Ambion, Austin, TX). The RNA was further purified with two phenol-chloroform treatments and then treated with RQ1 DNase (Promega, Madison, WI, USA) to remove DNA. The quality and quantity of the purified RNA were redetermined by measuring the absorbance at 260 nm/280 nm (A260/A280) using NanoPhotometer N50 (IMPLEN, Munich, Germany). The integrity of RNA was further verified by 1.0% agarose gel electrophoresis.
Library preparation and sequencing for RNA-seq
We performed RNA-seq for both SK4-overexpression (SK4-OE) and negative control (NC) samples with three biological replicates. For each sample, 1 µg of total RNA was used as input for mRNAs capture by VAHTS mRNA capture Beads (N401, Vazyme, Nanjing, China). RQ1 DNase (Promega, Madison, WI, USA) was then used to remove DNA and purify RNAs, which were used for directional RNA-seq library preparation by VAHTS Universal V8 RNA-seq Library Prep Kit for Illumina (NR605). Briefly, the captured mRNAs were purified, fragmented, and converted into double strand cDNA, which were then ligated to adaptor (N323). The 300–500 bps ligated products were amplified, purified, quantified, and stored at −80 °C. The prepared libraries were applied to Illumina Novaseq 6000 system (Novogene, Sacramento, CA, USA) for 150 nt paired-end sequencing following the manufacturer’s instructions.
Quality filtering and alignment of RNA-seq data
We used FASTX-toolkit (version 0.0.14) to obtain high-quality reads from RNA-seq raw data. We removed library adaptor, trimmed the low-quality bases (quality score < 20), discarded low-quality reads (quality score of over 30% bases less than 20), discarded reads with ambiguous bases (N), and finally kept reads longer than 16 nt. Then we aligned the reads onto human genome (GRCh38) using HISAT2 software (Kim et al., 2019) with one mismatch as the threshold. To calculate gene expression levels, we selected aligned reads with only one genomic location, and calculated fragments per kilobase of transcript per million fragments (FPKM) as the normalized value of gene expression. We used RNASeqPower to estimate the power for sample size and finally got a 0.98 power value. Principal component analysis (PCA) was performed to analyze sample similarity based on all expressed genes.
Differentially expressed gene analysis
To analyze SK4-regulated gene expression pattern, we used the DESeq2 method (Love, Huber & Anders, 2014) to identify differentially expressed genes (DEGs) by importing the raw reads count of all detected genes. As SK4 did not globally regulate gene expression pattern, we set p-value < 0.05 and fold change > 1.5 as the criteria for DEGs.
Alternative splicing analysis
For alternative splicing (AS) analysis, splicing junction reads were extracted based on the alignment result by HISAT2. We then used the splicing junction reads and human gene structure annotation to analyze the AS events (ASEs) by ABLas program (Xia et al., 2017). According to the isoforms of transcript, ASEs were classified into nine types: alternative 3′ splicing site (A3SS), alternative 5′ splicing site (A5SS), exon skipping (ES), cassette exon, mutually exclusive exon (MXE), A3SS&ES, A5SS&ES, 5′ MXE (5pMXE), and 3′ MXE (3pMXE). To identify SK4-regulated ASEs (RASEs), we calculated the difference and statistical significance of AS ratios between SK4-OE and NC samples, and selected the ASEs with p-value < 0.05 as RASEs. The genes containing RASEs were regarded as regulated alternative splicing genes (RASGs) by SK4-OE.
RT-qPCR validation for DEGs and RASEs
To validate the DEGs and RASEs between SK4-OE and NC in BHT101 cells, we designed specific primers and performed reverse transcription and quantitative polymerase chain reaction (RT-qPCR) for them. For RASEs, we used a boundary-spanning primer for the junction of constitutive exon and alternative exon (alternative spliced exon, AS) and an opposing primer for a constitutive exon (model exon, M) to detect the alternative isoform. The cDNA synthesis was done following the procedures of RNA-seq library preparation. The quantitative PCR was performed by denaturing at 95 °C for 10 min, and annealing and extension at 60 °C for 1 min on the ABI QuantStudio 5. Each sample had three technical replicates. Each transcript was then normalized to GAPDH (glyceraldehyde-3-phosphate dehydrogenase) mRNA level using 2−ΔΔCT method (Livak & Schmittgen, 2001). Comparisons were performed with the two-way ANOVA or the paired Student’s t-test with p-value < 0.05 as statistical difference. The information of primers is presented in Table S8.
Other analysis and statistical methods
The expression and promoter methylation levels of SK4 in thyroid carcinoma (THCA) were assessed by UALCAN tool (Chandrashekar et al., 2022) using the data from The Cancer Genome Atlas (TCGA) database. The immune cell infiltration correlation with SK4 expression was calculated by the TIMER2.0 online software (Li et al., 2020) with default parameters. Gene Ontology (GO) and Kyoto Encyclopedia of Genes and Genomes (KEGG) pathways were identified to sort out the functional categories of DEGs with the KOBAS server (version2.0, Beijing, China) (Xie et al., 2011). Other statistical and analysis methods were done using the R software (version 4.2). The error bar in each figure represents a standard error of the mean.
Results
SK4 was upregulated and associated with immune infiltration in thyroid cancer samples
Previous study has demonstrated the association between SK4 expression and PTC progression (Wen et al., 2020). By using the UALCAN tool (Chandrashekar et al., 2022), we observed a significant increase of SK4 in THCA, and the expression level of SK4 in normal samples was extremely low (Fig. 1A). By classifying the THCA samples into different stages, the significant upregulation of SK4 expression was observed in all the four stages compared with the normal samples (Fig. 1B). The promoter methylation level analysis of SK4 demonstrated a higher methylation level in normal samples (Fig. 1C), indicating that the high expression of SK4 in THCA samples may be attributed to its low promoter methylation level. Then, we explored the association between SK4 expression and immune cell infiltration by using TIMER2.0 software (Li et al., 2020). The results demonstrated that SK4 expression was positively correlated with the infiltration levels of myeloid dendritic cell, Macrophage M1, cancer associated fibroblast, T cell natural killer (NK), T cell regulatory, memory B cell, and monocytes (Figs. 1D–1J, Table S1), while SK4 was negatively correlated with that of endothelial cell (Fig. 1K, Table S1) in THCA. Taken together, these results demonstrated that SK4 expression is highly associated with THCA progression probably by increasing the infiltration of cancer-associated immune cells in PTC tissue.
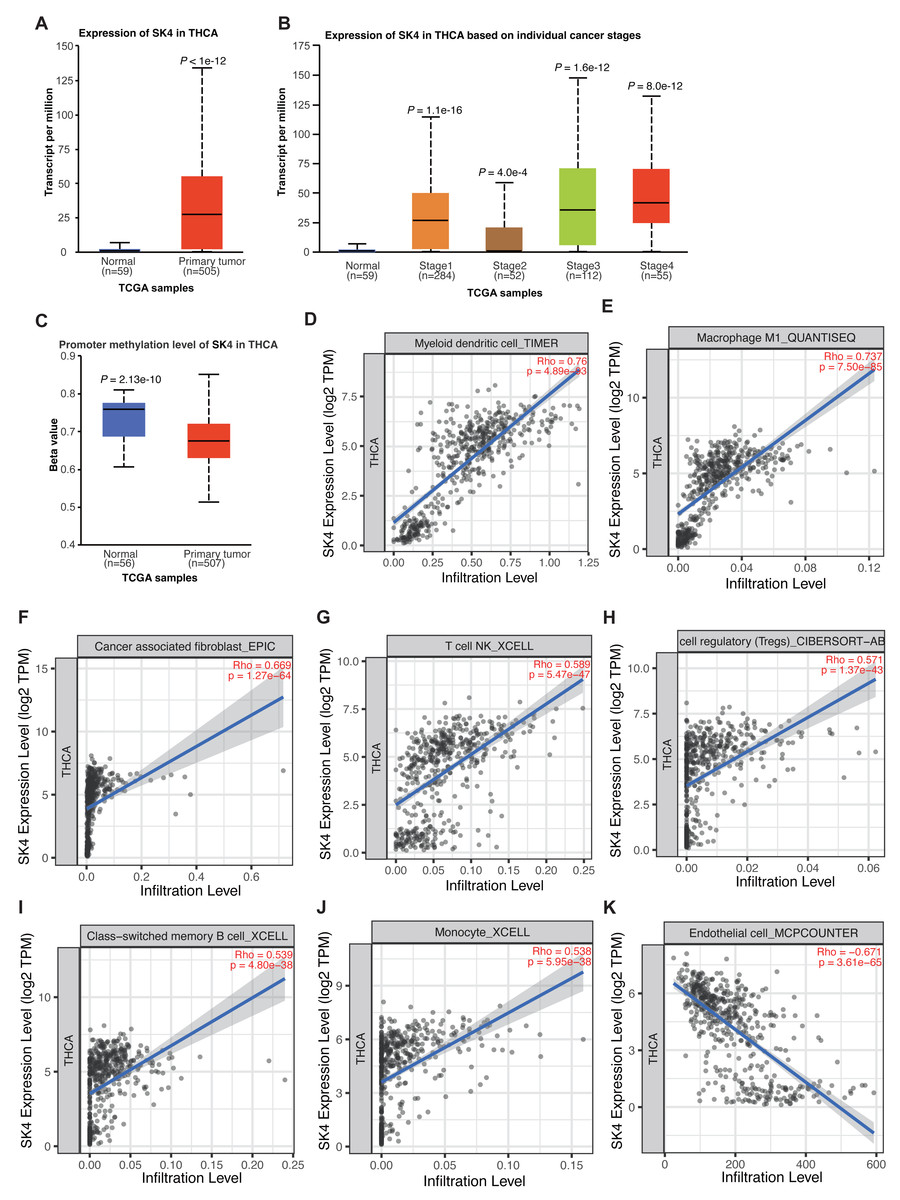
Figure 1: SK4 expression was increased in the tumor samples of thyroid cancer patients.
(A) Box plot showing the overall increase of SK4 expression in tumor samples from THCA patients. (B) Box plot showing that SK4 expression was consistently increased in the four stages of THCA patients. (C) Box plot showing the decreased methylation level at the promoter region of SK4 in tumor samples from THCA patients. (D–J) Correlation plot showing the positive association between SK4 expression and various immune cell infiltration levels in THCA samples. Rho was correlation coefficient, and p was the statistical p-value. (K) The same as (D–J) but for the negative association between SK4 expression and endothelial cell levels.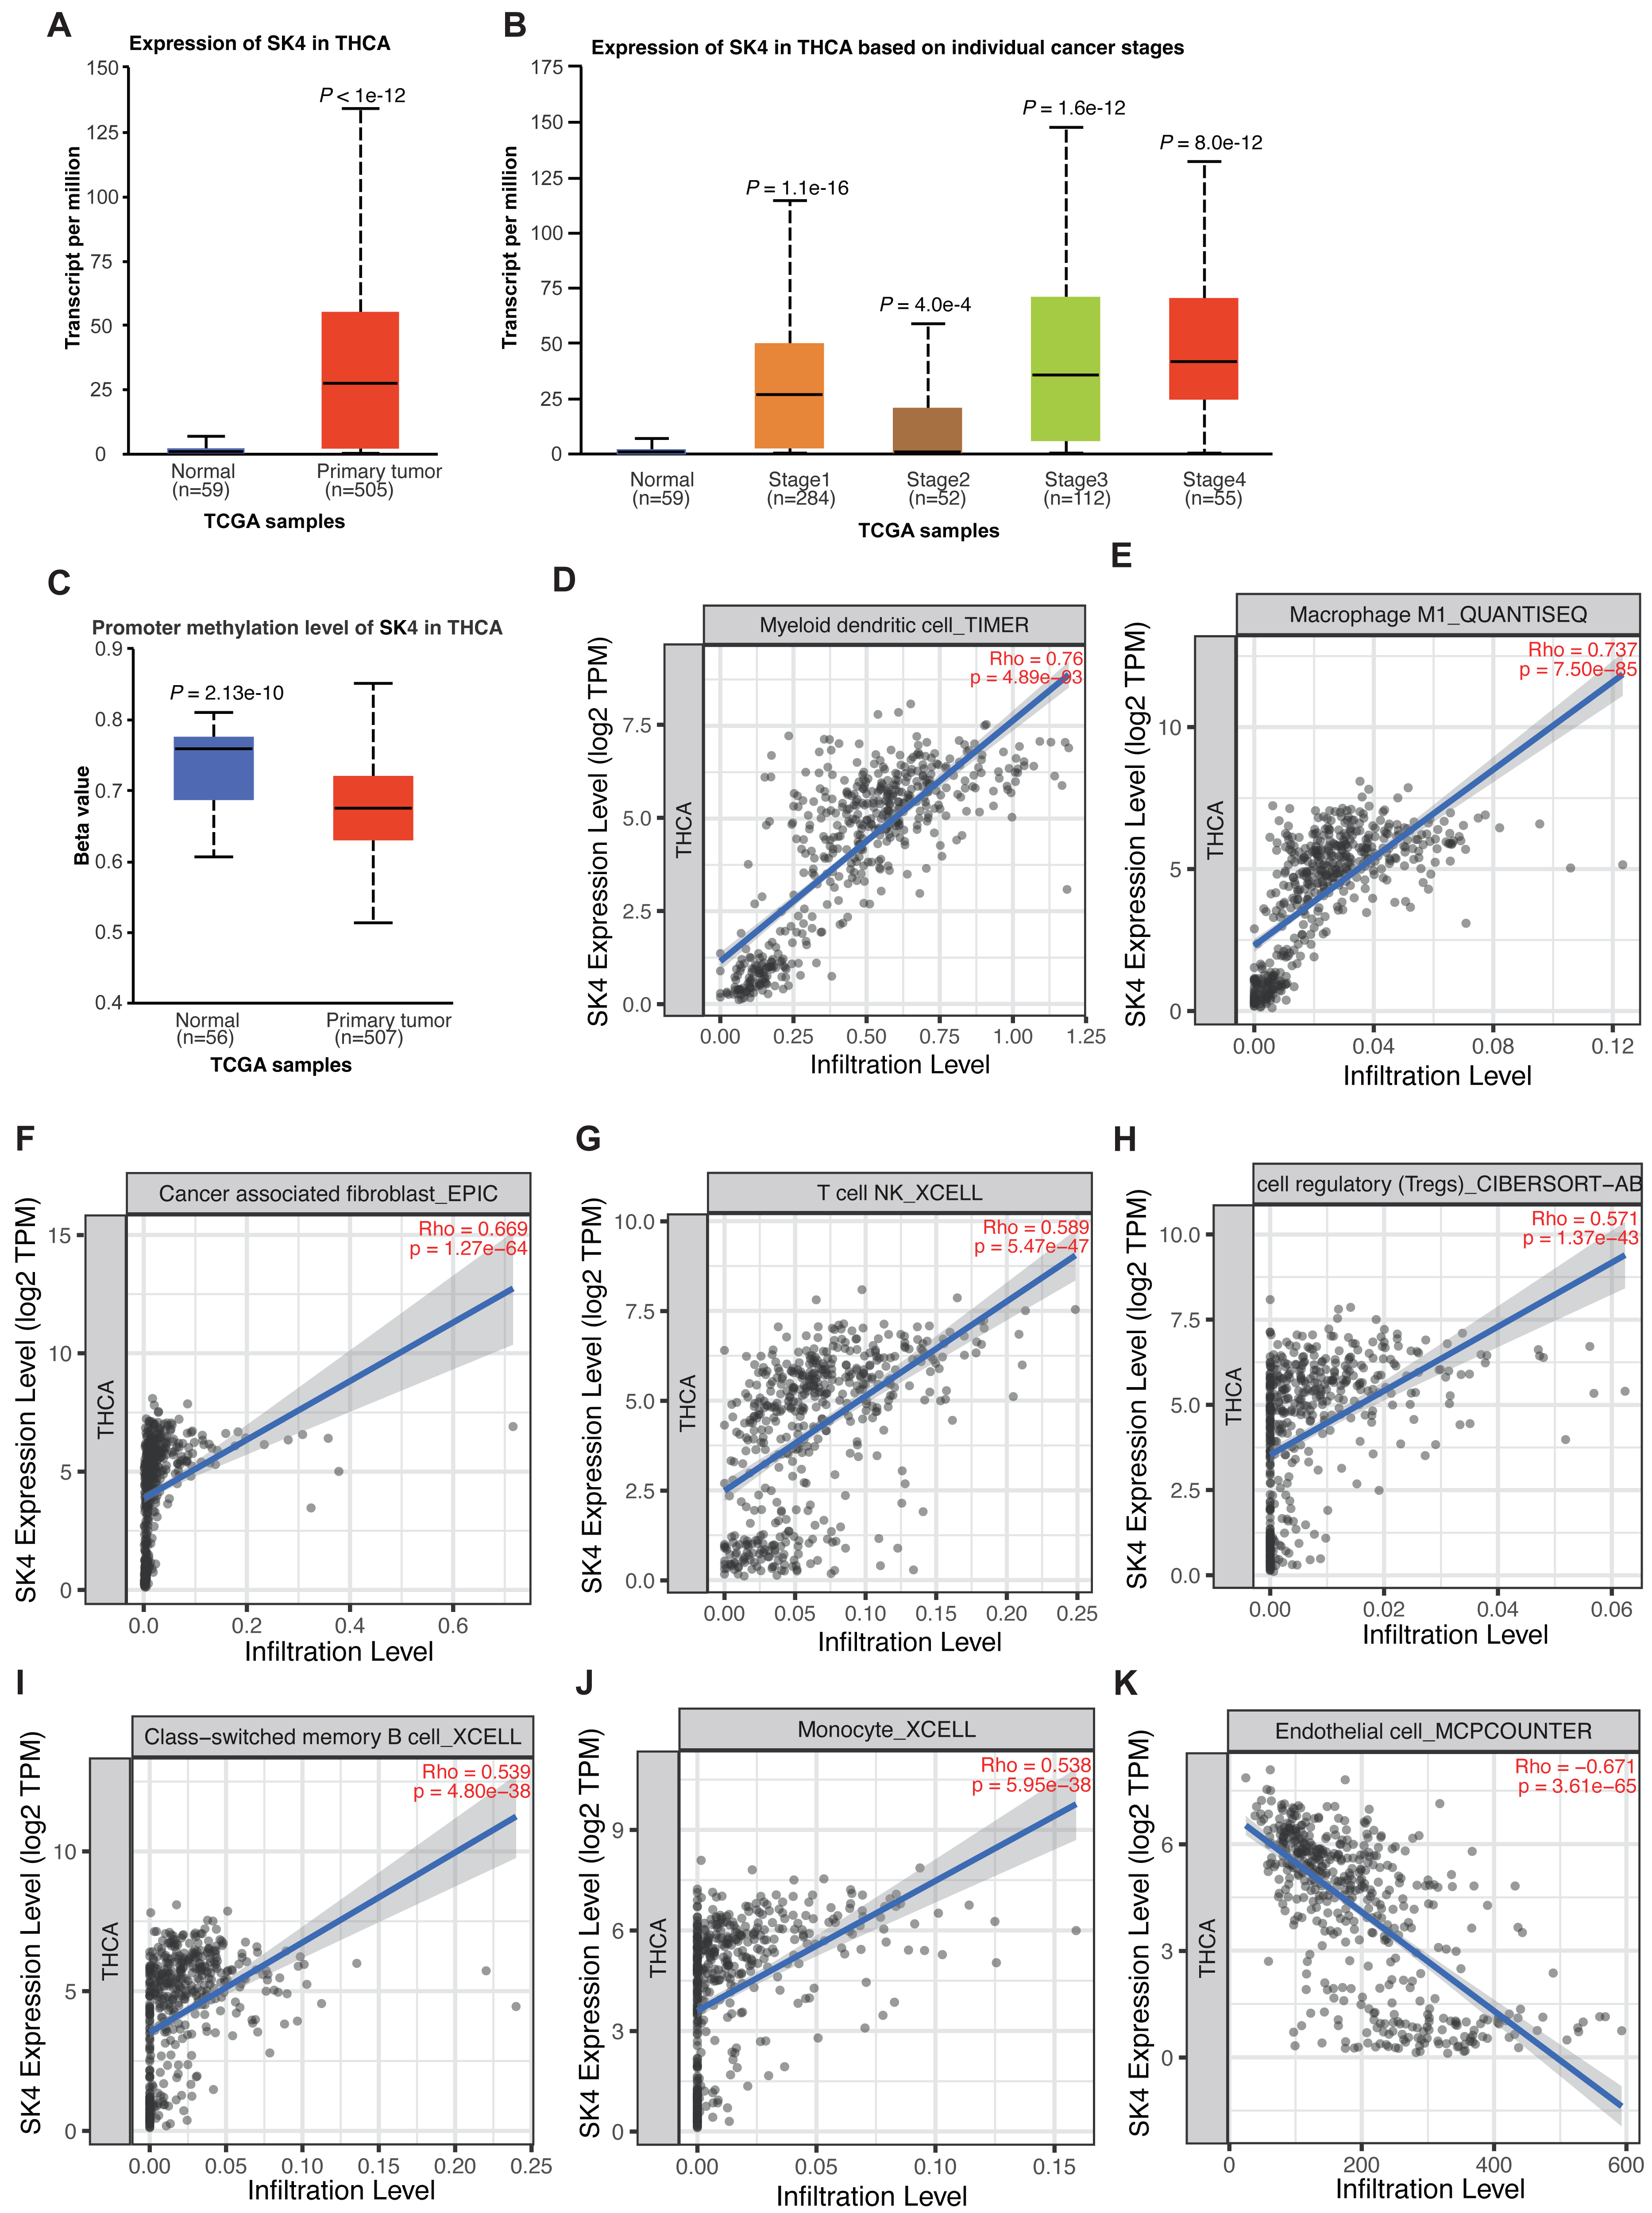
SK4 overexpression increased the proliferation and invasion abilities of BHT101 cells
To understand the function and underlying mechanisms of SK4 in PTC, we increased its expression level by transforming the SK4-OE plasmid into the BHT101, an undifferentiated human thyroid cancer cell line. The empty plasmid was used as the NC. After transfection, we performed RT-qPCR and WB experiment to check the overexpression result, and found SK4 expression was significantly increased in SK4-OE samples (Figs. 2A–2B). Then we performed cellular proliferation and invasion experiments to investigate the influence of SK4-OE on BHT101 cells. The cellular proliferation result showed that SK4-OE significantly increased the proliferation level of BHT101 cells (Fig. 2C). Then we assessed if SK4-OE could alter the invasion ability of BHT101 cells. We found the invaded cells were much more in SK4-OE samples than that in NC samples (Fig. 2D). In summary, these results together demonstrated that SK4 could increase the pro-oncogenic ability in BHT101 cells, and thus may promote PTC development and progression.
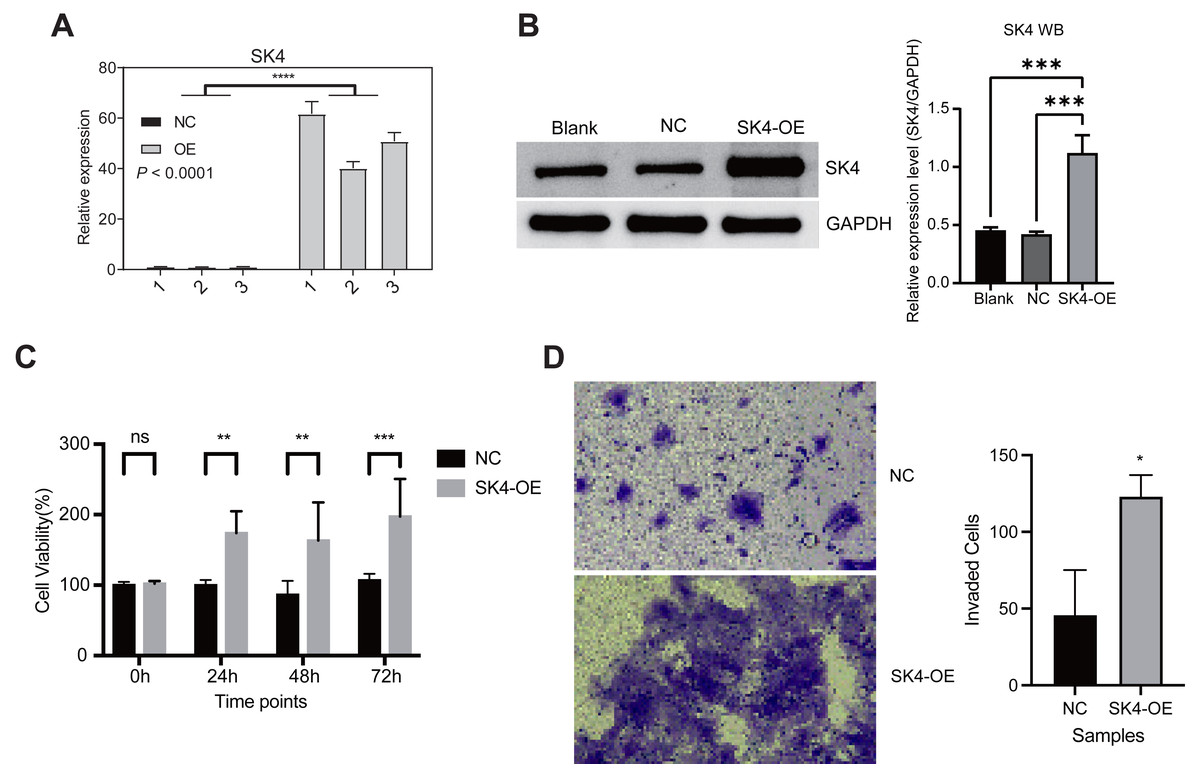
Figure 2: SK4 overexpression increased the proliferation and invasion levels of BHT101 cells.
(A) Bar plot showing the RT-qPCR result for SK4 overexpression experiment in BHT101 cells. (B) Western blot and quantitative results for SK4 overexpression in BHT101 cells. ***p-value < 0.001; One-way ANOVA test. (C) Bar plot showing the increased cell viability feature in SK4-OE BHT101 cells. Ns: non-significant; **p-value < 0.01; ***p-value < 0.001; **** p-value < 0.0001; Student’s t-test. (D) Cell invasion experiment demonstrated the increased invasion ability of SK4-OE BHT101 cells. Right panel was the quantitative result. *p-value < 0.05; Student’s t-test.
SK4 slightly modulate the expression profile of BHT101 cells by RNA-seq analysis
To further identify how SK4 affects the development and progression of PTC, we performed RNA-seq experiment based on the SK4-OE and NC cells with three biological replicates. The sequenced reads showed high quality with over 99% raw reads passing the quality filtering step (Table S2). By aligning the RNA-seq reads onto the human genome (Table S3), we found most of the aligned reads came from the transcribed regions, including coding sequence (CDS) and 3 prime untranslated-region (3′ UTR) as the two dominant regions (Fig. 3A). FPKM value of SK4 also showed significant increase in SK4-OE samples (Fig. 3B). Then PCA was conducted to assess the sample similarity for the two groups. The results demonstrated that SK4-OE and NC samples could not be clearly separated based on the top two principles (Fig. 3C), indicating that SK4-OE did not globally change the expression profile of BHT101 cells. The sample correlation analysis demonstrated similar result with that of PCA (Fig. 3D). Then we performed DEGs analysis with fold change > 1.5 and p-value < 0.05 as criteria, and identified 97 DEGs, including 48 up-regulated DEGs and 49 down-regulated DEGs (Fig. 3E, Table S4) Meanwhile, we found that the identified DEGs showed obvious difference between SK4-OE and NC samples (Fig. 3F). Then we analyzed the enriched functions of DEGs using the GO and KEGG databases. For down DEGs, they were mapped to integral component of membrane, nucleus, plasma membrane, membrane, and cytoplasm GO cellular component pathways (Fig. S1A), and mapped to DNA binding, protein binding, and metal ion binding GO molecular function pathways (Fig. S1B). For up DEGs, we found that they were significantly enriched in negative regulation of apoptotic process GO biological process pathway (Fig. 3G), including five genes, VTCN1, MSX1, FATE1, TEK, and PRAMEF2. For KEGG pathway analysis, down DEGs were mapped to several pathways, including primary bile acid biosynthesis and cytokine–cytokine receptor interaction (Fig. S1C). Up DEGs were mapped to several cancer associated pathways, including HIF-1 signaling pathway and thyroid cancer (Fig. 3H), indicating that SK4-OE could enhance the expression level of several genes associated with thyroid cancer. The included genes in up KEGG pathways were EDN1, TEK, RXRG, CCL4L2, and KCNN4. In summary, the DEG results suggest that SK4 could affect expression of a small set of genes that were associated with cancer development, indicating a potential novel regulatory mechanism for SK4 in BHT101 cells and PTC.
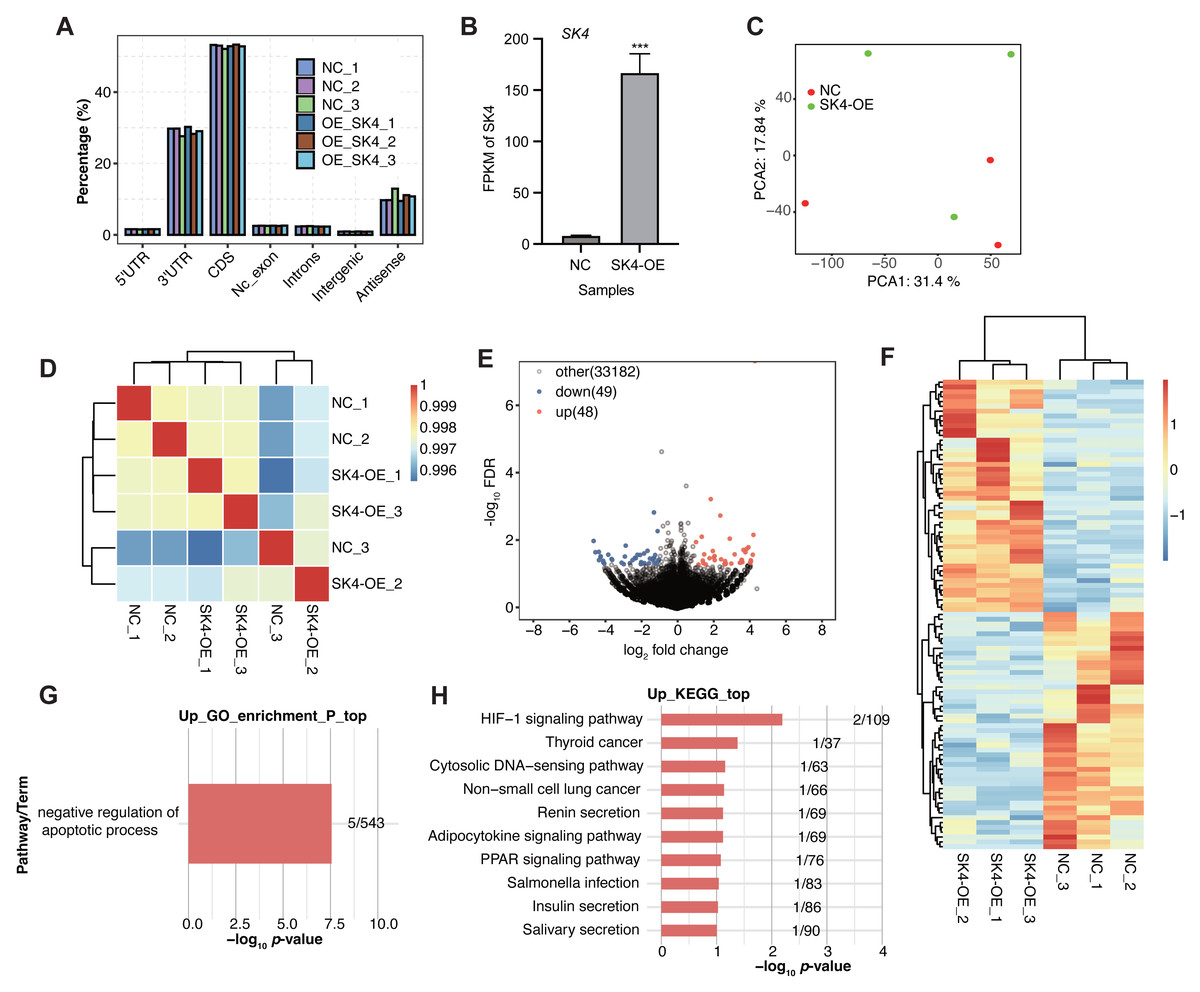
Figure 3: SK4-OE modulated expression of dozens of genes associated with cancer progression.
(A) Bar plot showing the genomic distribution of aligned reads in the six samples. (B) Bar plot showing the FPKM values of SK4 in SK4-OE and NC samples. (C) PCA result showing the distribution of six samples based on the top 2 principal components. (D) Hierarchical clustering heatmap showing the correlation of the six samples. (E) Volcano plot showing the up and down DEGs between SK4-OE and NC groups. (F) Hierarchical clustering heatmap showing the expression pattern of up and down DEGs. (G) Bar plot showing the enriched GO BP pathways for up DEGs. (H) Bar plot showing the top ten KEGG pathways for up DEGs.
Validation of SK4-regulated DEGs by RT-qPCR experiment
To validate the SK4-regulated DEGs, we selected six DEGs with important functions and performed RT-qPCR experiment for them, including VTCN1, MSX1, EDN1, SLC29A4, RP11-473M20.16, and CH507-513H4.4. Among them, VTCN1, MSX1, EDN1, and SLC29A4 were mRNAs, while RP11-473M20.16 and CH507-513H4.4 were lncRNAs. By performing RT-qPCR experiment, we found that the expression levels of most of the DEGs showed significant changes and were consistent with the RNA-seq result (Fig. 4). Only the RT-qPCR result of MSX1 were non-significant because of the variation within NC samples (Fig. 4, last panel).
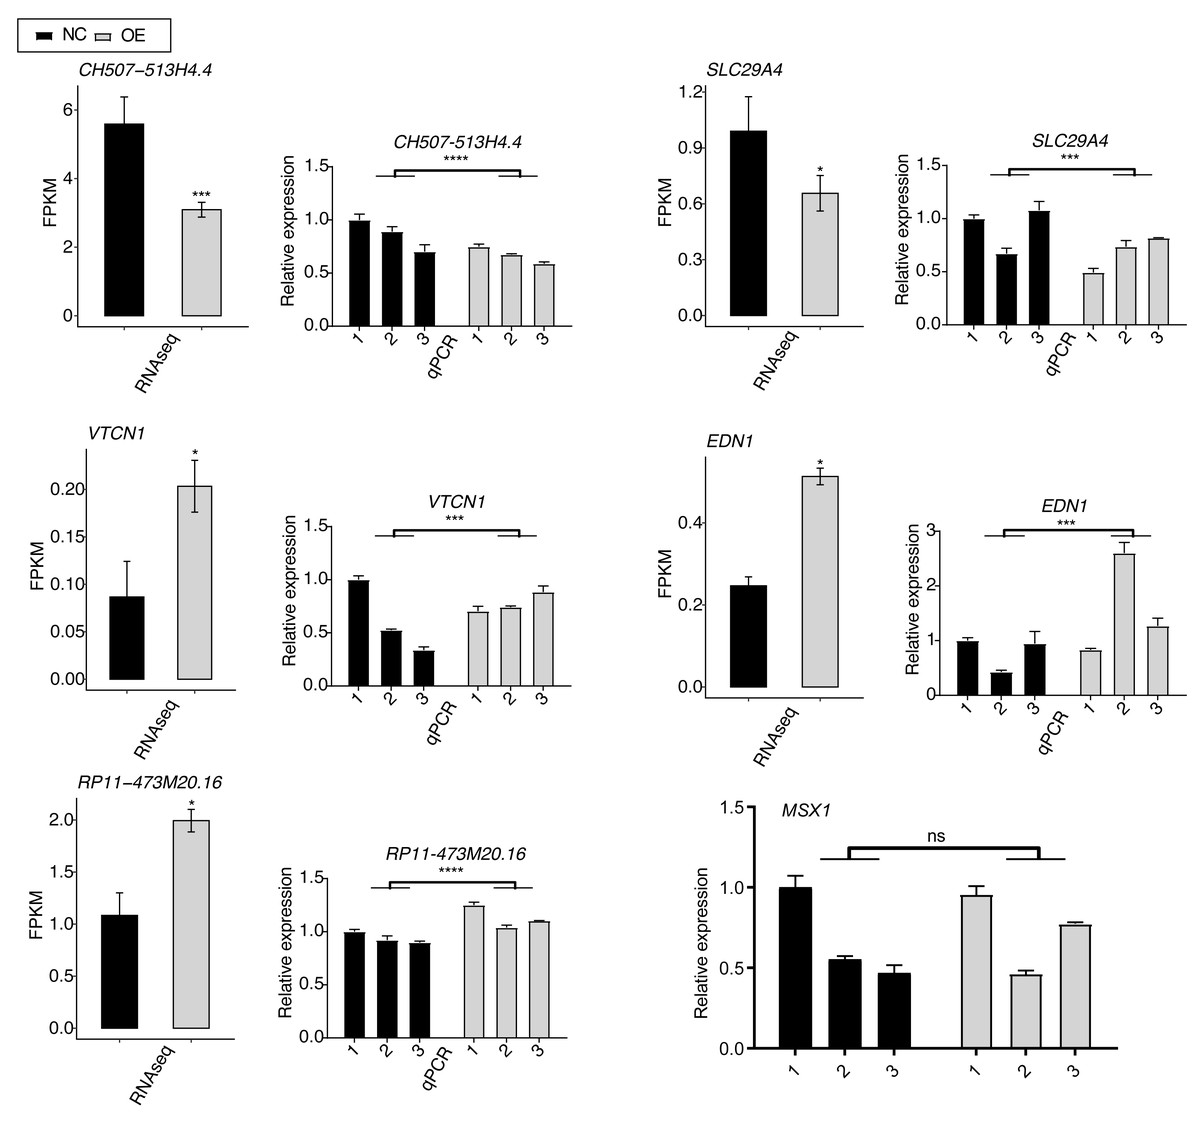
Figure 4: RT-qPCR validation for SK4-regulated DEGs between SK4-OE vs. NC samples.
RNA-seq and RT-qPCR results were shown and consistent for the first five genes. RT-qPCR result was shown for MSX1 gene. ns: not significant, *p-value < 0.05, ***p-value < 0.001, ****p-value < 0.0001, two-way ANOVA and Student’s t-test for RT-qPCR and RNA-seq, respectively.
SK4-OE globally regulated the alternative splicing profile of BHT101 cells
It has not been reported that SK4 could modulate AS of primary transcripts. Meanwhile, AS dysregulation was reported to be associated with carcinogenesis and prognosis of PTC (Zheng et al., 2021). We observed that about 42∼44% aligned reads were spliced (Table S3), indicating the abundant AS events in the RNA-seq data. Based on the above cognition, we explored the dysregulated AS profile by SK4-OE in BHT101 cells. We utilized ABLas program (Xia et al., 2017) to identify ASEs, as well as the SK4-RASEs between SK4-OE and NC samples (Table S5). Among the detected ASEs, novel ASEs were also with a large percentage, especially in the two dominant ASEs, A3SS and A5SS (Fig. 5A). Then we predicted the RASEs that were significantly regulated between SK4-OE vs. NC samples with p-value < 0.05 as threshold, and identified 1,639 RASEs, including 819 included and 820 excluded RASEs (Fig. 5B, Table S6). Then we plotted the pattern of RASE ratios and found these RASEs were consistently dysregulated by SK4-OE in BHT101 cells (Fig. 5C). To further associate the dysregulated AS pattern with SK4 functions, we performed functional enrichment analysis for RASGs. GO enrichment analysis demonstrated they were significantly enriched in cellular response to DNA damage stimulus, viral process, DNA repair, translation, protein import into peroxisome matrix, and other pathways (Fig. 5D, Table S7). KEGG analysis reviewed that RASGs were mapped to base excision repair, ribosome, pyrimidine metabolism, DNA replication, peroxisome, and other pathways (Fig. 5E). We found that DNA damage and repair pathways were among the top enriched pathways for both GO and KEGG results (Figs. 5D–5E). DNA damage and repair are major culprit in cancer development and progression (Hoeijmakers, 2009), indicating that SK4 may promote PTC progression by DNA damage/repair pathway. We finally used RT-qPCR to validate the dysregulated AS ration of RASEs, and selected the cassette exon event from TMEM116 as an example (Fig. 5F). TMEM116 has been identified as an oncogene that could promote cell motility and metastasis of lung cancer cells via PDK1 signaling pathway (Zhang et al., 2021). These results indicate that AS dysregulation can probably act as the functional manner for SK4 to regulate the development or progression of PTC.
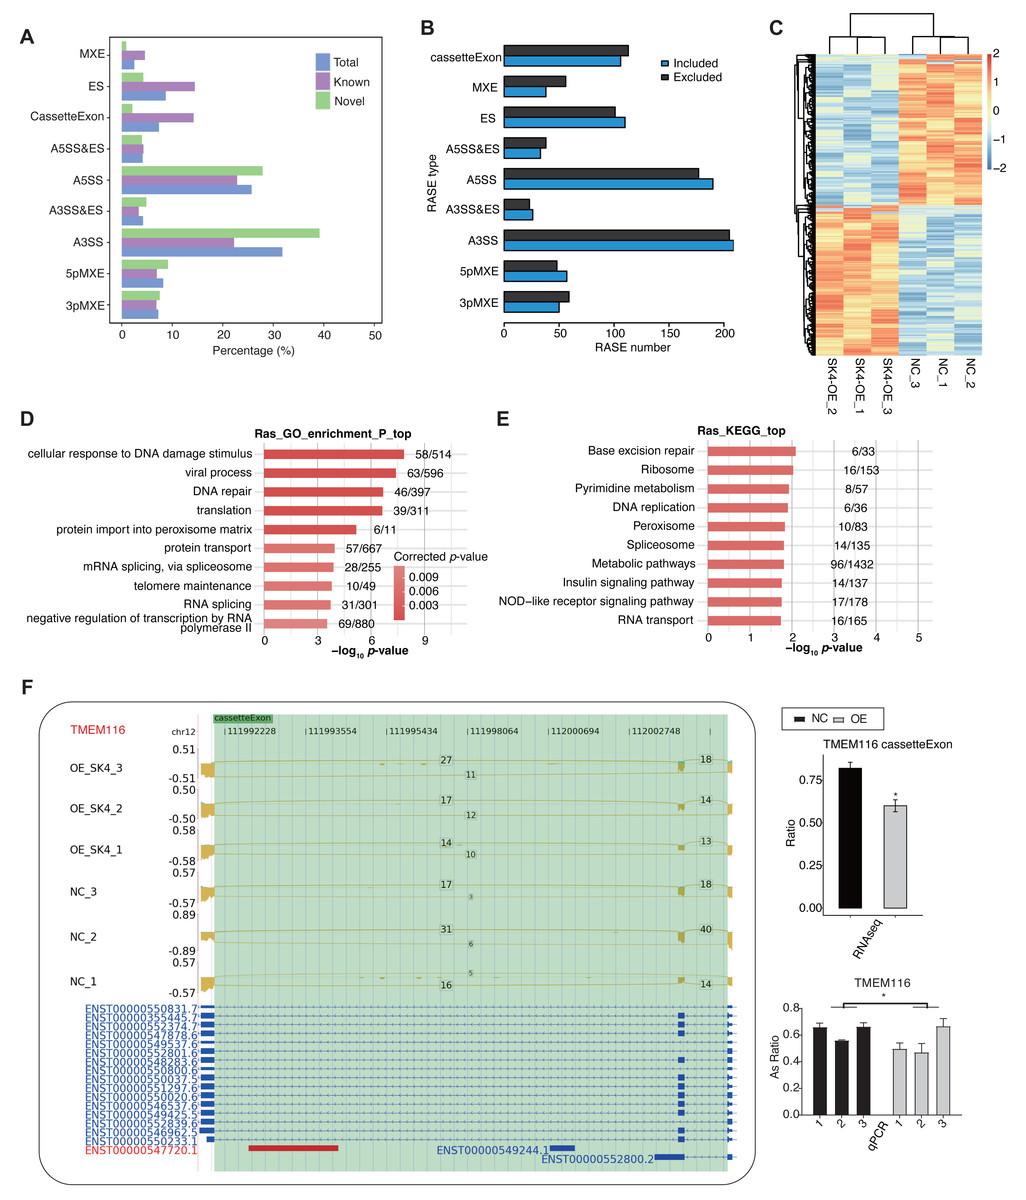
Figure 5: SK4-OE globally changed the alternative splicing pattern of BHT101 cells.
(A) Bar plot showing the types and percentages for all detected ASEs, including known, novel and combined total ASEs. (B) Bar plot showing the types and numbers for RASEs by SK4-OE, including the included and excluded RASEs. (C) Hierarchical clustering heatmap showing the changed pattern of all RASEs based on their AS ratios. (D) Bar plot showing the top ten enriched gene ontology biological process (GO BP) pathways for RASGs. (E) Bar plot showing the top ten KEGG pathways for RASGs. (F) Validation for the dysregulated cassette exon event of TMEM116 by RT-qPCR. Left panel showed the reads density and splicing reads number, as well as the transcript structure for the target RASE of TMEM116. Right panel showed the RNA-seq (top) and RT-qPCR (bottom) statistical result for AS ratio. *p-value < 0.05, two-way ANOVA and Student’s t-test for RT-qPCR and RNA-seq, respectively.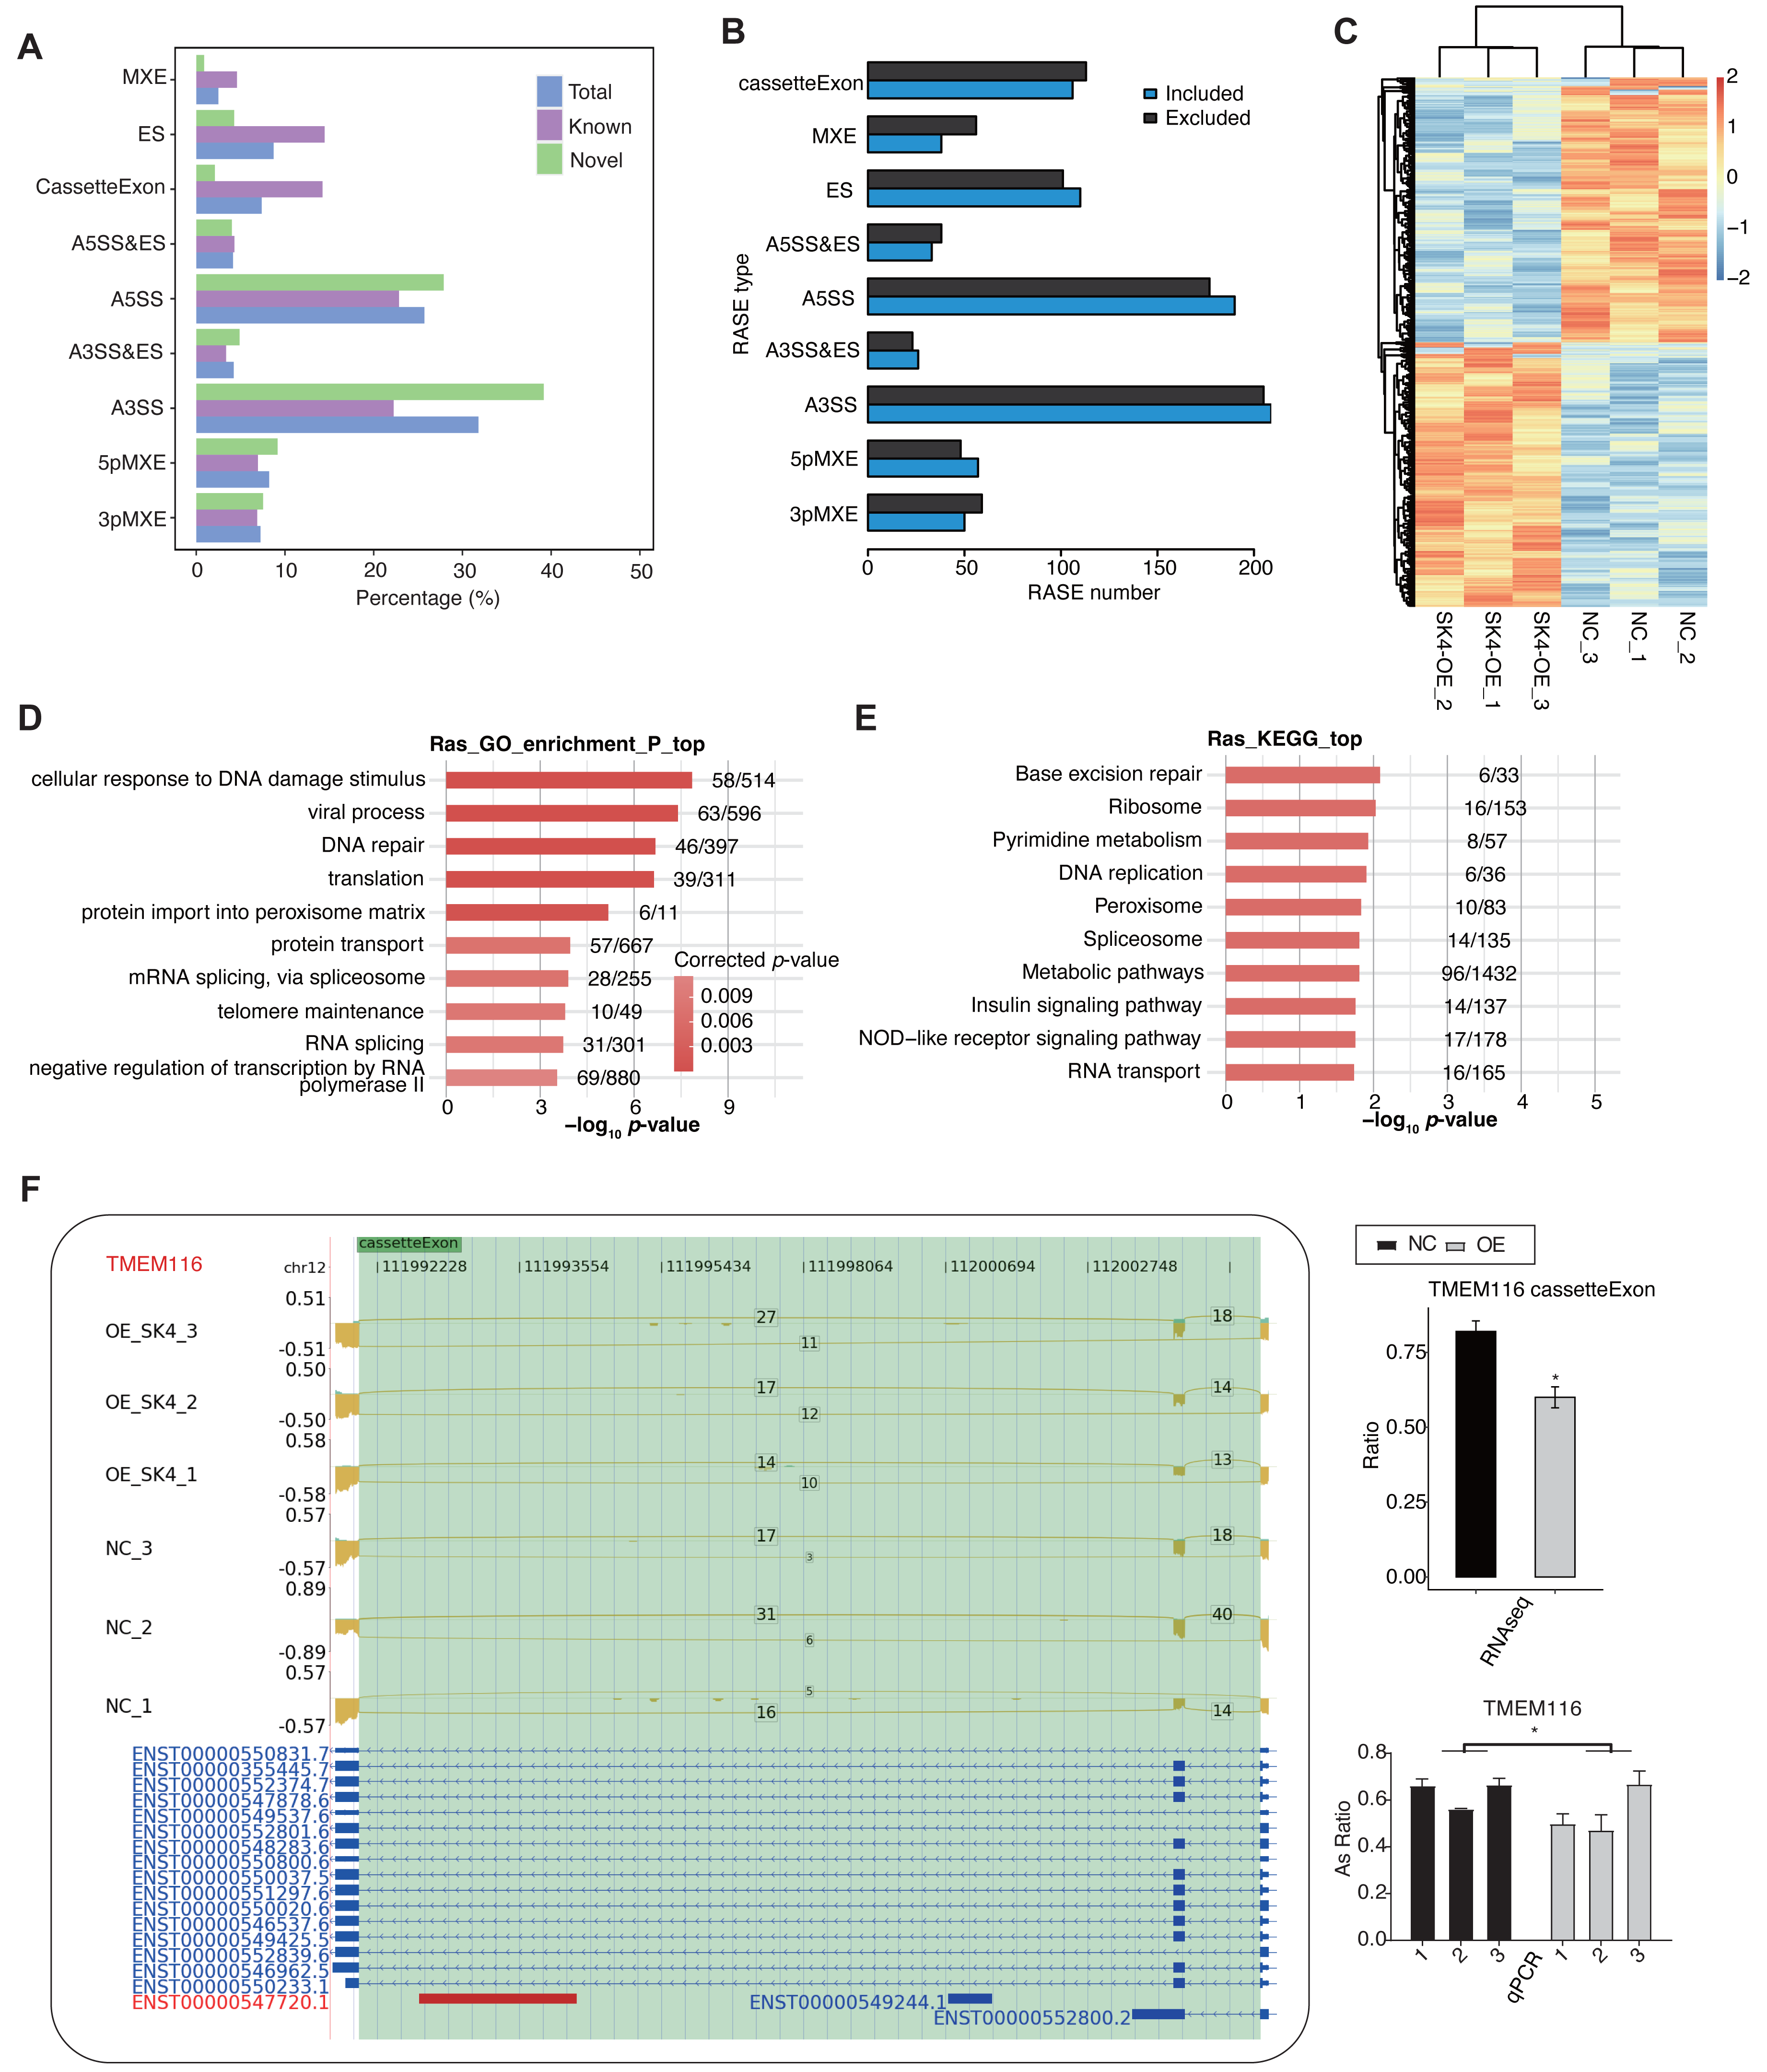
SK4 modulates AS profile by altering the AS pattern of spliceosome genes
At the same time, we observed that spliceosome or splicing via spliceosome was also emerged in the top 10 GO and KEGG pathways (Figs. 5D–5E). The proteins from spliceosome have essential roles in the AS regulation of primary RNAs (Wilkinson, Charenton & Nagai, 2020). We selected the splicing-associated pathways and genes from GO and KEGG databases, and found four pathways and 41 splicing-regulatory genes (Table 1). The splicing pattern of these 41 genes was significantly dysregulated between SK4-OE and NC samples (Fig. 6A). Among these splicing regulatory genes, we selected several genes and validated their dysregulated AS patterns using RT-qPCR method, including U2AF1L4, RBM39, and RBM6. We found the AS ratio was significantly changed for the RASEs from RBM39 and RBM6 (Figs. 6B–6C), indicating that these two AS regulators may have important functions in PTC. RBM39, as a splicing factor and transcription coactivator, has been identified as an immunological and prognostic biomarker in multiple cancer types (Zhang et al., 2022). Meanwhile, RBM6 participates in the AS regulation of the Notch pathway regulator NUMB to modulate cancer cell proliferation (Bechara et al., 2013). In summary, we propose that SK4 could probably regulate global AS profile through modulating the splicing of other splicing factors.
| Pathways (Database) | P-value | Genes |
|---|---|---|
| mRNA splicing, via spliceosome (GO) | 1.26e−4 | RBM6, CSTF1, SF3B3, WDR83, TXNL4A, CWF19L1, ESS2, SRSF3, PRPF31, PRPF40A, PCBP2, HNRNPA2B1, HNRNPD, SMNDC1, HNRNPA1, USP39, IK, SNRPN, HTATSF1, POLR2H, RBM41, RALY, PRCC, SRRM2, MAGOHB, U2AF1L4, DDX5, BUD31 |
| RNA splicing (GO) | 1.82e−4 | CIR1, ZRANB2, AAR2, SF3B3, WDR83, FMR1, TXNL4A, ESS2, SRSF3, PRPF31, PRPF40A, HNRNPA2B1, PPP1R9B, RBM39, PPIG, NSRP1, SMNDC1, HNRNPA1, LSM1, USP39, U2AF1L4, SNRPN, THOC2, NOL3, RALY, SRRM2, MAGOHB, IK, DDX5, RBM23, BUD31 |
| RNA splicing, via transesterification reactions (GO) | 0.008 | SMNDC1, TXNL4A, LSM1, SF3B3, WDR83 |
| Spliceosome (KEGG) | 0.01 | SRSF3, USP39, SMNDC1, PRPF31, HNRNPA1, MAGOHB, PRPF40A, THOC2, DDX5, U2AF1L4, SF3B3, ISY1-RAB43, BUD31, TXNL4A |
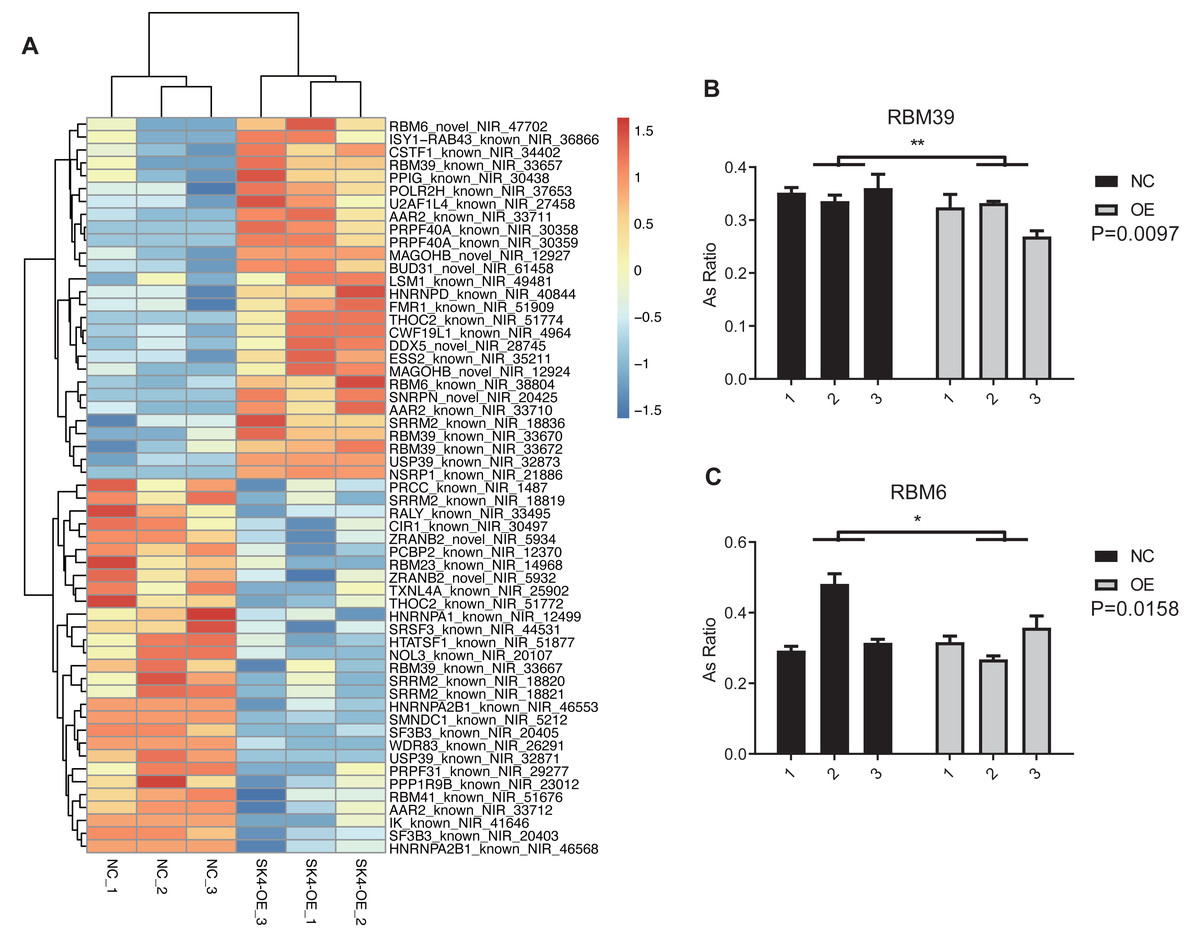
Figure 6: SK4-OE modulated the AS profile of 41 splicing regulators.
(A) Hierarchical clustering heatmap showing the changed pattern of RASEs from the 41 splicing regulators. (B) Bar plot showing the validation for the dysregulated ASEs of RBM39 by RT-qPCR. (C) Bar plot showing the validation for the dysregulated ASEs of RBM6 by RT-qPCR. *p-value < 0.05, **p-value < 0.01, two-way ANOVA test.
Discussion
In this study, we performed experiments to investigate the molecular functions of SK4 in BHT101 cells. Besides the influence on cellular behaviors, we excitedly found that the transcriptome profile, especially the AS pattern, was globally regulated by SK4-OE, implying the moonlight functions of SK4 in transcriptome regulation. Although the cellular functions of SK4 have been investigated in several cancers, including PTC (Wen et al., 2020), kidney renal clear cell carcinoma (Chen et al., 2021b), and breast cancer (Steudel et al., 2017), we validated that SK4 overexpression promoted cell proliferation and invasion in BHT101 cells, confirming its functions in PTC tumor cells. More importantly, we systematically investigated the SK4-regulated transcriptome and identified its downstream targets, a large part of which were associated with cancer development or progression. Meanwhile, the RASGs contained plenty of genes involving in AS regulation, indicating a possible manner for SK4 in regulating thousands of RASEs in BHT101 cells. In summary, these results highlight the underlying molecular functions and mechanisms of SK4 in BHT101 cells, indicating the potential application of SK4 in the development and treatment of PTC in future.
In the first part, we reported that complete repression of SK4 expression in normal thyroid samples but significant increase in tumor samples, the reason of which may be the decreased DNA methylation level at the promoter region of SK4. It is very interesting that SK4 expression was tightly associated with the immune cell infiltration, especially for several immune cell types. Previous study has demonstrated that SK4/KCa3.1 cooperates with Kv1.3 to regulate the function and activation of antigen-specific memory T cells (Chiang et al., 2017). Meanwhile, KCa3.1 channel activation could increase the ability of CD8+ T cells from head and neck squamous cell carcinoma patients to chemotax, suggesting the immune therapeutic potential of KCa3.1 channel in cancers (Chimote et al., 2018). The above results mostly explored the expression and function of SK4 in immune cells, while we constructed the relationship between SK4 and immune infiltration in PTC patients, suggesting that SK4 from other cells may also regulate immune cell functions. However, this hypothesis is not tested because the recent datasets have not checked the cellular communication for SK4. Following experiments, such as single cell RNA sequencing, could be used to identify the precise expression and communication of SK4 in individual cell types.
Based on the RNA-seq data of SK4-OE and NC samples, we could infer how SK4 affects the cellular behaviors and its downstream targets. From our results, we detected a few DEGs with loose criteria, implying the limited influence of SK4 on gene expression pattern. This result was consistent with the natural function of SK4 as a potassium calcium-activated channel protein that does not globally regulate transcriptome profile. Among the DEGs, we found several up DEGs were associated the cellular functions of SK4 in BHT101 cells. RXRG was upregulated by SK4-OE and came from the thyroid cancer pathway, indicating it is a SK4-regulated cancer gene in PTC (Chai, Li & Lv, 2016). Negative regulation of apoptotic process was the only enriched GO BP pathway for up DEGs, including five genes. The enriched pathway indicates that SK4 could upregulate these genes and inhibit the apoptotic process, thus promoting the proliferation level of BHT101 cells. Meanwhile, we validated several DEGs by RT-qPCR and found consistent dysregulation pattern between RNA-seq and RT-qPCR. Among the validated DEGs, VTCN1 has been identified as immune checkpoints and is associated with immune infiltration in THCA samples (Guo et al., 2023). Activation of EDN1, also known as ET1, and its receptors can modulate the phenotypes of cancers, including cell proliferation, apoptosis, migration, epithelial-to-mesenchymal transition, chemoresistance, and neovascularization (Rosano, Spinella & Bagnato, 2013). These results together indicate that SK4 can regulate PTC progression by modulating the expression levels of associated genes. Meanwhile, it is also necessary to confirm the above results by other experiments such as SK4 knockdown in BHT101 or other PTC cell lines.
Besides the DEGs, we observed that the AS dysregulation by SK4-OE was more remarkable than DEGs (Fig. 5). It is reported that SK4 itself has different isoforms and one of its isoforms, mKCa3.1b, can regulate thymocytes differentiation by down-regulation of mIL-2 transcripts, suggesting the important functions of AS in cellular states (Ohya et al., 2011). Meanwhile, another iron homeostasis regulator, TFRC, also extensively modulates alternative splicing profile in cancer and renal tubular mesangial cells by its transcriptome regulatory function (Huang et al., 2022; Li et al., 2023), indicating that ion transmembrane proteins have the functions in AS control for various cell types. We found several RASGs were enriched in cancer associated pathways. Besides the DNA damage/repair pathways, viral process was detected as the second enriched GO pathway. Although no direct evidence between the PTC pathogenesis and viral infection, one study has summarized the relationship between viral infections and risk of TC by meta-analysis, yielding the potential pathogenic association between viral infections, especially for SV40 and B19, and increased TC risk (Mostafaei et al., 2020). One group detected that 71.9% of included TC tumor samples contained Epstein–Barr virus which was associated with the development of TC (Moghoofei et al., 2019), indicating the virus involvement in TC pathogenesis. The AS pattern dysregulation of genes in viral progress by SK4-OE suggests a potential regulatory mechanism for SK4 in the virus-induced TC pathogenesis. We have pointed out the pathways of DNA damage/repair, a canonical topic and driving factor of tumor pathogenesis, in the results part. Previous studies mainly focused on the expression changes or DNA mutations of DNA damage response genes (Akulevich et al., 2009; Broustas & Lieberman, 2014), and DNA damage response has deeply influence on the constitutive and alternative splicing of genes (Shkreta & Chabot, 2015), while very few studies reported the AS dysregulation of transcripts of DNA damage/repair genes. The AS changes of DNA damage/response genes could also alter the functions of their encoded proteins, which may also contribute to the pathogenesis and progression of PTC. We also detected several cell cycle and cell migration associated pathways from RASGs (Table S6), illustrating the direct connection between RASGs and cellular behaviors influenced by SK4-OE.
Very interestingly, we finally focused on the dysregulated AS pattern of genes involved in AS regulation. As very few genes were altered at expression level, we propose that the global AS pattern alteration may come from other modulation layers. It has been reported that splicing alterations in cancers are mostly linked to the driver mutations in genes having essential functions in splicing machinery (Bonnal, Lopez-Oreja & Valcarcel, 2020). Meanwhile, it is well known that AS can also change the encoded amino acids and protein structure of transcripts, or even insert or delete important domains of translated proteins, resulting in a more pronounced functional alteration. We detected a total of 41 splicing regulatory genes that were modulated by SK4-OE at splicing level. These genes may extensively regulate AS pattern in BHT101 cells and amplify the final dysregulated AS profile between SK4-OE and NC samples, which is probably the underlying mechanism for SK4-modulated substantial AS events in BHT101 cells. Similar regulatory manner has been proposed for a keratin protein, KRT18, that modulates AS pattern of proliferation and apoptosis related genes, as well as the splicing regulatory genes in gastric cancer cells (Chen et al., 2021a). Further, this regulatory manner has been proposed by another recently published research that identified TRNAU1AP as an exon inclusion regulator by modulating the splicing of other splicing factors (Schmok et al., 2024). We validated several RASEs of genes from spliceosome or splicing factors, including RBM39 and RBM6, which are RNA-binding motif proteins and have important roles in tumor pathogenesis and development by modulating cell proliferation, migration, and apoptosis (Li et al., 2021). Although this regulatory mechanism is promising and credible, we have not validated the protein level changes of RASGs. Further experiments are needed to validate this hypothesis and make a sound conclusion for SK4-regulated AS profile in BHT101 and other PTC cell lines.
In summary, we systematically identified the downstream targets of SK4 in BHT101 cells, by which SK4 could participate in the progression of PTC. Among the identified DEGs and RASEs, we found SK4 preferred to modulate AS pattern other than the expression pattern, suggesting a novel regulatory mechanism for SK4 besides its canonical function in potassium channel. Meanwhile, the spliceosome-associated genes from RASGs could explain how SK4 regulates AS profile. In conclusion, our study extends the cognition about the functions and regulatory mechanisms of SK4 in BHT101 cells, and these identified molecules could be treated as potential targets for PTC therapy in future.
Supplemental Information
Functional analysis of down-regulated DEGs between SK4-OE vs. NC samples
(A) Bar plot showing the top GO cellular component pathways for down-regulated DEGs. (B) Bar plot showing the top GO molecular function pathways for down-regulated DEGs. (C) Bar plot showing the top KEGG pathways for down-regulated DEGs.