
Long non-coding RNA CYTOR promotes the progression of melanoma via the miR-485-5p/GPI axis
- Published
- Accepted
- Received
- Academic Editor
- Rohit Upadhyay
- Subject Areas
- Cell Biology, Molecular Biology, Oncology
- Keywords
- Melanoma, CYTOR, miR-485-5p, GPI
- Copyright
- © 2025 Lu et al.
- Licence
- This is an open access article distributed under the terms of the Creative Commons Attribution License, which permits using, remixing, and building upon the work non-commercially, as long as it is properly attributed. For attribution, the original author(s), title, publication source (PeerJ) and either DOI or URL of the article must be cited.
- Cite this article
- 2025. Long non-coding RNA CYTOR promotes the progression of melanoma via the miR-485-5p/GPI axis. PeerJ 13:e19284 https://doi.org/10.7717/peerj.19284
Abstract
Background
Recent research has underscored the critical role of long non-coding RNAs (lncRNAs) in tumorigenesis and malignancy development. Nevertheless, the role of lncRNA cytoskeleton regulator RNA (CYTOR) in the progression of melanoma remains only partially elucidated. This research seeks to explore the impact of CYTOR on melanoma development and to elucidate the molecular mechanisms involved.
Methods
In vitro and in vivo models were used to assess CYTOR expression levels by QPCR and Western blotting. Melanoma cell proliferation, migration, and invasion were assessed by CCK-8 assay, scratch wound assay and transwell invasion experiments. The mechanism of CYTOR promoting melanoma progression was verified in a xenograft tumor mouse model.
Results
Our investigation identified a marked increase in CYTOR expression levels in both melanoma tissues and cells. Experiments conducted both in vitro and in vivo revealed that CYTOR markedly stimulated melanoma cell proliferation, migration, and invasion. Dual-luciferase reporter assays confirmed the direct binding of miR-485-5p to CYTOR, and glucose-6-phosphate isomerase (GPI) was identified as a direct target of miR-485-5p.
Introduction
Cutaneous melanoma is a malignancy originating from skin melanocytes, with its incidence steadily rising, especially among Caucasians (Long et al., 2023). Each year, approximately 320,000 new cases of cutaneous melanoma are reported worldwide, leading to approximately 57,000 deaths (Sung et al., 2021). In Europe, melanoma incidence varies between 10 and 25 cases per 100,000 people, whereas in the United States, it falls within the range of 20 to 30 cases per 100,000 (Garbe et al., 2022). Melanoma is characterized by significant aggressiveness, with advanced stages prone to widespread metastasis, affecting the brain, liver, lungs, bones, and others (Achrol et al., 2019; Fornetti, Welm & Stewart, 2018; Kudchadkar et al., 2020; Tsilimigras et al., 2021).
Recent years have seen substantial improvements in melanoma detection and treatment, particularly in metastatic cases (Axelrod, Johnson & Balko, 2018). These advances are primarily driven by immune checkpoint inhibitors (ICIs), like anti-CTLA-4 and anti-PD-1/PD-L1 therapies, which enhance anti-tumor immunity. Clinical trials show ICIs significantly improve survival and response rates, with combination therapies demonstrating superior efficacy. Furthermore, biomarkers such as tumor mutational burden, PD-L1 expression, and immune cell infiltration aid in understanding patient responses to ICIs. Promising biomarkers have been linked to improved treatment responses in melanoma (Roccuzzo et al., 2024). Melanoma cells become resistant to BRAF inhibitor therapy due to mutations (i.e., BRAFV600E) which increase the frequency of RAF dimerization and promote MAP/ERK signaling (Roccuzzo et al., 2024). Approximately 15–20% of tumors display primary resistance and patients frequently develop acquired resistance via mechanisms such as MAPK/ERK pathway reactivation or the activation of alternative kinase signaling pathways, including PTEN, NF-1, and RAS. Furthermore, recent research highlights the critical roles of lncRNAs such as SAMMSON and POU3F3 in mediating melanoma drug resistance. Thus, identifying reliable biomarkers and potential therapeutic targets is critical for advancing both the diagnosis and treatment of melanoma.
LncRNAs are described as RNA sequences exceeding 200 nucleotides in length without protein-coding capacity, with the majority of their functions still unknown. However, a relatively small fraction of lncRNAs have been associated with a broad spectrum of biological processes via diverse molecular mechanisms. Dysregulated expression of various lncRNAs has been implicated in the progression of cancer (Ferrer & Dimitrova, 2024). For example, research suggests that lncRNA DLEU2 functions as a miR-30e-5p sponge, enhancing E2F7 expression and ultimately driving the advancement of esophageal cancer (Lu et al., 2020). Similarly, lncRNA ZFAS1 has been shown to enhance pancreatic cancer growth and metastasis through regulation of the miR-497-5p/HMGA2 axis (Rao et al., 2021).
Cytoskeleton regulator RNA (CYTOR), is a long intergenic non-coding RNA situated on chromosome 2p11.2, and is markedly expressed in various tumors, where it contributes to cellular proliferation, migration, and invasion (Wang et al., 2018; Yu et al., 2023). CYTOR is involved in regulating complex molecular signaling networks through epigenetic mechanisms, protein interactions, and by acting as a competitive endogenous RNA (ceRNA) (Xu et al., 2024). Prior investigations have shown that CYTOR enhances resistance to tamoxifen in breast cancer cells through sequestering miR-125a-5p (Liu et al., 2019). Additionally, CYTOR has been shown to promote cell growth and inhibit apoptosis in esophageal squamous cell carcinoma by functioning as a ceRNA for miR-15-3p, thereby regulating its target, FYN (Liu et al., 2019). Nonetheless, the functional role of CYTOR in melanoma remains largely unexplored.
Materials and Methods
Patient information
The study was approved by the Medical Ethics Committee of The Affiliated Hospital of Chengde Medical University (CYFYLL2023241) and conducted in accordance with the Declaration of Helsinki. All patients were informed with the study and the signed consent forms were obtained.
Expression profile analysis of CYTOR
GEPIA 2 (http://gepia2.cancer-pku.cn/) was applied to analyze the difference of CYTOR mRNA expression between melanoma tumor and non-tumor control tissues based upon the Cancer Genome Atlas (TCGA) and Genotype-Tissue Expression (GTEx) databases. |Log2FC| > 1 and p < 0.05 was considered as statistical significance. The “stage plot” module was selected, then we entered “CYTOR” and selected melanoma cancer to assess the correlation between CYTOR expression level and tumor pathological stages. The Kaplan–Meier (KM) plotter was used to analyze the prognostic value of CYTOR in melanoma.
Tissues and cells
Melanoma tissues and corresponding adjacent noncancerous tissues were obtained from the Affiliated Hospital of Chengde Medical University. None of the participants had received any preoperative anti-tumor treatments, including radiotherapy, chemotherapy, or surgery. This research received approval from the Ethics Committee of the Affiliated Hospital of Chengde Medical University (Approval No: CYFYLL2023241). All participants received informed consent. Clinical trial number: not applicable.
Four human melanoma cell lines (SK-MEL-28, MV3, A875, and A375), along with a normal human melanocyte cell line (PIG1), were procured from the Cell Bank of the Chinese Academy of Sciences (Shanghai, China).
Quantitative reverse transcriptase-PCR
Total RNA was isolated with TRIzol reagent (Invitrogen, Carlsbad, CA, USA). Complementary DNA (cDNA) was synthesized separately using the FastKing RT Kit (containing gDNase) (TIANGEN, Beijing, China) and miRcute Plus miRNA First-Strand cDNA Kit (TIANGEN, Beijing, China). All qPCR reactions were conducted in accordance with the manufacturer’s guidelines for the SuperReal PreMix Plus (SYBR Green) (TIANGEN, Beijing, China). The expression levels of CYTOR, glucose-6-phosphate isomerase (GPI), and miR-485-5p were normalized to either GAPDH or U6, as appropriate. The primers employed were as follows:
CYTOR: F: 5′-CCGAAAATCACGACTCAGCC-3′, R: 5′-CAGGCCCCAGGGAATCTTTC-3′;
miR-485-5p: 5′-CTGGCCGTGATGAATTCAAAA-3′;
U6: F: 5′-GGCTGGTAAGGATGAAGG-3′, R: 5′- TGGAAGGAGGTCATACGG-3′;
GPI: F: 5′- CCAGACCCAGCACCCCATA-3′, R: 5′-TCCGTCGATTTTCCCCTCA-3′.
RNA-fluorescence in situ hybridization
SK-MEL-28, MV3, A875, and A375 cells were fixed in 4% formaldehyde. Following this, the cells were rendered permeable through exposure to Triton X-100 for 5 min. They were then incubated with pre-hybridization buffer and exposed overnight to a 37 °C pre-hybridization buffer containing 20 μM CYTOR FISH probe (Servicebio, Wuhan, China). DAPI staining was applied and the cells were analyzed using a fluorescence microscope.
Transfection
The siRNA sequences (si-CYTOR-1: F: 5′-CCGUCUGCAUCCCUCGAAUTT-3′, R: 5′-AUUCGAGGGAUGCAGACGGTT-3′; si-CYTOR-2: F: 5′-GAAACCUCUUGACUCUUCUTT-3′, R: 5′-AGAAGAGUCAAGAGGUUUCTT-3′; si-CYTOR-3: F: 5′-GGCUUGAACAUUUGGUCUUTT-3′, R: 5′-AAGACCAAAUGUUCAAGCCTT-3′) targeting CYTOR were synthesized by GenePharma (Shanghai, China), with a scramble sequence serving as the negative control (NC). Full-length cDNA of CYTOR was synthesized and cloned into the pcDNA3.1 vector, also obtained from GenePharma, with the empty vector serving as the negative control. All miR-485-5p mimics (F: 5′-AGAGGCUGGCCGUGAUGAAUUC-3′, R: 5′-AUUCAUCACGGCCAGCCUCUUU-3′), miR-485-5p inhibitors (5′-GAAUUCAUCACGGCCAGCCUCU-3′), and their respective controls were also sourced from GenePharma. All cells were transfected using Lipofectamine 3000 (Invitrogen, Waltham, MA, USA) following the manufacturer’s instructions.
Cell viability assay
Cell proliferation was assessed employing the CCK-8 assay (Dojindo, Tokyo, Japan) according to the manufacturer’s protocol. Cells that had undergone transfection for 24 h were plated into five 96-well plates at a density of 2 × 10³ cells per well and incubated at 37 °C. At 24-h intervals, one plate was removed, and 10 μL of CCK-8 reagent was added to each well. The plates were incubated for 2 h at the same conditions, and the cell viability was determined by measuring the optical density (OD) at 450 nm. A proliferation curve was then generated based on the OD values. These experiments were performed in triplicate.
Scratch wound assay
Following 24 h post-transfection, the cells were seeded into 6-well plates at a concentration of 4 × 10⁵ cells per well and incubated for another 24 h. A wound was made in the middle of each well with a 200 µL pipette tip, followed by washing and an additional 24-h incubation in serum-free medium. Images of the wound areas were captured, and the degree of wound closure was assessed through ImageJ software.
Transwell invasion assay
The invasive capacity of the transfected cells was evaluated through a transwell invasion assay with 8 μm pores (Corning, NY, USA). The upper chamber was pre-coated with Matrigel matrix gel (BD Biosciences, San Jose, USA). Following 24 h post-transfection, the cells were resuspended in a serum-free medium. Subsequently, 200 µL of the cell suspension containing 4 × 10⁴ cells was introduced into the upper chamber, and 600 µL of medium supplemented with fetal bovine serum (FBS) was introduced in the lower chamber. After a 24-h incubation, cells that crossed the membrane were fixed in 4% paraformaldehyde and stained using 0.1% crystal violet. The cells were subsequently rinsed with PBS, and three random regions were selected under a microscope (magnification, ×100) for imaging and quantification.
Xenograft tumor model experiments
Lentiviral vectors encoding sh-CYTOR were constructed using the LV3-H1-GFP+PURO vector (GenePharma, Shanghai, China) in order to achieve stable knockdown of CYTOR in A375 cells. Male BALB/c nude mice, aged 5 weeks, were obtained from Beijing HFK Bioscience Co., Ltd. (Beijing, China). The mice were acclimated for 1 week prior to the experiment. Each cage contained 2–4 mice of the same gender. Mice were housed at 20–24 °C under a 12-h light-dark cycle (lights on at 07:00, lights off at 19:00), with food and water available ad libitum. Equal volumes of LV3-sh-CYTOR or LV3-sh-NC A375 cell suspensions were injected subcutaneously into the axillary region of the mice (0.2 mL, 1 × 10⁶ cells per 100 µL). Each group consisted of 5 mice. Tumor progression was assessed every 3 days. On the 18th day post-injection, the tumors were excised. Statistical analyses were conducted using GraphPad Prism 8.0 (San Diego, CA, USA), and results were expressed as mean ± standard deviation (SD). All animal experiments were reviewed and approved by the Animal Welfare Committee of the Affiliated Hospital of Chengde Medical University. The experiments were carried out following ethical standards and established animal care guidelines.
Western blot analysis
Cells or melanoma tissues were lysed in RIPA buffer (Solarbio, Beijing, China) containing a protease inhibitor cocktail (Solarbio, Beijing, China). The extracted proteins were separated using gel electrophoresis, transferred to polyvinylidene fluoride (PVDF) membranes (Beyotime, Shanghai, China), and blocked in 5% skimmed milk. The membranes were exposed to primary antibodies targeting GPI (A Rabbit Anti-Human monoclonal IgG antibody, Abcam, UK, ab167394) and α-Tubulin (A Rabbit Anti-Human polyclonal IgG antibody, Proteintech, China, 11224-1-AP) at 4 °C overnight. Afterward, the membranes were exposed to a secondary antibody (A Goat Anti-Rabbit IgG antibody, Affinity Biosciences, Cincinnati, OH, USA, S0001). The detection of protein bands was performed via electrochemiluminescence (ECL, Biosharp, Hefei, China).
Dual-luciferase reporter gene assay
When cells reached 60% confluence, they were co-transfected with 1 μg of GP-mirGLO-CYTOR/GPI 3′UTR and 50 pmol of miR-485-5p mimics (F: 5′-AGAGGCUGGCCGUGAUGAAUUC-3′, R: 5′-AUUCAUCACGGCCAGCCUCUUU-3′) using GP-transfect-Mate. 48 h post-transfection, the cells were lysed to assess luciferase activity with the Dual-Luciferase Reporter Assay System. The luciferase reporter constructs were obtained from GenePharma (Shanghai, China). All experiments were conducted in triplicate.
Statistical analysis
Statistical analyses were conducted with SPSS 17.0 (Chicago, IL, USA) and GraphPad Prism 8.0 (San Diego, CA, USA), and results were expressed as mean ± standard deviation (SD). Differences between two groups were assessed using the Student’s t-test, while one-way analysis of variance (ANOVA) was applied for comparisons involving three or more groups, followed by the least significant difference (LSD) multiple comparison test. Spearman’s correlation was applied to assess relationships between variables (*p < 0.05, **p < 0.01, and ***p < 0.001).
Results
High expression of CYTOR in melanoma
Utilizing the Gene Expression Profiling Interactive Analysis (GEPIA2) with |Log2FC| > 1 and p < 0.05 as target selection standard, we observed a significant upregulation of CYTOR in melanoma tissues compared to normal tissues (Average Log2FC 5.75 vs 3.82, p < 0.05) (Fig. 1A). CYTOR expression levels were quantified in 18 melanoma clinical specimens and melanoma cell lines (SK-MEL-28, MV3, A875, and A375) via qRT-PCR. The results showed that the CYTOR expression was highest in A375 cells (nearly six times that seen in the PIG1 melanocyte cells) and was also significantly elevated in SK-MEL-28, MV3 and A875 cells (two times, two times and three times respectively compared with that of PIG1 melanocyte cells) (Fig. 1C). The findings revealed elevated CYTOR expression in both melanoma cell lines and tissues in comparison to the control groups (Figs. 1B and 1C). Furthermore, CYTOR expression correlated with the prognosis of melanoma patients. Those exhibiting elevated CYTOR levels demonstrated reduced overall survival (OS) in comparison to patients with lower expression levels (Fig. 1D). These findings indicate that CYTOR could serve as a potential prognostic marker in melanoma.
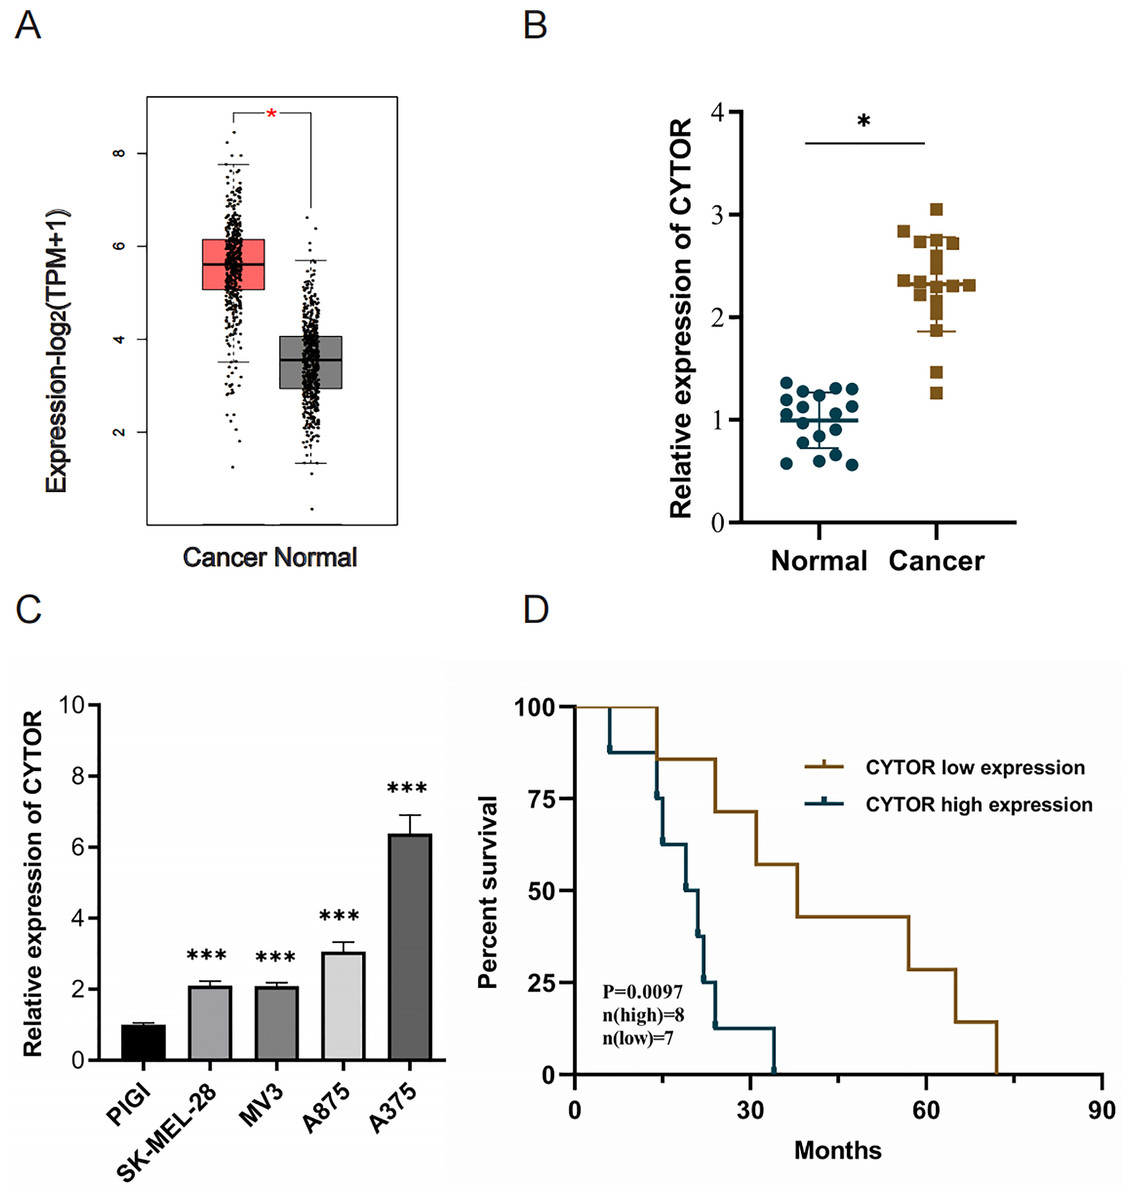
Figure 1: High expression of CYTOR in melanoma.
(A) CYTOR expression in melanoma tissues (n = 461) compared to normal tissues (n = 558) based on GEPIA2 analysis with |Log2FC| > 1 and p < 0.05 as target selection standard. Red box: skin cutaneous melanoma (SKCM) tissues (T); black box: normal tissue (N). (B) CYTOR expression levels were measured in melanoma tissue samples using qRT-PCR. (C) CYTOR expression was assessed in melanoma cell lines (SK-MEL-28, MV3, A875, and A375) and a normal human melanocyte cell line (PIG1). (D) Survival analysis revealed that patients with high CYTOR expression levels had a reduced OS compared to those with low expression levels (high-level: eight cases; low-level: seven cases; lost to follow-up: three cases), *P < 0.05, ***P < 0.001.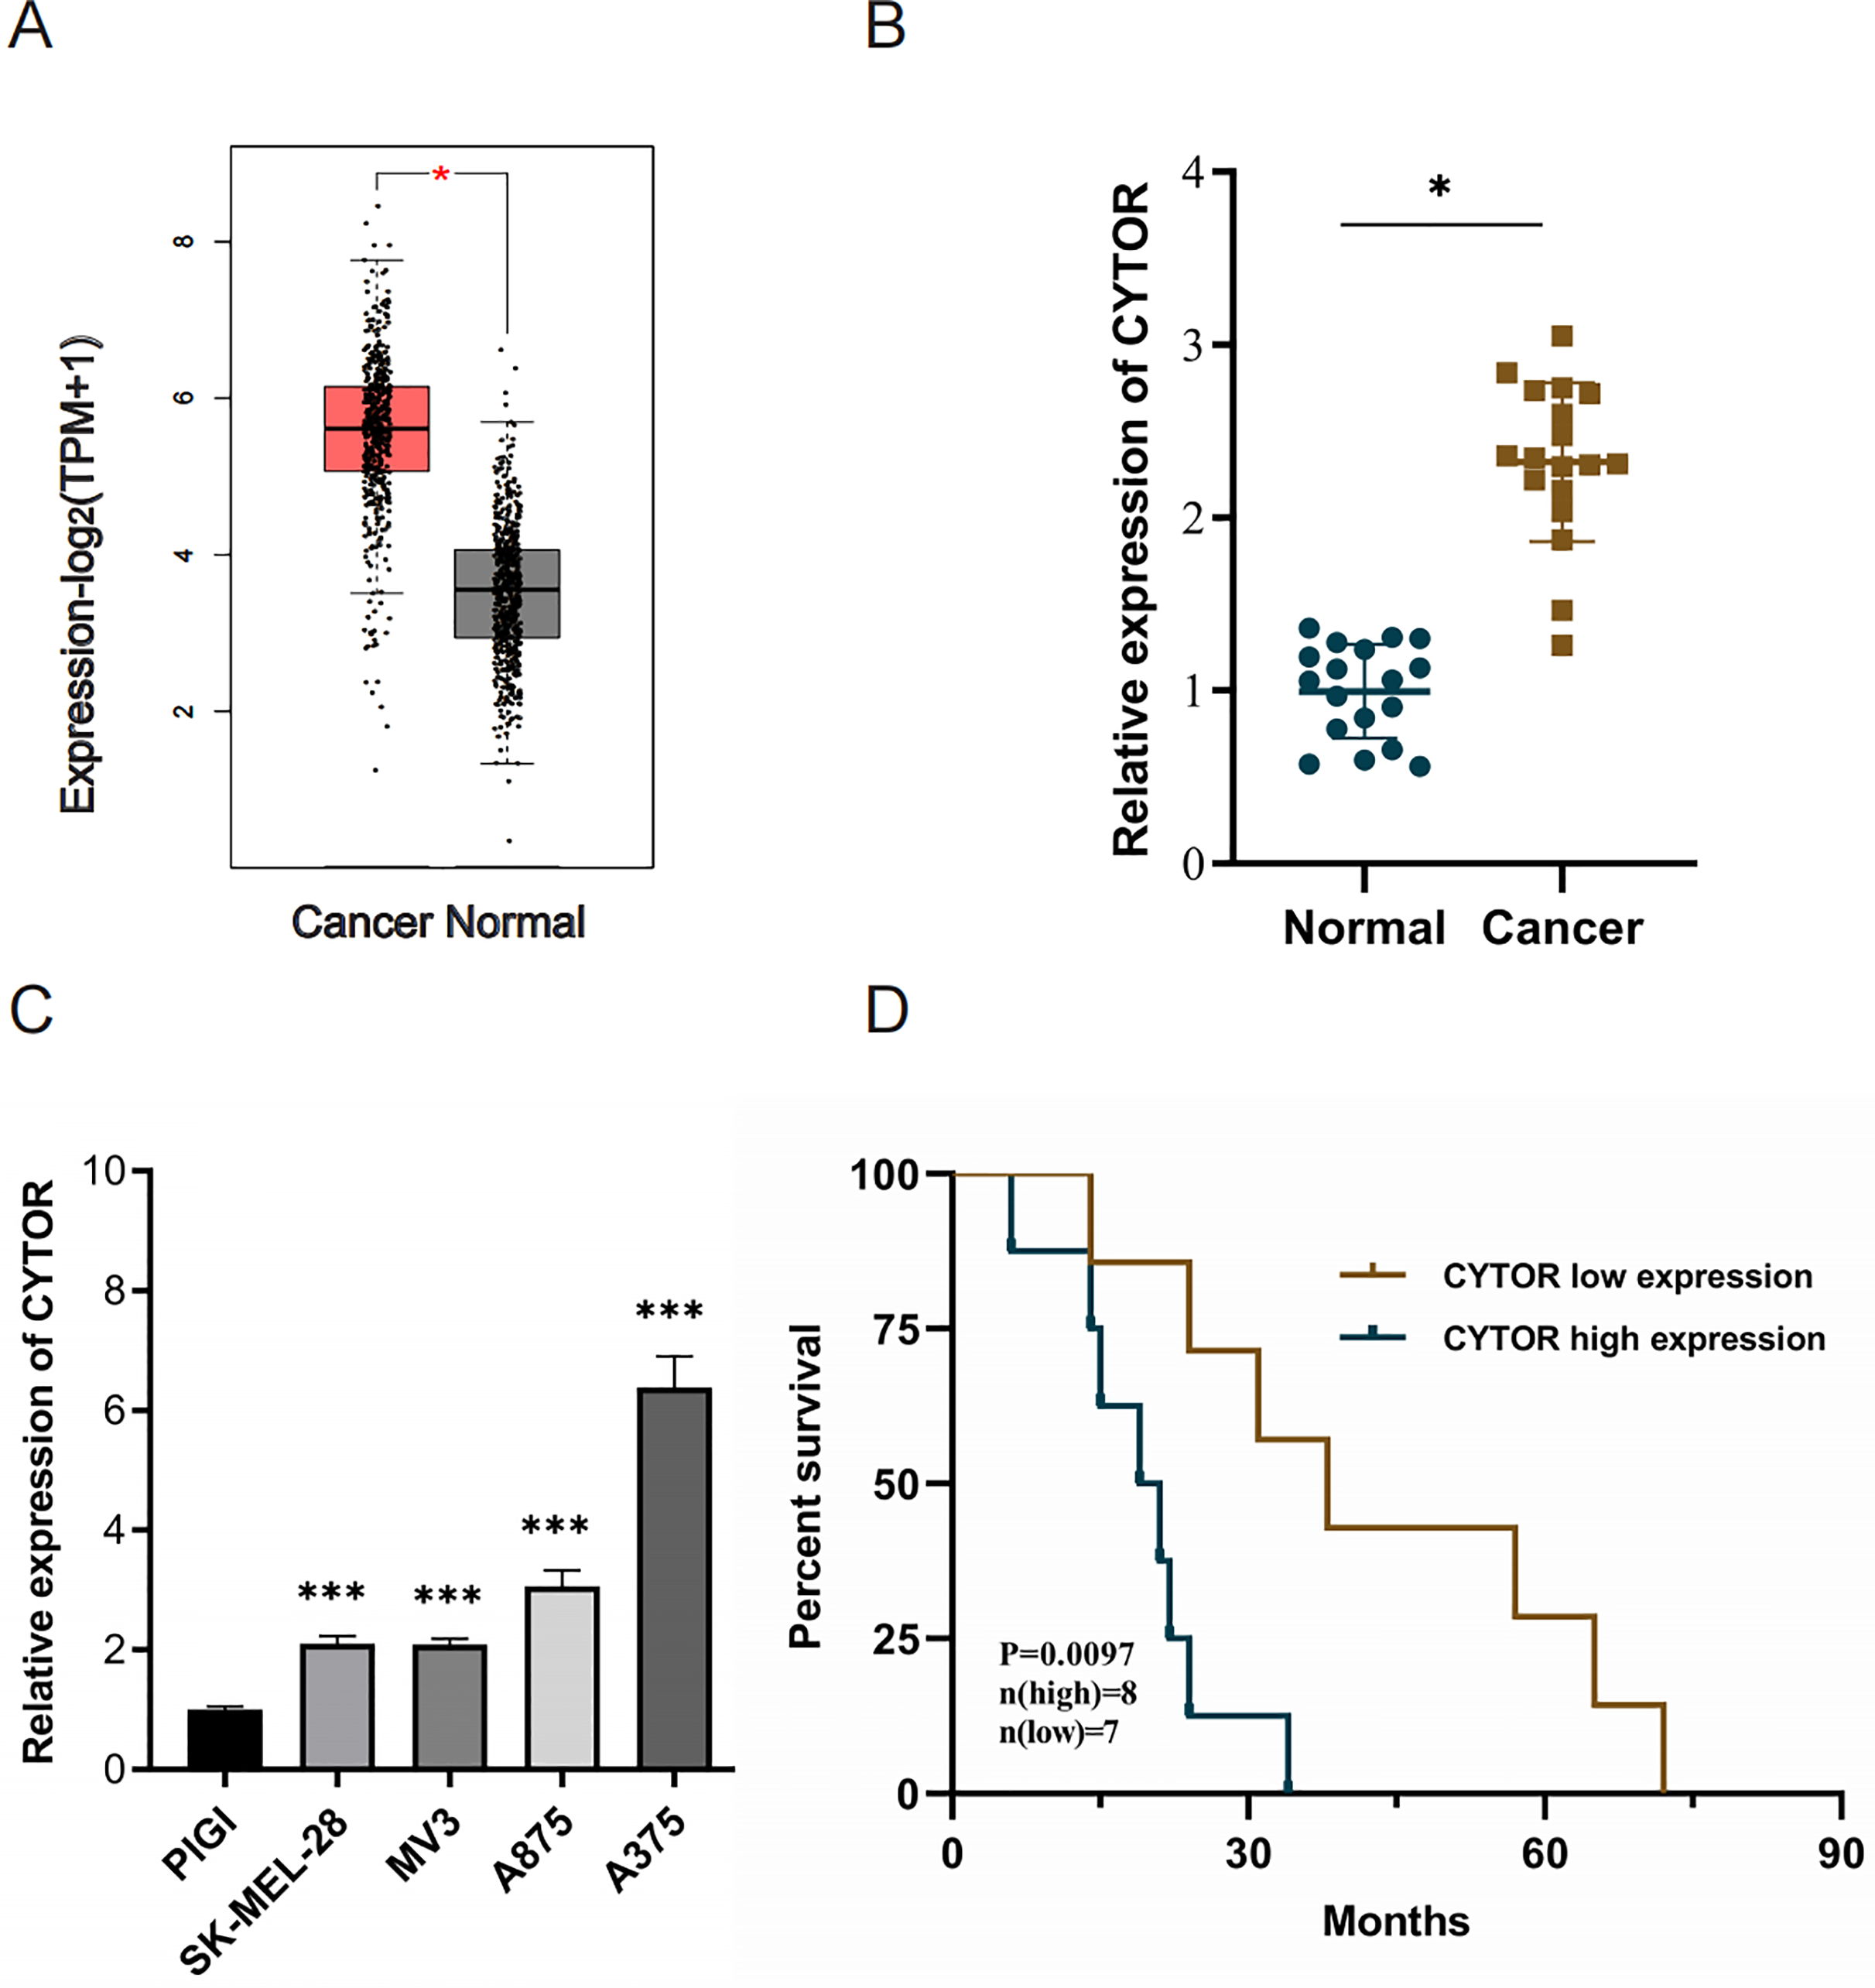
CYTOR downregulation inhibits melanoma cell proliferation, migration, and invasion
To investigate the functional role of CYTOR in melanoma cells, knockdown experiments were conducted through transfecting A375 and A875 cells with either si-NC or si-CYTOR. Both si-CYTOR-2 and si-CYTOR-3 effectively reduced CYTOR expression (Fig. 2A). The CCK-8 assay demonstrated that CYTOR silencing significantly inhibited cell proliferation in contrast to si-NC transfection (Fig. 2B). Furthermore, the impact of CYTOR on cellular migration and invasion was evaluated through scratch wound and transwell assays. CYTOR silencing significantly diminished the migratory and invasive capacities in the cell lines (Figs. 2C and 2D). These findings suggest that CYTOR silencing may reduce the malignant phenotype of melanoma cells.
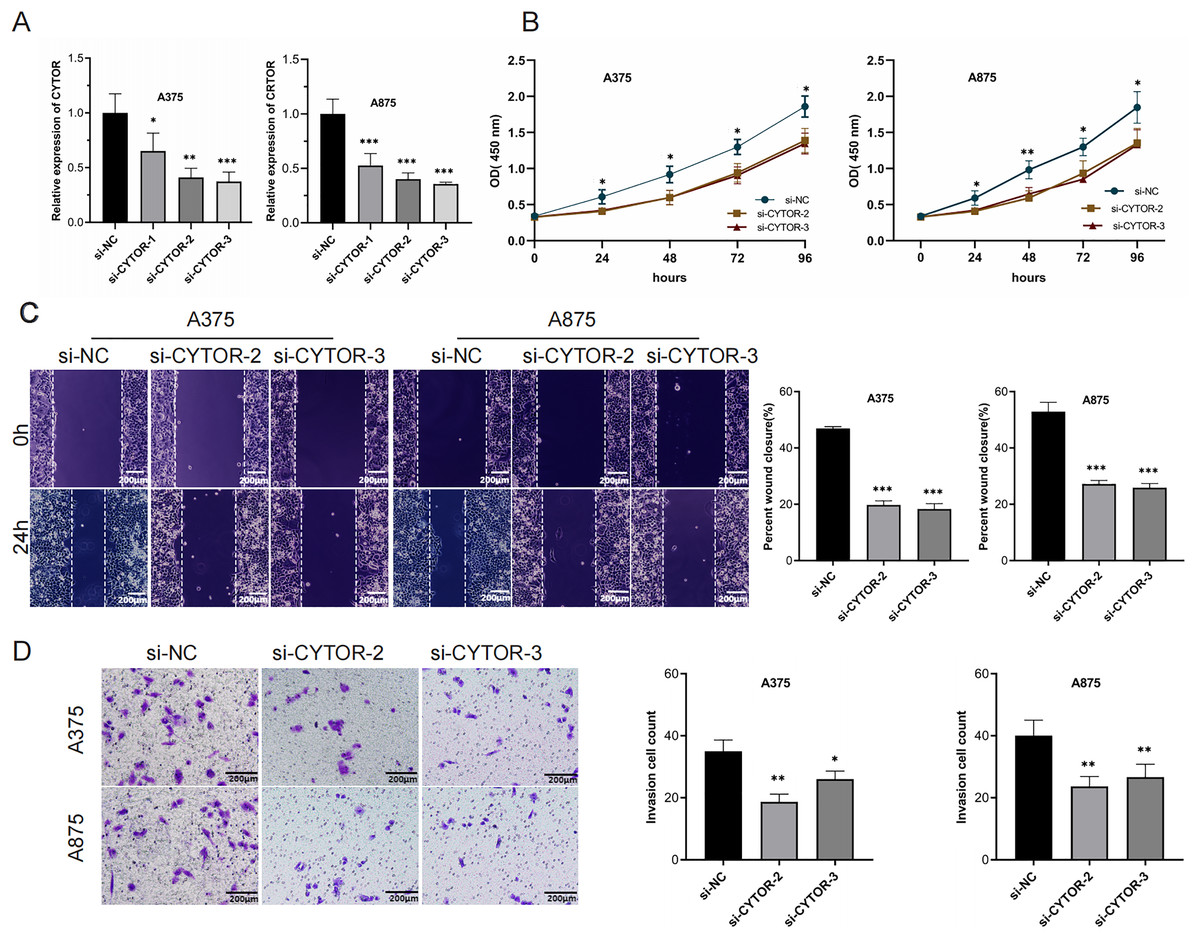
Figure 2: CYTOR downregulation inhibits melanoma cell proliferation, migration, and invasion.
(A) Transfection of si-CYTOR-2 and si-CYTOR-3 in A375 and A875 cells significantly downregulated CYTOR expression. (B) The CCK-8 assay was utilized to evaluate cell proliferation. (C and D) Scratch wound and transwell assays were conducted to assess the migratory and invasive abilities of A375 and A875 cells after siRNA-mediated CYTOR knockdown, *P < 0.05, **P < 0.01, ***P < 0.001.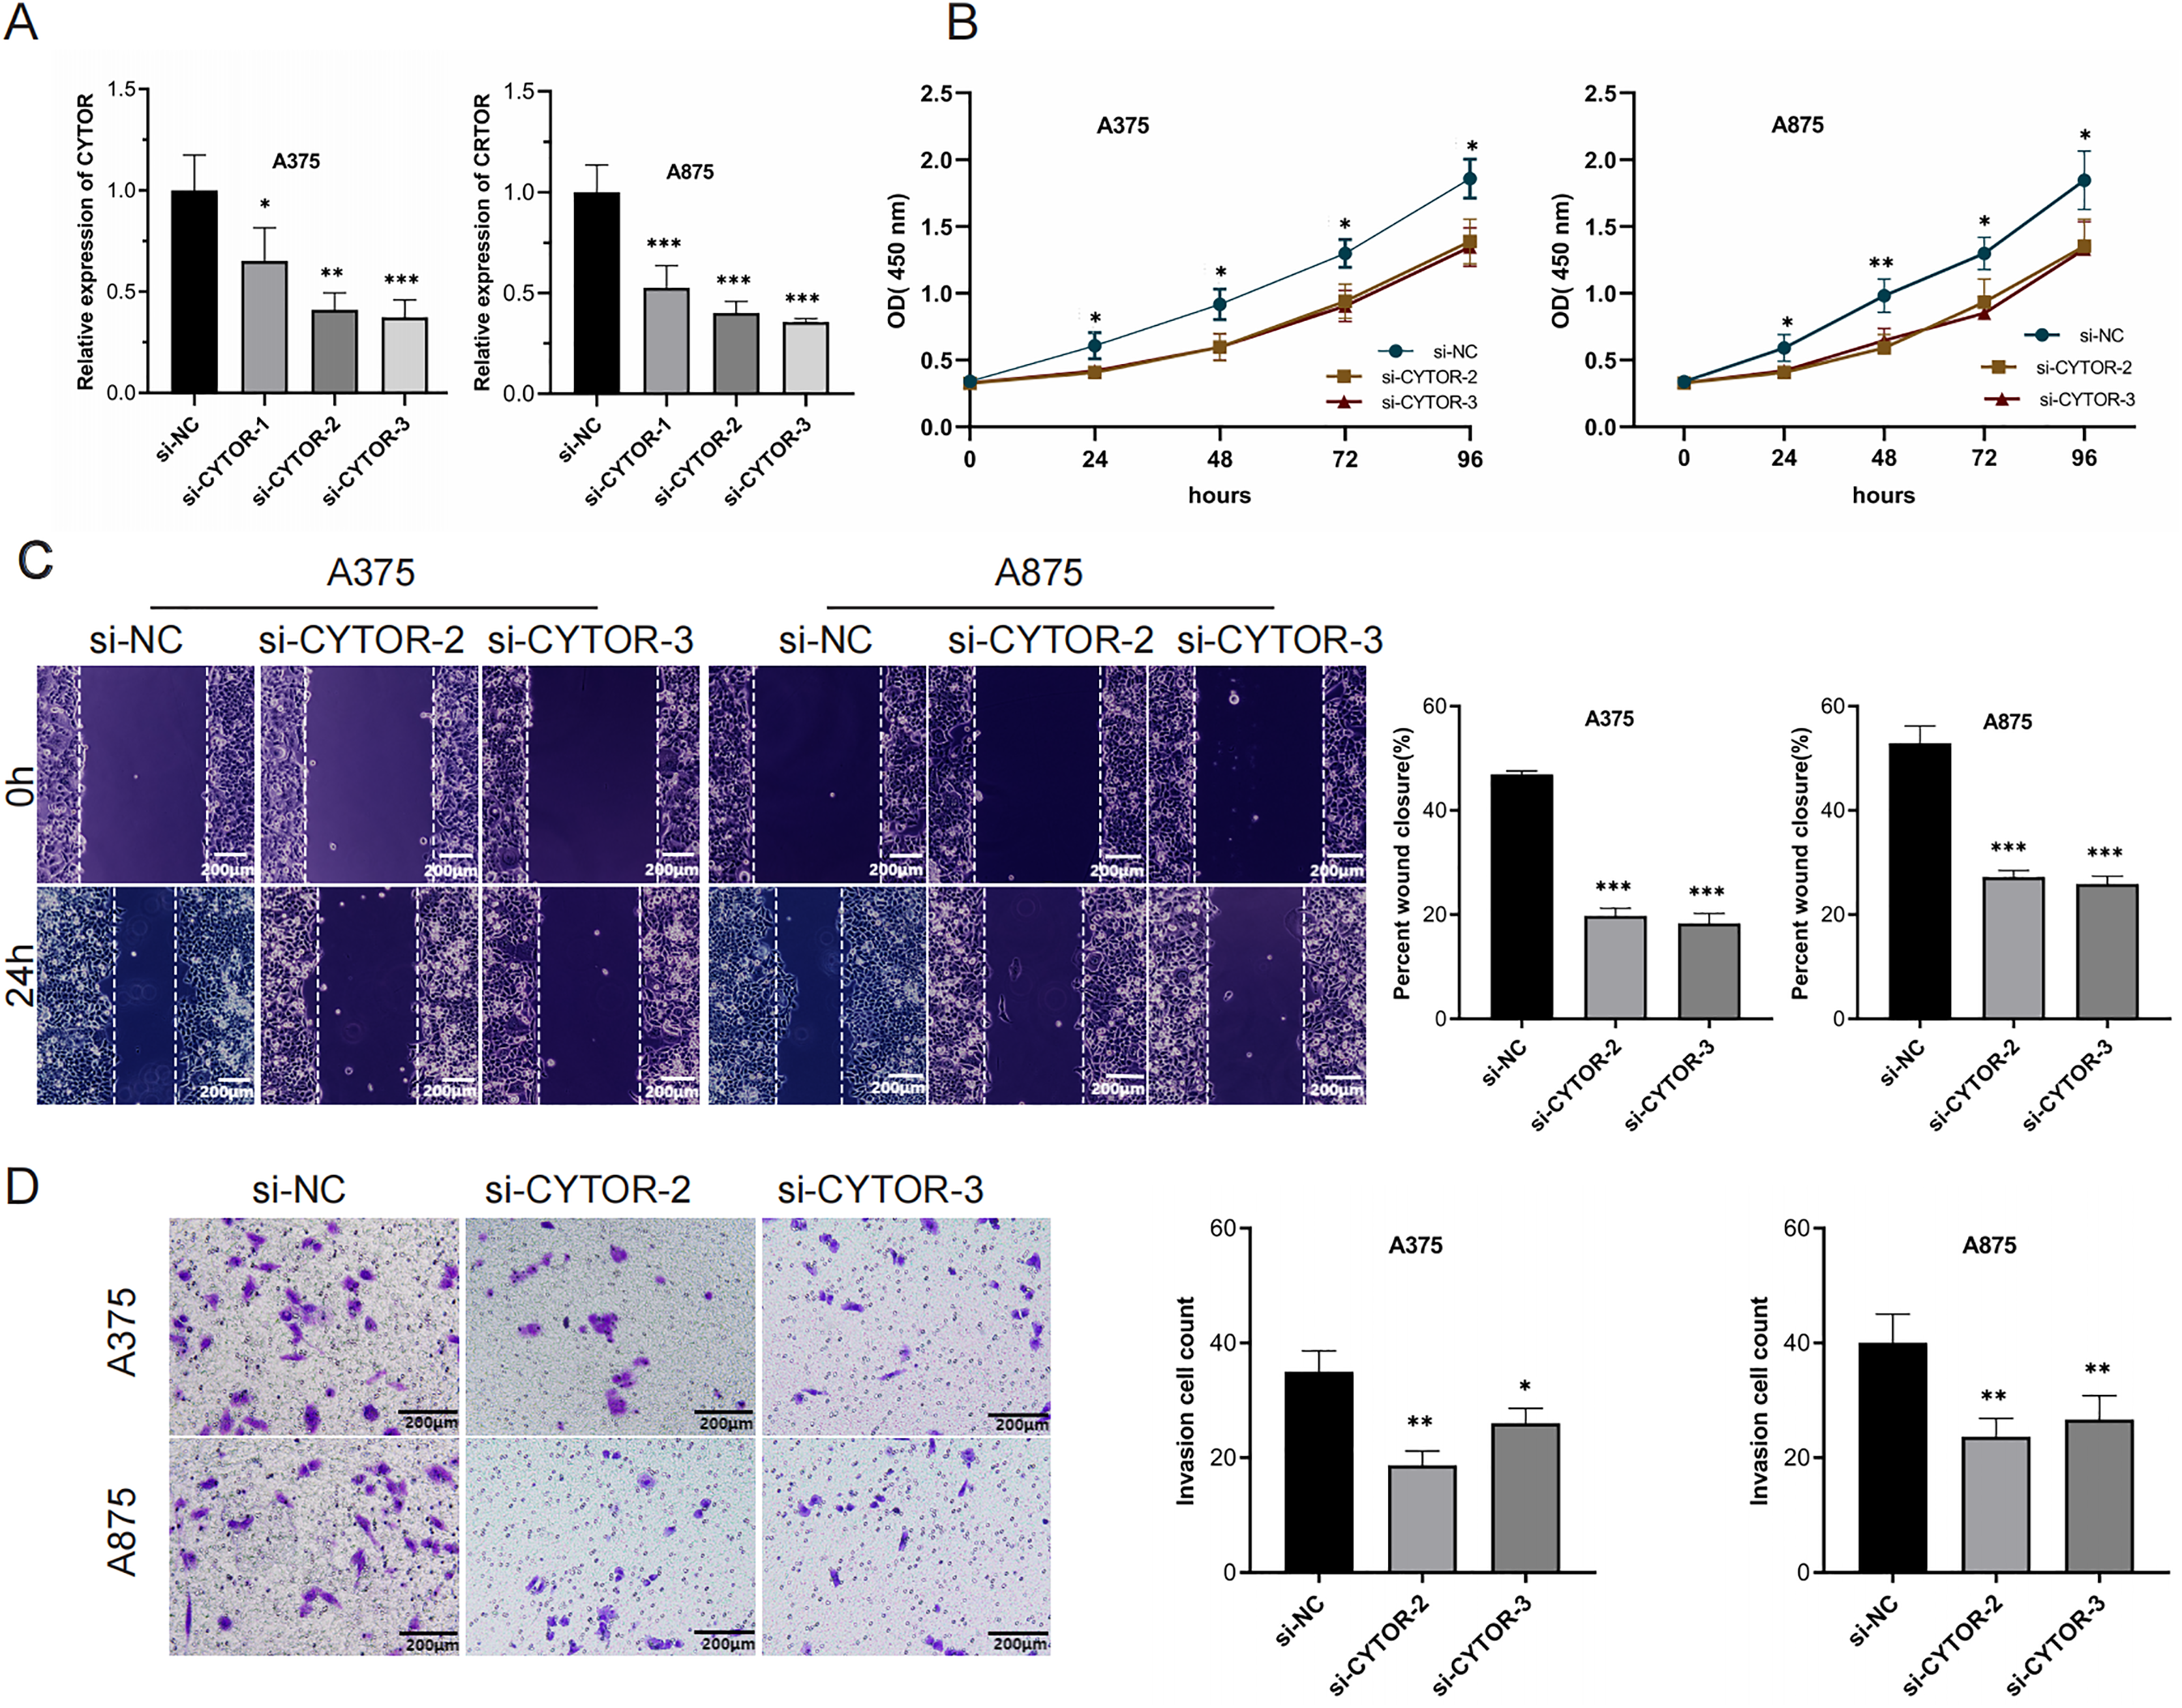
Upregulation of CYTOR stimulates melanoma cell proliferation, migration, and invasion
We next performed overexpression assays, demonstrating that CYTOR overexpression significantly enhanced proliferation (Figs. 3A and 3B), migration (Figs. 3C and 3D), and invasion (Figs. 3C and 3D) of SK-MEL-28 and MV3 cells.
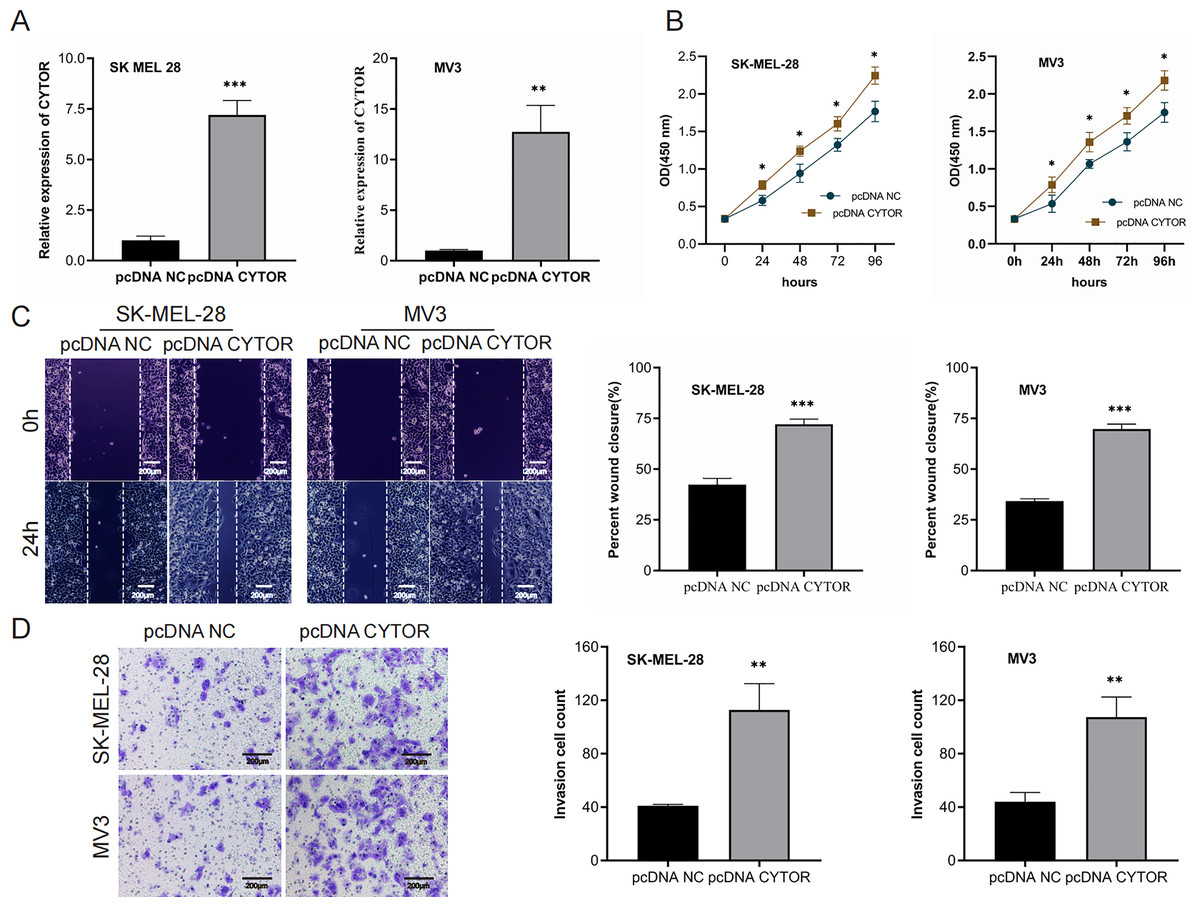
Figure 3: Upregulation of CYTOR stimulates melanoma cell proliferation, migration, and invasion.
(A) Transfection of pcDNA-CYTOR in SK-MEL-28 and MV3 cells significantly upregulated CYTOR expression. (B) The CCK-8 assay was utilized to evaluate cell proliferation. (C and D) Transfection of pcDNA-CYTOR in SK-MEL-28 and MV3 cells significantly promoted migration and invasion, *P < 0.05, **P < 0.01, ***P < 0.001.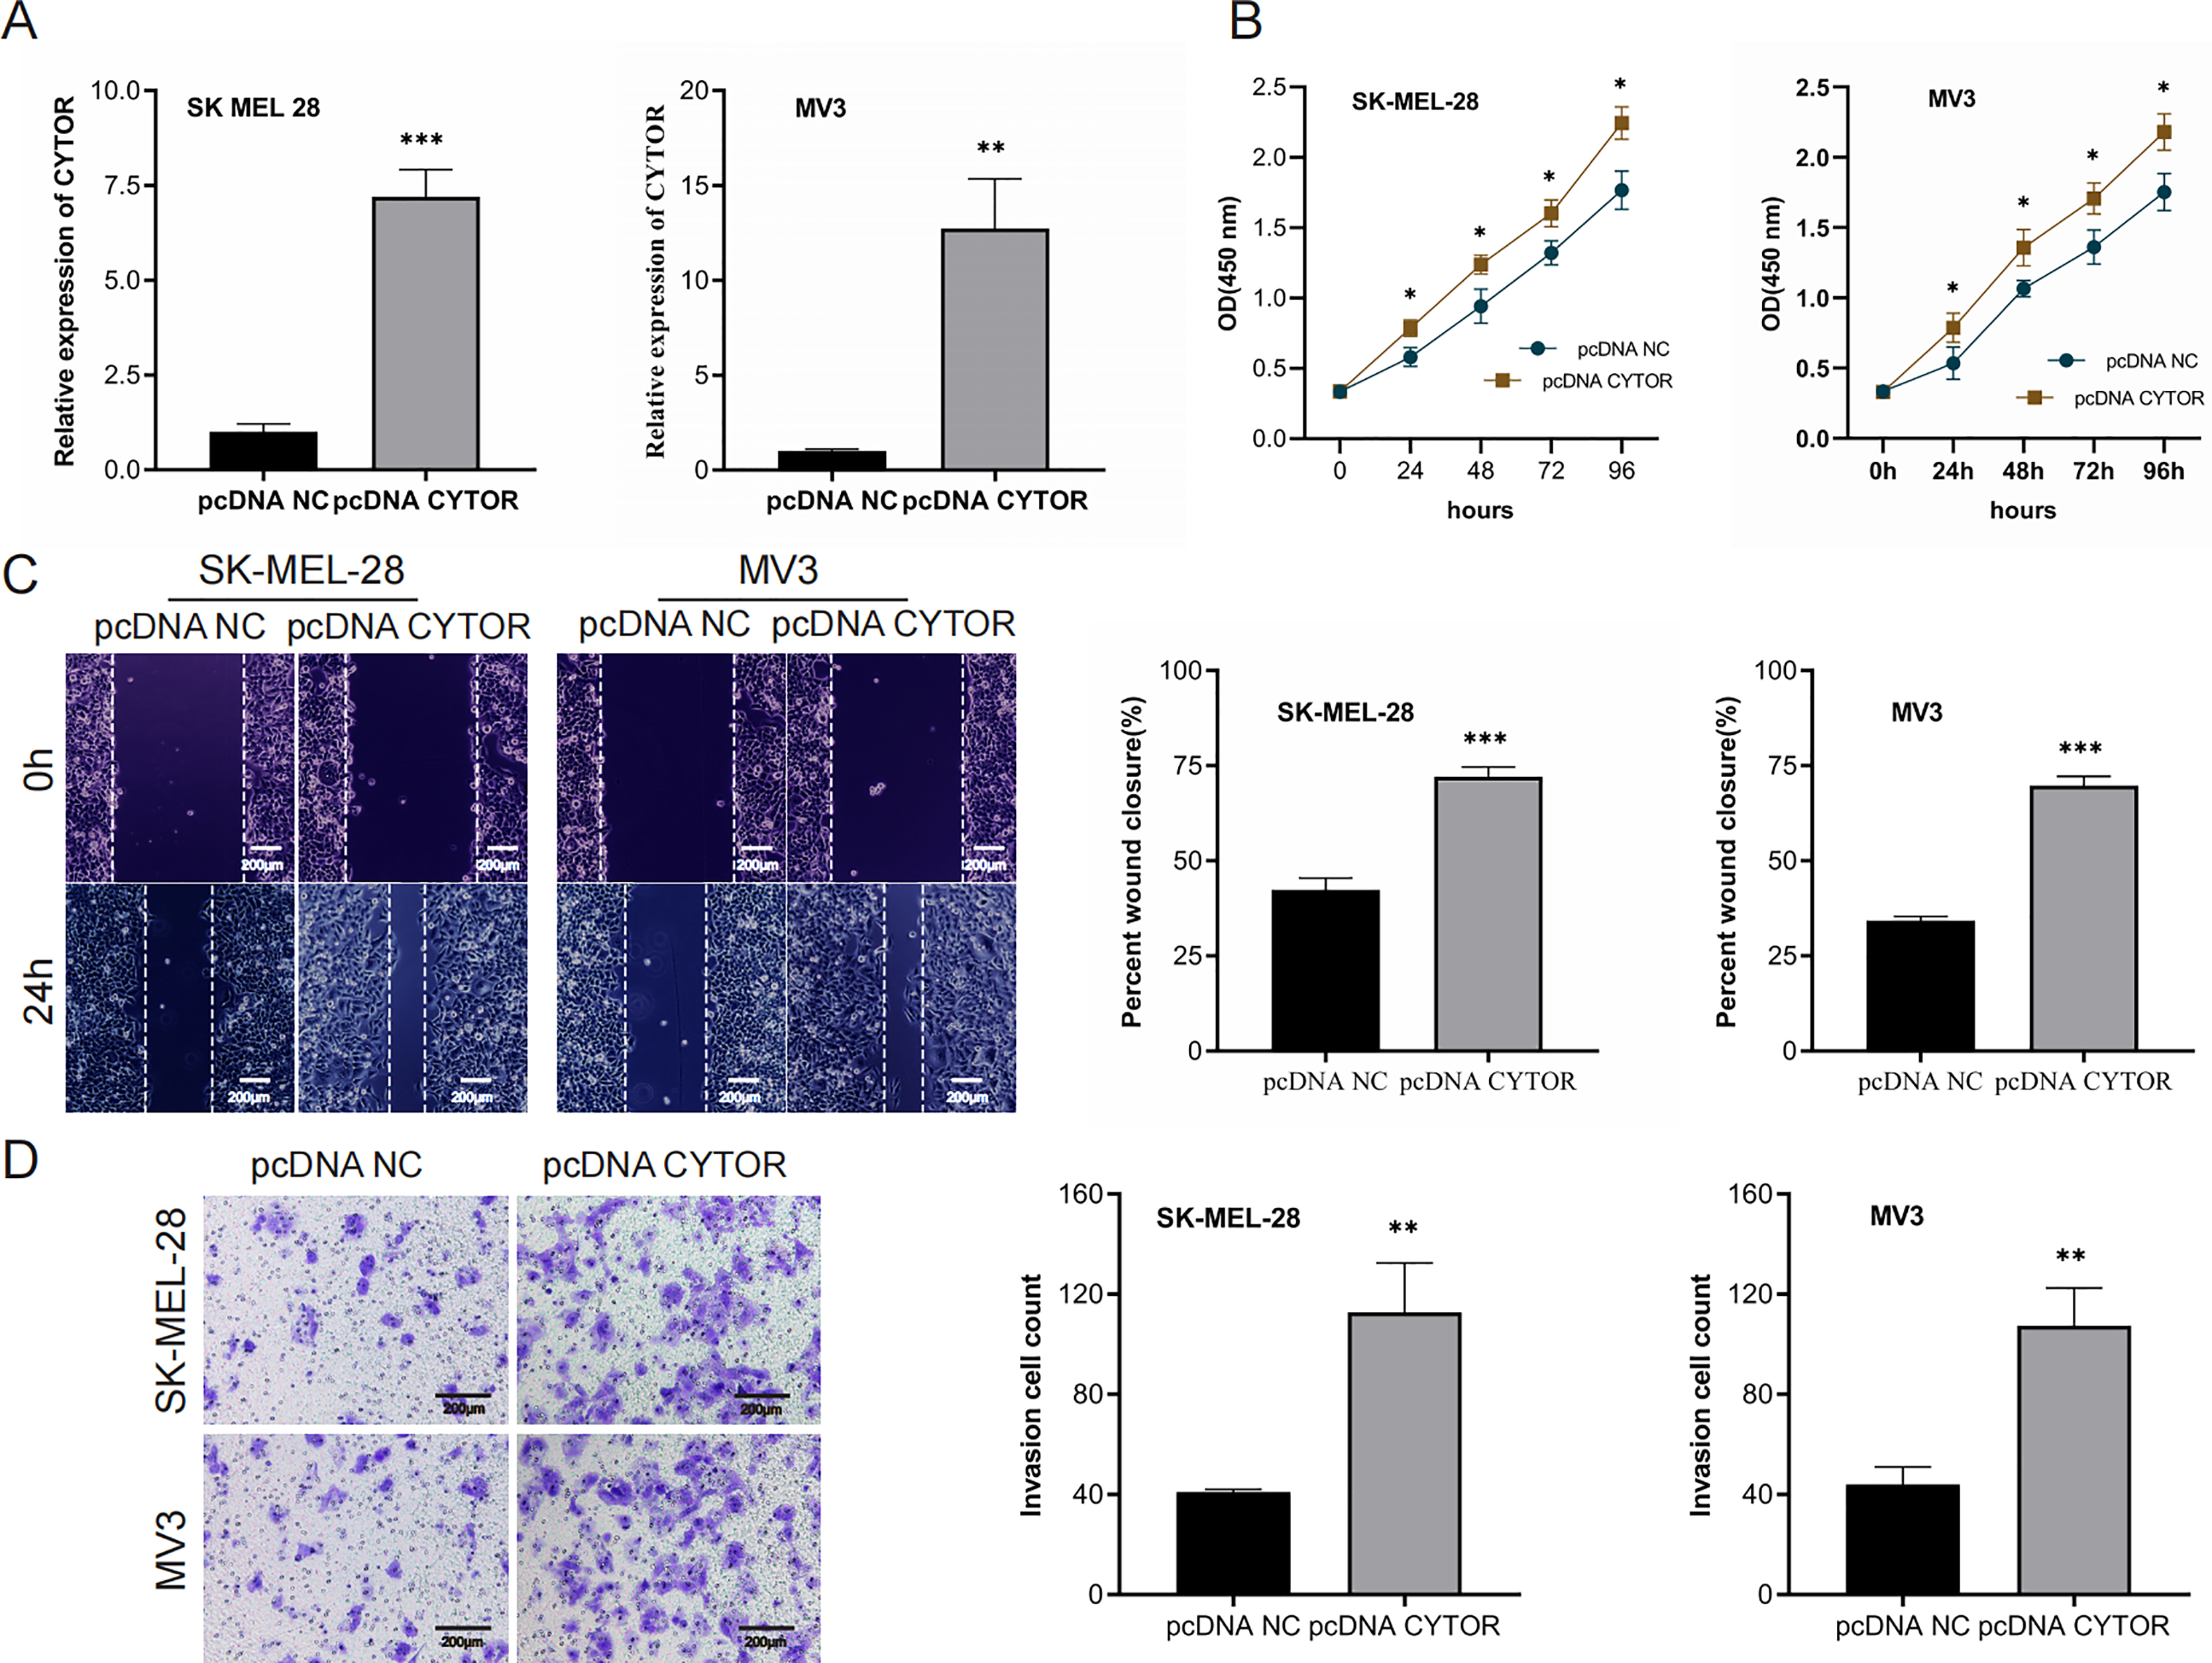
MiR-485-5p is a target of CYTOR
Starbase (ENCORI) (https://rnasysu.com/encori/) was used to verify interaction of lncRNA CYTO and miR-485-5P (p value of 2.283e−5 and FDR of 9.134e−5) and to predict the binding site of CYTO to miR-485-5P. To further elucidate the role of CYTOR in melanoma tumorigenesis, we utilized a competitive endogenous RNA (ceRNA) model. Fluorescence in situ hybridization (FISH) assays demonstrated that CYTOR primarily localizes within the cytoplasmic compartment (Fig. 4A). Bioinformatic analyses predicted possible interaction sites between CYTOR and miR-485-5p, which were subsequently validated using a luciferase reporter assay (Figs. 4B and 4C). In melanoma cells, miR-485-5p expression was observed to be reduced compared to normal cells (Fig. 4D). Furthermore, the expression of miR-485-5p in MV3 and A875 cells was markedly increased or decreased following CYTOR knockdown or overexpression, respectively (Fig. 4E). In clinical melanoma specimens, miR-485-5p levels were diminished and exhibited an inverse relationship with CYTOR expression (Figs. 4F and 4G).
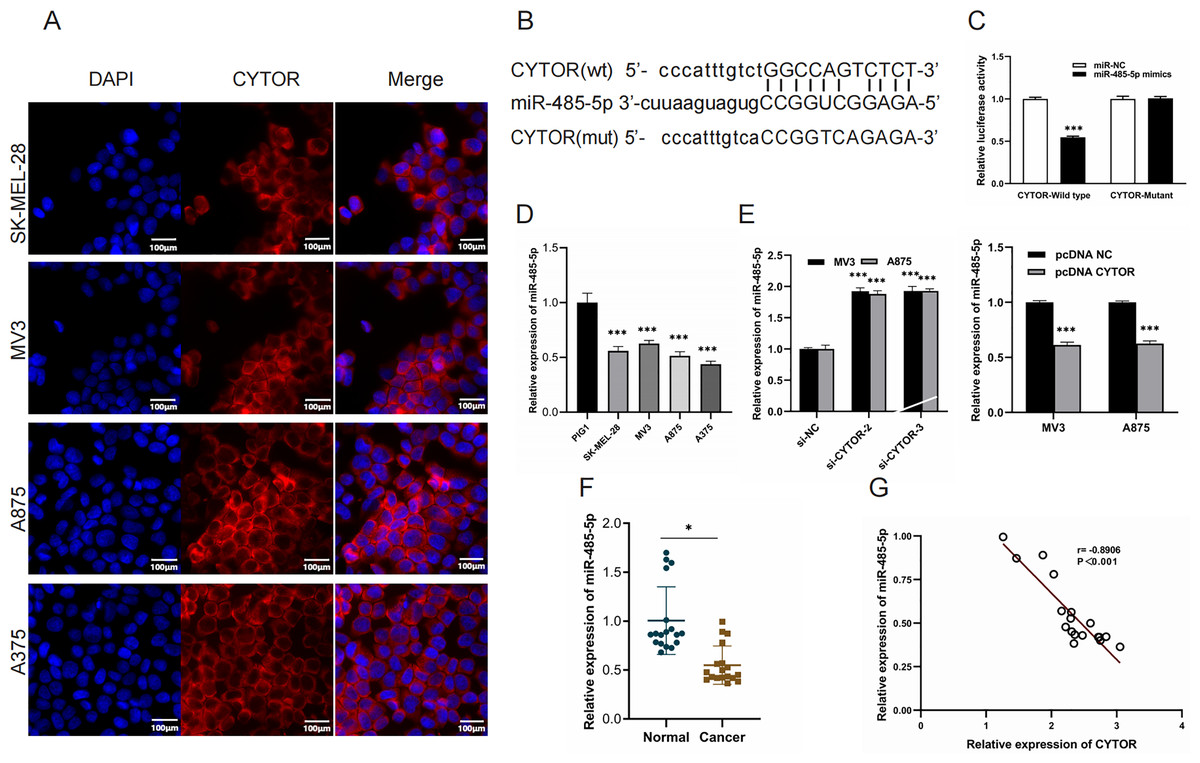
Figure 4: MiR-485-5p is a target of CYTOR.
(A) FISH analysis revealed that CYTOR was primarily localized within the cytoplasmic compartment of SK-MEL-28, MV3, A875, and A375 cells. (B and C) Bioinformatic approaches predicted potential binding sites between CYTOR and miR-485-5p, which were subsequently confirmed through a luciferase reporter assay. (D) MiR-485-5p levels were measured in melanoma cell lines (SK-MEL-28, MV3, A875, and A375) and the human normal melanocyte cell line (PIG1). (E) The expression of miR-485-5p was evaluated in MV3 and A875 cells following transfection with si-CYTOR and pcDNA CYTOR, respectively. (F) MiR-485-5p expression in tissues. (G) Spearman correlation analysis, *P < 0.05, ***P < 0.001.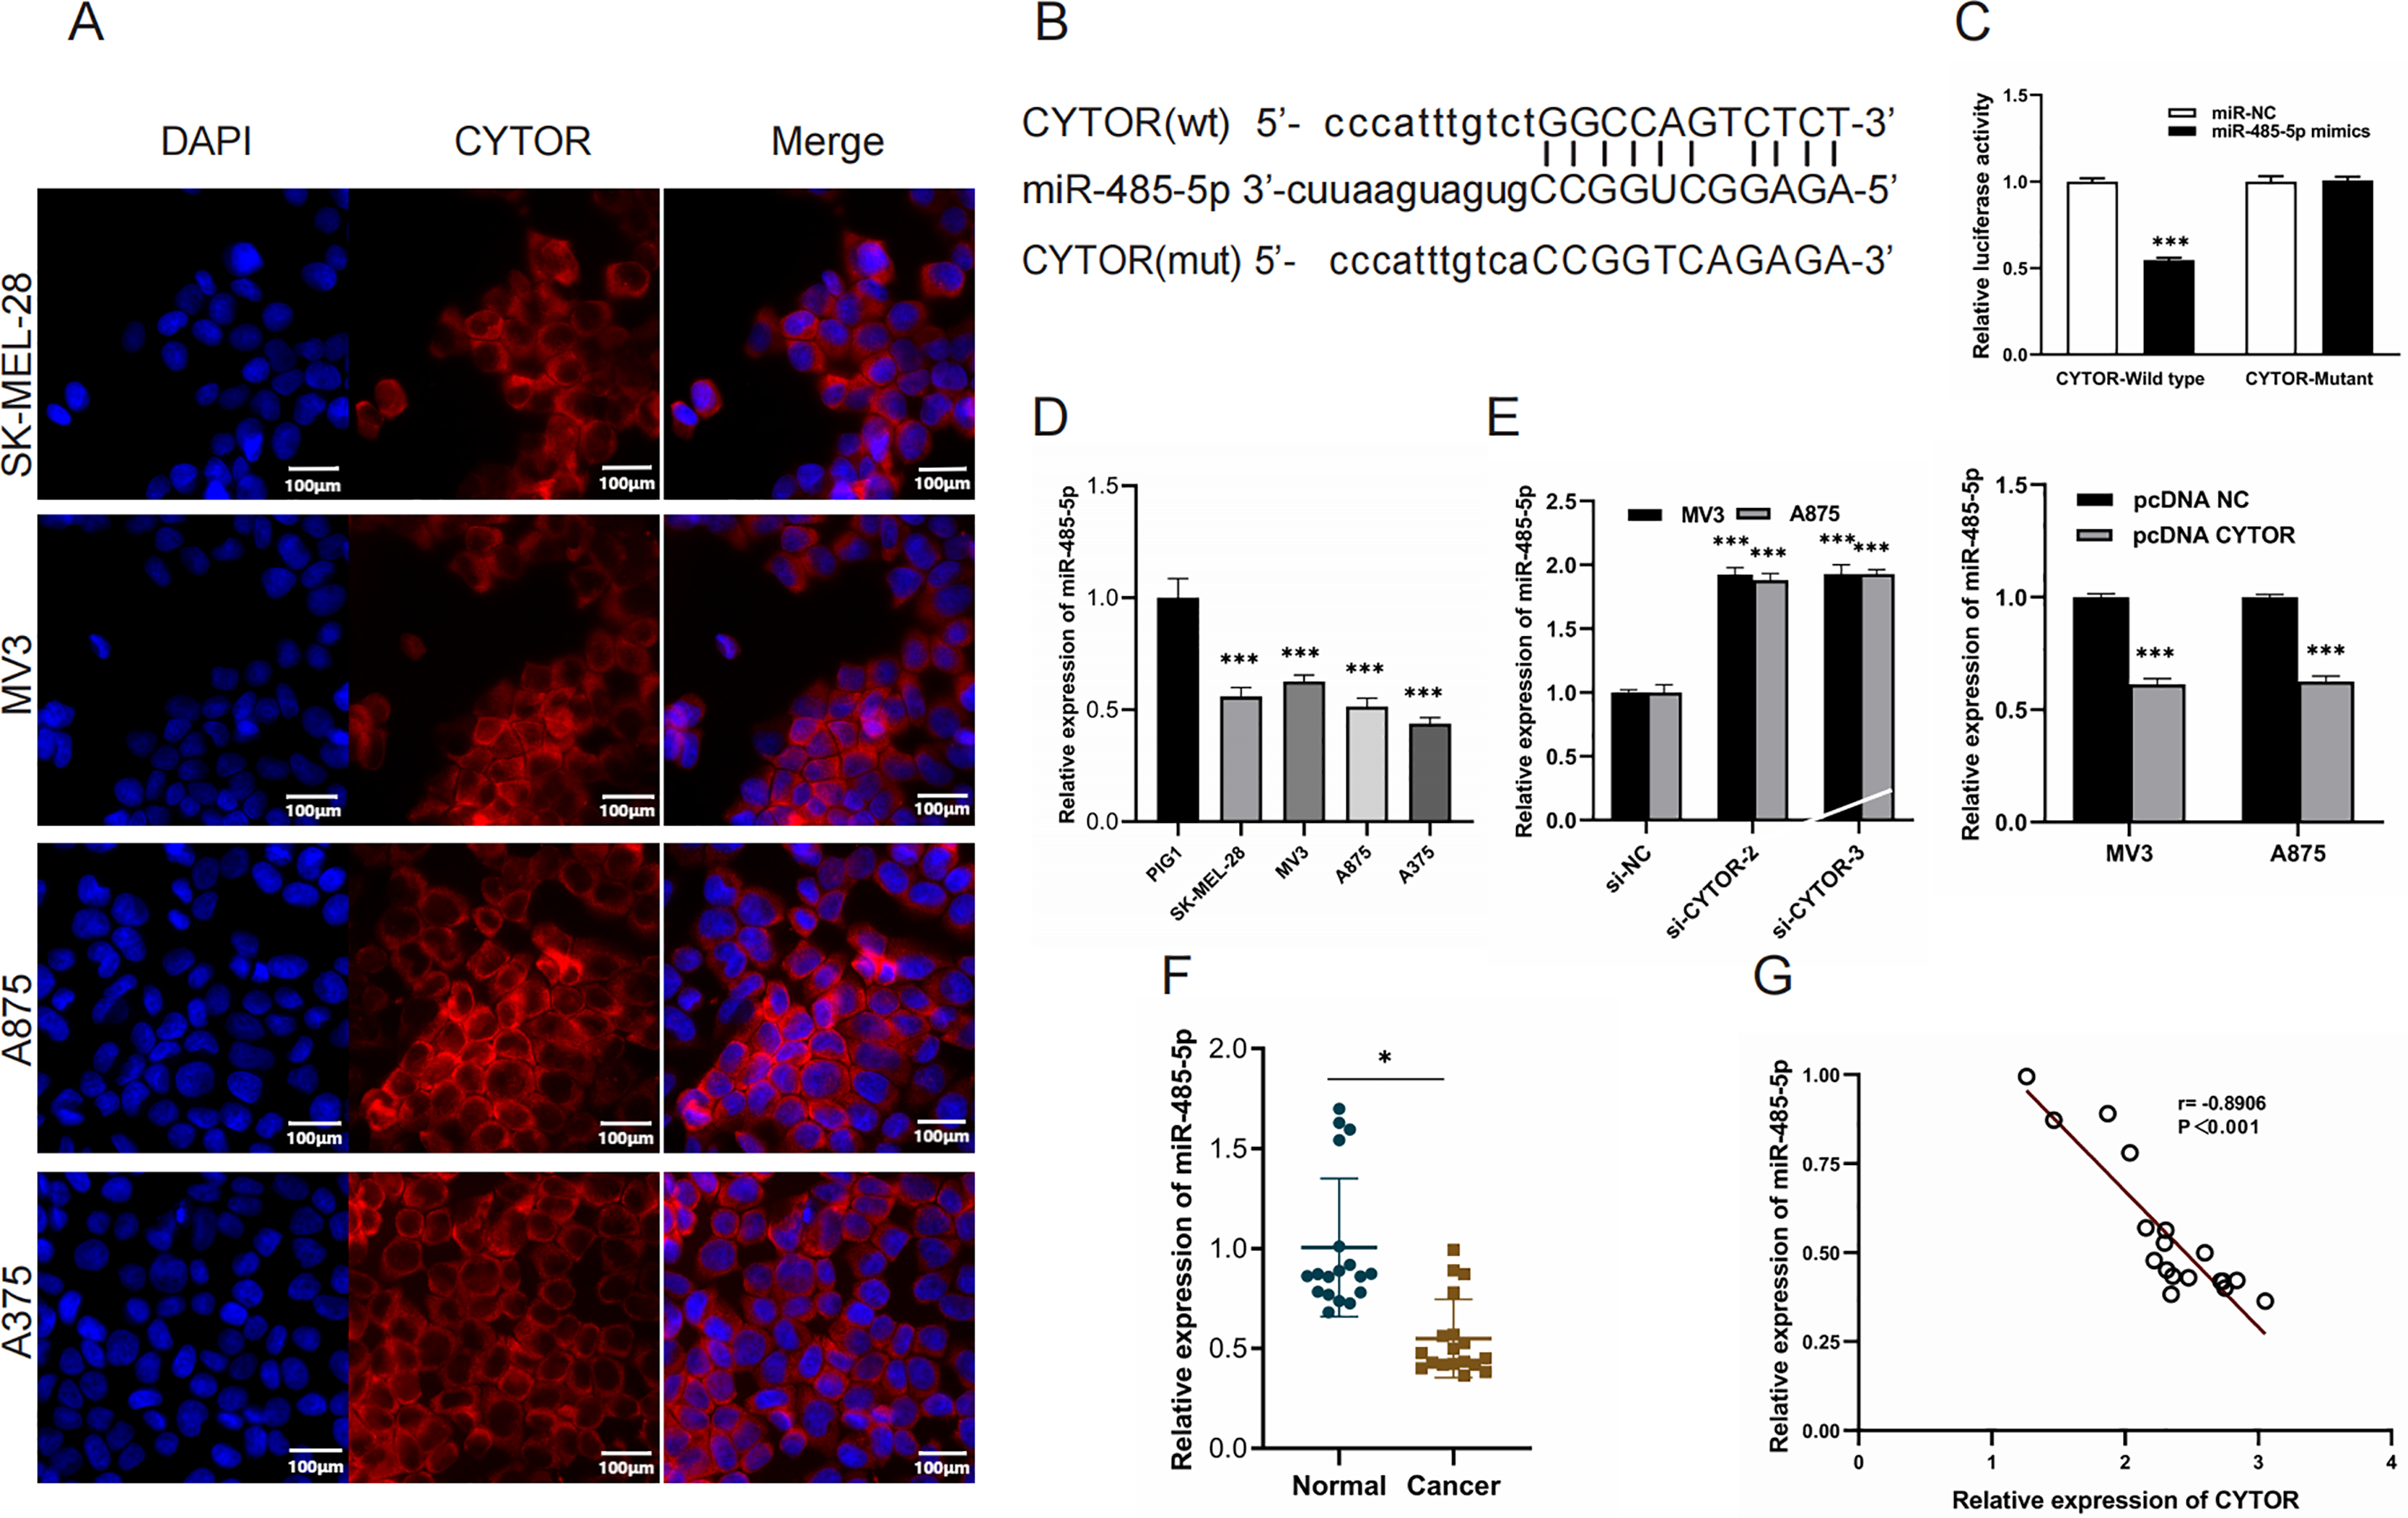
GPI is a target of miR-485-5p
TargetScan (https://www.targetscan.org/vert_80/) was used to verify the interaction of miR-485-5P and GPI and to predict the binding site of GP to miR-485-5P. miR-485-5p targeting GPI was corroborated by luciferase reporter assays (Figs. 5A and 5B). A marked upregulation of GPI expression was detected in both melanoma cells and tissues (Figs. 5C–5E). MiR-485-5p mimic transfection led to a reduction in GPI mRNA levels and protein expression in MV3 and A875 cells, whereas miR-485-5p inhibitor transfection produced the converse effect (Figs. 5F and 5G). Furthermore, GPI levels exhibited an inverse correlation with miR-485-5p expression, and elevated GPI expression was linked to reduced OS in melanoma patients (Figs. 5H and 5I).
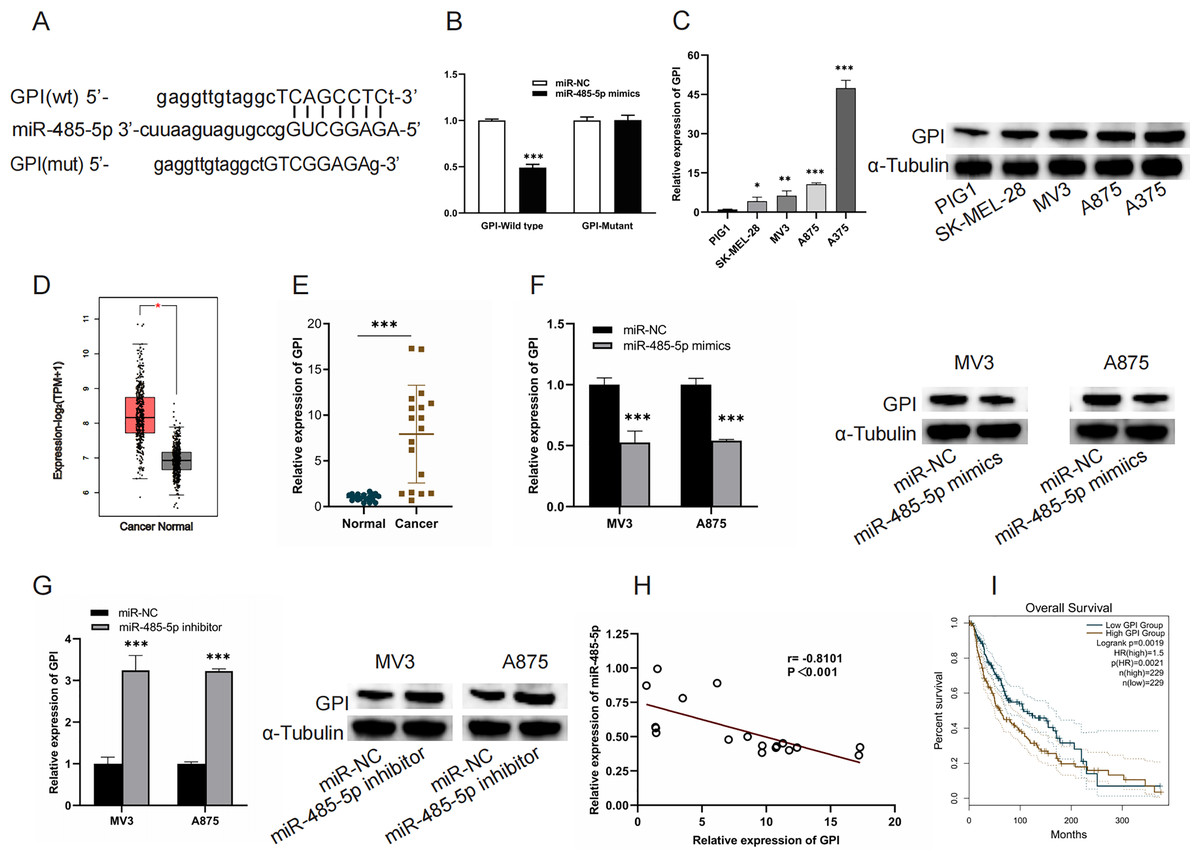
Figure 5: GPI is a target of miR-485-5p.
(A) The interaction site between GPI and miR-485-5p. (B) Luciferase reporter assays. (C) GPI mRNA levels and protein expression in PIG1, SK-MEL-28, MV3, A875, and A375 cells. (D) GPI levels in melanoma samples (n = 461) compared to normal counterparts (n = 558) based on GEPIA2. The red box indicates SKCM (T) samples, while the black box refers to normal tissues (N). (E) GPI expression levels were quantified using qRT-PCR in 18 paired samples of melanoma tumors and adjacent non-tumorous tissues. (F and G) GPI mRNA levels and protein expression were evaluated in MV3 and A875 cells after the introduction of miR-485-5p mimics or miR-485-5p inhibitor, respectively. (H) Spearman correlation analysis. (I) The correlation between GPI expression and OS of melanoma patients based on GEPIA2 analysis, *P < 0.05, **P < 0.01, ***P < 0.001.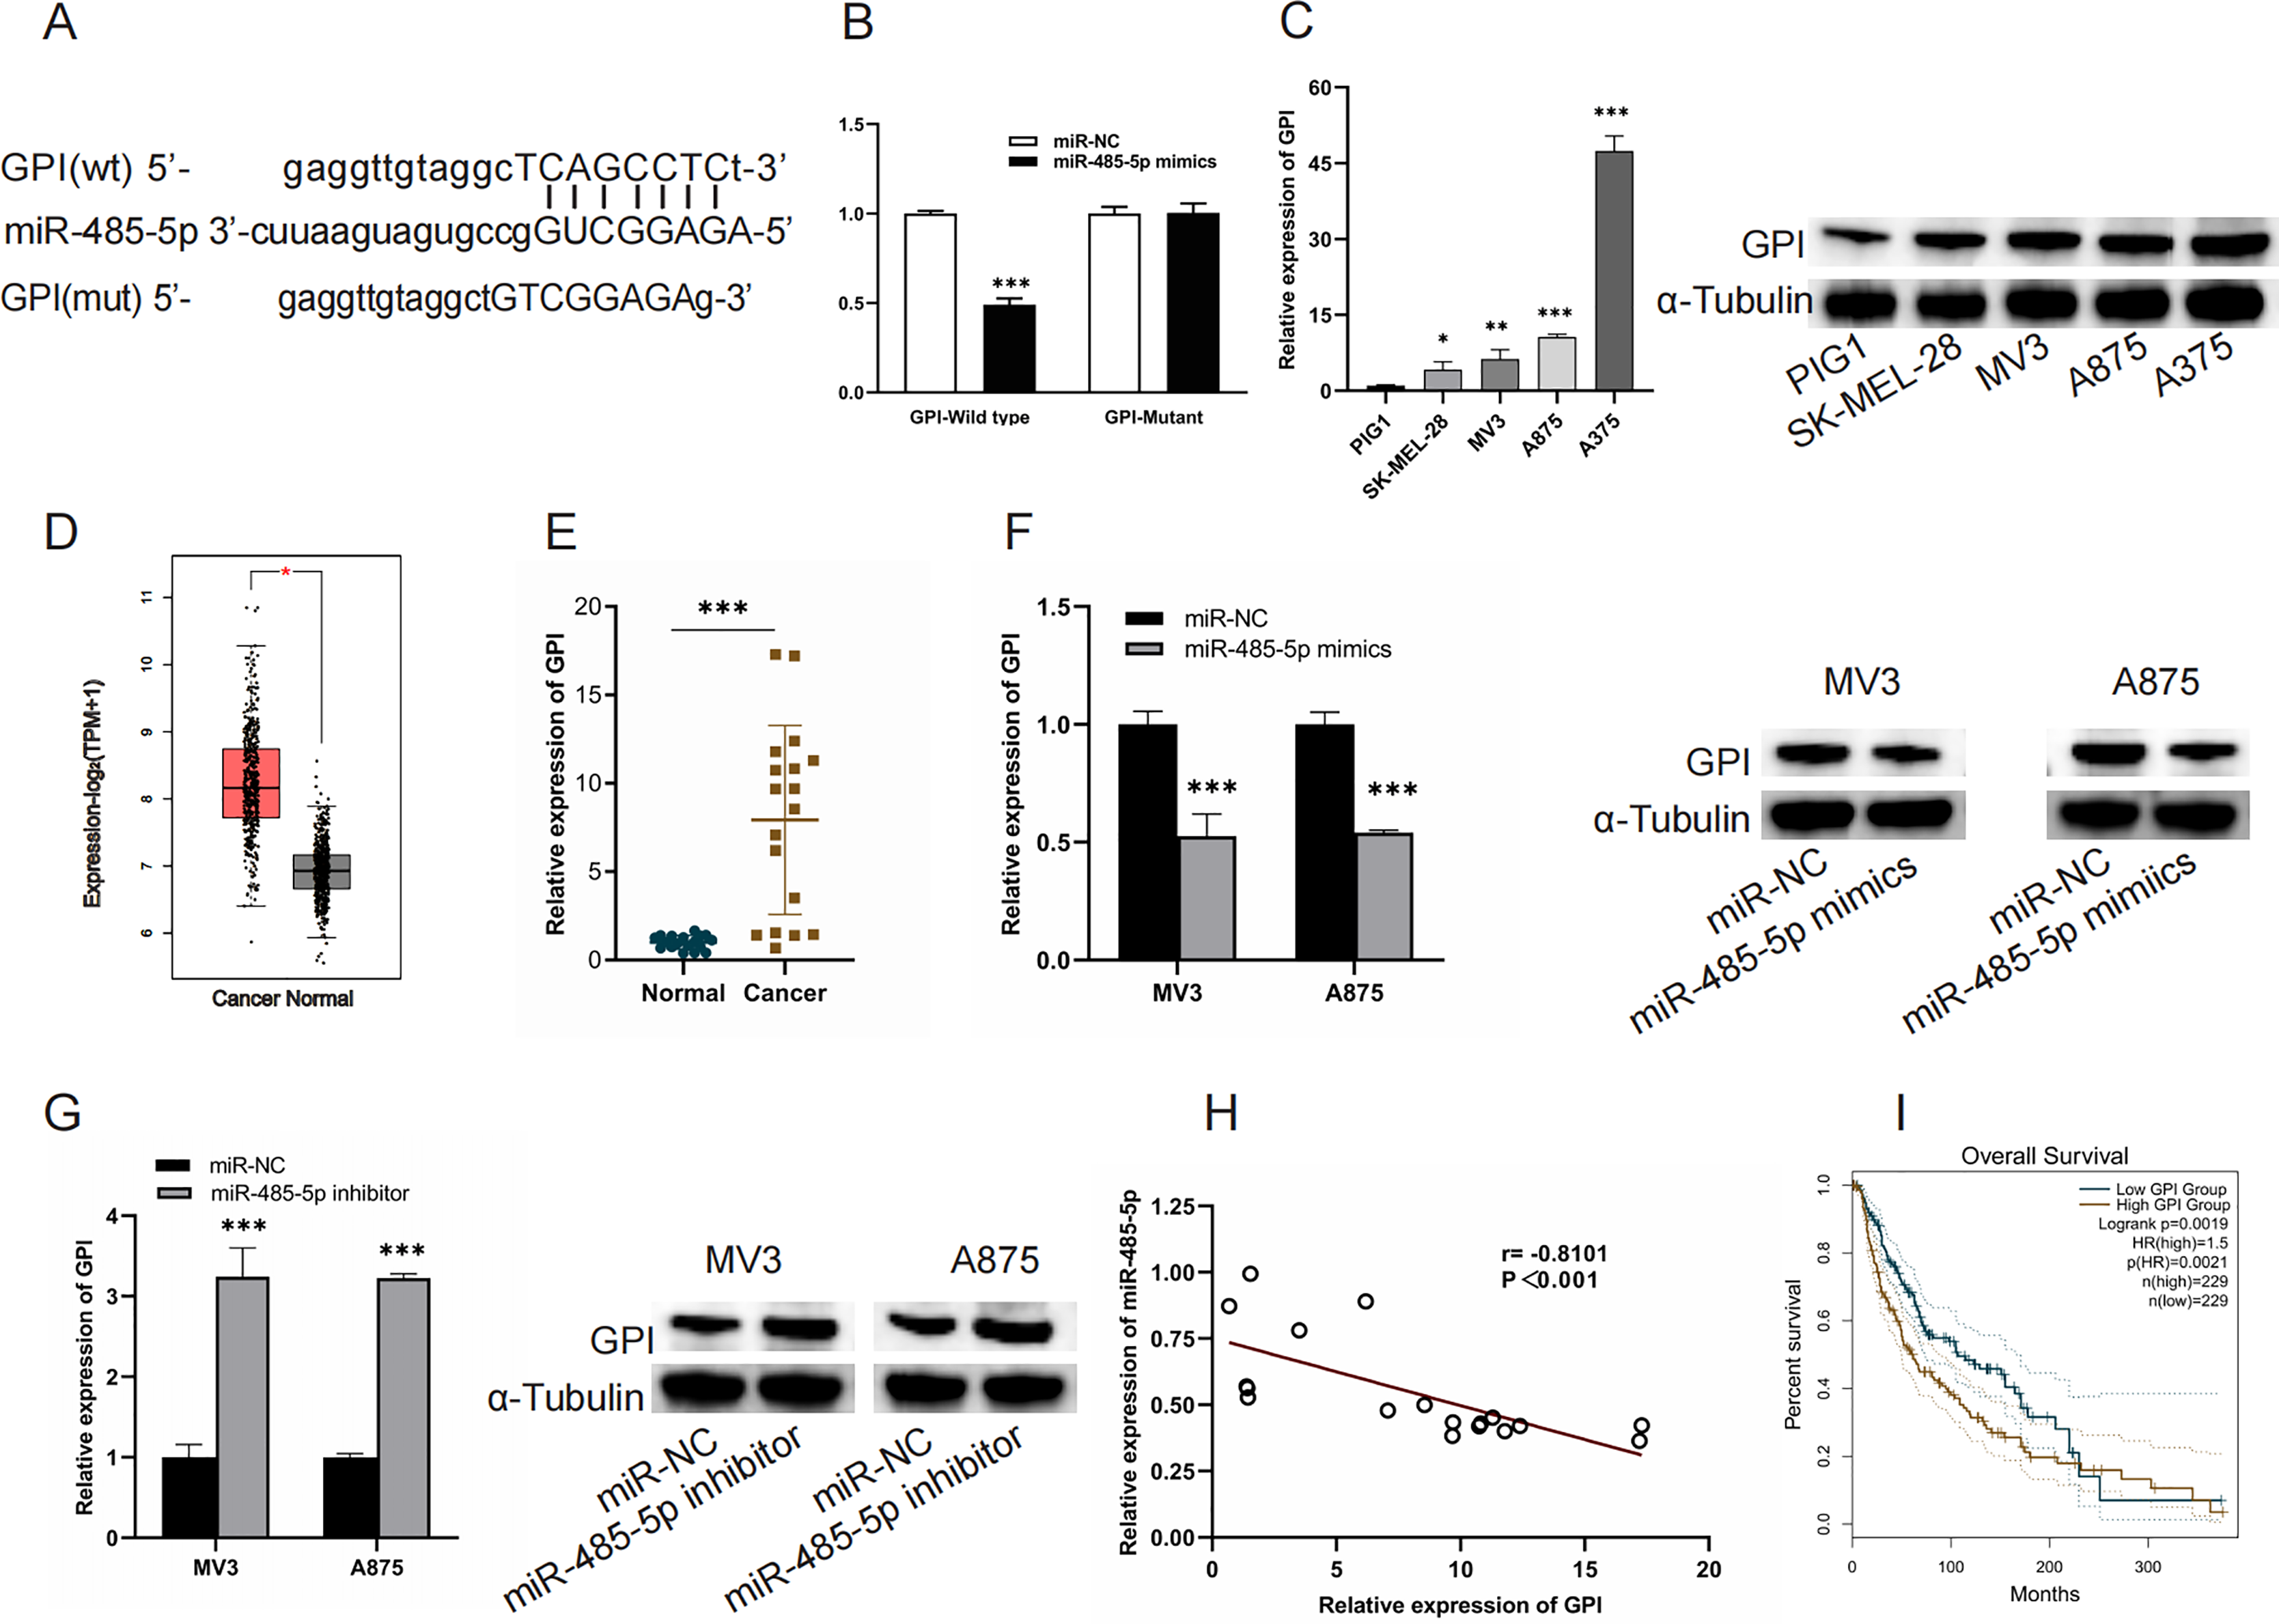
CYTOR enhances GPI expression by sequestering miR-485-5p
To investigate the impact of the CYTOR/miR-485-5p/GPI signaling pathway in melanoma development, we simultaneously overexpressed CYTOR and miR-485-5p mimics in MV3 and A875 cell lines. In CCK-8 essays, CYTOR overexpression significantly enhanced cell viability. However, co-transfection with pcDNA CYTOR and miR-485-5p mimics resulted in decreased cell proliferation in MV3 and A875 cell lines (Fig. 6A). Similarly, CYTOR overexpression facilitated migration and invasion, but this impact was markedly reduced when cells were co-transfected with pcDNA CYTOR and miR-485-5p mimics (Figs. 6B and 6C). Furthermore, Western blot analysis demonstrated that miR-485-5p mimics effectively reversed the alterations in GPI protein levels induced by CYTOR overexpression in melanoma cells (Fig. 6D). In conclusion, our findings suggest that the CYTOR/miR-485-5p/GPI pathway contributes to the regulation of melanoma aggressiveness.
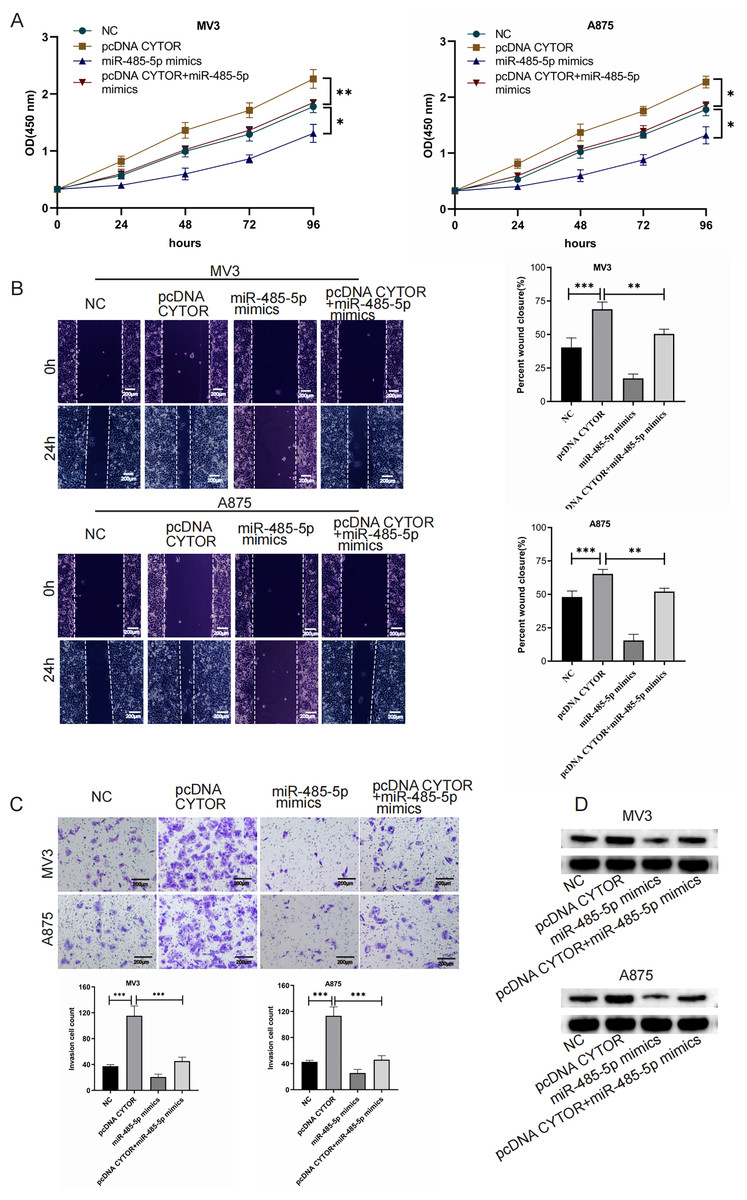
Figure 6: CYTOR enhances GPI expression by sequestering miR-485-5p.
Melanoma cells were co-transfected with pcDNA CYTOR and miR-485-5p mimics. (A) 24 h after transfection, the CCK-8 assay was employed to evaluate the proliferative capacity of MV3 and A875 cells. (B and C) Migration and invasion assays were conducted. (D) Western blot analysis was performed, *P < 0.05, **P < 0.01, ***P < 0.001.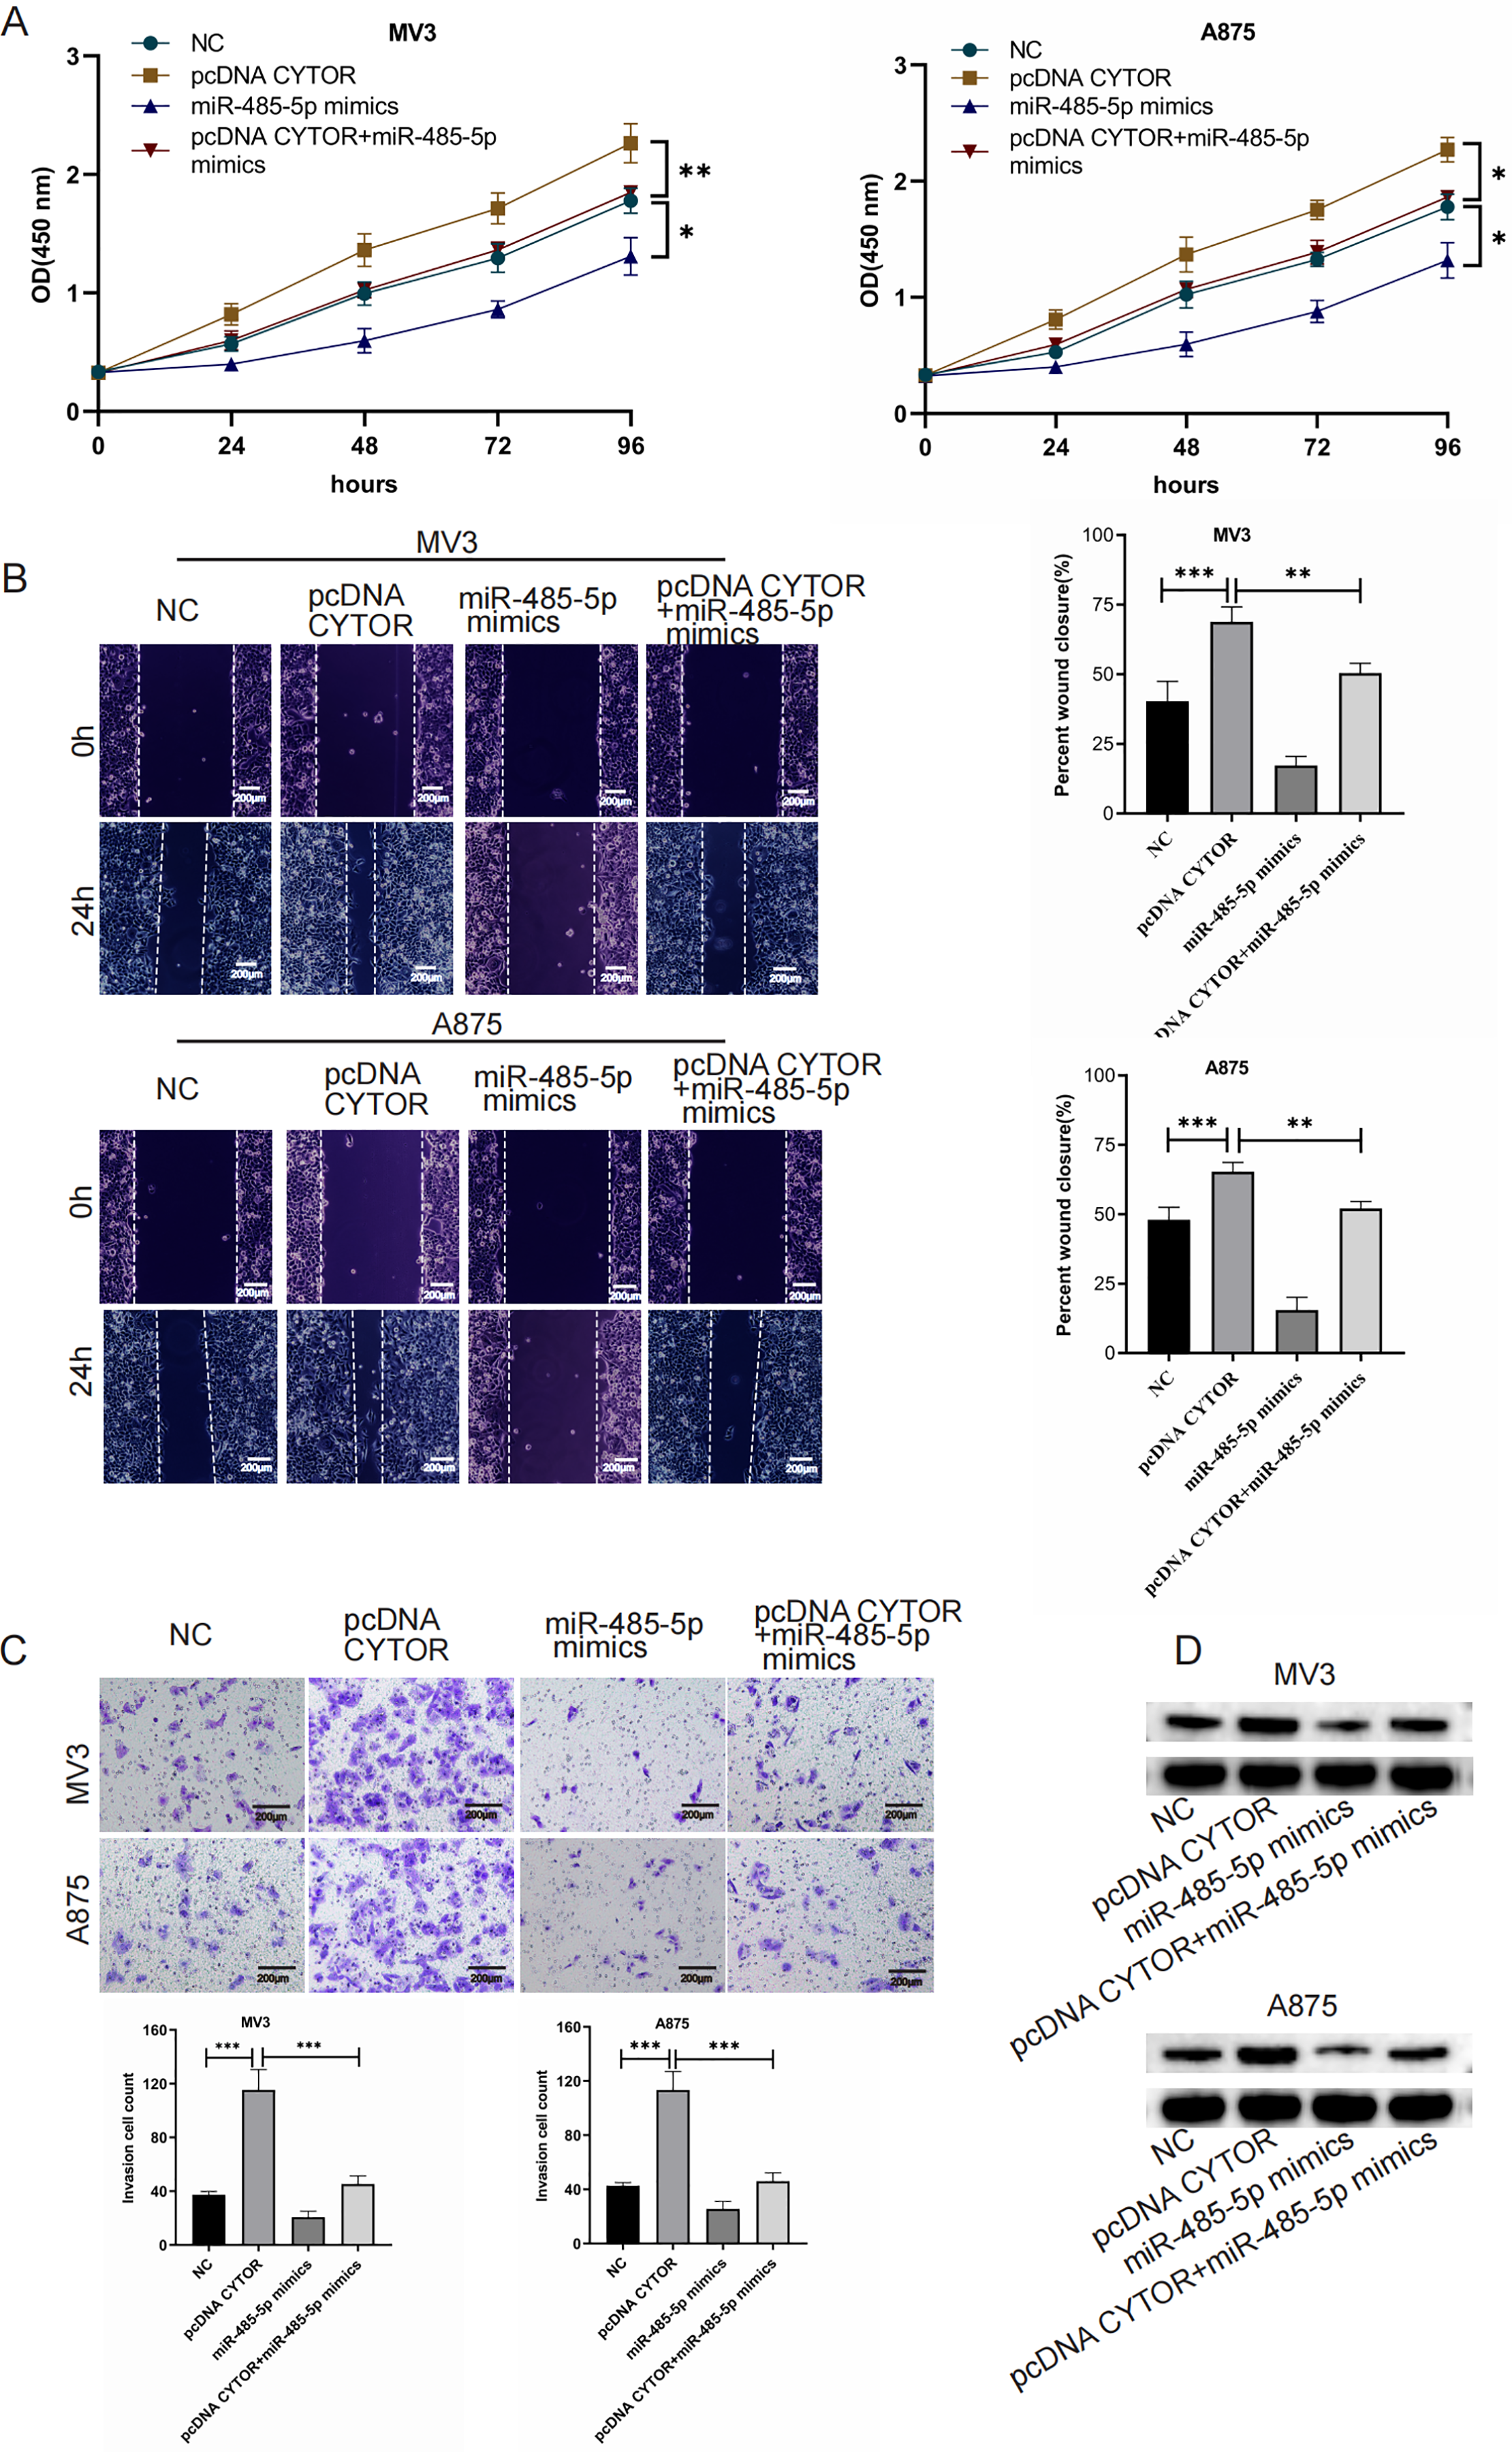
CYTOR suppression impedes the growth of melanoma cell xenograft tumors in vivo
Finally, we aimed to investigate the role of CYTOR in regulating tumorigenesis in vivo by establishing a xenograft model. Nude mice were implanted with A375 cells transduced with either control or sh-CYTOR lentiviral vectors. The results revealed that CYTOR silencing significantly inhibited tumor growth (Figs. 7A–7C). Tumors transduced with the sh-CYTOR lentivirus exhibited significantly higher levels of miR-485-5p compared to control tumors (Fig. 7D). Furthermore, Western blotting verified that GPI levels were markedly decreased in tumors infected with the sh-CYTOR lentivirus compared to control tumors (Fig. 7E). These findings demonstrate that CYTOR downregulation is sufficient to suppress melanoma tumor growth in vivo.
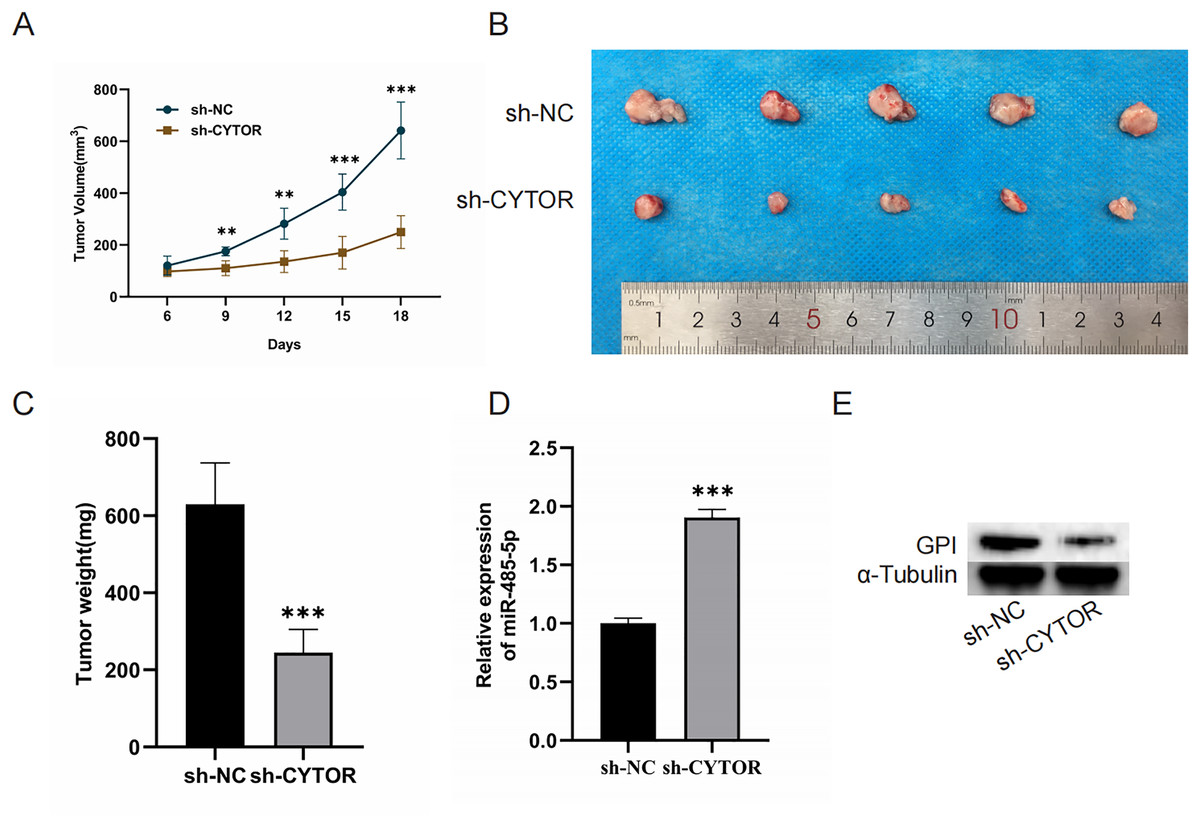
Figure 7: CYTOR suppression impedes the growth of melanoma cell xenograft tumors in vivo.
(A) Tumor volume was recorded at 3-day intervals. (B and C) Tumor weight was evaluated post-excision. (D and E) MiR-485-5p and GPI expression were assessed, **P < 0.01, ***P < 0.001.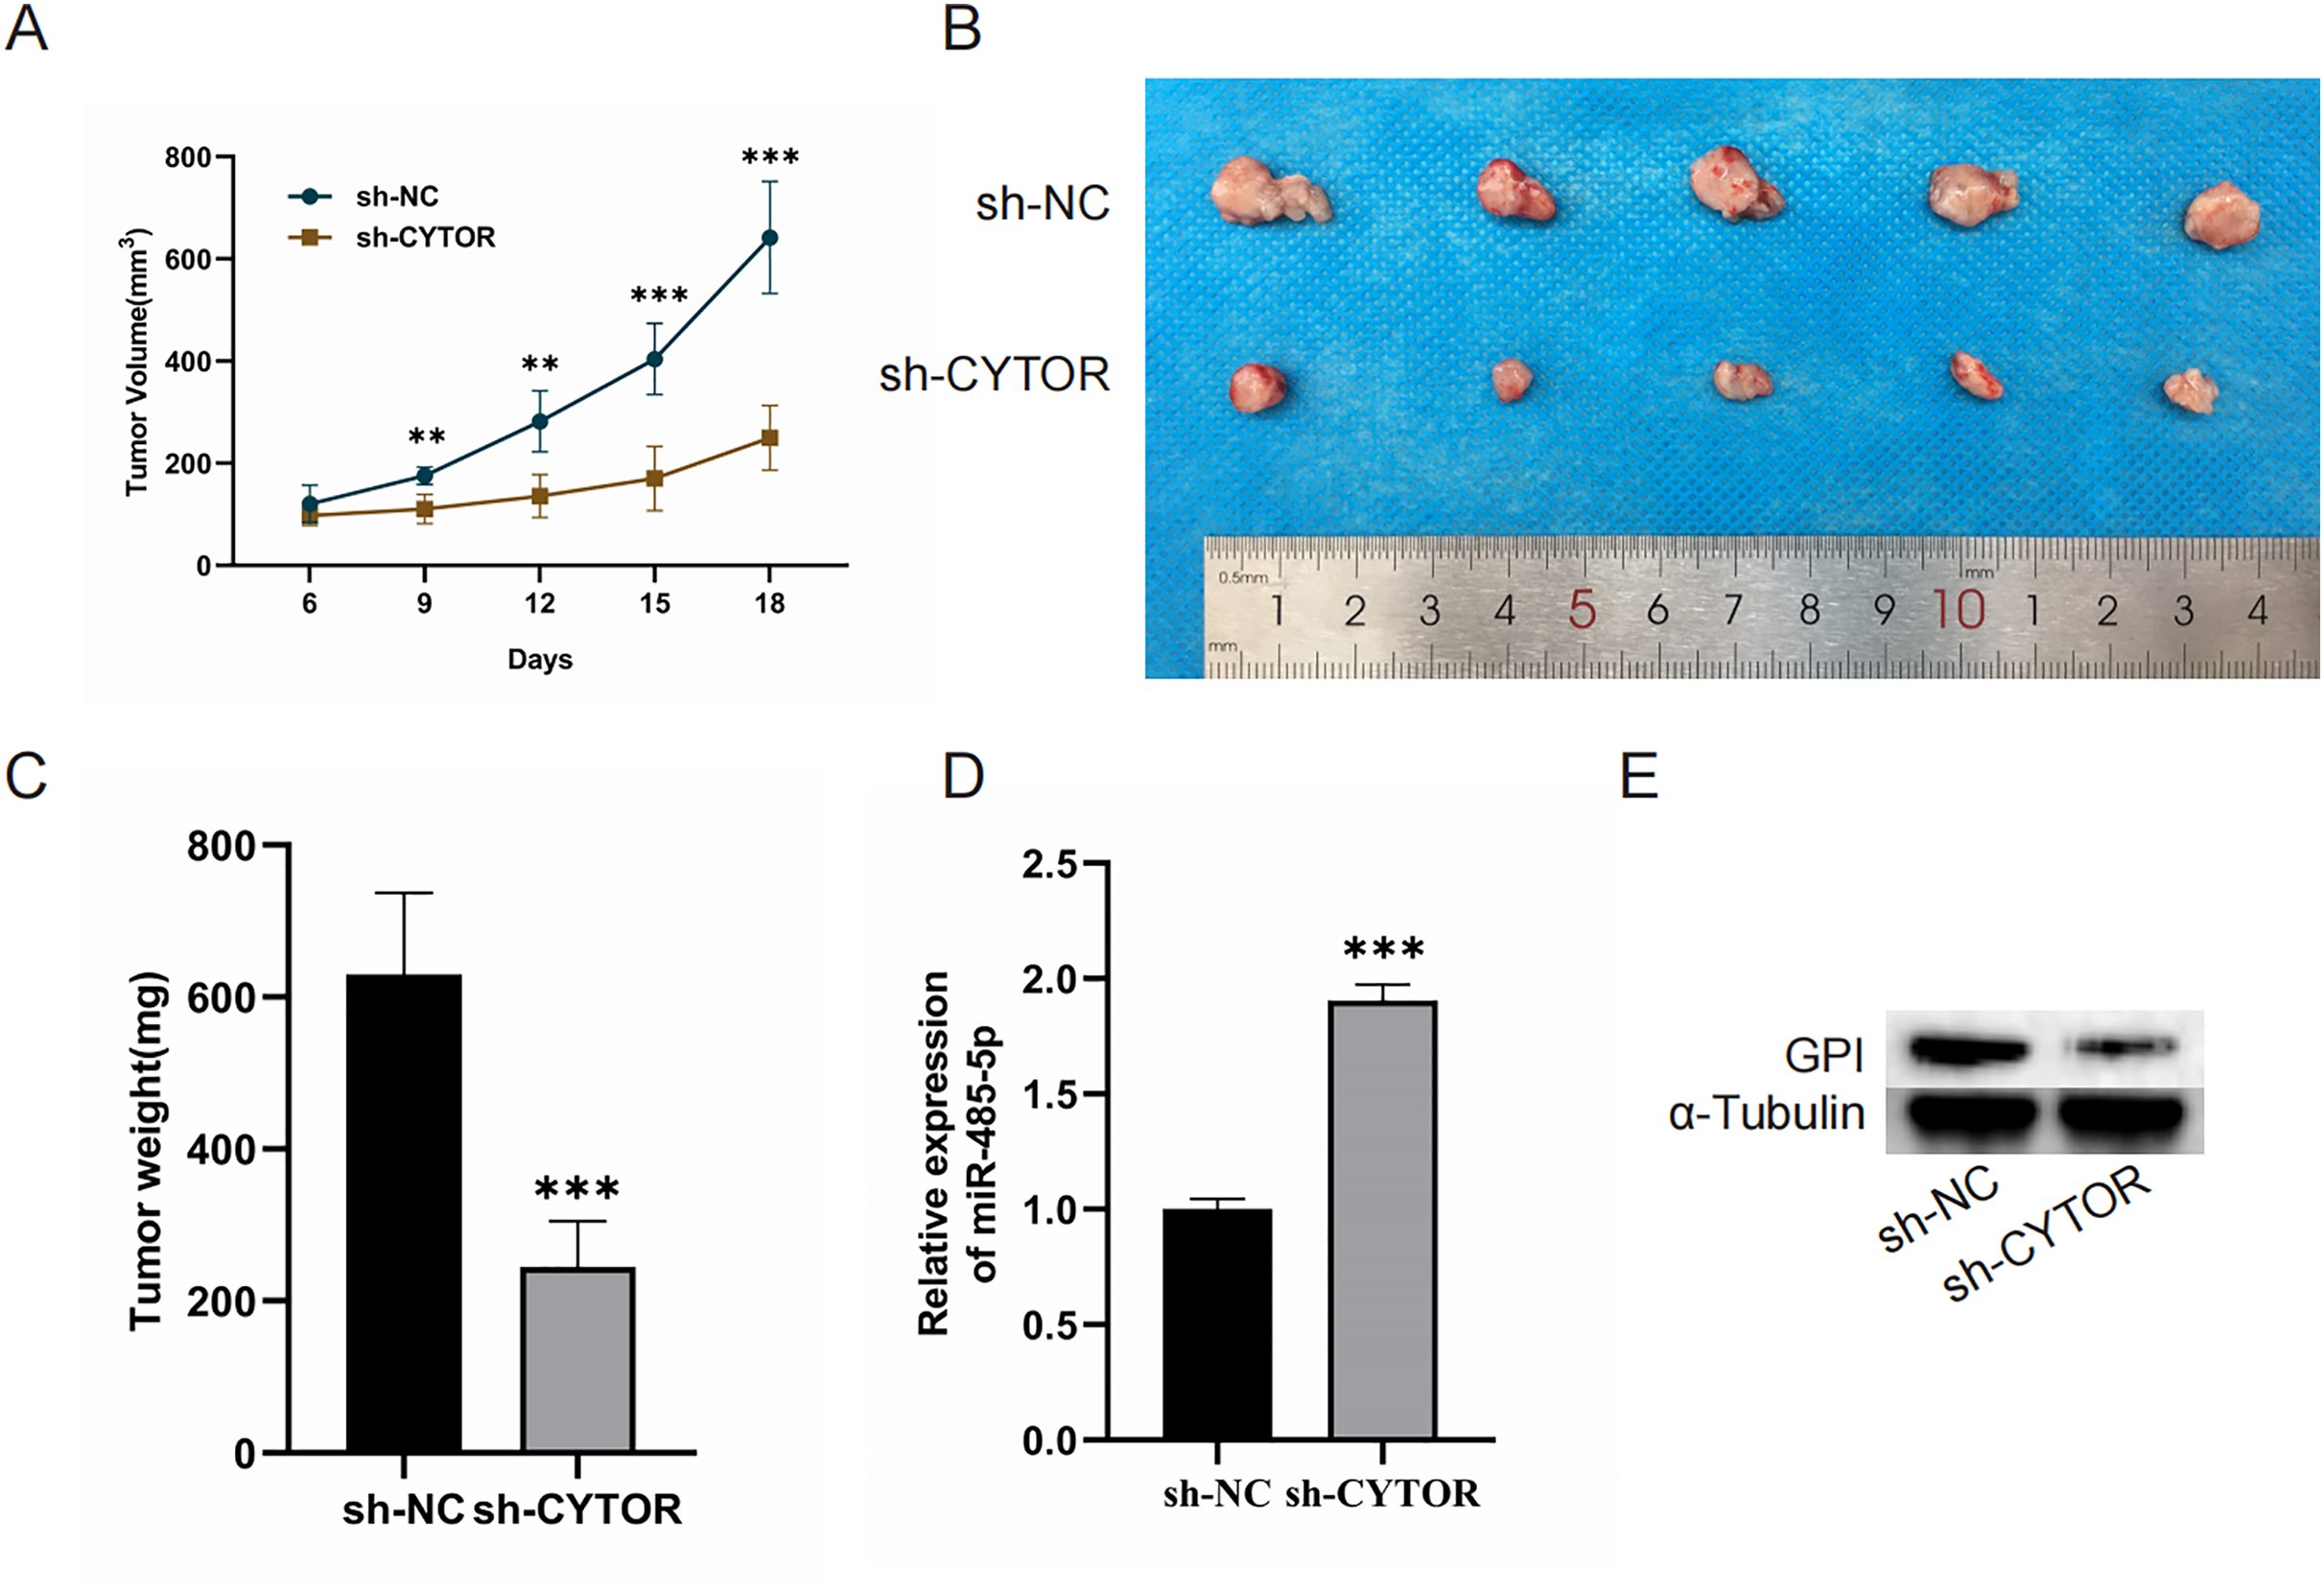
Discussion
A growing body of evidence has shown that long non-coding RNAs (lncRNAs) regulate various pathological processes, with their dysregulated expression significantly associated with the initiation and progression of cancer (Huang et al., 2020; McCabe & Rasmussen, 2021; Tan et al., 2021; Yao et al., 2022). Multiple lncRNAs have been implicated in the advancement of melanoma. For instance, lncRNA MEG3 facilitates melanoma progression through the activation of the miR-21/E-cadherin (Wu et al., 2020). LncRNA FOXD3-AS1 enhances the proliferation, invasion, and migratory capabilities of cutaneous malignant melanoma by modulating the miR-325/MAP3K2 axis (Chen et al., 2019). LncRNA LENOX is detected at all established stages of melanoma and is linked to the progression of the disease (Gambi et al., 2022). In this study, CYTOR was significantly upregulated in melanoma patients. Through both knockout and overexpression analyses, we confirmed that CYTOR promotes melanoma cell progression in vitro. These findings were further validated by xenograft models, where CYTOR knockdown resulted in suppressed tumor growth. Collectively, these results demonstrate that CYTOR functions as a pro-oncogenic factor in melanoma progression. The lncRNA CYTOR also plays a critical role in the chemotherapy resistance in oral squamous cell cancer and triple negative breast cancer by regulating MAPK/ERK pathways (Liu et al., 2019; Chen et al., 2021). Our results showed the significant elevation of CYTOR expression in several melanoma cell lines suggesting that CYTOR could be considered a diagnostic biomarker and potential target for resistance treatment in melanoma therapy. It will be worthy of further investigation of CYTOR’s role in regulating tumor progression in resistant melanoma cell lines.
The ceRNA hypothesis plays a pivotal role in the regulation of malignancies. LncRNAs influence the de-repression of miRNA targets and provide supplementary post-transcriptional regulation by functioning as miRNA sponges. FISH assays revealed that CYTOR was primarily localized in the cytoplasm of melanoma cells, indicating its potential role as a ceRNA, likely through sequestering complementary miRNAs and thus promoting melanoma progression. Bioinformatics analysis revealed that miR-485-5p has a complementary binding site targeting CYTOR, a finding further corroborated by dual-luciferase reporter assays. The modulation of gene expression by miRNAs is a mechanism observed in almost all cancer cells (Lujambio & Lowe, 2012). MiRNAs play a critical regulatory role in the initiation, progression, and drug resistance of melanoma (Mirzaei et al., 2016; Sun et al., 2014). MiR-485-5p has been identified as a tumor suppressor and is frequently dysregulated in various cancers. MiR-485-5p has been shown to influence the stemness and drug resistance of oral squamous cell carcinoma (Jang et al., 2022). Research has demonstrated that miR-485-5p inhibits cell metastasis and epithelial-mesenchymal transition (EMT), partially by downregulating HMGA2 expression (Chen et al., 2015). Consistent with this role, we observed a significant downregulation of miR-485-5p in melanoma tissues and cells, identifying CYTOR as a factor contributing to this downregulation. However, CYTOR expression inhibition was not assessed in normal melanocytes in this study and it’s role in normal melanocytes should be addressed as a top priority in the future studies.
GPI is a cytosolic enzyme widely present in cells and essential for glycolysis. In addition to functioning as a cytokine and growth factor, GPI is recognized for its ability to modulate tumor cell proliferation and motility during the progression of numerous human malignancies. The overexpression of GPI markedly enhances the aggressive phenotype of human colon cancer (Tsutsumi et al., 2009). In endometrial cancer tissues, GPI is overexpressed and mediates EMT through the MAPK signaling pathway (Li et al., 2015). Upregulation of GPI expression can promote cell proliferation (Tsutsumi et al., 2003). Conversely, GPI suppression reduces tumorsphere formation and migration in glioblastoma cells. Therefore, GPI is a viable target for glioblastoma therapy (Li et al., 2016). In this study, we confirmed that miR-485-5p targets and inhibits GPI expression in melanoma cells. GPI expression was ultimately repressed by miR-485-5p but elevated by CYTOR in this cancerous context. Rescue assays revealed that CYTOR indirectly enhanced GPI expression by binding miR-485-5p, thus promoting malignant behaviors in melanoma cells.
lncRNAs regulate gene expression at transcriptional, post-transcriptional, and epigenetic levels. Their dysregulation is implicated in cancer, neurodegenerative disorders, cardiovascular diseases, and metabolic syndromes. RNA-based therapeutic strategies represent a rapidly evolving field in medicine, leveraging the versatility of RNA to target diseases at the genetic level. Several Phase I clinical trials have been using non coding RNA technology to treat refractory/relapsed solid cancer patients (Grillone et al., 2024). Our findings suggest that CYTOR promotes melanoma progression by acting as a miR-485-5p sponge to regulate GPI, positioning CYTOR as a potential therapeutic target for melanoma treatment.
Conclusion
Mechanistic investigations revealed that CYTOR promoted melanoma progression by acting as a competitive endogenous RNA (ceRNA) for miR-485-5p, thereby upregulating GPI expression. Our findings demonstrate that CYTOR promotes melanoma progression by regulating the miR-485-5p/GPI signaling pathway, positioning CYTOR as a promising target for therapeutic intervention in melanoma.