
Seasonal genetic variation and genetic structure of Spodoptera exigua in Liaoning Province, Northeast China: insights from 11 years of microsatellite data
- Published
- Accepted
- Received
- Academic Editor
- Clement Kent
- Subject Areas
- Agricultural Science, Bioinformatics, Entomology, Genomics
- Keywords
- Spodoptera exigua, Genetic structure, Microsatellites, Migration, Seasonal variation, Welsh onion
- Copyright
- © 2025 Yu et al.
- Licence
- This is an open access article distributed under the terms of the Creative Commons Attribution License, which permits using, remixing, and building upon the work non-commercially, as long as it is properly attributed. For attribution, the original author(s), title, publication source (PeerJ) and either DOI or URL of the article must be cited.
- Cite this article
- 2025. Seasonal genetic variation and genetic structure of Spodoptera exigua in Liaoning Province, Northeast China: insights from 11 years of microsatellite data. PeerJ 13:e19243 https://doi.org/10.7717/peerj.19243
Abstract
Background
The beet armyworm (BAW), Spodoptera exigua, is a destructive migratory pest worldwide that has caused severe economic losses in China’s major crop-producing regions. To control this pest effectively, it is crucial to investigate its seasonal genetic variation and population genetic structure in northern China.
Methods
In this study, we used eight nuclear microsatellite loci to investigate the seasonal genetic variation and genetic structure of BAW in Shenyang, Liaoning Province, Northeast China, from 2012–2022, collected from a single location on Welsh onion.
Results
Microsatellite data revealed moderate levels of genetic variation among 50 seasonal populations of BAW sampled from 2012–2022, along with significant genetic differentiation among these populations. Neighbor-joining dendrograms, STRUCTURE analysis, and principal coordinate analysis (PCoA) revealed two genetically distinct groups: the SY2012–2018 group and the SY2019–2022 group. Our results revealed seasonal variation in the genetic subconstruction at this location, which may be related to the presence of different migratory individuals throughout the year. Accordingly, our unique insights into the population genetics of BAW will contribute to the development of effective management strategies for this migratory pest.
Introduction
The beet armyworm (BAW), Spodoptera exigua (Lepidoptera: Noctuidae), is a major polyphagous pest affecting a wide range of crops, including vegetables, maize, cotton, soybeans, and ornamental plants (Adamczyk et al., 2009; Guo, Wu & Wan, 2010). In general, BAW larvae feed on the leaves of host plants, resulting in reduced crop yields and potential plant death. Originally from South Asia, this species is now widely distributed across the tropical and temperate regions of Europe, Africa, North America, and Asia (Wei et al., 2010). In China, BAW was first recorded in Beijing in the 1890s. It is widely distributed in the primary crop-producing regions of China and has caused significant economic losses in recent years. For example, the beet armyworm has spread to several provinces in North China and East China, infesting a total area exceeding 2.7 million hectares (Luo, Cao & Jiang, 2000). This pest particularly affects Welsh onions in northern China, which infest over 8,000 hectares in Tianjin and result in a 30% reduction in annual Welsh onion production (Zheng et al., 2009; Zhu et al., 2010).
BAW is a polyphagous insect known for its high fecundity and long-distance flight capabilities (Feng et al., 2003; Adamczyk et al., 2009). Typically, the eggs of this species are laid on the undersides of leaves. Newly hatched larvae feed gregariously on the upper surfaces of the leaves, whereas third-instar larvae begin to feed solitarily. By the fourth instar, they start consuming a variety of plant parts, including leaves, petals, and pods. Pupae predominantly overwinter in the soil, with no overwintering occurring in South China. BAW can reproduce year-round, and no diapause behavior has been observed (Zheng et al., 2011). Previous studies have indicated that BAW migrates seasonally once a year in eastern China (Si et al., 2012). There were significant interannual and seasonal variations in the capture number of BAW in northern China from 2012 to 2022, and the number of BAW also increased significantly during these years, which will contribute to a deeper understanding of population dynamics in northern China and provide a theoretical basis for regional monitoring, early warning, and the development of effective management strategies for long-range migratory pests (Ma et al., 2024). In addition, chemical pesticides remain the primary method for pest control. However, the prolonged use of these insecticides has led to the rapid development of resistance in BAW, notably to chlorinated hydrocarbons and carbamates (Chaufaux & Ferron, 1986). Therefore, effectively controlling this pest is difficult.
Populations of short-lived organisms can adapt to seasonal changes through various mechanisms, including genetic polymorphisms and phenotypic plasticity. These populations typically harbor significant adaptive genetic variation, enabling them to respond rapidly to environmental shifts (Brennan et al., 2019). The genetic variation and population genetic structure of a species can be influenced by numerous factors, including climate change, ecological conditions, natural barriers, migration patterns, and human activities (Fairley, Renaud & Conn, 2000; Prugh et al., 2008; Pauls et al., 2013; Nater et al., 2013). Currently, a range of molecular markers are utilized to reveal the biogeography and evolutionary history of this species (Susanta, 2006). Owing to its moderate evolutionary rate and distinct evolutionary pattern, the cytochrome c oxidase subunit I (COI) gene is well suited for reconstructing species phylogenies (Hebert et al., 2003; Wang et al., 2014). Owing to their high codominance and significant polymorphism, microsatellite markers have been widely utilized in population genetics studies (Aggarwal et al., 2007; Wang, Shen & Gao, 2007; Zhu et al., 2020). Previous studies using amplified fragment length polymorphism (AFLP) and mitochondrial genes (e.g., mtDNA COI and Cytb) have indicated low levels of genetic variation and differentiation among BAW populations, with no clear phylogeographic structure (Niu et al., 2006; Wang et al., 2014; Wang & Zhou, 2016; Zhou et al., 2017). In contrast, two genetically distinct groups have been identified in Iran and western China (Golikhajeh et al., 2018; Wang et al., 2020). These studies provide valuable information for understanding the dispersal patterns and causes of outbreaks of pest species. However, accurate assessments of the genetic diversity and population genetic structure of this pest across large temporal scales in northern China have not been performed.
In the present study, we investigated the seasonal genetic variation and structure of BAW in northern China. We utilized microsatellite loci to assess genetic variation, genetic differentiation, and population structure across 50 seasonal populations of BAW collected from October 2012 to 2022 in Shenyang, Liaoning Province. Additionally, we discuss potential management strategies for this species. This research aims to deepen our understanding of the population genetics of this moth and provide a robust theoretical foundation for developing effective pest management strategies.
Materials and Methods
Sample collection and DNA extraction
A total of 1,095 male adult BAW individuals of 50 seasonal populations were collected via three sex pheromone traps (Pherobio Technology Co. Ltd., Beijing, China) in a Welsh onion field, covering an area of approximately one hectare (123.57°N, 41.82°E) over a period of 11 years, from June to October 2012 to 2022 in Shenyang, Liaoning Province. The distance between the three traps set in the field is 30 m. The traps used were cylindrical plastic devices, approximately 30 cm in height and 18 cm in diameter, with 16 one-way entrances on the top designed to capture pests. The pheromones used in this study were contained in small PVC lures (Pherobio Technology Co., Ltd., Beijing, China). The cis-9, trans-12-tetradecadienyl acetate and cis-9-tetradecadienol are the key components of pheromones (Ma et al., 2024). The number of trapped male adult BAW individuals was recorded weekly, and the trap lures were replaced every 2 weeks. Samples were collected on private land with permission of the land owners (Guo-Qing Xu). All the BAW samples were preserved in 95% ethanol at −20 °C and stored at the Plant Protection College, Shenyang Agricultural University, Shenyang, China. Details regarding the locations of the populations and the number of samples are provided in Table S1. The samples were collected from private land with the permission of the landowners, and none of the field surveys in this study involved endangered or protected species. Genomic DNA was extracted from individual samples via Qiagen’s DNeasy Blood & Tissue Kit (Qiagen, Valencia, CA, USA) following the manufacturer’s protocols. Field experiments were approved by the Chinese Academy of Agricultural Sciences (project number: 201003025).
Microsatellite amplification and genotyping
In this study, individuals were genotyped via eight loci (Spe06, Spe07, Spe08, Spe09, Spe10, Spe11, Spe12, and Spe15) from a set of polymorphic microsatellite loci provided by Kim et al. (2012). Each microsatellite locus was assigned a unique fluorophore for fluorescent tagging of the DNA. For these isolated microsatellites, each PCR mixture consisted of 1.0 units of EasyTaq DNA polymerase, 2.5 mM dNTP mixture, 0.5 µL of DNA template, 1× EasyTaq® buffer (containing 2 mM MgCl2; TransGen Biotech Co., Ltd., Beijing, China), and 0.4 µM of each primer, which was labelled with the fluorochromes HEX or FAM (Sangon Biotech, Shanghai, China). The PCR amplification conditions were as follows: initial denaturation at 94 °C for 4 minutes, followed by 30 cycles of denaturation at 94 °C for 30 s, annealing at 58 °C for 30 s, and extension at 72 °C for 30 s. A final extension was performed at 72 °C for 5 min. After amplification, the products were visualized at Sangon Biotech Co., Ltd. (Shanghai, China) via an ABI 3730XL automated sequencer (Applied Biosystems, Foster City, CA, USA). The microsatellite alleles were analysed with GeneMapper 4.0 software (Applied Biosystems, Foster City, CA, USA). The raw reads of the amplified fragment length from 1,095 individuals of BAW are shown in Table S2.
Microsatellite data analyses
Genetic variation and genetic differentiation
Micro-Checker 2.2.3 was utilized to detect errors and null alleles in BAW microsatellite genotypes, excluding individuals with missing data (Van Oosterhout et al., 2004). In the basic data table, missing genetic data are replaced with “0”. When Structure software was used for group analysis, the missing data were replaced with “-9”. Genotypic linkage disequilibrium (LD) was assessed for all pairs of loci across populations via Genepop 3.4 with exact probability tests (Raymond & Rousset, 1995). An exact test for Hardy‒Weinberg equilibrium (HWE) was conducted for each locus as well as for all loci within each population.
Genetic diversity indices, including the mean number of alleles (Na), effective number of alleles (Ne), Shannon’s information index (I), observed heterozygosity (Ho), expected heterozygosity (He), and unbiased expected heterozygosity (uHe), were assessed via GenAlEx 6.5 (Peakall & Smouse, 2006). The allelic richness (AR), fixation index (FST), and inbreeding coefficient (FIS) among populations were calculated via FSTAT 2.9.3.2 (Goudet, 1995), whereas the polymorphism information content (PIC) was computed via Cervus 2 (Hearne, Ghosh & Todd, 1992). To assess the degree of genetic differentiation between pairs of BAW populations, we calculated pairwise FST values via Arlequin 3.0 (Excoffier, Laval & Schneider, 2005) and created associated heatmaps of these values via R statistical software 3.0.2 (Dean & Nielsen, 2007).
Temporal genetic structure
To investigate the temporal population structure of BAW, we followed a stepwise process. First, we used POPTREE 2 to construct an unrooted tree via the neighbor-joining method (Takezaki, Nei & Tamura, 2009). Next, we employed a Bayesian clustering model to assess the degree of genetic structure and admixture among populations. The software STRUCTURE 2.3 (Evanno, Regnaut & Goudet, 2005) was utilized to identify clusters of genetically similar populations. We specified an initial range of potential genotype clusters (K) from 1–10 under the admixture model, assuming correlated allele frequencies among populations (Falush, Stephens & Pritchard, 2003). The Markov chain Monte Carlo simulation was run 10 times for each value of K, with a total of 5 × 10⁵ iterations following a burn-in period of 5 × 10⁴. The most likely number of clusters was determined via the ΔK approach values and the mean posterior probability (lnp(D)) values (Evanno, Regnaut & Goudet, 2005), as implemented in Structure Harvester 0.56.3 (Earl & vonHoldt, 2012). The final results were visualized as bar plots by finding the optimal alignment of the ten replicate analyses of the ‘best’ K in CLUMPP 1.1 (Jakobsson & Rosenberg, 2007) and visualized with DISTRUCT 1.1 (Guillot et al., 2012). Third, we conducted principal coordinate analysis (PCoA) on the basis of the covariance of the genetic distance matrix via GenAl 6.41 (Piry, Luikart & Cornuet, 1999). Fourth, we assessed the hierarchical partitioning of genetic structure among groups through analysis of molecular variance (AMOVA), which was performed via Arlequin 3.0 (Excoffier, Laval & Schneider, 2005). As mentioned previously, populations were grouped into (1) genetic structure, (2) year groups, and (3) month groups.
Results
Seasonal and interannual genetic variation
In this study, we used eight microsatellite loci to genotype 1,095 individuals from 50 seasonal populations from 2012–2022 in Shenyang, Liaoning Province, Northeast China. Low null allele frequencies per locus were observed, with an average of 0.066 (Table S3). Furthermore, the average FST values calculated with and without applying the ENA correction were 0.159 and 0.145, respectively, and these values did not differ significantly. Therefore, the presence of null alleles did not affect the FST estimations (Table S4). The average number of alleles (Na) varied from 2.680 in spe06 to 10.300 in spe09, with an overall average of 6.270. The maximum polymorphic information content (PIC) was 0.860 for spe09, whereas the minimum was 0.392 for spe06, resulting in an average PIC of 0.694. Eight microsatellite loci presented a low inbreeding coefficient (FIS) in most BAW populations. The mean observed heterozygosity was 0.569, whereas the expected heterozygosity was 0.597 (Table S5).
Overall, the eight microsatellite loci selected in this study were modestly polymorphic. The average number of alleles (Na) ranged from 2.625 in SY1408 to 7.625 in SY2009 and SY2209 (average = 6.270). The effective number of alleles (Ne) ranged from 1.766–4.295 (average = 3.510). The observed heterozygosity (Ho) ranged from 0.382–0.813, whereas the expected heterozygosity (He) ranged from 0.359–0.673. The unbiased expected heterozygosity (uHe) ranged from 0.367 in SY1408 to 0.750 in both SY2106 and SY2206 (Table S6). Furthermore, the interannual genetic variation analysis revealed that the mean observed heterozygosity (Ho = 0.569) was comparable to the mean expected heterozygosity (He = 0.597) across all the BAW populations (Table 1). The estimates of microsatellite genetic variation varied among the populations. For example, the unbiased expected heterozygosity (uHe) ranged from 0.546 in 2014 to 0.680 in 2020. The average number of effective alleles (Ne) across the different BAW populations was 3.510. The average observed number of alleles (Na) across microsatellite loci ranged from 6.500 in SY2012 to 10.750 in SY2019, with an overall mean value of 6.270 (Table 1). Additionally, the highest number of private alleles was detected in SY1709 and SY2008 (AP = 0.164).
| Pop | Na | Ne | I | H0 | He | uHe | Ap | Hs |
|---|---|---|---|---|---|---|---|---|
| SY2012 | 6.500 | 4.295 | 1.411 | 0.546 | 0.658 | 0.669 | 0.125 | 0.6100 |
| SY2013 | 8.625 | 3.886 | 1.425 | 0.553 | 0.631 | 0.634 | 0.1250 | 0.6344 |
| SY2014 | 8.000 | 2.943 | 1.212 | 0.452 | 0.543 | 0.546 | 0.2500 | 0.5470 |
| SY2015 | 7.875 | 3.807 | 1.362 | 0.529 | 0.618 | 0.621 | 0.2500 | 0.6210 |
| SY2016 | 9.125 | 3.777 | 1.403 | 0.526 | 0.612 | 0.615 | 0.3750 | 0.6159 |
| SY2017 | 8.375 | 3.869 | 1.359 | 0.511 | 0.601 | 0.604 | 0.2500 | 0.6040 |
| SY2018 | 7.625 | 3.675 | 1.279 | 0.521 | 0.561 | 0.564 | 0.1250 | 0.5643 |
| SY2019 | 10.750 | 4.064 | 1.517 | 0.557 | 0.656 | 0.659 | 0.7500 | 0.6593 |
| SY2020 | 10.625 | 4.209 | 1.527 | 0.688 | 0.677 | 0.680 | 0.6250 | 0.6801 |
| SY2021 | 9.375 | 4.092 | 1.500 | 0.647 | 0.668 | 0.671 | 0.1250 | 0.6714 |
| SY2022 | 10.625 | 4.105 | 1.527 | 0.670 | 0.668 | 0.671 | 0.2500 | 0.6710 |
| Mean | 6.270 | 3.510 | 1.272 | 0.569 | 0.597 | 0.619 | 0.052 | 0.6211 |
Note:
Na, observed number of alleles; Ne, effective number of alleles; I, Shannon’s information index; Ho, observed heterozygosity; He, expected heterozygosity; uHe, unbiased expected heterozygosity; AP, number of private alleles; HS, gene diversity.
Population genetic differentiation
On the basis of the microsatellite data, pairwise FST values for genetic differentiation ranged from 0 to 0.473, with 1,038 out of 1,225 comparisons showing significant differences. Overall, a high level of genetic differentiation among the populations was observed, with an average FST of 0.1452. Only a few pairwise FST comparisons revealed no genetic differentiation, as indicated by the low pairwise FST values (Fig. 1).
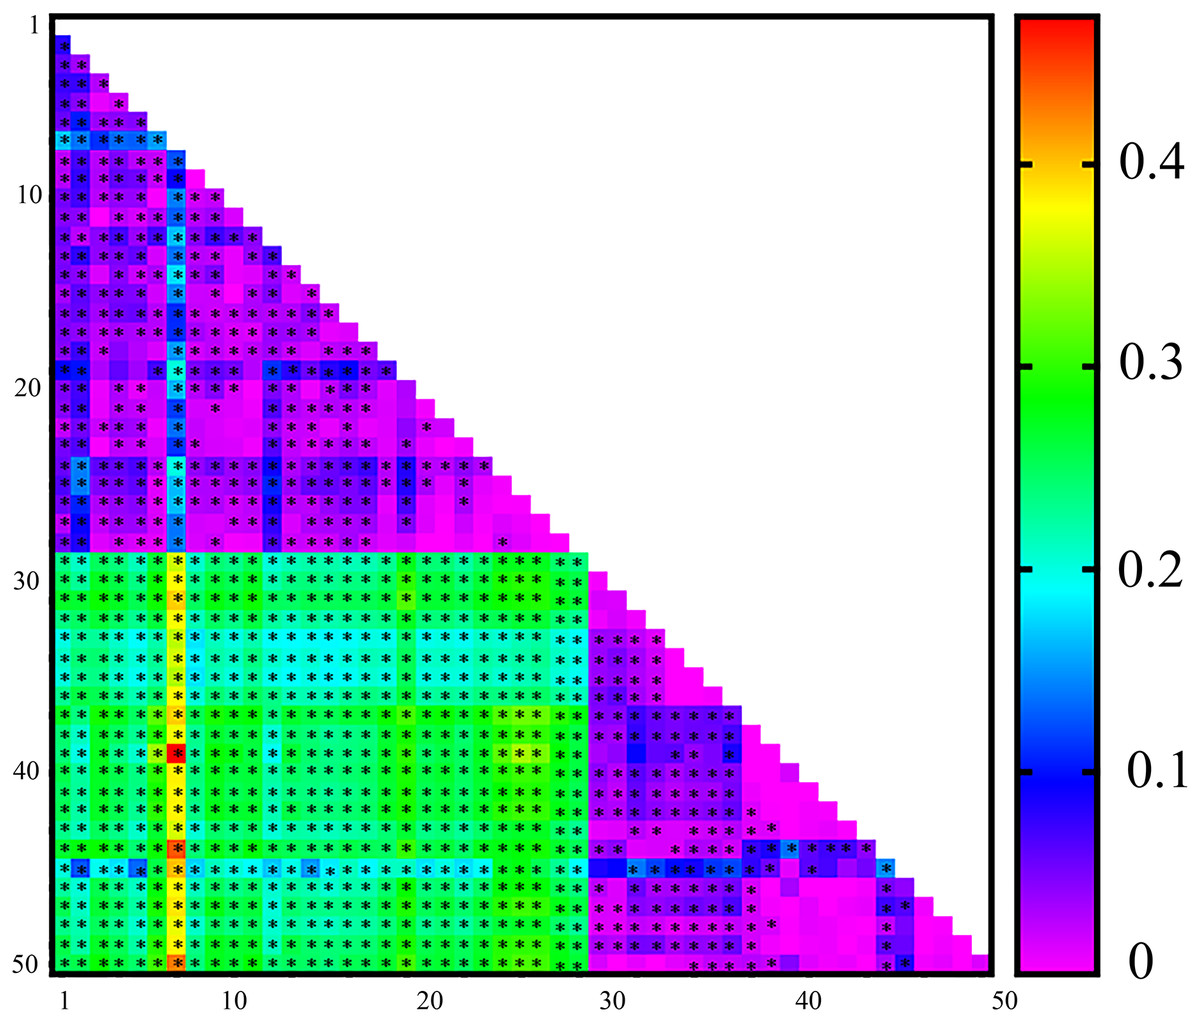
Figure 1: Heatmap of pairwise FST values estimated from microsatellite data for 50 Spodoptera exigua populations collected in Shenyang, Liaoning Province in northern China.
*Indicates significant differences following Bonferroni correction. See Table S1 for population codes.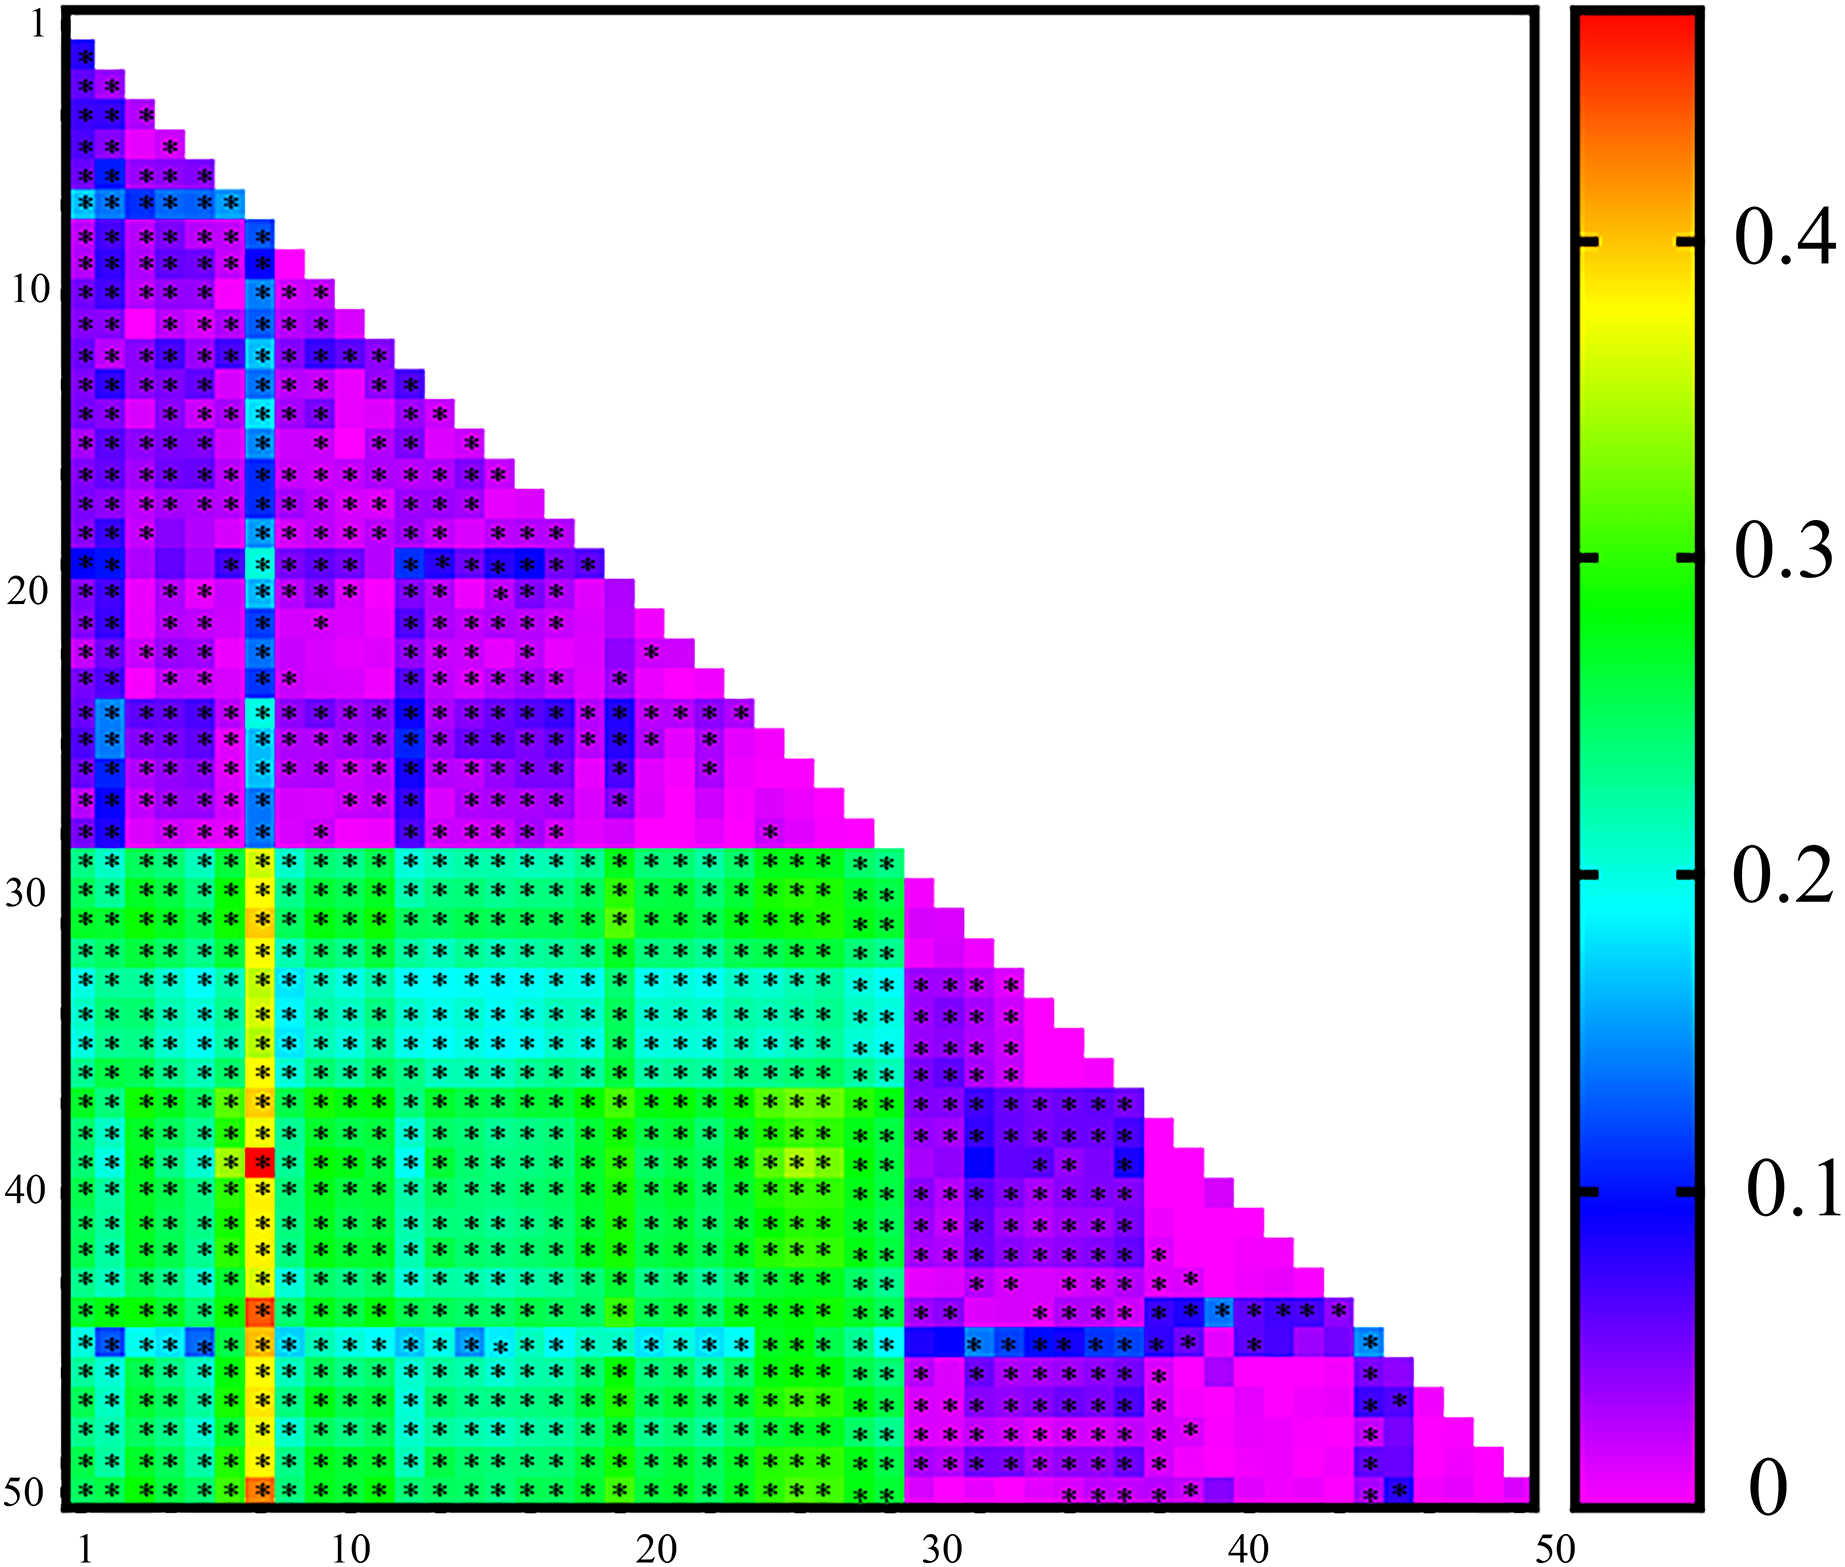
Temporal genetic structure
POPTREE analysis based on microsatellite data
A comparison of samples taken at different times of the year revealed that the BAW genetic signature population in Shenyang significantly increased throughout the year. On the basis of microsatellite data, the unrooted neighbor-joining tree, which included the 50 BAW seasonal populations, revealed two major clades: the SY2012–2018 group and the SY2019-–2022 group (Fig. 2). One clade corresponded to 28 populations collected from 2012–2018, and the second clade was composed of the remaining 22 populations collected from 2019–2022.
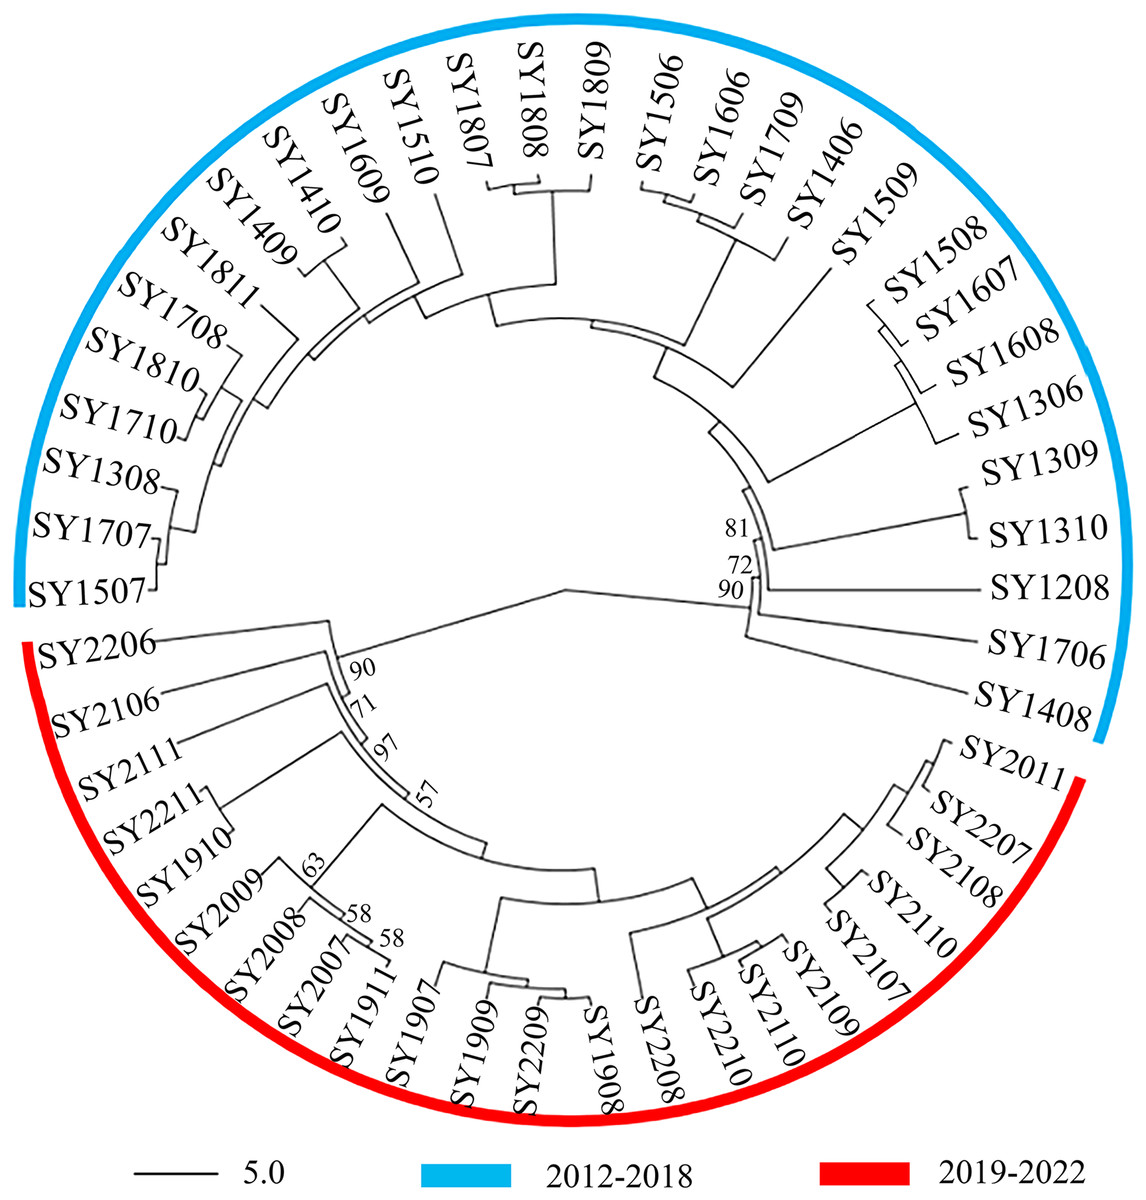
Figure 2: Unrooted neighbor-joining phylogenetic tree based on microsatellite data from 50 seasonal populations of Spodoptera exigua in northern China.
The numbers next to the nodes represent bootstrap values.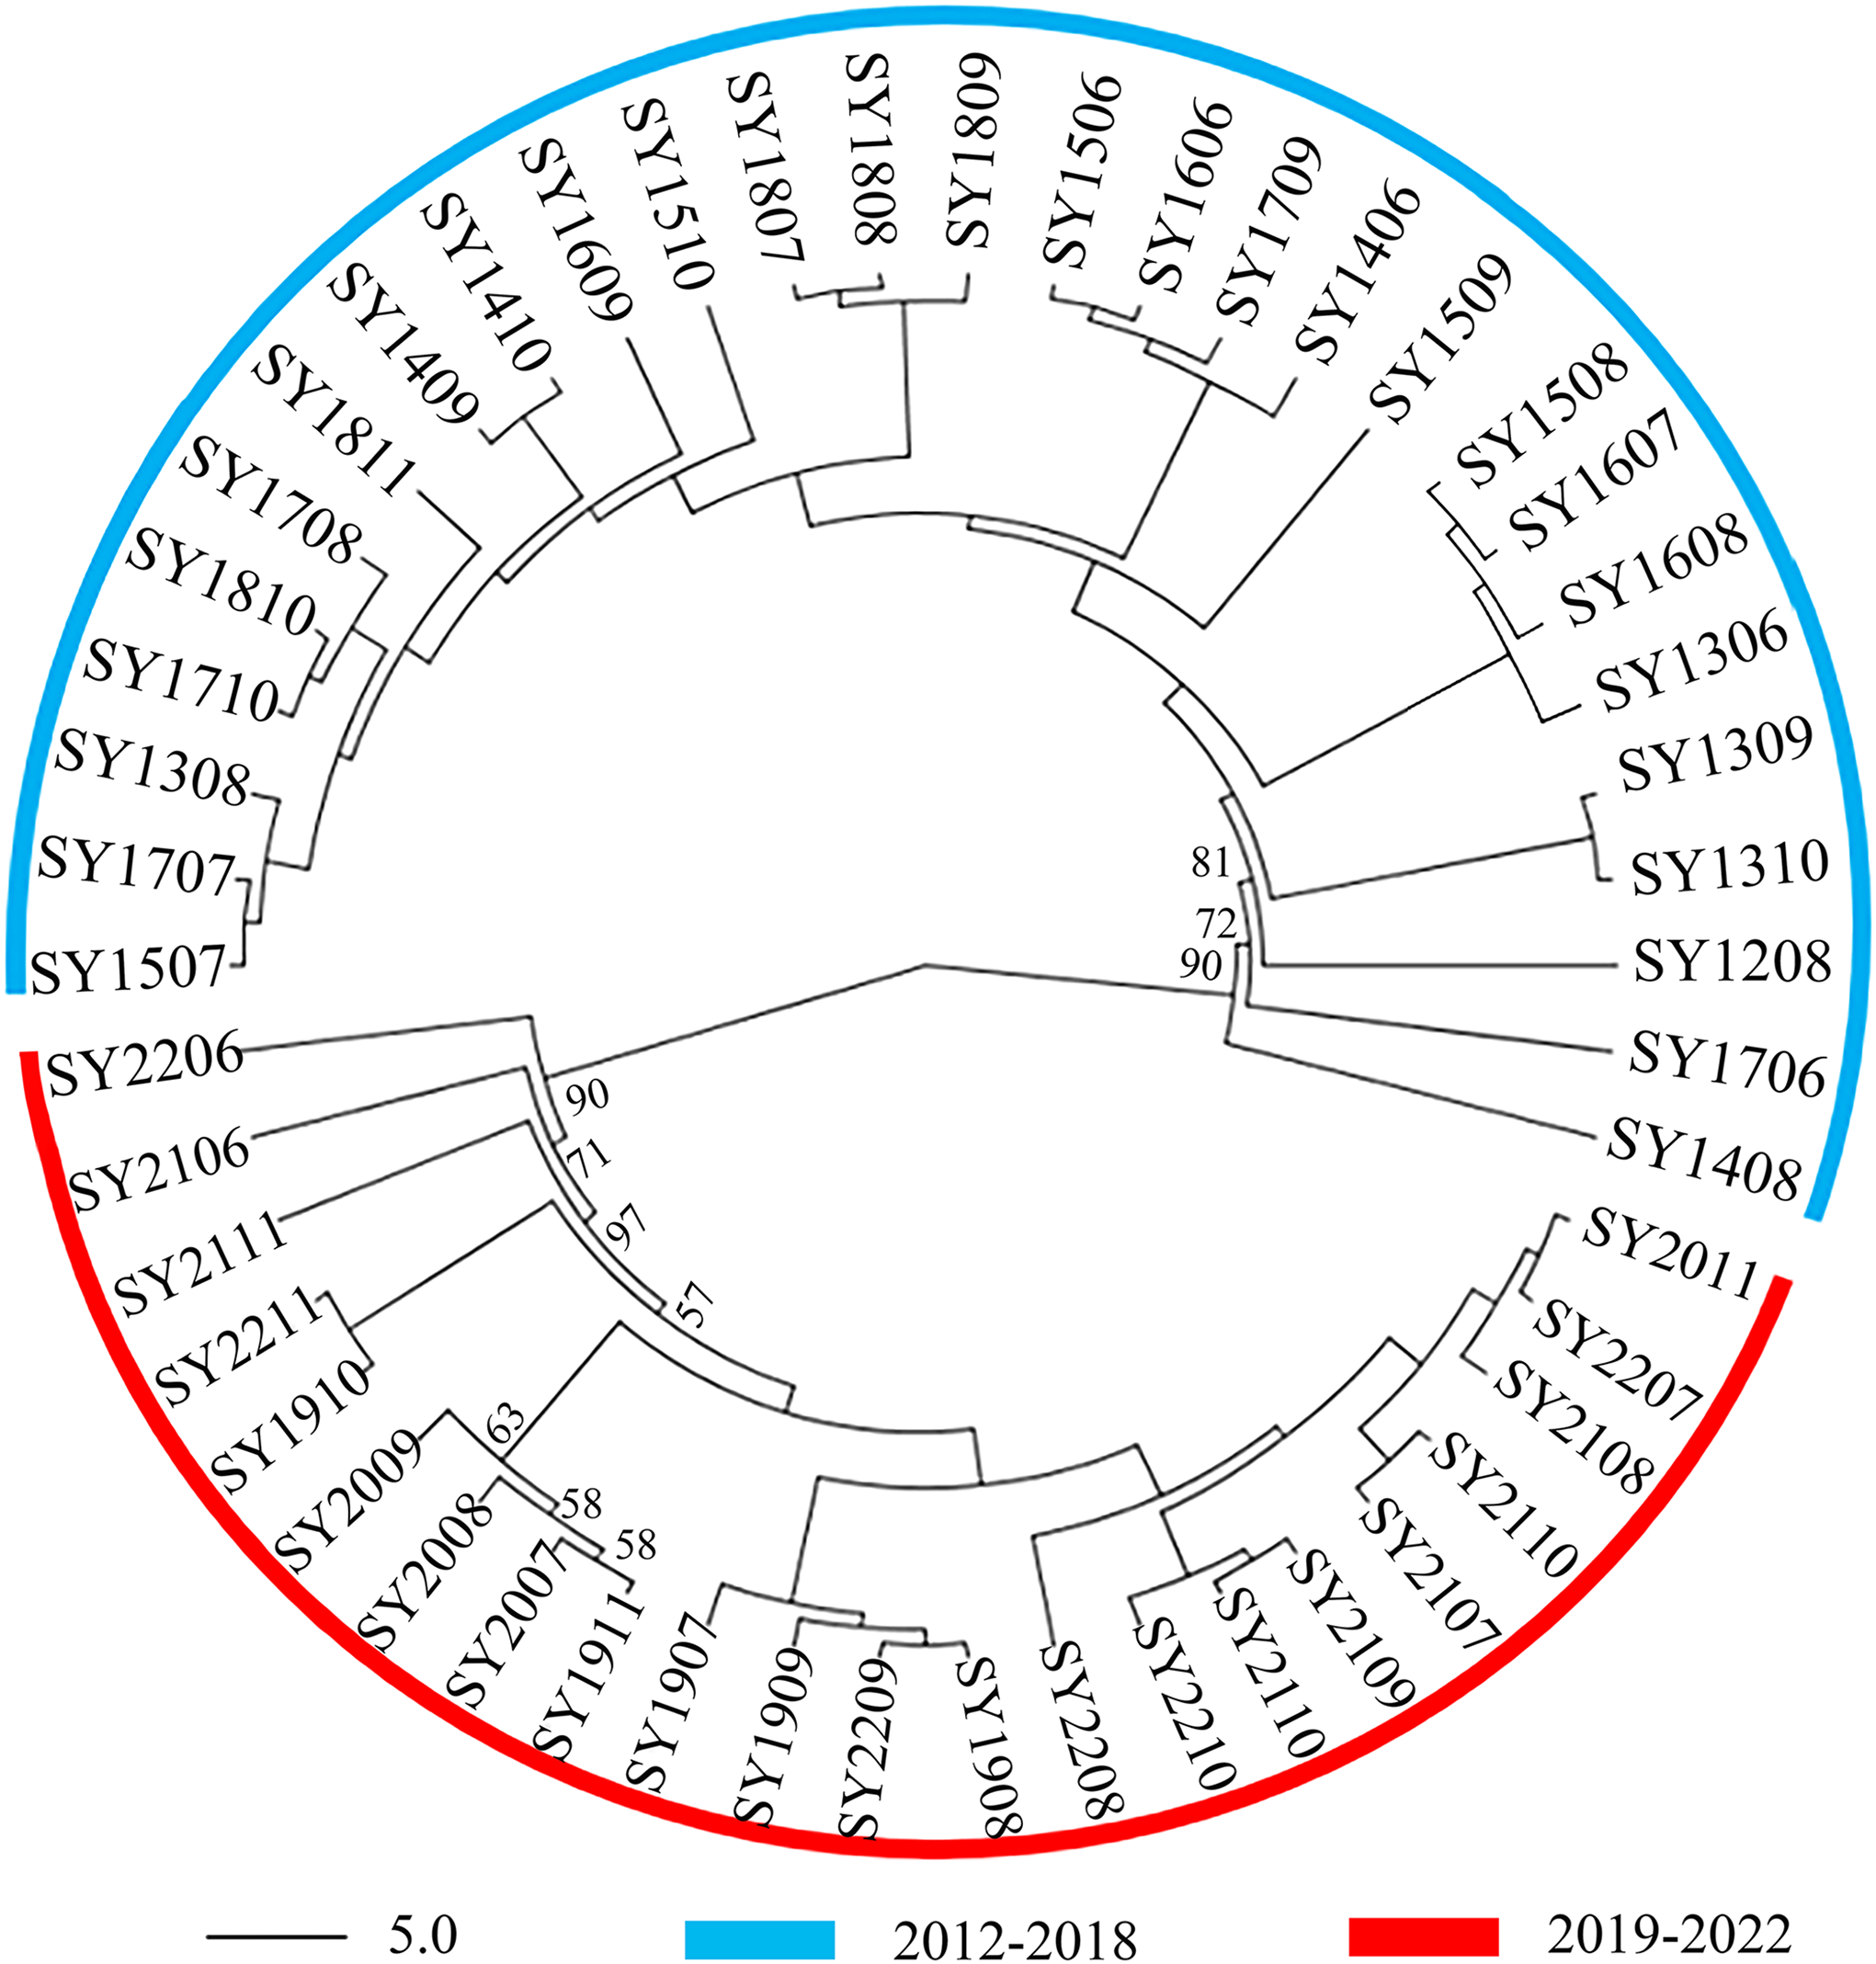
Bayesian clustering
Using microsatellite data, we applied a clustering algorithm in STRUCTURE 2.3.3 to analyse the relationships among the 50 BAW populations in Shenyang (Fig. 3). The mean LnP (D) values gradually increased from K = 2, suggesting that this is likely the optimal number of primary clusters. The highest value of ΔK was reached at K = 2. This result was consistent with the hypothesis that these populations could be divided into two groups: the SY2012–2018 group and the SY2019–2022 group (Figs. 3, 4). One clade corresponded to 28 populations collected from 2012–2018, and the second clade was composed of the remaining 22 populations collected from 2019–2022. This finding aligned with the results from the NJ phylogenetic tree analyses.
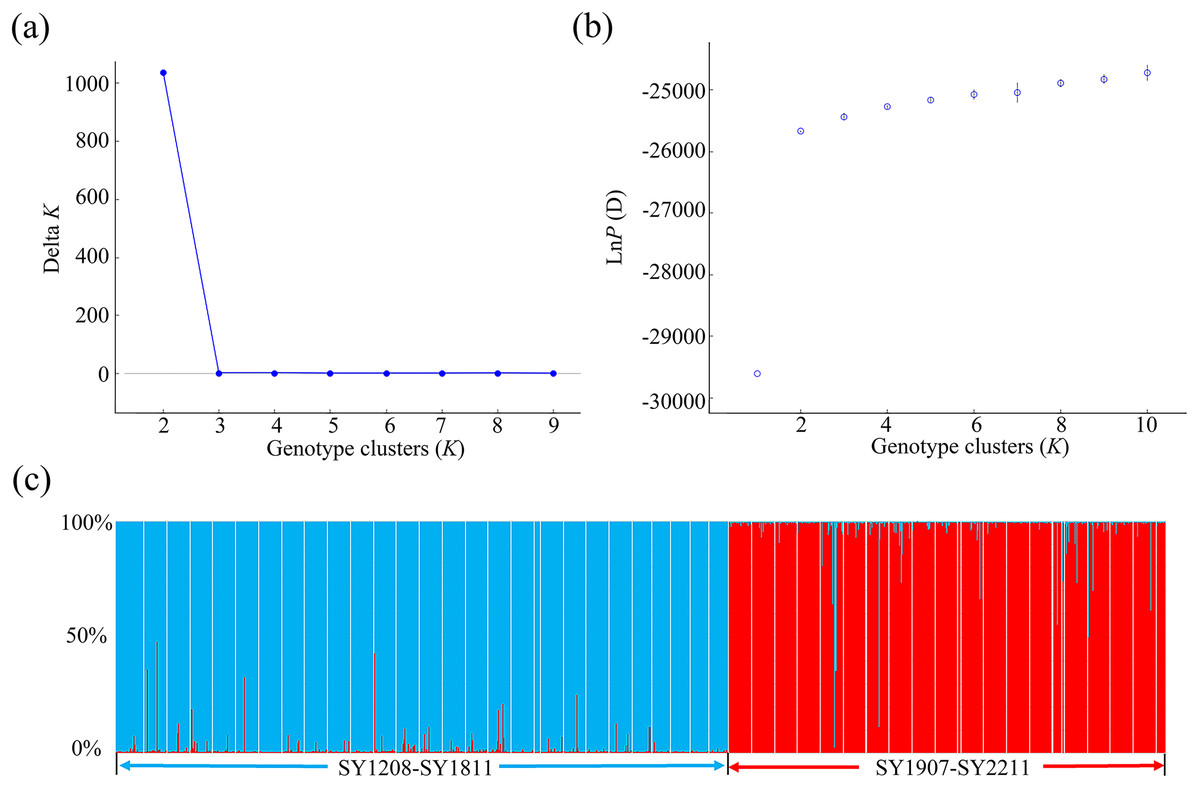
Figure 3: Population structure analysis of 1095 individuals collected from 50 seasonal populations of Spodoptera exigua in northern China on the basis of eight microsatellite loci.
The likelihood of the data is plotted against the number of genetic clusters (K) for (A) the mean posterior probability values (mean lnP (D) values) and (B) ΔK values. (C) Individual Bayesian assignment probabilities for K = 2 are shown, with each individual represented by a single vertical line. The sampling location codes can be found in Table S1.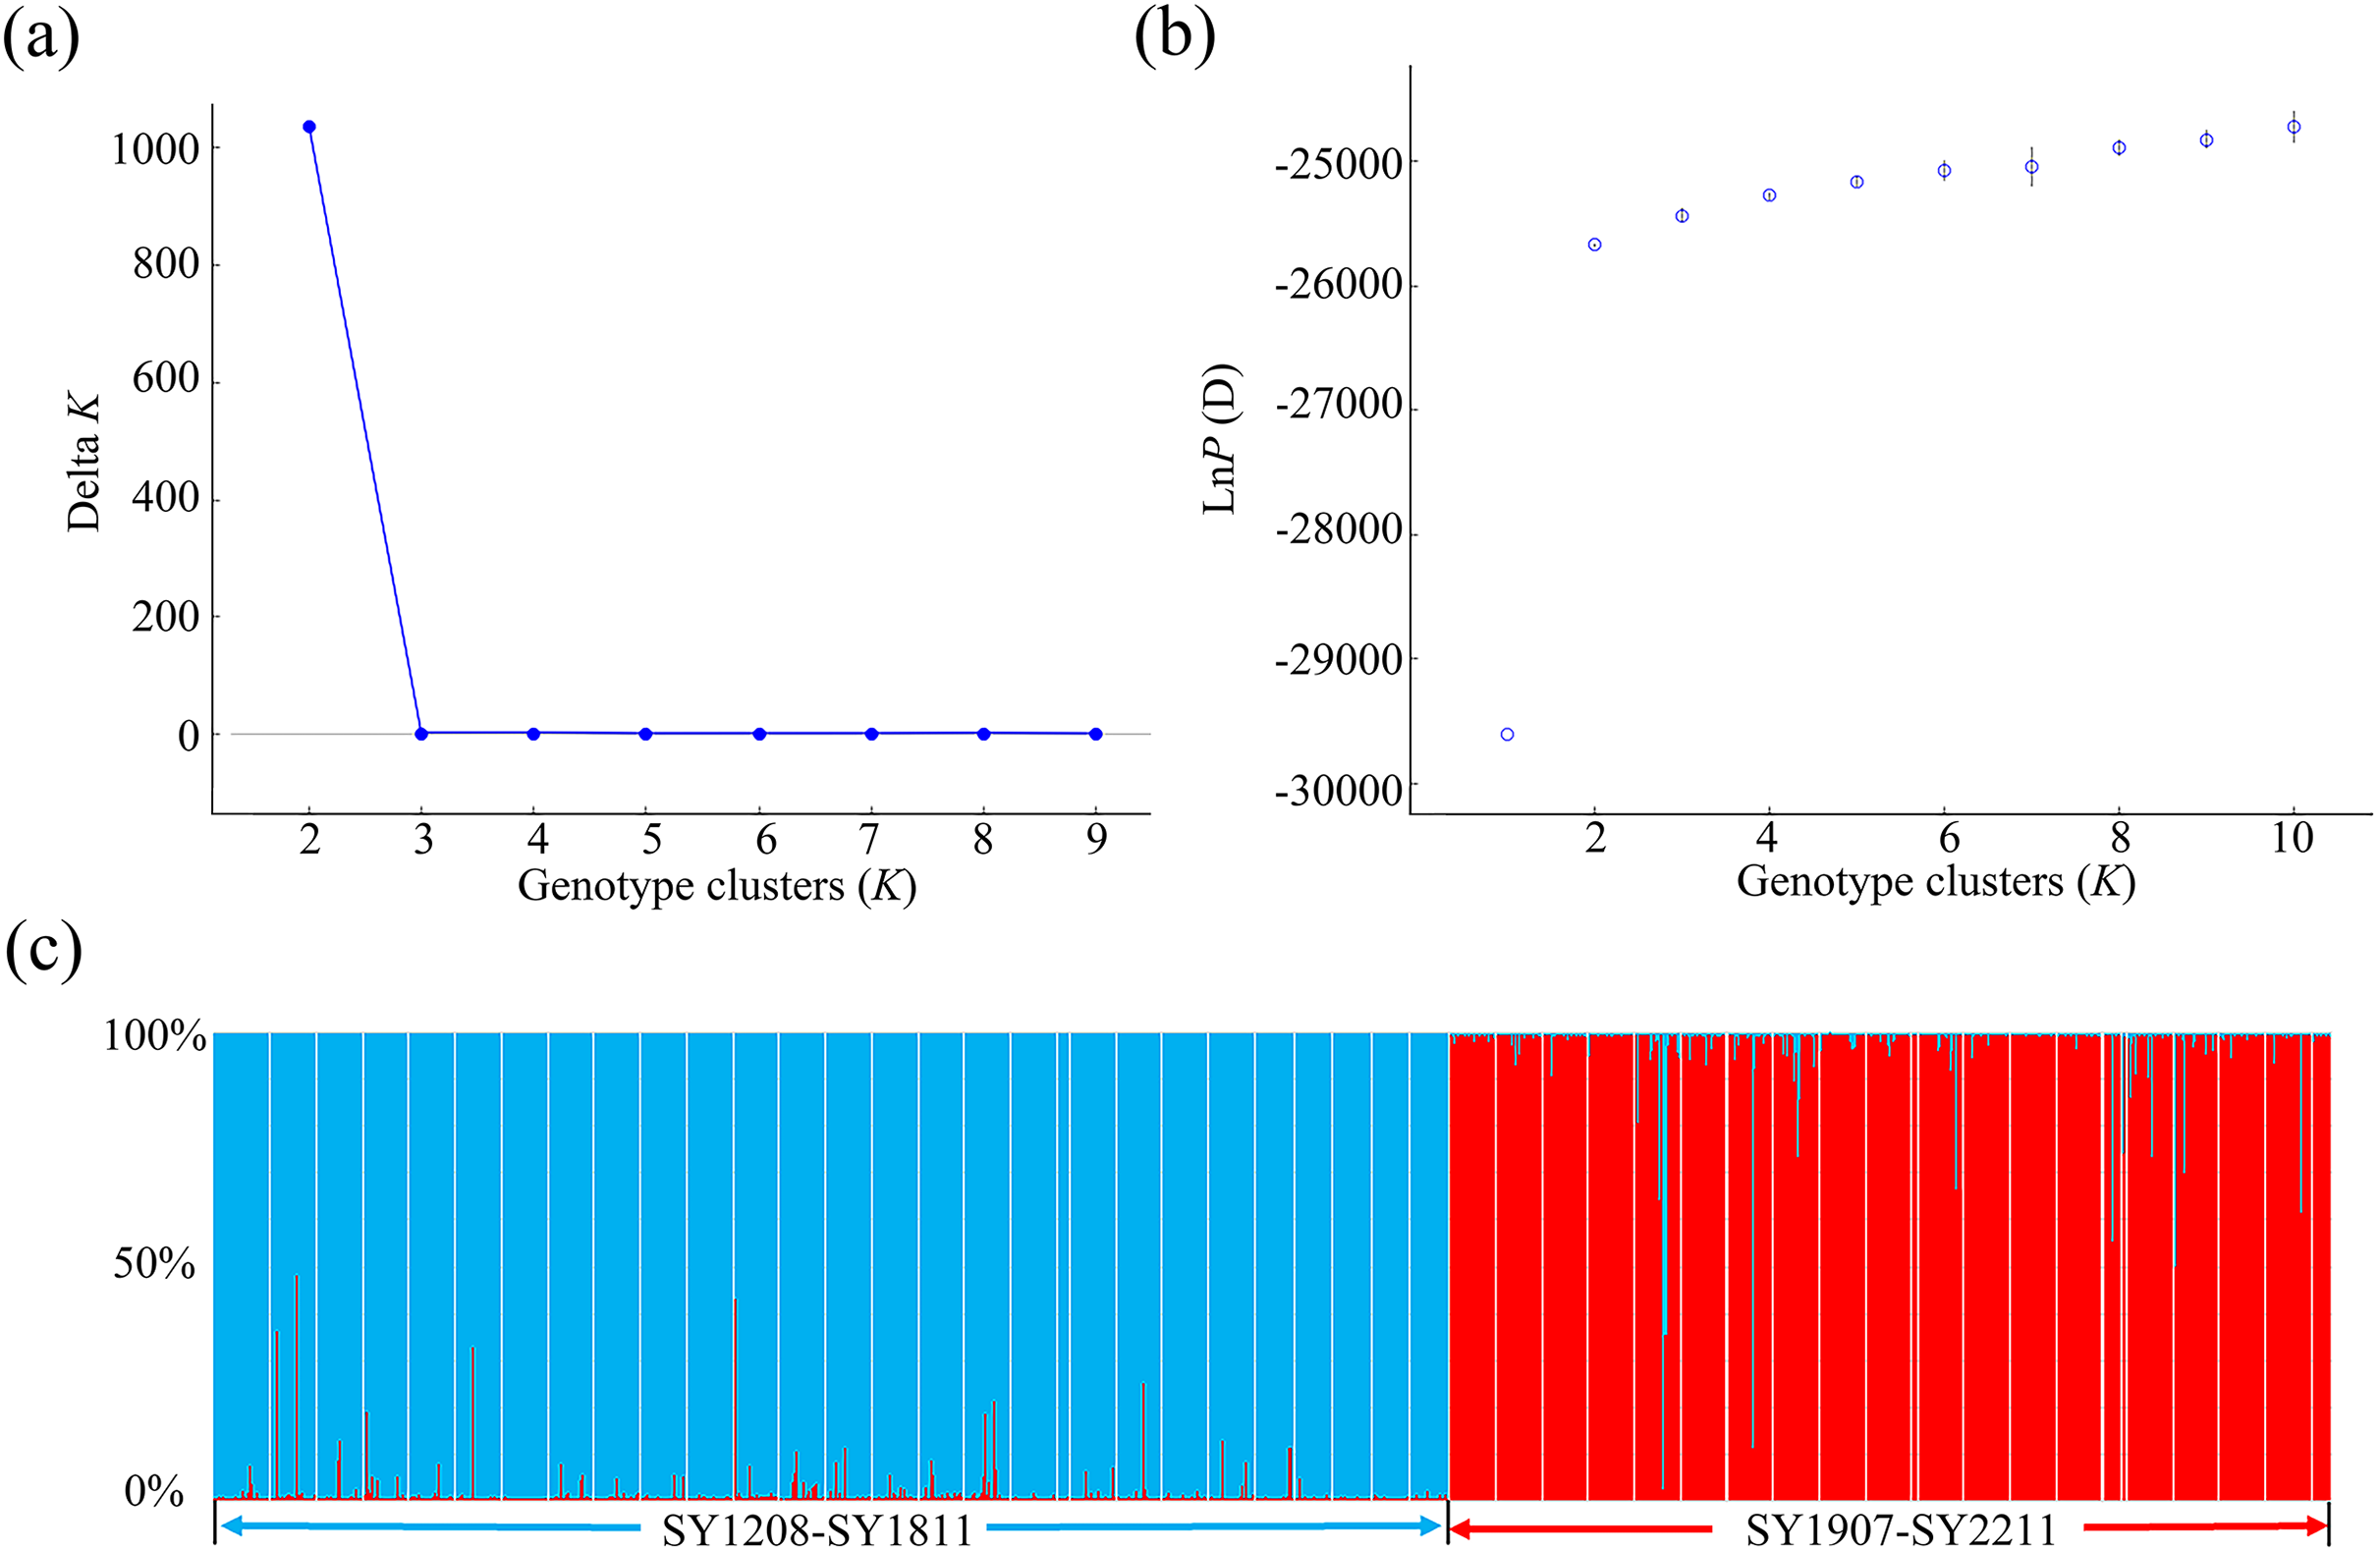
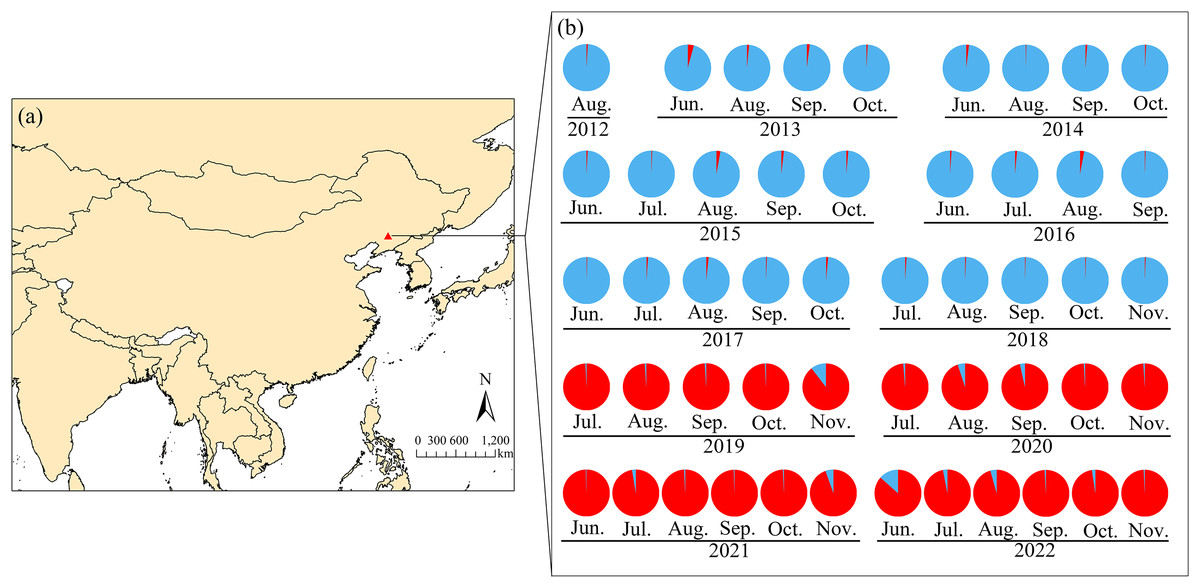
Figure 4: Seasonal sampling locations of Spodoptera exigua and distribution of microsatellite lineages in northern China.
The red triangle indicates the sampling site in Shenyang, Liaoning Province (A). Lineage 1 is represented in blue, whereas Lineage 2 is shown in red (B). Groups identified by STRUCTURE analysis of the microsatellite data are indicated. The population codes can be found in Table S1. The monitoring and sampling position map was created via ArcGIS Pro (https://www.esri.com/en-us/arcgis/products/arcgis-pro/overview) on the basis of geographic coordinates. The base map utilized in the analysis originates from the World Bank (https://datacatalog.worldbank.org/search/dataset/0038272).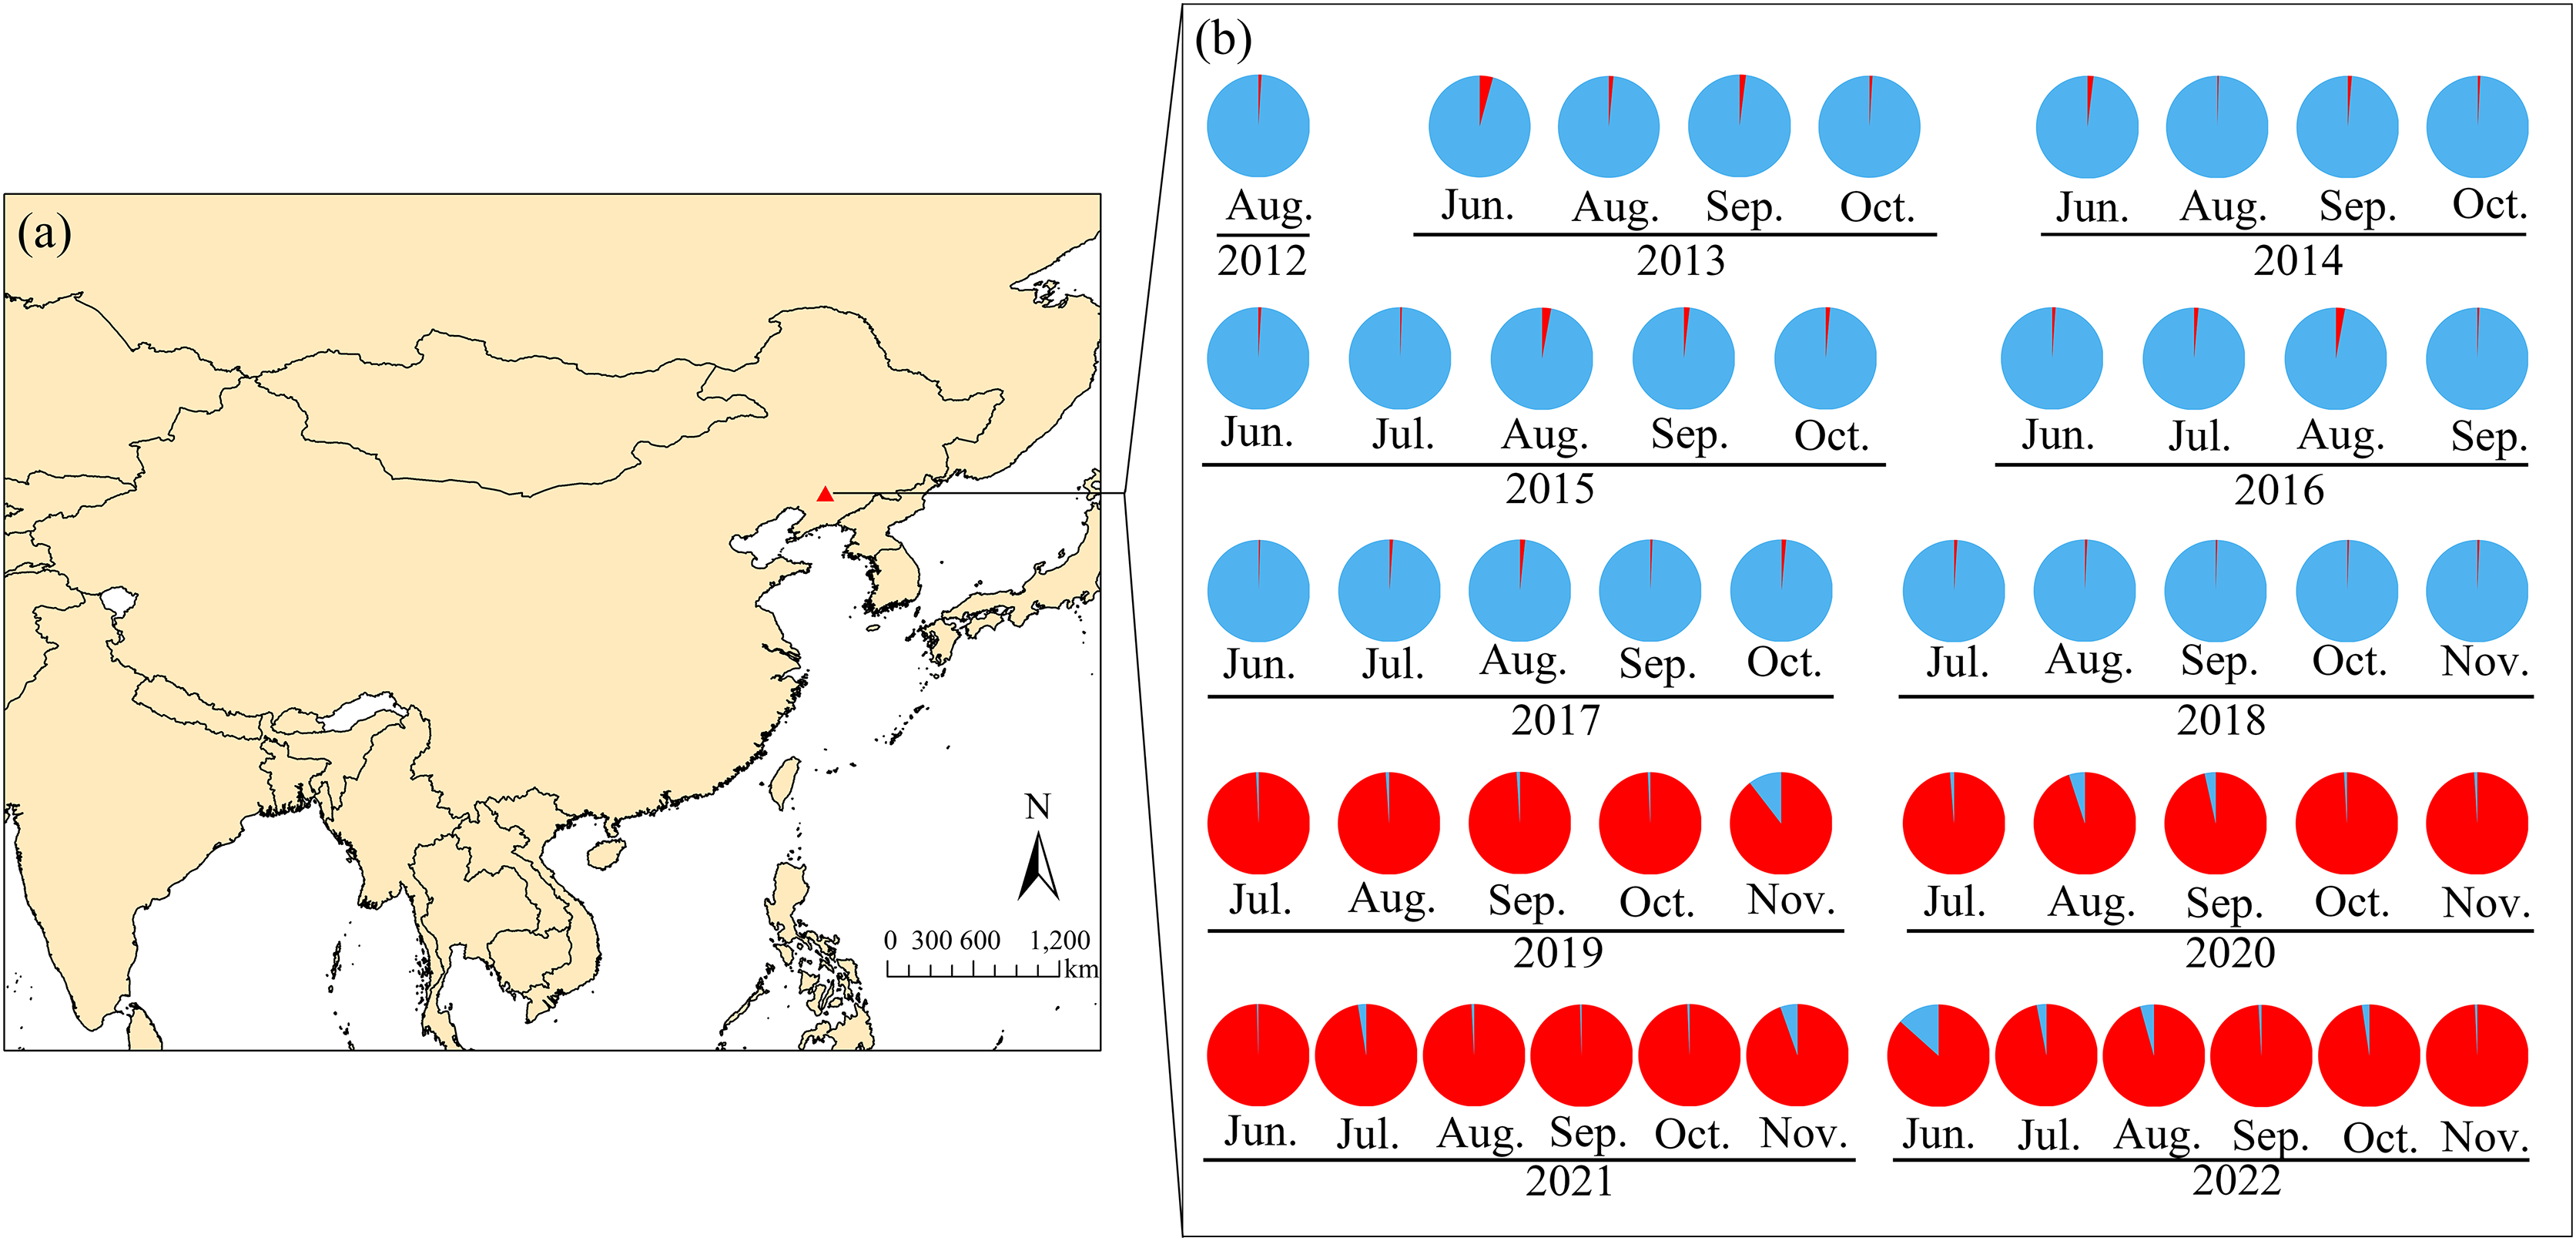
Principal coordinate analysis
Population-based principal coordinate analysis (PCoA) was performed on the basis of Nei’s genetic distance matrix derived from the allele frequencies of the eight microsatellite markers in the 50 BAW populations (Fig. 5). The first and second axes explained 37.19% and 62.1% of the total variance, respectively. The PCoA results indicated there were two genetic groups, which were consistent with those shown above for the neighbor-joining tree (Fig. 2) and Bayesian clustering was performed on the same data (Fig. 3), which were based on data from 50 BAW seasonal populations.
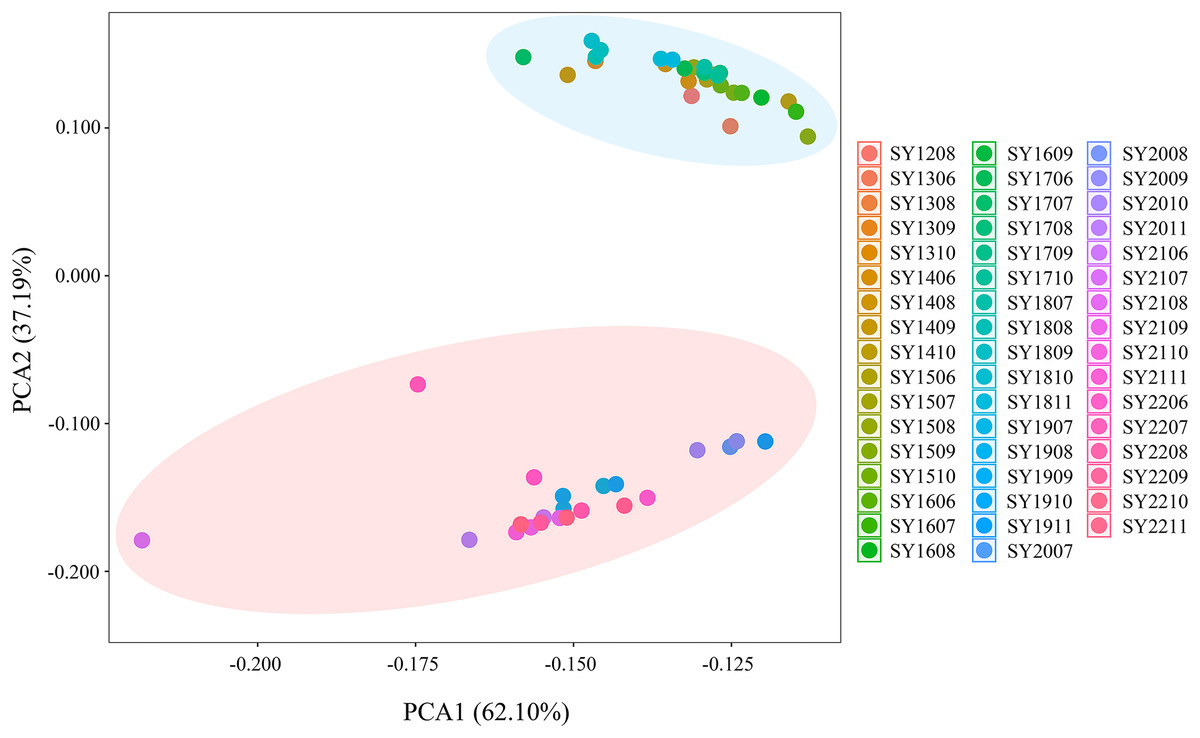
Figure 5: Principal coordinate analysis (PCoA) illustrating the relationships among 50 Spodoptera exigua seasonal populations in northern China, based on the genetic distance matrix of FST values derived from microsatellite data.
Population codes are provided in Table S1.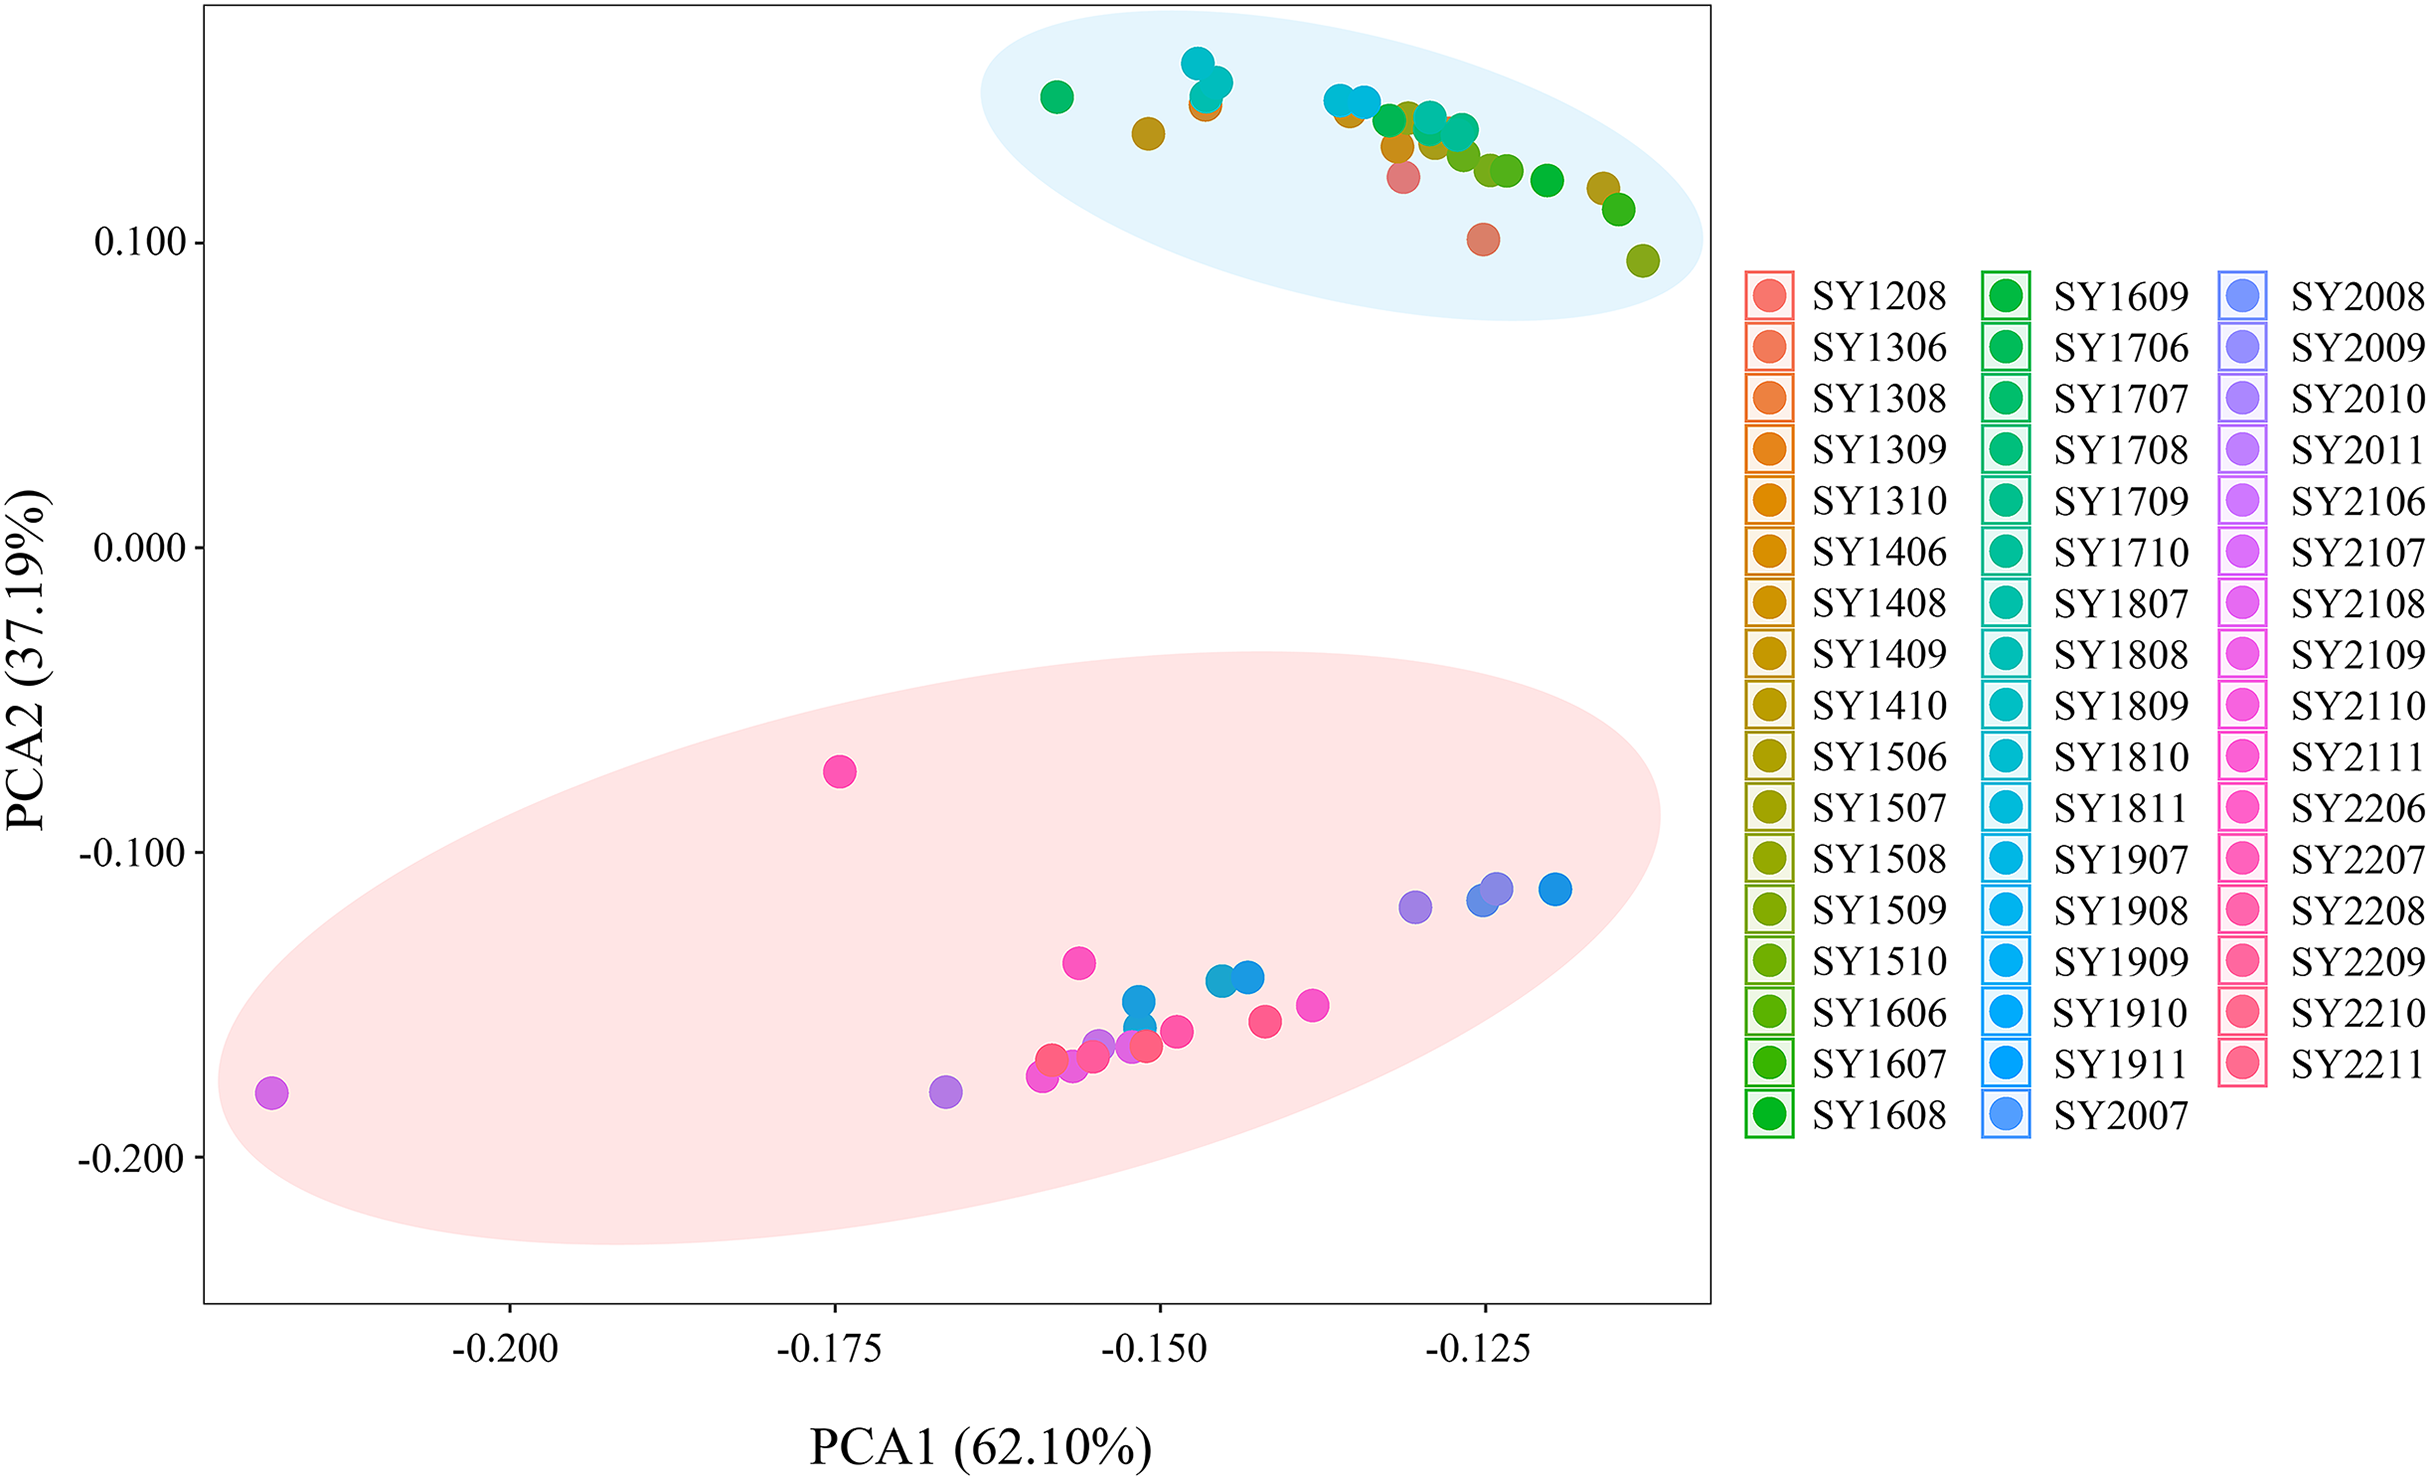
Analysis of molecular variance
The global analysis of molecular variance (AMOVA) of the microsatellite genotype data from the 50 BAW populations indicated that most genetic variation was partitioned between populations and individuals within those populations. Approximately 82.12% of the total genetic variation was attributed to individuals within populations, whereas 17.88% was attributed to variation among populations. Interannual AMOVA indicated that 15.36% of the total genetic variation could be attributed to differences between major groups, whereas the majority of the variation (81.16%) was due to variation within populations. When K = 2, AMOVA revealed that 21.74% of the total genetic variation was explained by differences between major groupings, with the most variation (73.13%) occurring within populations. Additionally, the largest genetic difference among groups (FCT = 0.217) for K = 2 was observed among the three different groups. Therefore, the group with K = 2 was considered the optimal grouping for these 50 BAW populations (Table 2). These results suggest that the BAW populations in Liaoning are composed of two distinct genetic groups, which is consistent with the findings from the NJ tree, PCoA, and STRUCTURE analyses.
| Source of variation | d.f. | Sum of squares | Variance components | Percentage variation (%) |
F-statistics |
|---|---|---|---|---|---|
| Global analysis | |||||
| Among populations | 49 | 1,327.779 | 0.561 Va | 17.88 | FST = 0.179*** |
| Within populations | 2,140 | 5,510.564 | 2.575 Vb | 82.12 | |
| Total | 2,189 | 6,838.343 | 3.136 | 100.00 | |
| Hierarchical AMOVA (K = 11) | |||||
| Among groups | 10 | 1,042.527 | 0.487 Va | 15.36 | FST = 0.188*** |
| Among populations within groups | 39 | 285.207 | 0.111 Vb | 3.49 | FSC = 0.041*** |
| Within populations | 2,140 | 5510.564 | 2.575 Vc | 81.16 | FCT = 0.153*** |
| Total | 2,189 | 6838.343 | 3.173 | ||
| Hierarchical AMOVA (K = 2) | |||||
| Among groups | 1 | 825.349 | 0.766 Va | 21.74 | FST = 0.269*** |
| Among populations within groups | 48 | 502.430 | 0.181 Vb | 5.13 | FSC = 0.066*** |
| Within populations | 2,140 | 5,510.564 | 2.575 Vc | 73.13 | FCT = 0.217*** |
| Total | 2,189 | 6,838.343 | 3.521 | 100.00 | |
Notes:
d.f., degrees of freedom.
FCT genetic differences among groups, FSC genetic differences within a group, FST genetic differences among populations.
Discussion
A comprehensive understanding of the genetic makeup of migratory pest populations is crucial for developing forecasting tools, biosecurity protocols, and sustainable management practices (Simon & Peccoud, 2018). Despite this importance, there is still a lack of critical insights into long-range dispersal events influenced by allelic drift and migration (Rosetti & Remis, 2012). BAW is a polyphagous species that feeds on more than 300 plant species, indicating its significant adaptive potential (Adamczyk et al., 2009; Guo, Wu & Wan, 2010). Originally from South Asia, it is now widely distributed across many major crop-producing areas in China (Wei et al., 2013; Luo, Cao & Jiang, 2000). Understanding seasonal genetic variation and genetic structure can offer valuable insights into the evolutionary and ecological processes of this species.
Ne and Na are critical genetic diversity parameters in pest control. For example, high values of Na typically indicate that pest populations possess strong adaptive capacity and significant potential for resistance evolution in response to control measures, thus necessitating more refined management approaches. Understanding Ne in pest populations is crucial for evaluating the potential for resistance development and gauging the effectiveness of control strategies. In addition, a low value of Ne may increase the susceptibility of a population to resistance evolution, potentially accelerating the accumulation and spread of resistance genes. Therefore, both the genetic diversity index directly influences the genetic fitness of populations and the rate of resistance development, making the monitoring of these indicators essential for predicting control effectiveness and devising more effective management strategies. In this study, the microsatellite markers used presented a high average number of alleles (Na), indicating that they are potentially informative tools for population genetics analysis of this species (Kalinowski, 2004; Rueda et al., 2011). Populations frequently exhibit substantial adaptive genetic variation, enabling rapid responses to environmental changes (Bitte et al., 2019; Brennan et al., 2019). Fluctuating selection can result in stable oscillations in the relative abundance or frequency of various alleles within a population, especially when these alleles correspond to phenotypes adapted to the differing environments encountered throughout the year (such as winter and summer morphs; Bergland et al., 2014). Seasonal genetic variation analysis revealed that the average number of alleles (Na) ranged from 2.625 in SY1408 to 7.625 in SY2009 and SY2209 (average = 6.270), and the effective number of alleles (Ne) ranged from 1.766–4.295 (average = 3.510). In contrast, several studies have indicated low levels of genetic diversity in other migratory Lepidoptera, such as monarch butterflies (Danaus plexippus) (Lyons et al., 2012). In addition, private alleles are crucial in understanding genetic differentiation between populations, species origin, and evolutionary history. Notably, the highest number of private alleles in SY1709 and SY2008, which indicated that the two populations are genetically distinct, likely evolved in isolation, and have different genetic traits, potentially due to separate evolutionary histories and different environmental pressures. Both populations may have adapted to different environments or ecological niches. The private alleles in each population may reflect unique adaptations to local conditions, suggesting that each population has evolved in response to different selective pressures.
Rapid climate change is likely to produce a range of new selection pressures on populations (Hoffmann & Carla, 2011). Evolutionary adaptation could be an important way for natural populations to counter rapid climate change (Kanarek & Webb, 2010). Widespread insect species often exhibit considerable genetic variation in various traits that are likely involved in climatic adaptation (e.g., seasonal timing) (Bradshaw & Holzapfel, 2008) and resistance to stressful climatic conditions (Hoffmann et al., 2003). In general, species capable of dispersal exhibit minimal genetic differentiation between populations. While BAW is a significant agricultural pest, there is limited information available regarding its dispersal ability (Fu et al., 2017). Migration typically homogenizes genetic differentiation among populations (Wei et al., 2013). Our previous work revealed asymmetric migration between the eastern and western BAW populations in China, with the eastern population exhibiting a greater proportion of potential migrants. Additionally, the East Asian monsoon in the eastern range facilitates BAW migration and promotes gene flow (Wang et al., 2022). However, the seasonal population genetic differentiation of this pest has rarely been studied. In this study, a high level of genetic differentiation among the seasonal populations was detected (average FST = 0. 1452) (Fig. 1). Spatiotemporal separation can lead to random genetic drift and adaptive mutations, ultimately resulting in reproductive isolation and speciation (Wang et al., 2022). Genetic divergence is likely to be particularly pronounced in genes associated with migration and those subjected to strong selection pressures.
Understanding population genetic structure provides valuable insights into the evolutionary and ecological processes of species. Microsatellite data reveal a temporal population structure, where genetic turnover leads to a distinct temporal genetic pattern (Che et al., 2015). Rapid genetic turnover in populations of Bemisia tabaci was also investigated in an agricultural landscape in the lockyer Valley, Australia. There was significant temporal varaition in local genetic composition from the beginning to the end of the season, and the temporal genetic structure greatly exceeded the spatial structure. Addditionally, two genetic clusters were obtained (Dinsdale et al., 2012). Aphids also displayed rapid temporal genetic changes and low variation in population structure between sample sites (Sunnucks et al., 1997), as well as temporal genetic changes in Helicoverpa virescens (Han & Caprio, 2004). These studies suggest that agricultural pest insects can be strongly influenced by cropping practices, as well as spatial and temporal factors. Similar findings have been reported in the diamondback moth Plutella xylostella, where climatic variables contribute to genetic differentiation between temperate and subtropical regions (Wei et al., 2013). In this study, we investigated the seasonal genetic diversity and distinctly genetic structure of BAW in Shenyang, Liaoning Province, Northeast China (Figs. 2–5). One clade corresponded to 28 populations collected from 2012–2018, and the second clade was composed of the remaining 22 populations collected from 2019–2022. Genetic turnover in populations of BAW were occurred. The factors causing genetic turnover may be multifaceted. One reason is related to the local rapidly changing climatic conditions (temperature, humidity, precipitation, etc.), host nutrition, natural enemies and other factors (Ma et al., 2024). For example, the average annual temperature was higher than the long-term average in 2019, ranking as the fifth warmest year since 1951. The national average temperature was 10.34 °C, which was 0.79 °C higher than the long-term average. The temperature in Northeast China also significantly increased, with all four seasons being warmer, especially spring and autumn (Li, Zeng & Wang, 2020). Additionally, precipitation patterns may affect the migration and settlement of BAW. Areas with abundant precipitation may provide more suitable habitats, promoting the spread of the population and gene exchange (Manel et al., 2003). In 2019, the national average precipitation was 645.5 millimeters, which was 2.5% greater than the long-term average. The Northeast region receives more precipitation, characterized by an early start and late end of the rainy season and increased rainfall (Li, Zeng & Wang, 2020). Humidity also affects the survival and reproduction of BAW. Higher humidity may be beneficial for the survival and development of its larvae, thereby affecting the genetic diversity of the population (Manel et al., 2003). The planting ratio and distribution of different crops may affect the population dynamics of insects. Large-scale planting of a single crop may provide abundant food resources, promoting the reproduction and spread of insects, thereby affecting its genetic structure (Avise et al., 1987). In addition, genetic drift as the season progresses may have contributed to changes in genotype frequencies. Such explanations may be related to temperature and/or farming practices (i.e., insecticides). In 2019, the first capture date was earlier than in previous years, the trapped amounts of BAW and migration duration is obviously higher than previous years trapped by sex pheromone traps in Shenyang. The damage caused by BAW larvae is significantly more severe compared to previous years. Threfore, multiple applications of chemical pesticides (e.g., emamectin) have been carried out. Resistance selection pressure causes a change in the frequency of specific genes in the population, resulting in genetic turnover. This change is usually due to the frequent spread of resistance genes, resulting in a gradual increase in the proportion of resistant individuals in the population, thus altering the genetic makeup of the population. This genetic turnover can impact the effective control of BAW. For example, monitoring genotype aggregation allows for early detection of changes in the genetic composition of pest populations, such as the emergence of resistance (Che et al., 2015). This enables pest managers to quickly adjust their strategies, helping prevent the escalation of infestations or the development of resistance.
Resistance to insecticides in insects exemplifies evolutionary adaptation to environmental changes (Ffrench-Constant, Daborn & Goff, 2004). For several decades, cultural and chemical control methods have been employed to prevent the spread and damage caused by BAW. Currently, there are more than 586 instances of pesticide resistance among BAW populations worldwide (Akhtar, Mahadevan & Paquet, 2011), with resistance to new chemistries emerging in several Asian countries (Che et al., 2015; Ahmad, Farid & Saeed, 2018). Therefore, quantifying the level of resistance to insecticides and investigating the distribution of resistance genes in relation to the genetic structure and gene flow among BAW populations in China are essential. In addition, understanding the dispersal ability, genetic structure, and population demography of this pest is crucial for both elucidating the theoretical aspects of its evolution and effectively implementing pest forecasting systems. In the future, we will investigate the population genetic differentiation and structure of BAW at the genomic level to reveal its evolutionary relationships and reconstruct its population history in the future. This research enhances our understanding of how BAW adapts to climate and ecological factors at the genomic level. Additionally, by elucidating the influence of monsoon patterns on the migration dynamics of BAW, we can improve predictions regarding the magnitude, timing, and geographic distribution of immigrant pest populations in China. Thus, while characterizing the fine-scale seasonal genetic structure of BAW in northern China, our work will also clarify its large-scale temporal migration dynamics and provide vital information for refining monitoring, forecasting, and integrated pest management (IPM) strategies.
Conclusions
This study provides further data on the seasonal genetic variation and genetic structure of BAW in northern China. The results support moderate levels of genetic variation and two genetically distinct groups among 50 BAW seasonal populations from 2012–2018. These unique insights into BAW population genetics will aid in the development of strategies for managing this highly migratory pest.