
Prognostic value and immunotherapy analysis of immune cell-related genes in laryngeal cancer
- Published
- Accepted
- Received
- Academic Editor
- Rohit Upadhyay
- Subject Areas
- Bioinformatics, Immunology, Oncology, Otorhinolaryngology
- Keywords
- Laryngeal cancer, Prognosis, Risk model, Tumor microenvironment, Prognostic biomarker
- Copyright
- © 2025 Zhang et al.
- Licence
- This is an open access article distributed under the terms of the Creative Commons Attribution License, which permits using, remixing, and building upon the work non-commercially, as long as it is properly attributed. For attribution, the original author(s), title, publication source (PeerJ) and either DOI or URL of the article must be cited.
- Cite this article
- 2025. Prognostic value and immunotherapy analysis of immune cell-related genes in laryngeal cancer. PeerJ 13:e19239 https://doi.org/10.7717/peerj.19239
Abstract
Background
Laryngeal cancer (LC) is a prevalent head and neck carcinoma. Extensive research has established a link between immune cells in the tumor microenvironment (TME) and cancer progression, as well as responses to immunotherapy. This study aims to develop a prognostic model based on immune cell-related genes and examine the TME in LC.
Methods
RNA-seq data for LC were sourced from The Cancer Genome Atlas (TCGA), and GSE27020 and GSE51985 datasets were retrieved from the Gene Expression Omnibus (GEO) database. Key genes were identified through the intersection of differentially expressed genes (DEGs) between normal and LC samples and module genes derived from weighted gene co-expression network analysis (WGCNA), followed by functional enrichment analysis. The prognostic risk model was constructed using univariate Cox and Least Absolute Shrinkage and Selection Operator (LASSO) analyses. Gene Set Variation Analysis (GSVA) was subsequently performed for hallmark and Kyoto Encyclopedia of Genes and Genomes (KEGG) pathway enrichment analyses in high- and low-risk groups. Immune infiltration analysis between risk groups was conducted via Estimation of STromal and Immune cells in MAlignant Tumor tissues using Expression data (ESTIMATE) and single sample gene set enrichment analysis (ssGSEA). Finally, the relationship between the risk model and immunotherapy response was explored.
Results
A total of 124 key genes were identified through the overlap analysis, predominantly enriched in GO terms such as defense response to viruses and regulation of response to biotic stimuli, as well as KEGG pathways related to phagosome and Epstein-Barr virus infection. Machine learning indicated that the optimal prognostic model was constructed from two biomarkers, RENBP and OLR1. GSVA revealed that in the high-risk group, epithelial-mesenchymal transition and ECM-receptor interaction were the most significantly enriched pathways, while autoimmune thyroid disease, ribosome, and oxidative phosphorylation predominated in the low-risk group. Additionally, the stromal score was significantly higher in the high-risk group, while CD8+ T cells, cytolytic activity, inflammation promotion, and T cell co-stimulation were elevated in the low-risk group. Tumor Immune Dysfunction and Exclusion (TIDE) analysis showed higher TIDE and exclusion scores in the high-risk group, whereas the CD8 score was higher in the low-risk group. Finally, CD274 (PD-L1) expression was significantly elevated in the low-risk group.
Conclusions
This study identified two key prognostic biomarkers, RENBP and OLR1, and characterized TME differences across risk groups, offering novel insights into the diagnosis and treatment of LC.
Introduction
Head and neck cancers rank as the sixth most common cancer among adults (Kostecki et al., 2024), with laryngeal cancer (LC) representing the second most prevalent type within this group (Bray et al., 2024). Laryngeal squamous cell carcinoma (LSCC) is the predominant form of LC, accounting for over 95% of all cases (He et al., 2021). There are nearly 190,000 new cases of laryngeal cancer and approximately 100,000 deaths worldwide every year (Bray et al., 2024). Traditional treatment primarily involves surgery, often supplemented by radiotherapy and chemotherapy. In recent years, larynx-preserving treatments have become more common (Obid, Redlich & Tomeh, 2019). Unfortunately, the five-year survival rate for LC has declined from 66% to 63% over the past four decades (Siegel, Miller & Jemal, 2016). Therefore, identifying prognostic biomarkers for LC is critical for developing more effective treatment strategies.
The tumor microenvironment (TME) refers to the niche where tumor cells or cancer stem cells reside, with the cellular interactions within this space collectively shaping the TME (Balkwill, Capasso & Hagemann, 2012; Arneth, 2020). Abnormalities in the TME are often pivotal in tumorigenesis (Hui & Chen, 2015). Despite the presence of immune surveillance mechanisms that typically target and eliminate tumors, the TME often adapts to favor immune escape, allowing tumors to evade immune detection and promoting tumor progression (Lv et al., 2022). For example, Zinc finger E-box binding homeobox 1 (ZEB1) upregulates the synthesis of C-C motif chemokine 8 (CCL8) in hypoxic conditions, recruiting macrophages via the CCL8 receptor-NF-κB pathway, which accelerates cervical cancer progression (Chen et al., 2019). In contrast, Toll-like receptor 8 (TLR8) mitigates tumor-induced T cell senescence by downregulating endogenous cAMP levels in tumor cells, thereby enhancing anti-tumor immunity (Ye et al., 2014). Additionally, silencing Tripartite motif-containing protein 44 in gastric cancer tissues significantly increased CD8+ and CD4+ T cell infiltration compared to control groups (Zhang et al., 2023b). However, limited research has been conducted on the prognostic implications of the TME and its molecular mechanisms in LC.
Immune cells in the TME play a pivotal role in tumor progression and treatment response (Cui et al., 2021; Lu et al., 2023). In various cancers, immune cell-related genes have been identified as key prognostic indicators (Li et al., 2022b; Li et al., 2023; Li et al., 2024; Lundberg, Li & Li, 2022; Zhang et al., 2023a). For instance, in pancreatic cancer, a prognostic model based on CD8+ T cell-related genes has been shown to predict immunotherapy efficacy (Xu et al., 2023). In gastric cancer, 10 immune cell-related genes were identified through cross-analysis, and subsequent enrichment analysis revealed their association with cancer progression and regulation of immune cell activity (Ji et al., 2024). Analyzing immune cell proportions and the expression of immune cell-related genes can thus provide valuable insights for predicting patient prognosis. However, the role of immune cell-related genes in LC remains unexplored.
Immunotherapy has also shown certain potential and application prospects in the treatment of laryngeal cancer (Burtness et al., 2019). At present, immune checkpoint inhibitors, such as anti-PD-1/PD-L1 antibodies, have shown clinical efficacy in some laryngeal cancer patients. Immune checkpoint inhibitors enhance the body’s immune system’s ability to attack tumor cells by blocking immune checkpoint proteins (Kowalski et al., 2021). However, the efficacy of immunotherapy varies significantly among different patients, and some patients may not respond to immunotherapy or develop drug resistance (Klatka et al., 2022). Research has shown that various factors in the immune microenvironment, such as the type, quantity, and functional status of immune cells, as well as cytokines in the tumor microenvironment, may affect the efficacy of immunotherapy (Kirchhammer et al., 2022). Therefore, a deep understanding of the immune microenvironment characteristics of laryngeal cancer patients is of great significance for predicting the efficacy of immunotherapy and optimizing treatment plans.
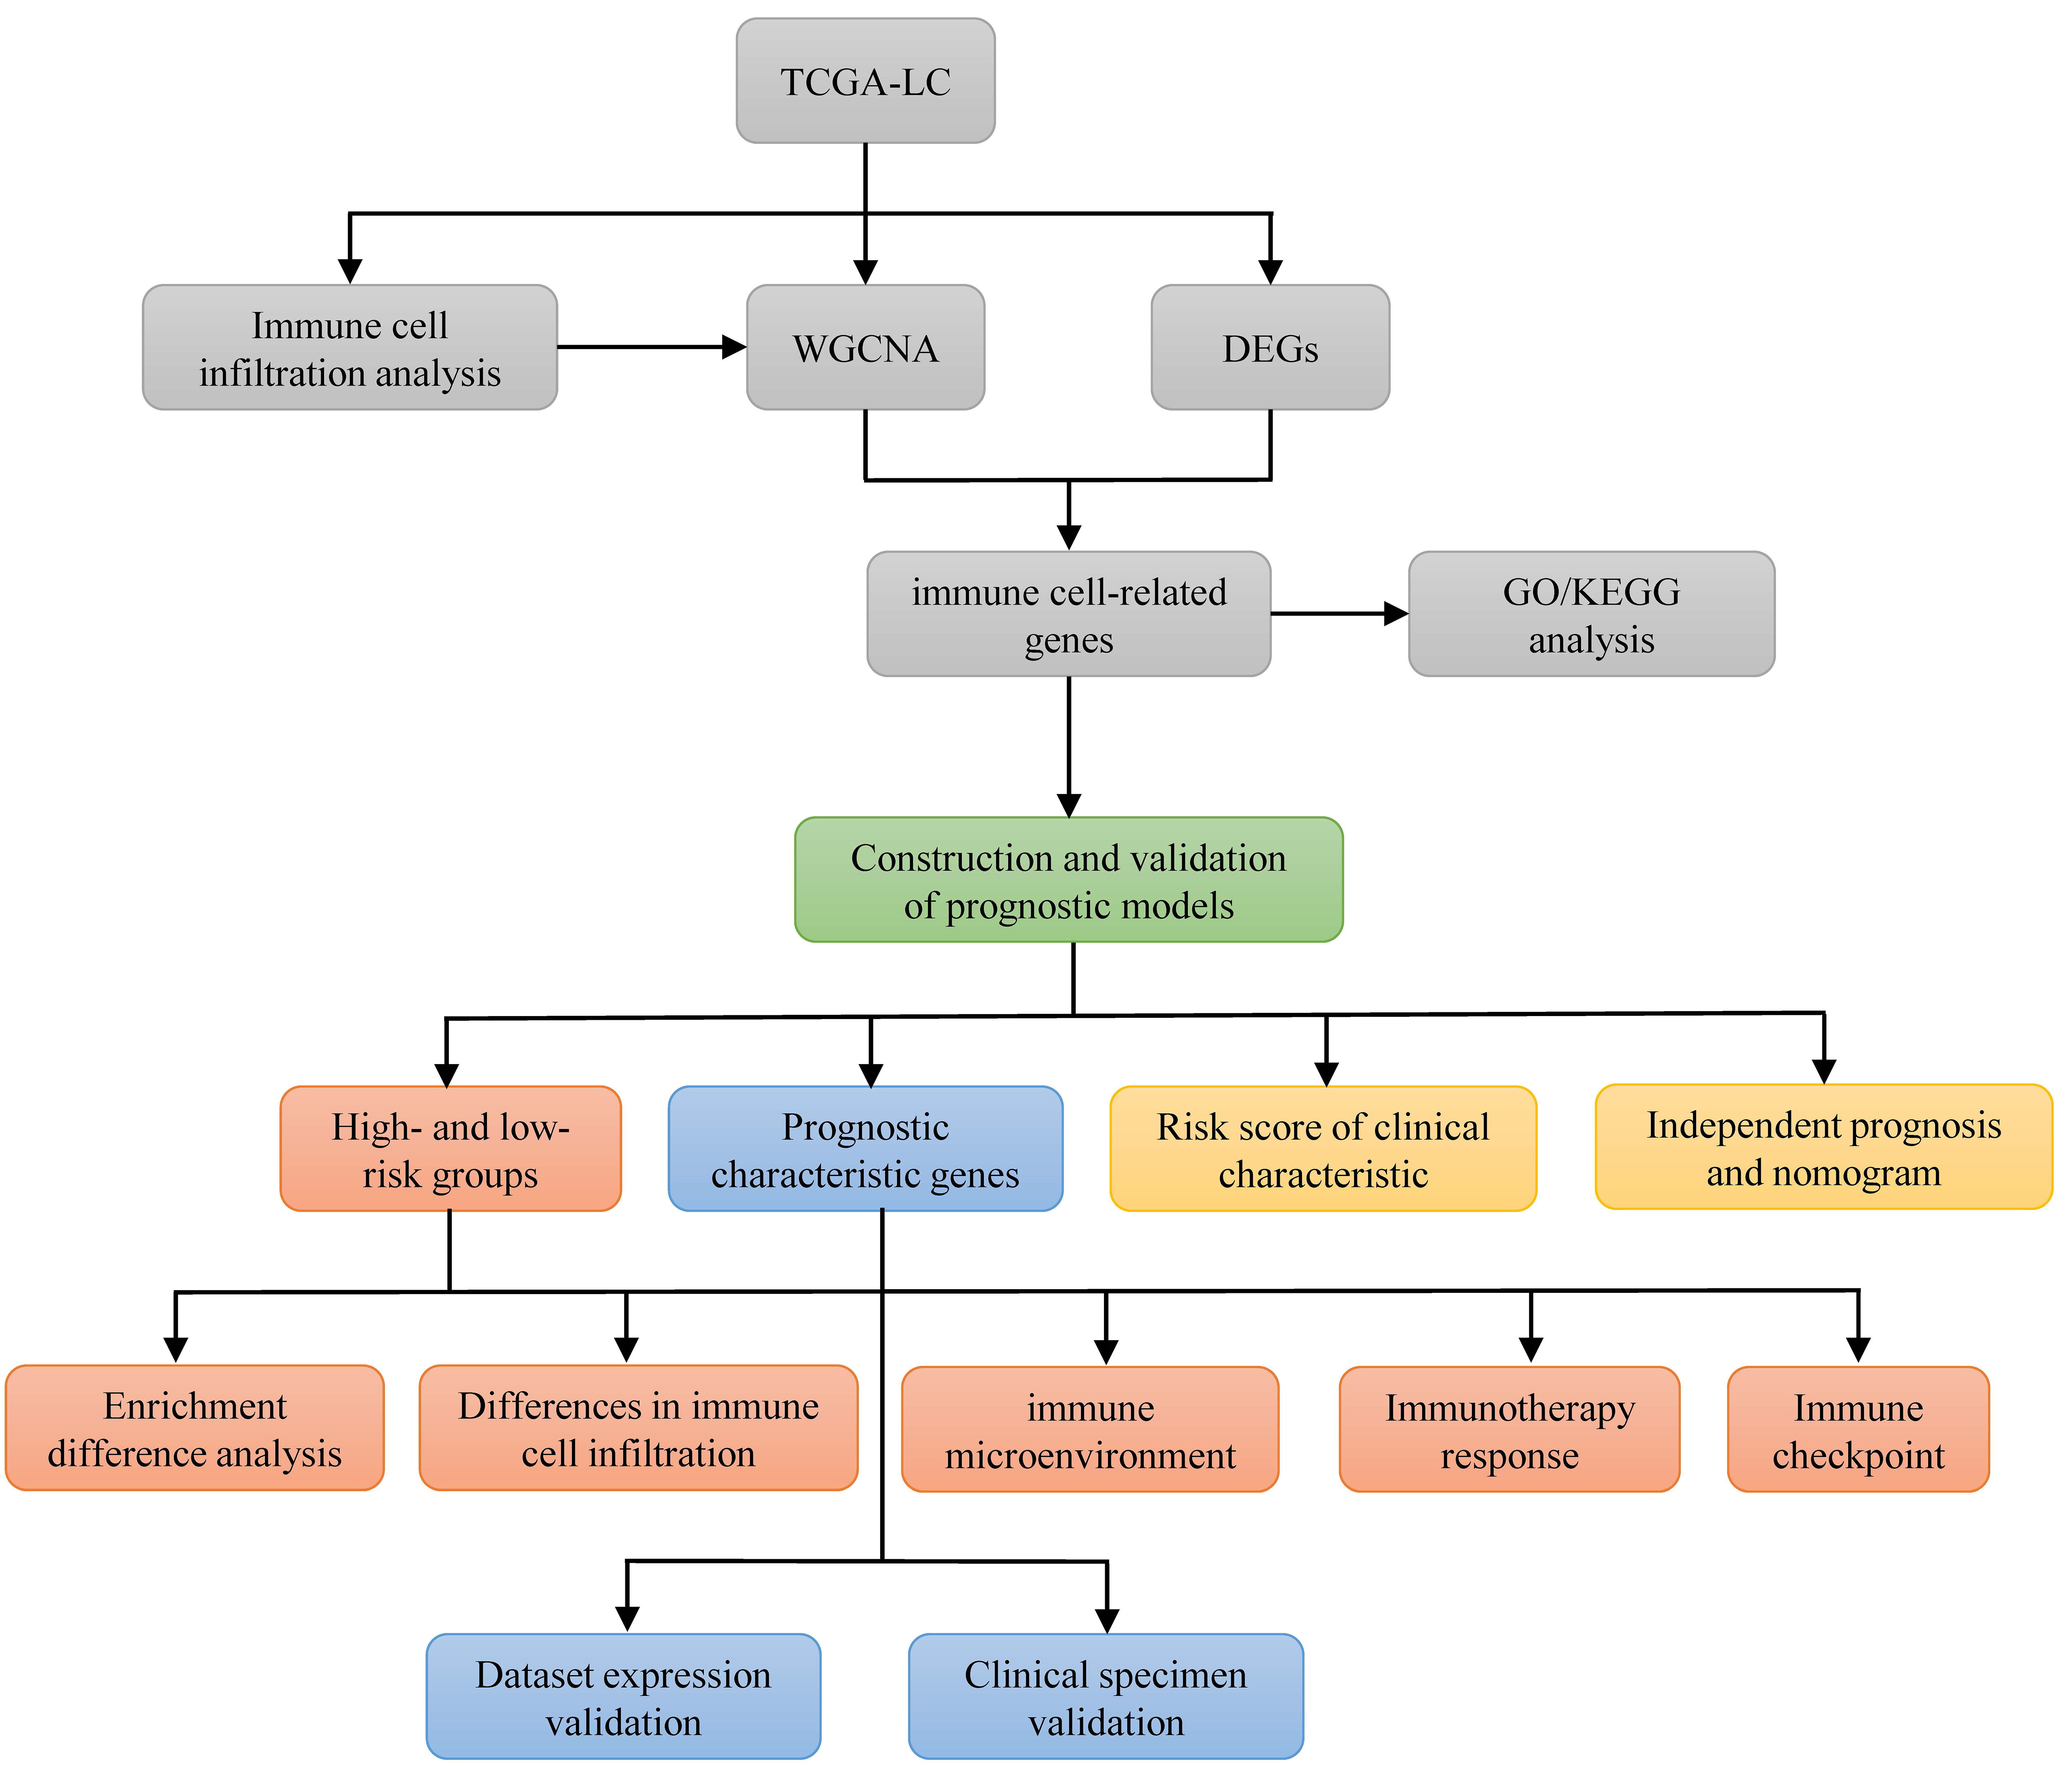
This study utilized publicly available databases, including Gene Expression Omnibus (GEO) and The Cancer Genome Atlas (TCGA), to identify immune cell-related prognostic biomarkers in LC through bioinformatics analysis. This research aims to develop a prognostic model that can improve diagnostic accuracy and facilitate prognosis assessment for patients with LC. A flowchart of the study is provided in Fig. S1, and the software tools used are listed in Table S1.
Data Source and Methods
Data sources
RNA-seq data of LC were extracted from The Cancer Genome Atlas-Head and Neck Squamous Cell (TCGA-HNSC) cohort (https://portal.gdc.cancer.gov/), comprising 112 LC samples and 11 normal tissue samples. After excluding samples with incomplete survival or clinical data, 83 LC samples were retained for subsequent analyses. Additionally, the GSE27020 dataset, serving as an external validation set, was sourced from the GEO database (https://www.ncbi.nlm.nih.gov/geo). This dataset includes expression profiles from 59 LC and 50 normal samples, along with transcriptome and disease-free survival (DFS) data and clinical features. Moreover, the GSE51985 dataset, utilized for model gene expression validation, contains the expression profiles of 10 LSCC tissue samples, also obtained from GEO.
Identification of DEGs and DE-ICs
Differential expression analysis was first conducted to identify differentially expressed genes (DEGs) between the 11 normal and 112 LC samples using the limma R package (version 3.44.3) (Ritchie et al., 2015), with a statistical significance threshold of P-value <0.05 and |Log2FC| >1. Single-sample Gene Set Enrichment Analysis (ssGSEA, version 1.03) was then performed to compare the proportions of 29 immune cell types between LC and normal samples, calculating the immune score for each cell type. Differentially expressed immune cells (DE-ICs) were defined based on these immune scores. DE-ICs were categorized into high and low expression groups according to the median immune score, and survival probabilities for each DE-IC group were compared.
Weighted gene co-expression network analysis
For further analysis, the goodSamplesGenes function in the weighted gene co-expression network analysis (WGCNA) R package was used to filter samples with a TRUE status, and immune cell infiltration levels with significant survival differences were incorporated as WGCNA trait data to identify co-expressed immune-related genes in LC. In the network construction process, a soft thresholding power β was selected as the lowest power. Modules were defined by the dynamic cutting method, with a minimum of 80 genes per module. Similar gene expression profiles were clustered, and modules were visualized in a tree diagram with a MEDissThres setting of 0.2. To identify modules associated with LC immune characteristics, a heatmap of module-feature relationships was constructed, displaying correlation coefficients and P-values. Modules with P < 0.05 and |cor|>0.3, associated with immune-related phenotypes (e.g., parainflammation, Tfh, NK cells), were selected as modules of interest, and genes within these modules were considered module genes.
Identification and functional enrichment of key genes
Overlap analysis was performed between DEGs and module genes, with the intersecting genes regarded as key genes. Gene Ontology (GO) and Kyoto Encyclopedia of Genes and Genomes (KEGG) enrichment analyses were subsequently conducted on the key genes using the clusterProfiler R package (version 4.0.2; R Core Team (2020)), with a significance threshold of P-value <0.05.
Construction and validation of risk model
The 83 TCGA-LC samples were randomly divided into a training set (59 samples) and an internal validation set (24 samples) at a 7:3 ratio, utilizing the Fragments Per Kilobase of exon model per Million mapped fragments (FPKM) for key gene expression levels. The risk model was constructed through univariate Cox analysis followed by Least Absolute Shrinkage and Selection Operator (LASSO) regression, with 10-fold cross-validation. Specifically, univariate Cox analysis was conducted to identify survival-related genes (P < 0.05) using the survival package (version 3.1-12) (Friedman, Hastie & Tibshirani, 2010). These survival-related genes were then input into LASSO logistic regression analysis using the glmnet package (version 4.1-1) (Borgan, 2001), with family set to binomial and type.measure set to class, for the selection of prognostic biomarkers.
To assess the prognostic value of the risk model, risk scores for each patient with LC were calculated by multiplying the risk coefficients from the LASSO model with the expression levels of the respective genes, following the formula: RiskScore = (−0.69348) × RENBP + 0.390337× OLR1. Risk curves, scatter plots, and heat maps of model gene expression were generated based on the risk scores. Overall survival curves were plotted for patients with LC in both high- and low-risk groups, determined by whether their risk scores exceeded the median, using the survminer package (version 0.4.6). The model’s efficacy was further assessed by calculating the area under the curve (AUC) of the receiver operating characteristic (ROC) curves. ROC curves for 1, 3, and 5-year survival time nodes were generated using the survival ROC package (version 3.1-12). Additionally, the same evaluation procedures were applied to both internal and external validation sets (GSE27020) to further validate the model’s effectiveness.
Establishment of a nomogram
To assess the prognostic value of the risk model in relation to clinical factors, a correlation analysis was performed between the clinicopathological characteristics (Age, T, N, M, Gender, and Stage) of the 83 TCGA-LC samples and the model genes, with the results visualized in a heatmap. Survival differences across subgroups of clinicopathological characteristics (M: M0, MX; Age: >60 and ≤60; T: T1, T2, T3, T4; Gender: Male, Female; lymph node metastasis status: N, N0 indicating no lymph node metastasis, N1, N2, and N3 indicating varying degrees of metastasis, and NX indicating undefined. Stage: Stage I, II, III, IV) were examined between the two risk groups. Subsequently, univariate Cox regression analysis was conducted to evaluate the prognostic impact of clinicopathological factors and the risk score. Clinicopathological variables with P < 0.05 were selected for multivariate Cox regression analysis to identify independent prognostic factors.
A nomogram combining the risk model with independent prognostic factors was then developed using the rms package (version 6.1-0). The discriminatory power of the nomogram was assessed using the concordance index (C-index), and its predictive accuracy was evaluated through calibration curves and ROC curve AUCs.
Expression analysis of model genes
The expression levels of the model genes were extracted from the TCGA-LC dataset and compared with those in normal samples. To validate these expression levels, the gene expression levels were further validated in the GSE51985 dataset.
Functional enrichment analyses of high- and low-risk groups
To analyze the impact of high- and low-risk groups on LC progression, hallmark and KEGG (C2) gene sets were downloaded from MSigDB (Broad Institute), and Gene Set Variation Analysis (GSVA) was performed for all genes in the high- and low-risk groups of TCGA-LC. The aim was to identify common functions and related pathways associated with the gene sets. For hallmark enrichment, the criteria |NES|>1 and FDR <0.05 were applied, while for KEGG pathways, the thresholds of |NES|>1 and FDR <0.25 were used to define significant enrichment.
TME analysis
The Estimation of STromal and Immune cells in Malignant Tumor tissues using Expression data (ESTIMATE) algorithm was applied to compare stromal scores, immune scores, and ESTIMATE composite scores between the high- and low-risk groups.
Additionally, the ssGSEA algorithm was utilized to calculate the proportions of immune cells in each sample, and the ssGSEA score comparison between the risk groups was visualized using violin plots and heatmaps.
To further evaluate the potential immunotherapy effects in LC, the Tumor Immune Dysfunction and Exclusion (TIDE) algorithm was applied to predict the response to immune checkpoint inhibitors (ICIs). The differences in immunotherapy sensitivity between the high- and low-risk groups were assessed. TIDE scores, including TIDE, IFNG, Merck18, CD8, Dysfunction, and Exclusion scores, were compared between the groups using rank-sum tests.
Additionally, the correlation between TIDE scores and risk score was analyzed. Finally, the expression levels of PD-1 were extracted and the differences between high- and low-risk groups were investigated (Roh et al., 2017).
Clinical specimen collection
The clinical specimens used in this experiment were all from the tissues excised from patients with LC in the First Hospital of Shanxi Medical University. Written informed consent had been obtained from all patients. This study was conducted in accordance with the Declaration of Helsinki. The protocol was approved by the Ethics Committee of the First Hospital of Shanxi Medical University on November 8, 2022 with the ethical approval number (2022) Ethical review (K184). We collected 29 clinical specimens for RT-qPCR and 12 specimens for immunohistochemical staining. The cancer group was obtained from laryngeal cancer tissue, and the normal group was taken from normal tissue five centimeters away from the edge of laryngeal cancer. Adopting the macroscopic dissection method, the minimum volume of the sample was 0.5 * 0.5 * 0.5 mm3, which may vary slightly depending on the size of the primary tumor. As for RT-qPCR, the specimen was immediately placed in an enzyme-free EP 2ml tube containing RNA later protective solution and stored at 4 °C. After 24 h, the protective solution was removed, and the specimen was then frozen in a −80 °C ultra-low temperature refrigerator. As for IHC, the specimen was immediately soaked in polyformaldehyde and stored in a refrigerator at 4 °C.
RT-qPCR
In this experiment, one mL of Trizol reagent (Ambion) was added to 50–100 mg of LC or adjacent normal tissue for total RNA extraction. RNA concentration was measured using a GENESYS 150 spectrophotometer (Thermo Fisher Scientific, Waltham, MA, USA). cDNA was synthesized via reverse transcription using the EasyScript One-Step gDNA Removal and cDNA Synthesis SuperMix (TranSgen, Beijing, China) according to the manufacturer’s instructions. One microgram of RNA was used for cDNA synthesis in a final volume of 20 µL, which was stored at −20 °C. A 20 µL qPCR reaction system was prepared using PerfectStart Green qPCR Supermix, and qPCR was conducted in triplicate on a LightCycler 96 real-time PCR system (Roche, Basel, Switzerland). The two-step PCR protocol consisted of an initial denaturation at 94 °C for 30 s, followed by 40 cycles of 94 °C for 5 s and 60 °C for 30 s. GAPDH served as the internal reference gene for the prognostic biomarkers, and relative expression levels were calculated using the 2−ΔΔCt method. RT-qPCR primers are listed in Table 1.
| Primer | Sequence (5′–3′) |
|---|---|
| GAPDH-F | GCTCTCTGCTCCTCCTGTTC |
| GAPDH-R | ACGACCAAATCCGTTGACTC |
| OLR1-F | AATGATAGAAACCCTTGC |
| OLR1-R | GCTGTCTCGGAGGAAC |
| RENBP-F | GCTGGTTTCTGCTCCGTCAT |
| RENBP-R | CCTATTGTTGCCCTTCCACT |
Immunohistochemistry (IHC)
Paraffin-embedded tissue samples were sectioned to four µm, dewaxed using xylene and ethanol, and subjected to antigen retrieval in sodium citrate solution. After three 5-minute PBS washes, endogenous peroxidase activity was blocked using a 3% H2O2 methanol solution, followed by blocking with goat serum for 20 min. Sections were incubated overnight at 4 °C with primary antibodies (1:400 dilution, Bioss, BS-2044R and BS-8497R, Beijing). Afterward, secondary antibodies (ZSGB-BIO, PV-6000, Beijing) were applied for 1 h at 37 °C. DAB (CST 8059S, USA) was used for staining, followed by counterstaining with hematoxylin (Nanchang Yulu). The sections were subsequently dehydrated, mounted, and scanned.
Statistical analysis
Data are expressed as mean ± standard deviation. Statistical analyses were performed using GraphPad Prism 9 (GraphPad Software, San Diego, CA, USA). For paired samples, normality was assessed using the Shapiro–Wilk test, and a T-test was applied for normally distributed data, while the Wilcoxon test was used for non-normally distributed data. Fisher’s exact test was employed for analyzing clinicopathological parameters. A P-value of <0.05 was considered statistically significant.
Results
Identification of DEGs and DE-ICs
A total of 1,509 DEGs were identified between LC and normal samples in the TCGA-LC dataset, comprising 914 up-regulated and 595 down-regulated DEGs (Figs. 1A, 1B). The ssGSEA algorithm revealed the proportions of immune cells (Fig. 1C). Differential analysis of immune cell distributions indicated significant differences in the proportions of 21 immune cell types, including aDCs, APC.co.stimulation, CCR, Check.point, Cytolytic.activity, HLA, iDCs, Inflammation.promoting, Macrophages, MHC.class.I, NK.cells, parainflammation, pDCs, T.cell.co.inhibition, T.cell.co.stimulation, Tfh, Th1.cells, Th2.cells, TIL, Treg, and Type.I.IFN.Response, categorized as DE-ICs (Fig. 1D). These 21 DE-ICs were classified into high and low expression groups based on the median value. Survival analysis revealed significant survival differences associated with three immune cell types, where high expression of Parainflammation correlated with poorer prognosis, while elevated levels of Tfh and NK cells were associated with better prognosis (Fig. 1E).
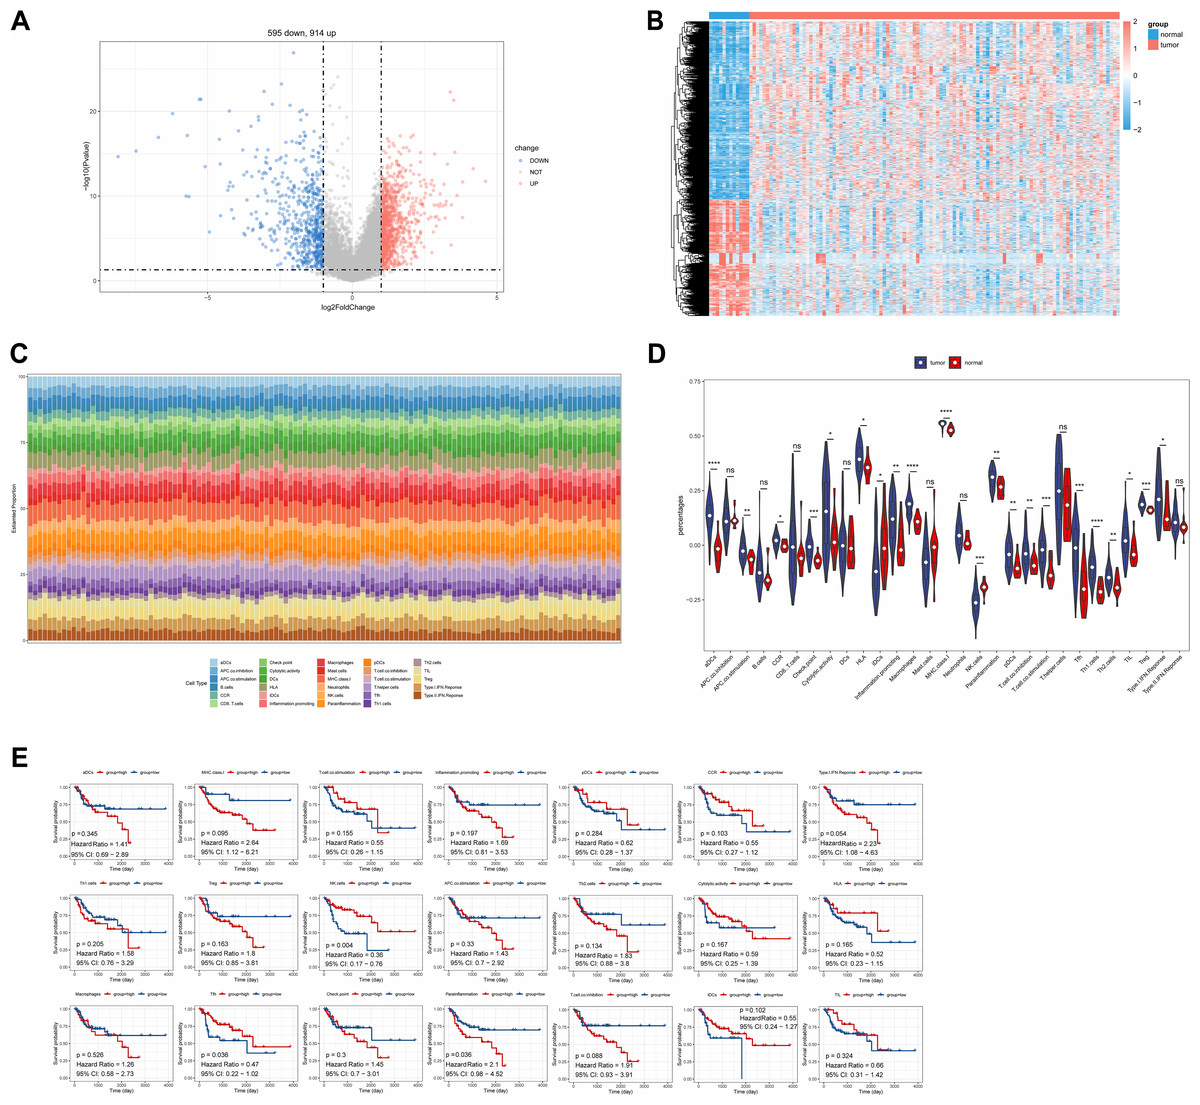
Figure 1: Identification of DEGs and DE-ICs.
(A) Volcano map of DEGs (disease/normal). The horizontal axis logFC represents the multiple of differences (disease/normal), and the vertical axis represents the confidence level -log10 (Pvalue). (B) The heat map of DEGs. The small squares represent the expression levels of genes. Each row represents the expression level of a gene in different samples, and each column represents the expression levels of different genes in a sample. (C) Distribution of immune infiltrating cells in all samples. The horizontal coordinates represent each sample, the vertical coordinates represent the size of the immune cell score, and different colors represent different immune cells. (D) The violin plot of immune scores of immune cells in high and low expression groups by ssGSEA algorithm. The statistical method used here was the Wilcoxon test, ****P-value < 0.0001; ***P-value < 0.001; **P-value < 0.01; *P-value < 0.05. (E) Survival analysis of DE-ICs in high and low expression groups.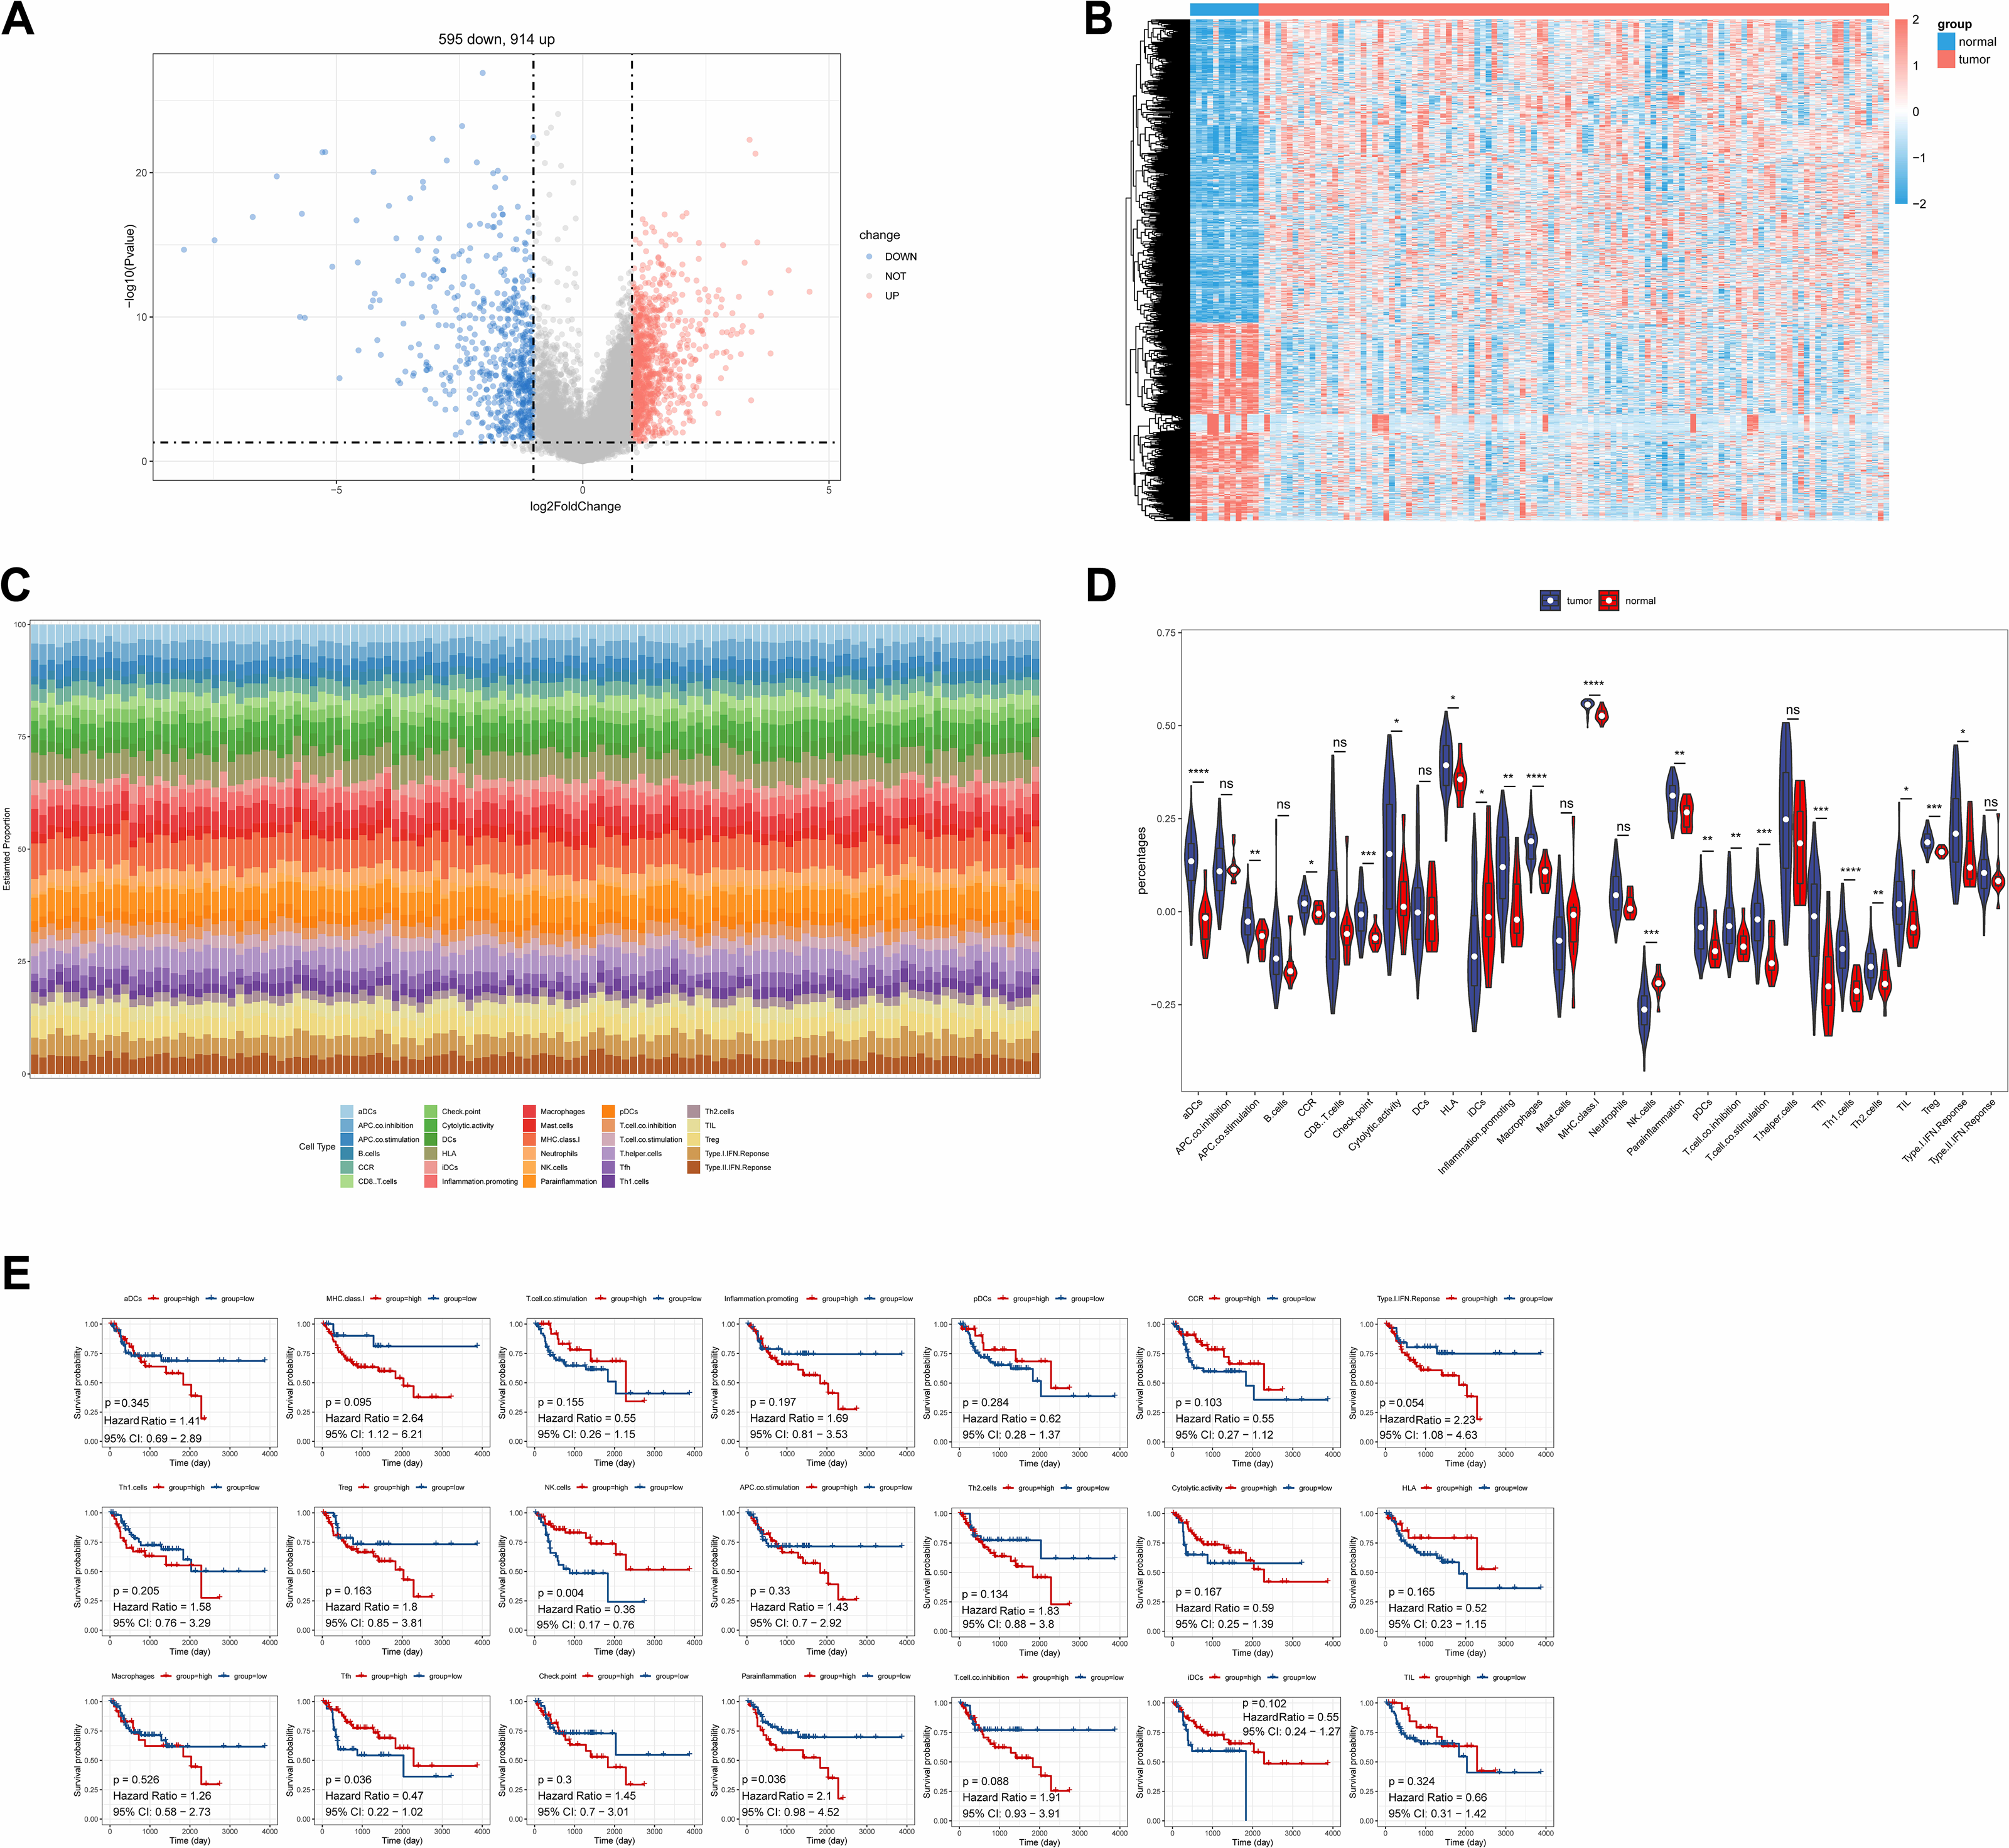
Identification of module genes
In the WGCNA, the soft threshold was set to seven (R2 = 0.85) to construct a scale-free network (Fig. 2A), which helped to identify gene modules that might have had an important role in the development of laryngeal cancer. Fifteen modules except for the grey module were identified based on the setting of MEDissThres = 0.2 and dynamic tree cutting (Fig. 2B). These modules represented collections of genes with similar expression patterns that might have been associated with different biological processes or features of laryngeal cancer. The cyan and pink modules were the most relevant modules to Parainflammation, Tfh, NK.cells, and case (|cor|>0.3 and P < 0.05; Fig. 2C), which suggested that the genes in these modules might have played important roles in the regulation of the immune microenvironment, inflammatory response, and disease progression in laryngeal cancer. Therefore, a total of 1,051 genes (224 in cyan, 827 in pink) in the two modules were obtained as module genes (Fig. 2D, Tables S2A, S2B).
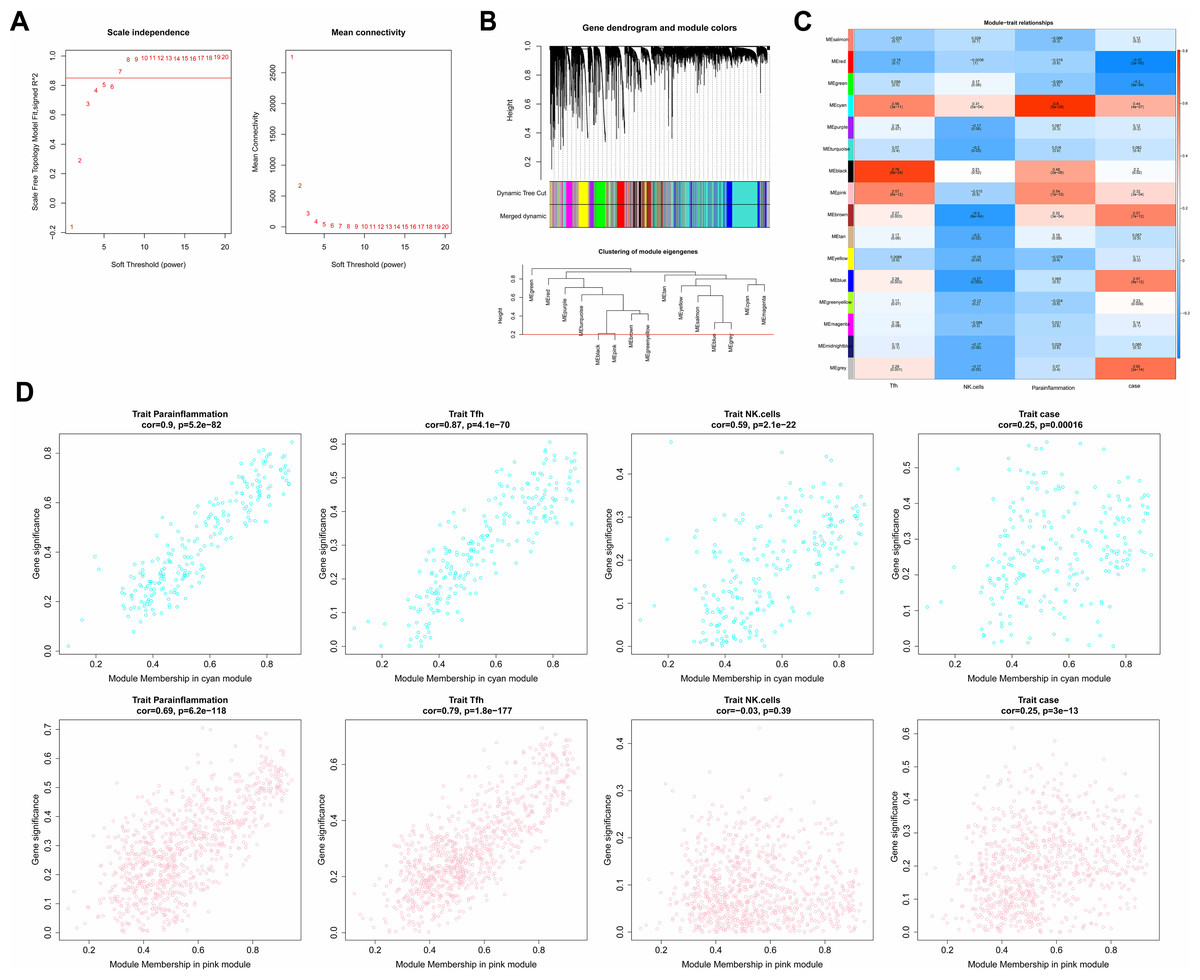
Figure 2: Immune-related WGCNA.
(A) The construct of the soft threshold. We build a scale-free network with a soft threshold of seven and R2 = 0.85. The horizontal axes of the graphs all represent the values of the weight parameter power, and the vertical axis of the left graph represents signed R2, where the higher the square of the correlation coefficient, the closer the network approximates a scale-free distribution, while the vertical axis of the right graph represents the mean value of the neighbour-joining function of all genes in the corresponding gene module. (B) Module identification and merging. The upper part of the graph is a gene tree, where each branch represents a gene. The genes are divided into various modules through hierarchical clustering, with different colors representing different modules. Gray by default indicates genes that cannot be classified into any module. The bottom part is the tree diagram of the clustering module. (C) Heat map of the correlation between modules and clinical traits. The vertical coordinates were for different modules and the horizontal coordinates were for different traits. Each square represents the correlation coefficient between a certain module and a certain trait. (D) Heat map of correlation between different modules and immune traits. The horizontal axis represents the connectivity within the cyan module (the top graph) or pink module (the bottom graph), while the vertical coordinates represent different immune traits.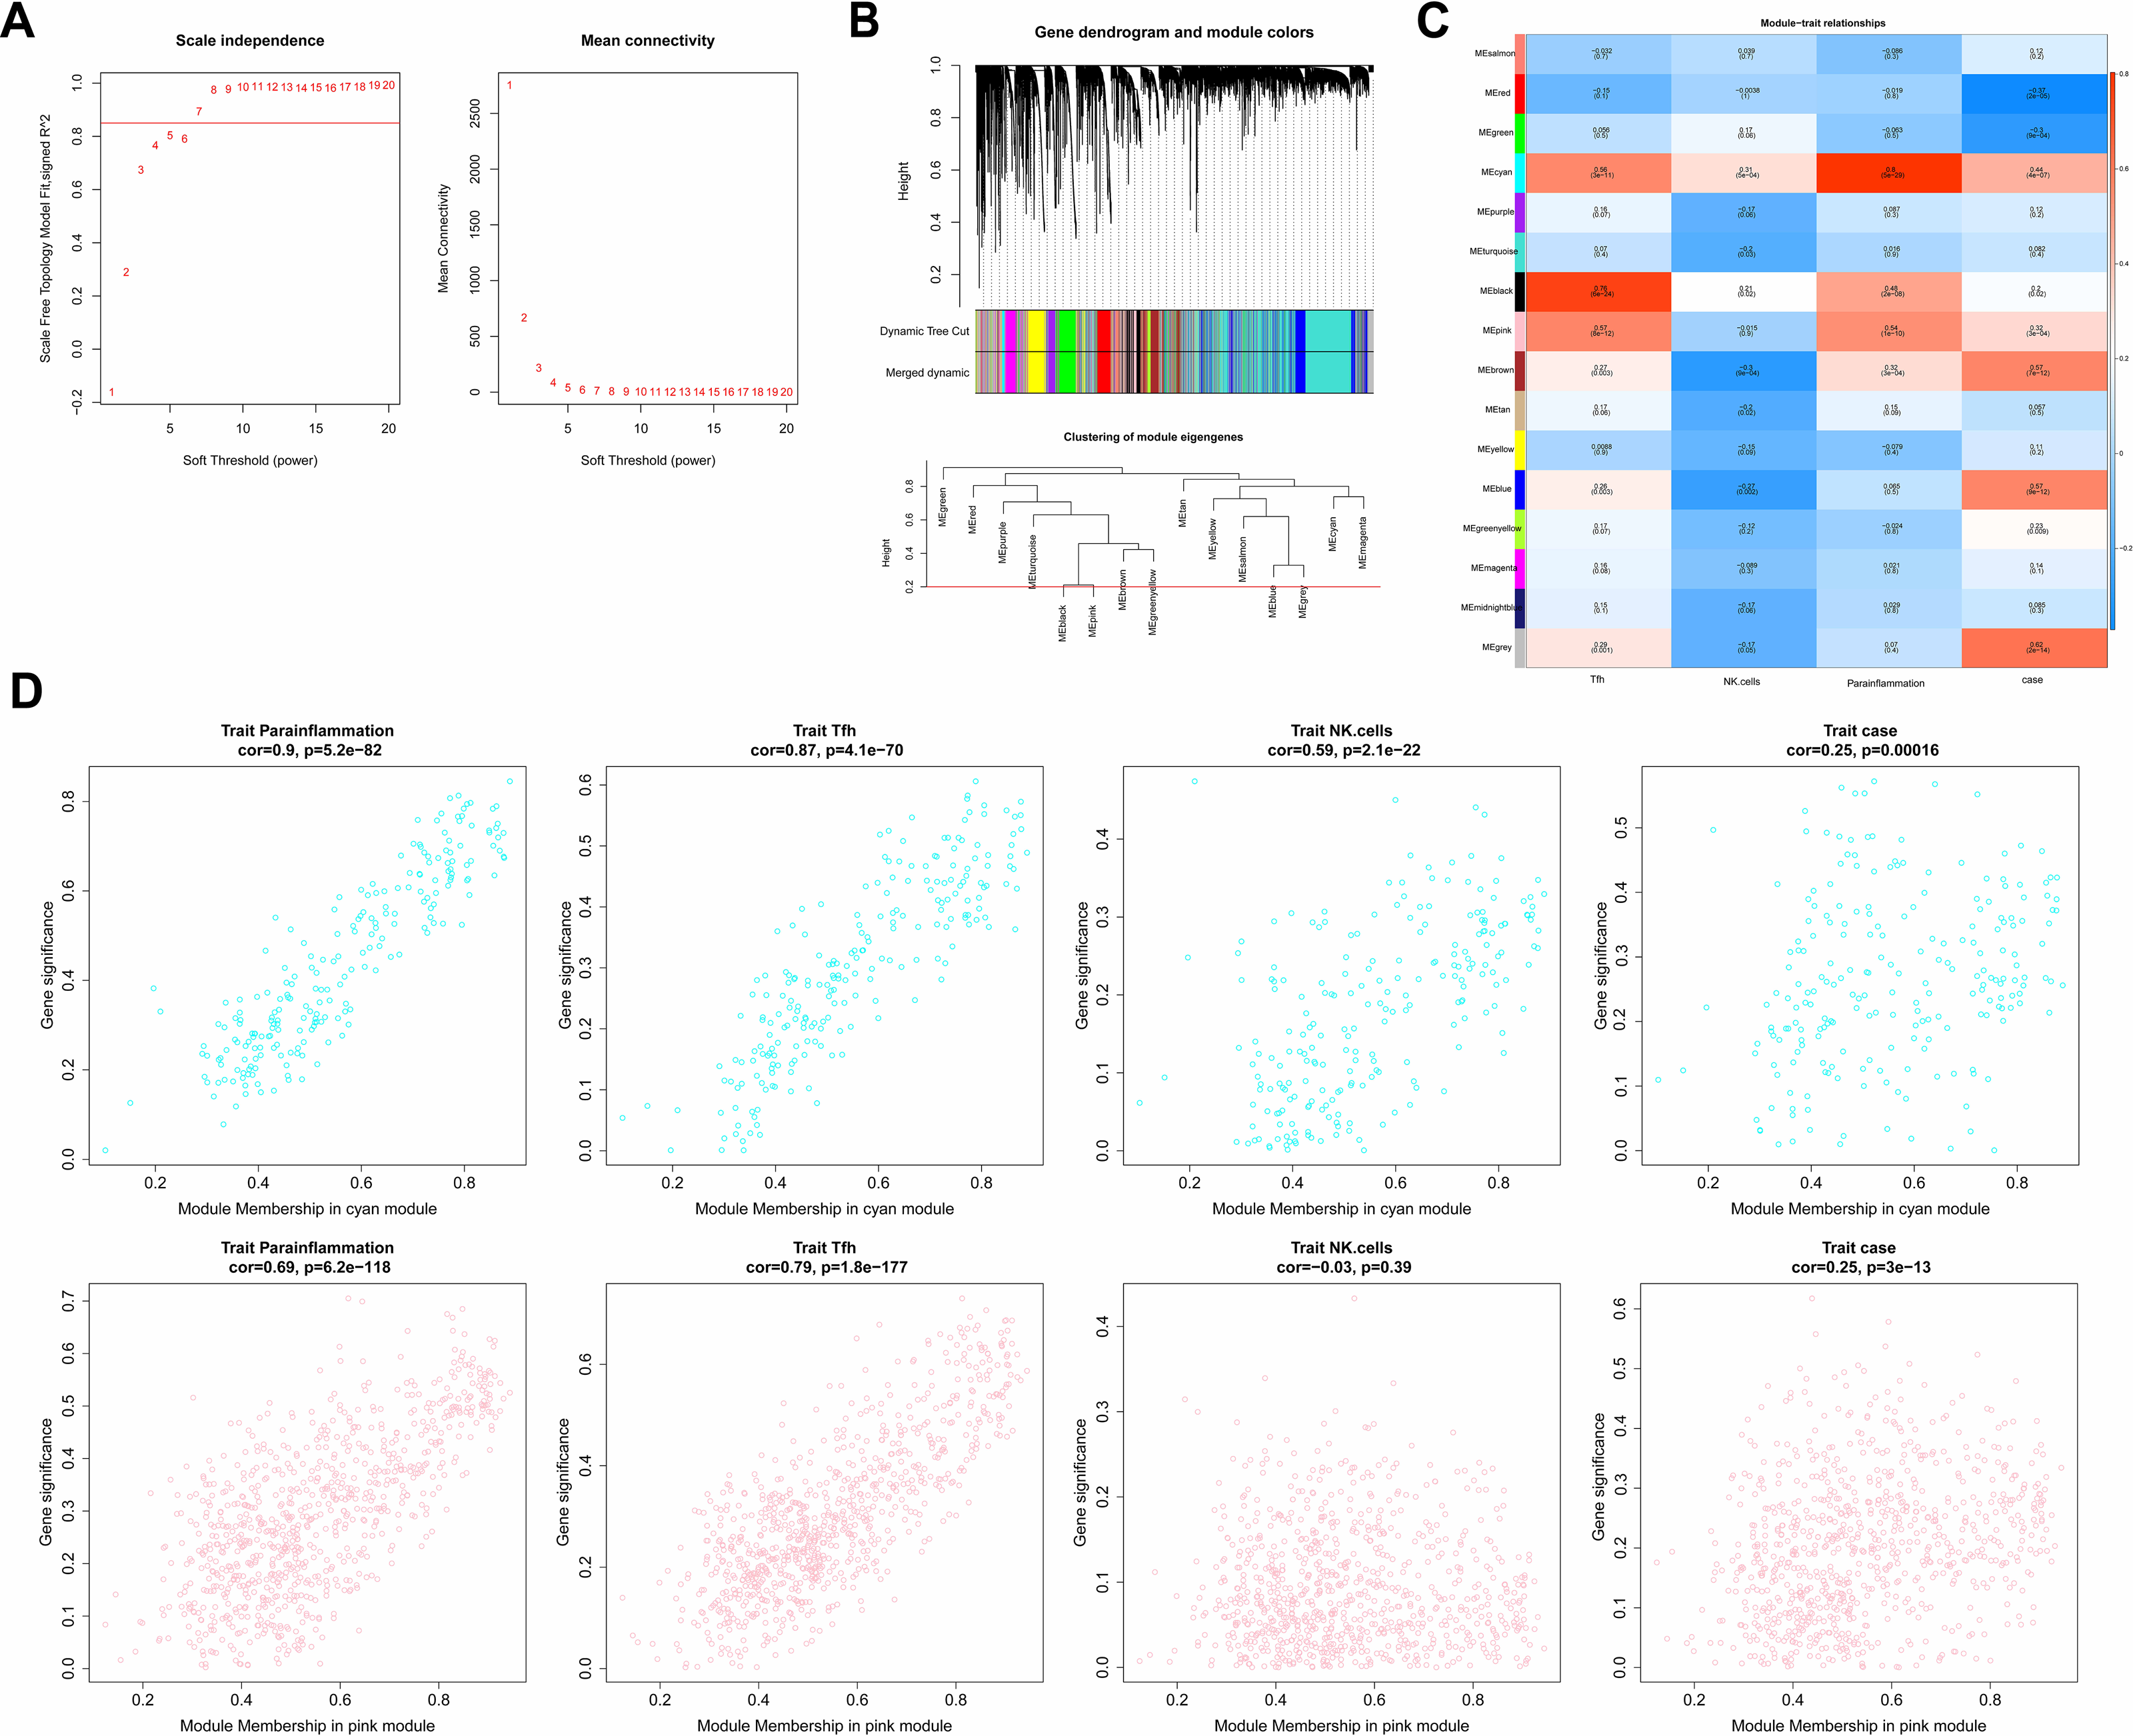
Identification and enrichment analyses of key genes
The overlap analysis showed that 124 intersection genes were acquired between 1,051 module genes and 1,509 DEGs (Table S3A, Fig. 3A), which were defined as key genes for subsequent analyses. The enrichment analysis of the key genes illustrated that 866 GO terms were enriched, such as defense response to virus, defense response to symbiont, response to virus, regulation of response to biotic stimulus, etc. in BP; secretory granule membrane, endocytic vesicle, ficolin−1 −rich granule, etc. in CC; and peptide binding, antigen binding, integrin binding, peptide antigen binding, etc. in MF (Fig. 3B). Moreover, 47 KEGG pathways were enriched, which mainly contained phagosome, Epstein-Barr virus infection, viral myocarditis, natural killer cell mediated cytotoxicity, etc. (Fig. 3C). This suggested that key genes might have influenced immune escape from laryngeal cancer, cancer cell clearance, and disease progression by participating in these pathways.
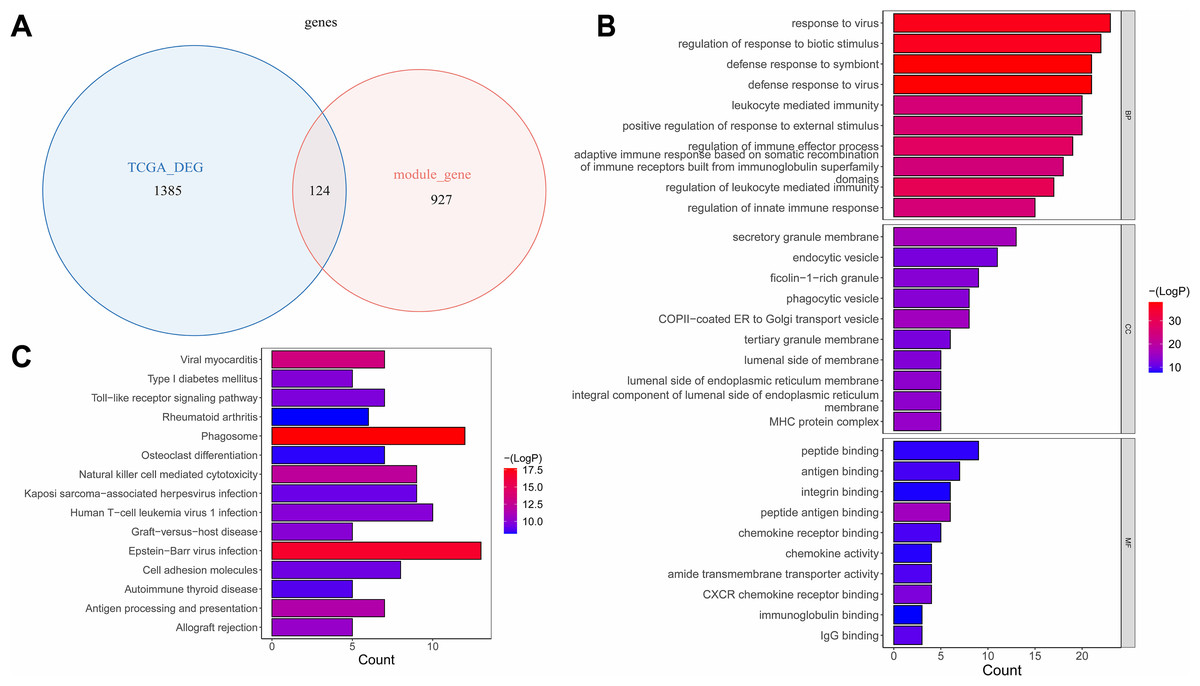
Figure 3: The identification and enrichment analyses of key genes.
(A) Venn diagram of differential genes and WGCNA. (B) GO enrichment diagram of key genes. (C) KEGG enrichment diagram of key genes. The horizontal axis represents the proportion of genes in GO/KEGG entries, and the vertical axis represents the name of the GO/KEGG entry, and the color represents -log10 (adjust P value).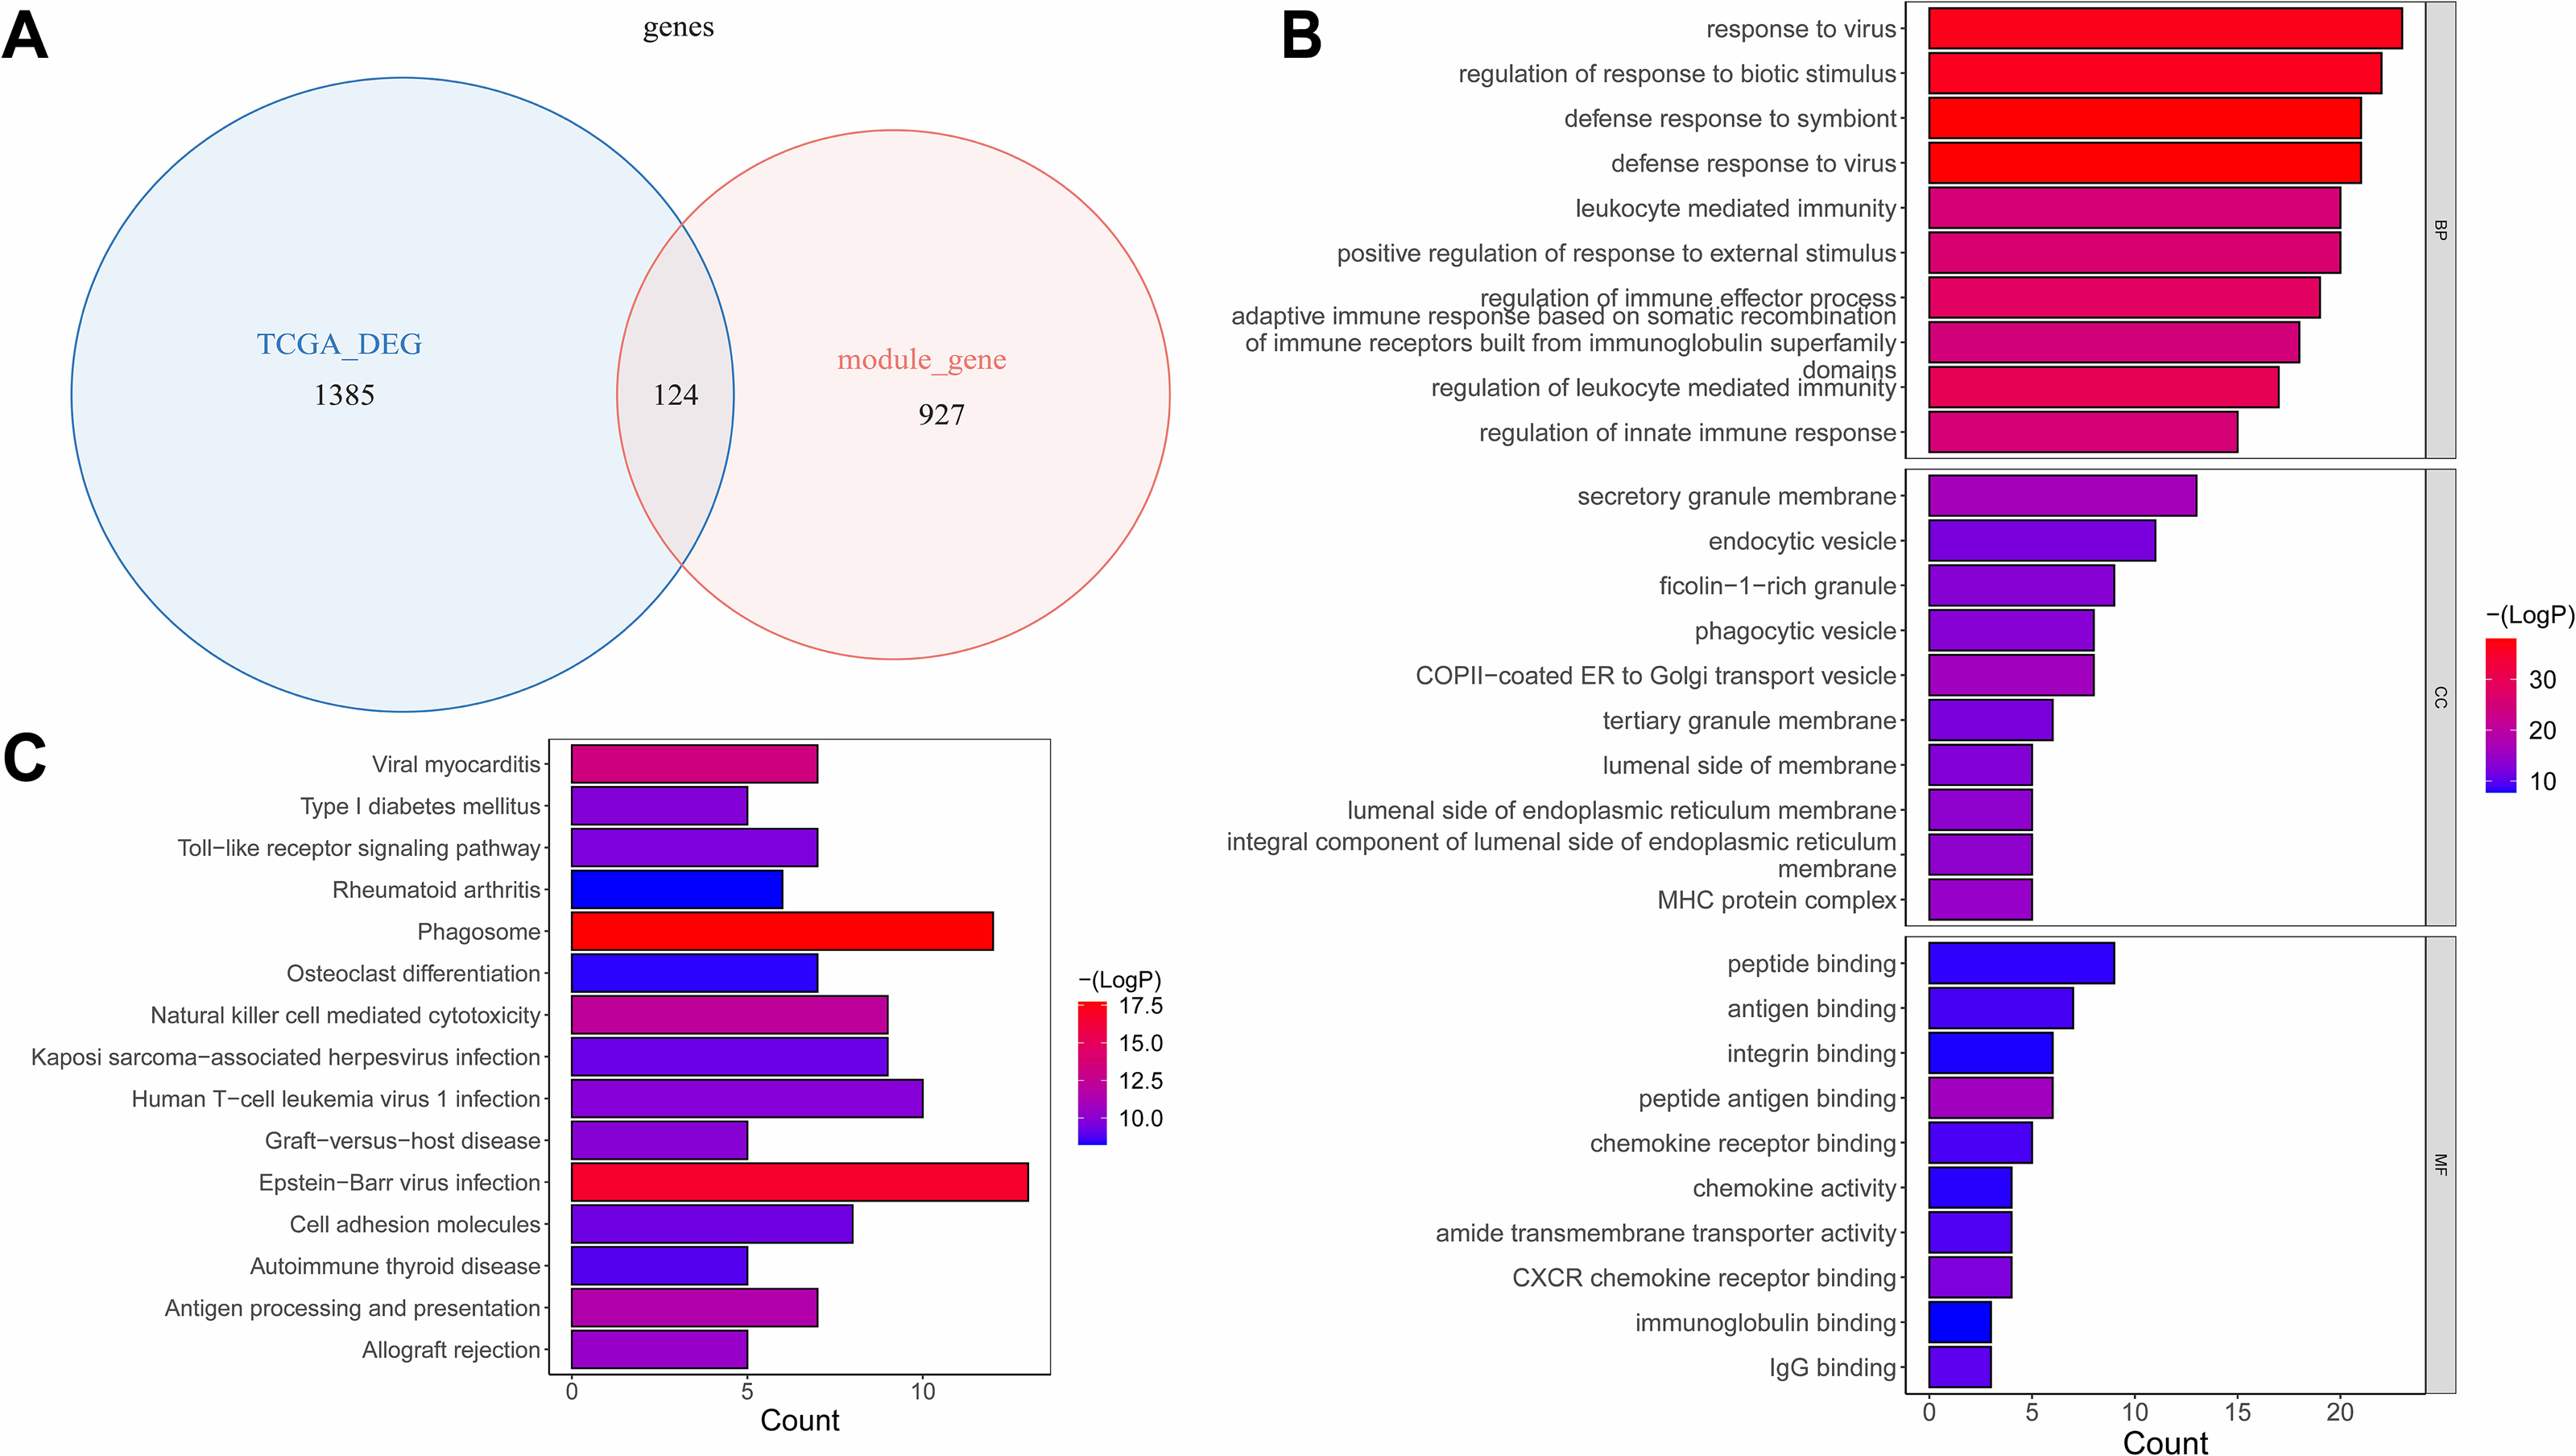
RENBP and OLR1 were prognostic biomarkers
Based on the FPKM of the 124 key genes, the univariate Cox analysis results were visualized in a forest map. As can be seen, two key genes relevant to survival were screened out from the training set, including RENBP and OLR1 (Fig. 4A). This suggested that the expression levels of these two genes might have been strongly associated with the survival prognosis of laryngeal cancer patients. The LASSO regression analysis of the two key genes suggested that these two genes were screened out as prognostic biomarkers when the cross-validation error was lowest (lambda.min = 0.03) (Fig. 4B). The risk score of the two prognostic biomarkers = − 0.69348 ×RENBP + 0.390337×OLR1. It could be found that patients in the high-risk group had worse survival, and OLR1 and RENBP were highly expressed in the high- and low-risk groups respectively (Fig. 4C). The Kaplan–Meier (K-M) curve illustrated that the low-risk patients had higher survival probability (P = 0.0098) (Fig. 4D). Additionally, ROC curve analysis showed AUCs greater than 0.7 for 1-, 3-, and 5-year survival in the training set, indicating the robust predictive capacity of the risk model (Fig. 4E). Moreover, the validation results of both internal and external validation (GSE27020) sets showed the consistent results with those of the training set (Figs. 5A–5F), and the AUCs of its 1-, 3- and 5-year survival rates were all greater than 0.65. The stability and reliability of the risk model, which could effectively predict the prognosis of laryngeal cancer patients on different sample sets, had been fully demonstrated, and it had certain potential for clinical application.
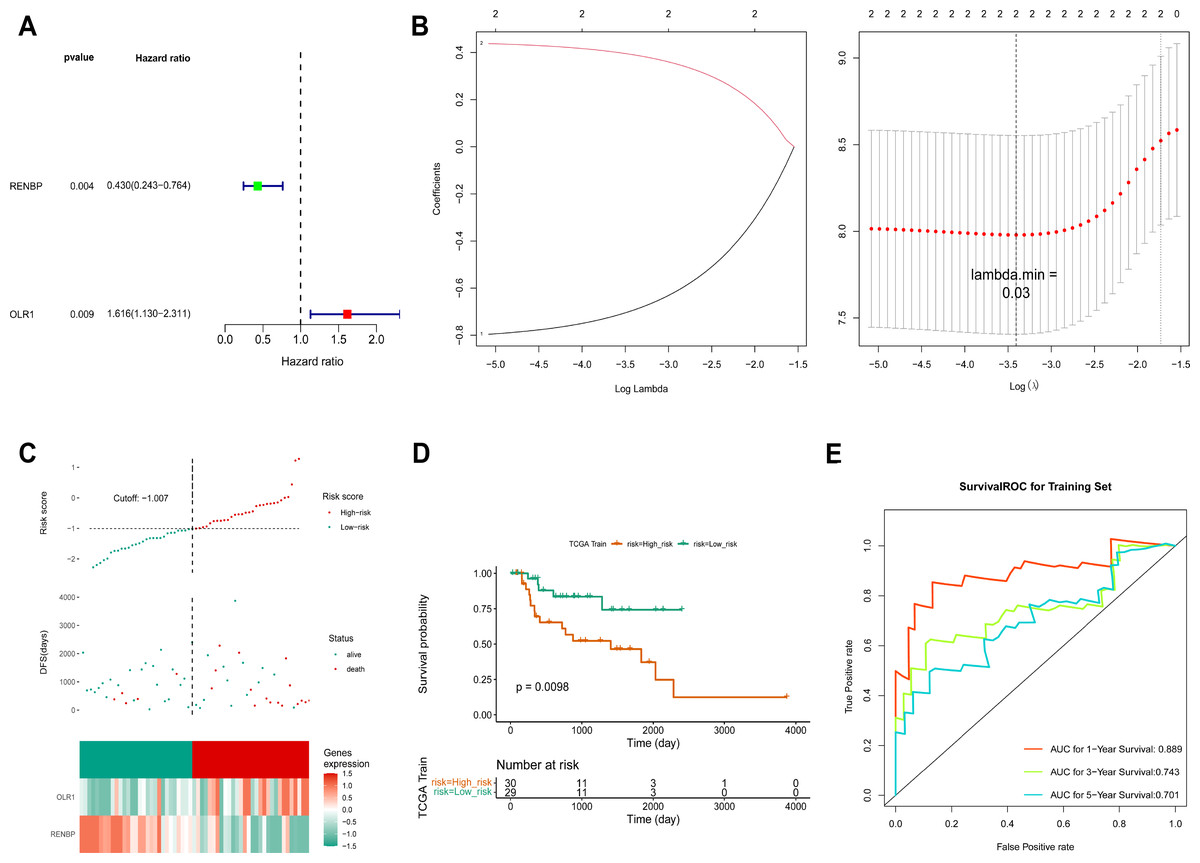
Figure 4: Construction of risk model.
(A) The screen of key genes by univariate Cox analysis. HR stands for risk ratio, and lower/upper 95% CI refers to the 95% confidence interval for the risk value. (B) The LASSO regression analysis of key genes. On the left is the graph of gene coefficients, with the horizontal axis representing the proportion of residuals explained by the model and the vertical axis representing the coefficients of genes. On the right is the cross-validation error graph, with log (Lambda) on the horizontal axis and the vertical axis representing the error of cross-validation. (C) Risk curves, scatter plots, and heat maps of prognostic biomarkers expression about high- and low-risk groups of patients in the training set. (D) Survival analysis of training set. (E) ROC curve of training set.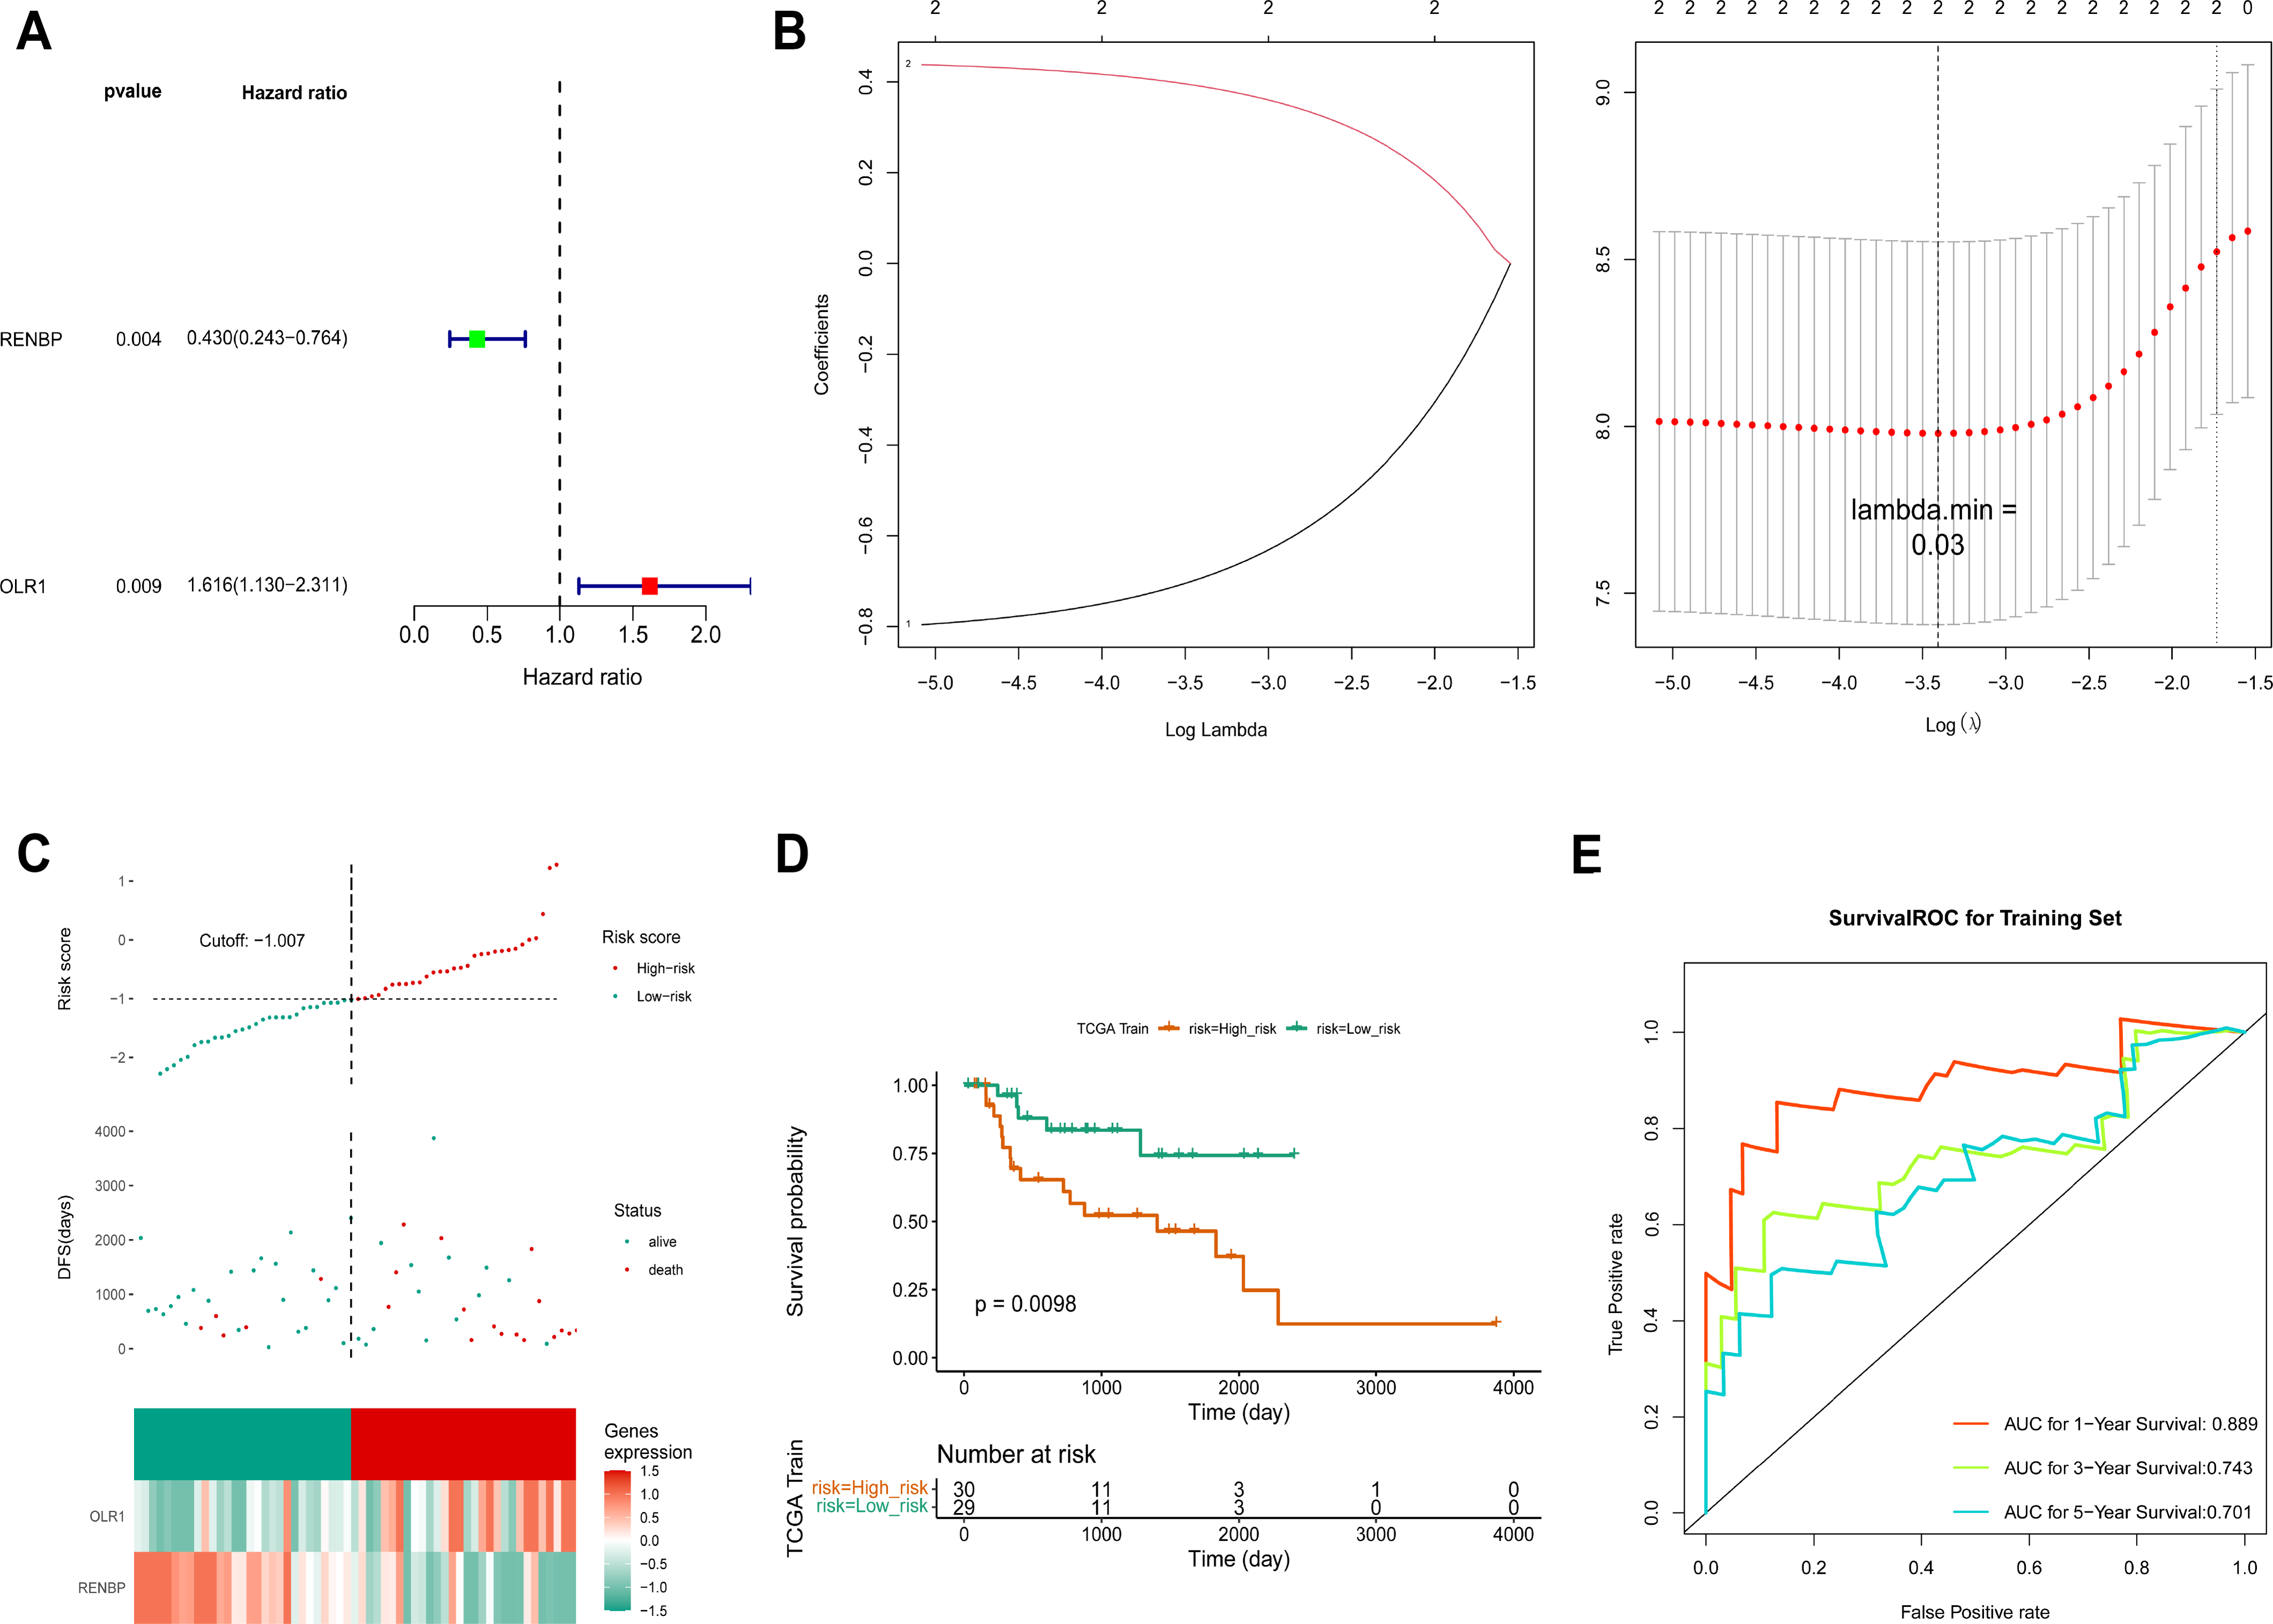
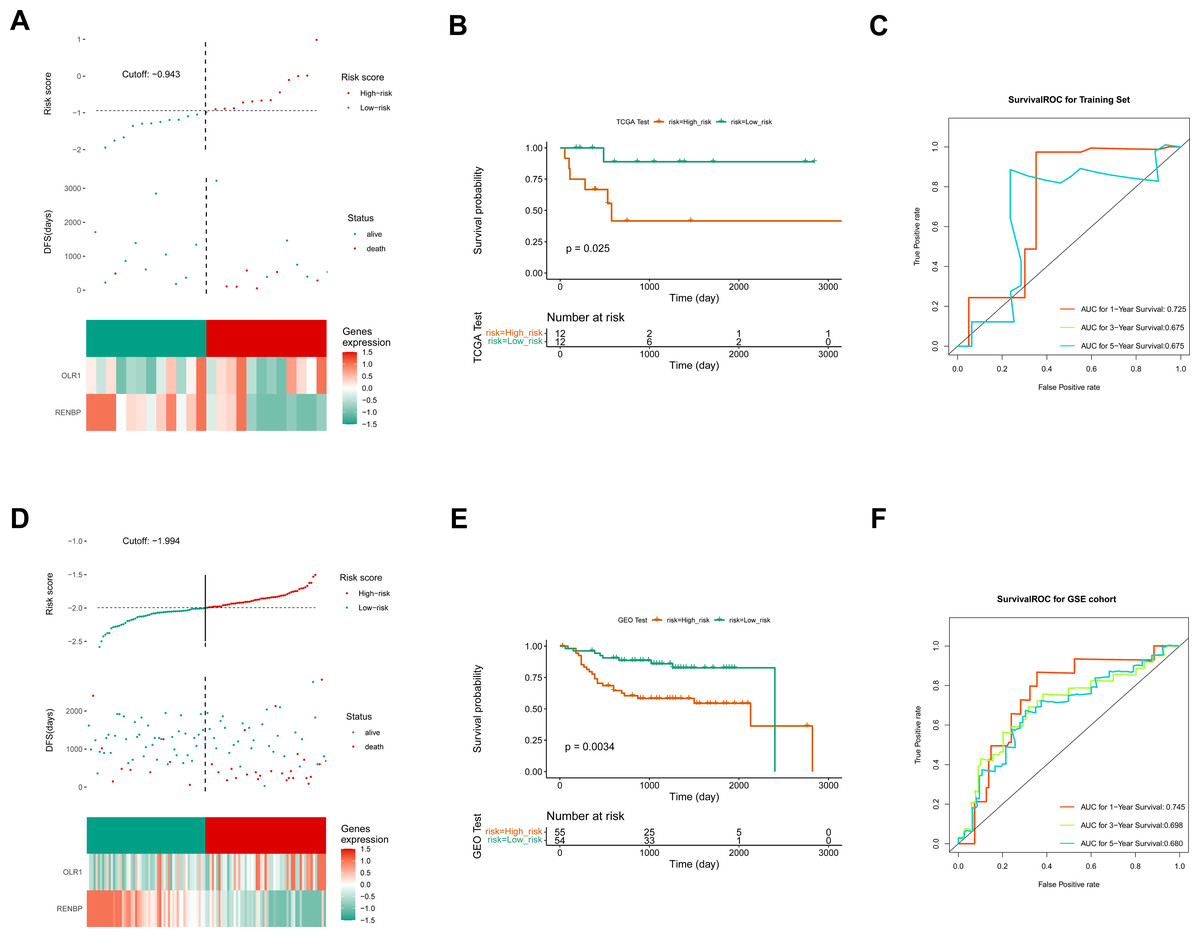
Figure 5: Construction of validation set risk models.
(A) Risk curves, scatter plots, and heat maps of prognostic biomarkers expression about high- and low-risk groups of patients in the internal validation set. (B) Survival analysis of the internal validation set. (C) ROC curve of the internal validation set. (D) Risk curves, scatter plots, model gene expression heat maps of high and low risk subgroups of patients in the external validation set. (E) Survival analysis of the external validation set. (F) ROC curve of the external validation set.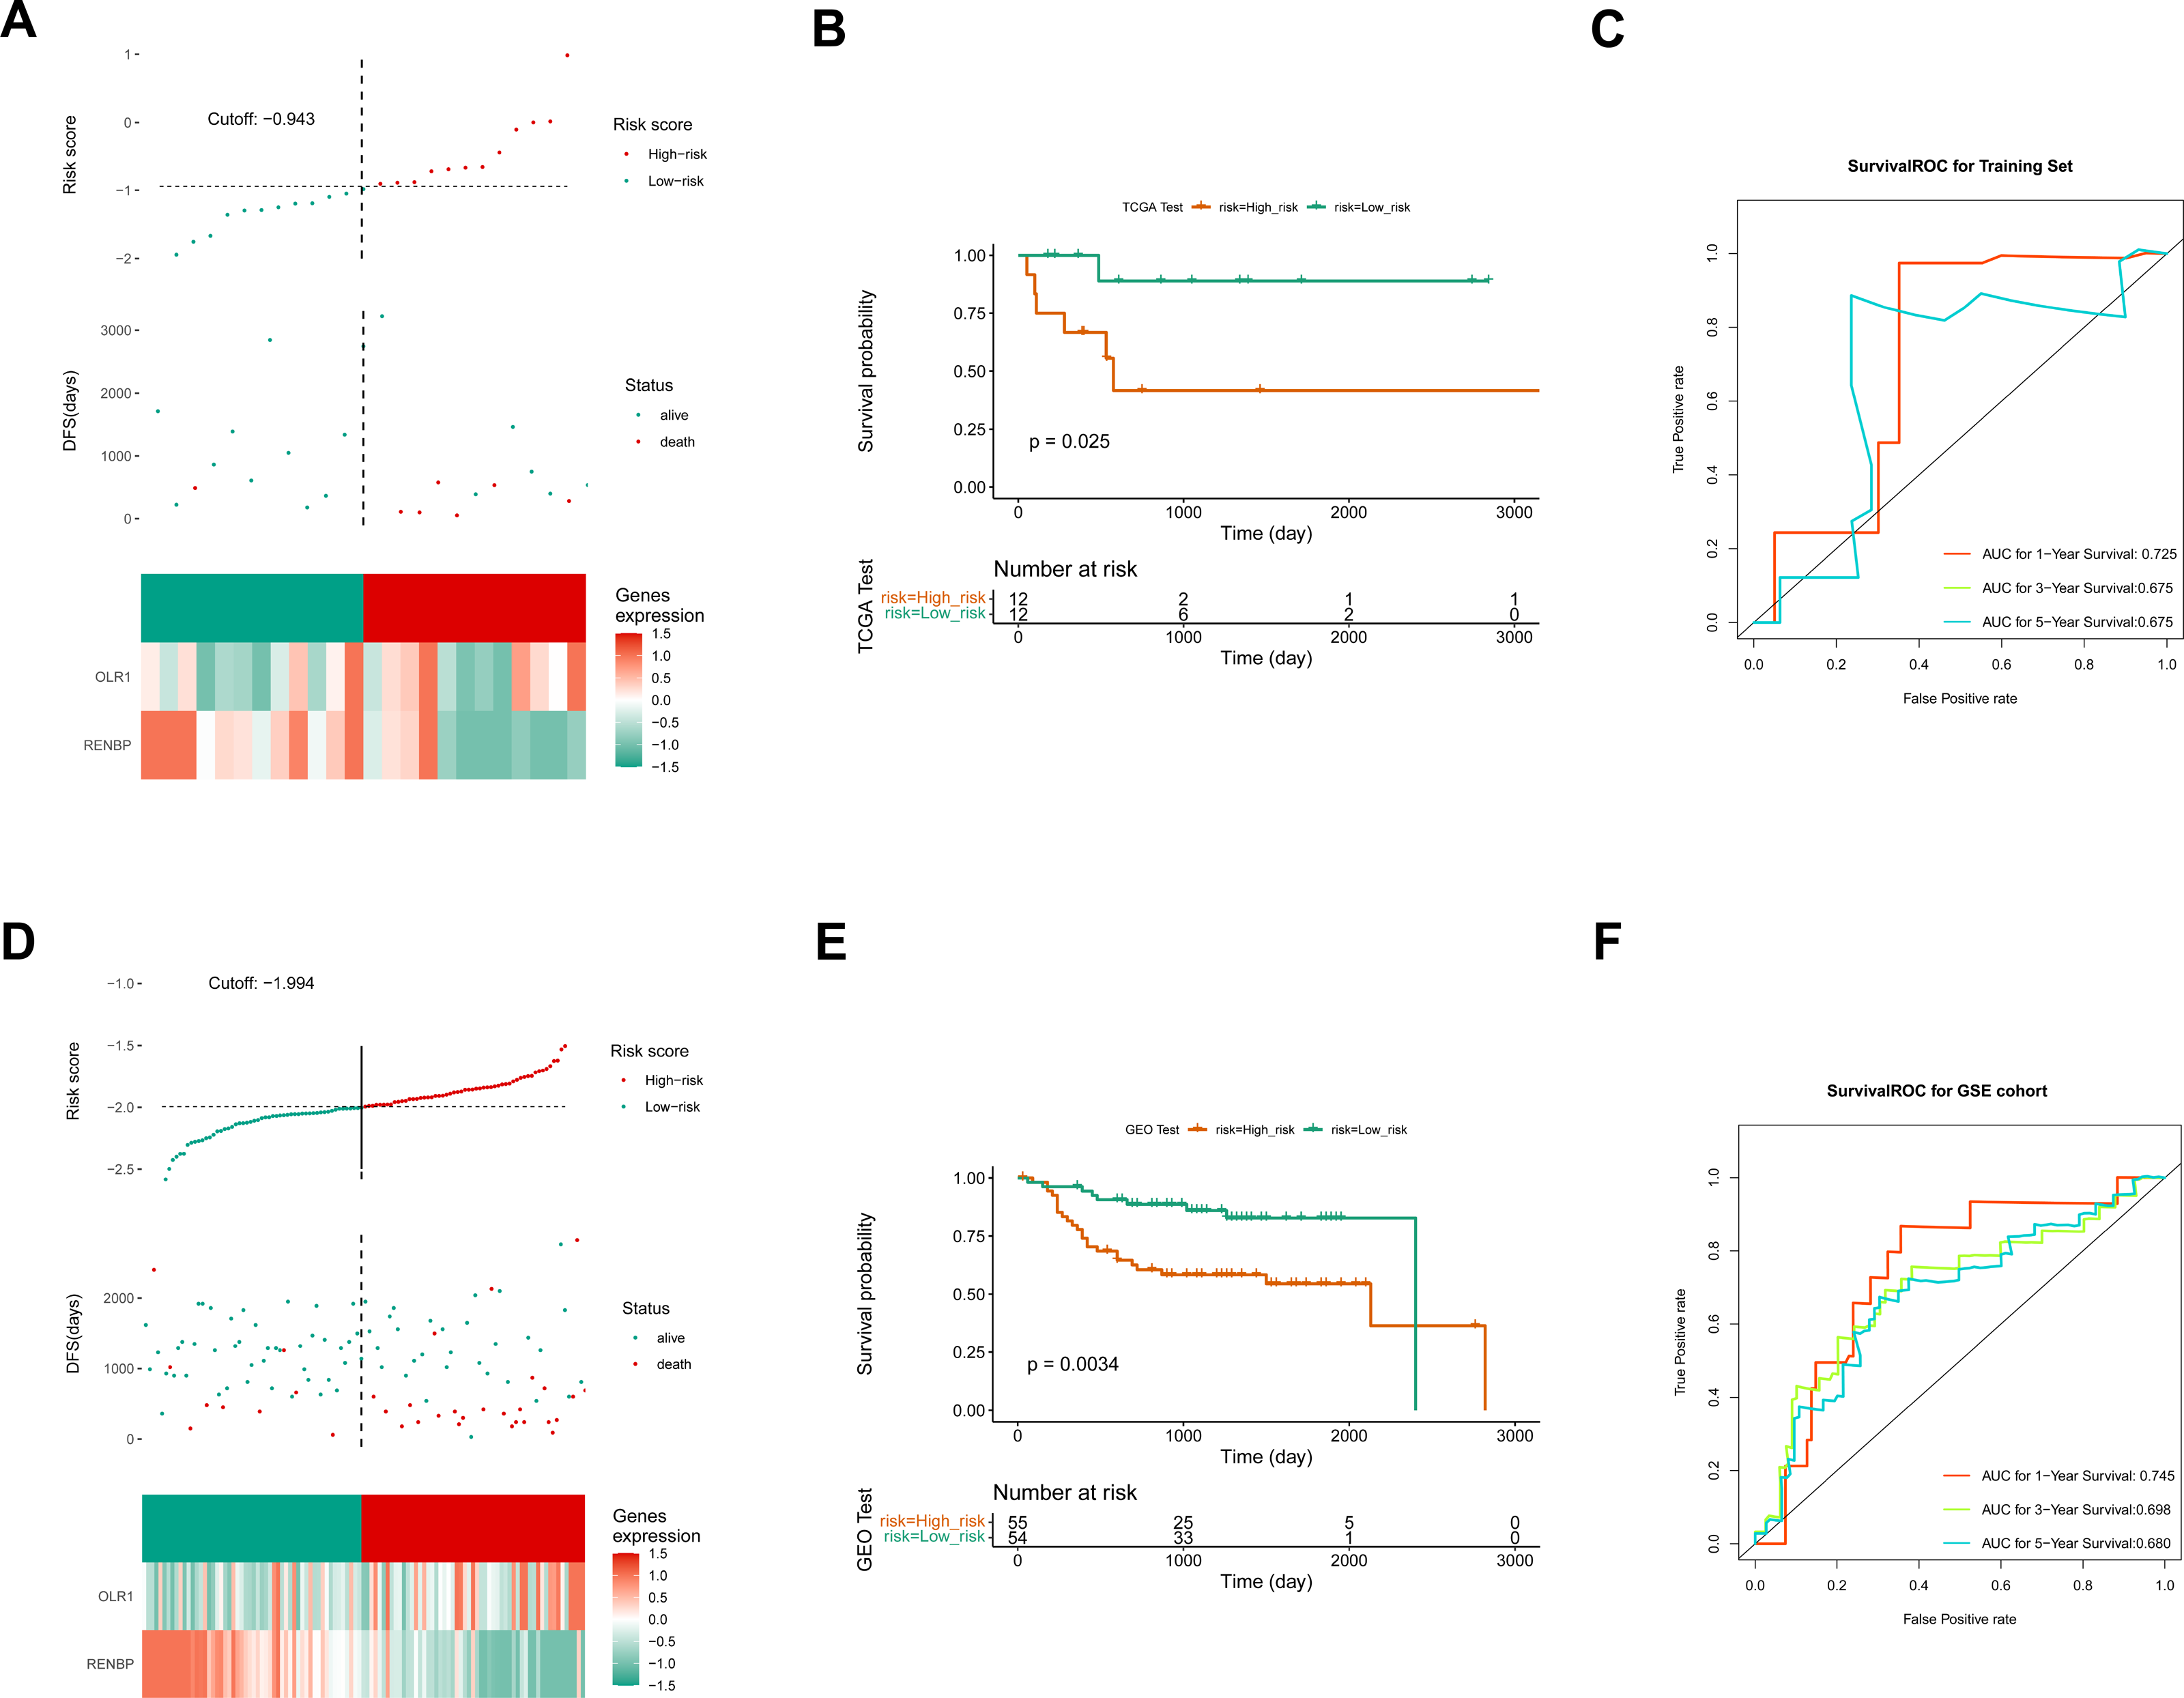
Prediction of nomogram was accurate
The correlations between clinicopathological characteristics (Age, T, N, M, Gender, and Stage) of 83 TCGA-LC samples and the prognostic biomarkers were shown in the heat map (Fig. 6A), and it could be found that there were significant survival differences in N1-N3, M0, T3-T4, Stage III–IV, male, and age≤60 subgroups between different risk groups (Fig. 6B). This suggested that these clinicopathological features were closely related to the prognosis of patients with laryngeal cancer and could be used as an important reference index for assessing the prognostic risk of patients. The univariate Cox independent prognostic analysis result illustrated that N, Age and risk score could be considered independent prognostic factors (P < 0.05) (Fig. 6C). Next, the Multivariate Cox independent prognostic analysis showed that the N (P = 0.04) and risk score (P = 0.001) could be regarded as independent prognostic factors for LC (Fig. 6D).
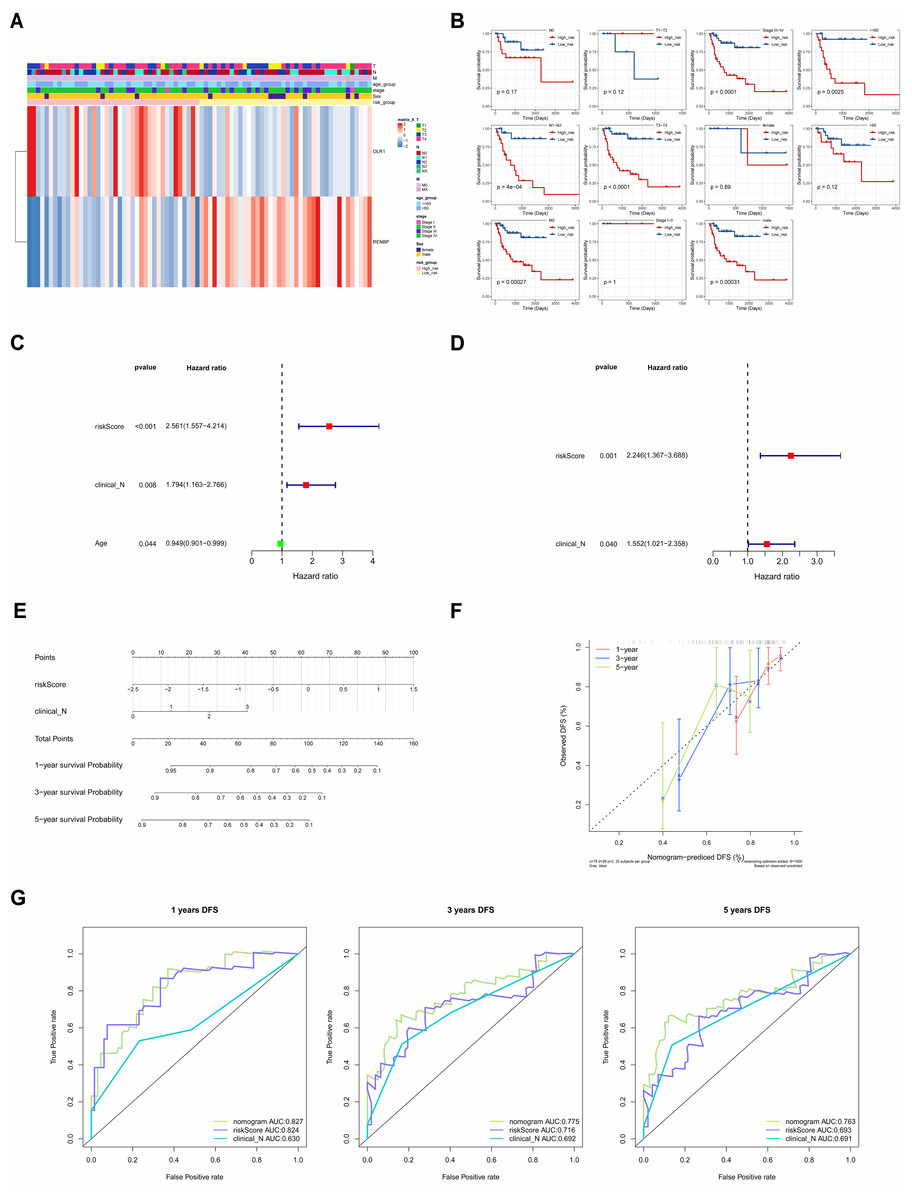
Figure 6: The clinical correlation analysis and independent prognostic model.
(A) Heat map of clinical features and risk scores. (B) Difference analysis between clinical features and risk score. (C) Univariate Cox independent prognostic analysis: incorporation of clinicopathological factors (T stage, N stage, gender, age) and risk score into the risk model. (D) Multivariate Cox independent prognostic analysis: incorporation of factors (N stage, age, risk score) into the risk model. (E) Nomogram of independent prognostic model. (F) Calibration curves of the nomogram. (G) ROC curves of DFS survival. In the 1-year, 3-year, and 5-year DFS survival ROC curves, the ROC curve of the independent prognostic model composed of risk score and N clinical factors was shown.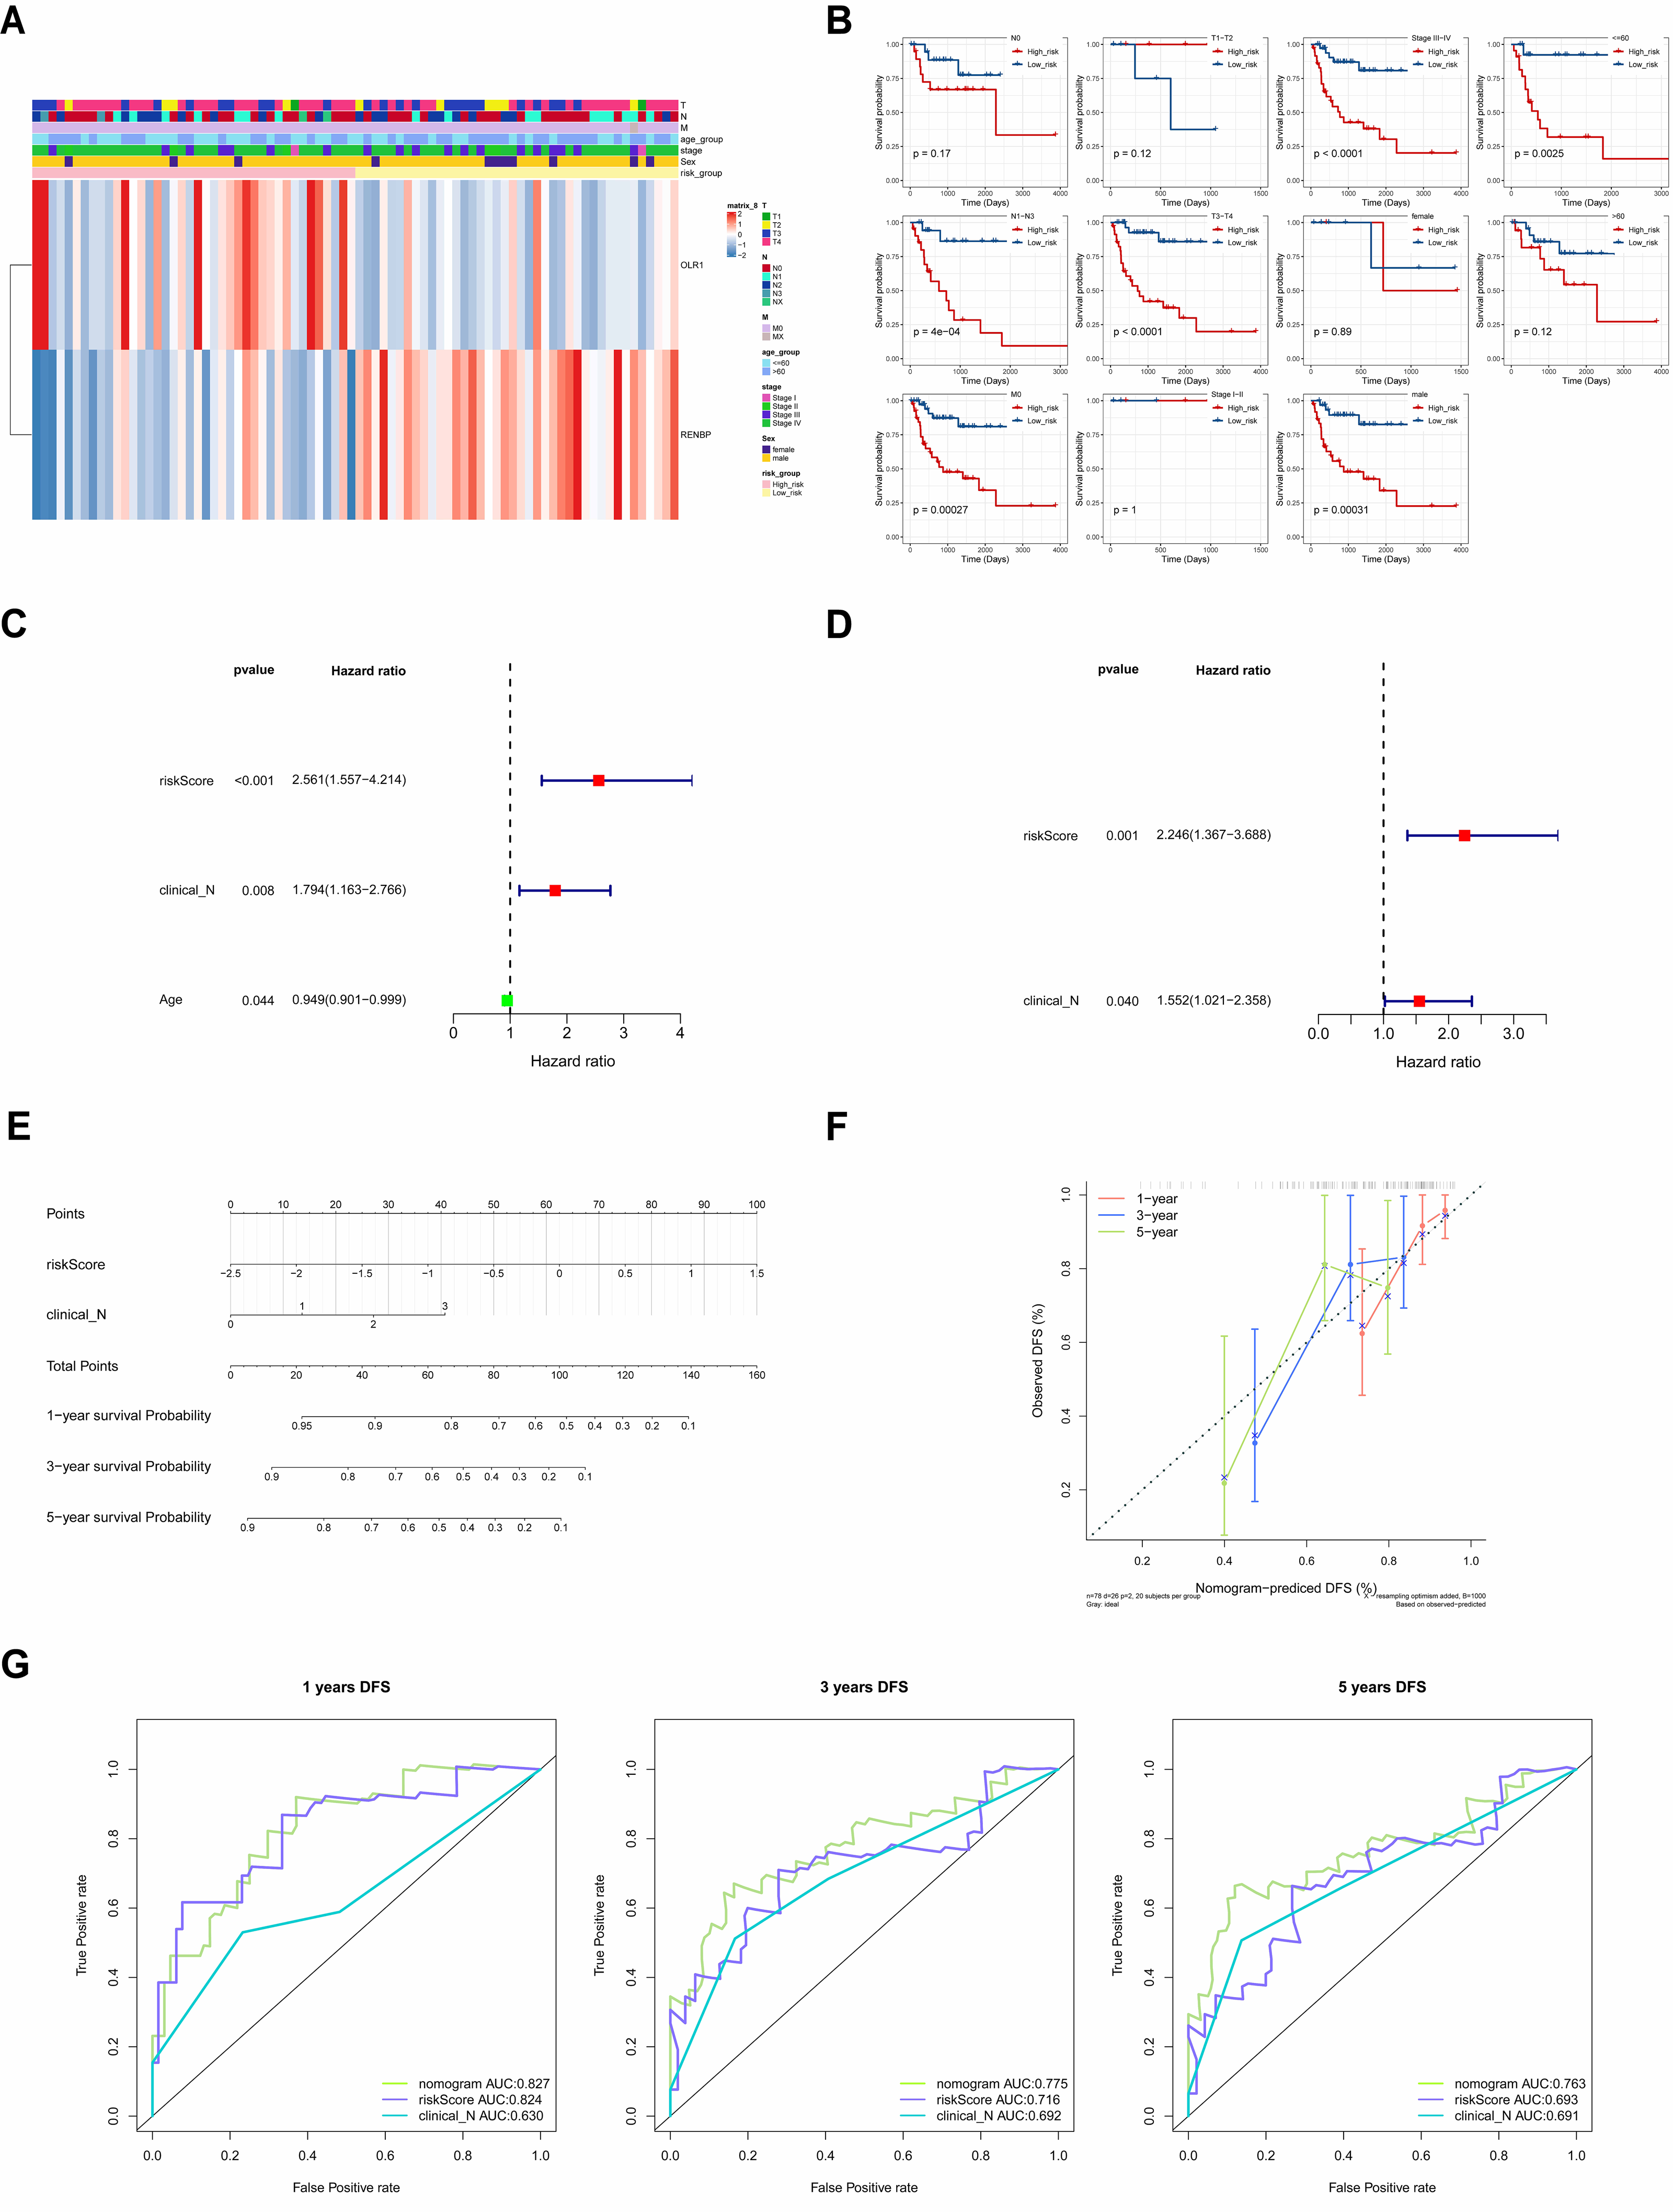
Moreover, it could be seen that the C-index of the nomogram based on N and risk score was 0.6886, and the calibration curves revealed that the prediction of this nomogram was accurate (Figs. 6E, 6F). Moreover, in the 1-, 3-, and 5-year DFS survival ROC curves, the AUCs of the nomogram were optimal, reaching 0.827, 0.775 and 0.763, respectively (Fig. 6G).
Expression validation of model genes
It could be found that, in the training set, the expressions of RENBP and OLR1 were both significantly higher in LC samples (Fig. 7A). And the validation results from the GSE51985 showed consistency with those in the training set (Fig. 7B).
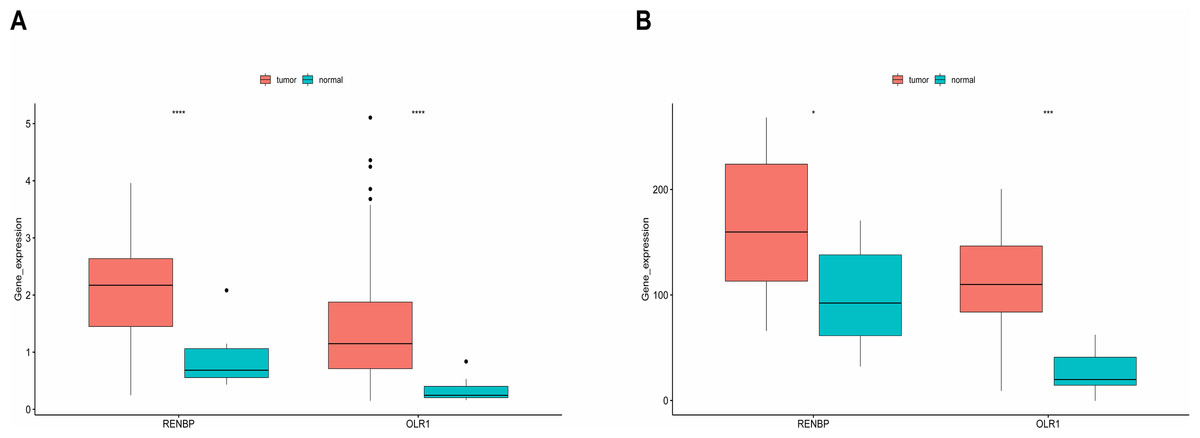
Figure 7: Expression analysis of prognostic biomarkers.
(A) In the training set, the expressions of RENBP and OLR1 were both significantly higher in LC samples. (B) The validation results derived from dataset GSE51985 demonstrated that both RENBP and OLR1 exhibited significantly elevated expression levels in LC samples. The statistical method used here was the Wilcoxon test, ****P-value < 0.0001; ***P-value < 0.001; **P-value < 0.01; *P-value < 0.05.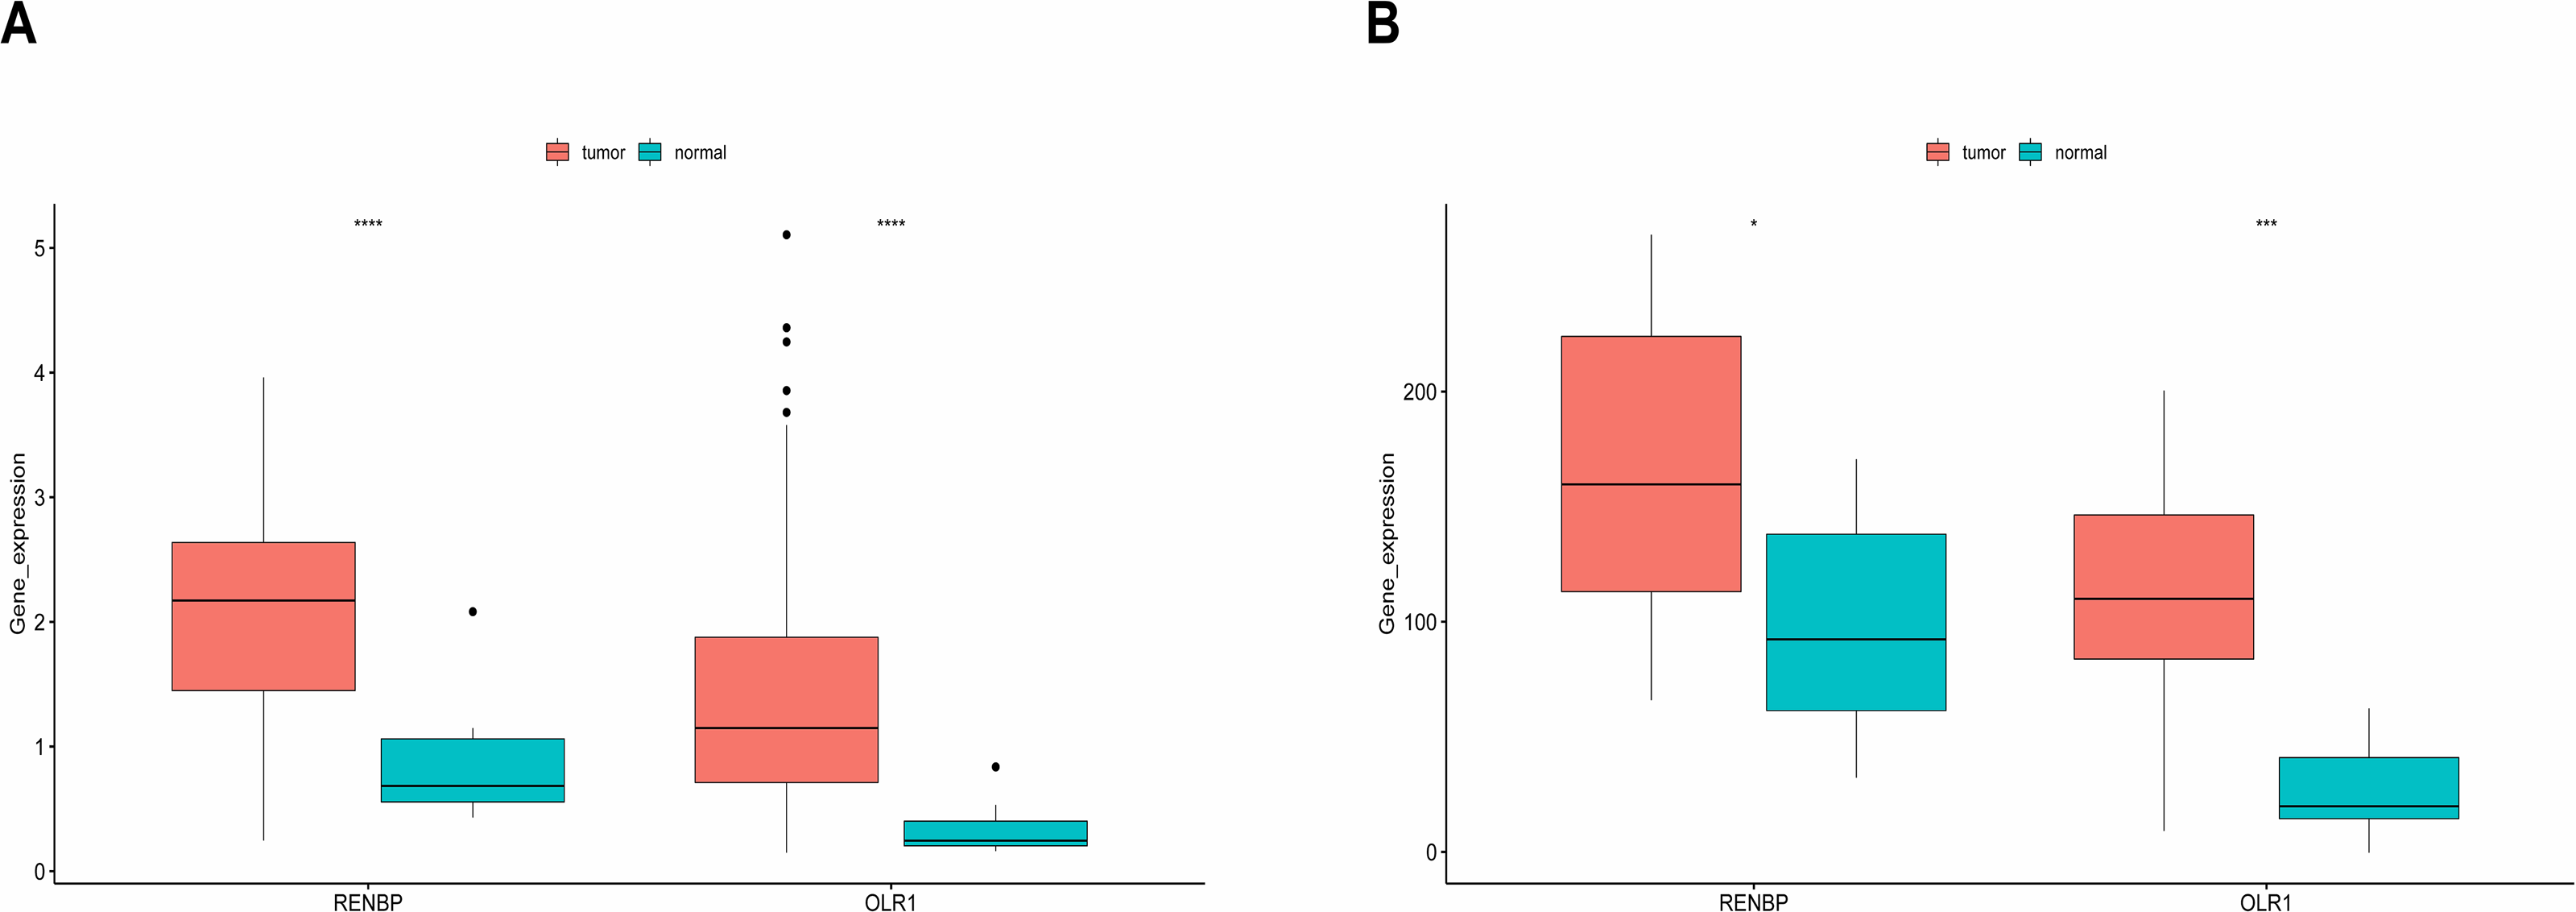
GSVA
To analyze the effects of grouping on LC progression, GSVA was employed. The hallmark enrichment results revealed that 19 and 13 pathways were enriched in high- and low-risk groups, respectively. Enrichment of these pathways suggested that laryngeal cancer cells might have been more invasive and metastatic in the high-risk groups. It could be observed that in the high-risk group, the significantly enriched pathways mainly included epithelial-mesenchymal transition (EMT), coagulation, myogenesis, TGF-beta-signaling, angiogenesis, and hypoxia. In the low-risk group, MYC-targets-VI, reactive-oxygen-species-pathway, E2F-target, and DNA-repair were the major enriched pathways (Fig. 8A). In terms of KEGG pathways, 23 and 26 pathways were significantly enriched in the high- and low-risk groups respectively. For instance, in the high-risk group, ECM-receptor-interaction, focal adhesion, cardiomyopathy-HCM, pathways in cancer, etc. were the major enriched KEGG pathways. In addition, autoimmune thyroid disease, ribosome, and oxidative phosphorylation were the main enriched KEGG pathways in the low-risk group (Fig. 8B).
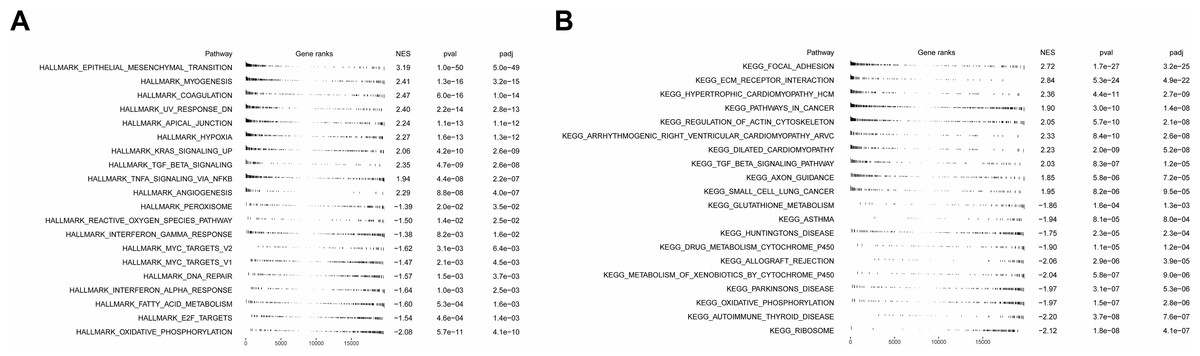
Figure 8: Functional enrichment analysis of high- and low-risk groups.
(A) Hallmark functional enrichment analysis in high- and low-risk groups. (B) KEGG functional enrichment analysis in high- and low-risk groups. In the above two figures, the first column represents the names of enriched pathway entries; the second column represents the relative position of the gene list sorted by log (FC) in the pathway, with each small vertical line representing a gene; the third column, namely ES (Enrichment Score), represents the enrichment score. Positive ES indicates that a certain functional gene set is enriched in front of the sorting sequence, while the negative ES indicates that a certain functional gene set is enriched after the sorting sequence; the fourth and fifth columns represent the p-value and the adjusted p-value, respectively.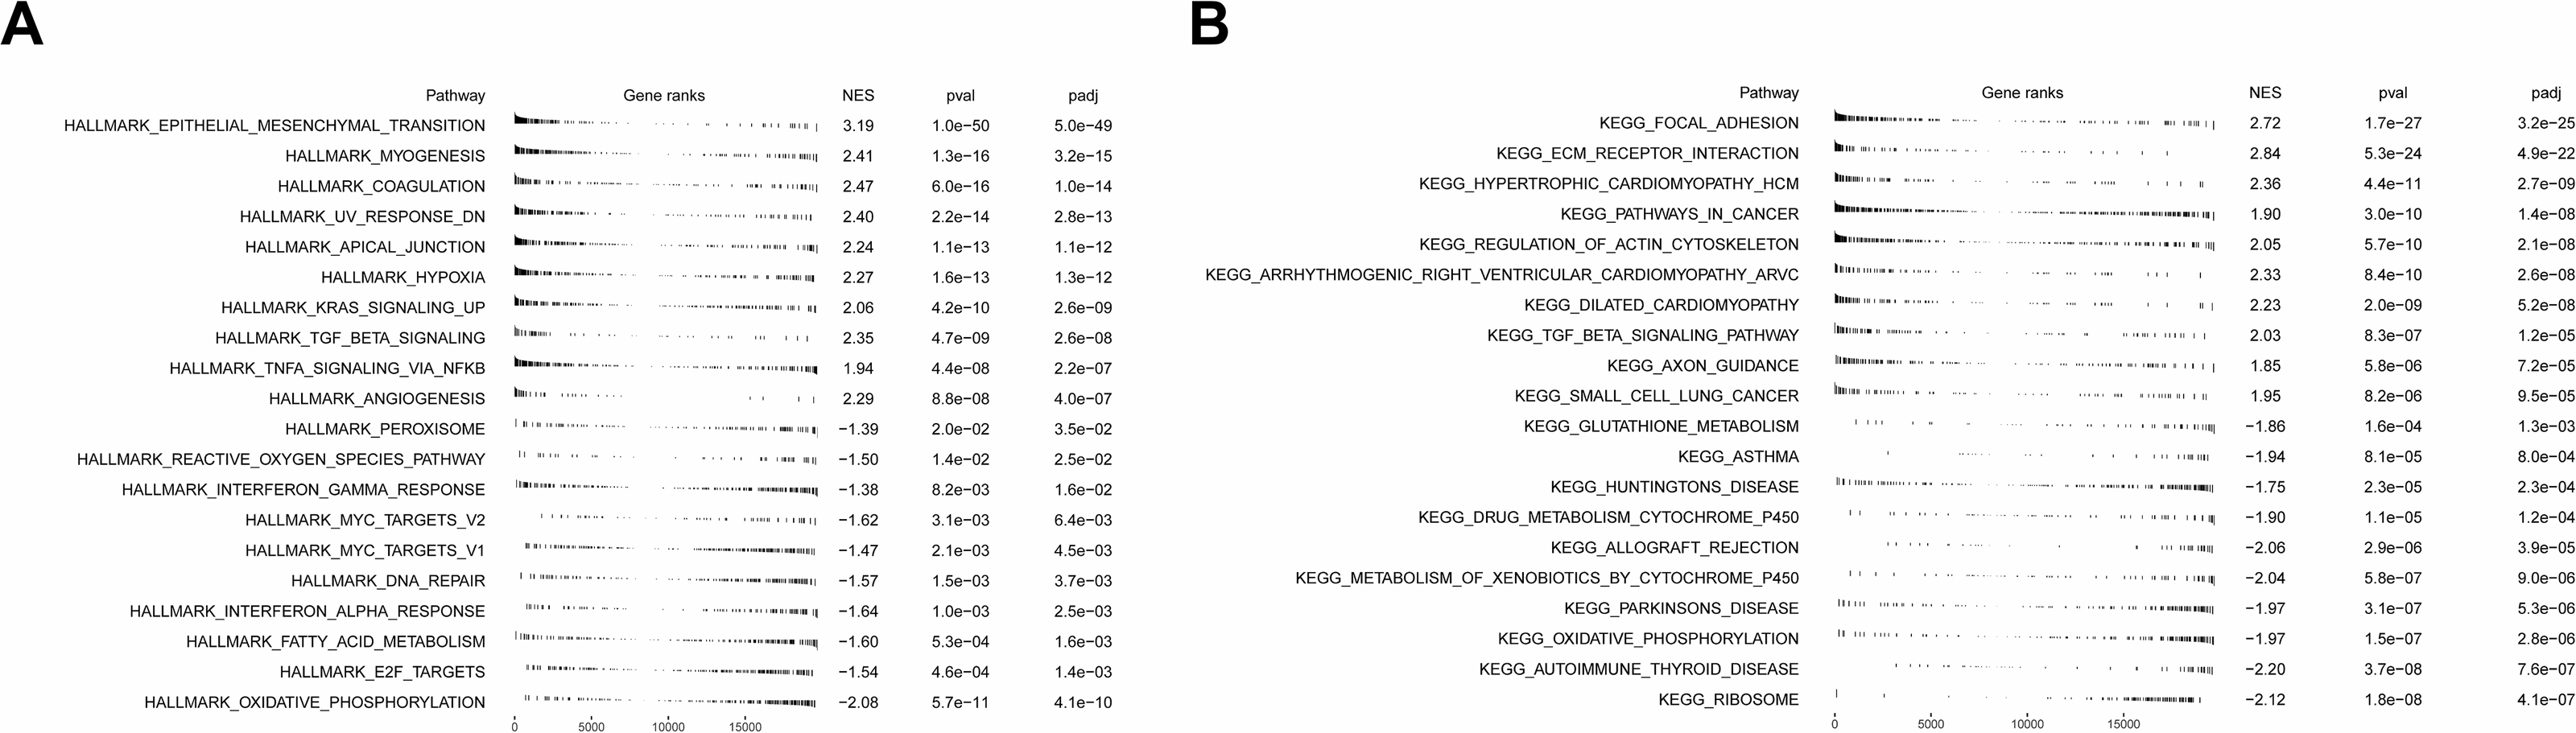
Immune infiltration and therapy
ESTIMATE analysis revealed a significant difference in stromal scores between the two risk groups, with the high-risk group exhibiting a higher stromal score (Fig. 9A). This suggested that the stromal component of the tumor microenvironment might have been more abundant in the high-risk group, which might have been associated with tumor characteristics such as aggressiveness, growth and metastasis. Additionally, the violin plot of ssGSEA showed that the differences in the proportions of the majority of immune cells were insignificant between the two groups. It was noteworthy that the percentages of CD8.T.cells, Cytolytic.activity, Inflammation.promoting, and pDCs were significantly higher in the low-risk group, while the proportions of T.cell.co.stimulation and Tfh were higher in the high-risk group (Fig. 9B), and the heat map showed the similar results (Fig. 9C).

Figure 9: ESTIMATE algorithm and immunotherapy analysis.
(A) Immune microenvironment score. (B) Violin diagram of immune score of immune cells in high- and low-risk groups. The horizontal axis represents immune cell function, and the vertical axis represents ssGSEA score. (C) Heat map of immune score of immune cells in high- and low-risk groups. (D) Analysis of TIDE score difference between high- and low-risk groups. TIDE results included TIDE, IFNG, Merck18, CD8, dysfunction, exclusion score. (E) Correlation analysis between tumor immune dysfunction and mutual exclusion score and risk score. (F) Difference analysis of immune checkpoint in high- and low-risk groups. Horizontal coordinates indicated the immune checkpoint genes, and vertical coordinates indicated the gene expression. The statistical method was the Wilcoxon test. ****P-value < 0.0001; ***P-value < 0.001; **P-value < 0.01; *P-value < 0.05.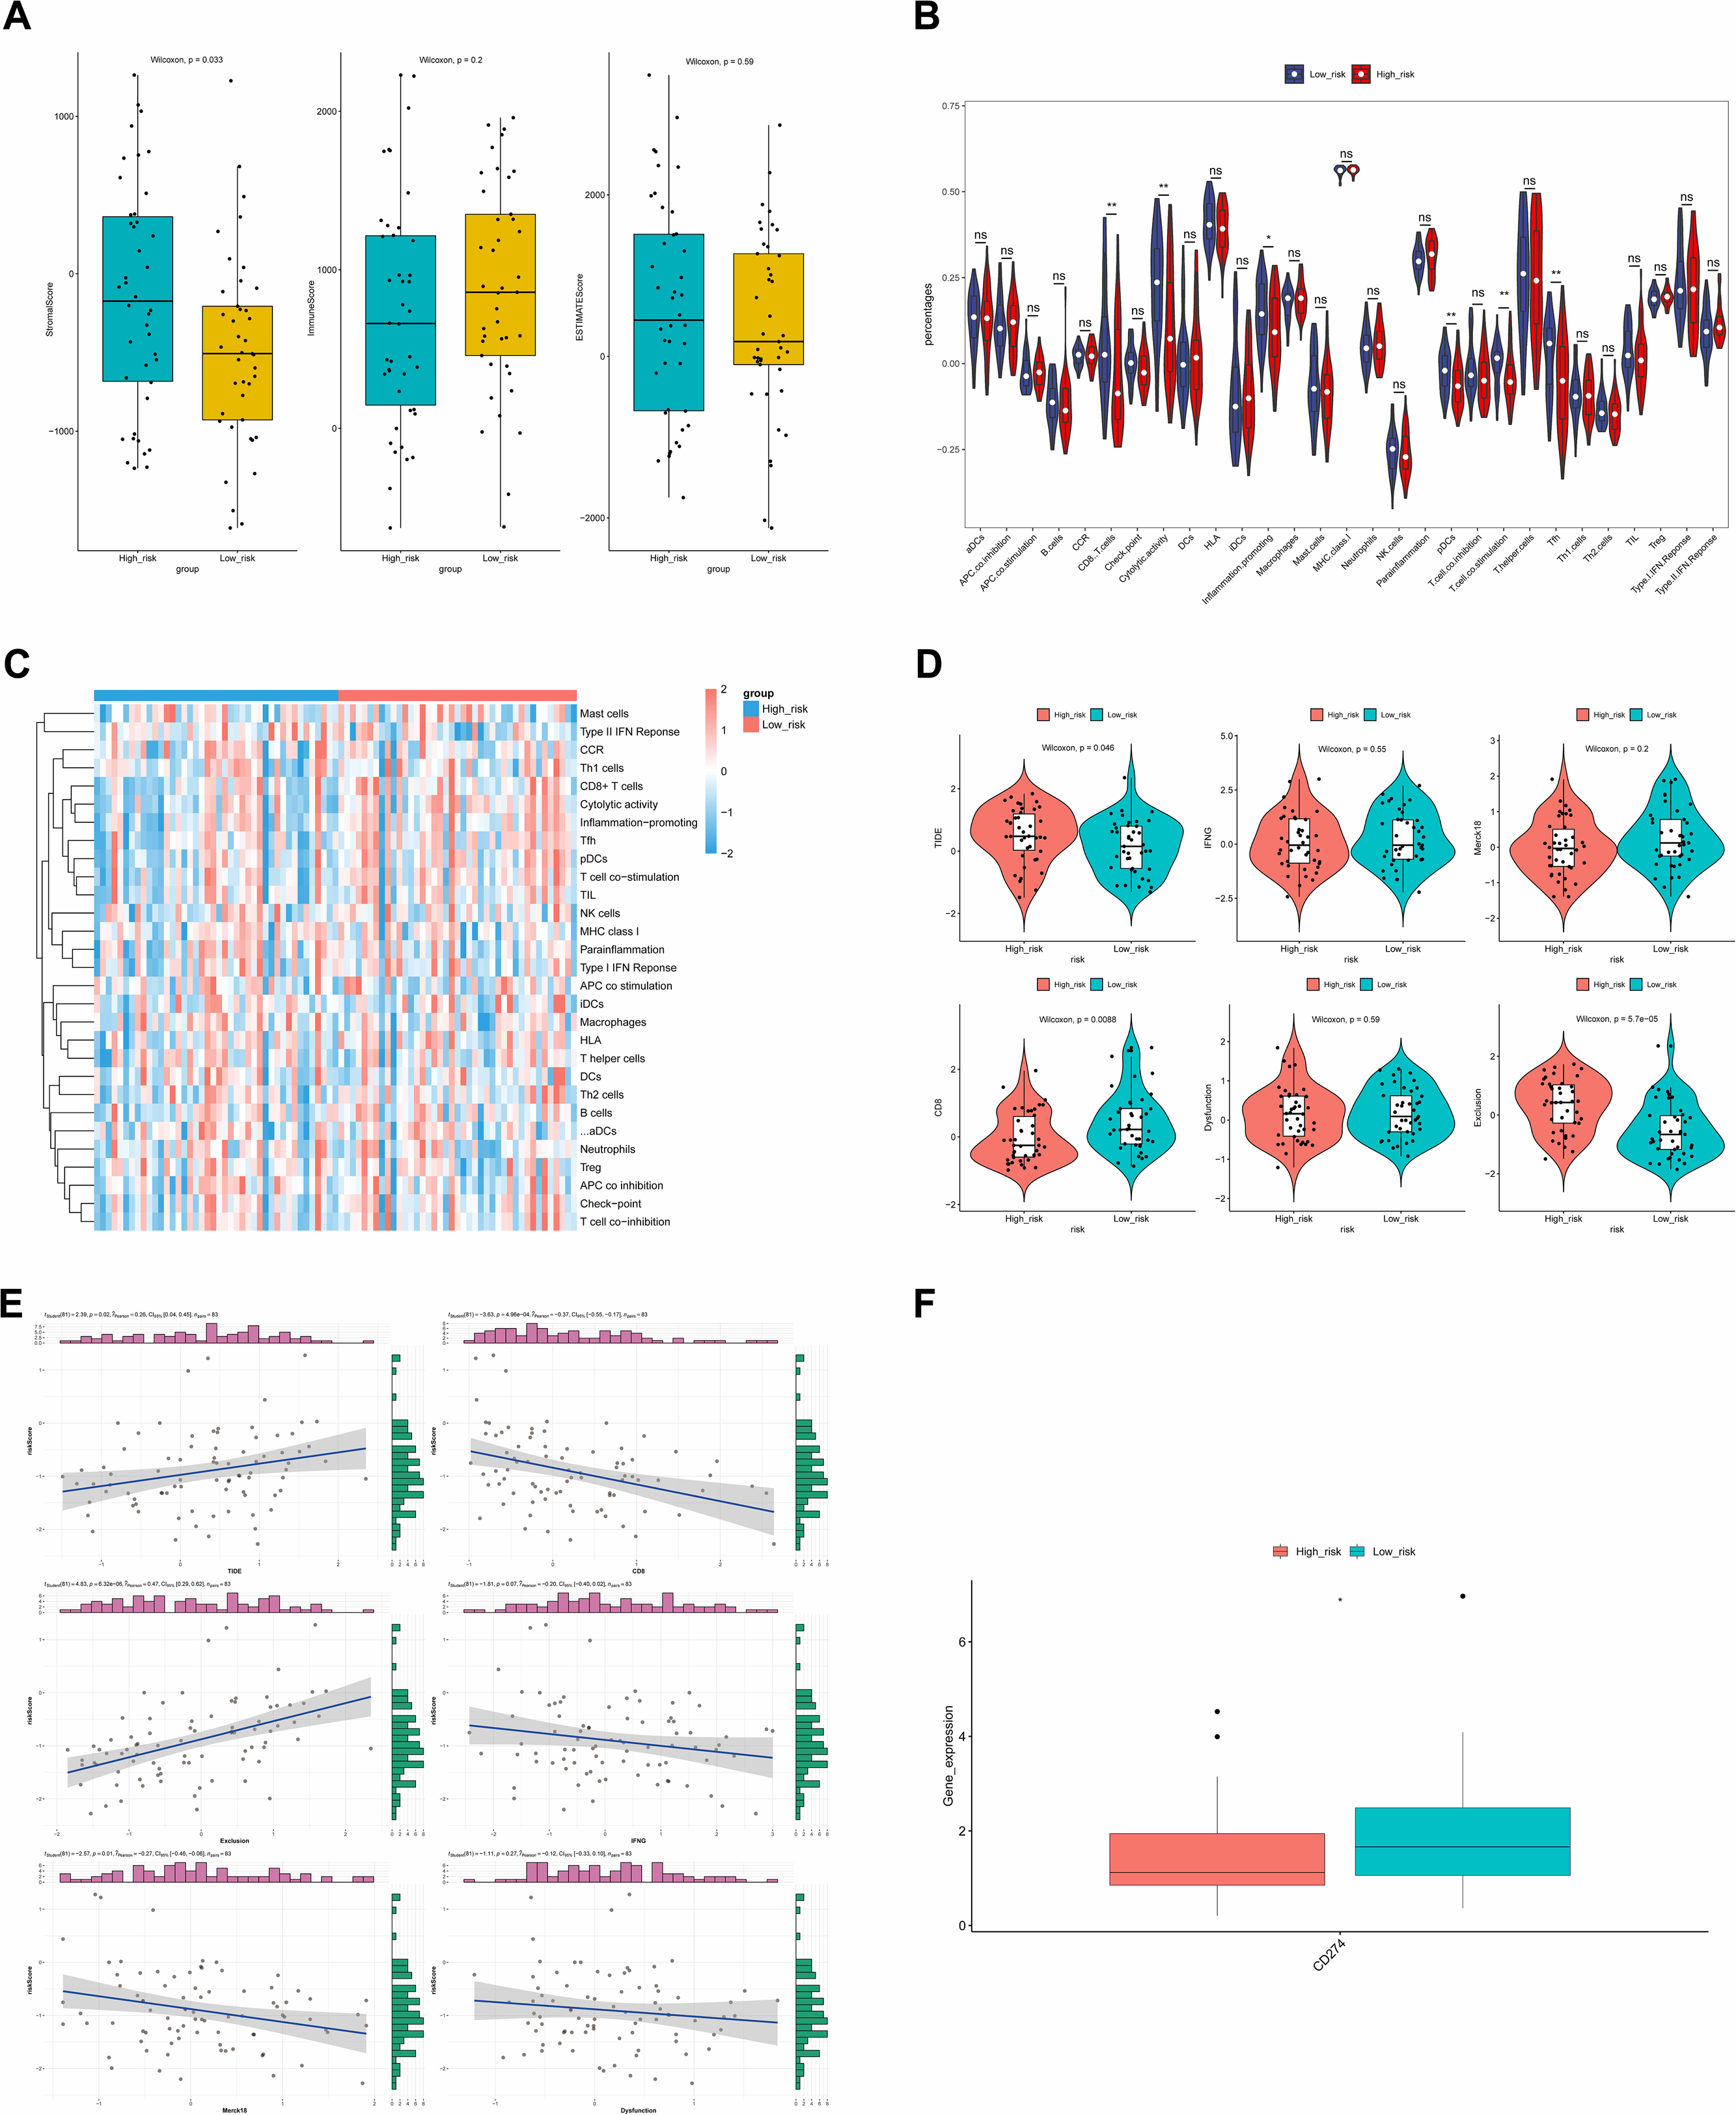
The TIDE results demonstrated that there were significant differences in the TIDE score, CD8 score and Exclusion score between the two risk groups. Specifically, TIDE and Exclusion scores were higher in the high-risk group, but the CD8 score showed the opposite result (Fig. 9D). Additionally, except that positive correlations were found between the TIDE score and risk score, and between Exclusion score and risk score, other scores showed negative correlations with risk score. The strongest correlation was found between Exclusion score and risk score, which was 0.47 (Fig. 9E). Finally, the expression level of CD274 (PD-L1) was significantly higher in the low-risk group (Fig. 9F). Higher PD-L1 expression in the low-risk group might have meant that immune cells in this group were in a relatively active but suppressed state.
The expression of OLR1 and RENBP in tissues
The results of RT-qPCR showed that the expression of OLR1 (n = 29, P = 0.0003) in LC tissues was higher than that in adjacent normal tissues (Fig. 10A); and the expression of RENBP (n = 29, P = 0.0431) in LC tissues was slightly higher than that in adjacent normal tissues (Fig. 10B). Capture three fields of view randomly under 200× magnification for positive expression area analysis in each group. The results showed that OLR1 (n = 10, P = 0.0068) and RENBP (n = 9, P = 0.0078) were highly expressed in LC tissues (Fig. 10C). Subsequently, we used IHC to detect the expression of PD-L1 in cancer and adjacent tissues. The expression of PD-L1 (n = 12, P < 0.0001) was increased in cancer tissues compared with adjacent tissues (Fig. 10D). Finally, we conducted the analysis of clinical pathological parameters, and the result was presented in Tables S4A, S4B. This further confirmed the up-regulation of OLR1 and RENBP expression in laryngeal cancer identified in the bioinformatics analysis, and provided strong evidence at the experimental level for the use of these two genes as laryngeal cancer-associated biomarkers, suggesting that their aberrant expression in laryngeal cancer tissues might have been closely related to the developmental process of laryngeal cancer.
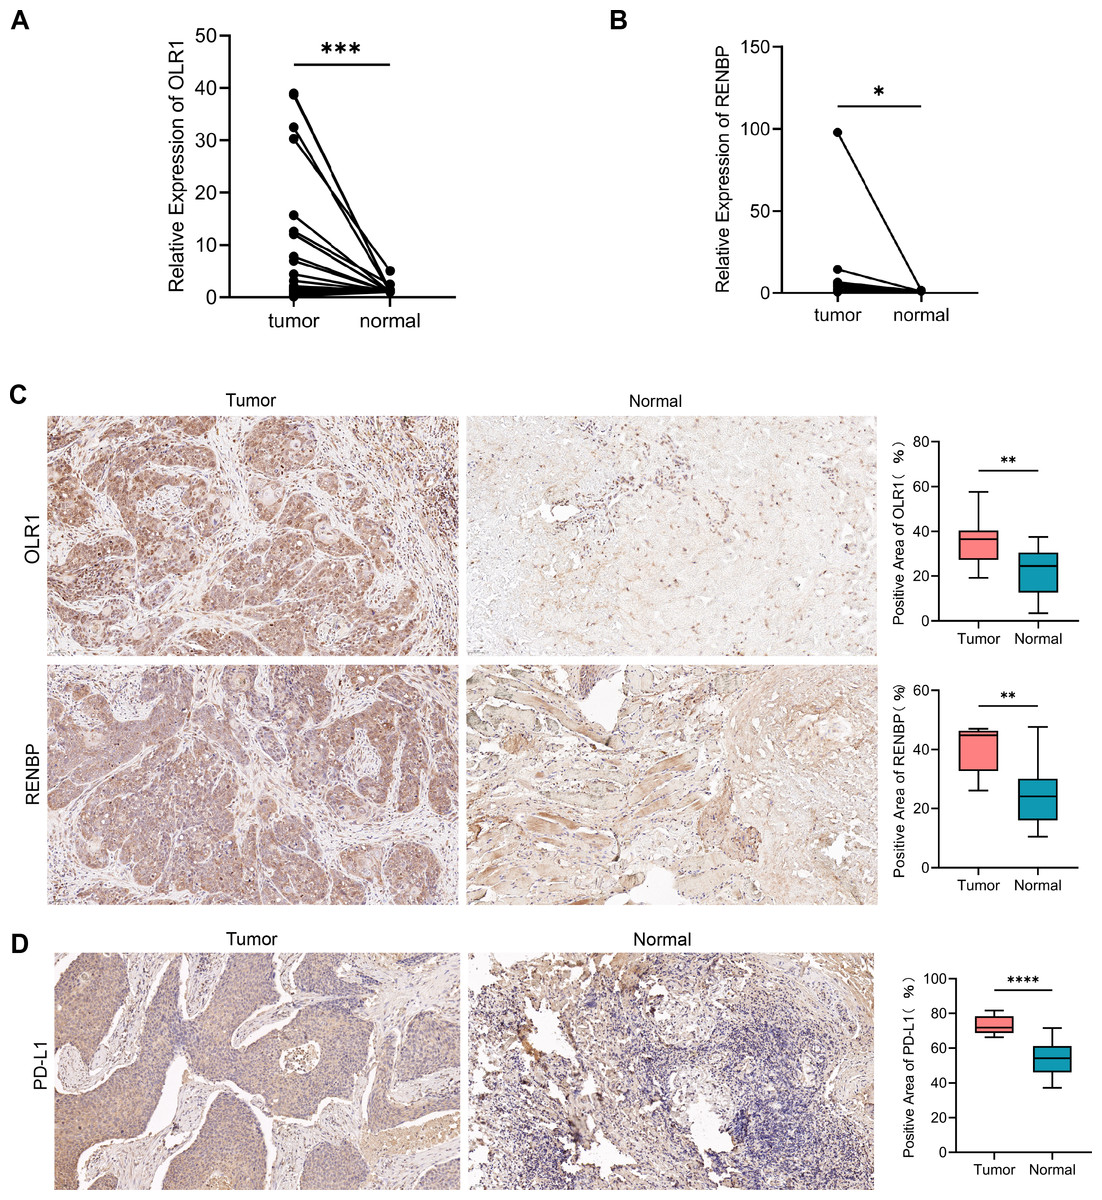
Figure 10: The expression of OLR1 and RENBP in LC was higher than that in adjacent normal tissues.
(A, B) RT-qPCR results showed that the expression of OLR1 and RENBP was higher in LC tissues. (C, D) IHC results showed that OLR1, RENBP and PD-L1 were highly expressed in LC tissues (200 ×). Notes: ****P-value < 0.0001; ***P-value < 0.001; **P-value < 0.01; *P-value < 0.05.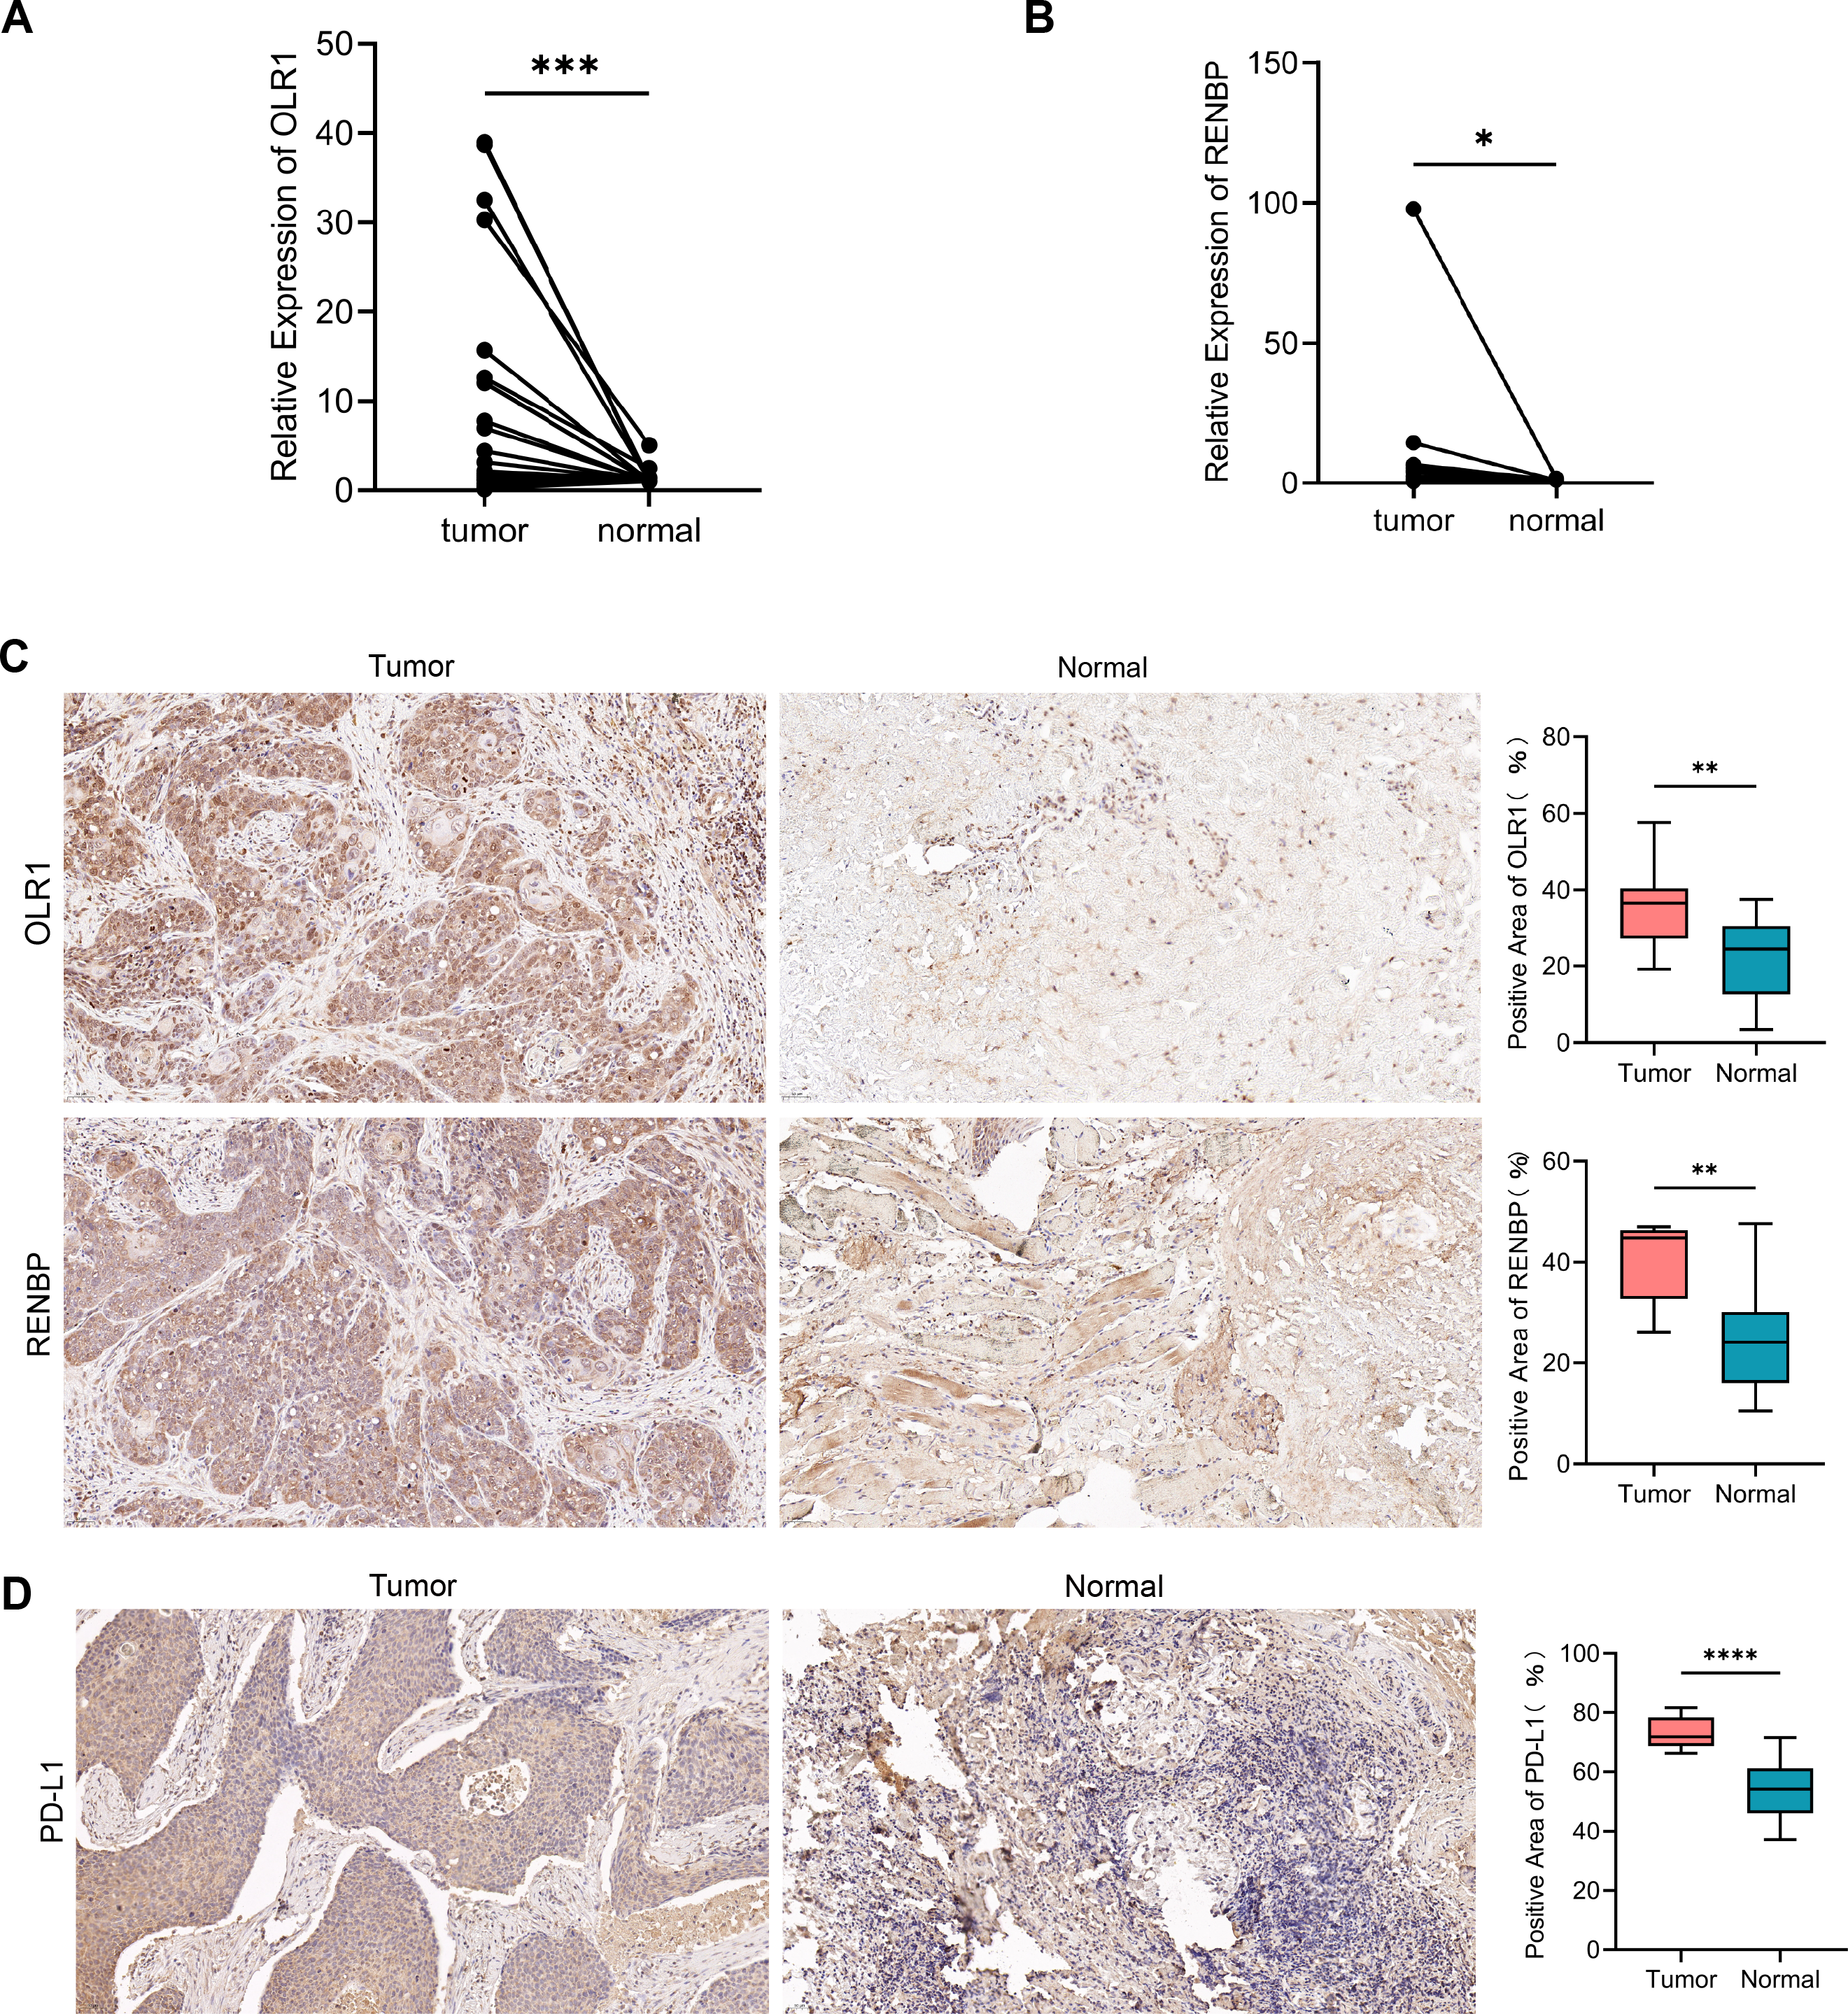
Discussion
LC is a serious disease that affects human health, with a five-year survival rate of only 63% (Siegel, Miller & Jemal, 2016). This underscores the urgent need for new biomarkers and a deeper understanding of its developmental mechanisms, which could greatly enhance early diagnosis, prognosis, and treatment strategies for LC. However, there remains a lack of prognostic markers linked to immune cell-related genes in LC. This study constructs a prognostic model based on immune cell-related genes, aiming to improve early diagnosis and prognosis assessment of LC.
In this study, 21 DE-ICs and 124 key genes were identified, with functional enrichment in GO terms related to defensive responses to viruses, antigen processing and presentation, and T-cell-mediated immunity, among others. Canel et al. (2023) reported that focal adhesion kinase (FAK) inhibits antigen processing and presentation, facilitating immune evasion in pancreatic cancer. Kelliher & Roderick (2018) highlighted that activation of the NOTCH signaling pathway enhances T-cell-mediated anti-tumor immunity, thereby extending tumor-free survival. Key pathways identified in this study included phagosomes, natural killer (NK) cell-mediated cytotoxicity, Toll-like receptor (TLR) signaling, and cell adhesion molecules. Malmberg et al. (2017) observed that abnormal NK cell cytotoxicity promotes cancer progression. TLRs, members of the pattern recognition receptor family, are essential for innate immune responses (Lim & Staudt, 2013). In head and neck cancer, TLR4 signaling promotes tumor growth and immune escape (Szczepanski et al., 2009), while in lung cancer, TLR4 signaling contributes to immune evasion by inducing immunosuppressive cytokines and apoptosis resistance (He et al., 2007). Decreased expression of cell adhesion molecules in LSCC correlates with poor prognosis (Chang et al., 2016). These findings align with our results, suggesting that immune-related biological functions and pathways are integral to LC development. Further studies are needed to explore the detailed mechanisms of these factors in LC.
Using the FPKM data of 124 key genes, univariate Cox and LASSO regression analyses identified two prognostic biomarkers, OLR1 and RENBP, which were incorporated into the risk model. The performance of the model was validated using the AUC, which confirmed its high efficiency. The AUC is a key metric for assessing the accuracy of predictive models, helping researchers evaluate the potential of multiple biomarkers for disease prediction (Mandrekar, 2010). OLR1 (oxidized low-density lipoprotein receptor 1), also known as lectin-like oxidized low-density lipoprotein receptor 1, functions as a receptor for oxidized low-density lipoprotein and is expressed in endothelial cells, macrophages, and smooth muscle cells (Mehta & Li, 2002). OLR1 has been identified as an oncogene and is significantly associated with patient prognosis in bladder cancer prognostic models (Khaidakov et al., 2011; Zhu et al., 2022). The abnormal expression of OLR1 may prompt macrophages to polarize in the pro-tumor direction, creating favorable conditions for the growth, invasion, and metastasis of tumor cells through the secretion of cytokines, the regulation of immune cell infiltration, and other means (Zhang et al., 2023c). In another study about HNSCC, Wu et al. (2023) further emphasized that OLR1 expression correlates with immune escape in cancer, and targeting OLR1 may enhance the efficacy of ICIs. RENBP (renin binding protein) is located on human chromosome X and functions by binding and inactivating renin, thereby regulating blood pressure (Takahashi, Inoue & Miyake, 1992; Knöll et al., 1997). RENBP is also part of the renin-angiotensin system (RAS), and RENBP may promote cancer cell migration, invasion, and metastasis by regulating RAS activity and affecting downstream signaling pathways, with RAS-targeted therapies showing potential to improve anti-tumor immunity (George, Thomas & Hannan, 2010; Wong et al., 2014; Catarata et al., 2020). Furthermore, in early life stages, RENBP has been associated with the composition of the immune network (Van Bilsen et al., 2020). Despite these insights, RENBP has not been widely studied in cancer. While previous research has analyzed the differential expression of immune cells in LSCC and their impact on prognosis (Li et al., 2022a), our study is the first to identify immune cell-related genes OLR1 and RENBP as prognostic markers for LC. This provides a more precise foundation for predicting patient outcomes. However, the mechanisms by which immune cells and their related genes influence the progression of LC remain unexplored in this study.
The nomogram constructed in our study provides a personalized prognosis estimate based on patient and disease characteristics. It integrates multiple prognostic factors to generate a probability of clinical events, offering a more reliable tool for outcome prediction (Balachandran et al., 2015). For comparison, Song, Miao & Chen (2018) developed a nomogram for pancreatic cancer prognosis, which incorporated variables such as age, site of onset, grade, stage, surgery status, tumor size, and marital status. In contrast, our nomogram emphasizes the influence of risk scores and N stages on patient outcomes, making it a simpler and more reliable tool.
The functional enrichment analysis revealed that the pathways enriched in the high-risk group are closely associated with cancer progression, including epithelial-mesenchymal transition (EMT), angiogenesis, and coagulation. In colon cancer, EMT is involved in immune regulation within the TME (Shan et al., 2021). Transcription factors related to EMT can modulate chemokines, attracting immunosuppressive cells, increasing the expression of immunosuppressive checkpoint molecules, and ultimately fostering a tumor-immunosuppressive microenvironment (Taki et al., 2021). The enrichment analysis of the low-risk group revealed pathways associated with favorable clinical outcomes, such as ROS, E2F targets, and DNA repair pathways. ROS pathways are integral to metformin-induced antitumor immunity, where mitochondrial ROS stimulate glycolysis and activate NFE2-related factor 2 (Nrf2), establishing a positive feedback loop that enhances Nrf2 activity and promotes CD8+ T lymphocyte proliferation, thereby improving therapeutic efficacy (Nishida et al., 2021). Additionally, DNA damage repair mechanisms have been linked to the effectiveness of anti-PD-1 therapy in gastric cancer, underscoring the role of DNA repair in optimizing immunotherapy responses (Lou et al., 2022). Enrichment in these pathways suggests their protective role in enhancing immune responses and inhibiting cancer progression.
The ssGSEA analysis revealed higher immune scores in the low-risk group compared to the high-risk group, indicating superior immune functionality. Specifically, the low-risk group exhibited higher infiltration of CD8+ T cells, cytolytic activity, inflammatory markers, and pDCs, all of which correlate with better prognosis. For instance, CD8+ T cell density is associated with improved survival outcomes in HNSCC (Zhang et al., 2022). Moreover, TIDE scores, predictive of immune checkpoint blockade (ICB) response, were higher in the high-risk group, indicating poorer outcomes for these patients with respect to ICB therapies (Jiang et al., 2018).
In another study on the prognostic model of laryngeal cancer biomarkers, no external independent dataset was used for validation and there was a lack of evidence to validate the model at the molecular level, resulting in relatively weak support for the generalization ability validation and biological mechanism validation of the biomarker model (Kawano et al., 2024). Our study further validated the gene expression of the model in clinical samples through RT-qPCR and IHC, providing experimental evidence for the accuracy of the model and enhancing its credibility and precision.
In our study, TIDE scores were higher in the high-risk group, indicating a poor response to ICBs in the high-risk group. The low-risk group had a higher CD8 score, and higher CD8 scores were often associated with a better prognosis (Oshi et al., 2020). Correlation analysis showed that TIDE score and exclusion score were positively correlated with risk score, which was consistent with our above results, indicating that our analysis results were reliable. Lastly, the high expression of CD274 in the low-risk group indicates that patients in the low-risk group will have better immunotherapy efficacy.
The gene expression of the clinical samples was consistent with the results of our analysis, which further confirmed our research. In another study about head and neck squamous cell carcinoma, the results showed that high expression of OLR1 was associated with higher clinical staging and poorer prognosis, which was consistent with our analysis results (Zhang et al., 2023c).
Although our study provides new insights into the prognosis of LC and TME, the relatively small sample size may affect the accuracy and reliability of the research results. The current research still cannot determine the upstream mechanism of upregulation of OLR1 and RENBP. In addition, although the model has shown some effectiveness in predicting prognosis, other factors such as individual differences in patients and treatment plans still need to be comprehensively considered in practical clinical applications.
In the future, it is necessary to expand the sample size to further validate the effectiveness of the model. In the future, we will further investigate the upstream regulatory network upregulated by RENBP and OLR1, using signaling pathway inhibitors or activators to explore the effects of specific signaling pathways on the expression of OLR1 and RENBP. This will deepen our understanding of LC patients and improve the diagnosis and treatment of LC patients.
Conclusion
The aim of this study was to explore the prognostic value and immunotherapy significance of immune cell related genes in laryngeal cancer (LC). Through comprehensive bioinformatics analysis using data from TCGA and GEO databases, we identified 124 key genes and constructed a risk model based on two prognostic biomarkers, RENBP and OLR1. In both the training and validation sets, the risk model performed well in predicting patient survival rates. The functional enrichment analysis of the high- and low-risk groups revealed different biological pathways and processes. In addition, we studied immune infiltration and its correlation with risk models, and found differences in the proportion of immune cells and TIDE scores between the two risk groups. The expression level of CD274 (PD-L1) was significantly higher in the low-risk group. This study provided new ideas and methods for the research of LC, and it will be of great significance for the development of immune regulated therapeutic drugs.