
Phylogenetic species delimitation for crayfishes of the genus Pacifastacus
- Published
- Accepted
- Received
- Academic Editor
- Keith Crandall
- Subject Areas
- Aquaculture, Fisheries and Fish Science, Biodiversity, Conservation Biology, Marine Biology, Taxonomy
- Keywords
- Hobbsastacus, Pacifastacus fortis, Pacific Northwest, Pacifastacus leniusculus, Signal crayfish, Invasive species, Poisson Tree Processes, Cryptic species, Species delimitation
- Copyright
- © 2016 Larson et al.
- Licence
- This is an open access article distributed under the terms of the Creative Commons Attribution License, which permits unrestricted use, distribution, reproduction and adaptation in any medium and for any purpose provided that it is properly attributed. For attribution, the original author(s), title, publication source (PeerJ) and either DOI or URL of the article must be cited.
- Cite this article
- 2016. Phylogenetic species delimitation for crayfishes of the genus Pacifastacus. PeerJ 4:e1915 https://doi.org/10.7717/peerj.1915
Abstract
Molecular genetic approaches are playing an increasing role in conservation science by identifying biodiversity that may not be evident by morphology-based taxonomy and systematics. So-called cryptic species are particularly prevalent in freshwater environments, where isolation of dispersal-limited species, such as crayfishes, within dendritic river networks often gives rise to high intra- and inter-specific genetic divergence. We apply here a multi-gene molecular approach to investigate relationships among extant species of the crayfish genus Pacifastacus, representing the first comprehensive phylogenetic study of this taxonomic group. Importantly, Pacifastacus includes both the widely invasive signal crayfish Pacifastacus leniusculus, as well as several species of conservation concern like the Shasta crayfish Pacifastacus fortis. Our analysis used 83 individuals sampled across the four extant Pacifastacus species (omitting the extinct Pacifastacus nigrescens), representing the known taxonomic diversity and geographic distributions within this genus as comprehensively as possible. We reconstructed phylogenetic trees from mitochondrial (16S, COI) and nuclear genes (GAPDH), both separately and using a combined or concatenated dataset, and performed several species delimitation analyses (PTP, ABGD, GMYC) on the COI phylogeny to propose Primary Species Hypotheses (PSHs) within the genus. All phylogenies recovered the genus Pacifastacus as monophyletic, within which we identified a range of six to 21 PSHs; more abundant PSHs delimitations from GMYC and ABGD were always nested within PSHs delimited by the more conservative PTP method. Pacifastacus leniusculus included the majority of PSHs and was not monophyletic relative to the other Pacifastacus species considered. Several of these highly distinct P. leniusculus PSHs likely require urgent conservation attention. Our results identify research needs and conservation priorities for Pacifastacus crayfishes in western North America, and may inform better understanding and management of P. leniusculus in regions where it is invasive, such as Europe and Japan.
Introduction
The conservation and management of freshwater biodiversity is dependent on recognizing this biodiversity across levels of the ecological hierarchy, from genes to ecosystems (Geist, 2011; Mace, Norris & Fitter, 2012). Molecular, and increasingly genomic, approaches have emerged over recent decades as invaluable for identifying biodiversity of conservation value that may not always be evident by traditional morphology-based taxonomy and systematics (Bickford et al., 2007). Whether identifying cryptic species (e.g., Witt, Threloff & Hebert, 2006) or evolutionary significant units (ESUs) within species (Waples, 1991), molecular approaches are now considered foundational to the field of conservation science. Although molecular approaches should not replace or marginalize traditional taxonomy and systematics, these methods do offer considerable power to clarify cases where convergent evolution (e.g., Breinholt, Porter & Crandall, 2012) or complex evolutionary histories (e.g., Niemiller, Fitzpatrick & Miller, 2008) obscure our understanding of biodiversity and consequently impair its conservation.
Freshwater crayfish are an important taxonomic group in the world’s streams, rivers, lakes, and wetlands (Crandall & Buhay, 2008). Crayfish are polytrophic, generalist consumers that can achieve high population densities and function as strong interactors in food webs (Momot, 1995). Further, crayfish are among the most imperiled freshwater taxa globally (Richman et al., 2015), while also producing some of the planet’s most harmful freshwater invasive species (Gherardi, 2007). Endemic to western North America, the crayfish genus Pacifastacus (Astacidae) represents a microcosm of issues in crayfish conservation and management globally (Larson & Olden, 2011). Of five modern Pacifastacus species, one has been declared extinct (Pacifastacus nigrescens), a second is listed as endangered under the United States Endangered Species Act (ESA; Pacifastacus fortis), two are effectively unstudied (Pacifastacus connectens and Pacifastacus gambelii), and the last is a widespread invasive species with well-documented impacts on both freshwater biodiversity and ecosystem structure and function (Pacifastacus leniusculus; Lodge et al., 2000; Harvey et al., 2011).
Related to these conservation and management concerns, the genus Pacifastacus also suffers from a complicated taxonomic history. The endangered P. fortis was split out of the now extinct P. nigrescens, first as a subspecies and subsequently as a species. Similarly, P. connectens was split from P. gambelii as a subspecies and then species. Conversely, P. leniusculus was initially described as three separate species that were subsequently demoted to subspecies, which now are largely ignored by most researchers and managers (reviewed in Larson & Williams, 2015). Most recently, Bouchard (1977b) recommended that P. connectens, P. fortis, and P. gambelii be recognized as the subgenus Hobbsastacus on the basis of similar mandible morphology (blade-like mandibles) relative to P. leniusculus (tooth-like mandibles), among other traits. Molecular genetic approaches offer great potential in resolving many of these ambiguities with respect to the taxonomy and phylogenetic relationships of Pacifastacus crayfishes, which in turn can direct future management and study.
We apply here a multi-gene molecular approach to investigate relationships among extant species of the genus Pacifastacus. In addition, we use several molecular-based species delimitation methods to gain insight into species designations independent of potentially confounding morphological characters historically used for Pacifastacus taxonomy. This work is motivated in part by a previous study that used a single gene to identify morphologically-cryptic diversity within crayfishes historically recognized as P. leniusculus (Larson et al., 2012). We significantly expand the scope of Larson et al. (2012) by increasing both taxonomic breadth and gene inclusion. Notably, this represents the first dedicated, comprehensive phylogenetic study of the crayfish genus Pacifastacus. These results should be of high interest both to researchers concerned with the conservation of imperiled Pacifastacus crayfishes in western North America (e.g., Light et al., 1995), as well as for those interested in better understanding and managing populations of P. leniusculus where invasive (e.g., Lodge et al., 2000).
Materials and Methods
Sampling and data collection
Our ingroup sampling included a total of 83 specimens representing the four extant Pacifastacus species. Unfortunately, we were unable to obtain tissue from the presumed extinct Pacifastacus nigrescens (i.e., Bouchard, 1977a). We incorporated 40 P. leniusculus samples (i.e., both DNA and published sequence data) from Larson et al. (2012) to: (a) represent the geographic breadth of the native range of this nominal species (i.e., P. leniusculus sensu lato), omitting samples from geographic areas of western North America where the species is known or suspected to have been introduced; and (b) maximize representation of the genetic variation previously observed using the 16S rDNA gene (Larson et al., 2012). We added 43 new Pacifastacus specimens: 11 individuals of P. connectens from three sites; six individuals of P. fortis from three sites; eight individuals of P. gambelii from two sites; and 18 additional individuals of P. leniusculus sensu lato from eight sites.
The majority (N = 31) of new specimens were collected in 2011 and 2012 by E.R. Larson and B.W. Williams, with additional individuals collected in 2012 by L. Beck of the Malheur National Wildlife Refuge (five P. connectens and one P. leniusculus) and in 2005 by M. Ellis of Spring River Ecological Sciences (all P. fortis specimens under US permit TE806679-3 and California permit 801319-02). New collections sought to fill in sampling gaps of Larson et al. (2012) within the range of P. leniusculus sensu lato, and to represent the known distributions of the Hobbsastacus crayfishes P. connectens, P. fortis, and P. gambelii as comprehensively as possible. For example, P. connectens was collected from both the endorheic (closed) Harney Basin as well as the Pacific-draining (via Columbia River) Snake River drainage, and P. gambelii was collected from both the endorheic Bonneville Basin and the Snake River drainage (Larson & Williams, 2015). Pacifastacus fortis specimens were chosen from a subset of sampled locations representing each of three genetic clusters identified through previous analysis of nine microsatellite loci (Petersen & May, 2008).
We chose five outgroup taxa to represent major lineages within the Holarctic-distributed crayfish superfamily Astacoidea based on relationships to Pacifastacus from recent crayfish phylogenies (Bracken-Grissom et al., 2014; Owen et al., 2015) and availability of publicly accessible data for the focal genes used in the current study. We included the Astacidae species Astacus astacus and Austropotamobius torrentium and the Cambaridae species Cambaroides similis, Cambarus hamulatus and Orconectes virilis (Table 1). An additional O. virilis specimen collected by B.W. Williams was also used, following laboratory procedures outlined below.
| Species | COI | 16S | GAPDH |
|---|---|---|---|
| Astacus astacus | AY6671461, GU727619* | AF2359837 | |
| Austropotamobius torrentium | AM1809462 | AM1813462 | |
| Cambaroides similis | NC0169253 | NC0169253 | |
| Cambarus hamulatus | DQ4117614 | DQ4117394 | DQ4117864 |
| Orconectes virilis | EU4427295, KU6035416 | EU4426725, KU6035696 | EU5962695, KU6036066 |
DNA extraction, PCR amplification and DNA sequencing
We extracted total DNA from abdominal muscle or gill tissue using the standard protocol for the Qiagen DNeasy Blood and Tissue kit (Qiagen, Valencia, CA, USA). DNA was diluted 1:10 in ddH2O prior to PCR amplification. We amplified fragments of two mitochondrial genes, 16S rDNA and COI, and one nuclear locus, glyceraldehyde-3-phosphate dehydrogenase (GAPDH) using the primer pairs 16Sar-L and 16Sbr-H (Imai et al., 2004), LCOI1490 and HCO2198 (Folmer et al., 1994), and G3PCq157F and G3PCq981R (Buhay et al., 2007; Mathews et al., 2008), respectively. Amplification of COI and GAPDH products were generated by an initial denaturation step of 5 min at 95 °C followed by 35 cycles of denaturation at 95 °C for 45 s (60 s for GAPDH), annealing at 50 °C for 45 s (60 s for GAPDH) and extension at 72 °C for 2 min, with an additional final extension of 72 °C for 10 min (5 min for GAPDH). Amplification of 16S products were generated by an initial denaturation step of 3 min at 98 °C followed by 12 ‘touchdown’ cycles of denaturation at 98 °C, annealing at 50–65 °C for 30 s (with temperature decreasing by 5 °C every 3 cycles), and extension at 72 °C for 30 s, and then 30 amplification cycles with denaturation step at 98 °C for 30 s, annealing at 48 °C for 30 s, and extension at 72 °C for 30 s, and an additional final extension of 72 °C for 2 min. PCR products were purified using ExoSAP-IT (Affymetrix/USB) and sequenced bi-directionally using the above PCR primers and BigDye Terminator v 3.1 (Thermofisher). These reactions were then purified using DyeEx 2.0 Spin Kits (Qiagen) and run on a 3130xl genetic analyzer (Applied Biosystems).
Sequences were aligned using the FFT-NS-I strategy in MAFFT v. 7 (Katoh et al., 2002; Katoh & Toh, 2010; http://mafft.cbrc.jp/alignment/server/). We used BioEdit version 7.2.5 (Hall, 1999) to check for poorly aligned sites, and MEGA v 4.0 (Tamura et al., 2007) to translate protein-coding sequences (i.e., COI and GAPDH) to screen for premature stop codons. We calculated number of haplotypes/genotypes, number of polymorphic sites, and number of parsimony informative sites for each gene alignment using MEGA and DnaSP v. 5.10.01 (Librado & Rozas, 2009). All new sequences were deposited in GenBank (Accession numbers: KU603429–KU603606).
Phylogenetic analyses
Using the Bayesian Information Criterion in jModelTest 2.1.6 (Darriba et al., 2012), the suggested best-fit models of nucleotide evolution were HKI+G+I for COI and 16S genes, and TIM2ef+G for GAPDH. Three independent single-gene phylogenies were constructed using COI, 16S and GAPDH genes, excluding any redundant sequences between specimens. After checking for congruency among the tree topologies derived from the single-gene phylogenies, we conducted a fourth analysis based on concatenated sequences from a minimum of two out of the three genes analyzed. We used concatenation because this approach can outperform species tree methods when few loci are used and gene trees have low phylogenetic signal (Bayzid & Warnow, 2013; Mirarab, Bayzid & Warnow, 2014). All phylogenetic trees were built using both Maximum likelihood (ML) and Bayesian approaches (BA). First and second codon and third codon positions were used as two different partitions in COI and GAPDH analyses, whereas the noncoding 16S gene was considered a single partition. In the concatenated analysis, mutation rates were partitioned among genes, and the partitions among codon positions (first and second codon and third codon positions) were conserved for the different coding regions.
Best-scoring ML trees were estimated for each dataset using RAxML HPC2 v.8.2.4 (Stamatakis, 2006) on Teragrid v.7.2.7, implemented in the Cyber Infrastructure for phylogenetic Research (CIPRES) portal v.3.1. (Miller, Pfeiffer & Schwartz, 2010; https://www.phylo.org/). One hundred independent searches, each starting from distinct random trees, were conducted. Robustness of the nodes was assessed using nonparametric bootstrapping (Felsenstein, 1985) with 1,000 bootstrap replicates. Bayesian trees were calculated using the uncorrelated lognormal relaxed-clock model implemented in BEAST 1.8.2 with an input file generated in BEAUti version 1.8.0 (Drummond et al., 2012). When an optimal model of nucleotide evolution was not available in BEAUti 1.8.0 we selected a similar but more complex near-optimal model (Huelsenbeck & Rannala, 2004). The Yule process of speciation, which assumes a constant speciation rate among lineages, was applied as a tree prior. Each analysis ran for 100,000,000 generations with sample frequency of 1,000. The final trees were calculated based on 99,000 trees (after a burn-in of 1,000 generations) with maximum clade credibility and median node heights. Length of burn-in was determined by examination of traces in Tracer 1.5 (Rambaut & Drummond, 2009). Support for nodes was determined using posterior probabilities (PP; calculated by BEAST). In addition, a time-calibrated ultrametric tree based on the COI gene was produced using BEAST for GMYC analyses (described below). A coalescent model of constant population size was used as a tree prior and the heterogeneity of the mutation rate across lineages was set under an uncorrelated lognormal clock. The mutation rate was set to one to get branch lengths in units of substitution per site. Two independent analyses, starting from distinct coalescent trees, were run over 100,000,000 generations and sampled each 1,000 steps. After checking adequate mixing and convergence of all runs with Tracer, 10,000,000 samples were discarded as a burn-in, the two runs were pooled together and re-sampled each 20,000 steps. The maximum clade credibility tree was extracted from these results of pooled analyses using TreeAnnotator (default parameters).
Species delimitation
Consensus support across multiple species delimitation approaches is generally preferable to reliance on a single method (Carstens et al., 2013; Fontaneto, Flot & Tang, 2015). Accordingly, we conducted species delimitation analyses using three methods: (i) the Poisson Tree Processes (PTP) method of Zhang et al. (2013); (ii) the General Mixed Yule Coalescent (GMYC, single threshold algorithm) method of Pons et al. (2006), and; (iii) the Automatic Barcode Gap Discovery (ABGD) method of Puillandre et al. (2012). We applied these methods only to the codon-partitioned COI dataset to remain consistent with a reliance on this gene fragment to identify Primary Species Hypotheses (PSHs) in animals (i.e. “DNA barcoding”; Hebert, Ratnasingham & DeWaard, 2003). Unlike ABGD that uses detection of the ‘barcode gap’ in the distribution of genetic pairwise distances, GMYC and PTP use a phylogenetic input tree from which the fit of speciation and coalescent processes are modeled to delineate PSHs (Tang et al., 2014). The ABGD method was implemented based on all available COI sequences and using the online version of the program (http://wwwabi.snv.jussieu.fr/public/abgd/) with default parameter, except that we set the relative gap width (X) to 10 to avoid the capture of smaller local gaps. The GMYC method was implemented using the time-calibrated ultrametric tree based on COI gene produced earlier using BEAST, and was run from the Exelixis Lab web server (http://species.h-its.org/gmyc/). The PTP method was implemented using the best-scoring ML tree based on COI gene produced earlier using RAxML HPC2 v.8.2.4, and was run in Python using the Environment for Tree Exploration package (Huerta-Cepas, Dopazo & Gabaldón, 2010).
Results
Sampling, alignment, and phylogenetic analyses
From the total 93 individuals used (including outgroups), we obtained COI sequences for 79 specimens (639 bp unambiguous alignment), 16S rDNA for 86 specimens (446 bp aligned, including gaps), and GAPDH for 69 specimens. We trimmed the GAPDH sequences to a final unambiguous alignment of 581 bp, representing the gene region for which we recovered fully overlapping forward and reverse sequences. For the COI gene fragment, the ingroup included 33 haplotypes displaying 149 polymorphic sites, of which 121 were parsimony informative. For the 16S gene fragment, the ingroup included 25 haplotypes displaying 42 polymorphic sites, of which 40 were parsimony informative. For GAPDH, the ingroup included 33 different genotypes displaying 20 polymorphic sites, of which 18 were parsimony informative. Phylogenetic tree topologies were congruent between Bayesian and maximum likelihood analyses. The genus Pacifastacus was monophyletic in the concatenated tree (Fig. 1; posterior probability value, PP = 100, bootstrap value, BS = 83) and each of the single gene analyses (Appendix S1; COI: PP = 99, BS < 50; 16S rDNA: PP = 100, BS = 65; GAPDH: PP = 76, BS = 100). Several moderately- to well-supported subclades were recovered within Pacifastacus, only in part reflecting morphotaxa. Pacifastacus leniusculus sensu lato was paraphyletic relative to a monophyletic Hobbsastacus subgenus, and the Hobbsastacus species P. connectens was not monophyletic in any tree.
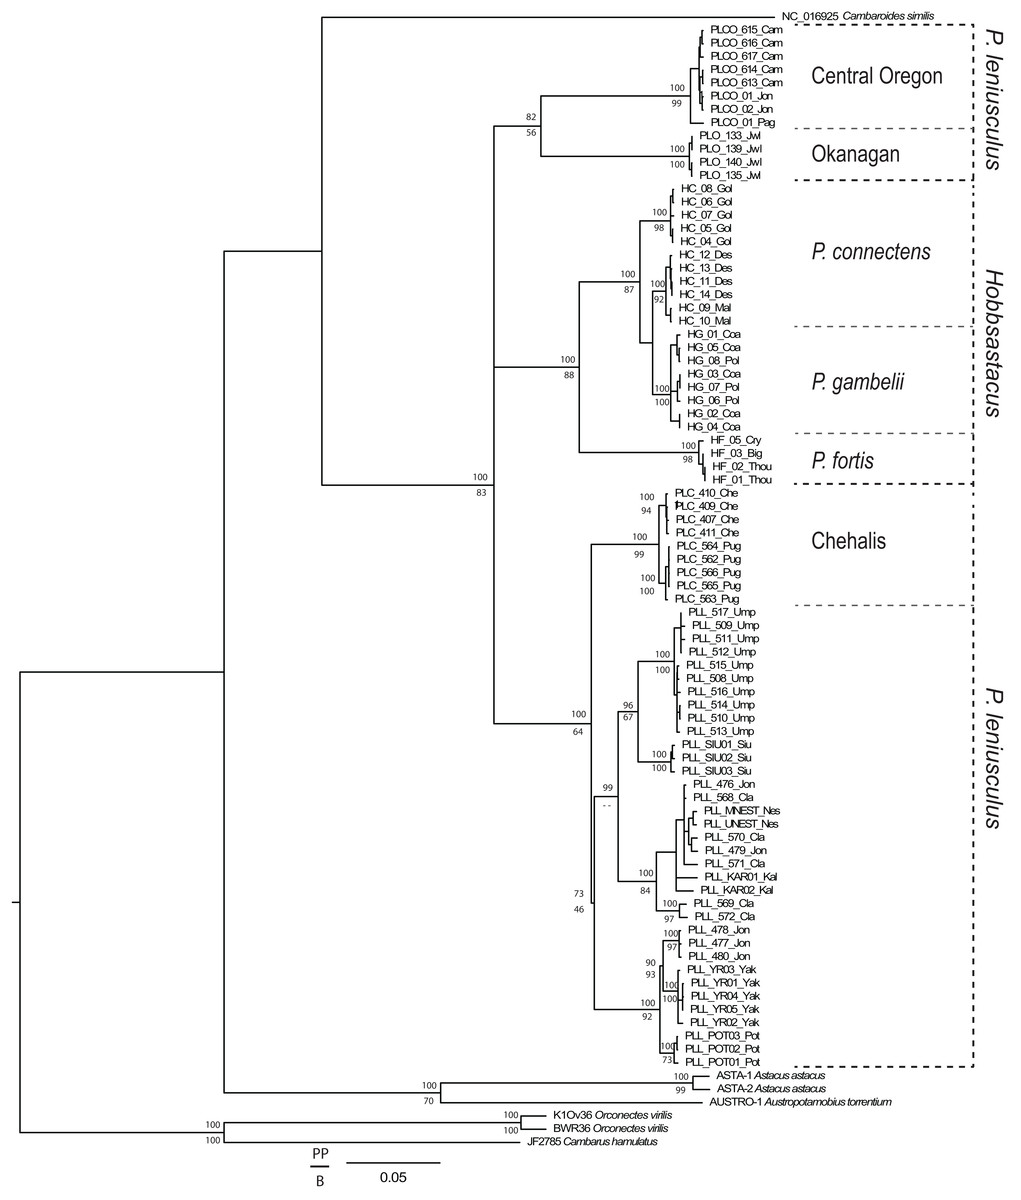
Figure 1: Combined gene phylogenetic tree for Pacifastacus.
Combined gene (COI, 16S, GAPDH) Bayesian phylogenetic tree for Pacifastacus crayfishes, including species identities and cryptic groups (Central Oregon, Chehalis, Okanagan) proposed by Larson et al. (2012). We provide both Bayesian (posterior probability, PP; top) and maximum likelihood (bootstrap, B; bottom) support values for each node.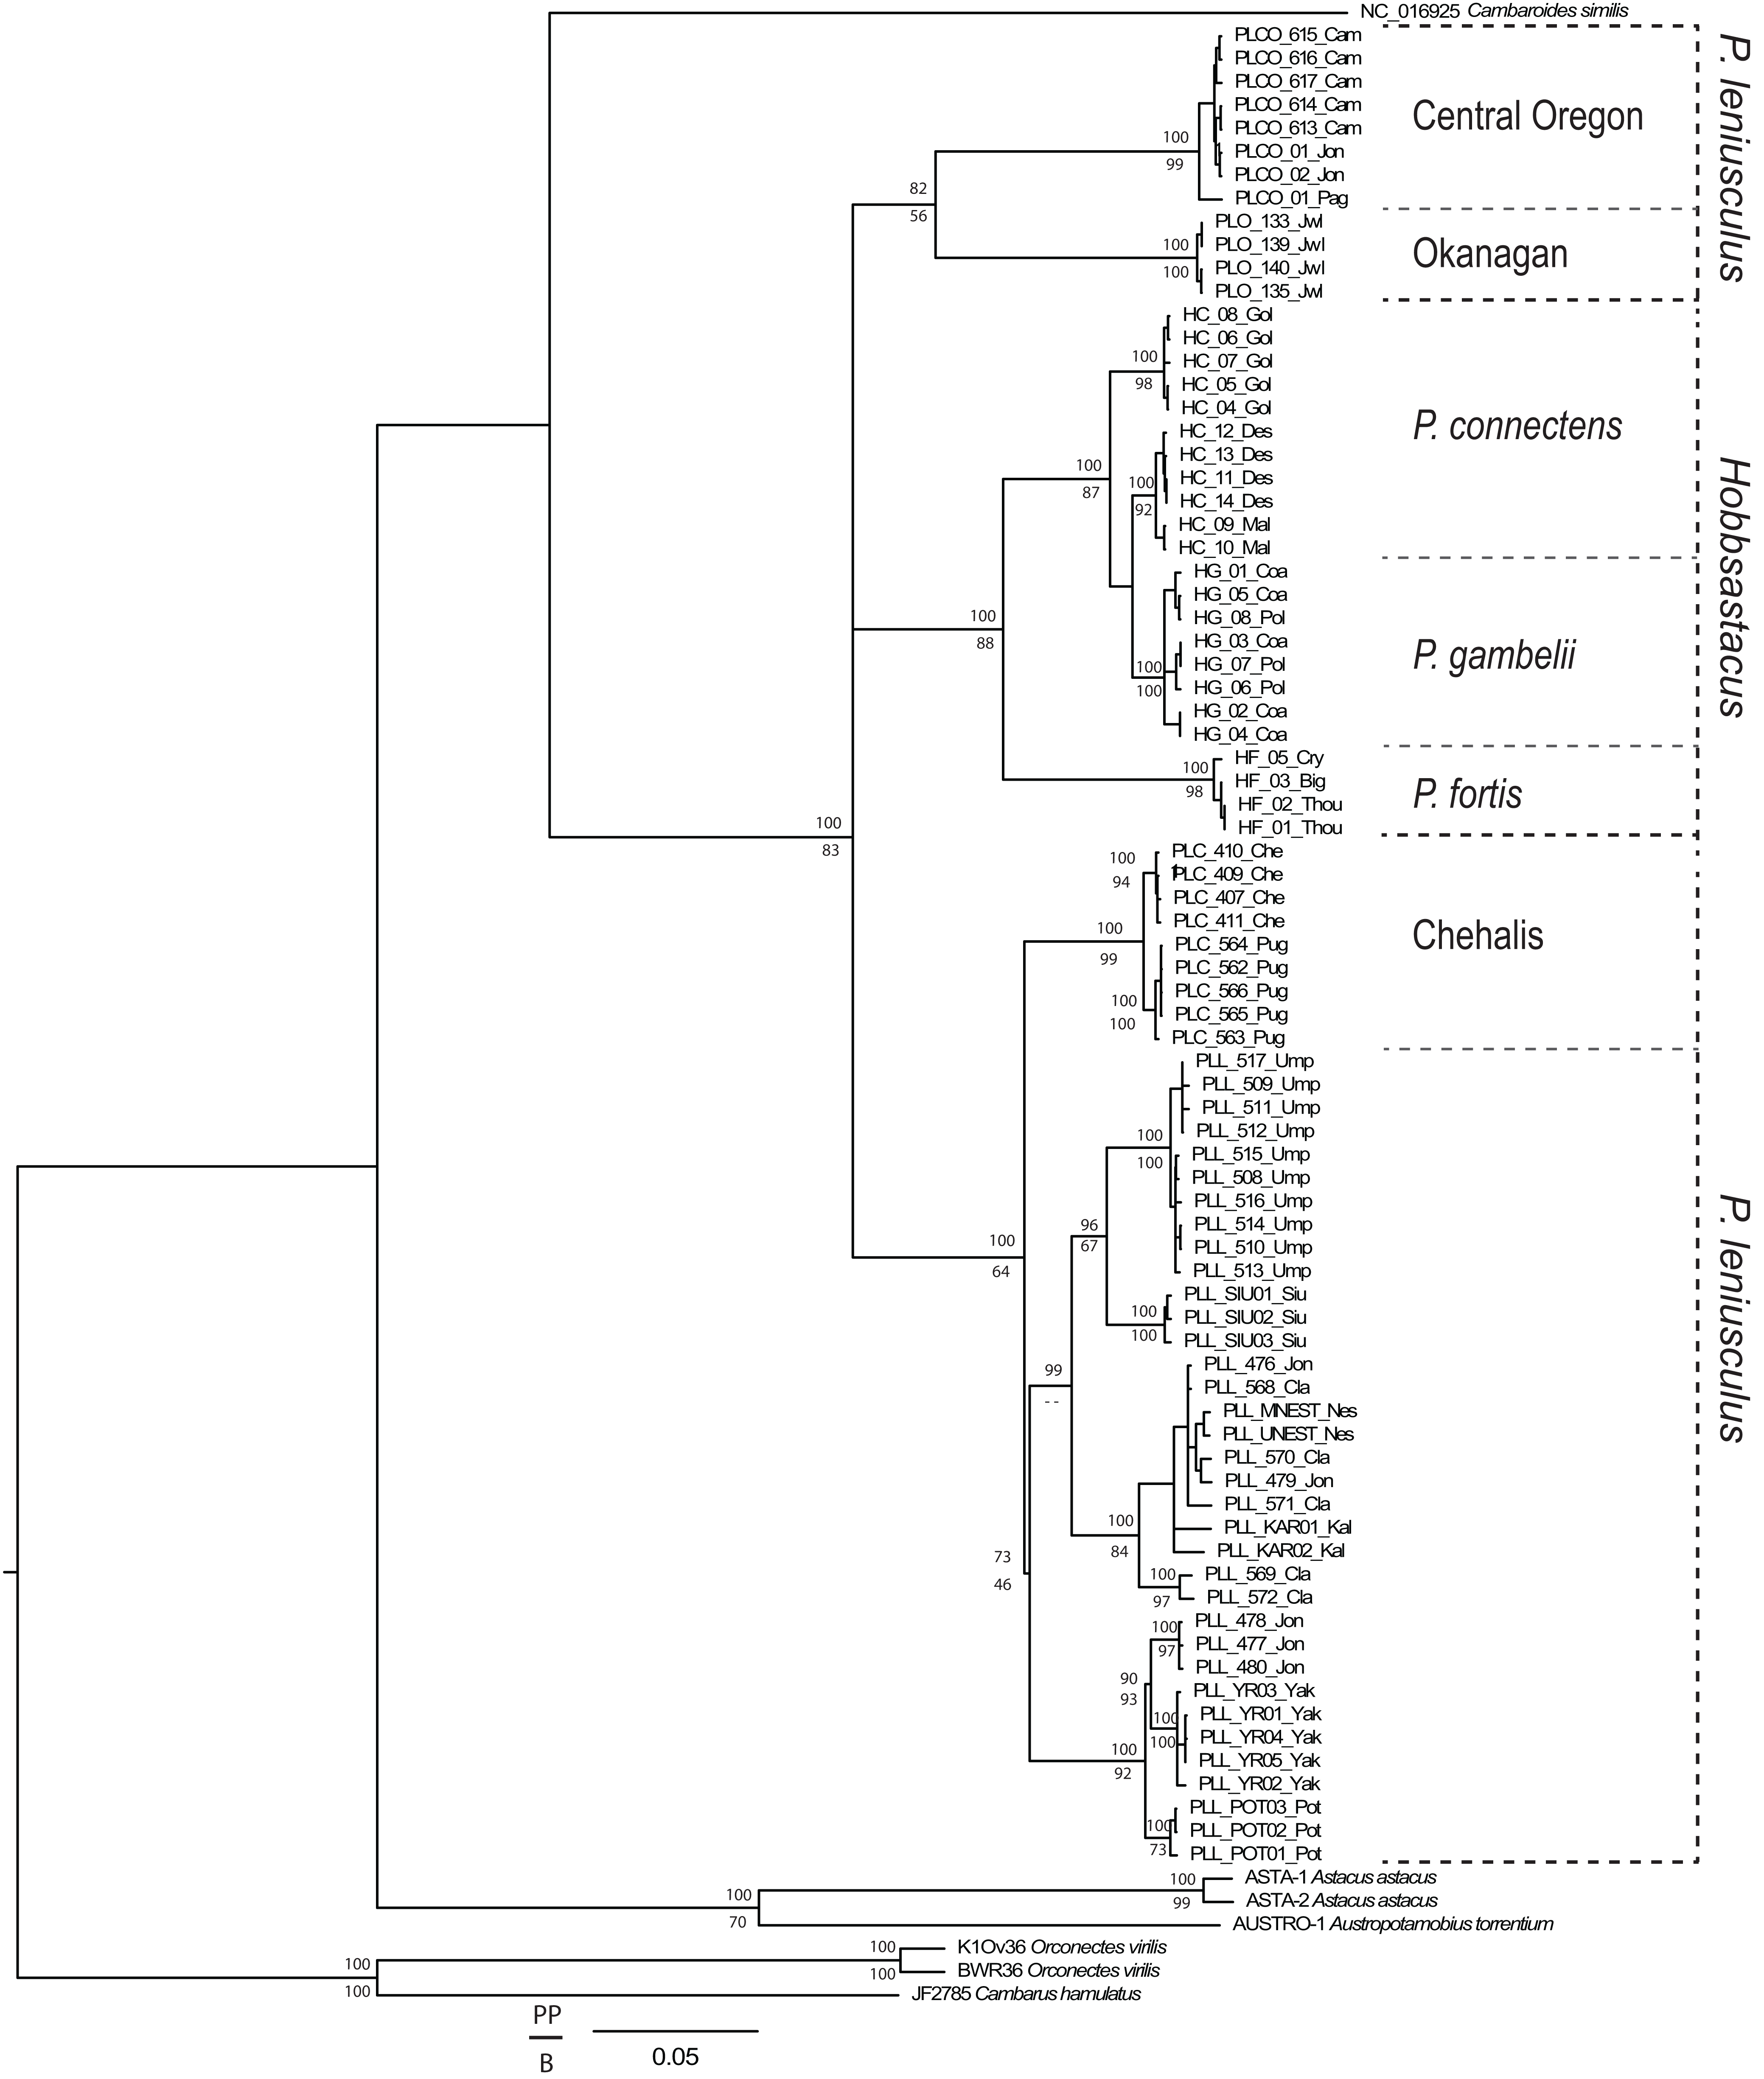
Species delimitation and taxonomic interpretation
The likelihood of the null model in the PTP analysis (i.e., that all sequences belong to a single species) was found to be significantly lower than the maximum likelihood species delimitation (178 versus 226, P < 0.001). The PTP analysis resulted in the delimitation of six ingroup PSHs, hereafter denoted PSH-A–PSH-F (Fig. 2). Pacifastacus leniusculus sensu lato was delimited as three PSHs (A–C; Fig. 2). Two of the three P. leniusculus cryptic groups (Central Oregon, PSH-A; Okanagan, PSH-B) identified by Larson et al. (2012) delimited as PSHs, whereas the third did not (Chehalis). We do not map the three P. leniusculus subspecies names or morphologies to PSHs because morphological traits associated with subspecies are not conserved among phylogenetic lineages (Larson et al., 2012). All Hobbsastacus species delimited as separate species by PTP (P. connectens, PSH-D; P. fortis, PSH-F; P. gambelii, PSH-E). Sample locations with species names, cryptic group designations, and both PTP- and ABGD-delimited PSHs labels are given in Fig. 3. The GMYC method resulted in recovery of 21 PSHs within Pacifastacus, including 17 clusters and four entities (i.e., a single sequence representing a group). Delineations among these 21 groups did not conflict with PTP-delimited PSHs; however, additional phylogenetic species were suggested within PTP-delimited PSHs for both P. leniusculus sensu lato and the Hobbsastacus species P. connectens (Fig. 2). Similarly, we estimated six a priori thresholds using ABGD, resulting in six partitions with 13, 14, 14, 15, 17 and 18 PSHs. Like GMYC, ABGD results were not inconsistent with the six PSHs identified by PTP, with further splitting into additional phylogenetic species, particularly within P. leniusculus senso lato. Results of only the intermediate 15 PSHs partition of ABGD are given in Figs. 2 and 3.
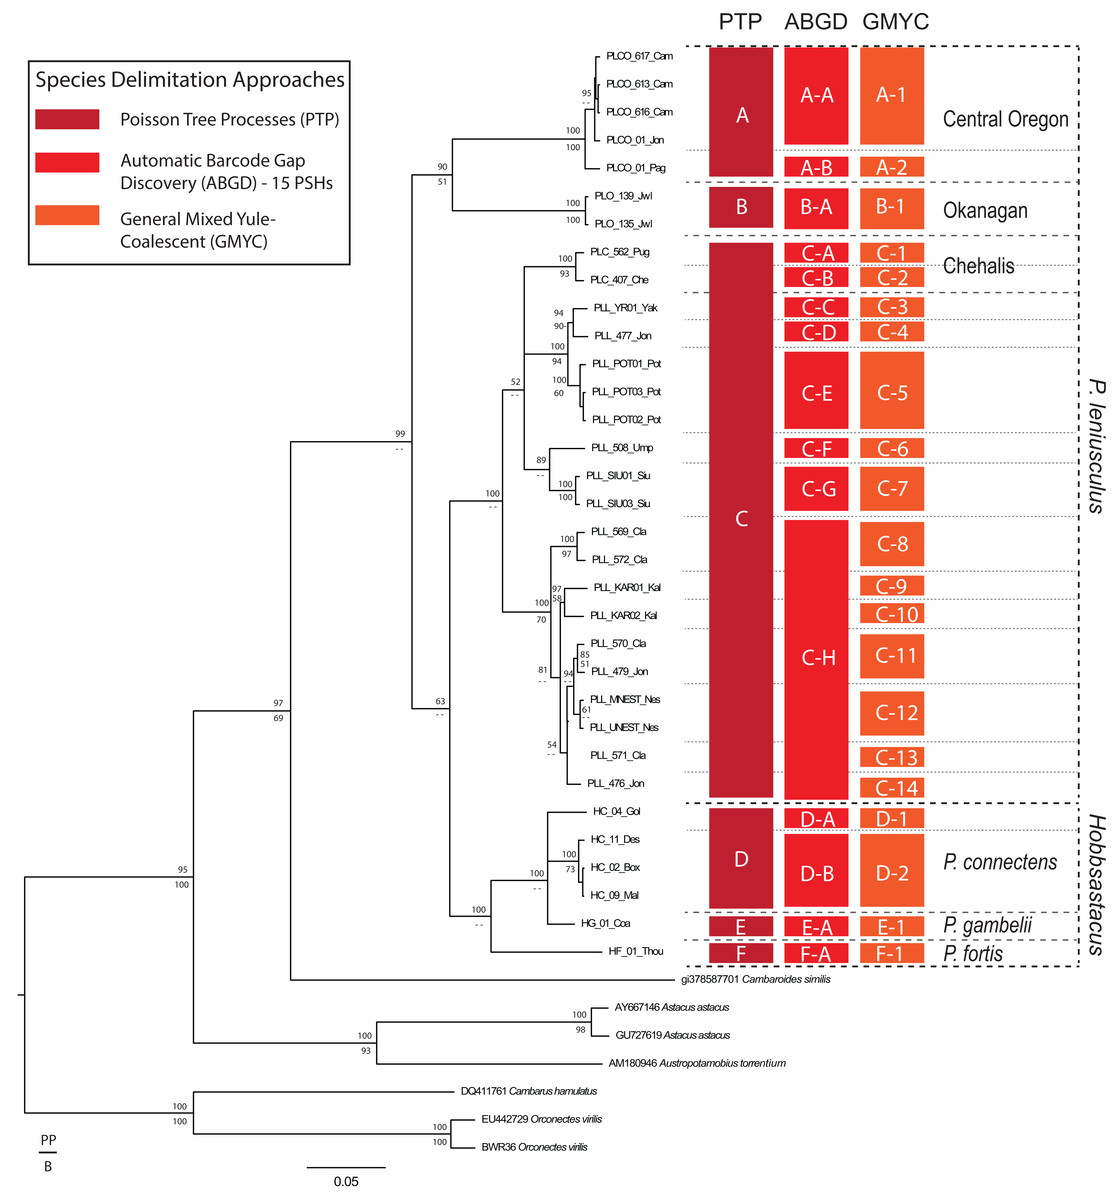
Figure 2: Species delimitation analyses on COI gene.
Results of species delimitation analyses on the COI gene fragment using Poisson Tree Processes (PTP; Zhang et al., 2013), Automatic Barcode Gap Discovery (ABGD; Puillandre et al., 2012), and General Mixed Yule Coalescent (GMYC; Pons et al., 2006). Only the 15 Primary Species Hypothesis (PSH) partition of ABGD is reported for clarity. PSHs are labeled with letters and numbers; species of Pacifastacus crayfishes are also labeled, along with cryptic groups (Central Oregon, Chehalis, Okanagan) proposed by Larson et al. (2012). We provide both Bayesian (posterior probability, PP; top) and maximum likelihood (bootstrap, B; bottom) support values for each node on this Bayesian phylogenetic COI tree.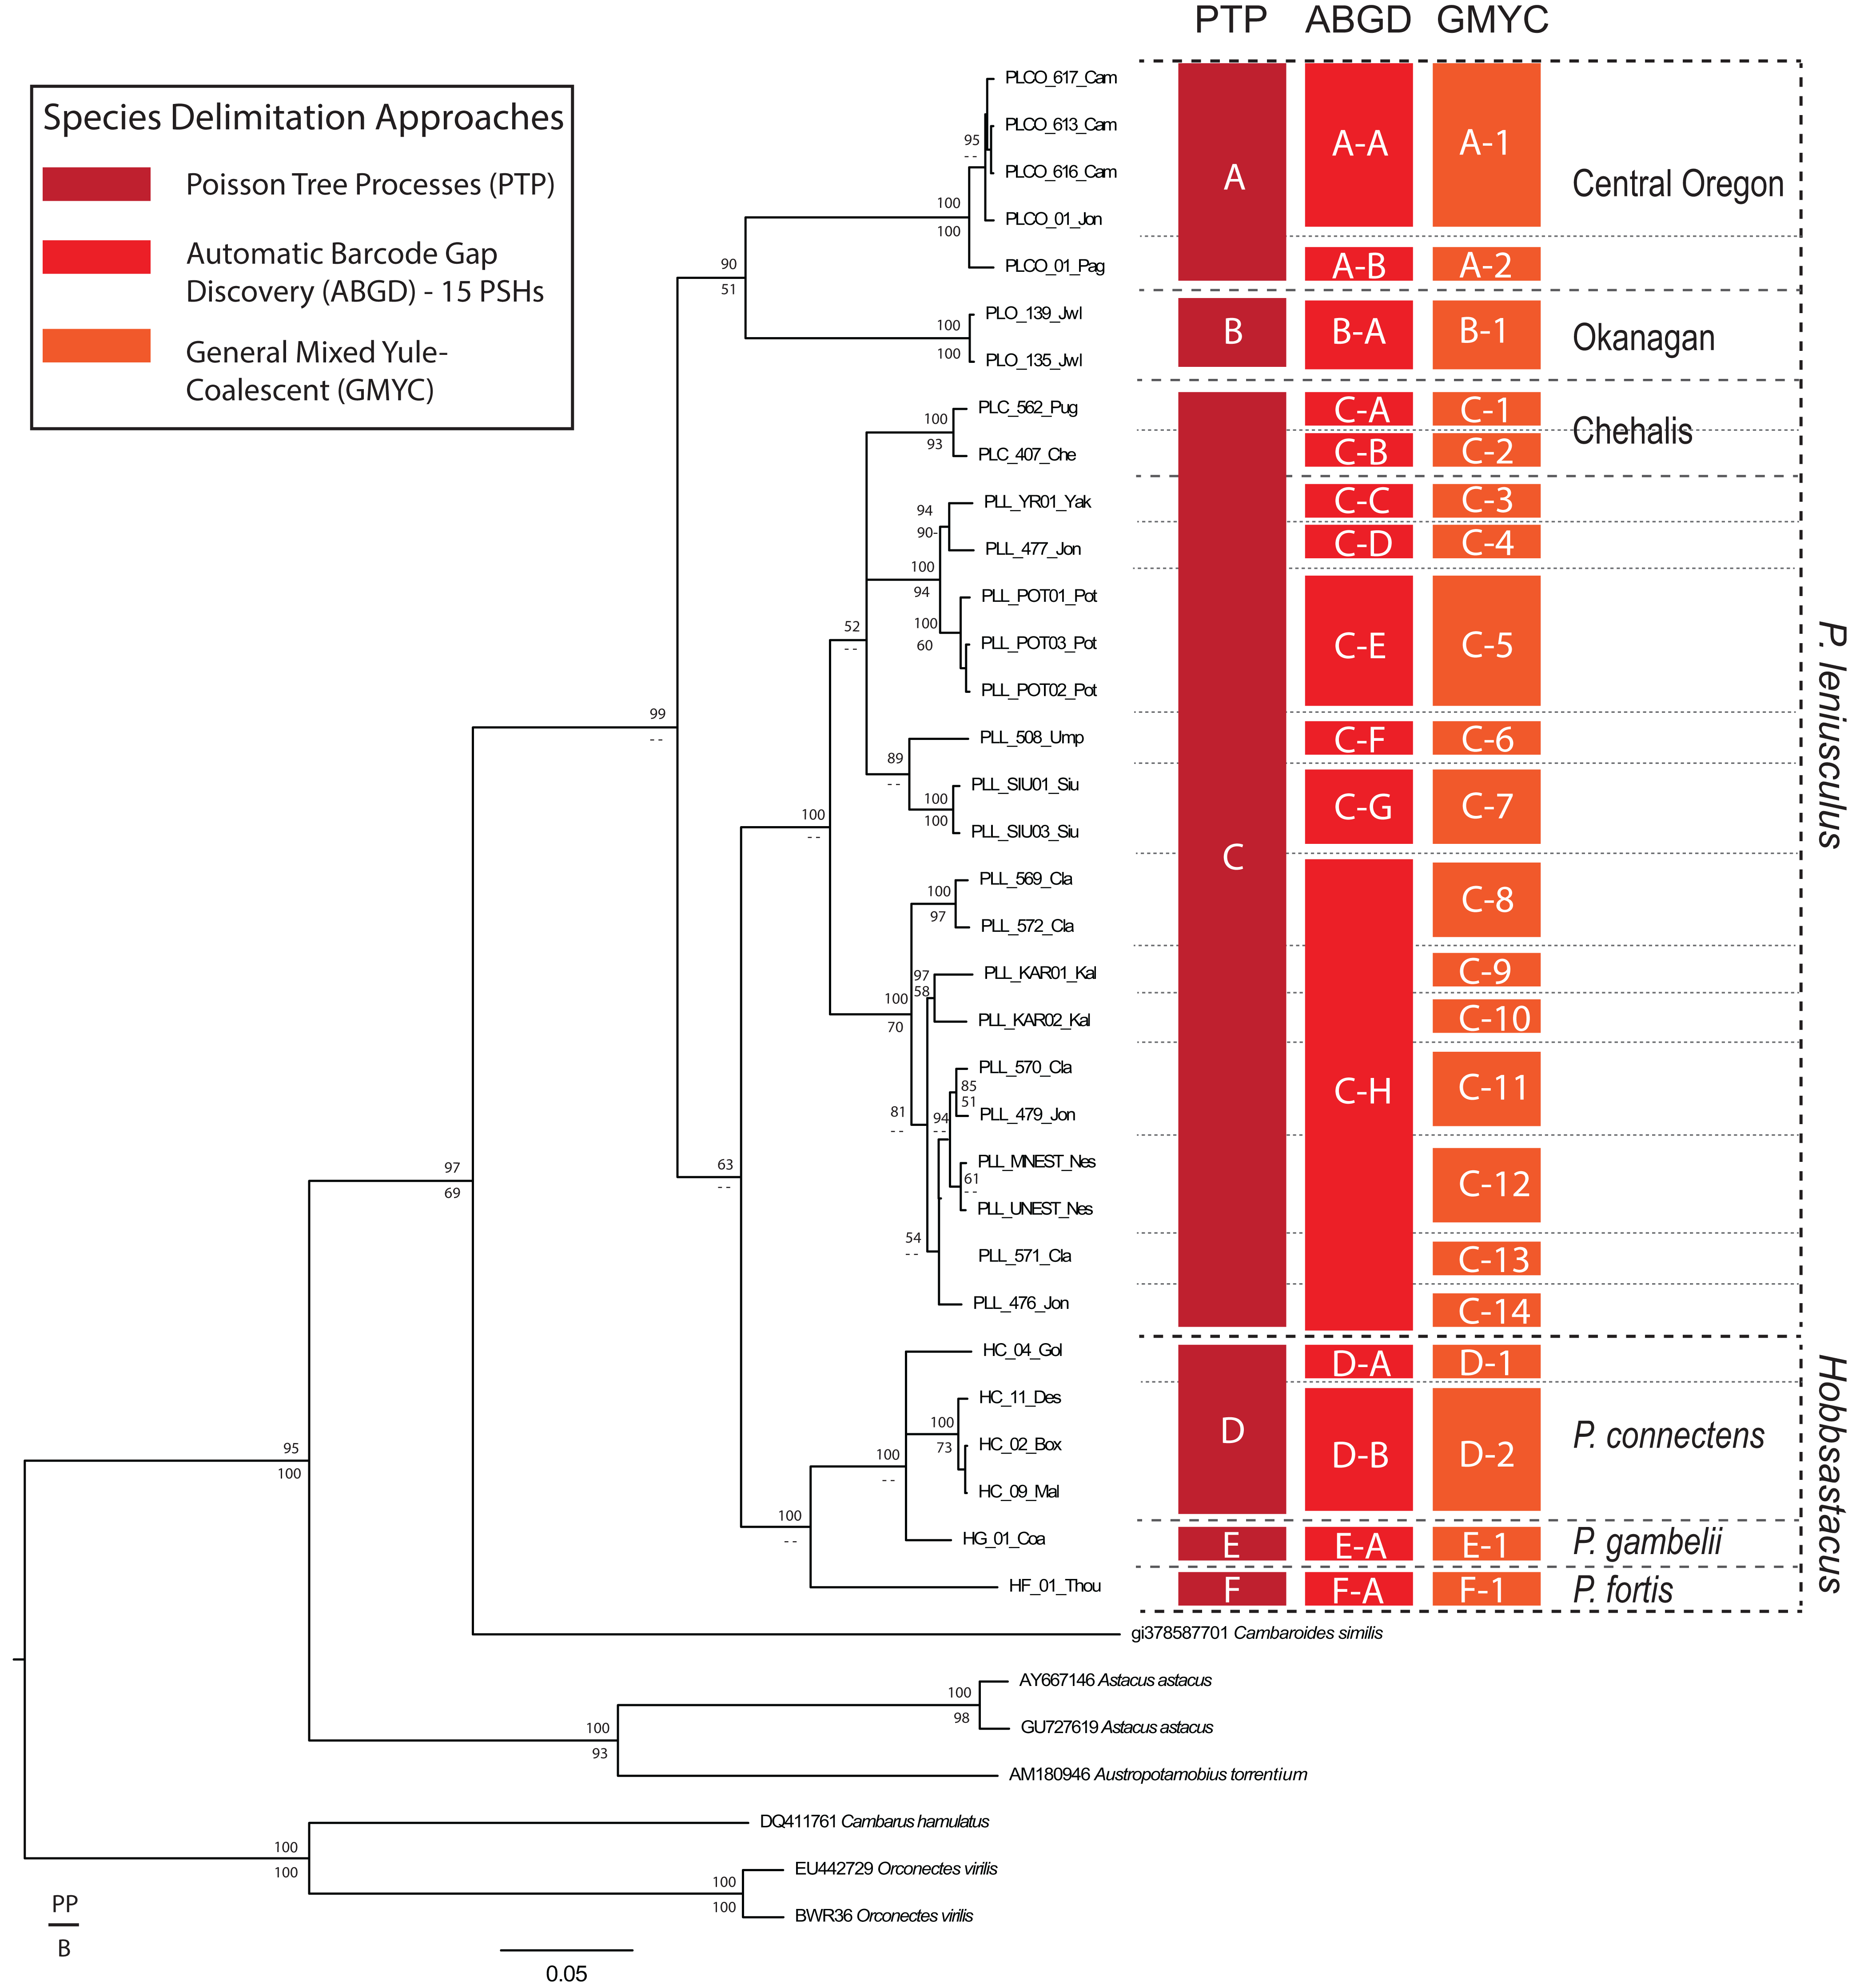
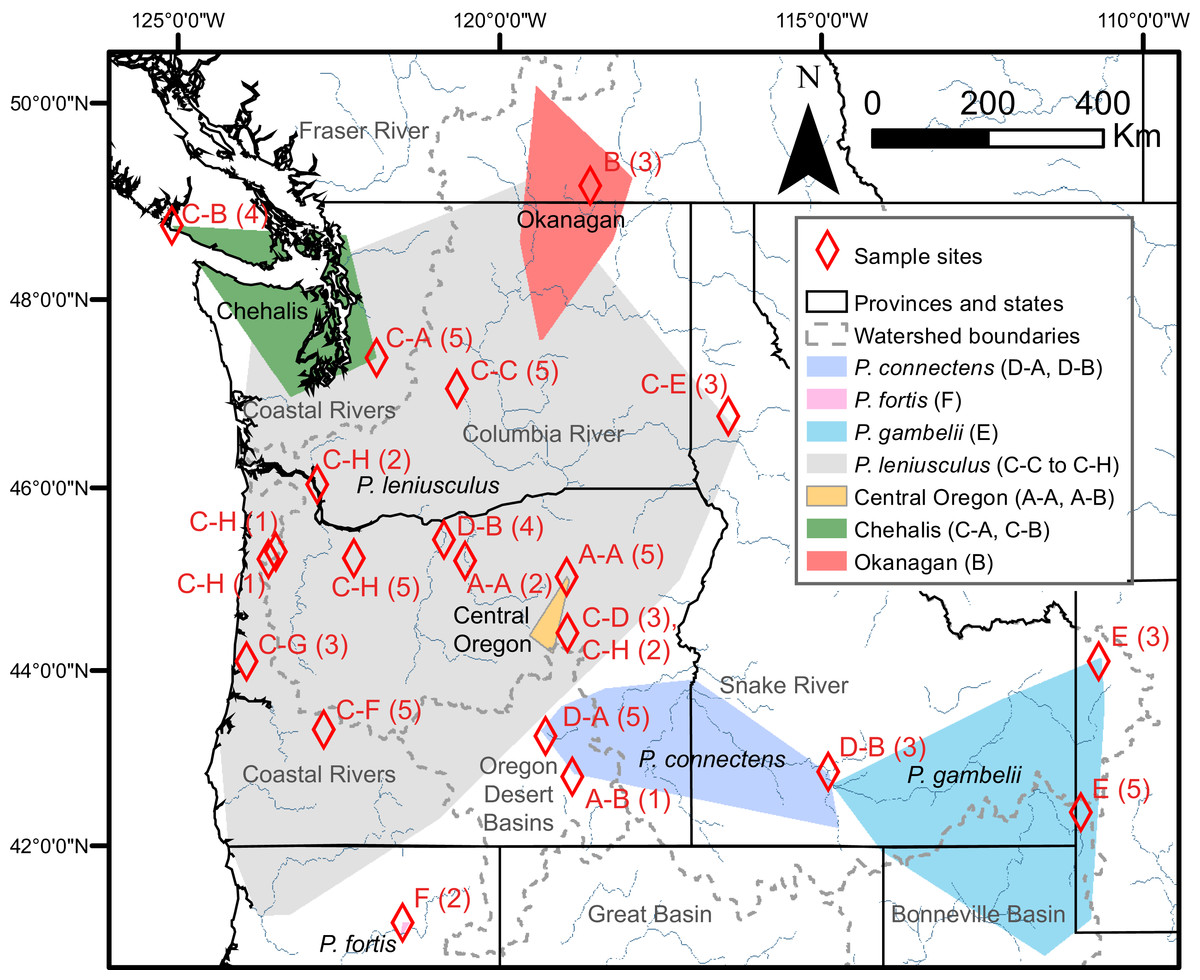
Figure 3: Study region with species and cryptic group ranges, as well as sample sites with Primary Species Hypotheses letters and number of samples.
Map of study region, with convex hulls representing native range locations reported by Miller (1960) for the crayfish species P. connectens, P. fortis, P. gambelii, and P. leniusculus (see also Larson & Olden, 2011; Larson et al., 2012), as well as convex hulls representing all locations for three cryptic groups of P. leniusculus (Central Oregon, Chehalis, Okanagan) identified by Larson et al. (2012). Sampling sites used in the current study are noted by red diamonds, with the number of crayfish from each site (in parenthesis) assigned to Primary Species Hypotheses (PSHs) by species delimitation analysis on COI (Fig. 2). Codes for PSHs are based on both Poisson Tree Processes (PTP) and, in some cases, more resolved assignments from the intermediate 15 partition scenario of Automatic Barcode Gap Discovery (ABGD).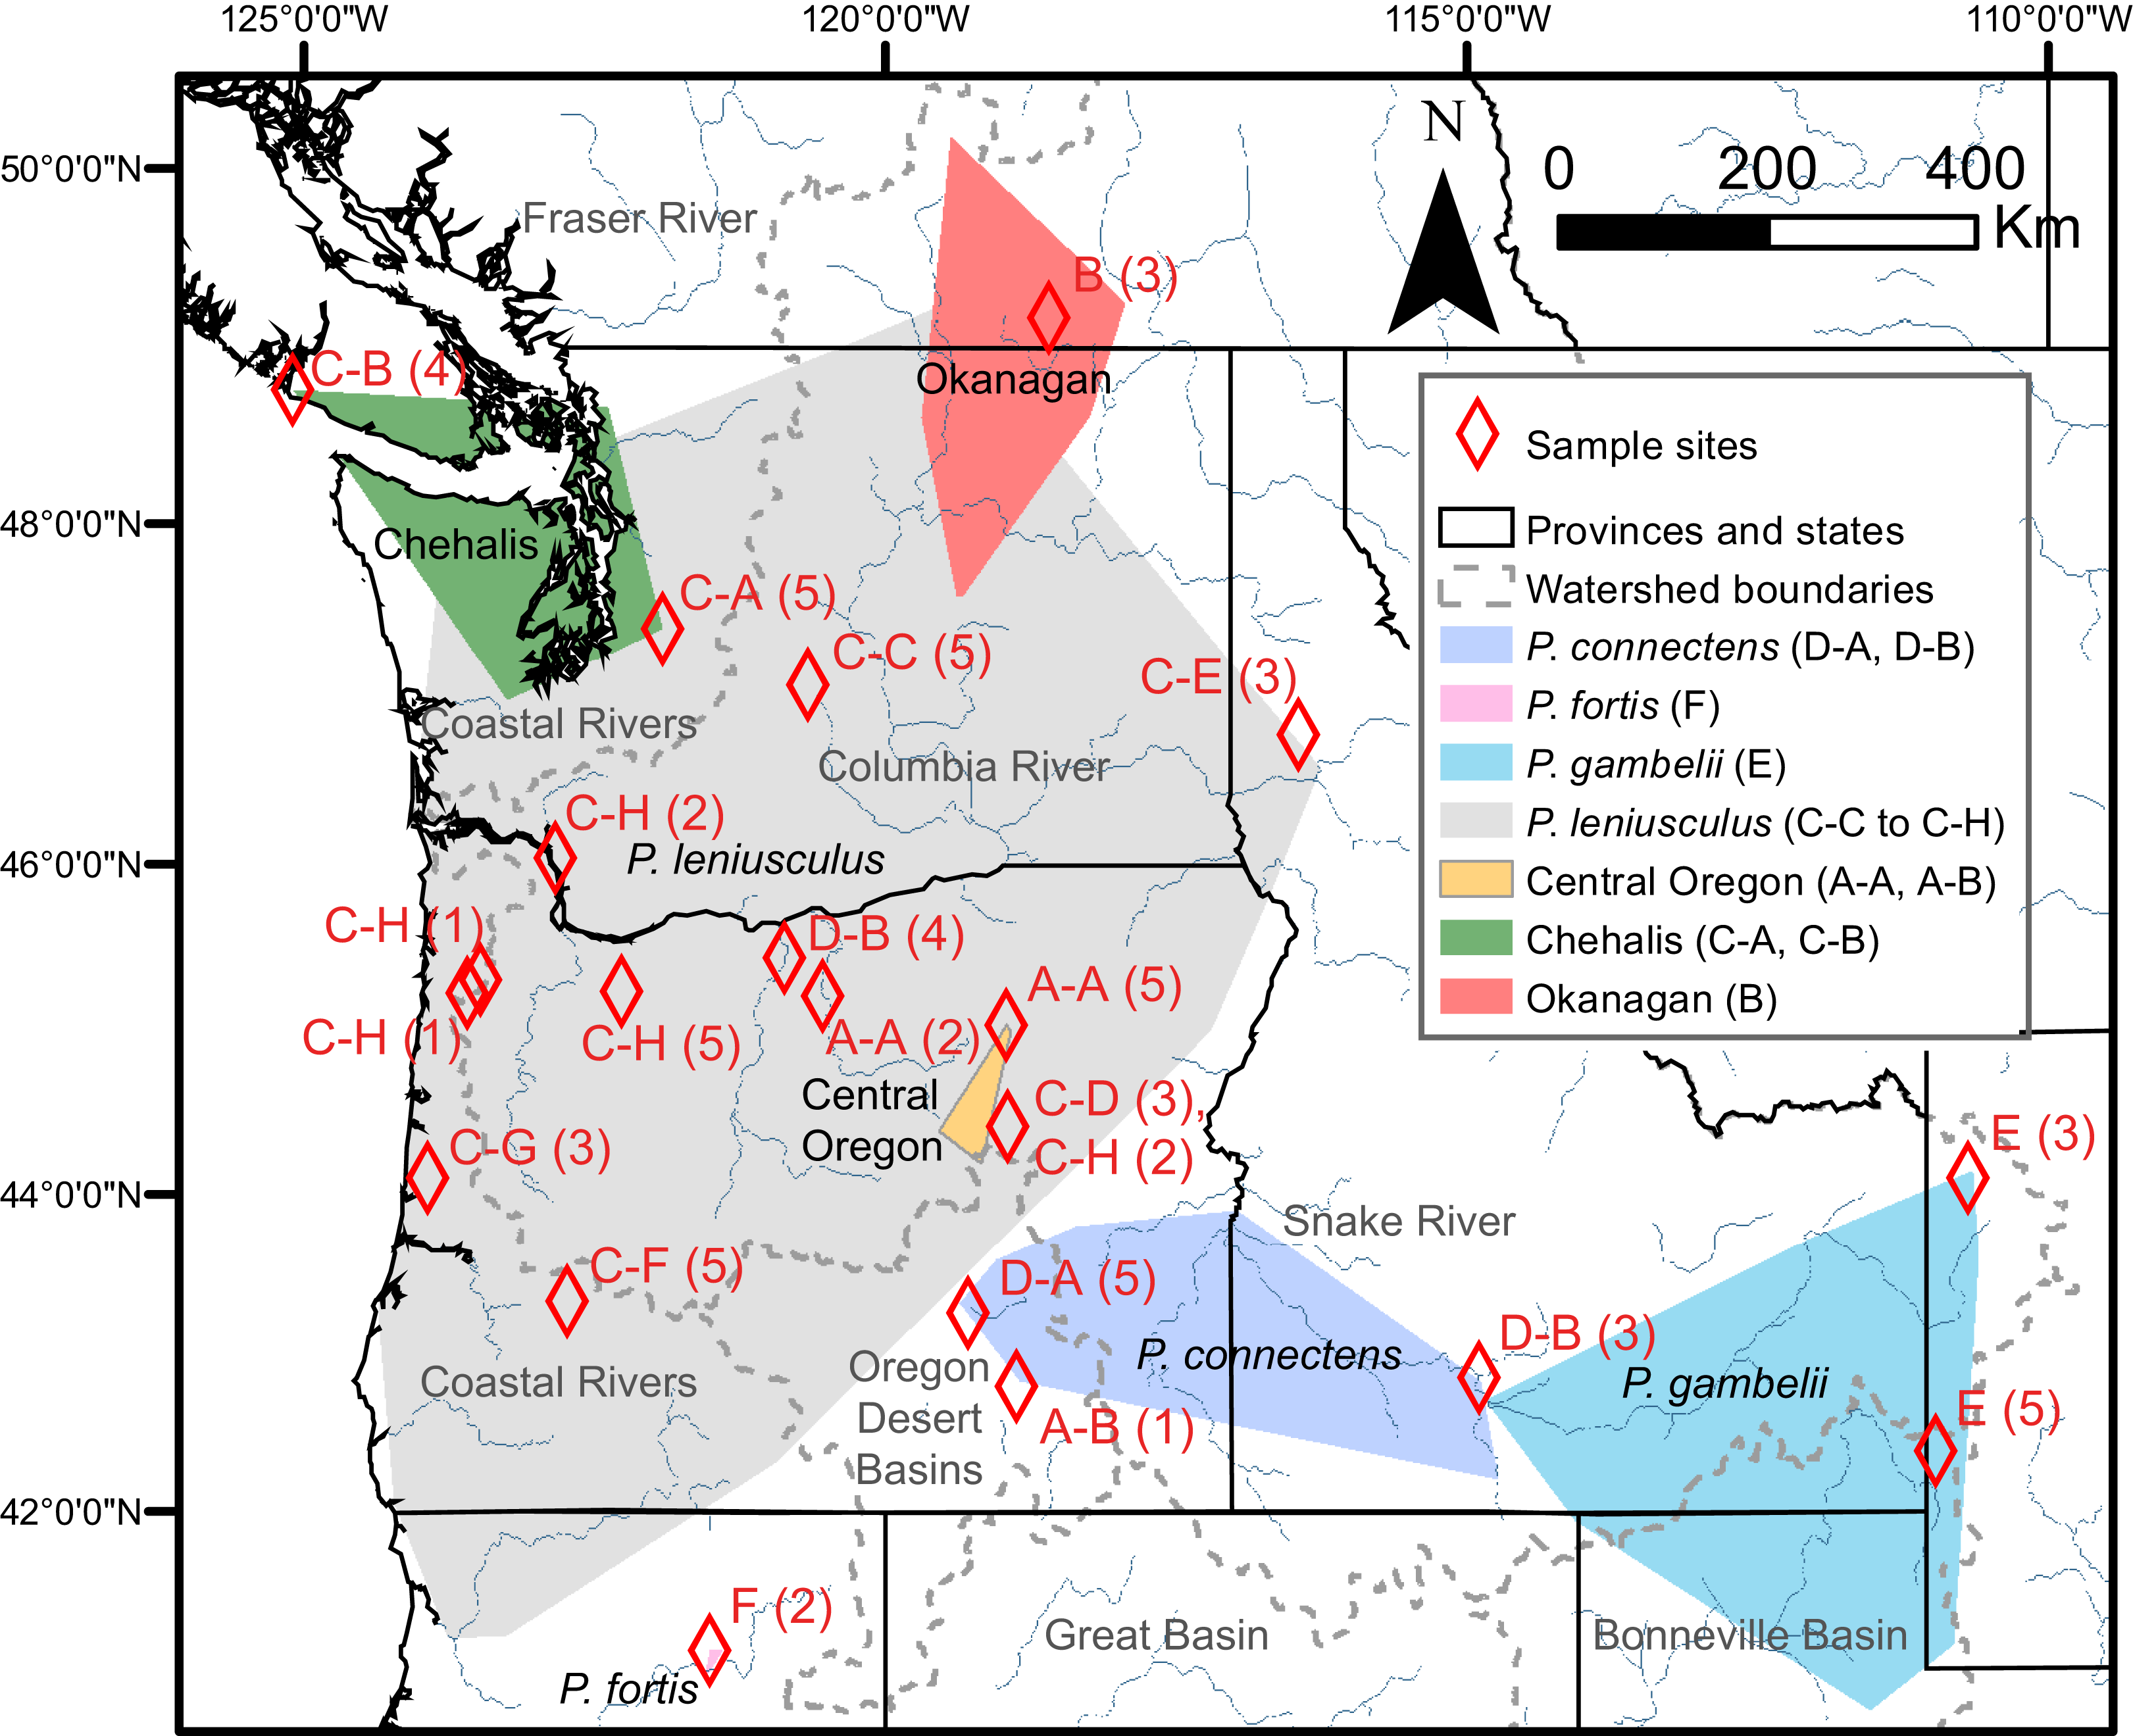
Discussion
Our multi-gene phylogenetic analyses, in combination with species delimitation estimation, provide evidence that P. leniusculus sensu lato includes morphologically cryptic diversity. Further, crayfish historically recognized as P. leniusculus are not monophyletic relative to the separate subgenus Hobbsastacus (P. connectens, P. fortis, and P. gambelii). This is similar to recent results challenging the validity of subgenera classifications in crayfishes of the family Cambaridae (e.g., Breinholt, Porter & Crandall, 2012). This cryptic diversity may ultimately merit taxonomic description as new species, albeit in consideration with other factors like sympatric coexistence or hybridization, ecological exchangeability, and morphology–in particular, tools like geometric morphometrics (e.g. Helms et al., 2015) may be useful in future applications to Pacifastacus crayfishes (see below). Similarly, two of our species delimitation approaches (ABGD, GMYC) identified additional PSHs within not only P. leniusculus, but also within P. connectens of the subgenus Hobbsastacus, relative to the more conservative PTP method. Notably, P. connectens was not monophyletic in any of our phylogenetic trees. Cumulatively, these results have important implications for the management and conservation of crayfishes in the Pacific Northwest of North America, as well as for regions like Europe and Japan where P. leniusculus is a widespread invasive species.
Phylogenies and species delimitation
Some of the conflict between molecular-based phylogenetic approaches to classifying biodiversity and traditional morphology-based taxonomy is likely caused by a tendency for molecular phylogenetic approaches to be mutable over short time scales, owing to rapid advances in laboratory and statistical techniques, resulting in the potential misconception that they are arbitrary or indecisive. Overcoming this tension requires an appreciation that results of phylogenetic studies based on all data types, whether morphological or molecular, are not fixed, but rather are dynamic sources of data and hypotheses for subsequent inquiry, reanalysis and interpretation (Owen et al., 2015). We do not advance our analyses here as definitively overturning existing Pacifastacus taxonomy, or precluding future phylogenetic studies. Rather, we provide further robust support for previously reported patterns of potentially high conservation and management relevance (Larson et al., 2012), while also identifying priorities for ongoing investigation. Nevertheless, a comprehensive taxonomic revision of this genus would be useful.
In particular, several phylogenetic relationships among lineages within Pacifastacus remain poorly supported, in part because the fragment of the nuclear gene used in the current study (GAPDH) presented little variation within the genus. Further, these phylogenetic relationships might also be clarified by increased sampling within some of the problematic lineages in future studies. In addition, next generation sequencing and genomic approaches may advance understanding of phylogenetic relationships for Pacifastacus crayfishes (McCormack et al., 2013). Although the three species delimitation methods applied in this study did not achieve consensus support for number of PSHs within Pacifastacus (PTP = 6 PSHs; ABGD = 13–18; GMYC = 21), the results did not appear to conflict, as the divisions among PTP-defined PSHs were also recovered by GMYC and ABGD. The recovery of multiple PSHs within Pacifastacus combined with a failure to recover a monophyletic P. leniusculus senso lato relative to the Hobbsastacus subgenus for each gene independently supports morphologically cryptic taxa.
Pacifastacus taxonomy
The species P. leniusculus, Pacifastacus klamathensis, and Pacifastacus trowbridgii were demoted by Miller (1960) to subspecies of P. leniusculus on the basis of observed intermediate morphologies proposed to represent hybridization in sympatry, a view subsequently adopted by Hobbs (1974). Unfortunately, the characters used to distinguish P. leniusculus subspecies are not discrete, but rather continuous gradients for several seemingly independent morphological traits. As primary examples, subspecies are distinguished by narrow (P. l. leniusculus) to intermediate (P. l. trowbridgii) to broad carapaces (P. l. klamathensis); long rostrums and acumens with pronounced postorbital spines (P. l. leniusculus) to intermediate (P. l. trowbridgii) to short, broad rostrums with reduced acumens and postorbital spines (P. l. klamathensis); and broad chelae with convex palms (P. l. leniusculus) to intermediate (P. l. trowbridgii) to narrow chelae with long, straight palms (P. l. klamathensis).
Miller (1960) proposed a Discriminant Function Analysis (DFA) to classify P. leniusculus to subspecies on a reduced set of morphological characters; Larson et al. (2012) applied this DFA to a subset of samples also considered in the current study and found that subspecies assignments were not conserved within distinct phylogenetic lineages as inferred from a fragment of the mitochondrial gene 16S rDNA. For example, P. l. klamathensis morphologies can be found among Central Oregon (A) and Okanagan (B) cryptic groups, the Chehalis cryptic group (C-A and C-B per ABGD), and a number of additional P. leniusculus PSHs reported here (e.g., C-C, C-D, and C-F per ABGD). Not all of these P. leniusculus lineages in disparate geographic regions can be P. l. klamathensis. As such, considerable work is needed to determine whether morphological attributes historically associated with P. leniusculus subspecies represent shared ancestral polymorphism or convergent evolution between distinct phylogenetic lineages, hybridization among them, or phenotypic responses to environmental conditions. The degree to which these distinct P. leniusculus lineages occur and persist in sympatry is unknown, and is likely confounded by ongoing human introductions of these crayfishes within the region (Larson et al., 2012). Even omitting the pronounced Central Oregon and Okanagan cryptic groups recognized here by the more conservative PTP analysis, the other primary lineage of P. leniusculus senso latu includes considerable genetic variability recovered as a diversity of PSHs by ABGD and GMYC that similarly merit future scrutiny.
Pacifastacus connectens was described as a subspecies of P. gambelii by Faxon (1914), and subsequently elevated to a species by Hobbs (1972) with little clear justification. Like the characters associated with P. leniusculus subspecies (above), P. connectens and P. gambelii are distinguished along gradients of several continuous morphological traits. Pacifastacus connectens is characterized as having a long, acute rostrum whereas that of P. gambelii is described as shorter and obtuse, and P. connectens is characterized as having long, slender chelae whereas those of P. gambelii are characterized as broad and robust. The degree to which these morphological characters are influenced by genotype relative to plastic responses to environment is unknown. The PTP species delimitation analysis identified P. connectens and P. gambelii as separate PSHs, whereas the ABGD and GMYC species delimitation analyses identified an additional PSH within P. connectens. These two P. connectens PSHs include a lineage sampled from several sites in the Snake River and a disjunct location in the Deschutes River (see below), and a second lineage sampled instead from the endorheic Harney Basin. Given these results in light of Hobbsastacus taxonomic history and potential morphological ambiguity, we propose P. connectens for more intensive taxonomic and phylogenetic investigation. In addition, we collected P. connectens from the lower Deschutes River of north Central Oregon, a major range expansion for a species never previously observed from tributaries of the lower Columbia River (Larson & Olden, 2011; Larson & Williams, 2015). We do not know whether this occurrence represents a historically overlooked component of the native range of P. connectens, or instead a range expansion by human introduction that is seemingly common for other species in this region (Larson & Olden, 2011; Larson et al., 2012).
Conservation and management
The most important implication of our study is a call to better conserve and manage unique, and potentially imperiled, genetic diversity within the species historically recognized as P. leniusculus. For example, the Okanagan and Central Oregon cryptic groups are directly threatened by recent invasions by the virile crayfish Orconectes virilis and the rusty crayfish Orconectes rusticus (Larson & Olden, 2011). Given that the extinction and ESA listing of two other narrowly endemic Pacifastacus crayfishes has been attributed in part to impacts of invasive crayfish (Bouchard, 1977a; Light et al., 1995), these cryptic P. leniusculus are very likely at risk of population and range declines from interactions with invaders. Further work including increased taxonomic recognition of these cryptic groups will likely be necessary to motivate any conservation action. This does not necessarily require elevation to species status; for example, the Pacific Northwest region has ample experience managing ESUs of anadromous salmonids for conservation (Waples, 1991). However, ESU status is preferably based not only on genetic distinctiveness between populations, but also on ecological distinctiveness or exchangeability (Crandall, Harris & Fetzner, 2000). To date, we have no knowledge of the extent to which the genetic diversity and phylogenetic structure within P. leniusculus corresponds to differences in ecological function and the expression of phenotypic traits between these organisms.
Molecular approaches have enabled an increasingly resolved understanding of ways that genetic variation and its phenotypic expression can affect whole-ecosystem processes (Bailey et al., 2004; Post et al., 2008). Given that crayfish can have important but variable effects on the structure and function of freshwater ecosystems (Jackson et al., 2014), and the wide range of both genetic and phenotypic variation observed across P. leniusculus, it is plausible that different PSHs identified by our study are ecologically distinct. As a consequence, an investigation of this possibility has important conservation and management implications. Where introduced into California and Nevada, P. leniusculus has been a major invasive species and is implicated in the extinction of P. nigrescens and ESA listing of P. fortis (Bouchard, 1977a; Light et al., 1995). We do not know which P. leniusculus lineages or PSHs comprise these invasive populations, or how these PSHs potentially interact with each other with respect to factors like hybridization, disease or parasite transmission, or competition, which are the major mechanisms whereby native crayfish are displaced by invaders (Lodge et al., 2000). Finally, at the global scale, P. leniusculus is an extremely successful invasive species in Europe and Japan, with well-studied effects on other crayfish populations, freshwater communities and ecosystems, and habitat structure (Lodge et al., 2000; Usio et al., 2007; Harvey et al., 2011). Our study provides a baseline to help identify which lineages or PSHs of P. leniusculus are globally invasive, and to potentially identify source populations for past and ongoing introductions. This information could help guide management intervention to focus on specific introduction pathways and vectors and help slow the ongoing spread of P. leniusculus globally.