
Effects of time, anticoagulant and detection channel on platelet count in ethylenediaminetetraacetic acid (EDTA)-dependent pseudothrombocytopenia
- Published
- Accepted
- Received
- Academic Editor
- Carlos Eurico Fernandes
- Subject Areas
- Hematology, Public Health
- Keywords
- EDTA-PTCP, PLT clumps, Haematology analyser, Dissociation effect, PLT physiology
- Copyright
- © 2025 Zhang et al.
- Licence
- This is an open access article distributed under the terms of the Creative Commons Attribution License, which permits using, remixing, and building upon the work non-commercially, as long as it is properly attributed. For attribution, the original author(s), title, publication source (PeerJ) and either DOI or URL of the article must be cited.
- Cite this article
- 2025. Effects of time, anticoagulant and detection channel on platelet count in ethylenediaminetetraacetic acid (EDTA)-dependent pseudothrombocytopenia. PeerJ 13:e19103 https://doi.org/10.7717/peerj.19103
Abstract
Background
EDTA-dependent pseudothrombocytopenia (EDTA-PTCP) is an in vitro phenomenon that may lead to expensive, time-consuming, and invasive diagnostic procedures as well as unnecessary patient treatment. The purpose of this study was to explore the effects of time, anticoagulant and detection channel on the platelet (PLT) count of EDTA-PTCP samples, and to suggest a better method for correcting spurious low PLT counts.
Methods
In this study, 43 identified EDTA-PTCP samples were collected. The Sysmex XN-9100, Mindray BC-6900 and Mindray BC-5390 haematology analysers were used to test these EDTA-PTCP samples on the following detection channels at different time points: PLT count by impedance method (PLT-I), PLT count by optical method (PLT-O) and PLT count by fluorescent staining (PLT-F).
Results
EDTA-PTCP was time-dependent and small PLT agglutination occurred in most of the corresponding citrate-treated samples. Our results further demonstrated that the detection channel significantly affected the PLT count of the EDTA-PTCP samples. The XN-9100 PLT-F channel exhibited a greater dissociative effect than the XN-9100 PLT-I and PLT-O channels. Moreover, blood samples processed in the PLT-O channel of the Mindray hematology analyzer showed the highest PLT count in EDTA-K2 tubes compared to the other detection channels.
Conclusion
Our data showed that time, anticoagulant and detection channel significantly affected the PLT count in the EDTA-PTCP samples. For the EDTA-PTCP samples, the simplest retest method was to use the PLT-O channel of the Mindray automatic blood analyser within 30 min. In addition, changing the sodium citrate anticoagulant and using the XN-9100 PLT-F channel within 15 min were also suitable for correcting the spurious low PLT of the EDTA-PTCP samples.
Introduction
Accumulating evidence suggests that platelets (PLT) contribute to both hemostasis and thrombosis. Thus, routine peripheral PLT examinations can reveal insights into patient health (Vieira-de-Abreu et al., 2012; Guo & Rondina, 2019). Pseudothrombocytopenia (PTCP) refers to the phenomenon in which PLT aggregate in anticoagulated blood outside the body, preventing the blood analyzer from recognising PLT and resulting in a significantly lower PLT count than the actual value (Ceran et al., 2021; Kometani et al., 2022). In clinical practice, PTCP is often misdiagnosed as immune thrombocytopenia, leading to unnecessary examinations and treatments (Pujol-Moix et al., 2023). Currently, PTCP pose certain challenges in blood sample analysis (Pang et al., 2024). The causes of PTCP are diverse, and include improper venipuncture, uneven blood mixing, specimen coagulation, osteoarthritis, and large or giant PLTs (Lardinois et al., 2021). Additionally, PLT aggregation is correlated with anticoagulation time and room temperature, more severe platelet aggregation is observed with longer anticoagulation times and lower indoor temperature (Lardinois et al., 2021; Bao et al., 2020). Among PLT aggregations induced by different factors, ethylenediaminetetraacetic acid (EDTA)-dependent PTCP (EDTA-PTCP) is the most common aetiology (Bao et al., 2020).
EDTA-PTCP is caused by PLT aggregation, accumulation, and satellite formation when EDTA salts are used to anti-coagulate whole blood. This leads to the inability of fully automated hematology analyzers to accurately count PLT, resulting in a pseudo-reduction in PLT count. The incidence rate of EDTA-PTCP is 0.09–0.21% (Lin et al., 2014; Yoneyama & Nakahara, 2003), with a higher occurrence rate in hospitalised patients than in healthy individuals, ranging from 1.5–1.9%. Previous studies have shown that autoimmune diseases, infection, pregnancy, and low-molecular-weight heparin are significant risk factors for EDTA-PTCP (Lardinois et al., 2021). The possible mechanism of action of EDTA-PTCP is that EDTA mediates a conformational change in the PLT structure which causes dissociation of the Ca2+-dependent GpIIb/IIIa heterodimer, leading to PLT aggregation (Lin et al., 2014). If this phenomenon of EDTA-PTCP occurring in vitro is not discovered and corrected in a timely manner, it may lead to unnecessary additional clinical examinations such as bone marrow puncture, hormone therapy, or splenectomy, and may even result in misdiagnosis, mistreatment, and medical disputes. Therefore, it is particularly important to promptly identify patients with EDTA-PTCP in clinical practice and accurately conduct PLT count retesting.
With the development of experimental technology, several methods have been recommended for the resolution of EDTA-PTCP. The traditional method involves the use of anticoagulants other than EDTA during blood sample collection (Lunde, Hjelmtvedt & Amundsen, 2022). However, this alternative anticoagulant is only suitable for a portion of the EDTA-PTCP sample (Sharif et al., 2023). Amikacin and kanamycin are also effective in correcting PLT count (Bokaei et al., 2017; Tantanate, Talabthong & Lamyai, 2022). However, this method is limited by its lack of availability. Recently, the detection channel of an automatic blood analyser was shown to dissociate PLT clumps (Lunde, Hjelmtvedt & Amundsen, 2022). However, the effect of different detection channels on correcting spurious low PLT counts caused by EDTA-PTCP remains unknown. Therefore, our study aimed to evaluate the efficacy of the detection channel for the correction of EDTA-PTCP and to suggest a better approach for correcting the low PLT count in EDTA-PTCP samples.
Materials and Methods
Patients and samples
Between 2022 and 2024, we collected 43 EDTA-PTCP samples from the Affiliated Suzhou Hospital of Nanjing Medical University. There were 21 male patients and 22 female patients aged 22–81 years, with an average age of 42. The standards for EDTA-PTCP samples were as follows: (1) an abnormal PLT counts lower than 80 × 109/L with instrument “platelet aggregation” flag in EDTA-treated blood. (2) PLT clumps in blood smear; and (3) the patient lacked clinical signs of a PLT disorder. This study was approved by the Clinical Research Ethics Committee of the Affiliated Suzhou Hospital of Nanjing Medical University (IEC approval No. K-2024-033-K01), and written informed consent was obtained from each participant.
Instruments and reagents
The Sysmex XN-9100 automatic haematology analyser (Sysmex Co., Saitama, Japan), Mindray BC-6900 automatic haematology analyzer (Shenzhen Mindray Biomedical Electronics Co. Ltd., Shenzhen, China), and Mindray BC-5390 automatic haematology analyser (Shenzhen Mindray Biomedical Electronics Co. Ltd., Shenzhen, China) were used. The Liu stain kit (Zhuhai Beso Biotechnology Co., Ltd., Zhuhai, Guangdong, China), EDTA-K2 anticoagulant vacuum vein collection (Jiangsu Kangjian Medical Supplies Co., Ltd. Jiangsu, China); and sodium citrate anticoagulant vacuum vein collection (Jiangsu Kangjian Medical Supplies Co., LtdD.) were used.
Platelet analytical methods
EDTA-PTCP blood samples were initially collected in EDTA-K2 and sodium citrate anticoagulant tubes. And blood smears were made at different time points. Smears were dried for 15 min and stained using a Liu staining kit. PLT counts were determined using an automated hematology analyzer at room temperature at 5, 15, 30, and 60 min after phlebotomy. Daily maintenance and quality control were performed according to the manufacturer’s instructions to ensure that the instruments were in a stable state. All samples in EDTA tubes and sodium citrate tubes underwent PLT counting using Sysmex XN-9100 in the following detection channels: PLT count by impedance method (PLT-I), PLT count by optical method (PLT-O) and PLT count by fluorescent staining (PLT-F); BC-6900 in PLT-I and PLT-O channels; and BC-5390 in the PLT-I channel. PLT counts in citrate tubes were corrected by dividing by 0.9 to eliminate the volume impact of the liquid citrate anticoagulant.
Statistical analysis
Statistical analyses were performed using the GraphPad 5.0 software. Differences between the two groups were analysed using the Student’s t test. Comparisons between the means of matched samples were performed using the Wilcoxon signed-rank test. Differences were considered statistically significant at p < 0.05.
Results
Laboratory features of EDTA-PTCP samples
A total of 43 EDTA-PTCP samples were enrolled in this study. As shown in Fig. 1A, PLT clumps were observed under a microscope in these EDTA-PTCP samples. With prolonged treatment, PLT aggregation increased in both quantity and area (Fig. 1A). Small PLT aggregation was also observed in the sodium citrate tubes (Fig. 1A). Subsequently, we compared the images of the platelet detection channels of different hematology analyzers, we found that the EDTA-PTCP samples presented a zigzag tail and serrated irregularity on the platelet histogram in the PLT-I channel (Figs. 1B, 1C). In addition, the PLT images of XN-9100-PLT-F and BC6900-PLT-O channels have no significant difference in EDTA-PTCP samples than the control group (Figs. 1B, 1C).
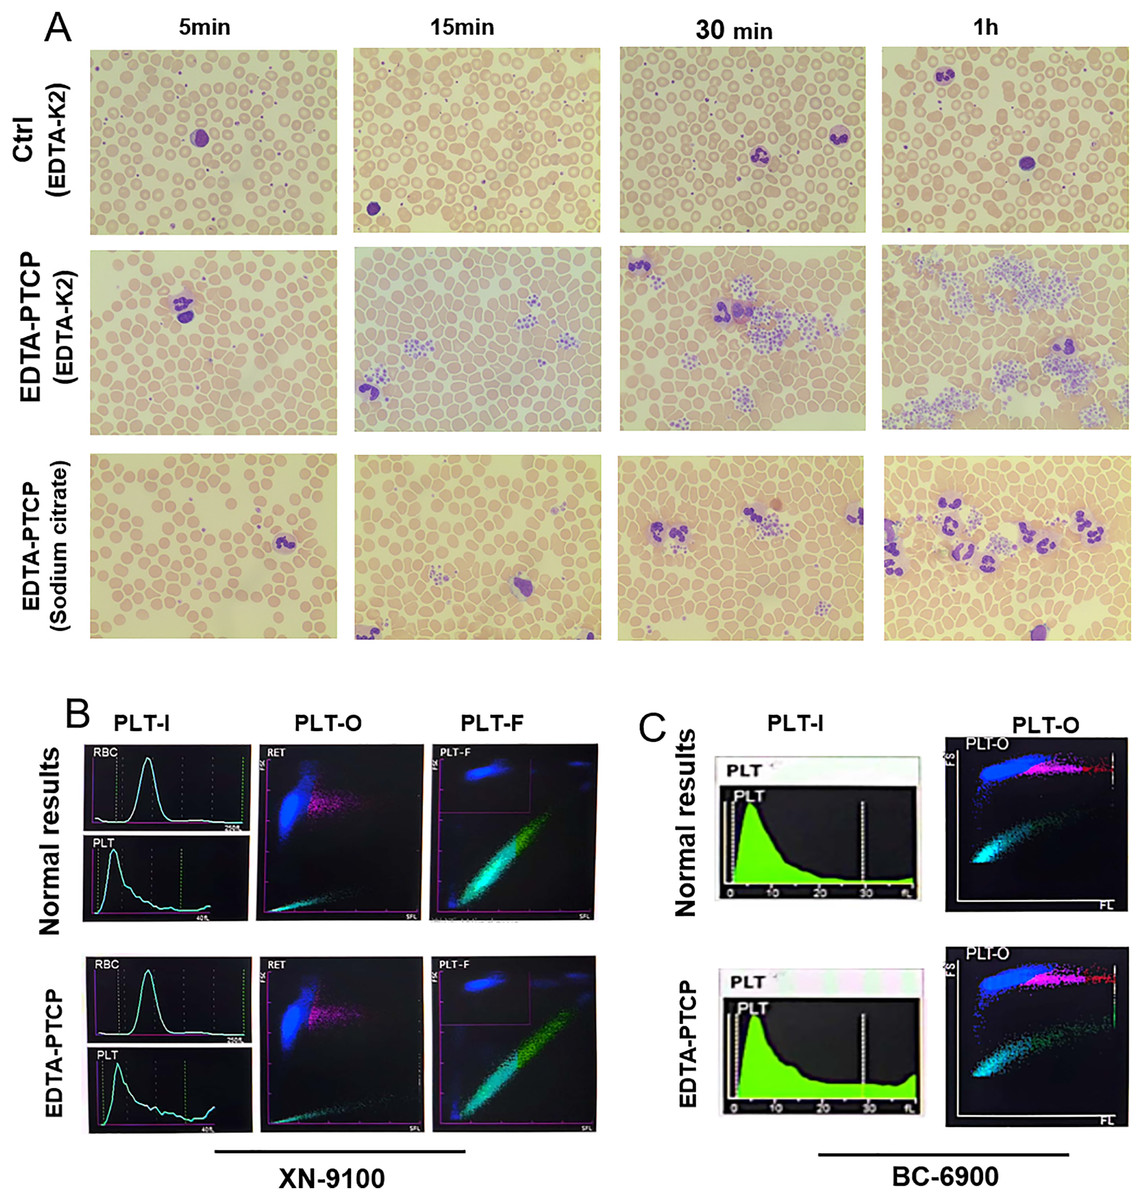
Figure 1: Microscopic pictures of EDTA-PTCP samples and typical platelet histogram of EDTA-PTCP samples.
(A) Blood smear prepared from EDTA-anticoagulated blood showed platelet aggregates from EDTA-K2 anticoagulated samples and citrate anticoagulated samples at different time points. (B and C) Images captured from different channels of the XN-9100 and BC-6900 hematology analyzers.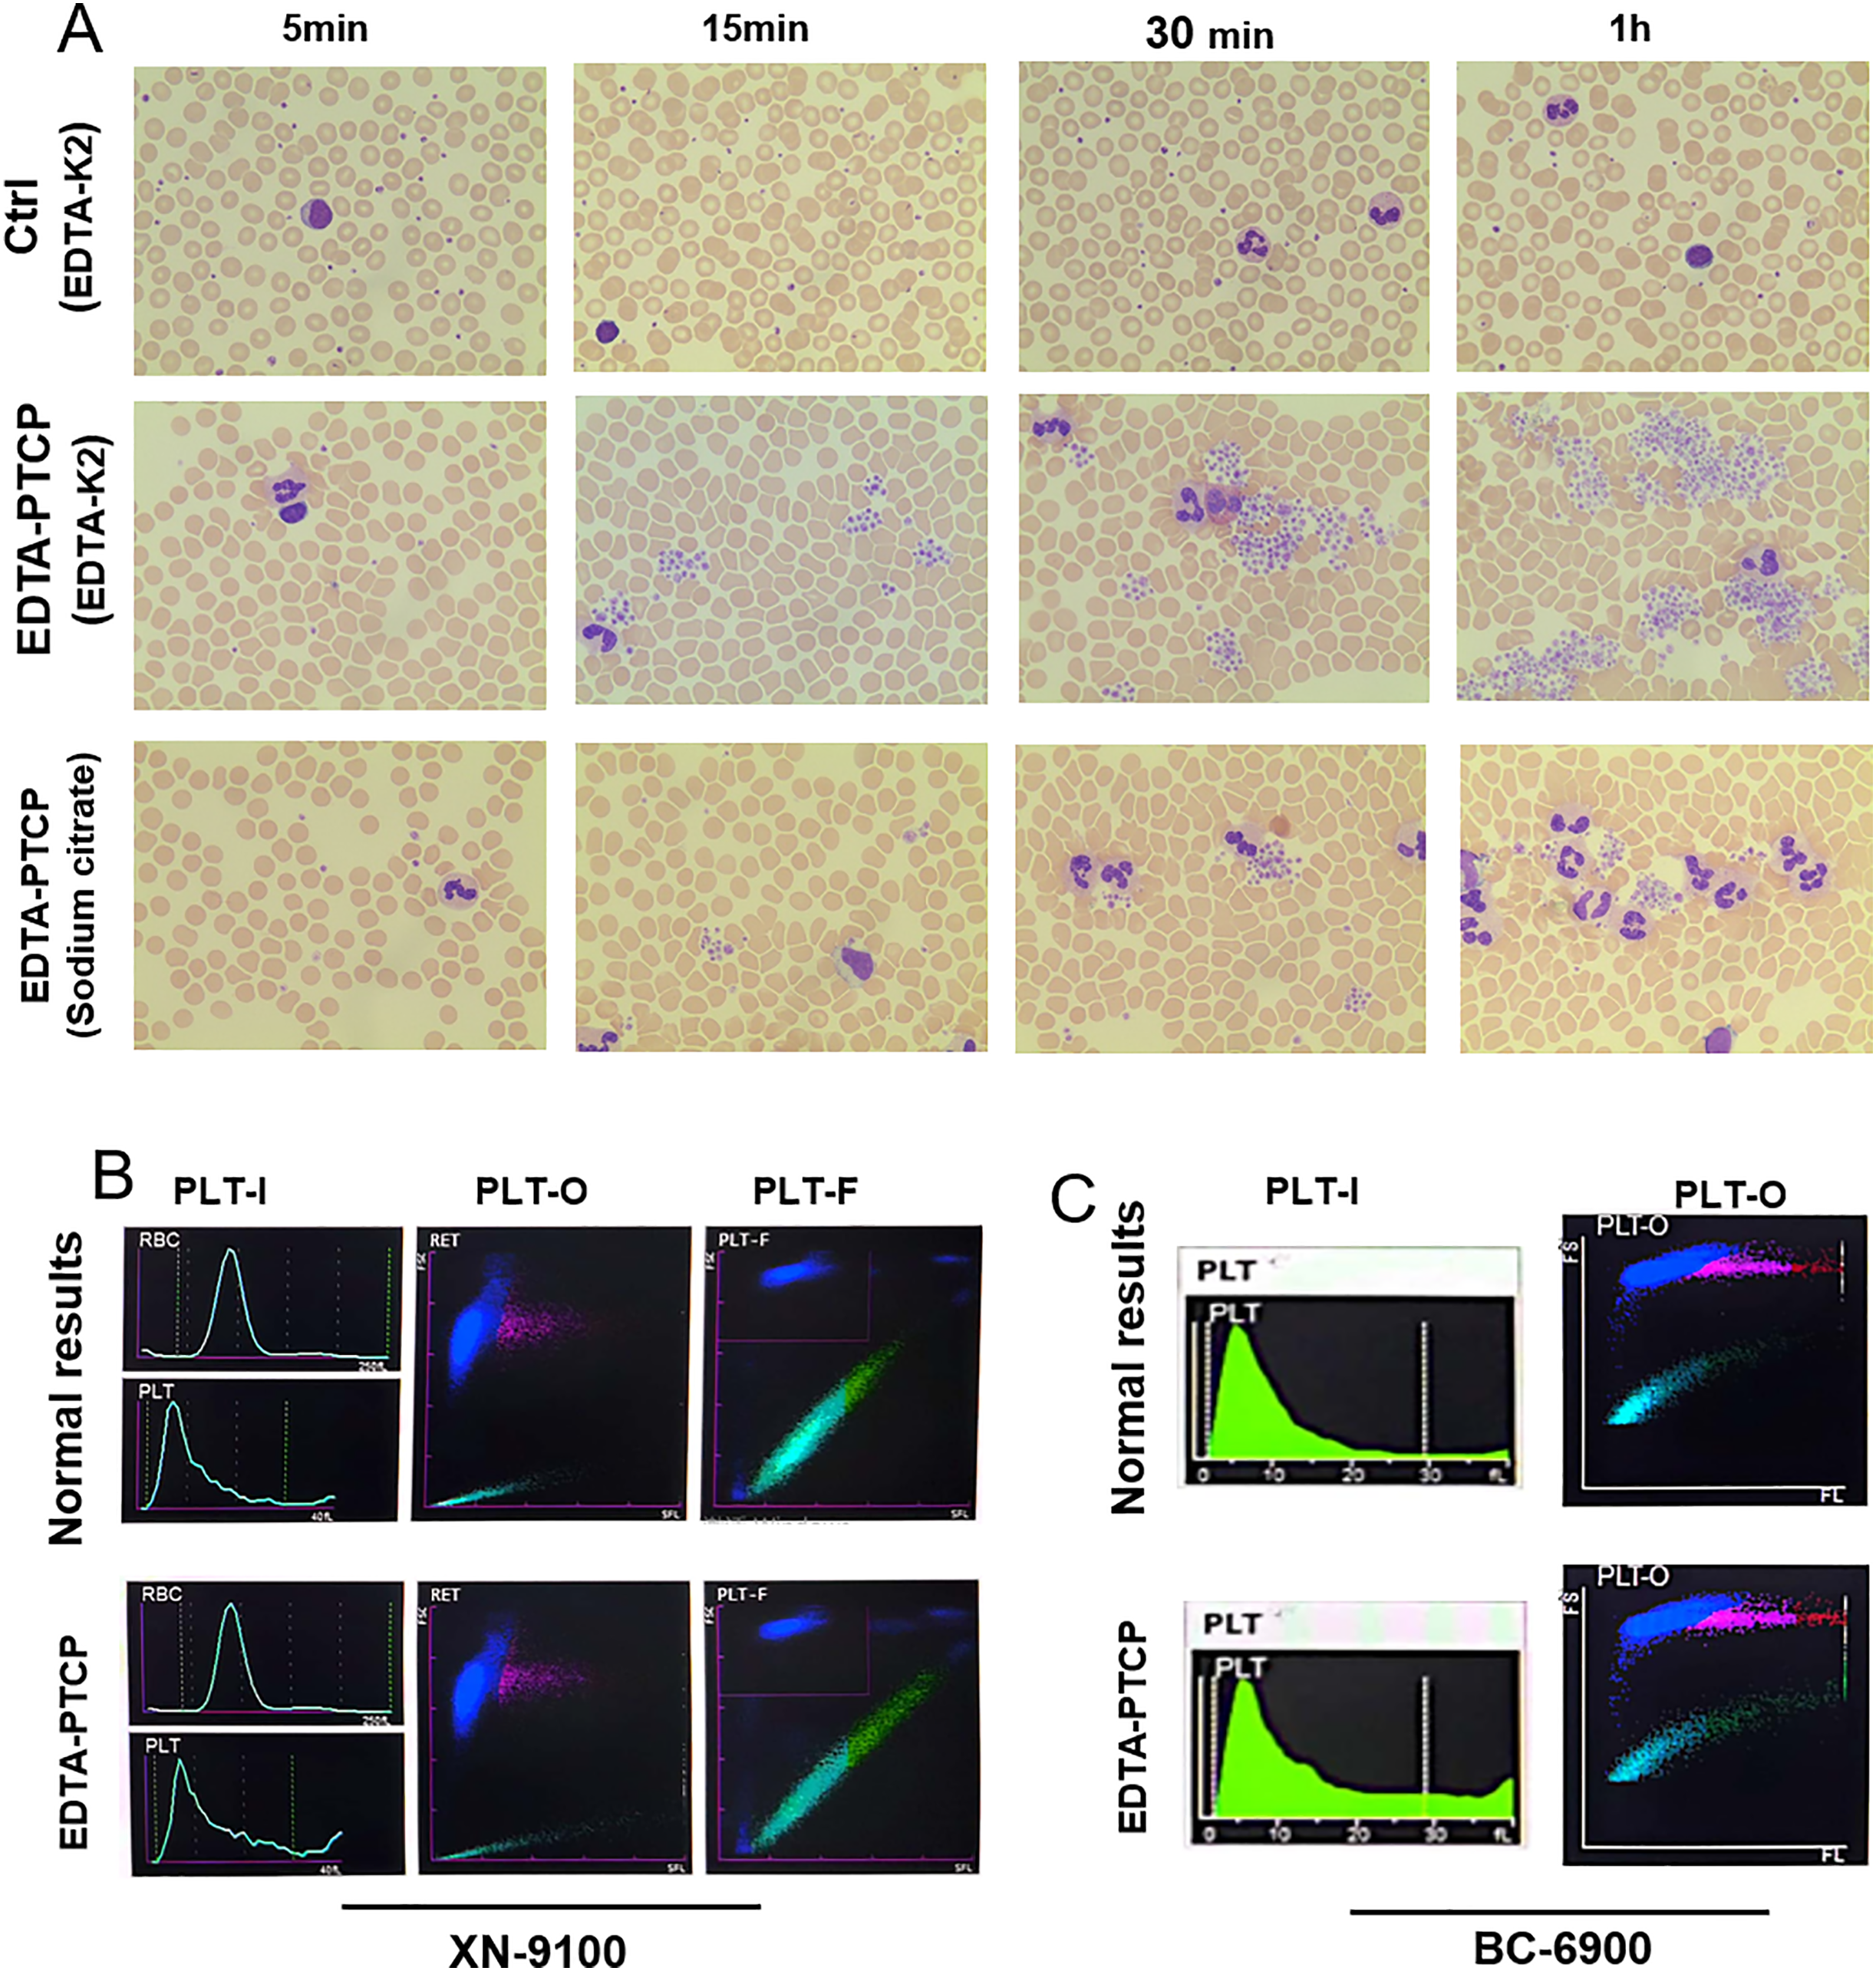
Effect of time on platelet detection in EDTA-PTCP samples
Since time influenced the size of PLT clumps in EDTA-PTCP samples (Fig. 1), it surely also affected the PLT counts. We initially discovered that the PLT count of some EDTA-PTCP samples dropped significantly at 5 min after sample collection (Fig. 2A). In the XN-9100 PLT-I detection channel, PLT counts were decreased over time in both the EDTA-K2 and sodium citrate groups (Figs. 2A, 2B). Compared to the control group (5 min time point), PLT counts decreased significantly at 15, 30, and 60 min, and after 30 min, platelet counts remained at a stable level (Figs. 2A, 2B). In the XN-9100 PLT-O and PLT-F detection channels, the platelet counts trends were consistent with the PLT-I detection channel in EDTA-K2 group (Figs. 2C, 2E), and there was no significant difference in PLT counts within 15 min in the sodium group (Figs. 2D, 2F). In the BC6900 PLT-I detection channel, PLT counts in the EDTA-K2 group decreased significantly at 15, 30, and 60 compared to the control group (Fig. 2G), the sodium citrate group decreased significantly at 30 min point (Fig. 2H). In the BC6900 PLT-O channel, there was no significant change in PLT counts within 30 min in the EDTA-K2 group, but PLT counts were decreased significantly at 60 min (Fig. 2I). In the sodium citrate group, there was no significant change in platelet counts within 15 min; however, PLT counts were decreased significantly at 30 and 60 min time point (Fig. 2J). In the BC5390 PLT-I channel, PLT counts in both the EDTA-K2 and sodium citrate groups decreased significantly at 15, 30, and 60 min (Figs. 2K, 2L).
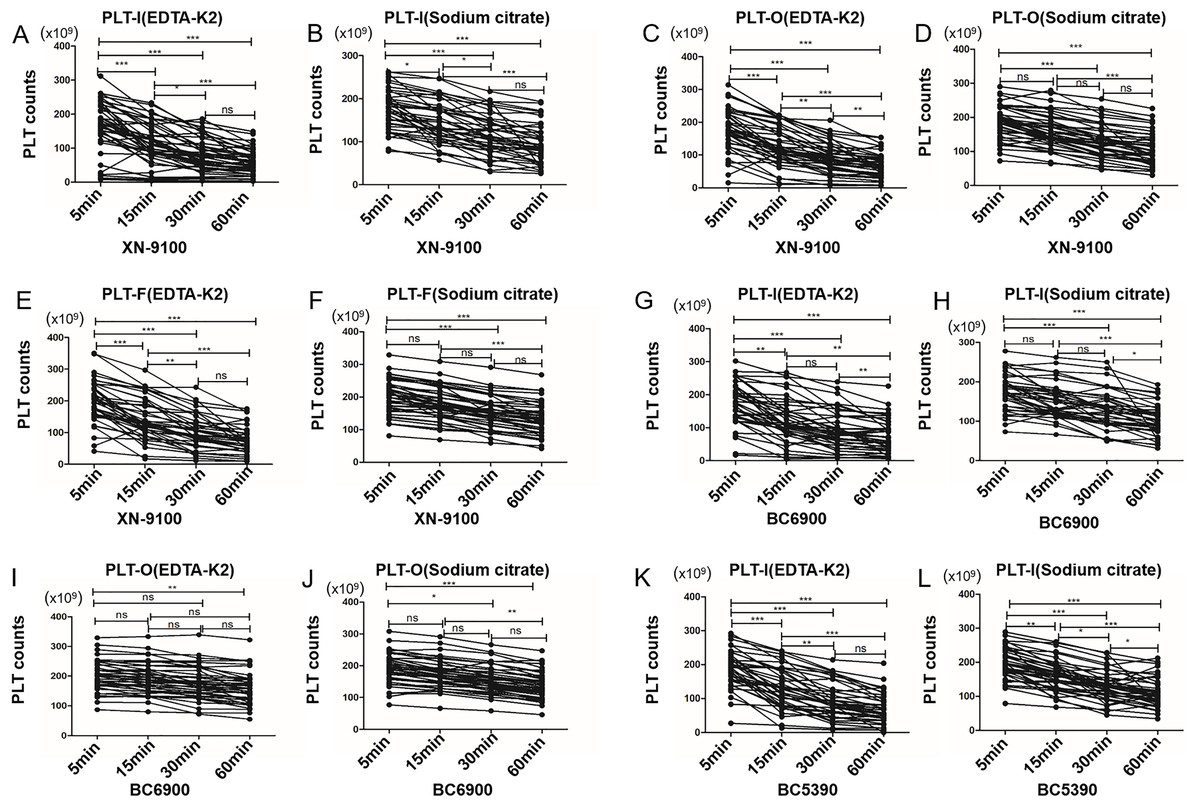
Figure 2: The time courses of platelet count of EDTA anticoagulated samples.
(A and B) The time courses of platelet count of XN-9100 PLT-I channels of EDTA-K2 and sodium citrate group. (C and D) The time courses of platelet count of XN-9100 PLT-O channels of EDTA-K2 and sodium citrate group. (E and F) The time courses of platelet count of XN-9100 PLT-F channels of EDTA-K2 and sodium citrate group. (G–J) The time courses of platelet count of BC-6900 PLT-I and PLT-O channels. (K and L) The time courses of platelet count of BC-5390 PLT-I channel. ns, not significant; *p < 0.05, **p < 0.01, ***p < 0.001.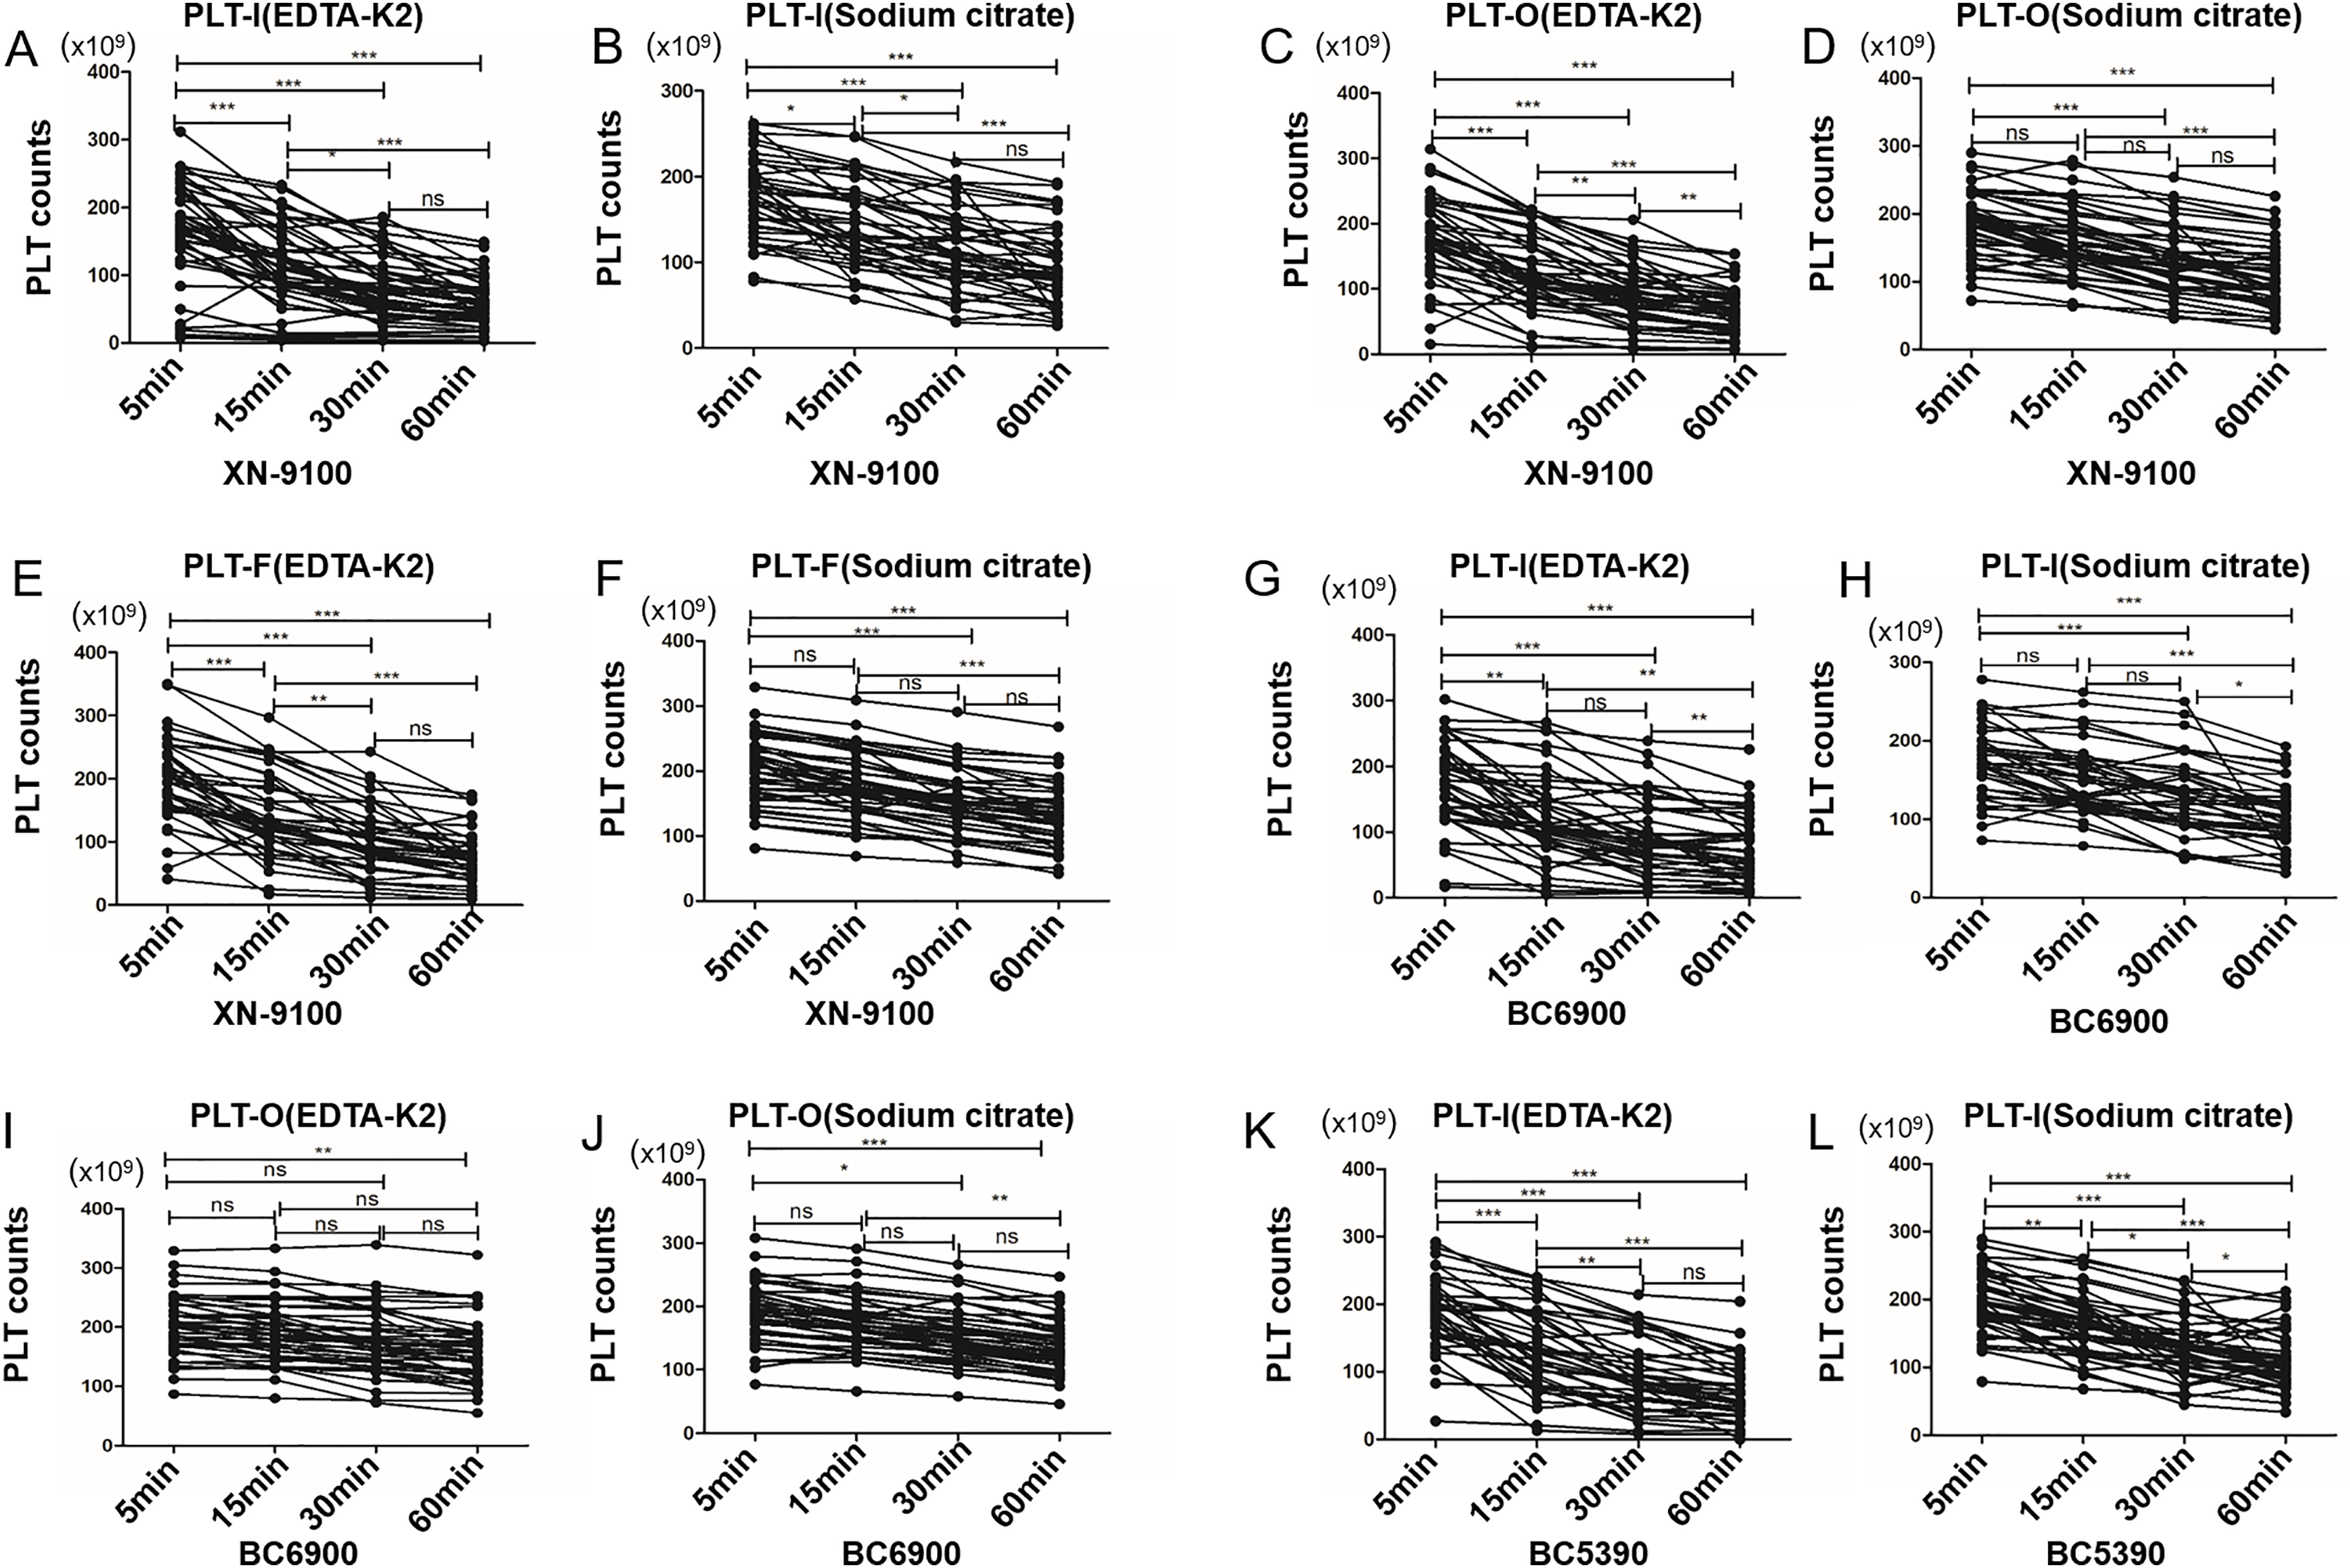
Influence of anticoagulant on PLT detection in EDTA-PTCP samples
Studies have shown that changing sodium citrate anticoagulant can correct PLT counts in EDTA-PTCP samples, however, we found that PLT aggregates may also occur in sodium citrate anticoagulated blood (Fig. 1A). Thus, we further analysed the effects of EDTA-K2 anticoagulant and sodium citrate anticoagulant on PLT counts in EDTA-PTCP samples. Our results showed that in the PLT-I, PLT-O, and PLT-F detection channels of the XN-9100 analyzer, PLT counts in the sodium citrate group were significantly higher than those in the EDTA-K2 group (Figs. 3A–3C). Similarly, we also found in the PLT-I channels of the BC-6900 and BC5390 analyzers that PLT counts in the sodium citrate group were higher than those in the EDTA-K2 group (Figs. 3D and 3F). However, in the BC-6900 PLT-O detection channel, PLT counts in the EDTA-K2 group were significantly higher than those in the sodium citrate group (Fig. 3E), indicated that the efficacy of the BC-6900 PLT-O channel for the correction of EDTA-PTCP is EDTA dependent.
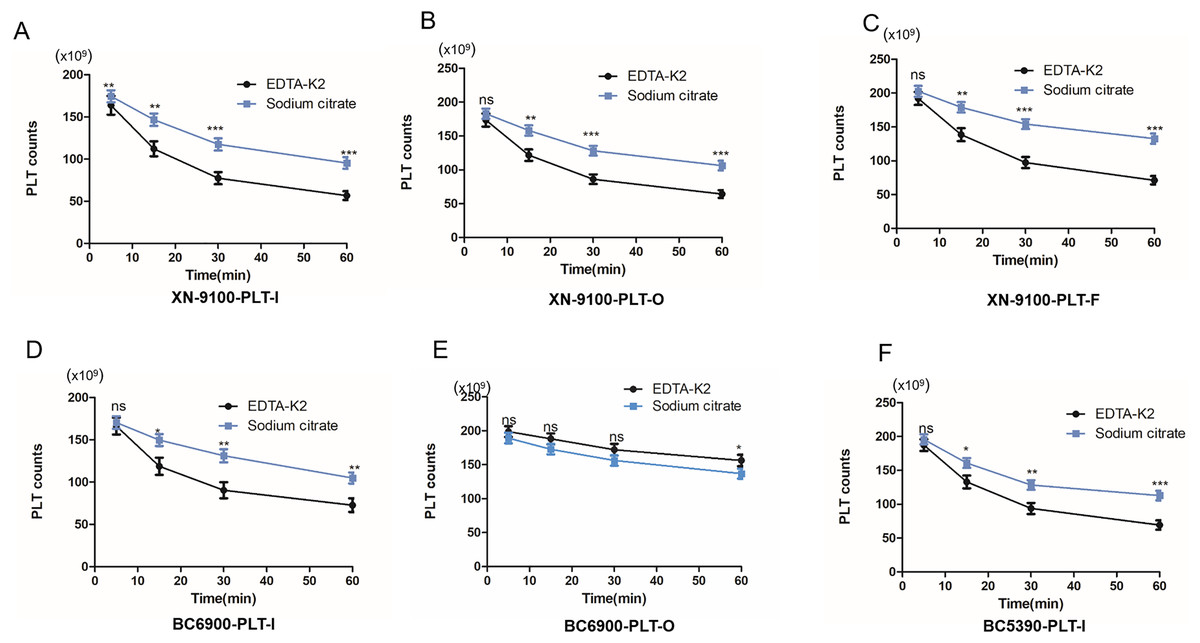
Figure 3: The effects of anticoagulant on the time course of platelet counts of EDTA-PTCP samples.
(A) The platelet counts of EDTA-PTCP samples in EDTA-K2 and sodium citrate group in XN-9100 PLT-I channel. (B and C) The platelet counts of EDTA-PTCP samples in EDTA-K2 and sodium citrate group in XN-9100 PLT-O and F channels. (D and E) BC-6900’s PLT-I and O channels of platelet counts of EDTA-K2 and sodium citrate group. (F) BC-5390’s PLT-I channel of platelet count of EDTA-K2 and sodium citrate group. *p < 0.05, **p < 0.01, ***p < 0.001.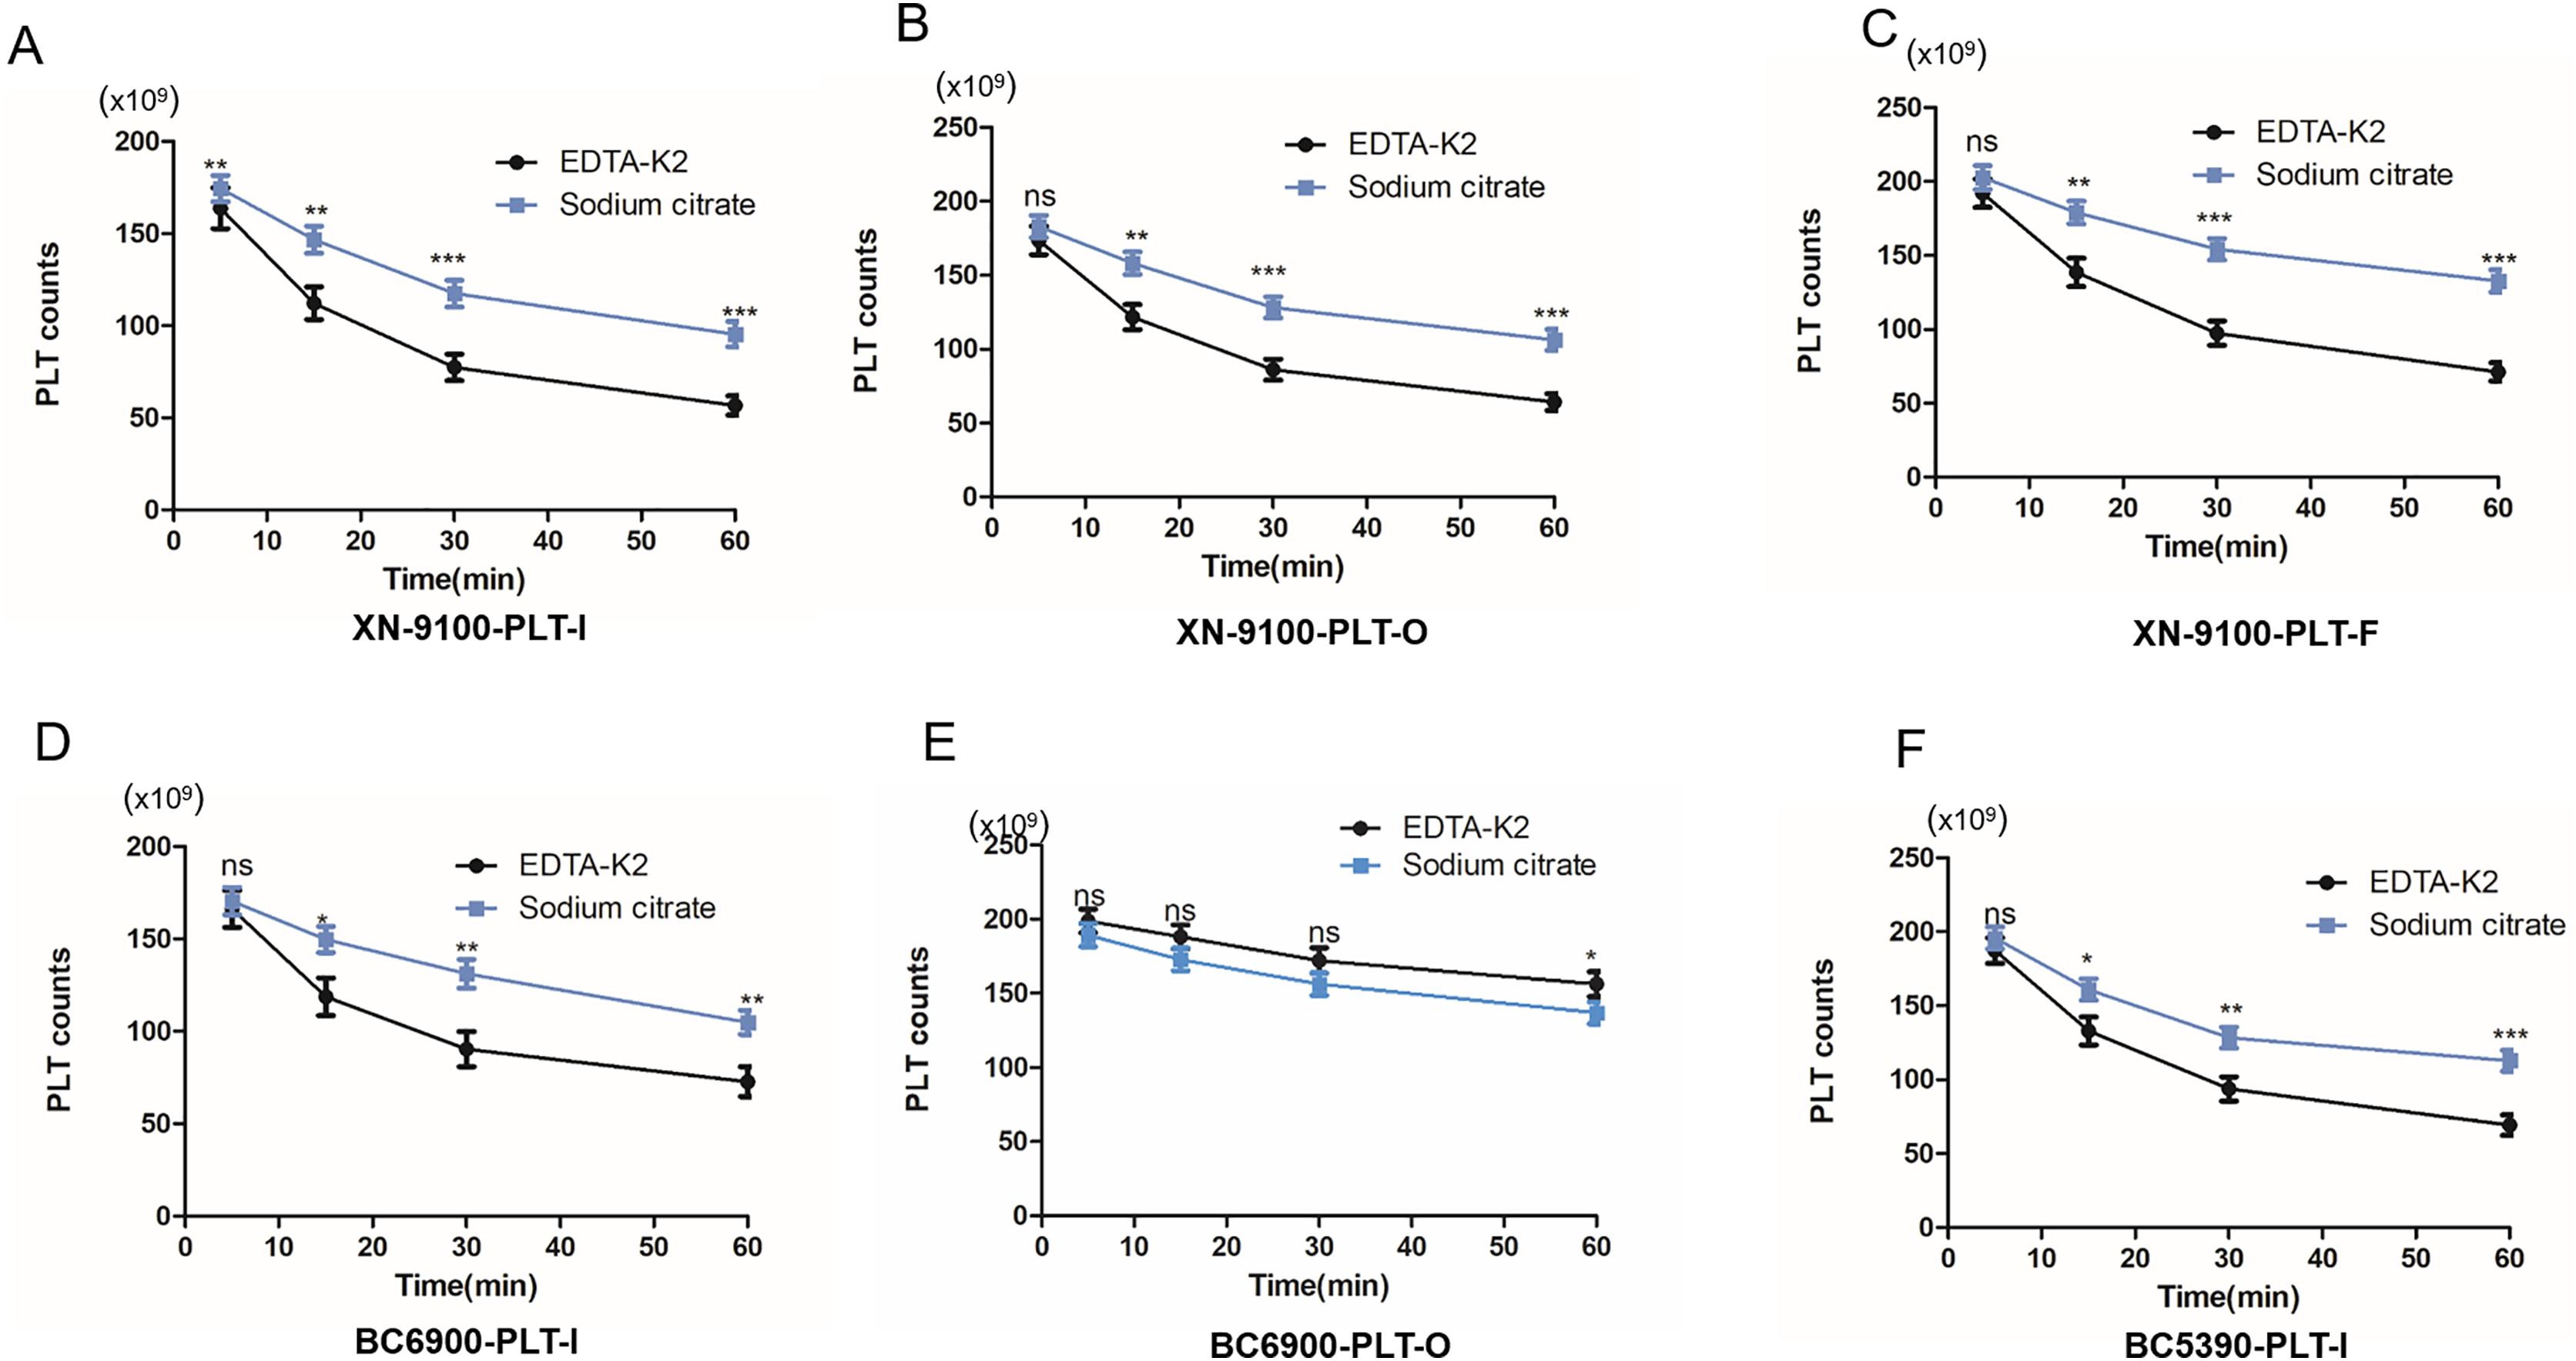
Effect of detection channel on PLT counts in EDTA-PTCP samples
The XN-9100 and BC-6900 haematology analysers have multiple PLT detection channels. Thus, we investigated whether different channels have an impact on PLT counts in the EDTA-PTCP samples. We found that the PLT-F detection channel of the XN-9100 analyser showed significantly better disaggregation of PLTs in EDTA-PTCP samples compared to the PLT-I and PLT-O channels in the sodium citrate groups (Fig. 4B). There was no significant difference in the disaggregation of PLTs between the PLT-I and PLT-O channels in EDTA-PTCP samples both in the EDTA-K2 group and sodium citrate group (Figs. 4A, 4B). The PLT-O detection channel of the BC6900 haematology analyser showed significantly better disaggregation of PLTs in the EDTA-PTCP samples compared to the PLT-I detection channel, with a more pronounced difference in the EDTA-K2 group (Figs. 4C and 4D).
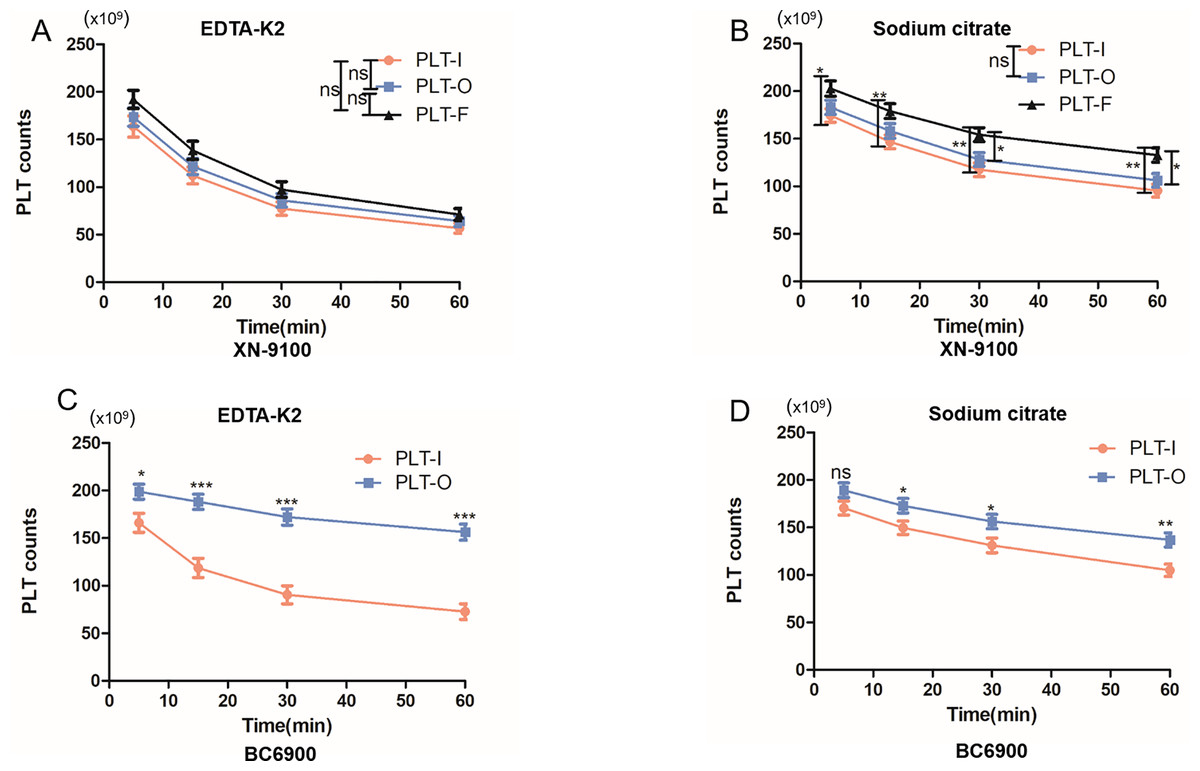
Figure 4: Comparable results of different channels on platelet counting in EDTA-PTCP samples.
(A) The platelet counting in XN-9100 PLT-I, O and F channels in EDTA-K2 group. (B) The platelet counting in XN-9100 PLT-I, O and F channels in sodium citrate group. (C and D) Comparable results between PLT-I and PLT-O channels of platelet counting on BC-6900 hematology analyzers. ns, not significant; *p < 0.05, **p < 0.01, ***p < 0.001.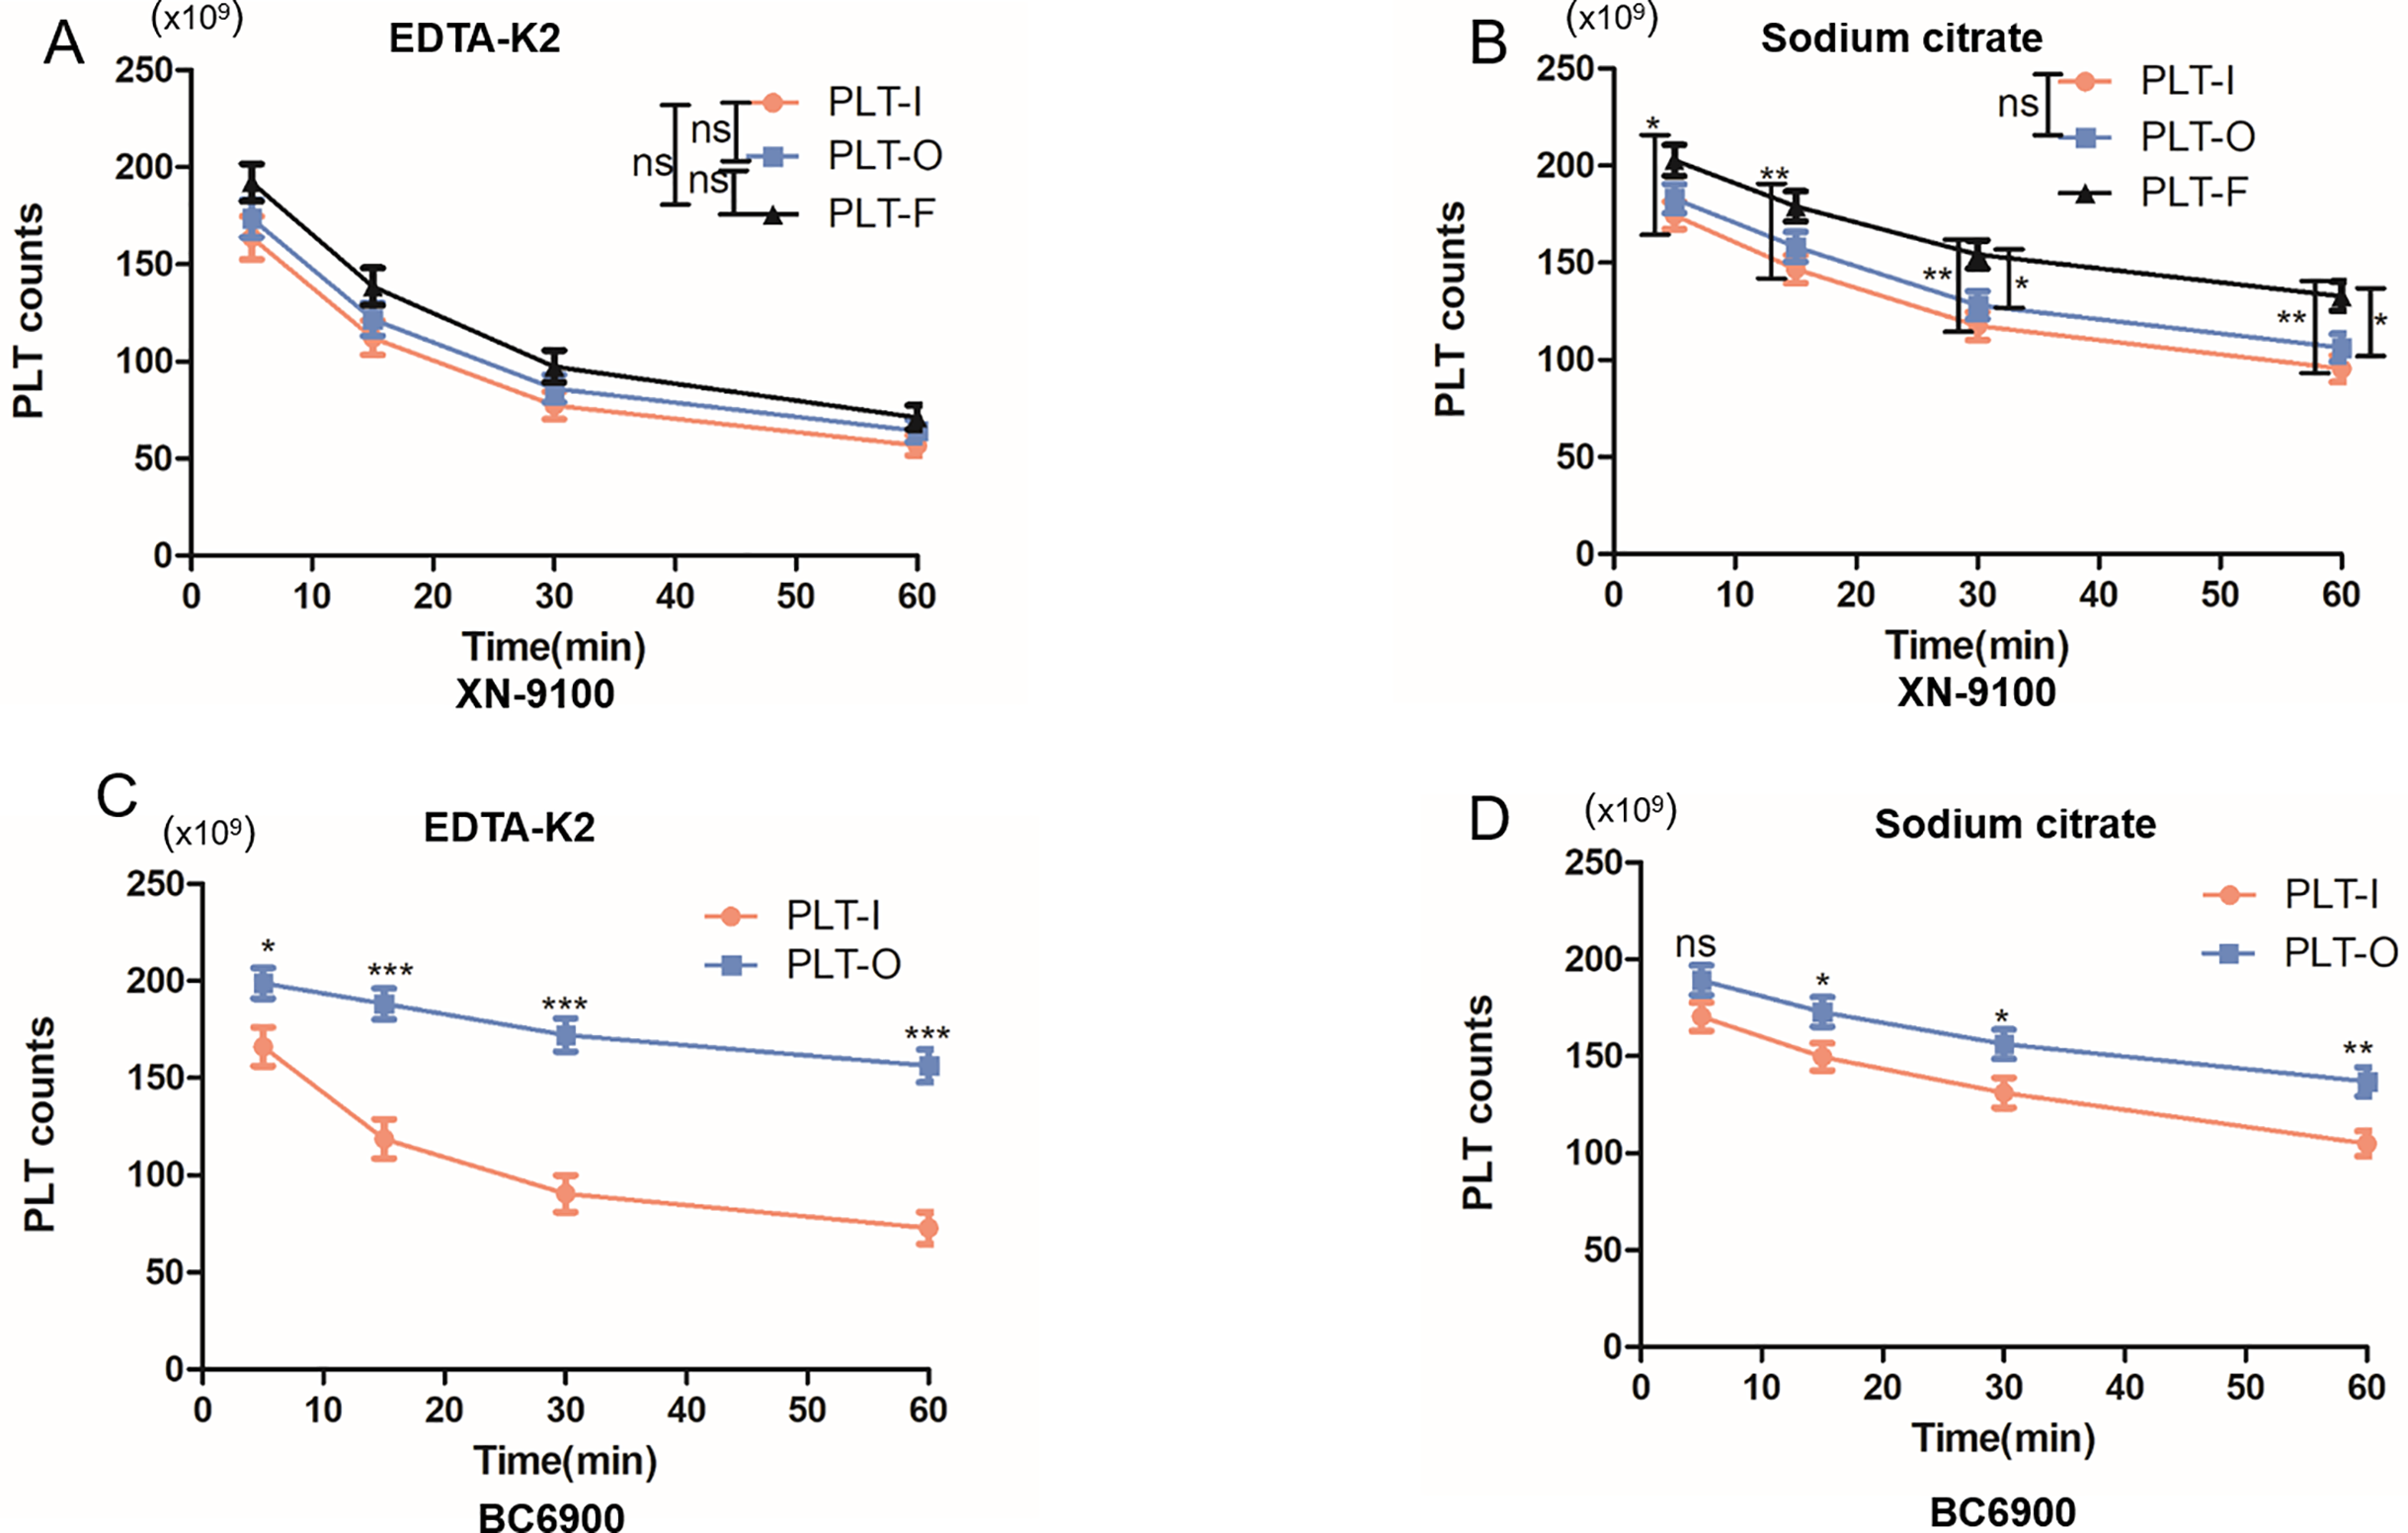
Effect of different hematology analyzers on platelet counts in EDTA-PTCP samples
In China, most laboratories, especially those in tertiary hospitals, are equipped with multiple haematology analysers to meet different clinical testing needs. Thus, we investigated which hasmatology analyser is more suitable for correcting PLT counts in EDTA-PTCP samples. The results revealed that there was no significant difference in PLT counts in the EDTA-PTCP samples in the PLT-I channels of the XN-9100, BC-6900, and BC5390 analyzers at each time point (Figs. 5A and 5B), suggesting that the PLT-I channel does not have a dissociation function. The PLT-O detection channel of the BC6900 analyser was significantly better than the PLT-O detection channel of the XN-9100 analyser (Figs. 5C and 5D). Additionally, in the EDTA-K2 anticoagulant group, the PLT-O detection channel of the BC-6900 analyser was significantly better than the PLT-F detection channel of the XN-9100 (Fig. 5E). In the sodium citrate anticoagulant group, there is no significant difference in PLT counts between the PLT-O and PLT-F detection channels for EDTA-PTCP samples (Fig. 5F).
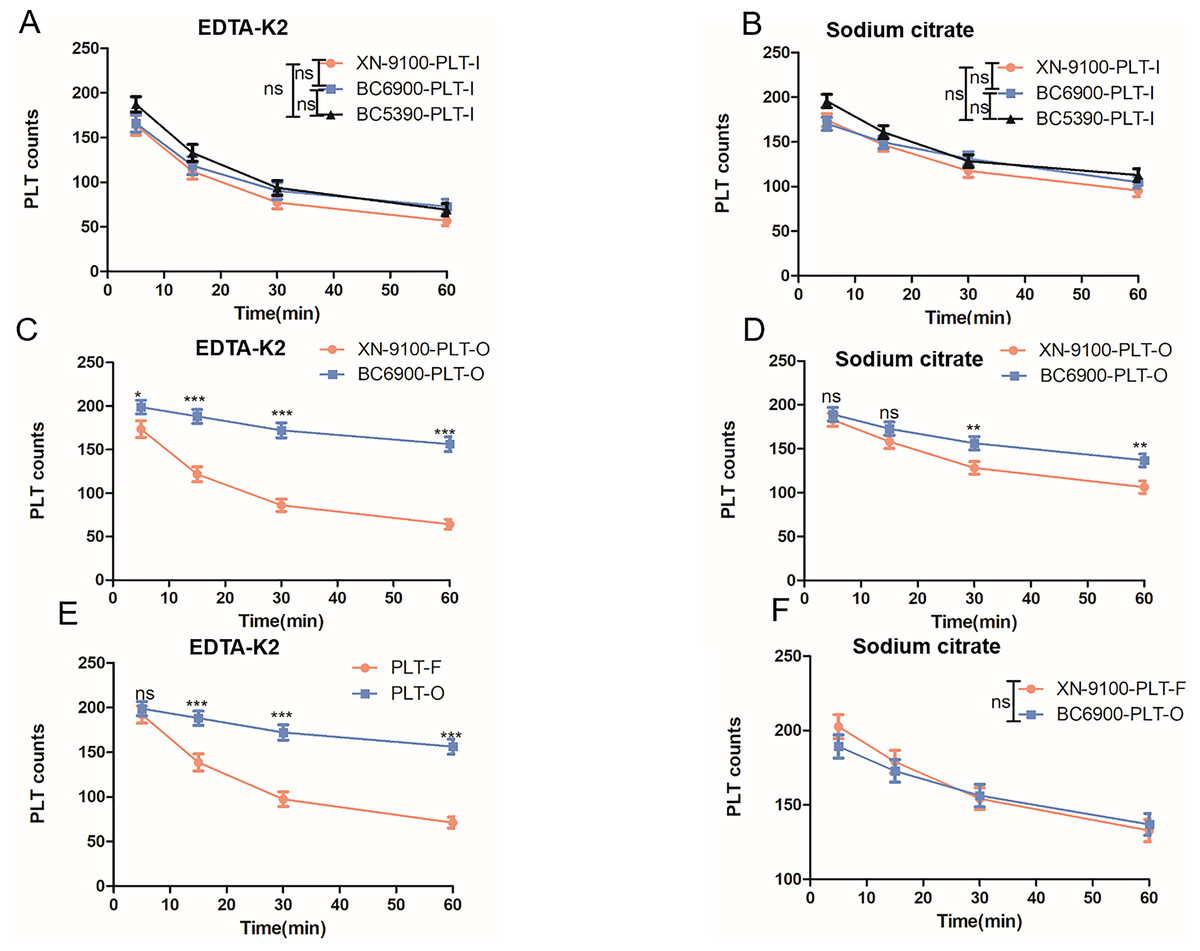
Figure 5: Comparable results of different hematology analyzers on platelet counting in EDTA-PTCP samples.
(A and B) The platelet counts of EDTA-PTCP samples in PLT-I channels of XN-9100, BC-6900 and BC-5390 in EDTA-K2 group (A) and sodium citrate group (B). (C and D) The platelet counts of EDTA-PTCP samples in PLT-O channels of XN-9100 and BC-6900 in EDTA-K2 group (C) and sodium citrate group (D). (E and F) Comparable results between XN-9100-PLT-F and BC-6900-PLT-O channels in EDTA-K2 group (E) and sodium citrate group (F). ns, not significant; *p < 0.05, **p < 0.01, ***p < 0.001.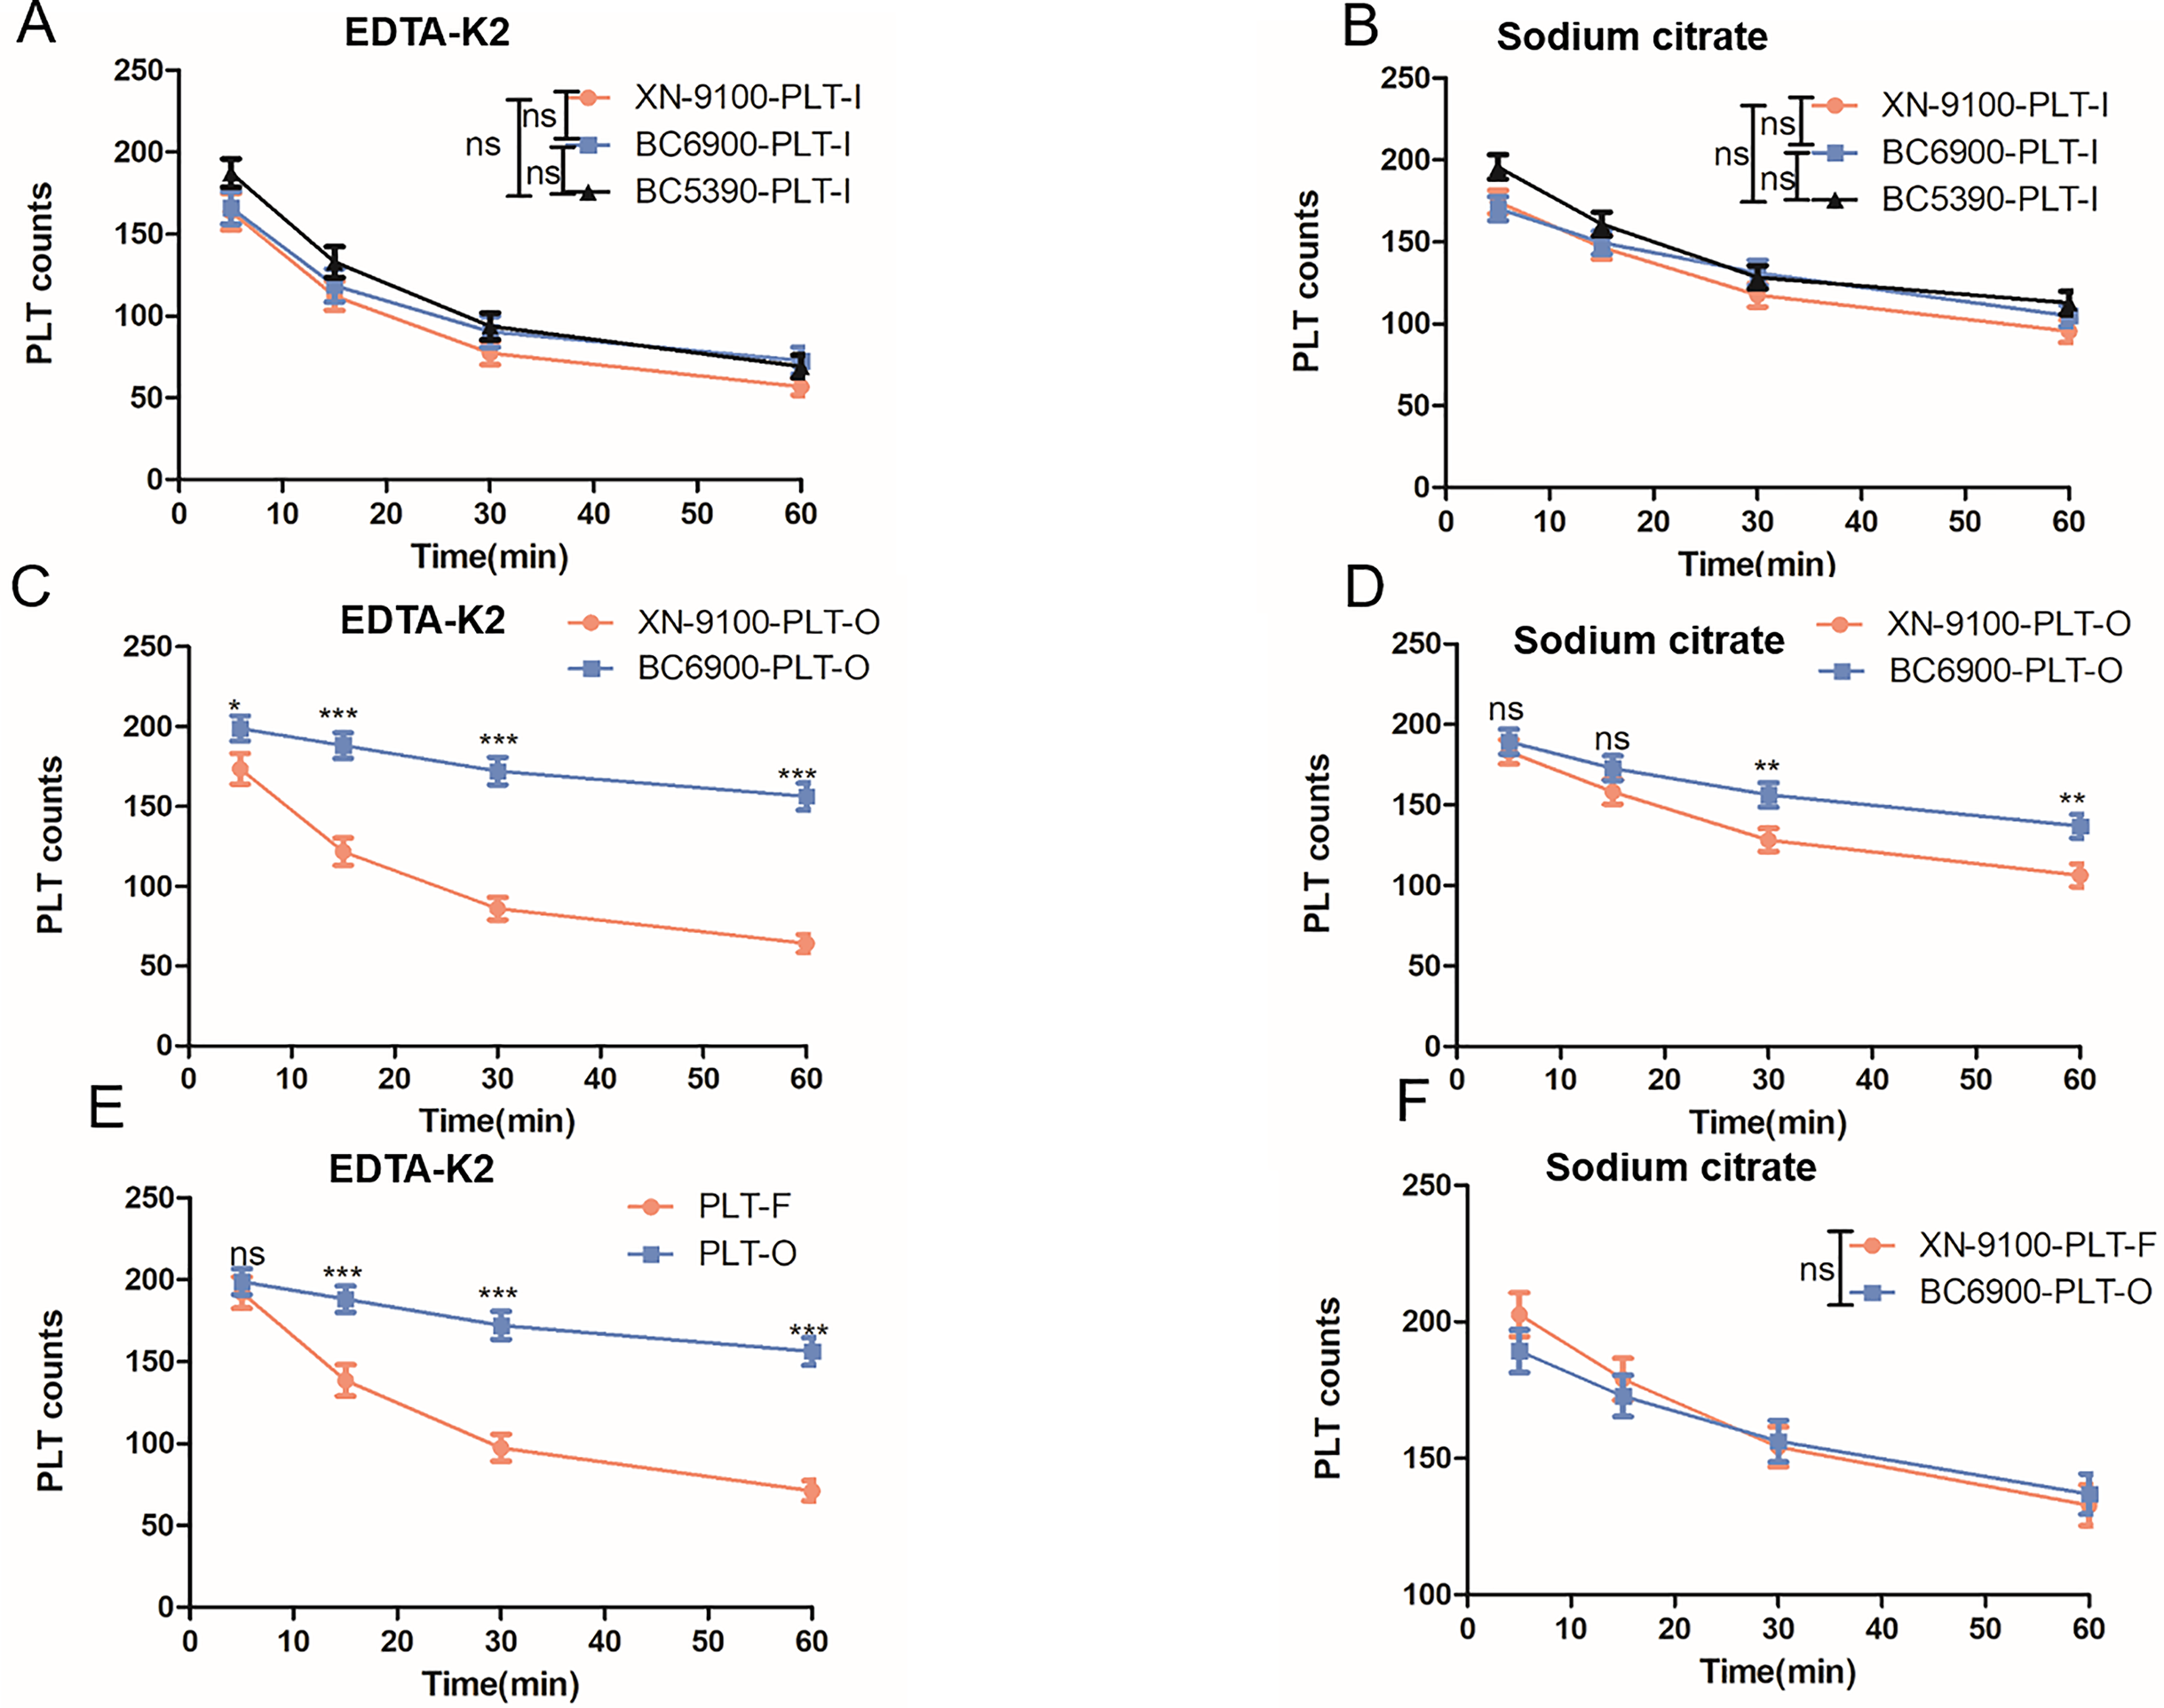
Discussion
EDTA-PTCP is a phenomenon of PLT aggregation in vitro, leading to falsely low PLT counts by automated haematology analysers (Tangella et al., 2023). The underlying molecular mechanism of action of EDTA-PTCP is currently unclear, but research has demonstrated that it is an EDTA-dependent PLT antibody-mediated PLT aggregation (Lardinois et al., 2021; Lippi & Plebani, 2012; Casonato et al., 1994). These antibodies directly target the hidden epitope membrane glycoprotein (GP) IIb/IIIa complex of platelets and form heterodimers which dependent on Ca2+ (Lardinois et al., 2021; Casonato et al., 1994; Chae et al., 2012; Rivas & González-Rodríguez, 1991; Golański et al., 1997). Previous studies have shown that EDTA-PTCP has no relationship with gender or age, but it can exist in individuals with different conditions (Tantanate, Talabthong & Lamyai, 2022; Bizzaro, 1995). Although EDTA-PTCP is not associated with any bleeding symptoms or PLT dysfunction, it can lead to unnecessary treatment and over-examination. Therefore, rapid differential diagnosis of EDTA-PTCP samples are crucial for clinical practice. In this study, the subjects included healthy check-up patients, those with malignant tumors, those with infectious diseases, and those with autoimmune diseases. We systematically compared the dissociative effect of several automatic blood routine analysers to select the best detection method and time for PLT detection in EDTA-PTCP samples.
We first observed that the longer the EDTA-PTCP samples are left at room temperature, the more severe the PLT aggregation (Figs. 1, 2). These results indicated that time has a significant impact on PLT counts in EDTA-PTCP samples, and PLT counts should be tested as soon as possible after blood collection. We subsequently compared the effects of EDTA-K2 and sodium citrate anticoagulants on PLT counts in EDTA-PTCP samples. Our results revealed that, in most of the detection channels, sodium citrate anticoagulant performed better compared to EDTA-K2 anticoagulant. Surprisingly, the PLT counts in the EDTA-K2 group were consistently higher than those in the sodium citrate group in the PLT-O channel of the BC6900 haematology analyser (Fig. 3). Therefore, changing the sodium citrate anticoagulant to correct the PLT count of the EDTA-PTCP sample is not applicable under all conditions, and also depends on the haematology analyser and detection channel. Moreover, a recent study also demonstrated that sodium citrate anticoagulant was only able to correct one-third of EDTA-PTCP samples (Sharif et al., 2023). Taken together, these results suggested that the storage time, anticoagulant, hematology analyzer, and detection channel had effects on the PLT count of EDTA-PTCP samples.
In China, many laboratories have one or more haematology analysers to meet different clinical needs, and some haematology analysers have multiple detection channels. We found that the detection effect of the PLT-F channel was superior to the PLT-O and PLT-I channels in the XN-9100 haematology analyser. In addition, the dissociation effect of the PLT-O channel was better than that of the PLT-I channel in BC6900 haematology analyser. Moreover, the dissociation effect in the EDTA-K2 group was more obvious than that in the sodium citrate group. These results showed that selecting appropriate detection channels is crucial for PLT counts in EDTA-PTCP samples. Finally, we compared the dissociation effects of different haematology analysers in EDTA-PTCP samples. We demonstrated that there was no significant difference in the detection of PLTs in the PLT-I channels of the XN-9100, BC6900 and BC5390 analysers in the EDTA-PTCP samples. Moreover, the dissociation effect of the PLT-O channel in the BC6900 haematology analyser was significantly better compared to the XN-9100’s PLT-O and PLT-F channels in the EDTA-K2 group. These results demonstrated that the PLT-O channel of Mindray hematology analyzer showed a highly effective platelet deaggregation function for EDTA-PTCP samples. When rechecking PLT counts in EDTA-PTCP samples, in addition to considering the time factor, the influence of anticoagulants, instruments, and detection channels on PLT counts should also be considered.
Conclusions
In summary, this study systematically compared the effects of time, anticoagulants, haematology analysers, and different detection channels on the PLT count of EDTA-PTCP samples. There are many other methods, such as peripheral blood smear, aminoglycosides, sodium fluoride to correct PLT counts in EDTA-PTCP samples (Baccini et al., 2020; Sakurai et al., 1997; Ahn et al., 2002; Chen, Fei & Ling, 2012); however, we believe that haematology analysers are more quickly than these methods, especially for large-scale hospitals. Therefore, a suitable haematology analyser and detection channel should be selected to correct PLT counts in EDTA-PTCP samples. Our results confirm that the PLT-F channel of the XN-9100 analyser and the PLT-O channel of the BC6900 analyser have a good correction effect on PLT counts in EDTA-PTCP samples. Although we do not know how these channels dissociate PLT clumping, we believe that the dissociation was associated with heat, shock and even the addition of certain drugs. Different laboratories can choose the suitable automatic blood cell analyzer for their own situation.