
Efficacy of novel activated bamboo charcoal in reducing uremic toxins and enhancing kidney function in chronic kidney disease patients: a pilot randomized controlled trial
- Published
- Accepted
- Received
- Academic Editor
- Cristina Capusa
- Subject Areas
- Clinical Trials, Gastroenterology and Hepatology, Nephrology
- Keywords
- Activated bamboo charcoal, Probiotics, Chronic kidney disease, Indoxyl sulphate, p-Cresyl sulfate, TMAO, Phenyl sulfate
- Copyright
- © 2025 Hung et al.
- Licence
- This is an open access article distributed under the terms of the Creative Commons Attribution License, which permits using, remixing, and building upon the work non-commercially, as long as it is properly attributed. For attribution, the original author(s), title, publication source (PeerJ) and either DOI or URL of the article must be cited.
- Cite this article
- 2025. Efficacy of novel activated bamboo charcoal in reducing uremic toxins and enhancing kidney function in chronic kidney disease patients: a pilot randomized controlled trial. PeerJ 13:e19007 https://doi.org/10.7717/peerj.19007
Abstract
Background
The role of uremic toxins in the progression of chronic kidney disease (CKD) and novel treatments to mitigate their effects are critical areas of research. This pilot study investigated the efficacy of a novel activated bamboo charcoal and/or probiotics in reducing uremic toxins and improving renal function in CKD patients.
Methods
This prospective, randomized, open, blinded end-point (PROBE) study included patients with stage 3 CKD. Patients were randomly assigned to one of four groups: activated bamboo charcoal (ABC), probiotics, ABC with probiotics, or standard treatment for 3 months.
Results
A total of 46 patients were enrolled (mean age 66.7 ± 11.5 years, 71.7% male). The ABC and ABC with probiotics groups showed a significant reduction in serum levels of the uremic toxins trimethylamine N-oxide (TMAO), p-cresyl sulfate (PCS), indoxyl sulfate (IS), and phenyl sulfate (PS) after 3 months of treatment (all p < 0.05). There was a particularly pronounced decrease in the percentage of IS in both the ABC group (−23.9 ± 28.9% vs. 33.9 ± 63.4%, p = 0.005) and the ABC with probiotics group (−29.3 ± 30.6% vs. 33.9 ± 63.4%, p = 0.009). The eGFR change ratio also significantly improved in the ABC group compared to the control group (4.6 ± 10.2% vs. −8.6 ± 12.5%, p = 0.011). However, the probiotics group did not exhibit a similar reduction in uremic toxins or an improvement in the eGFR.
Conclusion
This study suggested that ABC significantly reduced uremic toxins and might have potential in improving eGFR in CKD stage 3 patients over a 3-month period. These findings suggest a potential protective effect of ABC on kidney function, highlighting the need for further large-scale, long-term randomized controlled trials to confirm these results.
Introduction
Several extensively discussed uremic and vascular toxins that are derived from gut microbiota metabolism, including phenolic compounds such as p-cresyl sulfate (PCS), indoles such as indoxyl sulfate (IS), aromatic organosulfates, such as phenyl sulfate (PS), and trimethylamine N-oxide (TMAO), are correlated with increased cardiovascular mortality, kidney function deterioration, and metabolic perturbations (Szymanski et al., 1985; Nemet et al., 2023; Van Buren et al., 2021; Meijers et al., 2008; Barreto et al., 2009).
The decline in the estimated glomerular filtration rate (eGFR) observed in chronic kidney disease (CKD) is associated with elevated levels of uremic toxins such as IS, PS, and PCS (Pignanelli et al., 2019). The accumulation of these toxins accelerates disease progression by inducing functional renal impairment, fibrosis, inflammation, and oxidative stress (Lekawanvijit et al., 2012).
Orally administered charcoal adsorbent AST-120 may reduce systemic toxin absorption by sequestering toxins in the gastrointestinal tract (Fujii et al., 2009), thereby potentially slowing disease progression. However, it may not effectively prevent CKD progression to end-stage renal disease (ESRD) (Schulman et al., 2006), as it is typically retained in the stomach and proximal small intestine after ingestion and the indole toxins are predominantly produced in the colon (Schulman et al., 2015). Probiotics, prebiotics, and synbiotics have emerged as potential therapies to restore gut microflora balance and mitigate CKD-related complications (Cooper et al., 2023; Sumida et al., 2023). Studies have shown promising results, including reductions in circulating IS and PCS concentrations in CKD patients (Chen et al., 2022). However, the efficacy of these interventions on CKD progression remains uncertain.
In vitro and in vivo findings suggest that activated bamboo charcoal (ABC) may have the potential to mitigate kidney function decline and reduce levels of uremic toxins in rats with CKD (Lin et al., 2020). In addition, ABC had larger porosity and higher surface area as compared to AST-120 based on scanning electron microscope (Lin et al., 2020). This area of inquiry has garnered significant research attention due to its potential to delay the onset of dialysis.
This study aimed to evaluate the therapeutic efficacy of a novel oral adsorbent made from ABC, with or without probiotics, on uremic toxin levels in a multicenter, pilot, randomized, controlled trial (RCT). This approach built on the established efficacy of the gut microbiome in adsorbing uremic toxins and/or restoration within the gastrointestinal tract. By reducing toxin absorption and blood concentration, the intervention was expected to slow the decline in the eGFR.
Materials and Methods
This trial was conducted across five medical centers: National Taiwan University Hospital, Far Eastern Memorial Hospital, E-Da Hospital, Kaohsiung Medical University Hospital, and Taoyuan Min Sheng General Hospital. The study was designed as a prospective, randomized, open-labeled, blinded end-point (PROBE) trial conducted over a period of 3 months, targeting patients with stage 3 CKD (eGFR 30 < eGFR < 60 ml/min/1.73 m2). Exclusion criteria included individuals with baseline eGFR < 30 ml/min/1.73 m2, severe malnutrition (albumin < 2.0 g/dL), significant anemia or active gastrointestinal bleeding (hemoglobin < 8 g/dL), and conditions such as peptic ulcer, esophageal varices, ileus, or fasting status. eGFR was calculated based on the Modification of Diet in Renal Disease (MDRD) equation=175*Scr−1.154*Age−0.203*0.742 (if female). Additionally, patients with a history of gastrointestinal surgery, chronic constipation (managed with oral laxatives), major hemorrhage requiring blood transfusion, solid organ or hematological transplantation, oliguric kidney injury (<500 cc/day), or evidence of obstructive kidney injury or polycystic kidney disease were excluded. Moreover, individuals who had received antibiotic or probiotic treatment within the 2 weeks preceding enrollment and during the follow-up period were excluded.
Procedure
Patients were randomized into one of four groups based on a table of random numbers: the ABC-treatment group (N = 12), the ABC with probiotics group (N = 12), the probiotics group (N = 11), and the usual care group (N = 11) (Fig. 1). Those in the ABC-treatment group received CharXenPlus 4 g (which contained 2 g of activated bamboo charcoal) (MAC Biomedical Co., New Taipei City, Taiwan) three times daily for 3 months. Patients in the ABC with probiotics group received CharXenPlus along with probiotics, i.e., APL-MIX2 (CharXprob) 0.8 g (which contained Lactobacillus plantarum and Lactobacillus paracasei, each with a total colony count of 4.8 × 10¹⁰) (Grape King Bio Ltd., Taoyuan City, Taiwan) once daily. The usual-care group received standard clinical care as guided by the KDIGO CKD guidelines (Kidney Disease: improving global outcomes CKDWG, 2024). All blood samples were gathered and sent to National Taiwan University Hospital for further examination. The study was performed according to the principles of the Declaration of Helsinki and was approved by the ethics committee of the National Taiwan University Hospital in Taiwan (NTUH-REC No: 202002030RINA). The randomized controlled trial registration number is NCT04819217. All patients gave written informed consent before the study was initiated.
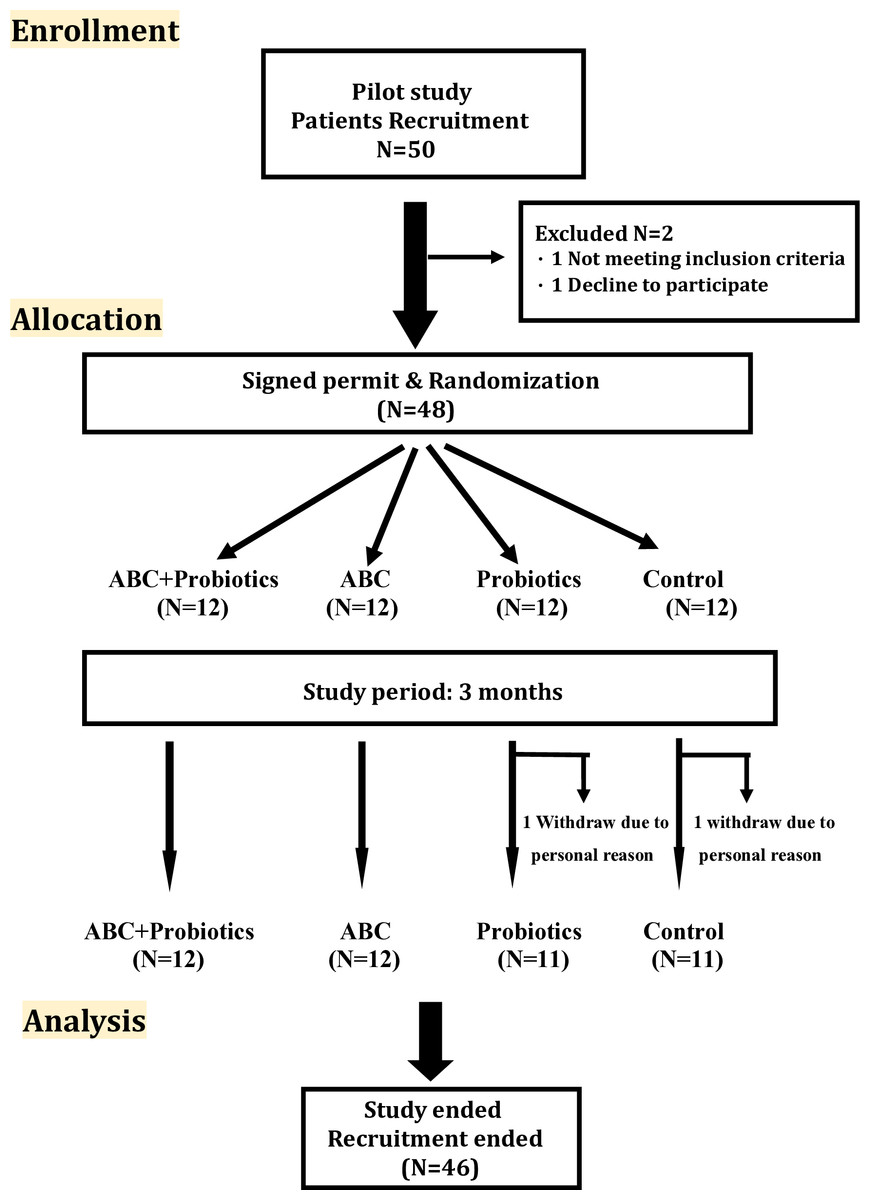
Figure 1: Flow diagram of the CONSORT study.
The stages of the CONSORT study, beginning with the recruitment of the patients, followed by their allocation into intervention, and analysis.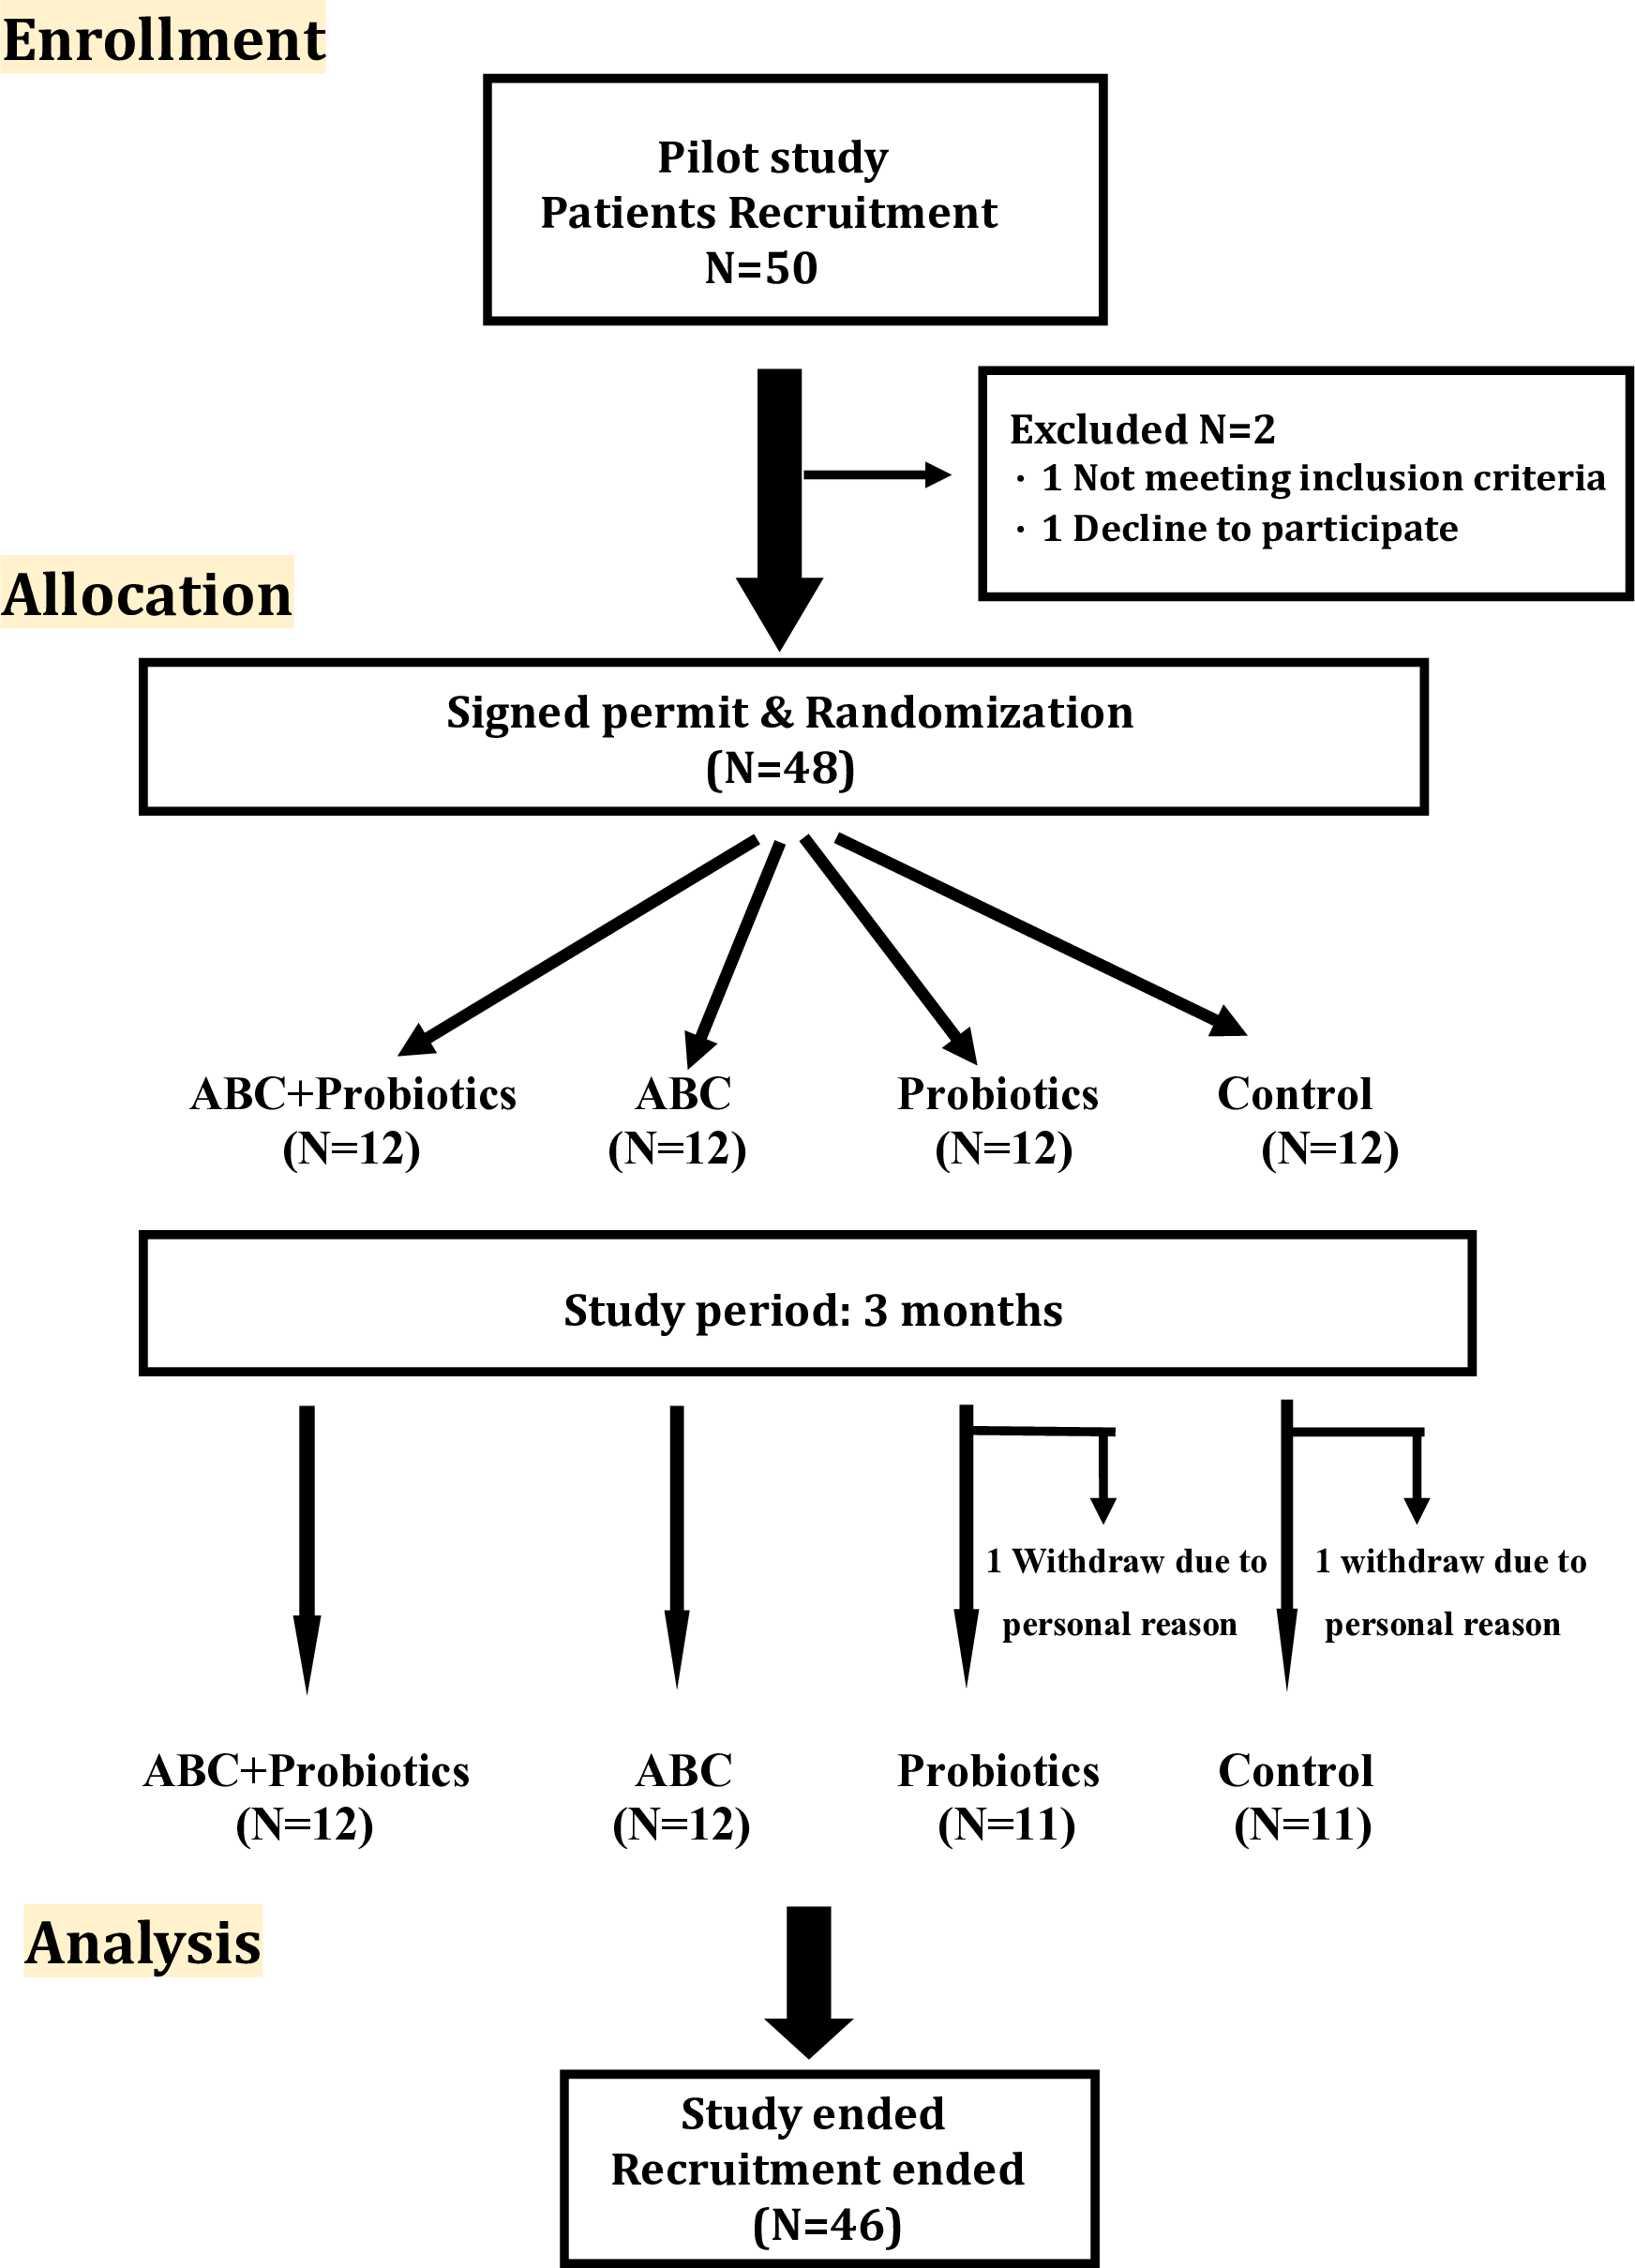
Activated bamboo charcoal
The preparation of the novel CharXgenPlus treatment involved extracting and refining activated charcoal from locally sourced bamboo in Taiwan, which thrives in the region’s subtropical conditions (Cooper et al., 2023). To address the issue of activated charcoal adherence to the gastrointestinal wall, negatively charged and biocompatible sodium alginate was utilized as a coating material. This coating facilitates the formation of millispheres, preventing the charcoal from adhering to the mucosal wall upon entering the intestinal tract. The mesoporous structure of bamboo charcoal generates a large surface area to absorb toxins, and through activation at high temperatures, its porous nature can be further enhanced. This process also leads to the formation of functional groups such as COOH and OH on its surface, enabling the activated charcoal to effectively bind to toxic substances (Cooper et al., 2023).
Probiotics
A previous study demonstrated that high dosages of Lactobacillus plantarum and Lactobacillus paracasei could reduce levels of both creatinine (Cr) and blood urea nitrogen (BUN) in a pig model with cisplatin-induced CKD (Lee et al., 2020). Based on these findings, this prospective study utilized a probiotic combination of Lactobacillus plantarum and Lactobacillus paracasei, each with a total colony forming unit of 4.8 × 10¹⁰/0.8 g.
Outcomes of interests
The primary outcomes of this study were the percentage changes in the eGFR and uremic or vascular toxin levels, including IS, PCS, PS, and TMAO, before and after treatment. Secondary outcomes encompassed the absolute changes in the eGFR and these uremic or vascular toxin levels pre- and post-treatment. Safety was rigorously assessed by monitoring adverse events such as diarrhea, constipation, and alterations in bowel habits, complemented by regular laboratory examinations.
Laboratory measurement
Laboratory assessments included measurements of serum BUN, Cr, eGFR, proteinuria, lipid profile, aspartate aminotransferase (AST), albumin, glucose levels, HbA1c, electrolytes, hemogram, and levels of IS, PCS, PS, and TMAO. The serum levels of IS, PCS, PS, and TMAO were determined by liquid chromatography–mass spectrometry (LC: Exion LC, MS: Triple Quad 5500, SCIEX, Framingham, MA, USA). Samples with levels exceeding the standard curve were diluted accordingly. Results were quantified in terms of concentrations (parts per billion, µg/L).
Statistical analysis
Each group’s results are presented as the median (Q1–Q3) in Table 1 and the percentage change before and after 3 months treat is presented as mean ± standard deviation (SD). To delineate the demographic and baseline clinical characteristics for each treatment group, descriptive statistics were employed. The Kruskal–Wallis H test was utilized to examine the difference among these groups (ABC-treatment group, ABC with probiotics group, probiotics group and usual care group) for continuous data. To rectify skewness, a log-transformation was performed on the serum uremic toxin levels. The R function network plot was used to visualize and explore correlations (r). The data analysis was conducted using R software, version 4.0.1 (R Core Team, 2020). A p-value of less than 0.05 was established as the threshold for statistical significance.
| Predictors | Alln = 46 | A+Pn = 12 | An = 12 | Pn = 11 | Cn = 11 | Kruskal–Wallis H test |
|---|---|---|---|---|---|---|
| Age, year | 68 [61–74] | 71 [61.50–76.50] | 66 [61.50–71] | 72 [56–80] | 65 [53–69] | 0.315 |
| Male (%) | 71.7% | 58.3% | 83.3% | 72.7% | 72.7% | NA |
| DM (%) | 20(43.5%) | 3 (25%) | 7 (58.3%) | 4 (36.4%) | 6 (54.6%) | NA |
| TMAO, µg/L | 840.25 [548.80–1,160] | 691.90 [474.90–1,014] | 821.30 [562.15–998.50] | 1,034 [767–1,322] | 738.10 [517–1,633] | 0.500 |
| PCS, µg/L | 4,133.95 [2,357.30–8,610.70] | 3,400.90 [2,442.45–4,194.85] | 4,205.85 [1,904.95–7,447.40] | 8,865 [4,801.60–13,862] | 3,162.50 [1,279.40–7,772.20] | 0.162 |
| IS, µg/L | 2,778.20 [1,477.60–3,679.80] | 2,362.05 [1,484.80–3,043.55] | 3,226.60 [1,992.75–4,199.30] | 2,792.10 [1,235.50–3,838.30] | 1,833.50 [779.20–3,578] | 0.348 |
| PS, µg/L | 1,876.35 [935.30–4,319.40] | 2,729.75 [1,570.90–6,874.40] | 2,062.30 [1,091.65–7,824.60] | 1,497.40 [691.70–2,910.30] | 1,456.20 [636.80–2,329.60] | 0.271 |
| CRE, mg/dL | 1.49 [1.30–1.70] | 1.50 [1.32–1.76] | 1.49 [1.36–1.68] | 1.60 [1.30–1.80] | 1.44 [1.30–1.70] | 0.919 |
| eGFR, mL/min/1.73 m2 | 43.76 [39.38–52.10] | 42.44 [39.45–47.45] | 48.80 [39.48–55.25] | 39.60 [35.50–55.90] | 48 [43.62–53.80] | 0.289 |
| UACR, mg/g | 444.50 [195–683] | 524.90 [260.95–780] | 405.50 [226.01–820.73] | 394 [156–483.60] | 466.75 [195–660.90] | 0.764 |
| TC, mg/dL | 165.50 [139–187] | 153 [136–166] | 170.35 [144–199.50] | 139 [132–205] | 169.70 [158–184] | 0.408 |
| HDL, mg/dL | 46.55 [40–52] | 44.80 [41.50–50] | 47.96 [36–55.80] | 46.10 [43–60] | 47.91 [39–54.60] | 0.918 |
| LDL, mg/dL | 94.56 [76–106.50] | 92 [75.40–124] | 98.50 [81–112.50] | 79 [58.10–105] | 94.56 [81–106] | 0.405 |
| TG, mg/dL | 122.48 [73–163] | 90.50 [68.50–136] | 124.48 [94–186.50] | 77 [68–162] | 133 [67–170] | 0.425 |
| BUN, mg/dL | 25.36 [22–29.20] | 26.10 [22.95–31.40] | 24.30 [19.80–25.76] | 26.40 [21.50–39.80] | 27.30 [21.50–29.20] | 0.478 |
| AC_sugar, mg/dL | 105 [93–133] | 99.50 [94.50–129.81] | 112.50 [92.50–131] | 126 [82–160] | 110 [101–128] | 0.979 |
| HbA1c (%) | 6.66 [5.60–7.30] | 6.15 [5.75–7.25] | 6.48 [5.70–7.40] | 6.80 [5.50–7.70] | 6.40 [5.40–7.10] | 0.747 |
| Albumin, mg/dL | 4.28 [4.20–4.50] | 4.06 [3.80–4.27] | 4.35 [4.27–4.50] | 4.25 [4–4.50] | 4.30 [4.25–4.60] | 0.013 |
| AST, U/L | 22 [18–28] | 20 [14.50–24.50] | 24.50 [18–40.50] | 22 [18–23] | 26 [20–34] | 0.213 |
| UA, mg/dL | 7.15 [5.60–8.10] | 7.50 [5.80–7.85] | 7.25 [6.10–8.35] | 7.20 [6.20–8.40] | 5.80 [5.30–8.50] | 0.911 |
| Na, mmol/L | 140 [139–142] | 142 [139–142.50] | 140 [139–142] | 139 [138–142] | 142 [140–143] | 0.317 |
| K, mmol/L | 4.20 [4–4.50] | 4.25 [4–4.40] | 4.10 [4.05–4.35] | 4.50 [4.20–4.80] | 4.10 [3.80–4.60] | 0.151 |
| P, mg/dL | 3.50 [3.30–3.80] | 3.60 [3.30–3.95] | 3.44 [3.10–3.70] | 3.50 [3.30–3.60] | 3.49 [2.90–3.80] | 0.669 |
| RBC (×106/µL) | 4.47 [3.76–4.91] | 3.97 [3.49–4.81] | 4.48 [4.22–4.91] | 4.55 [3.85–4.92] | 4.60 [3.58–5.17] | 0.640 |
| WBC (×103/µL) | 6.38 [5.08–7.60] | 5.60 [4.40–7.53] | 6.49 [5.73–8.20] | 6.16 [4.61–7.11] | 7.25 [5.26–8.17] | 0.407 |
| Platelet (×103/µL) | 219.37 [187–262] | 199.50 [185–272.50] | 220.74 [198–236] | 216 [185–237] | 257 [179–276] | 0.521 |
| Hct (%) | 40.58 [35.60–43.60] | 37.45 [31.80–40.40] | 40.58 [39.30–47.15] | 41.70 [35.60–44.50] | 42.30 [34.50–44.20] | 0.125 |
| SBP, mmHg | 139.5 [134–155] | 140 [134–162] | 150 [136–169] | 138 [126–141] | 137 [120–150] | 0.446 |
| DBP, mmHg | 78[73-89] | 75 [74–90] | 84 [80–89] | 74 [73–76] | 73 [70–91] | 0.310 |
| HR, beats/ min | 82.5 [71–91] | 83 [71–90] | 77 [63–90] | 80 [77–95] | 88 [78–93] | 0.463 |
Notes:
- ACEI
-
Angiotensin converting enzyme inhibitor
- ARB
-
Angiotensin receptor blocker
- SGLT2i
-
sodium-glucose cotransporter 2 inhibitor
- AC_sugar
-
ante cibum sugar
- ANOVA
-
Analysis of Variance
- BUN
-
blood urea nitrogen
- Ca
-
calcium
- DM
-
diabetes mellitus
- eGFR
-
estimated glomerular filtration rate
- ALT
-
alanine aminotransferase
- HbA1c
-
hemoglobin A1c
- HDL
-
high-density lipoprotein
- Hct
-
hematocrit
- IS
-
indoxyl sulfate
- LDL
-
low-density lipoprotein
- PCS
-
p-cresyl sulfate
- PS
-
phenyl sulfate
- RBC
-
red blood cell count
- TMAO
-
trimethylamine N-oxide
- TC
-
total cholesterol
- TG
-
triglycerides
- UACR
-
urinary albumin-to-creatinine ratio
- WBC
-
white blood cell count
Results
Baseline characteristics
Table 1 showed the baseline characteristics of all study groups. During the study period, 46 patients (mean 66.67 ± 11.50, male, 71.7%) were enrolled. Of these, 12 CKD patients were randomized to the ABC+probiotics group (mean age 68.8 ± 10 years, 58.3% male), 12 to the ABC group (mean age 65.9 ± 7.9 years, 83.3% male), 11 to the probiotics group (mean age 70.6 ± 13.6 years, 72.7% male), and 11 to the usual-care group (mean age 61.2 ± 13.3 years, 72.7% male). There was no significant difference in baseline levels of creatinine, eGFR, proteinuria, AST, glucose, or uric acid, or in the DM ratio, lipid profile, blood pressure, percentage of using angiotensin converting enzyme inhibitor (ACEI)/angiotensin receptor blocker (ARB) or sodium-glucose transporter 2 inhibitor (SGLT2i) among the four groups. From the group analysis, the baseline levels of albumin were different among all groups (p = 0.013); however, the post hoc analysis showed that there was no difference compared to the control group.
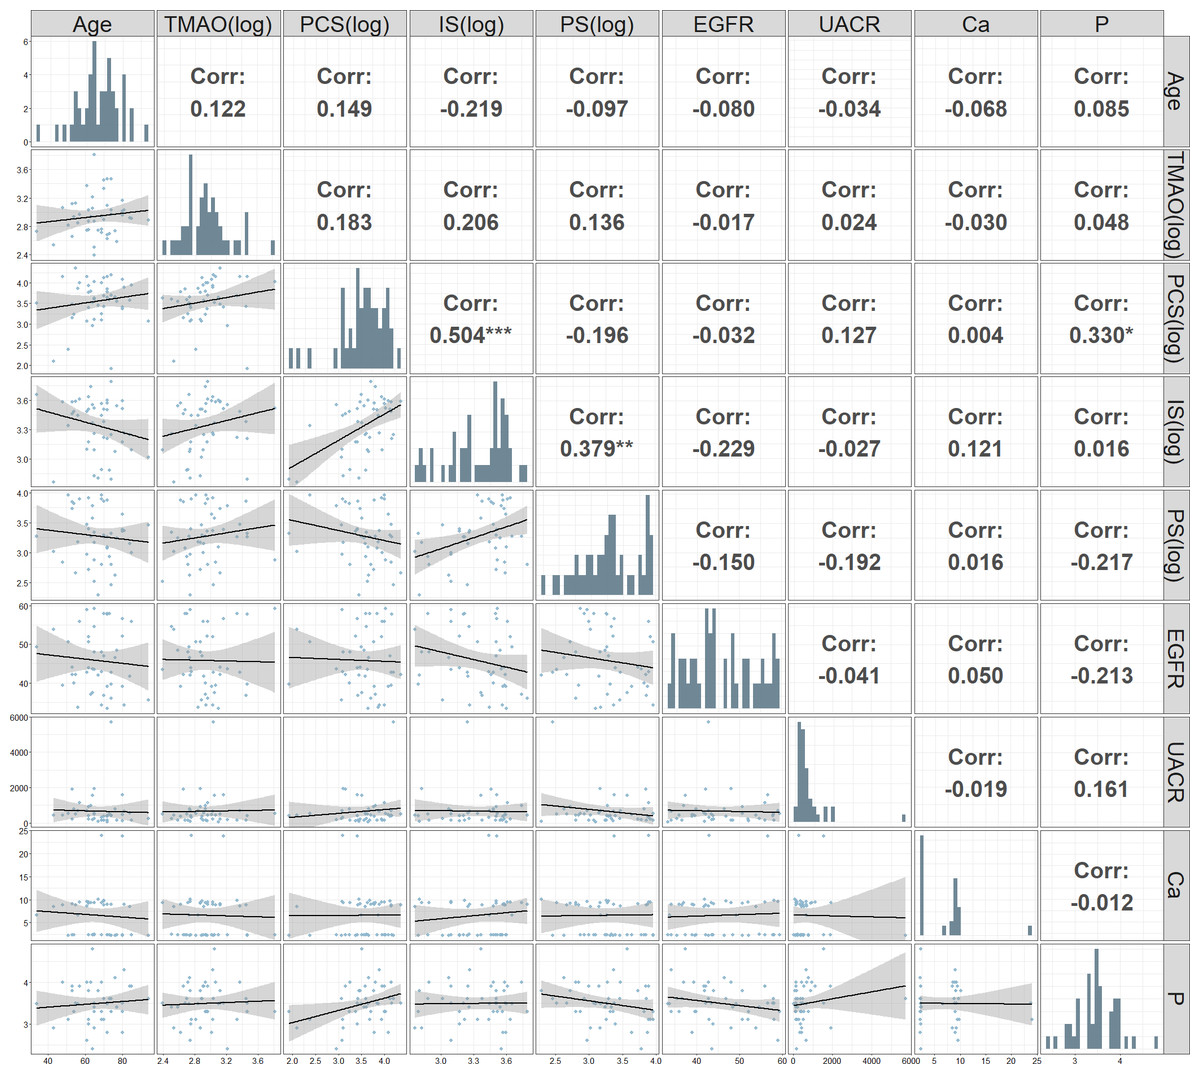
Figure 2: Correlation matrix and scatter plot matrix of clinical and biochemical parameters.
Upper triangular panels display the Pearson correlation coefficients between pairs of parameters. The lower triangular panels contain scatter plots with fitted regression lines and 95% confidence intervals, showing the relationships between pairs of parameters. Significant correlations are highlighted with asterisks: ***p < 0.001, **p < 0.01, *p < 0.05.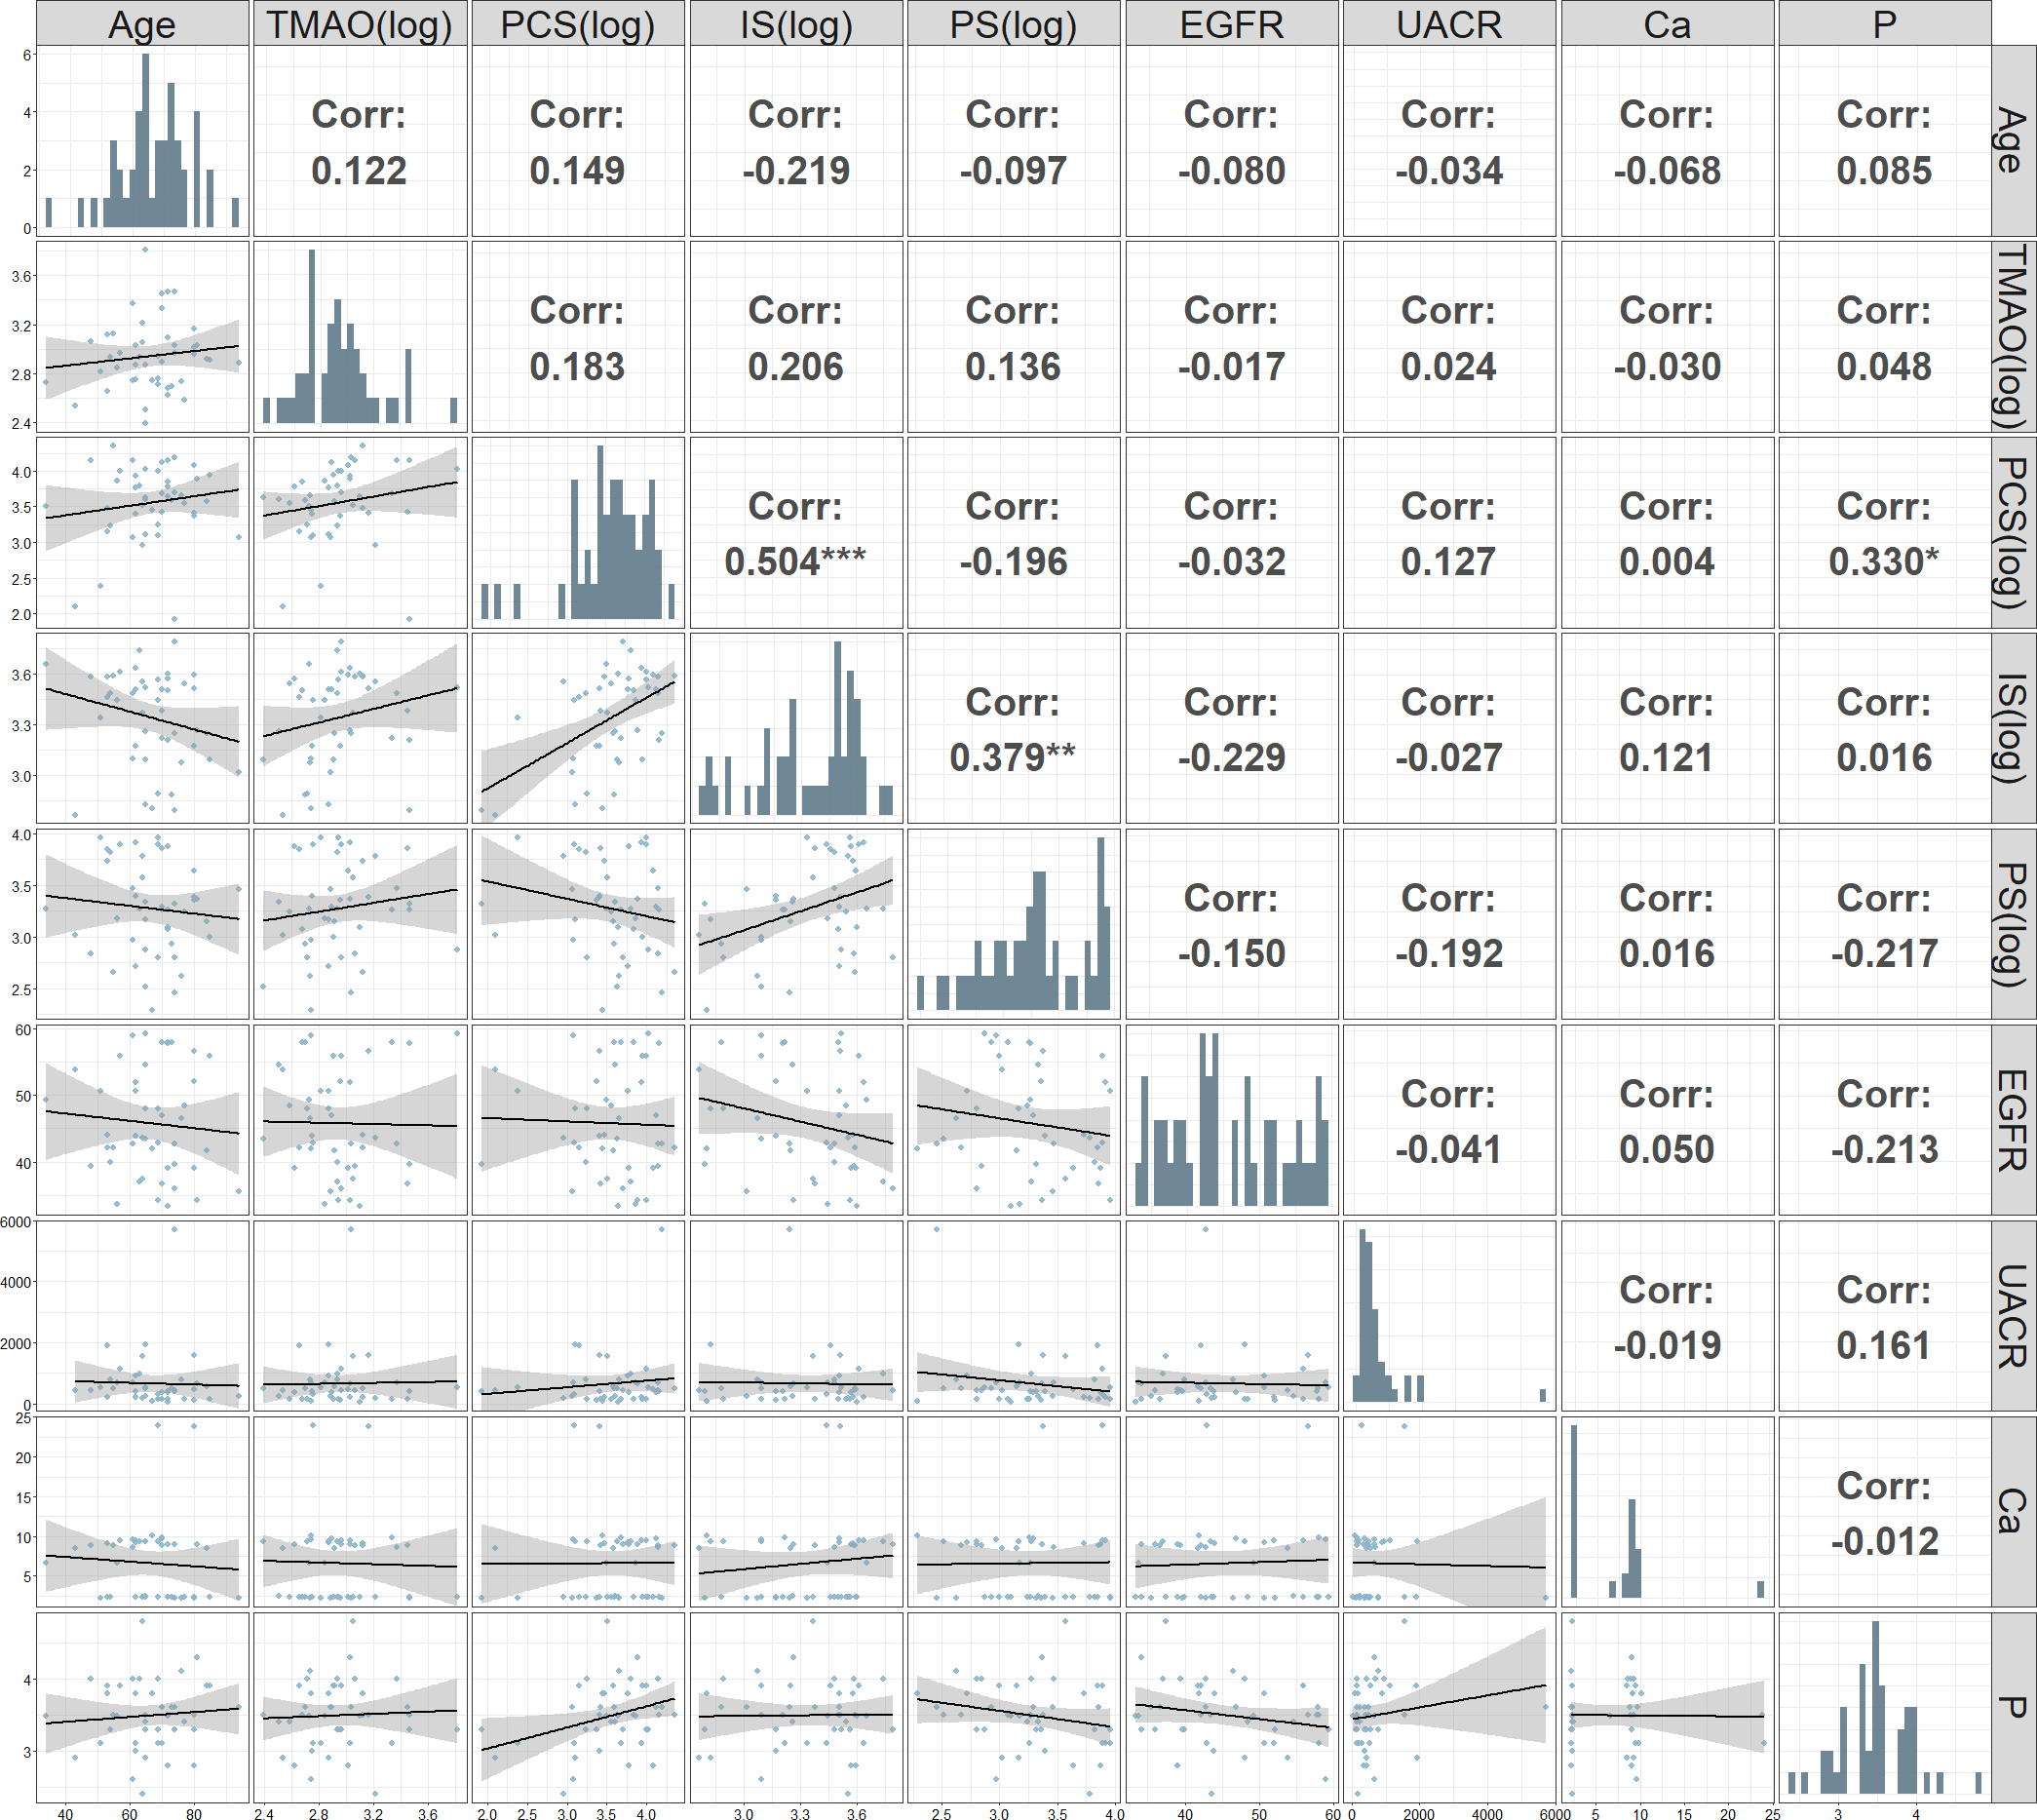
The correlation matrix and scatter plot matrix of various clinical and biochemical parameters measured in patients with CKD was showed in Fig. 2. A significant positive correlation was found between (log) PCS and (log) IS (r = 0.504, p < 0.001). Additionally, significant positive correlations were observed between phosphate and PCS (log) (r = 0.330, p < 0.05). Negative correlations were noted between eGFR and both IS (log) and PS (log), although these were not statistically significant.
Temporal change in uremic and vascular toxins and biochemistry data
Table 2 showed the percentage change in serum biochemical levels from visit 1 to visit 0 (expressed as (V1−V0/V0)%). In contrast to a percentage increase in the IS level in the control group, the ABC group exhibited a percentage decrease in IS levels after treatment (−23.9 ± 28.9% vs. control 33.9 ± 63.4%, p < 0.01). A reduction in IS was also observed in the ABC+probiotics group (−29.3 ± 30.6% vs. control 33.9 ± 63.4%, p < 0.01). Additionally, serial changes in PS levels exhibited group distinctions (p = 0.030), with the control group demonstrating the highest increase (111.5 ± 233.2%), while a decrease was noted in the ABC (−29.4 ± 26.0%) and ABC+probiotics groups (−26.0 ± 34.0%). Similarly, temporal alterations in TMAO levels exhibited group discrepancies (p = 0.025), with an increase noted in the probiotics group (89.1 ± 163.4%) and a decrease observed in the ABC (−17.4 ± 53.7%) and ABC+probiotics groups (−35.6 ± 24.7%). Noteworthy kidney function changes included a significant percentage decrease in serum creatinine levels (−4.4 ± 9.1%, p = 0.005) and a notable percentage increase in the eGFR (4.6 ± 10.2%, p = 0.011) in the ABC group relative to the control group. However, no significant percentage changes were observed in other groups. Additionally, other biochemical profiles did not show significant changes after treatment across all groups. Differential changes in percentage of biomarkers illustrated by circular bar plot was showed in Fig. 3.
Serum uremic and vascular toxin levels before and after treatment
Figure 4 showed the changes in biomarkers over time in different treatment groups. There were significant changes in serum uremic and vascular toxin levels before and after treatment in the ABC+probiotics group. Specifically, the log-transformed levels notably decreased: log (PCS) from 3.5 ± 0.3 to 3.3 ± 0.4 µg/L (p = 0.005), log (IS) from 3.3 ± 0.2 to 3.1 ± 0.3 µg/L (p = 0.013), log (PS) from 3.4 ± 0.4 to 3.2 ± 0.4 (p = 0.025), and log (TMAO) from 2.9 ± 0.3 to 2.7 ± 0.3 µg/L (p = 0.001). Similarly, significant decreases were noted in the ABC group: log (PCS) from 3.5 ± 0.5 to 3.3 ± 0.5 µg/L (p = 0.003), log (IS) from 3.4 ± 0.3 to 3.3 ± 0.3 µg/L (p = 0.032), log (PS) from 3.3 ± 0.5 to 3.2 ± 0.5 µg/L (p = 0.003), and log (TMAO) from 2.9 ± 0.2 to 2.7 ± 0.3 µg/L (p = 0.050). However, no significant changes were observed in eGFR and UACR levels before and after treatment in any of the groups. Moreover, the probiotics and control groups did not exhibit significant changes in serum uremic or vascular toxin levels or kidney function.
| Predictors | A+Pn = 12 | An = 12 | Pn = 11 | Cn = 11 | p | TTEST | Kruskal–Wallis H test | ||
|---|---|---|---|---|---|---|---|---|---|
| A+P vs. C | A vs. C | P vs. C | |||||||
| TMAO, µg/L | 35.6 ± 24.7 | 17.4 ± 53.7 | 89.1 ± 163.4 | 29.7 ± 110.9 | 0.025 | 0.083 | 0.222 | 0.330 | 0.010 |
| PCS, µg/L | 38.3 ± 31.8 | 37.6 ± 28.7 | 26.9 ± 113.4 | 439.1 ± 1303.2 | 0.241 | 0.252 | 0.253 | 0.320 | 0.002 |
| IS, µg/L | −29.3 ± 30.6 | −23.9 ± 28.9 | 23.4 ± 63.6 | 33.9 ± 63.4 | 0.005 | 0.009 | 0.015 | 0.700 | 0.009 |
| PS, µg/L | −26.0 ± 34.0 | −29.4 ± 26.0 | 20.4 ± 78.8 | 111.5 ± 233.2 | 0.030 | 0.080 | 0.074 | 0.243 | 0.156 |
| CRE, mg/dL | 2.6 ± 9.6 | −4.4 ± 9.1 | 14.1 ± 41.6 | 10.0 ± 12.7 | 0.214 | 0.129 | 0.005 | 0.758 | 0.045 |
| eGFR, mL/min/1.73 m2 | −1.9 ± 10.7 | 4.6 ± 10.2 | −1.6 ± 14.3 | −8.6 ± 12.5 | 0.087 | 0.180 | 0.011 | 0.233 | 0.073 |
| UACR, mg/g | −5.1 ± 35.2 | 35.5 ± 100 | 1.97 ± 42.8 | −2.7 ± 105.2 | 0.603 | 0.948 | 0.442 | 0.903 | 0.471 |
| TC, mg/dL | 1.4 ± 20.4 | 4.0 ± 11.9 | −5.2 ± 24.8 | 4.3 ± 15.0 | 0.599 | 0.704 | 0.951 | 0.287 | 0.781 |
| HDL, mg/dL | 4.7 ± 20.5 | 6.9 ± 14.4 | 3.8 ± 21.3 | 5.9 ± 28.6 | 0.987 | 0.903 | 0.923 | 0.843 | 0.896 |
| LDL, mg/dL | −6.4 ± 9.9 | 2.5 ± 19.8 | −6.7 ± 22.4 | −7.2 ± 31.8 | 0.667 | 0.942 | 0.384 | 0.970 | 0.630 |
| TG, mg/dL | 8.3 ± 31.5 | 52.2 ± 154.2 | 19.9 ± 64.9 | 12.4 ± 58.2 | 0.639 | 0.833 | 0.420 | 0.778 | 1.000 |
| BUN, mg/dL | 4.2 ± 24.7 | 21.1 ± 60.4 | −1.3 ± 28.1 | 10.5 ± 7.7 | 0.514 | 0.416 | 0.561 | 0.207 | 0.153 |
| AC_sugar, mg/dL | −4.5 ± 19.5 | 20.2 ± 44.4 | 3.0 ± 39.8 | 9.1 ± 27.7 | 0.356 | 0.184 | 0.484 | 0.681 | 0.199 |
| HbA1c (%) | 2.7 ± 8.3 | 64.7 ± 220.0 | 1.2 ± 14.0 | 2.7 ± 8.4 | 0.447 | 0.981 | 0.350 | 0.772 | 0.501 |
| Albumin, mg/dL | 0.6 ± 5.4 | −0.5 ± 6.1 | −0.8 ± 6.5 | 1.2 ± 2.4 | 0.804 | 0.766 | 0.408 | 0.363 | 0.800 |
| GOT_AST, U/L | 13.1 ± 38.7 | −4.0 ± 18.2 | −3.4 ± 10.9 | 9.1 ± 13.9 | 0.205 | 0.743 | 0.068 | 0.029 | 0.064 |
| GPT_ALT, U/L | 34.1 ± 45.1 | −2.0 ± 33.1 | 21.0 ± 59.1 | 4.8 ± 15.0 | 0.156 | 0.053 | 0.528 | 0.396 | 0.059 |
| UA, mg/dL | −4.6 ± 14.3 | −5.1 ± 19.9 | −3.6 ± 29.1 | 6.5 ± 13.8 | 0.480 | 0.072 | 0.123 | 0.315 | 0.539 |
| Na, mmol/L | −0.5 ± 2.1 | −0.7 ± 1.3 | 0.1 ± 1.6 | −6.2 ± 19.5 | 0.384 | 0.354 | 0.367 | 0.311 | 0.413 |
| K, mmol/L | 1.1 ± 12.7 | 4.5 ± 10.5 | −3.3 ± 10.4 | 7.9 ± 14.0 | 0.166 | 0.235 | 0.512 | 0.045 | 0.165 |
| P, mg/dL | 1.4 ± 12.8 | 8.6 ± 12.5 | 7.5 ± 15.4 | 13.8 ± 15.2 | 0.242 | 0.052 | 0.394 | 0.360 | 0.314 |
| RBC (×106/µL) | 435.1 ± 1506.8 | 0.6 ± 7.9 | 1.2 ± 5.4 | 0.3 ± 4.8 | 0.429 | 0.339 | 0.900 | 0.508 | 0.795 |
| WBC (×103/µL) | 0.7 ± 16.2 | 10.1 ± 16.7 | 0.8 ± 19.9 | 1.6 ± 13.4 | 0.323 | 0.883 | 0.089 | 0.750 | 0.501 |
| Platelet (×103/µL) | 9.8 ± 31.1 | 1.9 ± 10.2 | 0.2 ± 16.2 | 0.7 ± 12.3 | 0.443 | 0.298 | 0.802 | 0.929 | 0.535 |
| Hct (%) | 1.3 ± 7.9 | 0.0 ± 5.6 | 4.8 ± 16.3 | 0.7 ± 5.3 | 0.435 | 0.832 | 0.775 | 0.306 | 0.772 |
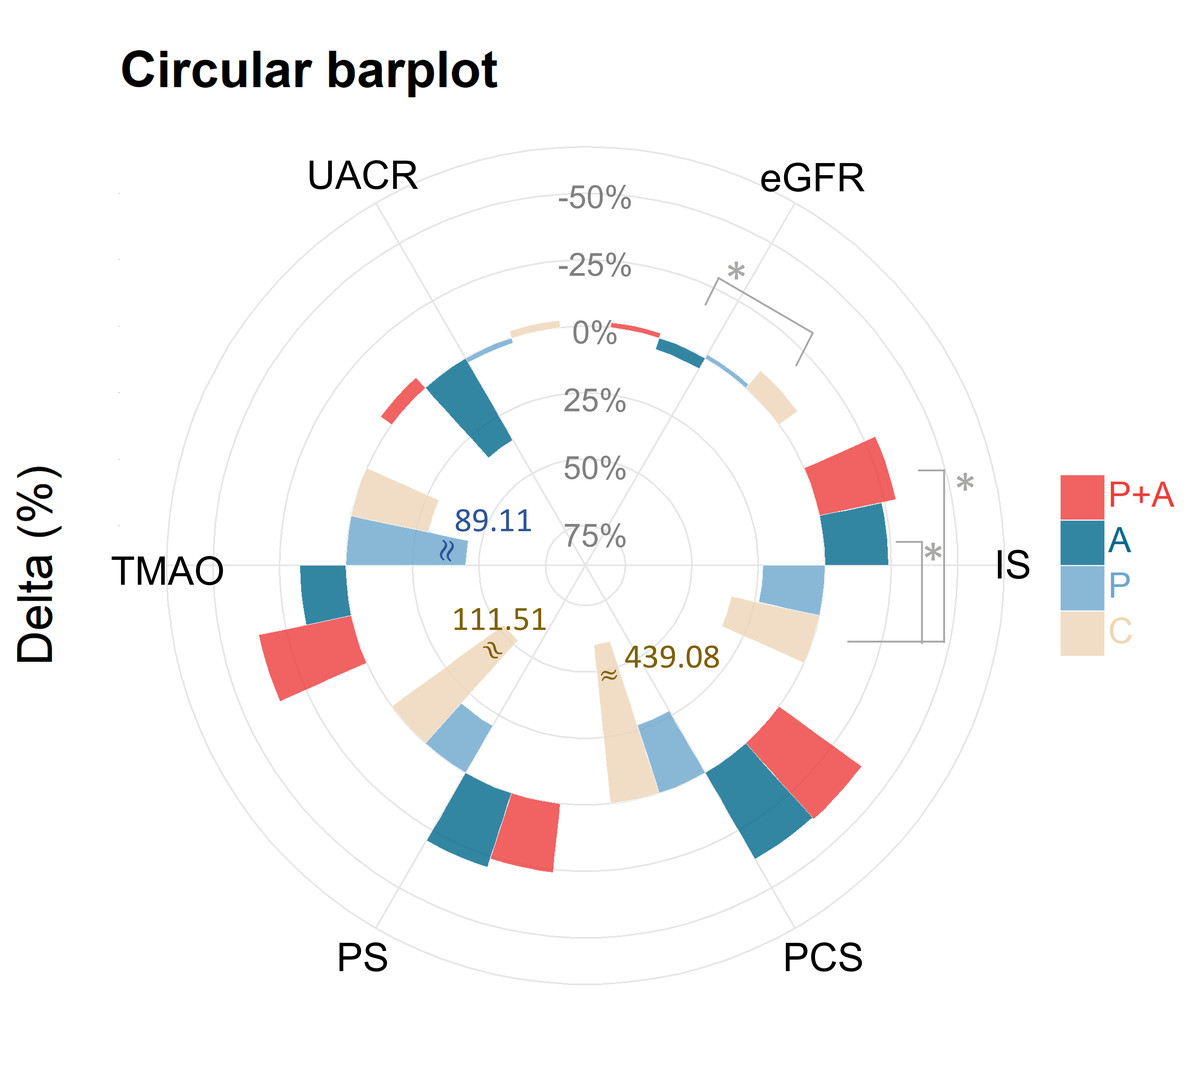
Figure 3: Differential changes in percentage of biomarkers illustrated by circular bar plot.
This illustrates the percentage changes (delta %) in various biomarkers across the four distinct treatment groups. The biomarkers assessed include TMAO, PCS, PS, IS, eGFR, and UACR. The bars represent the delta (%) from baseline (V0) to follow-up (V1), with each treatment group denoted by a different color: P+A (red), A (dark blue), P (light blue), and C (beige). TMAO, PCS, PS, and UACR exhibited no significant variations. IS exhibited a significant reduction in the P+A groups and P groups; the other groups showed less pronounced changes. eGFR changes were improved in group A compared with group C. Asterisks indicate statistically significant changes (*p < 0.05) within each biomarker. The plot highlights the differential impacts of various treatment regimens on key metabolic and kidney function biomarkers. Red asterisks indicate statistically significant differences between V0 and V1 within each treatment group (*p < 0.05). The treatment groups are denoted as follows: P+A, combined probiotic active bamboo charcoal; A, active bamboo charcoal; P, probiotic; C, control.
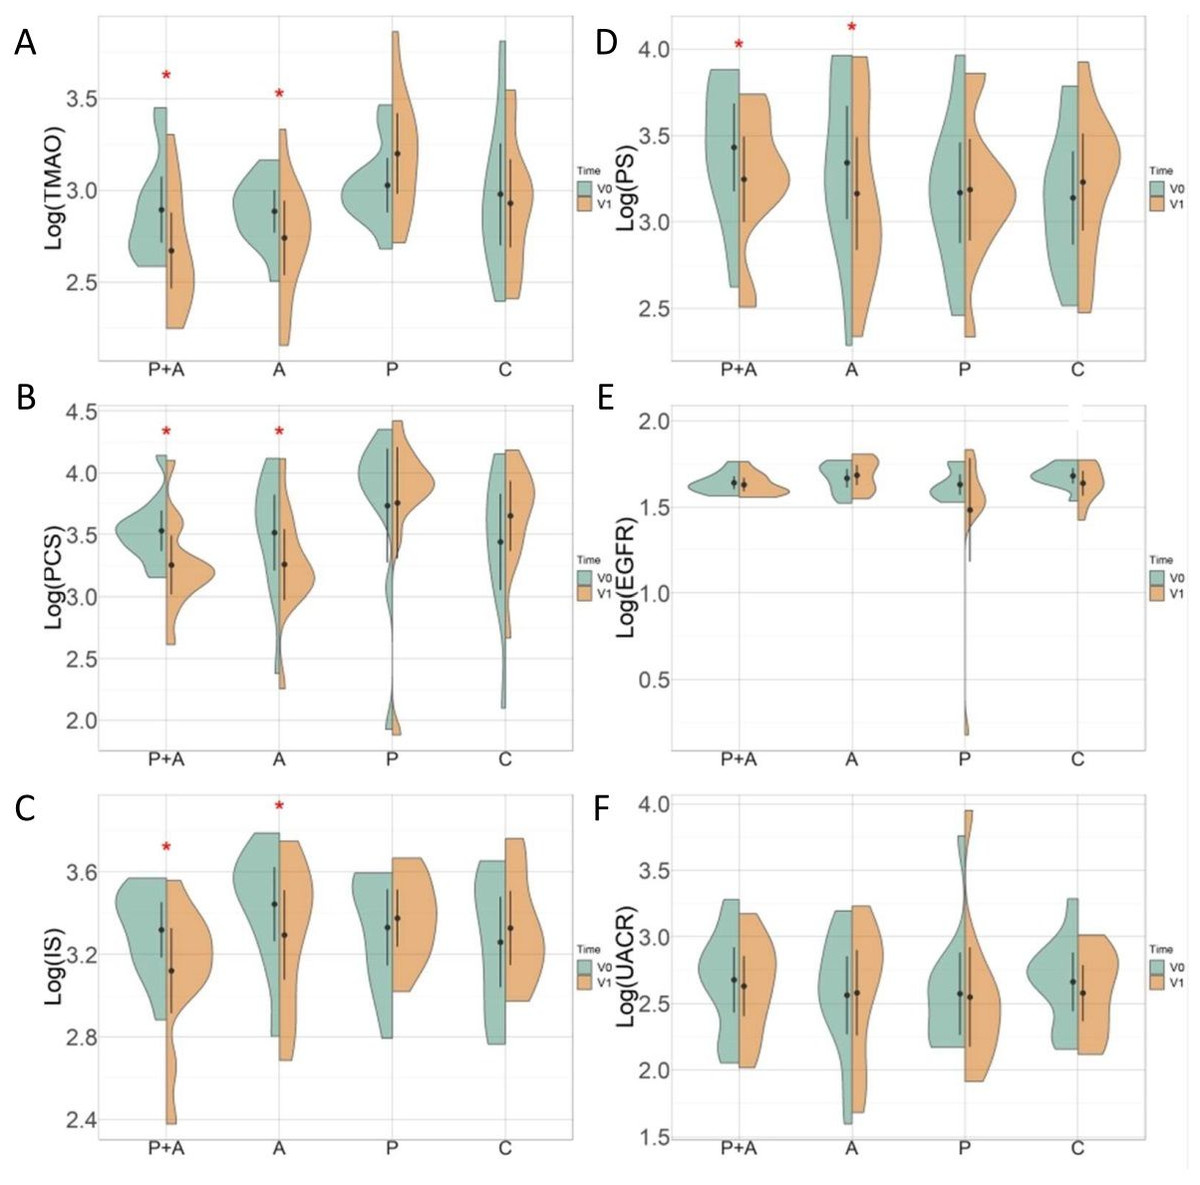
Figure 4: Changes in biomarkers over time in different treatment groups.
This figure depicts the distribution and changes in different biomarkers across treatment groups at two time points (baseline (V0) and 3 months after treatment (V1)). (A–F) The log-transformed levels of specific biomarkers. Violin plots display the density of the data points, while the central black dot and vertical line indicate the median and interquartile range, respectively. Orange and green represent the baseline and follow-up measurements, respectively. (A) Log(TMAO)—TMAO levels significantly decreased in the P+A and A groups (*p < 0.05), while no significant changes were observed in the P, and C groups. (B) Log(PCS)—PCS levels showed a significant reduction in the P+A and A groups (*p < 0.05), with stable levels in the P and C groups. (C) Log(IS)—IS levels were significantly reduced in the P+A and A groups (*p < 0.05). The P and C groups did not exhibit significant changes. (D) Log(PS)—PS decreased significantly in the P+A and A groups (*p < 0.05), with no significant change in the P and C groups. (E) Log(eGFR)—eGFR did not show significant changes in any groups, indicating stable kidney function over time. (F) Log(uACR)—UACR remained stable across all groups, with no significant differences between V0 and V1.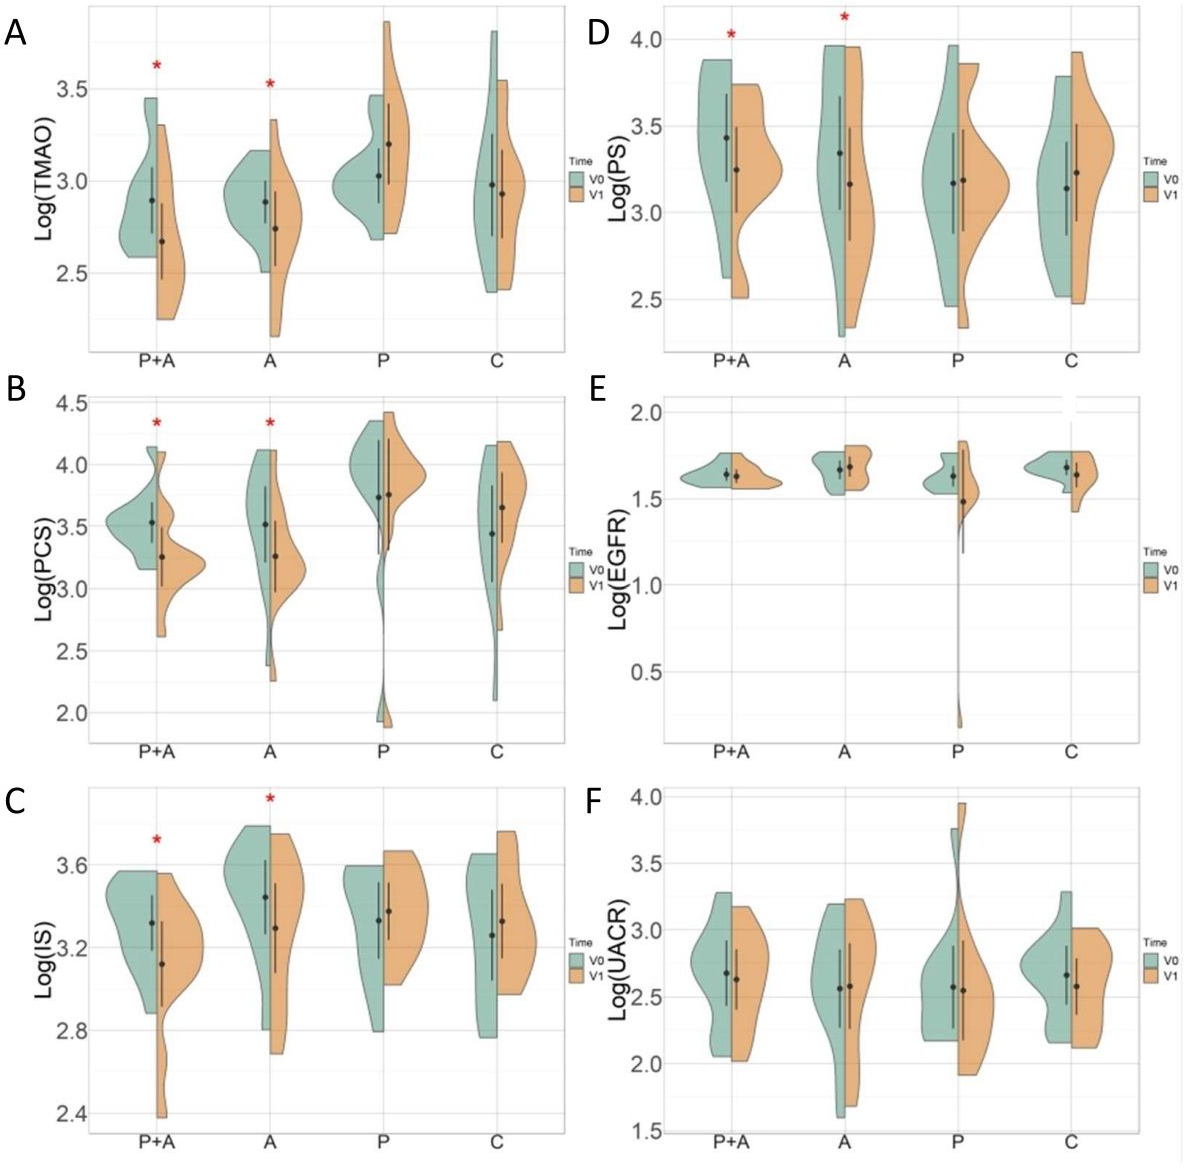
Side effects
Only one patient receiving ABC+probiotics experienced recurrent hemorrhoids, and one patient receiving ABC reported constipation during the treatment. However, these symptoms were manageable with supportive care, such as increased water intake, and did not lead to treatment discontinuation.
Discussion
This multicenter, randomized, controlled trial demonstrated a significant reduction in uremic and vascular toxin levels, including IS, PCS, PS, and TMAO, in patients with CKD following a 3-month regimen of ABC or ABC combined with probiotics. Furthermore, notable temporal attenuation in serum IS and PCS percentages were observed in both the ABC and ABC+probiotics groups compared to the control group. Importantly, patients receiving ABC treatment exhibited a significantly improved percentage change in the eGFR relative to the control group after the 3-month treatment period. The treatment did not induce significant side effects.
The effect of ABC on uremic and vascular toxins and kidney function
The specific surface area and basic structure of ABC have been analyzed by scanning electron microscope and X-ray diffractometer. It indicated that the specific surface area was significantly increased after an activation process. In addition, the functional group on surface of ABC was as similar as AST-120 measured by Fourier-transform infrared spectroscopy (FTIR) (Lin et al., 2020). Owing to its porous structure and extensive surface area, activated charcoal possesses the ability to adsorb various substances, including uremic toxins (Lim et al., 2012). AST-120 has demonstrated its efficacy in delaying the progression of both CKD and cardiovascular disease (CVD) events in patients with advanced CKD by adsorbing the IS precursor, indole, in the intestine, consequently reducing serum IS levels (Marier et al., 2006; Akizawa et al., 2009).
In an animal study, both the early and late administration of activated charcoal resulted in a notable decrease in serum urea and creatinine levels, with charcoal treatment also showing a relative reduction in the kidney fibrosis index (El-Kafoury et al., 2019). However, a network meta-analysis of randomized controlled trials revealed that neither low- nor high-dose AST-120 treatments demonstrated superiority over no AST-120 treatment in terms of renal outcomes (Su et al., 2021). Another systematic review and meta-analysis of randomized controlled trials found that CKD patients receiving AST-120 did not experience significant improvements in renal outcomes or all-cause mortality (Chen et al., 2019). Moreover, recent studies have shown that high circulating plasma TMAO levels are closely associated with diseases such as atherosclerosis, hypertension, and metabolic disorders. Endothelial dysfunction mediated by TMAO is primarily driven by inflammation and oxidative stress. Oral non-absorbent binders have been proposed to eliminate TMAO and its precursors. While oral AST-120 has been shown to eliminate uremic toxins such as PCS and IS in end-stage kidney disease patients, it remains an uncertain approach as none of these adsorbents specifically target TMAO (Chen et al., 2019).
In this study, a novel form of activated charcoal, CharXenPlus, was employed. CharXenPlus is produced and activated from bamboo and coated with negatively charged, biocompatible sodium alginate. This coating allows the activated carbon to form microspheres, preventing adhesion to the mucosal wall when entering the intestinal tract. The interior of the ABC is mesoporous, significantly enhancing its capacity to adsorb toxins (Sternkopf et al., 2019). This is the first study to demonstrate that ABC can slow the deterioration of kidney function and decrease serum TMAO levels after 3 months of use. In vitro findings show that this charcoal has a stronger binding capacity for indole and p-cresol in the intestine compared to AST-120 (Lin et al., 2020).
This enhanced efficacy may be attributed to the need for more effective adsorbent formulations to maintain precise control over particle size, spherical morphology, and the preservation of an interconnected mesoporous structure. These characteristics enhance the adsorption surface area and selectively adsorb hydrophilic uremic and vascular toxins within the intestinal milieu (Sternkopf et al., 2019).
In an animal model, CKD rats fed with ABC or AST-120 demonstrated lower serum IS and PCS levels compared to control CKD rats (Lin et al., 2020). These outcomes suggest that the binding capacity of activated bamboo charcoal to uremic toxins is comparable to that of AST-120. Furthermore, there was a more significant improvement in kidney function observed in our CKD group following treatment with ABC. The potency could explain the differential effect observed between ABC and AST-120.
The effect of probiotics
The gut microbiota exerts a notable influence on the generation of uremic and vascular toxins. Alterations in the microbiota can impact factors such as intestinal transit time and permeability, pH levels, nutrient absorption, and the availability of metabolites, which serve as substrates for the microbiota and are produced by it, including precursors of uremic and vascular toxins. These species changes may potentially influence the progression of or complications associated with CKD (Beker et al., 2022).
However, it is crucial to acknowledge that, while there is evidence supporting the effectiveness of probiotics in reducing uremic and vascular toxin production and improving kidney function, the quality of intervention trials investigating this innovative CKD therapy remains inadequate (Koppe, Mafra & Fouque, 2015). In this study, we did not observe significant improvements in uremic and vascular toxins or kidney function in the probiotics group, even with the addition of activated charcoal. The possible reasons were owing to the beneficial effect of ABC might be mitigated by the probiotics and the percentage of using ACEI/ARB and SGLT2i were lower in these two groups than ABC group. Probiotics offer potential benefits in managing CKD by enhancing gut function and promoting a balanced gut microbiota (Maftei et al., 2024). However, it is important to note that they cannot address the root causes of kidney disease. While probiotics may improve metabolic functions and mitigate the systemic inflammation associated with CKD, in advanced stages of the disease where gut bacteria with creatininase activity are elevated, a significant proportion of endogenously formed creatinine remains unaccounted for (ranging from 16% to 66%) (Lempert, 2019).
The optimal dosage and duration of probiotic therapy for CKD patients remain unclear. Additionally, emerging evidence suggests that individuals with early-stage (1–2) CKD exhibit alterations in both the quantity and quality of their microbiota profile (Tian et al., 2022). Due to the lack of early kidney injury detection, current treatments for kidney disease may be initiated too late and lack effectiveness. While numerous studies have investigated the impact of gut-derived metabolites on CKD progression, our understanding of how urinary and blood microbiome compositions influence CKD advancement, including the effects of various microbiomes, remains limited (Wu et al., 2020; Modena et al., 2017). The accumulation of microbial metabolites and toxins is associated with deteriorating kidney function and an elevated risk of mortality. However, renoprotective metabolites such as short-chain fatty acids and bile acids show promise in enhancing kidney function and increasing survival rates in CKD patients (Wehedy, Shatat & Khodor, 2022).
Different combinations of probiotics may exert varying regulatory effects on different types of uremic or vascular toxins. Even in the SYNERGY trial, which involved stage 4–5 CKD patients, a decrease in serum PCS was observed alongside a favorable change in the stool microbiome, although no decrease was observed in IS levels (Rossi et al., 2016). Therefore, while probiotics might offer potential benefits for kidney health, their effects on kidney function are complex and may not consistently lead to improvements.
Study limitations
First, this is a pilot clinical trial and the sample size was small. Second, we did not collect patient’s dietary status and check urinary urea level. We were unable to elucidate the discordance about why the improvement of eGFR only can significantly be found in patients with ABC not ABC with probiotic group. Third, we only investigated the short-term changes in protein-bound uremic and vascular toxins and the potential benefits of ABC and/or probiotic use among stage 3 CKD patients over 3 months. Despite having beneficiary effects, particularly regarding the reduction in serum uremic and vascular toxin levels and improvements in the eGFR, the long-term effects of ABC therapy remain unclear. Thus, further larger and longer follow-up clinical trials are necessary to directly address these questions and provide further insights into the efficacy of ABC therapy in CKD management.
Conclusions
In conclusion, this pilot study suggested that a novel ABC treatment not only significantly reduced uremic and vascular toxin levels, including PCS, IS, PS, and TMAO, with a particularly pronounced decrease in the percentage change in IS, but might have a potential benefit in protecting kidney function in patients with CKD stage 3. Nonetheless, the protective effects of ABC on kidney function require further validation through large-scale and longer-term randomized controlled trials.