
A nicotinamide metabolism-related gene signature for predicting immunotherapy response and prognosis in lung adenocarcinoma patients
- Published
- Accepted
- Received
- Academic Editor
- Huashan Shi
- Subject Areas
- Biochemistry, Bioinformatics, Cell Biology, Immunology, Oncology
- Keywords
- Nicotinamide metabolism, Tumor microenvironment, Lung adenocarcinoma, Metabolic reprogramming, Prognosis, immunotherapy
- Copyright
- © 2025 Wang et al.
- Licence
- This is an open access article distributed under the terms of the Creative Commons Attribution License, which permits using, remixing, and building upon the work non-commercially, as long as it is properly attributed. For attribution, the original author(s), title, publication source (PeerJ) and either DOI or URL of the article must be cited.
- Cite this article
- 2025. A nicotinamide metabolism-related gene signature for predicting immunotherapy response and prognosis in lung adenocarcinoma patients. PeerJ 13:e18991 https://doi.org/10.7717/peerj.18991
Abstract
Background
Nicotinamide (NAM) metabolism fulfills crucial functions in tumor progression. The present study aims to establish a NAM metabolism-correlated gene (NMRG) signature to assess the immunotherapy response and prognosis of lung adenocarcinoma (LUAD).
Methods
The training set and validation set (the GSE31210 dataset) were collected The Cancer Genome Atlas (TCGA) and Gene Expression Omnibus (GEO), respectively. Molecular subtypes of LUAD were classified by consensus clustering. Mutation landscape of the top 20 somatic genes was visualized by maftools package. Subsequently, differential expression analysis was conducted using the limma package, and univariate, multivariate and LASSO regression analyses were performed on the screened genes to construct a risk model for LUAD. Next, the MCP-counter, TIMER and ESTIMATE algorithms were utilized to comprehensively assess the immune microenvironmental profile of LUAD patients in different risk groups. The efficacy of immunotherapy and chemotherapy drugs was evaluated by TIDE score and pRRophetic package. A nomogram was created by integrating RiskScore and clinical features. The mRNA expressions of independent prognostic NMRGs and the migration and invasion of LUAD cells were measured by carrying out cellular assays.
Results
Two subtypes (C1 and C2) of LUAD were classified, with C1 subtype showing a worse prognosis than C2. The top three genes with a high mutation frequency in C1 and C2 subtypes were TTN (45.25%), FLG (25.25%), and ZNF536 (19.8%). Four independent prognostic NMRGs (GJB3, CPA3, DKK1, KRT6A) were screened and used to construct a RiskScore model, which exhibited a strong predictive performance. High-risk group showed low immune cell infiltration, high TIDE score, and worse prognosis, and the patients in this group exhibited a high drug sensitivity to Cisplatin, Erlotinib, Paclitaxel, Saracatini, and CGP_082996. A nomogram was established with an accurate predictive and diagnostic performance. GJB3, DKK1, CPA3, and KRT6A were all high- expressed in LUAD cells, and silencing GJB3 inhibited the migration and invasion of LUAD cells.
Conclusion
A novel NMRG signature was developed, contributing to the prognostic evaluation and personalized treatment for LUAD patients.
Introduction
Lung cancer is a frequent and lethal epithelial malignant tumor (Tang et al., 2023; Zhang et al., 2023). In 2020, China reported approximately 820,000 new cases of lung cancer, constituting 17.9% of all new cancer diagnoses (4.57 million), with 710,000 fatalities, which accounted for 23.7% of all cancer-related deaths (3 million) (Cao et al., 2023). Lung adenocarcinoma (LUAD), the predominant subtype of lung cancer, comprises more than 40% of all lung cancer cases and is characterized by its aggressive nature and high mortality rate (Cao et al., 2024; Xia et al., 2024). Despite advancements including chemotherapy, surgical resection, radiotherapy, immunotherapy, and targeted molecular therapies, the prognosis of lung cancer remains grim (Meng et al., 2024; Zhou et al., 2022; Ding, Lv & Hua, 2022). This is largely due to the challenges in early detection, rapid progression of the cancer as well as the development of treatment resistance (Zhang et al., 2022; Zheng et al., 2023). Immunotherapy is a promising strategy for treating LUAD, and studies have shown the crucial role of immune system in LUAD progression (Guo et al., 2022). Specifically, immune checkpoint inhibitors (ICIs) have become a pivotal therapeutic modality LUAD for and are widely applied in clinical setting (Xu et al., 2023). In China, the currently approved ICIs for LUAD treatment are mainly PD-1 and PD-L1 inhibitors, including agents such as tislelizumab, pembrolizumab, and durvalumab (Feng et al., 2023; Hu et al., 2022). However, due to tumor heterogeneity of tumors and patient-specific differences, only about 15% of patients could benefit from ICIs (Nguyen et al., 2022; He et al., 2024). Studies confirmed that developing risk models and analyzing immune infiltration analysis in both low- and high-risk groups can assists in predicting the immune therapeutic response in LUAD (Li et al., 2023; Yi et al., 2021; Wu et al., 2021). Hence, establishing risk model for LUAD prognosis is imperative, as they can inform treatment strategies and improve patient outcomes.
Metabolic reprogramming is a hallmark of malignant tumors, primarily involving alterations in glutamine metabolism, glucose metabolism, and lipid metabolism (Li et al., 2022; Zhang, Zou & Fang, 2023). This reprogramming allows tumors to evade cell apoptosis, a prerequisite for promoting rapid proliferation, invasion, and metastasis of tumor cells (Shum et al., 2023). It has been reported that metabolic reprogramming not only enables cancer cells to escape immune surveillance, but also induces treatment resistance and interacts with the tumor microenvironment via the metabolites produced (Faubert, Solmonson & DeBerardinis, 2020). Inhibition of metabolic reprogramming could reduce tumor aggressiveness (Liu et al., 2023), thus identifying it as a possible target for cancer therapies (Nong et al., 2023). Nicotinamide (NAM), the amide pattern of vitamin B3, serves as a precursor to nicotinamide-adenine dinucleotide (NAD+), a key mediator in cellular energy metabolism (Song et al., 2019). During cell senescence, the reduction of NAD+ levels will increase the production of reactive oxygen species (ROS), contributing to metabolic reprogramming (Cui et al., 2023). Increasing evidence demonstrated the pivotal role of NAM in the prevention and therapies of cancers (Nikas, Paschou & Ryu, 2020). For example, NAM could suppress breast cancer cell proliferation via mitochondrial dysfunction and ROS accumulation by regulating lipid metabolism pathway (Jung et al., 2022). As a crucial enzyme in the NAD+ salvage pathway, nicotinamide phosphoribosyl transferase (NAMPT) could convert NAM to nicotinamide mononucleotide (NMN), contributing significantly to immunosuppressive microenvironment (Burgos, 2011; Travelli et al., 2019). In certain tumors, NAMPT has been found to promote the expression of PD-L1, which allows tumors to evade immune response, particularly in a CD8+ T cell- dependent manner (Li et al., 2020; Lv et al., 2021). These findings highlighted the significance and potential prognostic value of NAM metabolism in relation to tumor outcomes and immune responses.
Given that the research on the correlation between NAM metabolism and immunotherapy response and prognosis of LUAD is limited, the present research set out to examine the significant role of NAM metabolism in LUAD progression and to develop a new predictive model for immunotherapeutic response and prognosis based on NAM metabolism-related genes (NMRGs). Firstly, molecular subtypes of LUAD were delineated using NMRGs, and comparisons were made regarding clinical features, somatic gene mutation profiles, and differentially expressed genes (DEGs) across the subtypes. Subsequently, independent prognostic NMRGs were screened to create a RiskScore model for patients suffering from LUAD, the reliability of which was validated using GSE31210 dataset. The analysis extended to assessing immune infiltration, immunotherapy response, and drugs sensitivity across different risk groups. Furthermore, a nomogram integrating RiskScore with clinical features was established. Finally, the mRNA expressions of independent prognostic NMRGs, and cell migration and invasion capabilities of LUAD cells were experimentally verified. This study offers a promising method for evaluating the prognostic outcomes and treatment effectiveness for LUAD patients, potentially improving clinical decision-making.
Materials and Methods
Data collection and preprocessing
The somatic mutation information and clinical phenotype data of LUAD were collected from the Cancer Genome Atlas (TCGA) database (https://portal.gdc.cancer.gov/). The RNA-seq expression profile was converted to FPKM format and log2-converted. The somatic gene mutation information was processed by mutect2 (Saba et al., 2020). After removing samples that lacked survival time or survival status, a total of 500 tumor samples with a survival time longer than 0 day were obtained.
The chip data of GSE31210 (Shahrajabian & Sun, 2023) was acquired from Gene Expression Omnibus (GEO) (https://www.ncbi.nlm.nih.gov/geo/query/acc.cgi?acc=GSE31210) (Song et al., 2023). The probes were transformed to genes symbol based on the annotation information. A total of 226 tumor samples from GSE31210 were recruited for subsequent study after removing normal samples and those without clinical follow-up or overall survival (OS) data.
TCGA-LUAD and GSE31210 datasets served as the training dataset and independent validation dataset, respectively.
Consensus clustering analysis
Firstly, 42 NMRGs obtained from a previous study (Cui et al., 2023) were subjected to univariate Cox regression analysis (p < 0.05) to filter prognostically significant NMRGs in LUAD. Then, consensus clustering was performed to delineate molecular subtypes of TCGA-LUAD using ConsensusClusterPlus R package (the parameters were set as clusterAlg = “hc” and distance = “Spearman”) (Li et al., 2020). Sampling was repeated 500 times with 80% samples involved each time. The optimal cluster number (between 2 to 10) was determined according to the CDF. Finally, the prognosis between different subtypes in TCGA-LUAD cohort was evaluated and validated in GSE31210 dataset.
Somatic gene mutation landscape analysis
Somatic genes with mutation frequencies higher than 2 were selected. Then, genes with significantly high mutation frequencies within each molecular subtype were further identified using Fisher’s exact test, setting a threshold of p < 0.05. Next, the mutation landscape of the top 20 somatic genes in each molecular subtype was visually displayed using a waterfall diagram, generated with the maftools R package (Jia et al., 2024).
Identification of DEGs and GSEA
DEGs among different subtypes of TCGA-LUAD were selected using limma R package, with a screening threshold of |log2FoldChange (FC)|>log2(1.5) and p < 0.05. Following this, pathway enrichment analysis was conducted via GSEA R package to pinpoint significantly enriched pathways, using a threshold of p < 0.05 (Innis et al., 2021). The gene set “h.all.v2023.1.Hs.entrez.gmt” from the MsigDB (https://www.gsea-msigdb.org/gsea/msigdb/) served as the background gene sets (Li et al., 2023), encompassing the HALLMARK series of pathways.
Development and verification of a RiskScore model
Using univariate Cox regression analysis (p < 0.05), the prognostic genes were selected from the DEGs between the molecular subtypes in TCGA-LUAD. Subsequently, the model was refined by performing LASSO Cox regression analysis in the glmnet R package and 10-fold cross validation (Li et al., 2024). Then, the independent prognostic NMRGs were screened via stepwise multivariate regression analysis and applied to develop the RiskScore model as follow (Fan et al., 2024):
βi indicates the coefficient of gene in Cox regression model, and ExPi represents gene expression value.
The RiskScore for all the samples in TCGA-LUAD and GSE31210 datasets was calculated, and LUAD patients were separated by the median RiskScore value into high- and low-risk groups. The ROC curve was constructed using timeROC R package (Zhang, 2022). The model robustness was validated using the GSE31210 dataset.
Evaluation of the TME
To investigate the association between the TME in LUAD and different risk groups, the scores of a total of 28 types of tumor infiltration immune cells (TIICs) were computed for each sample (Wang et al., 2020). Also, the scores of 10 types of immune cells were calculated by MCP-counter (Zhang et al., 2022). The TIMER online tool (http://cistrome.org/TIMER) was employed to calculate the scores of six immune cells (Cao et al., 2022). Moreover, ESTIMATE algorithm was utilized to output the ESTIMATEScore, StromalScore, ImmuneScore using estimated R package (Ke et al., 2021).
Immunotherapy response and drug sensitivity assessment
Firstly, the TIDE score was calculated based on the standardized transcriptome data in TIDE website (http://tide.dfci.harvard.edu/) (Zheng et al., 2024) to evaluate the immunotherapy response of LUAD patients, with higher TIDE scores indicating greater immune escape possibility and less immunotherapy benefit. Furthermore, the sensitivity of LUAD patients in TCGA-LUAD to 10 common chemotherapy drugs was compared based on the IC50 value using pRRopetic R package.
Development and verification of a NAM metabolism-related nomogram
Firstly, independent prognostic factors were identified by subjecting clinical traits and RiskScore model to univariate and multivariate Cox regression analysis. Then, a nomogram integrating RiskScore with other clinicopathologic features was created to evaluate the 1-, 3-, and 5- year survival rate of patients with LUAD (Liu et al., 2024). The nomogram’s performance was assessed using a calibration curve and DCA. The predictive accuracy was further validated by calculating the C-index (Wang et al., 2022). Additionally, the diagnostic efficacy of the nomogram was evaluated through plotting receiver operating characteristic (ROC) curves using the timeROC R package (Lin et al., 2023).
Cell culture and transfection
Normal human lung epithelial cell line (BEAS-2B) and the LUAD cell line (A549) were procured from Wuhan Sunncell Biotechnology Co., Ltd (Wuhan, China). DMEM/F12 medium comprising 10% fetal bovine serum (FBS) and 1% penicillin-streptomycin was used in all cell culture under the incubation conditions of 37 °C, 5% CO2, and saturated humidity.
Subsequently, the silencing of GJB3 was conducted by cell transfection. The small interfering (si) RNA specifically targeting GJB3 (si-GJB3) along with a negative control (si-NC) was obtained (Shanghai Sangon Biotechnology Co., Ltd., Shanghai, China). The sequence of si-GJB3 was AAGTTATGCAACTTTCGTTTTGG. Transfection of A549 cells was conducted with the use of Lipofectamine® 3000 (Invitrogen, Thermo Fisher Scientific) for 48 h, according to the instruction.
Quantitative real‑time PCR
Firstly, the total RNA of BEAS-2B and A549 cells obtained using TriZol reagent (Invitrogen, Waltham, MA, USA) was reverse-transcribed into cDNA with SuperScript IV reverse transcriptase (Invitrogen, Waltham, MA, USA). Next, to measure the mRNA expressions of independent prognostic NMRGs in BEAS-2B and A549 cells, quantitative real–time PCR (qRT–PCR) was conducted for amplification using SYBR® Premix Ex Taq™ II (Takara, Shanghai, China). See Table S1 for the primer sequences. The amplification was performed as follows: pre-denaturation at 95 °C for 1 minute (min), 40 cycles of 95 °C for 30 seconds (s), and annealing at 56 °C for 30 s, elongation at 72 °C for 40 s. The relative expressions of NMRGs were quantified by 2−ΔΔCT method, applying GAPDH as the housekeeping gene (Song et al., 2023).
Wound-healing assay
The A549 cell migration was measured by wound-healing assay (Zhang et al., 2022). A549 cells at a concentration of 2 × 10⁵ cells/well were cultured in a 24-well plate and scratched using an aseptic pipette tip. After washing with phosphate buffer, the A549 cells were cultivated in serum-free medium. The BX53M upright metallographic microscope (Olympus, Tokyo, Japan) was applied to observe and capture the representative images at 0 and 48 h. Meanwhile, the wound closure (%) of A549 cells was counted.
Transwell assay
Transwell assay was conducted to evaluate the invasion of A549 cells (Zhou et al., 2021). Firstly, each Transwell chamber was added with 70 µL diluted Matrigel and placed at 37 °C for 2 h to coagulate the Matrigel. Then, the A549 cells (2 × 10⁵ cells/well) were suspended in 250 µL non-serum medium contained in the upper chamber and incubated, while 650 µL medium comprising 10% FBS was supplemented to the lower chamber. Following 24-h cultivation, 5% paraformaldehyde was used to fix the A549 cells invading the lower chamber for 30 min. Then, 0.1% crystal violet was employed to dye the fixed cells for 15 min. Finally, the invaded A549 cells were quantified under the BX53M upright metallic microscope (Olympus, Tokyo, Japan).
Statistical analysis
Bioinformatic analysis were performed using R software 4.2.1. Two-group differences were calculated by Wilcoxon rank test. The distribution of clinicopathologic features was analyzed by Chi-Squared test. Survival differences among different risk groups or subtypes were compared by Kaplan-Meier curves. Data were shown as mean ± standard deviation, and GraphPad Prism 7.0 was employed to conduct statistical analysis. Student’s t-test was employed to test two-group comparisons. And p < 0.05 was considered statistically significant.
Results
Using NMRGs to classify two molecular subtypes of LUAD
Firstly, six NMRGs (ENPP1, NNT, NT5C1A, NT5C3A, NT5E, and PNP) were significantly correlated with the prognostic outcomes of LUAD (Fig. 1A). Using these six NMRGs, consensus clustering analysis was performed on the 500 samples in TCGA-LUAD dataset. According to the CDF and CDF Delta area curves, the clustering results were stable when there were two clusters (Fig. 1B). Thus, LUAD patients were divided into two subtypes when consensus matrix k = 2 (Fig. 1C). In TCGA-LUAD cohort, the OS probability in C2 subtype was more favorable than that in C1 subtype (Fig. 1D), indicating that C2 subtype patients exhibited a better prognosis than C1 subtype. In addition, 226 samples in GSE31210 dataset were similarly clustered into two stable subtypes, which also showed clear prognostic differences (Fig. 1E).
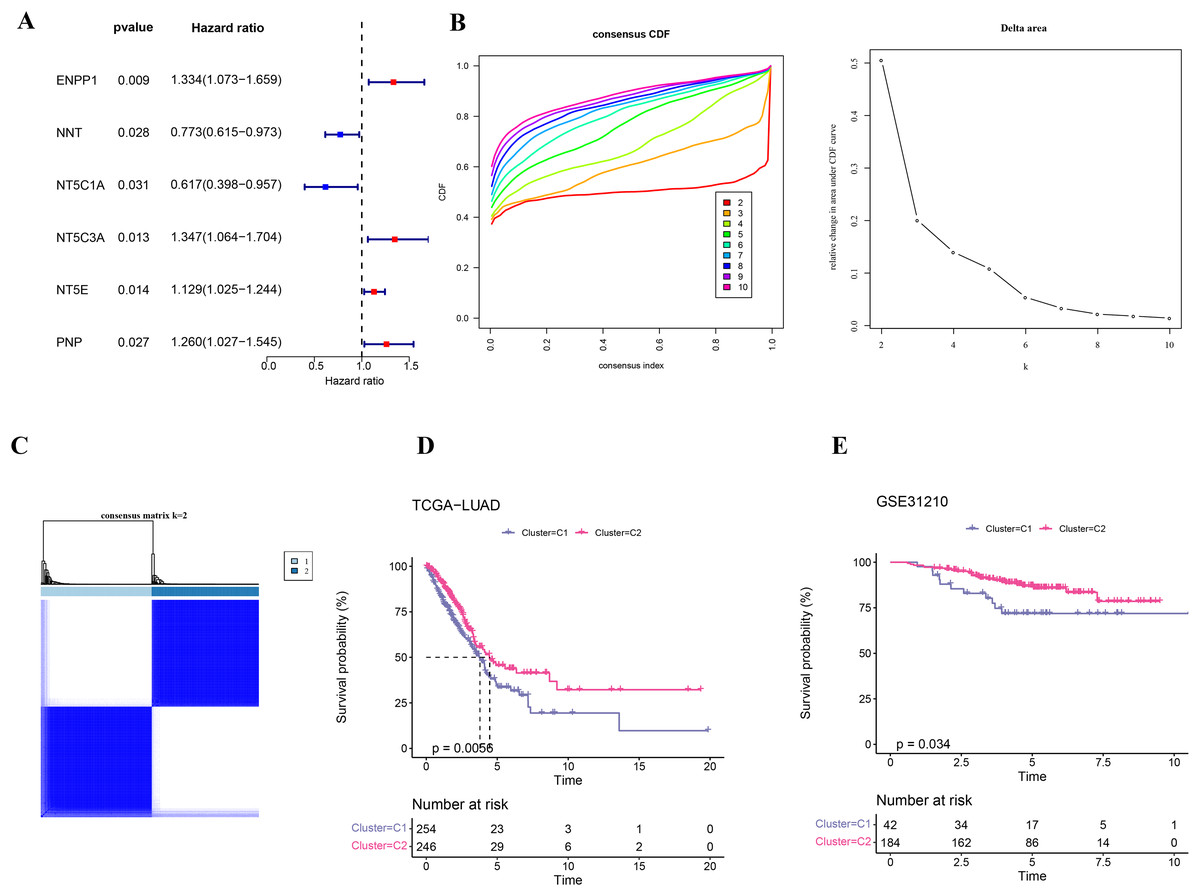
Figure 1: Identification on the molecular subtypes of LUAD based on NMRGs.
(A) The NMRGs associated with prognosis. (B) Consensus cumulative distribution function (CDF) and CDF Delta area curves in TCGA-LUAD cohort. (C) Heatmap of consensus matrix in TCGA-LUAD cohort. (D) Overall survival (OS) difference between two molecular subtypes in TCGA-LUAD cohort. (E) OS curve of two molecular subtypes in GSE31210.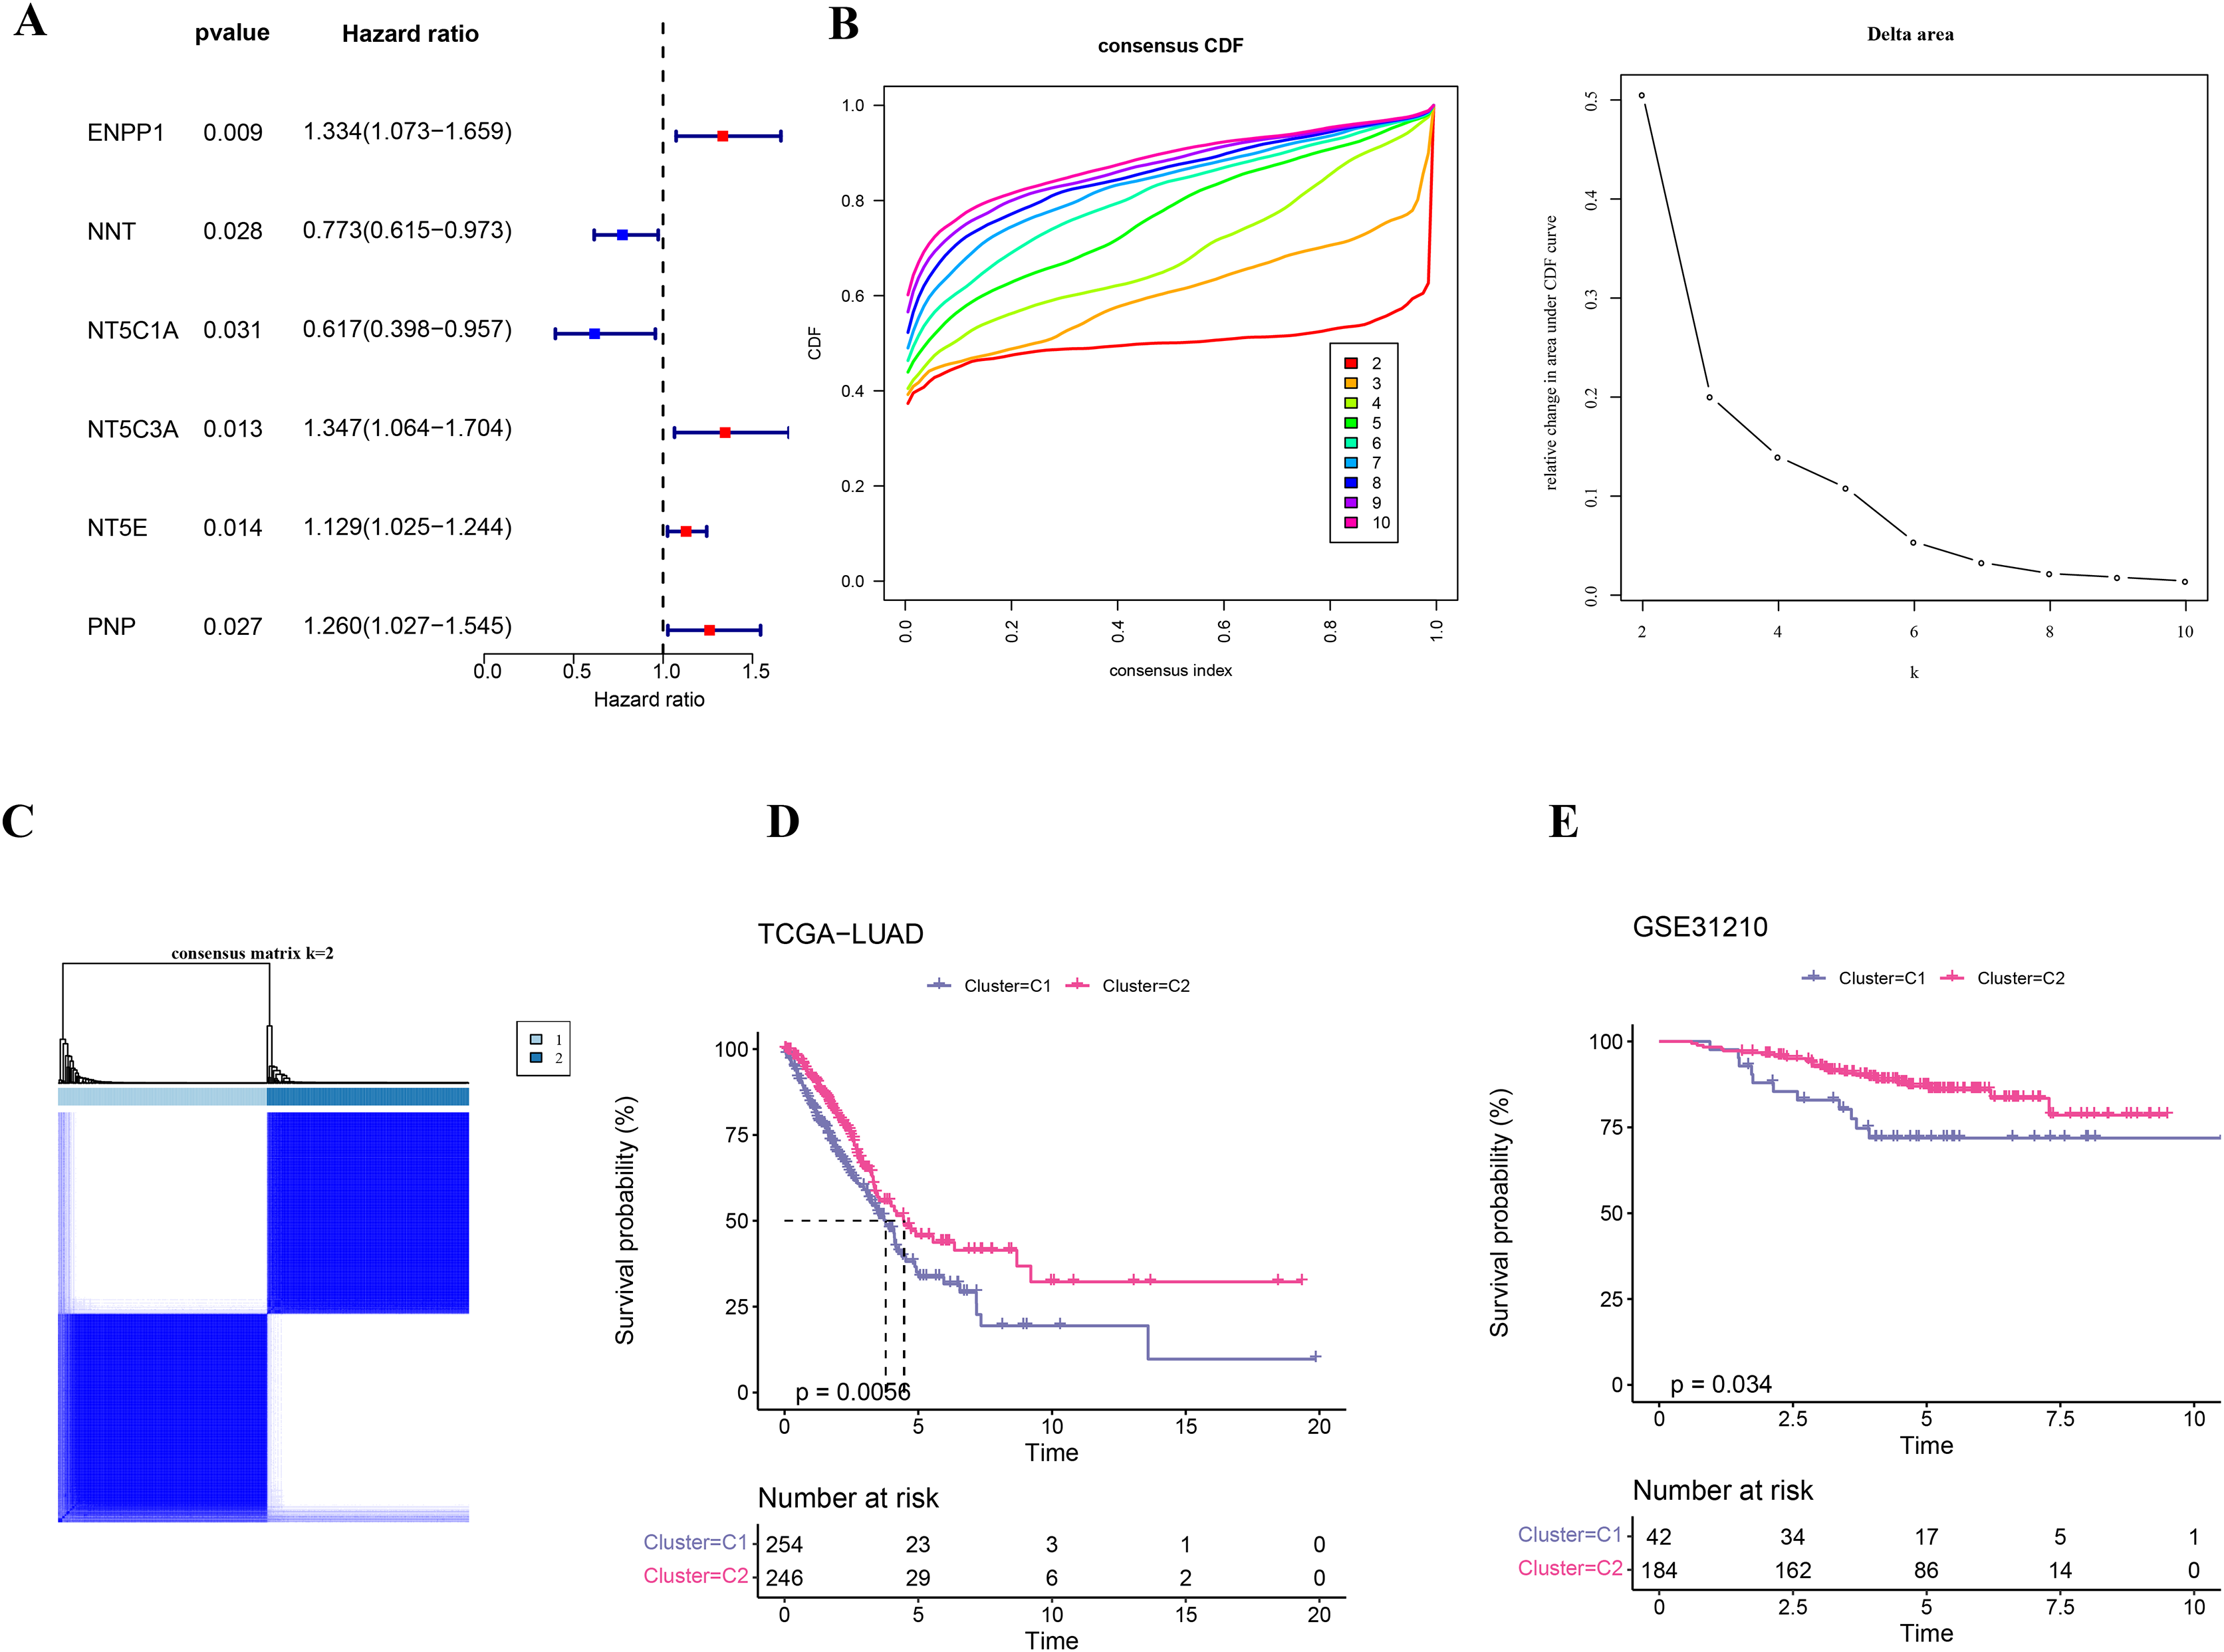
Clinical features and somatic gene mutation landscape between the two subtypes
Comparison on the distribution difference of clinicopathologic features between C1 and C2 in TCGA-LUAD cohort showed that compared to C2 subtype, more patients in C1 subtype were in the pathologic_M1, pathologic_T3, T4, pathologic_N1, N2, and pathologic_stage II, III (Figs. 2A–2D). In addition, 369 somatic mutation genes with significantly high mutation frequency between C1 and C2 subtypes were obtained and the mutation distribution of the top 20 genes was visually displayed. The top three somatic genes with the highest mutation frequencies were TTN (45.25%), FLG (25.25%), and ZNF536 (19.8%) (Fig. 2E).
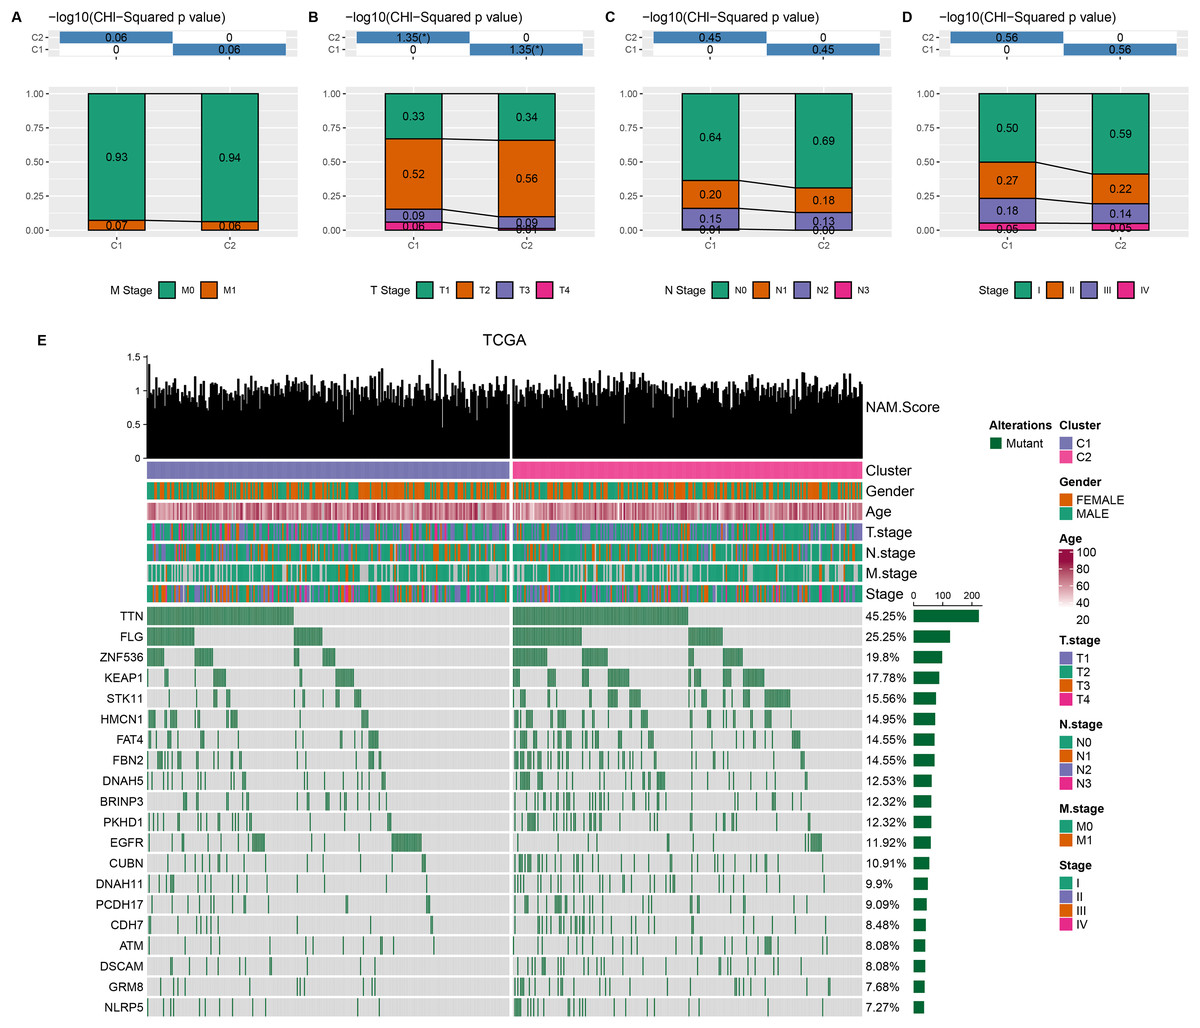
Figure 2: Clinical features and somatic gene mutation landscape between two molecular subtypes.
(A–D) The distribution difference of clinical features between two molecular subtypes in TCGA-LUAD cohort, including M Stage, T Stage, N Stage, and Stage. * means p < 0.05. (E) The somatic gene mutation landscape between two molecular subtypes in TCGA-LUAD cohort.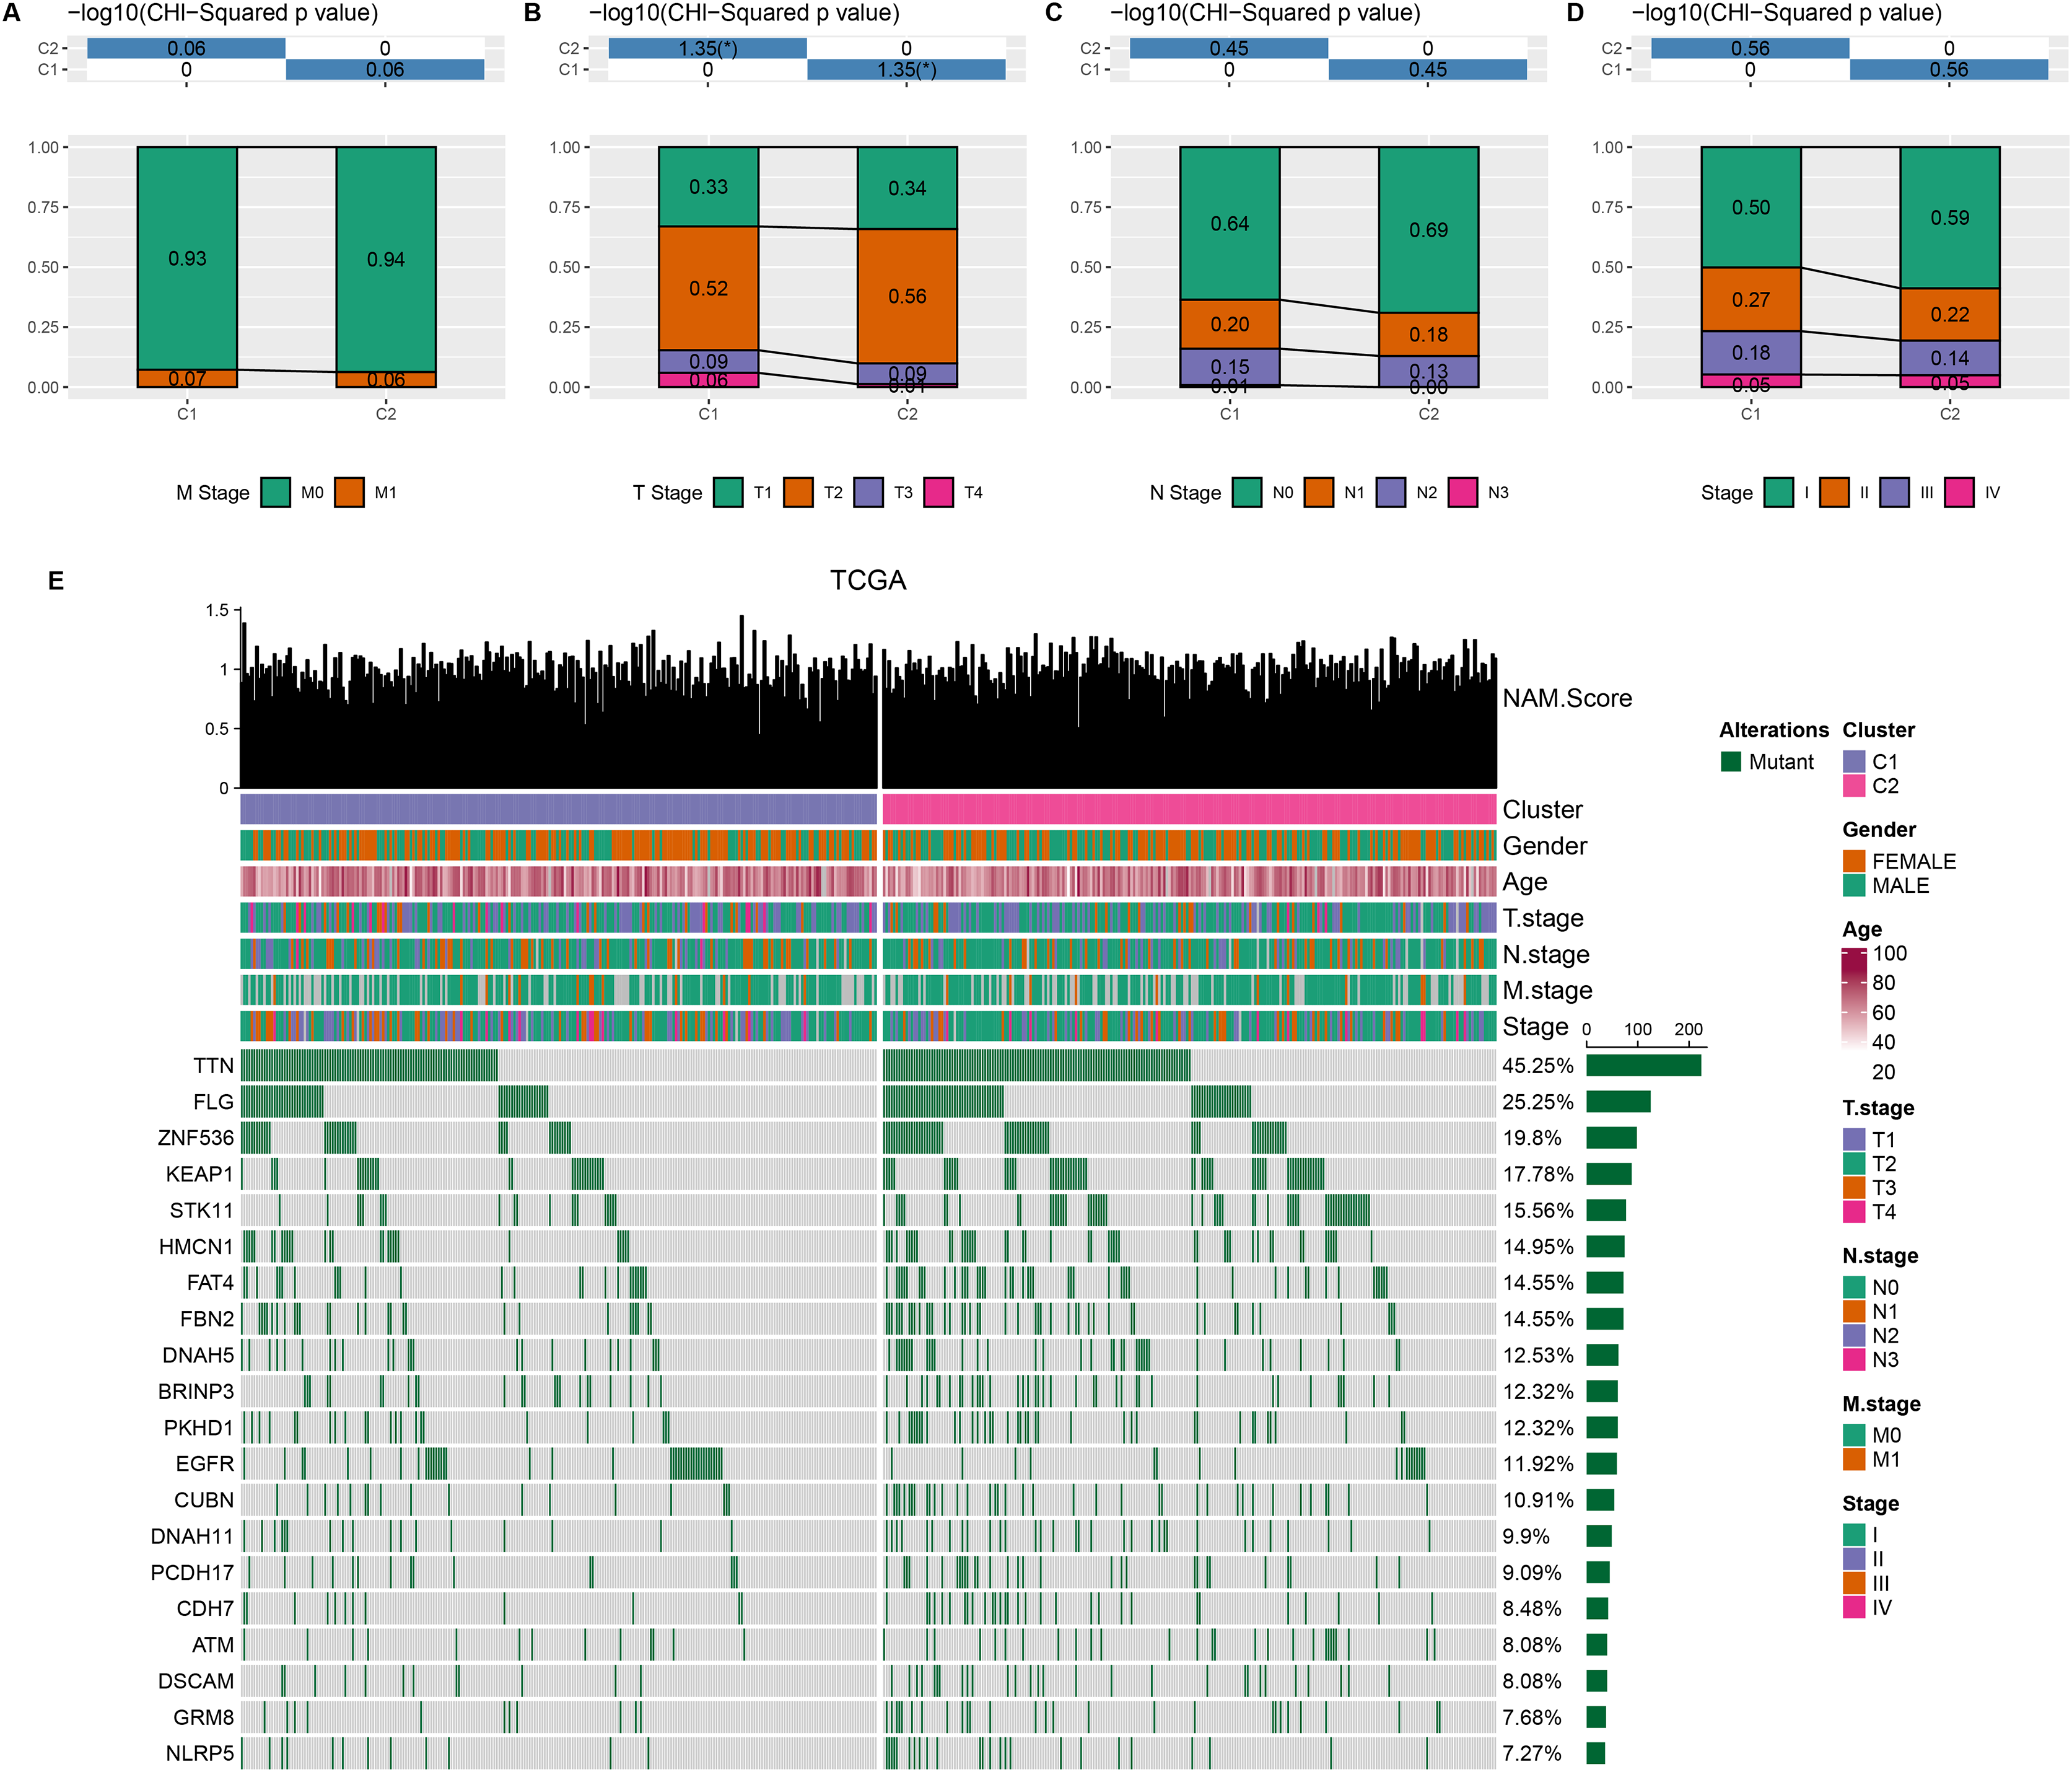
DEGs were identified and GSEA was performed between two subtypes
Firstly, DEG analysis between C1 and C2 in TCGA-LUAD cohort screened 178 upregulated DEGs and 61 downregulated DEGs (Fig. 3A). Furthermore, GSEA showed that C1 subtype was specifically enriched in multiple pathways, including the P53_PATHWAY, GLYCOLYSIS, TGF_BETA_SIGNALING, KRAS_SIGNALING_UP, HYPOXIA, which are associated with the progression and deterioration of tumors (Fig. 3B). However, C2 subtype was enriched in the pathways such as MTORC1_SIGNALING, FATTY_ACID_METABOLISM, MYC_TARGETS_V2, and REACTIVE_OXYGEN_SPECIES_PATHWAY (Fig. 3B). These results showed that C1 subtype was more associated with glycolytic metabolism-related pathways, while C2 subtype was more related to fatty acid metabolism pathway.
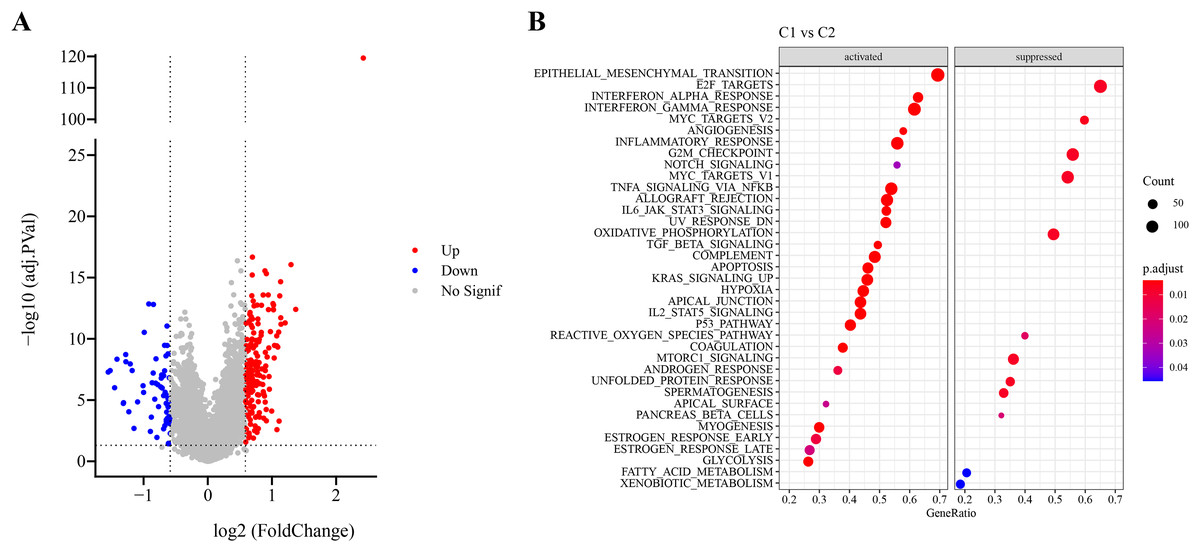
Figure 3: Identification and pathway enrichment analysis of differentially expressed genes (DEGs).
(A) Volcano map of DEGs between two molecular subtypes in TCGA-LUAD cohort. (B) HALLMARK pathway enrichment results of DEGs between two molecular subtypes.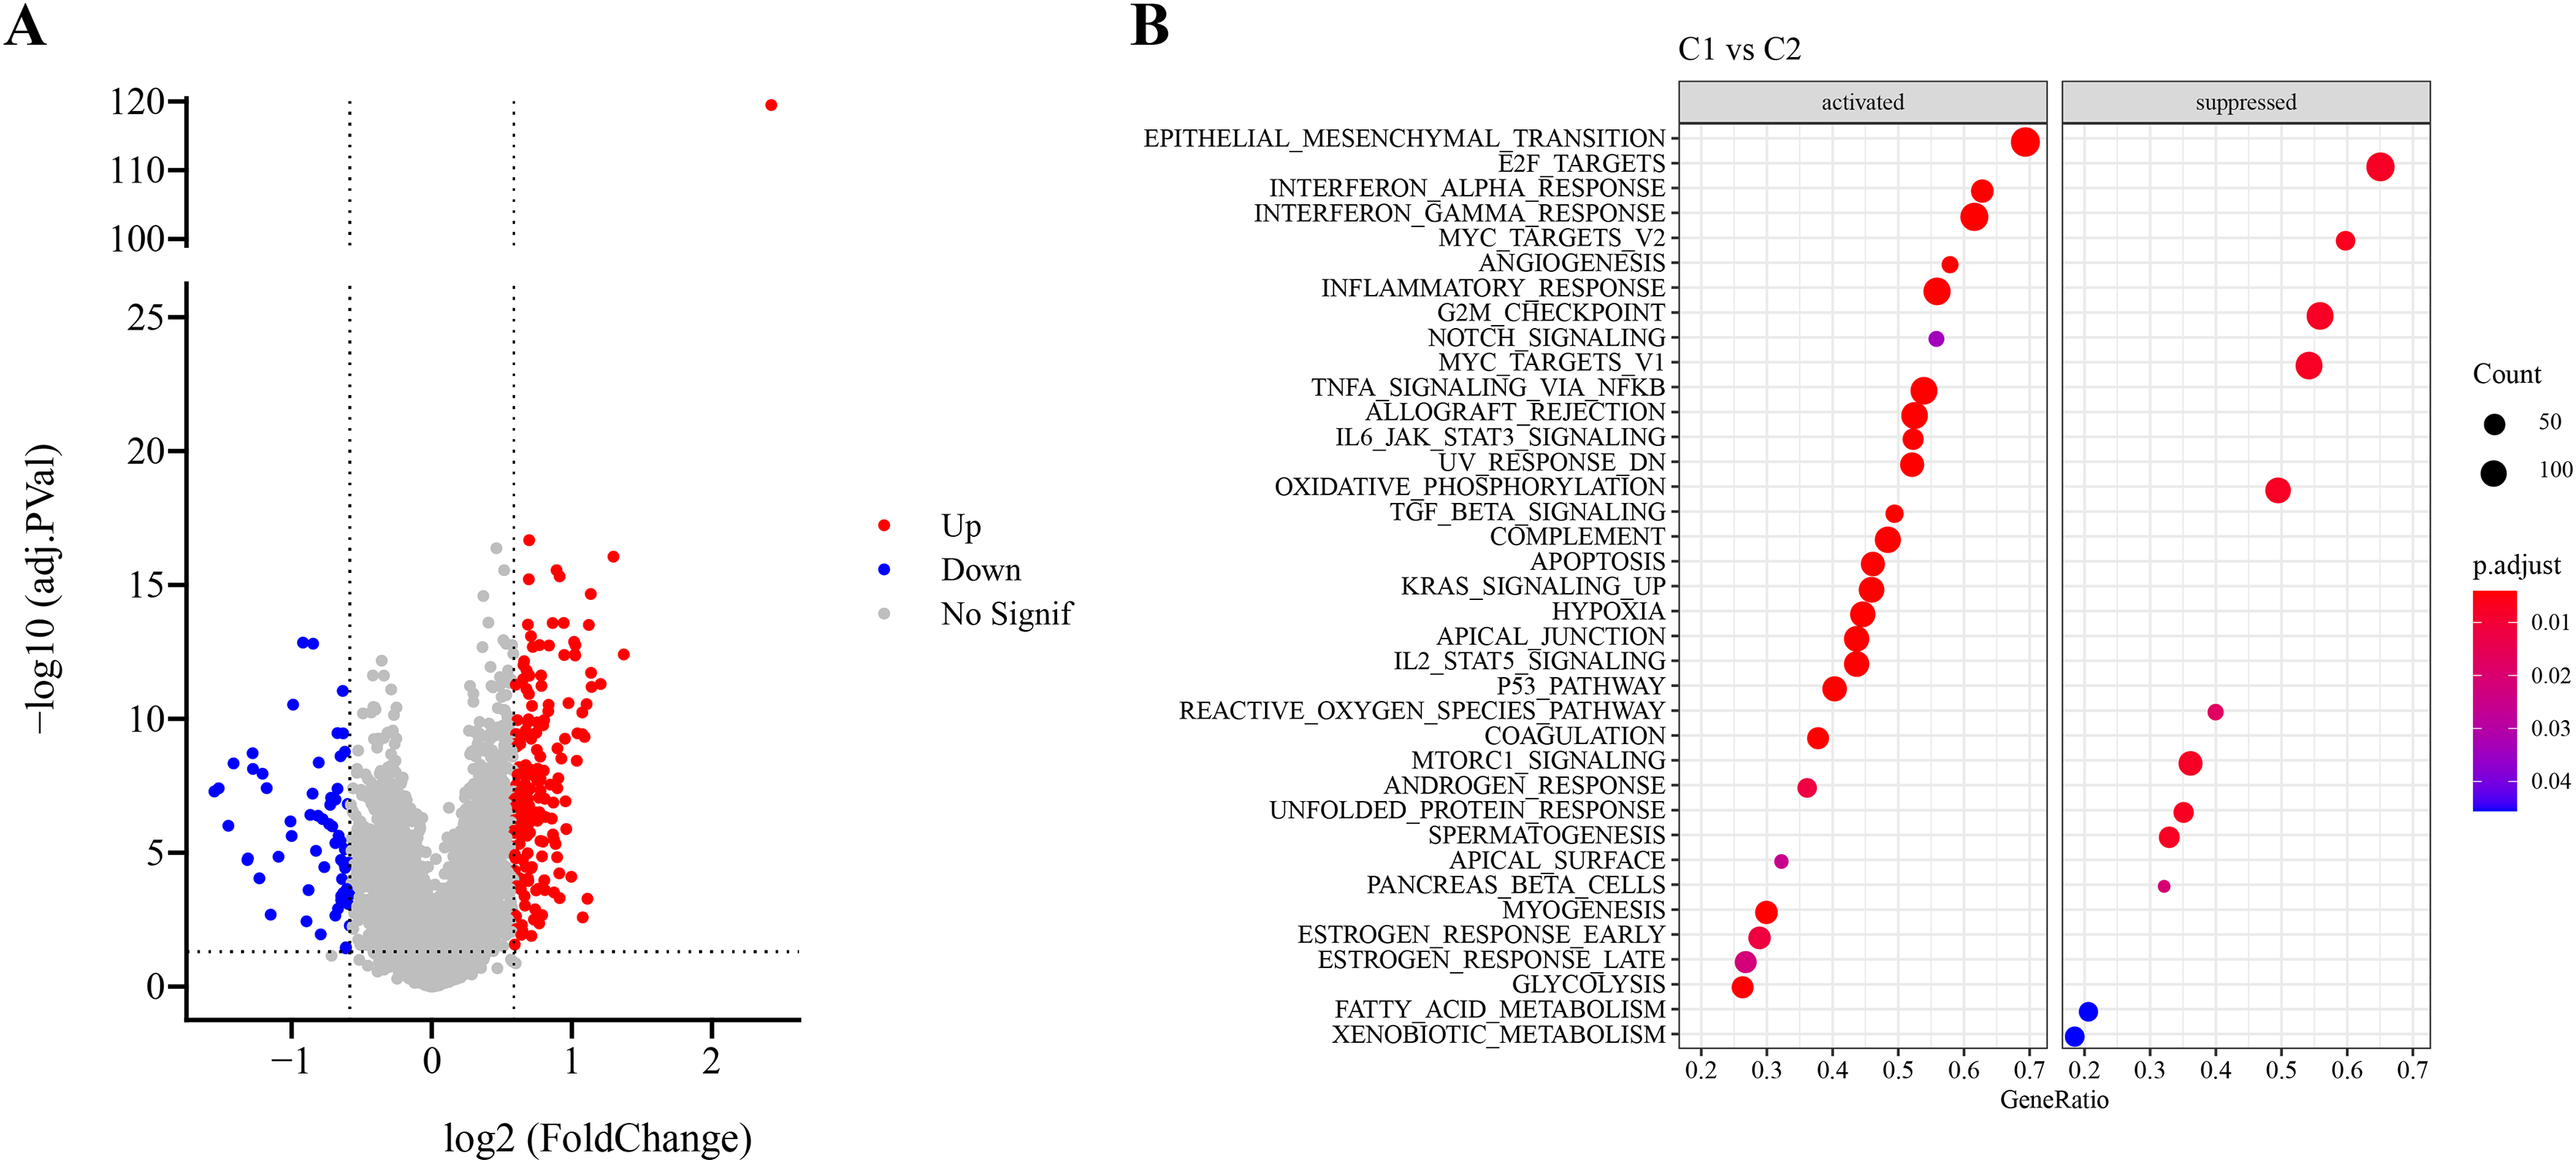
RiskScore model with a high prediction performance was constructed
Univariate Cox regression analysis screened 88 genes significantly related to LUAD prognosis between C1 and C2 (p < 0.05). To refine the risk model, LASSO Cox regression analysis with 10-fold cross validation was performed to reduce gene number (Figs. 4A and 4B). Subsequently, four independent prognostic NMRGs, including 1 protective gene (CPA3) and three risk genes (DKK1, GJB3, KRT6A), were screened by multivariate Cox regression analysis (Fig. 4C) and used to establish a RiskScore model:
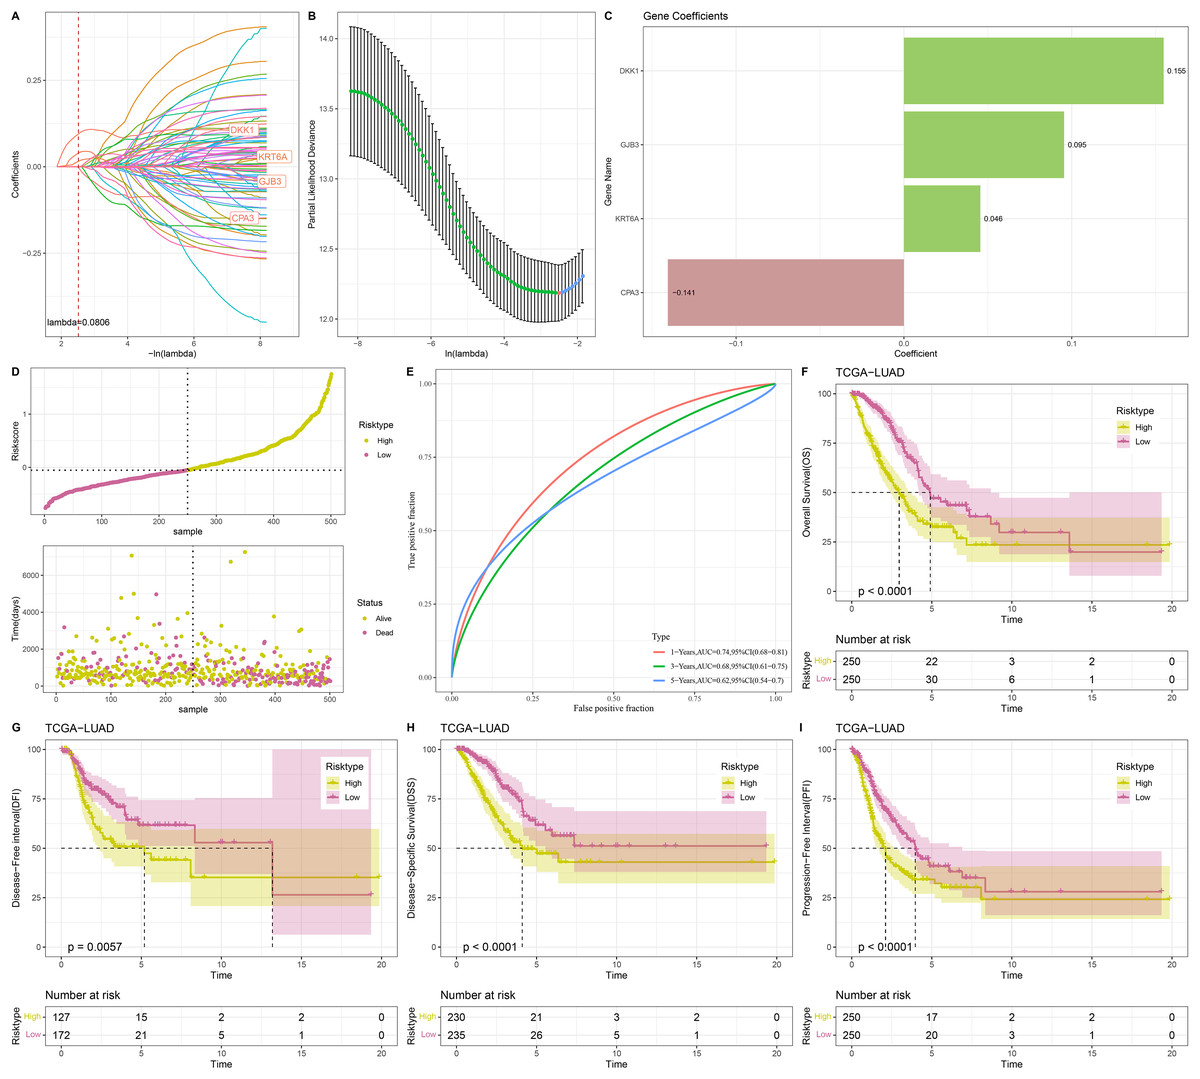
Figure 4: Construction and evaluation of RiskScore model.
(A, B) Results of narrowing the gene range through LASSO. (C) The coefficients of four independent prognostic NMRGs in TCGA-LUAD cohort. (D) RiskScore of samples in TCGA-LUAD cohort. (E) ROC curve of RiskScore model for 1-, 3-, and 5-years in TCGA-LUAD cohort. (F–I) Kaplan-Meier curves of OS, disease-free interval (DFI), disease-specific survival (DSS), and progression-free interval (PFI) between two risk groups in TCGA-LUAD cohort.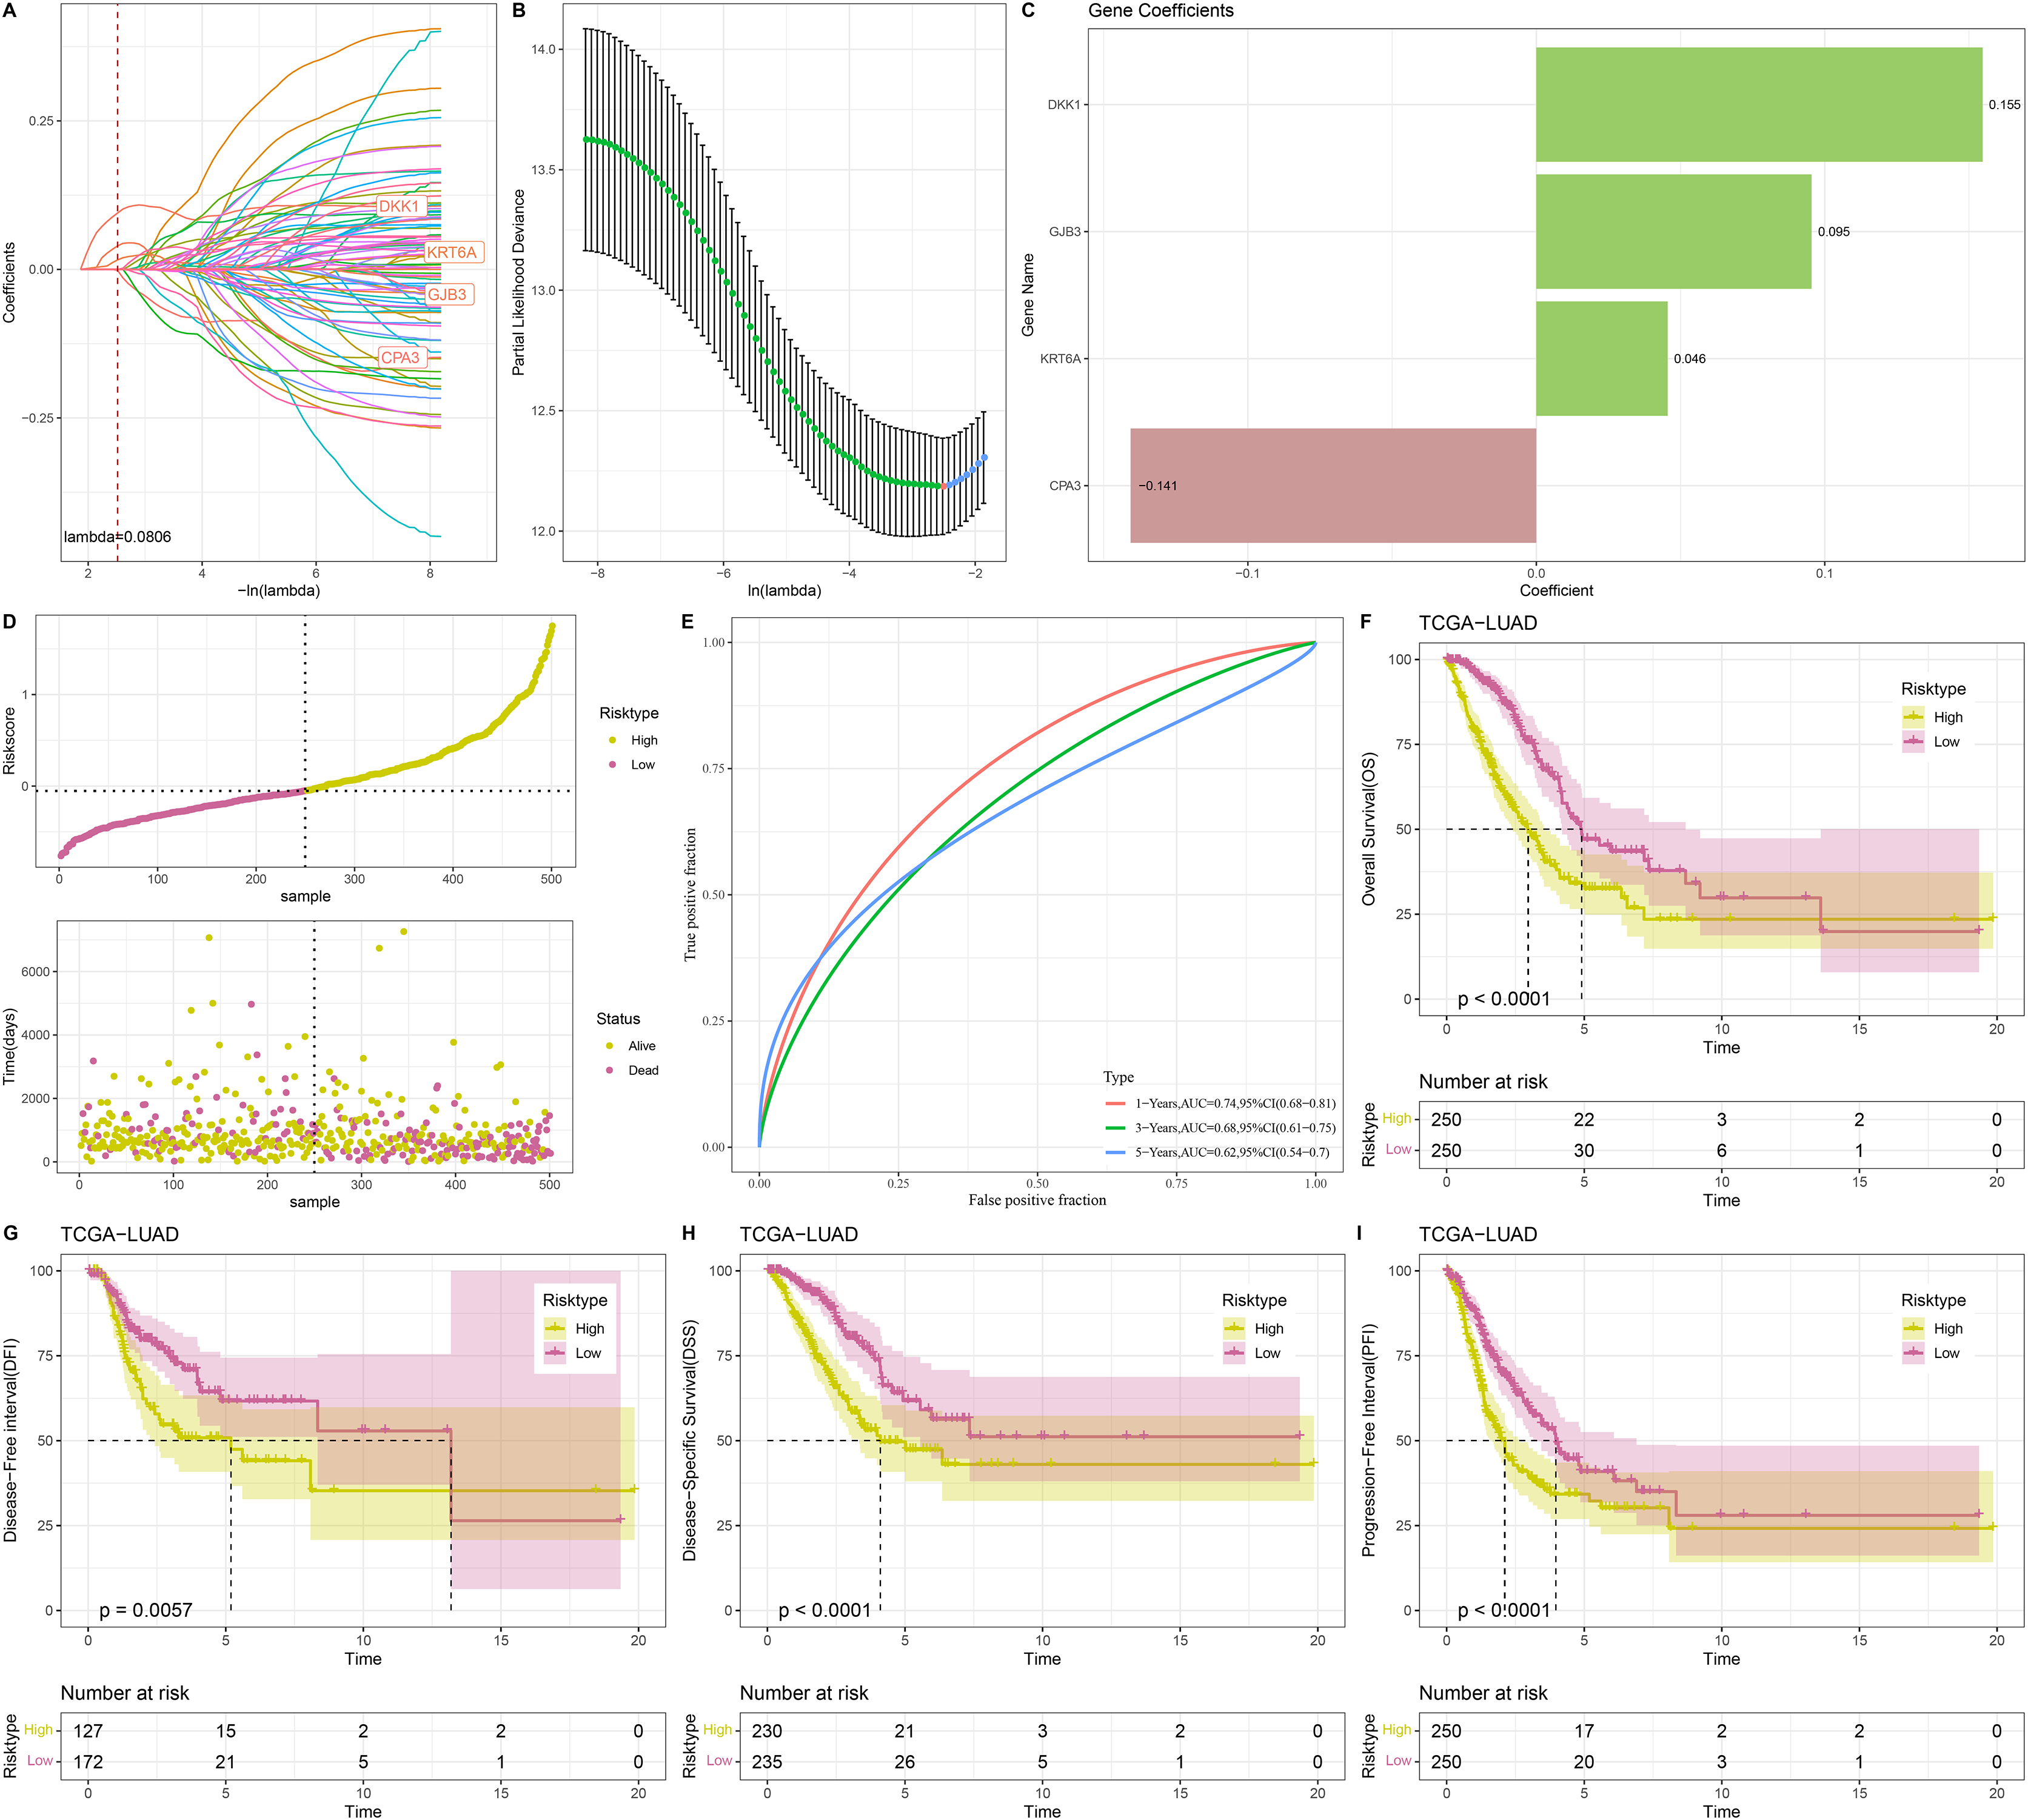
A total of 500 samples in TCGA-LUAD were divided by the median RiskScore value into low-risk and high-risk groups (Fig. 4D). Furthermore, the AUC displayed that the RiskScore model was credible with 1-, 3-, and 5- year AUC of 0.74, 0.68, and 0.62, respectively (Fig. 4E). In TCGA-LUAD cohort, Kaplan-Meier curves demonstrated that low-risk group had better survivals in terms of progression-free interval (PFI), OS, disease-specific survival (DSS), and disease-free interval (DFI) (Figs. 4F–4I), which suggested that patients with a high RiskScore had a worse prognosis.
The RiskScore model was validated in GSE31210 dataset
To confirm the stability and reliability of RiskScore model, the GSE31210 dataset containing 226 tumor samples served as an independent validation set. Similarly, the results in validation cohort were in line with those in TCGA-LUAD training set. In detail, 226 tumor samples in GSE31210 dataset were divided into low- and high-risk groups (Fig. 5A), with low-risk patients having a higher OS probability (Fig. 5C). This suggested that the prognostic outcomes of low-risk patients were more favorable than the high-risk patients. The ROC curve also validated the reliability of the RiskScore model, with 1-, 3-, and 5-year AUC of 0.74, 0.69, and 0.59, respectively (Fig. 5B). Moreover, to further investigate the roles of the four model genes (GJB3, CPA3, DKK1, KRT6A) in LUAD prognosis, 226 patients in GSE31210 dataset were divided by the median expression of these genes into high- and low- expression groups. Except for DKK1, the expressions of GJB3, CPA3, and KRT6A were closely linked to the OS of LUAD patients. The low expression groups of GJB3 and KRT6A exhibited better OS than high expression groups, while the high expression group of CPA3 had higher OS rate than low expression group (Fig. 5D), indicating that the expressions of these model genes could affect LUAD prognosis.
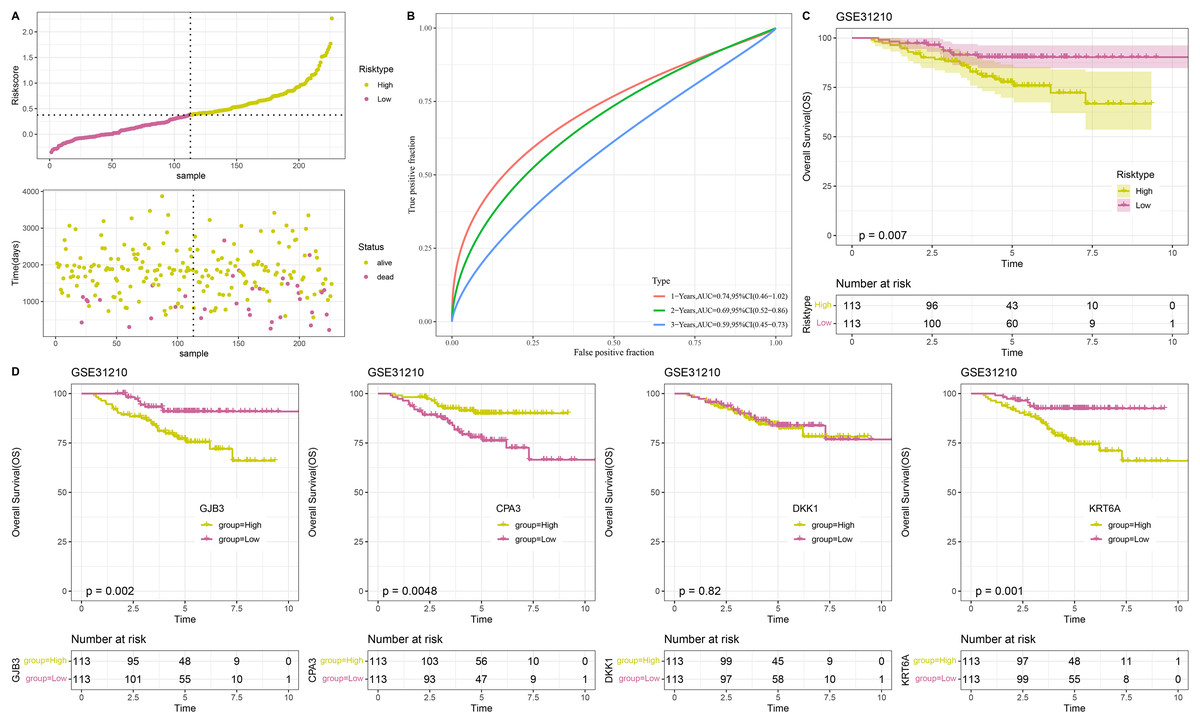
Figure 5: Validation of RiskScore model.
(A) RiskScore of samples in GSE31210 dataset. (B) ROC curve of RiskScore model for 1-, 3-, and 5-years in GSE31210 dataset. (C) OS curve of two risk groups in GSE31210 dataset. (D) The relationship between high/low expression groups of four independent prognostic NMRGs and OS in GSE31210 dataset.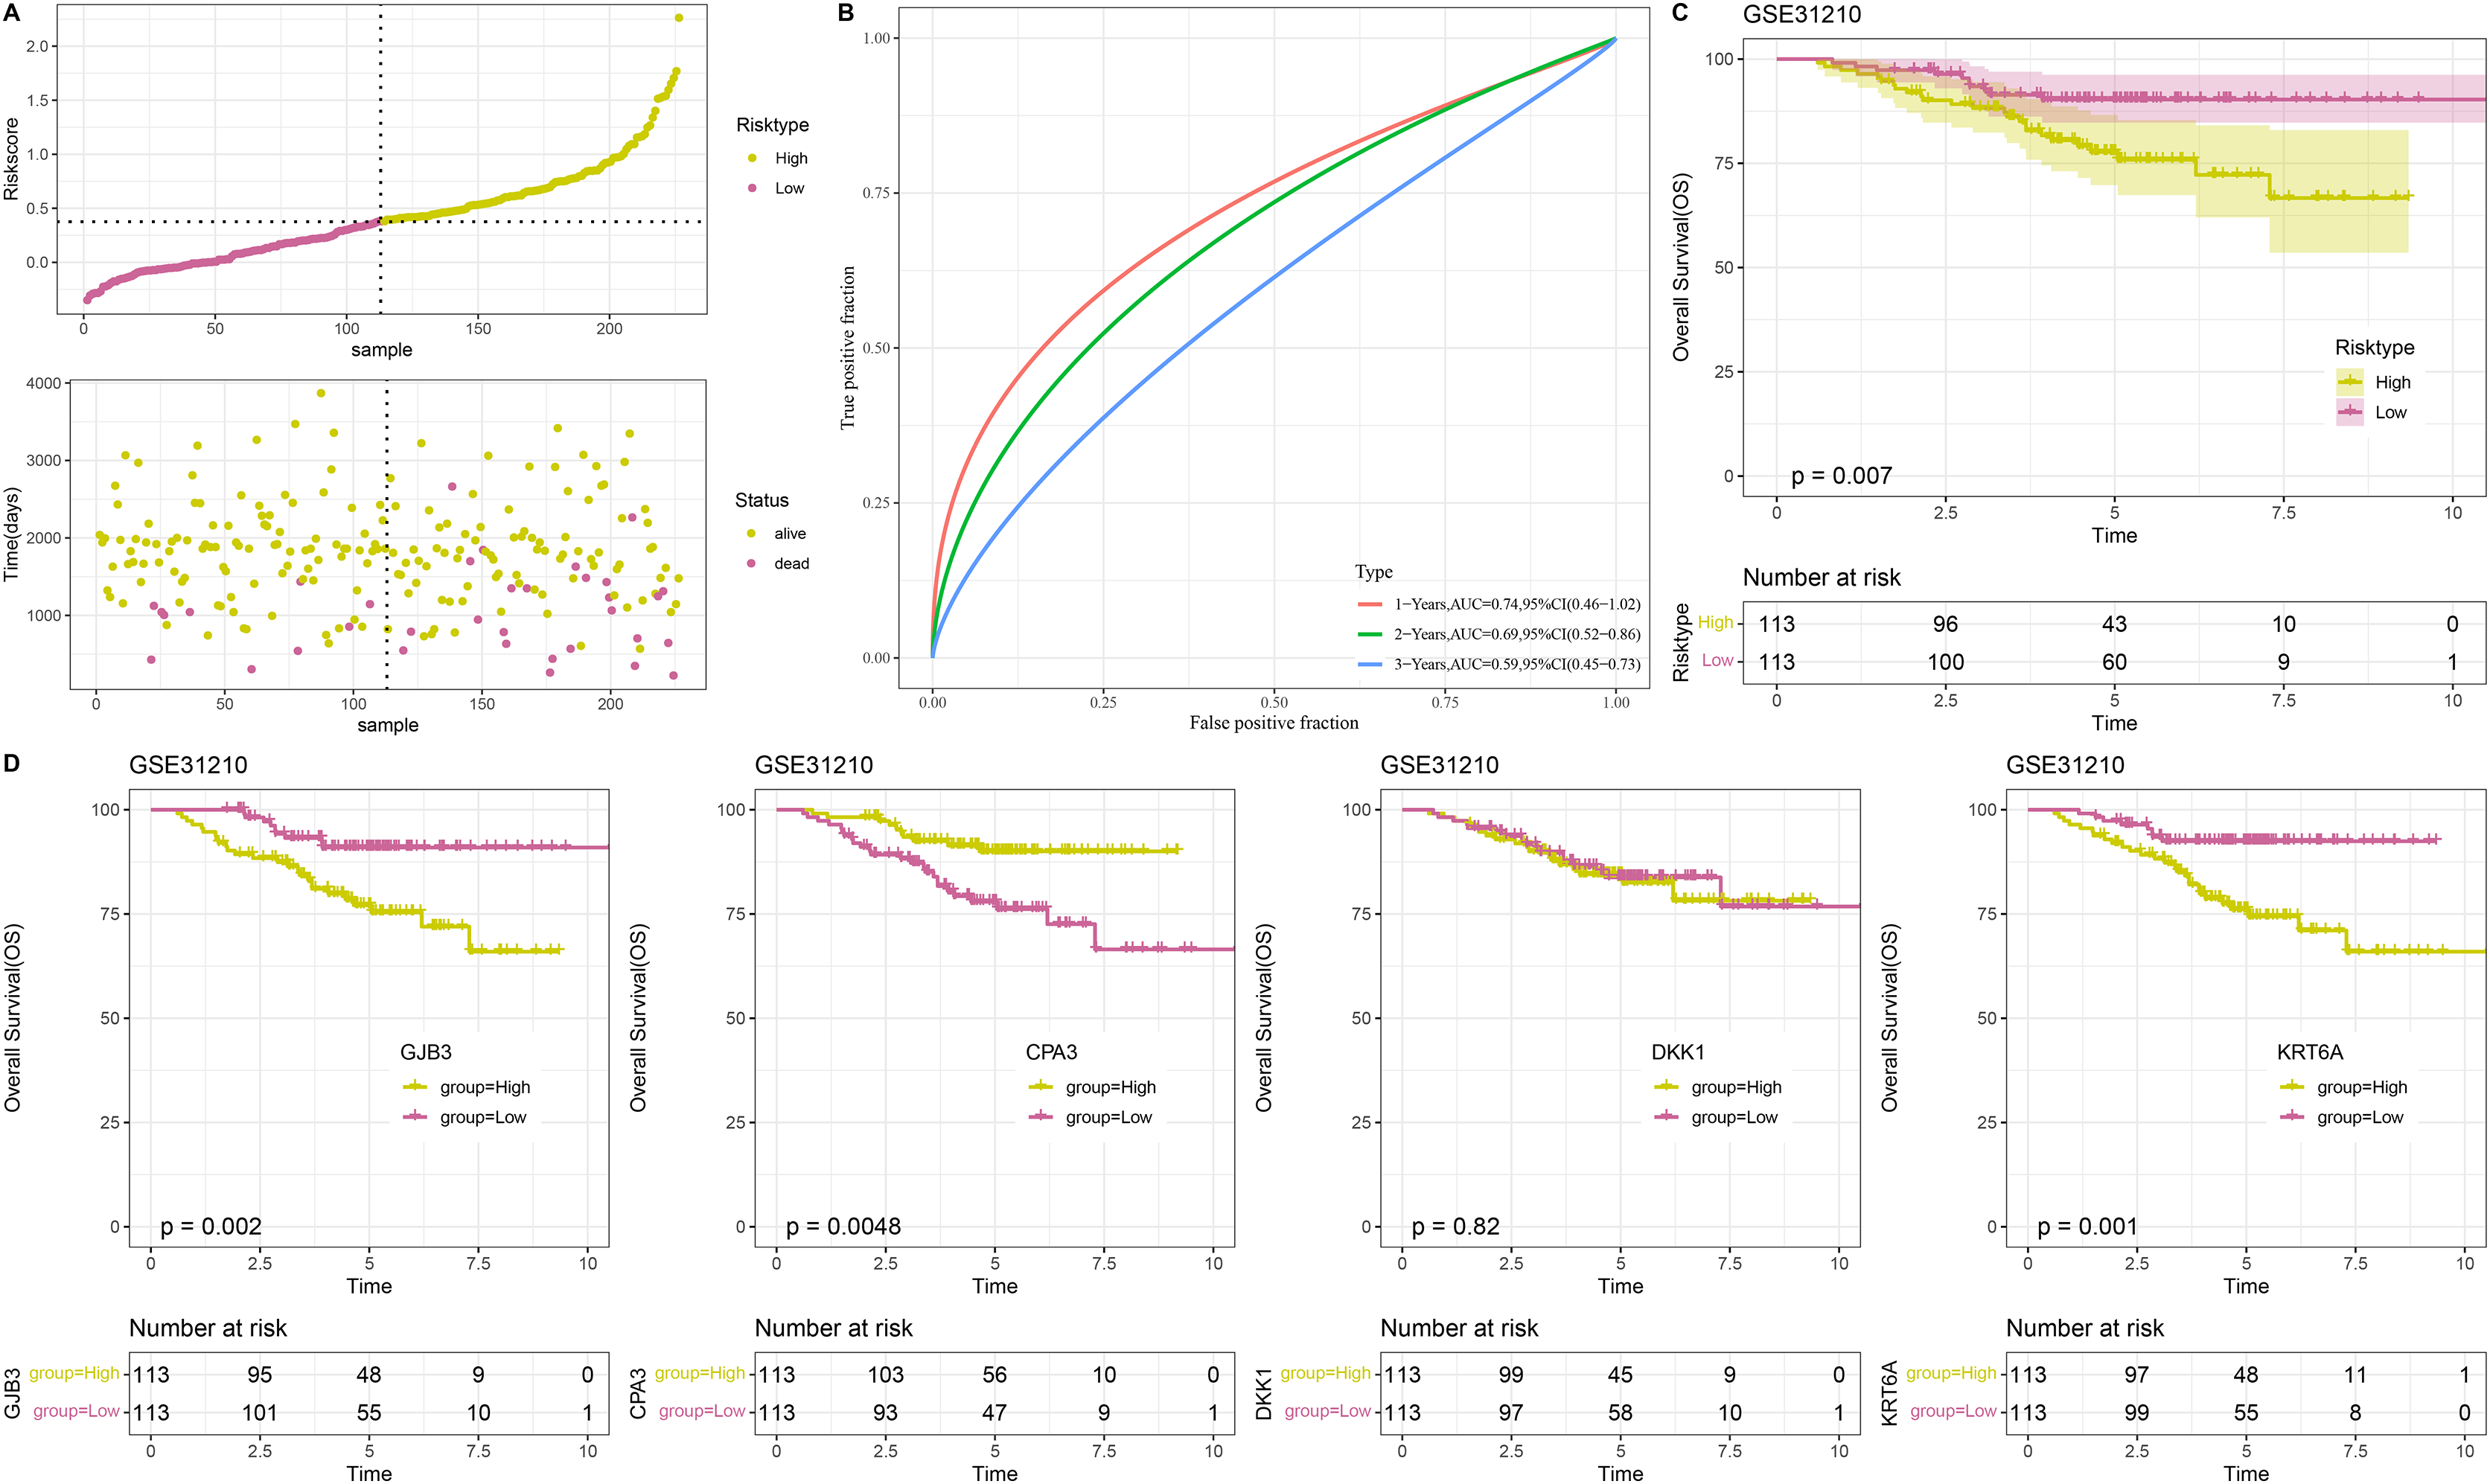
Immune cell infiltration analysis and GSEA between low- and high-risk groups
ESTIMATE, TIMER, ssGSEA, and MCP-counter methods were utilized to compare the degree of immune infiltration between the two risk groups in TCGA-LUAD. Firstly, ESTIMATE analysis revealed that the high-risk group had significantly lower ImmuneScore, StromalScore, and ESTIMATEScore than low-risk group (Fig. 6A), indicating lower immune cell infiltration in the TME of LUAD patients with a high risk. TIMER analysis demonstrated that in comparison to low-risk group, the score of Macrophage was lower in high-risk group (Fig. 6B), implying that the function of Macrophage was inhibited in high-risk patients. The infiltration of 28 types of immune cells was further explored through ssGSEA, and it was observed that compared to low-risk group, the infiltration of most immune cells (such as plasmacytoid dendritic cell, eosinophil, immature dendritic cell, activated CD4 T cell, mast cell, immature B cell, monocyte, natural killer cell, activated B cell) was remarkably lower in high-risk group (Fig. 6C), suggesting an immunosuppressive environment in the high-risk group. Furthermore, MCP-counter analysis demonstrated that the infiltration of neutrophil, T cell, endothelial cell, myeloid dendritic cell and B lineage were significantly reduced in high-risk group (Fig. 6D). The GSEA results showed that the low-risk group was primarily enriched in allograft rejection and bile acid metabolism, whereas the high-risk group was more enriched in numerous HALLMARK pathways (Fig. 7).
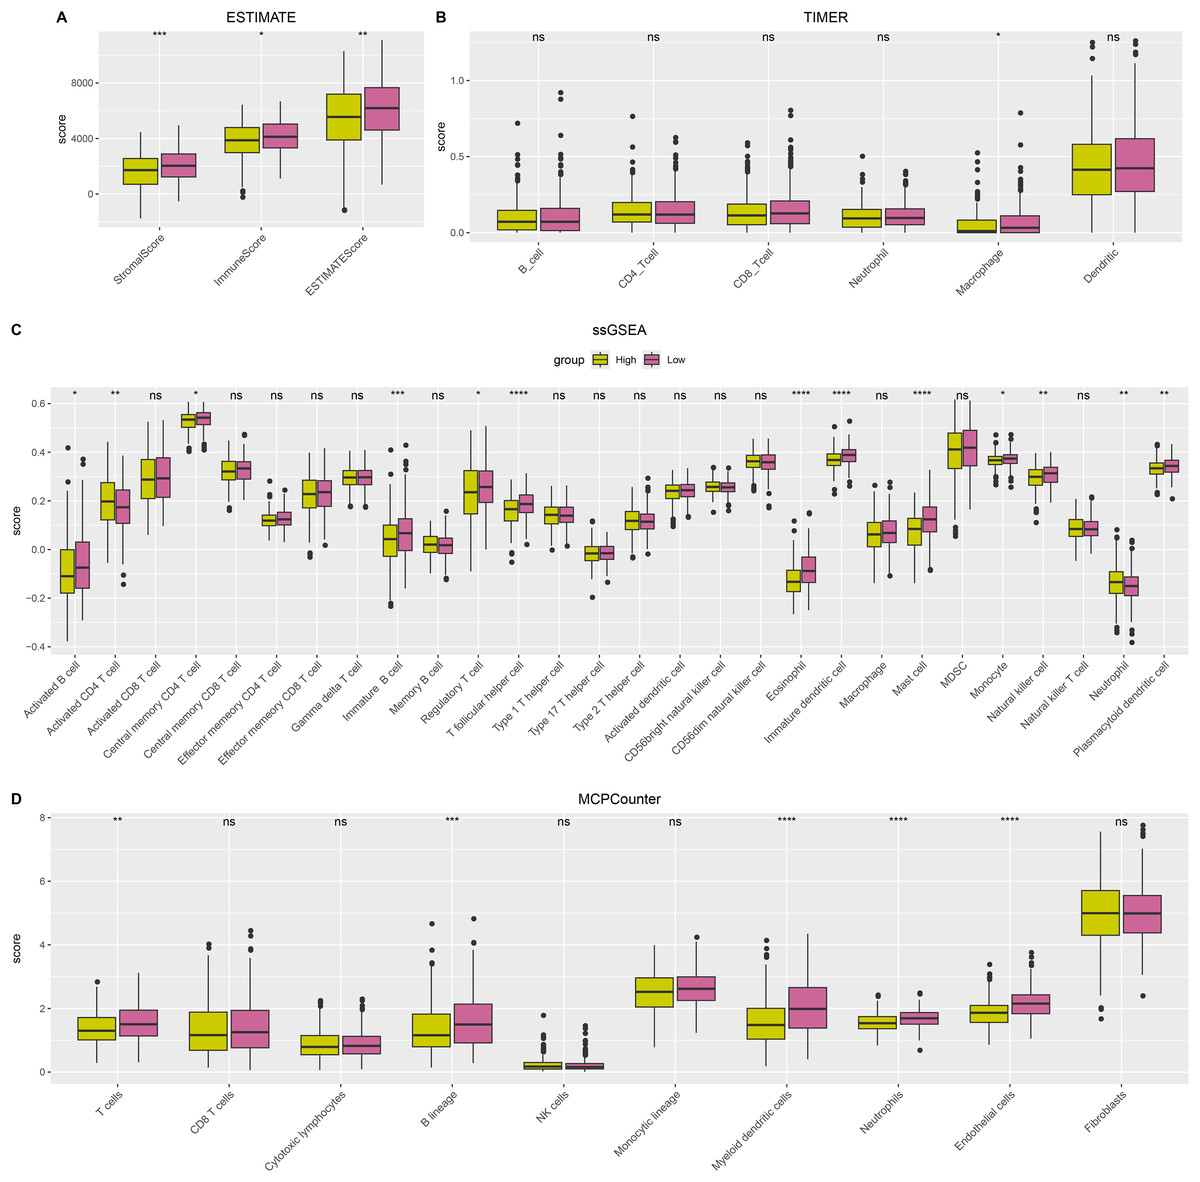
Figure 6: The difference of tumor microenvironment (TME) between two risk groups in TCGA-LUAD cohort.
(A) StromalScore, ImmuneScore, and ESTIMATEScore evaluated by ESTIMATE method. (B) The scores of six immune cells assessed by TIMER method. (C) The scores of 28 immune cells calculated by ssGSEA. (D) The scores of 10 immune cells computed by MCP-counter analysis. **** means p < 0.0001; *** means p < 0.001; ** means p < 0.01; * means p < 0.05; ns means not significant.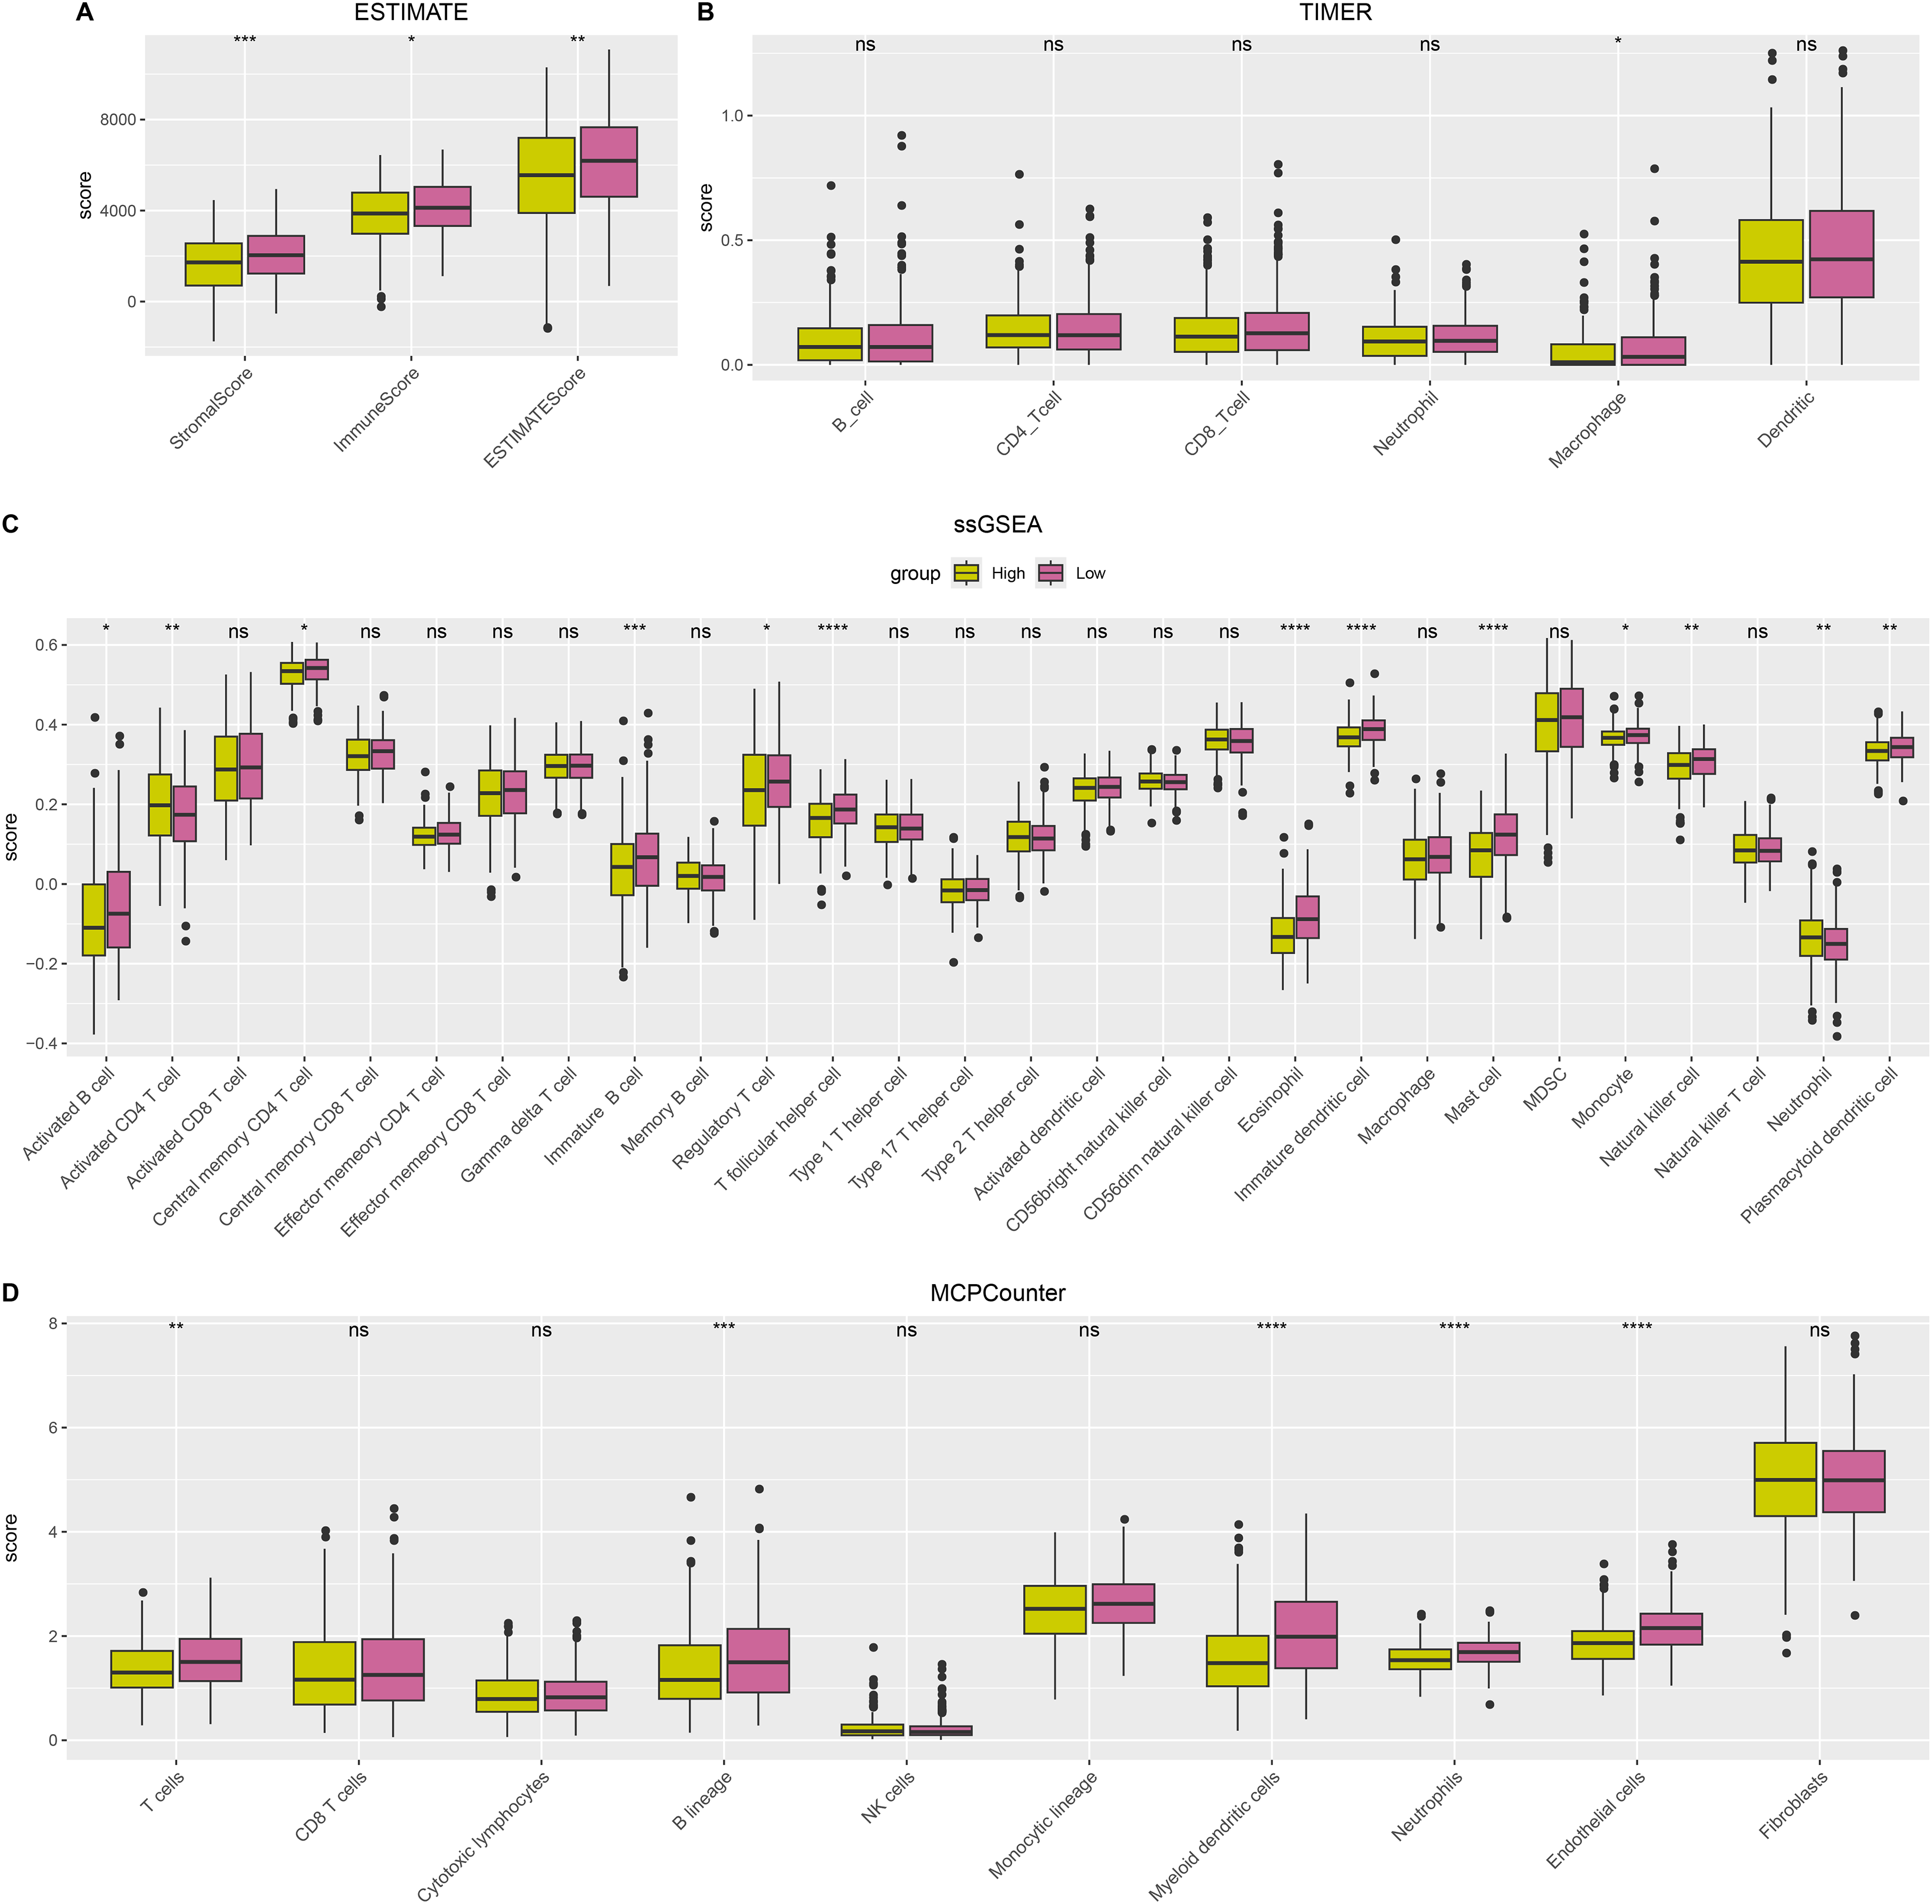
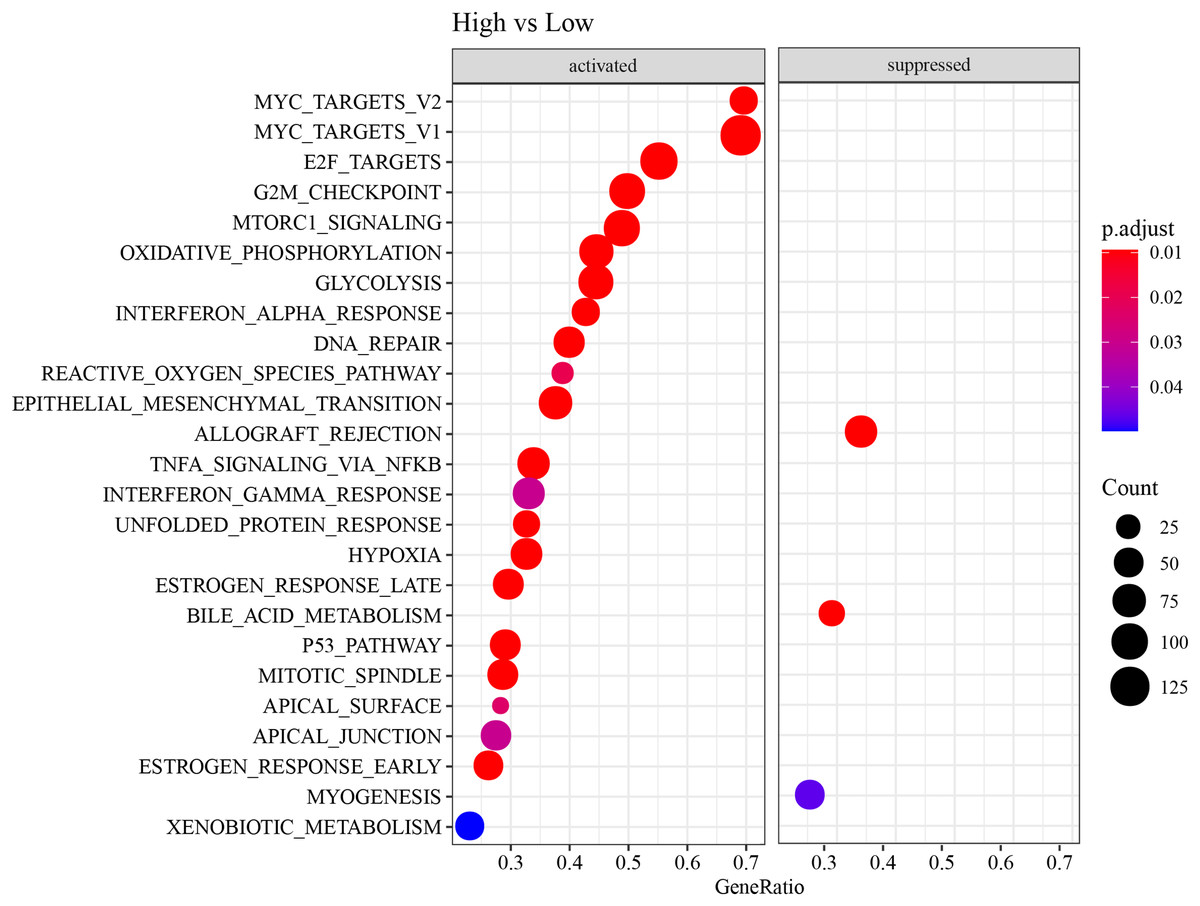
Figure 7: HALLMARK pathway enrichment results of DEGs between two risk groups.
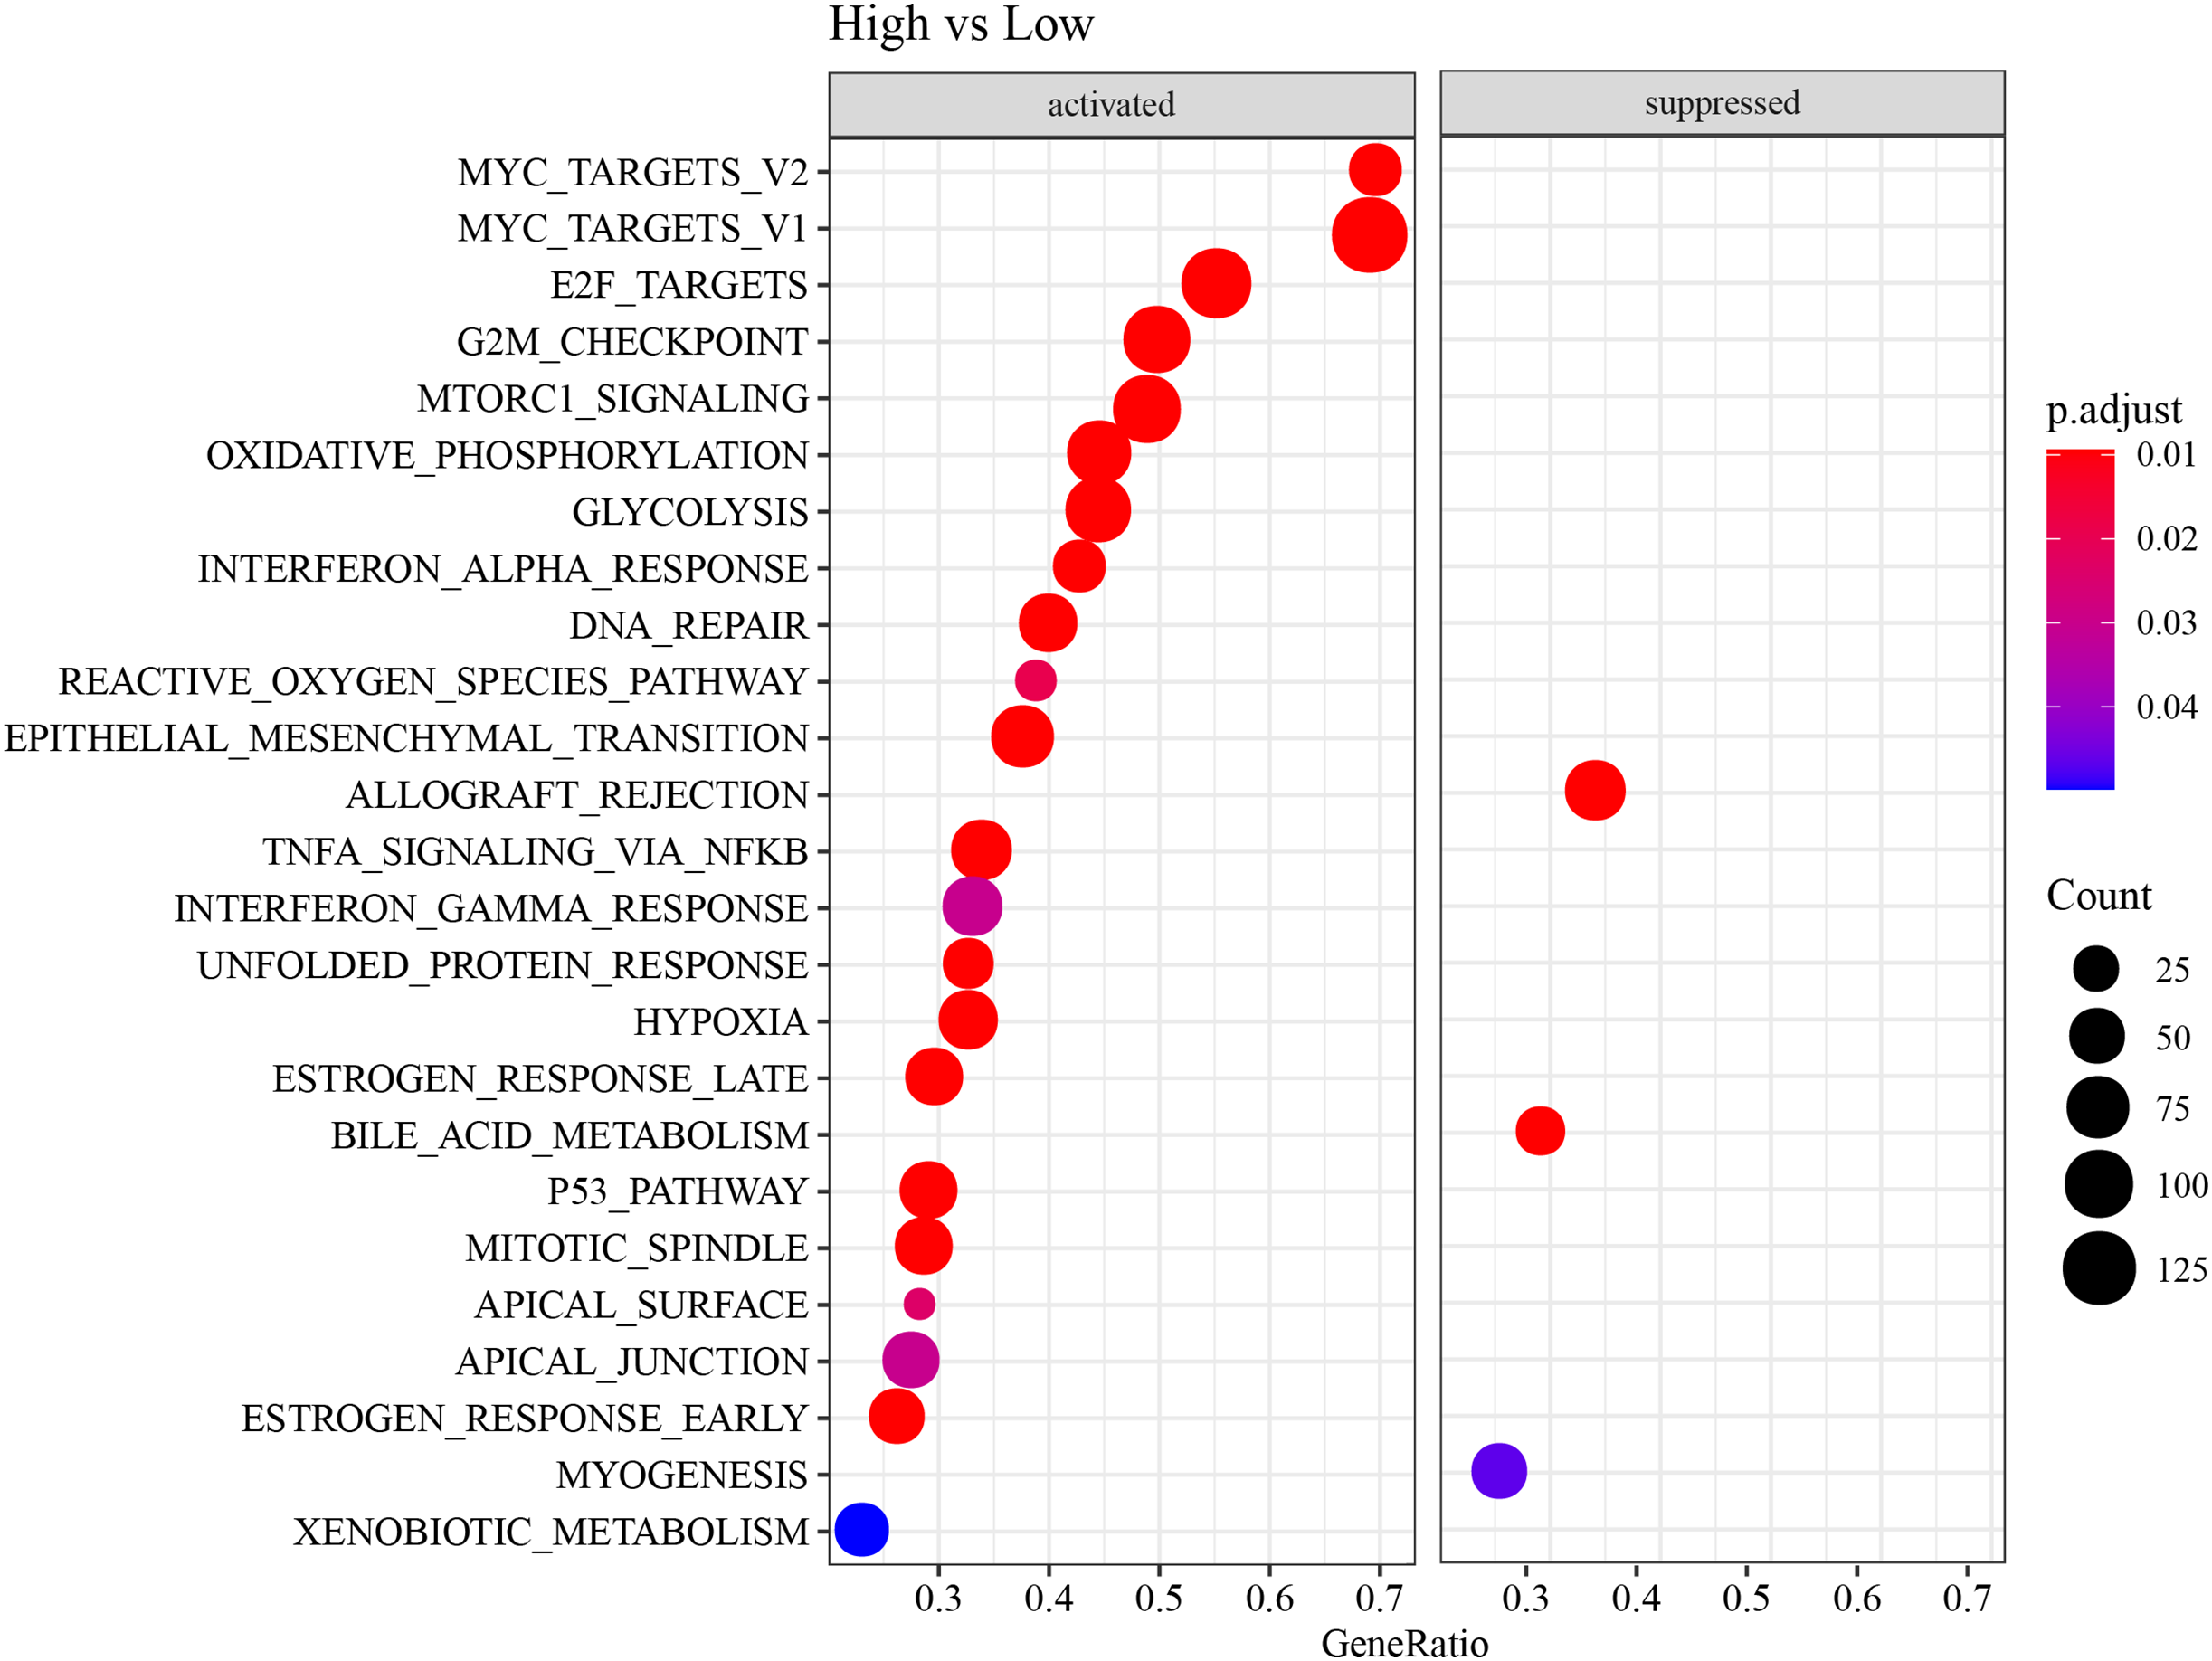
High-risk group exhibited poor immunotherapy response and drug sensitivity
With the purpose to further investigate the potential value of the NMRG signature in the precision treatment of LUAD, the efficacy of immunotherapy and 10 common chemotherapy drugs for different risk groups of TCGA-LUAD patients was analyzed. It was found that the TIDE score of high-risk patients was notably higher (Fig. 8A) and the ratio of responders to immunotherapy in this group was lower (Fig. 8B), showing that high-risk LUAD patients had greater immune escape capabilities and less active immunotherapy responses. Additionally, the IC50 values of Erlotinib, Paclitaxel, Cisplatin, Saracatinib, and CGP_082996 in high-risk group were lower than that in low-risk group (Fig. 8C), which indicated that these drugs were more effective in treating high-risk LUAD patients. However, high-risk LUAD patients exhibited low sensitivities to Rapamycin, PHA_665752, Sorafenib, Imatinib, and Crizotinib.
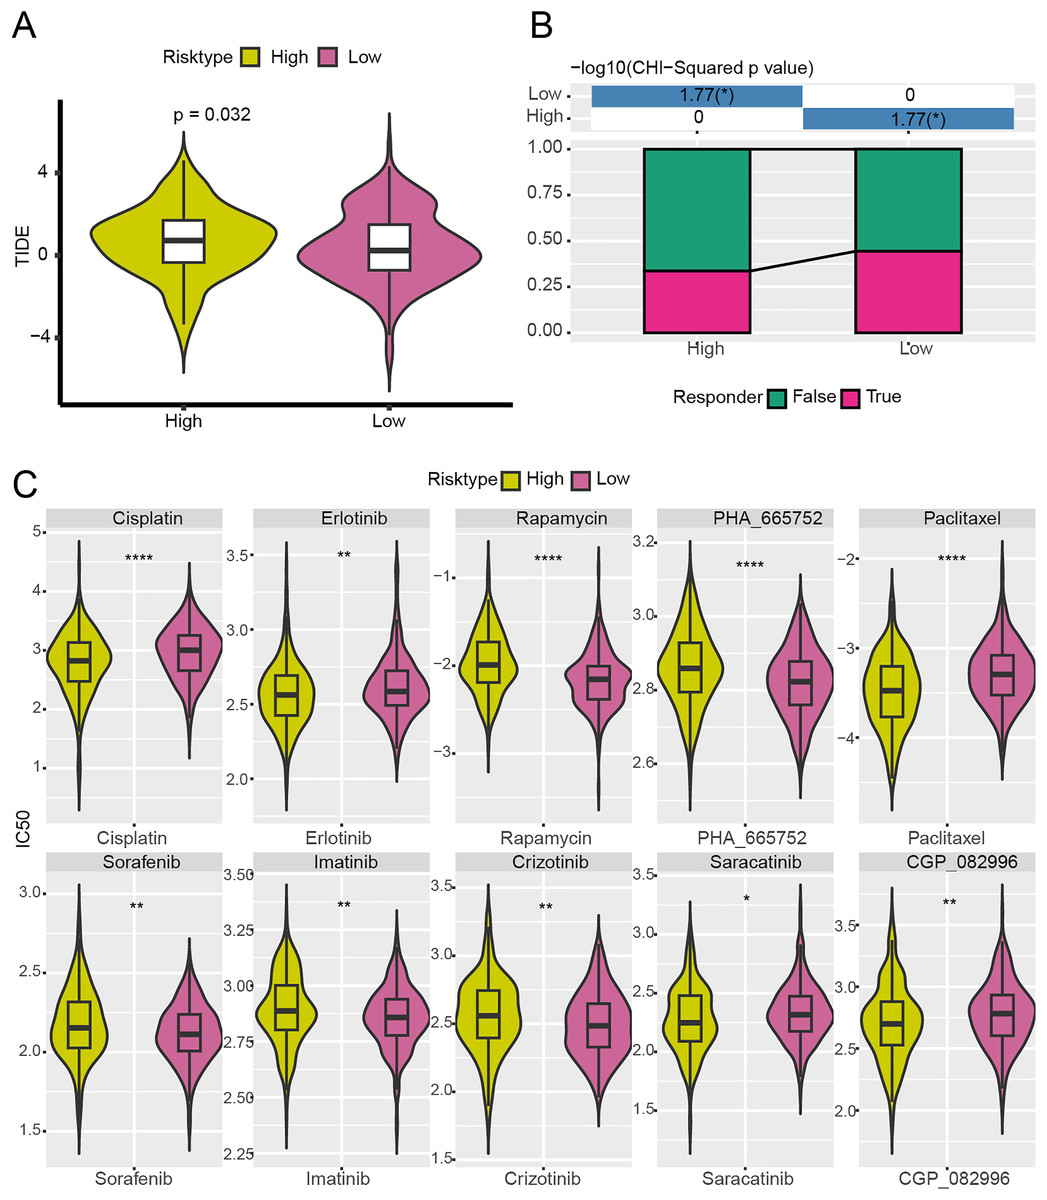
Figure 8: Analysis of immunotherapy response and drug sensitivity between two risk groups in TCGA-LUAD cohort.
(A) The difference of TIDE score between two risk groups in TCGA-LUAD cohort. (B) The proportion of responders to immunotherapy between two risk groups in TCGA-LUAD cohort. (C) The difference of drug sensitivity between two risk groups in TCGA-LUAD cohort. **** means p < 0.0001; ** means p < 0.01; * means p < 0.05.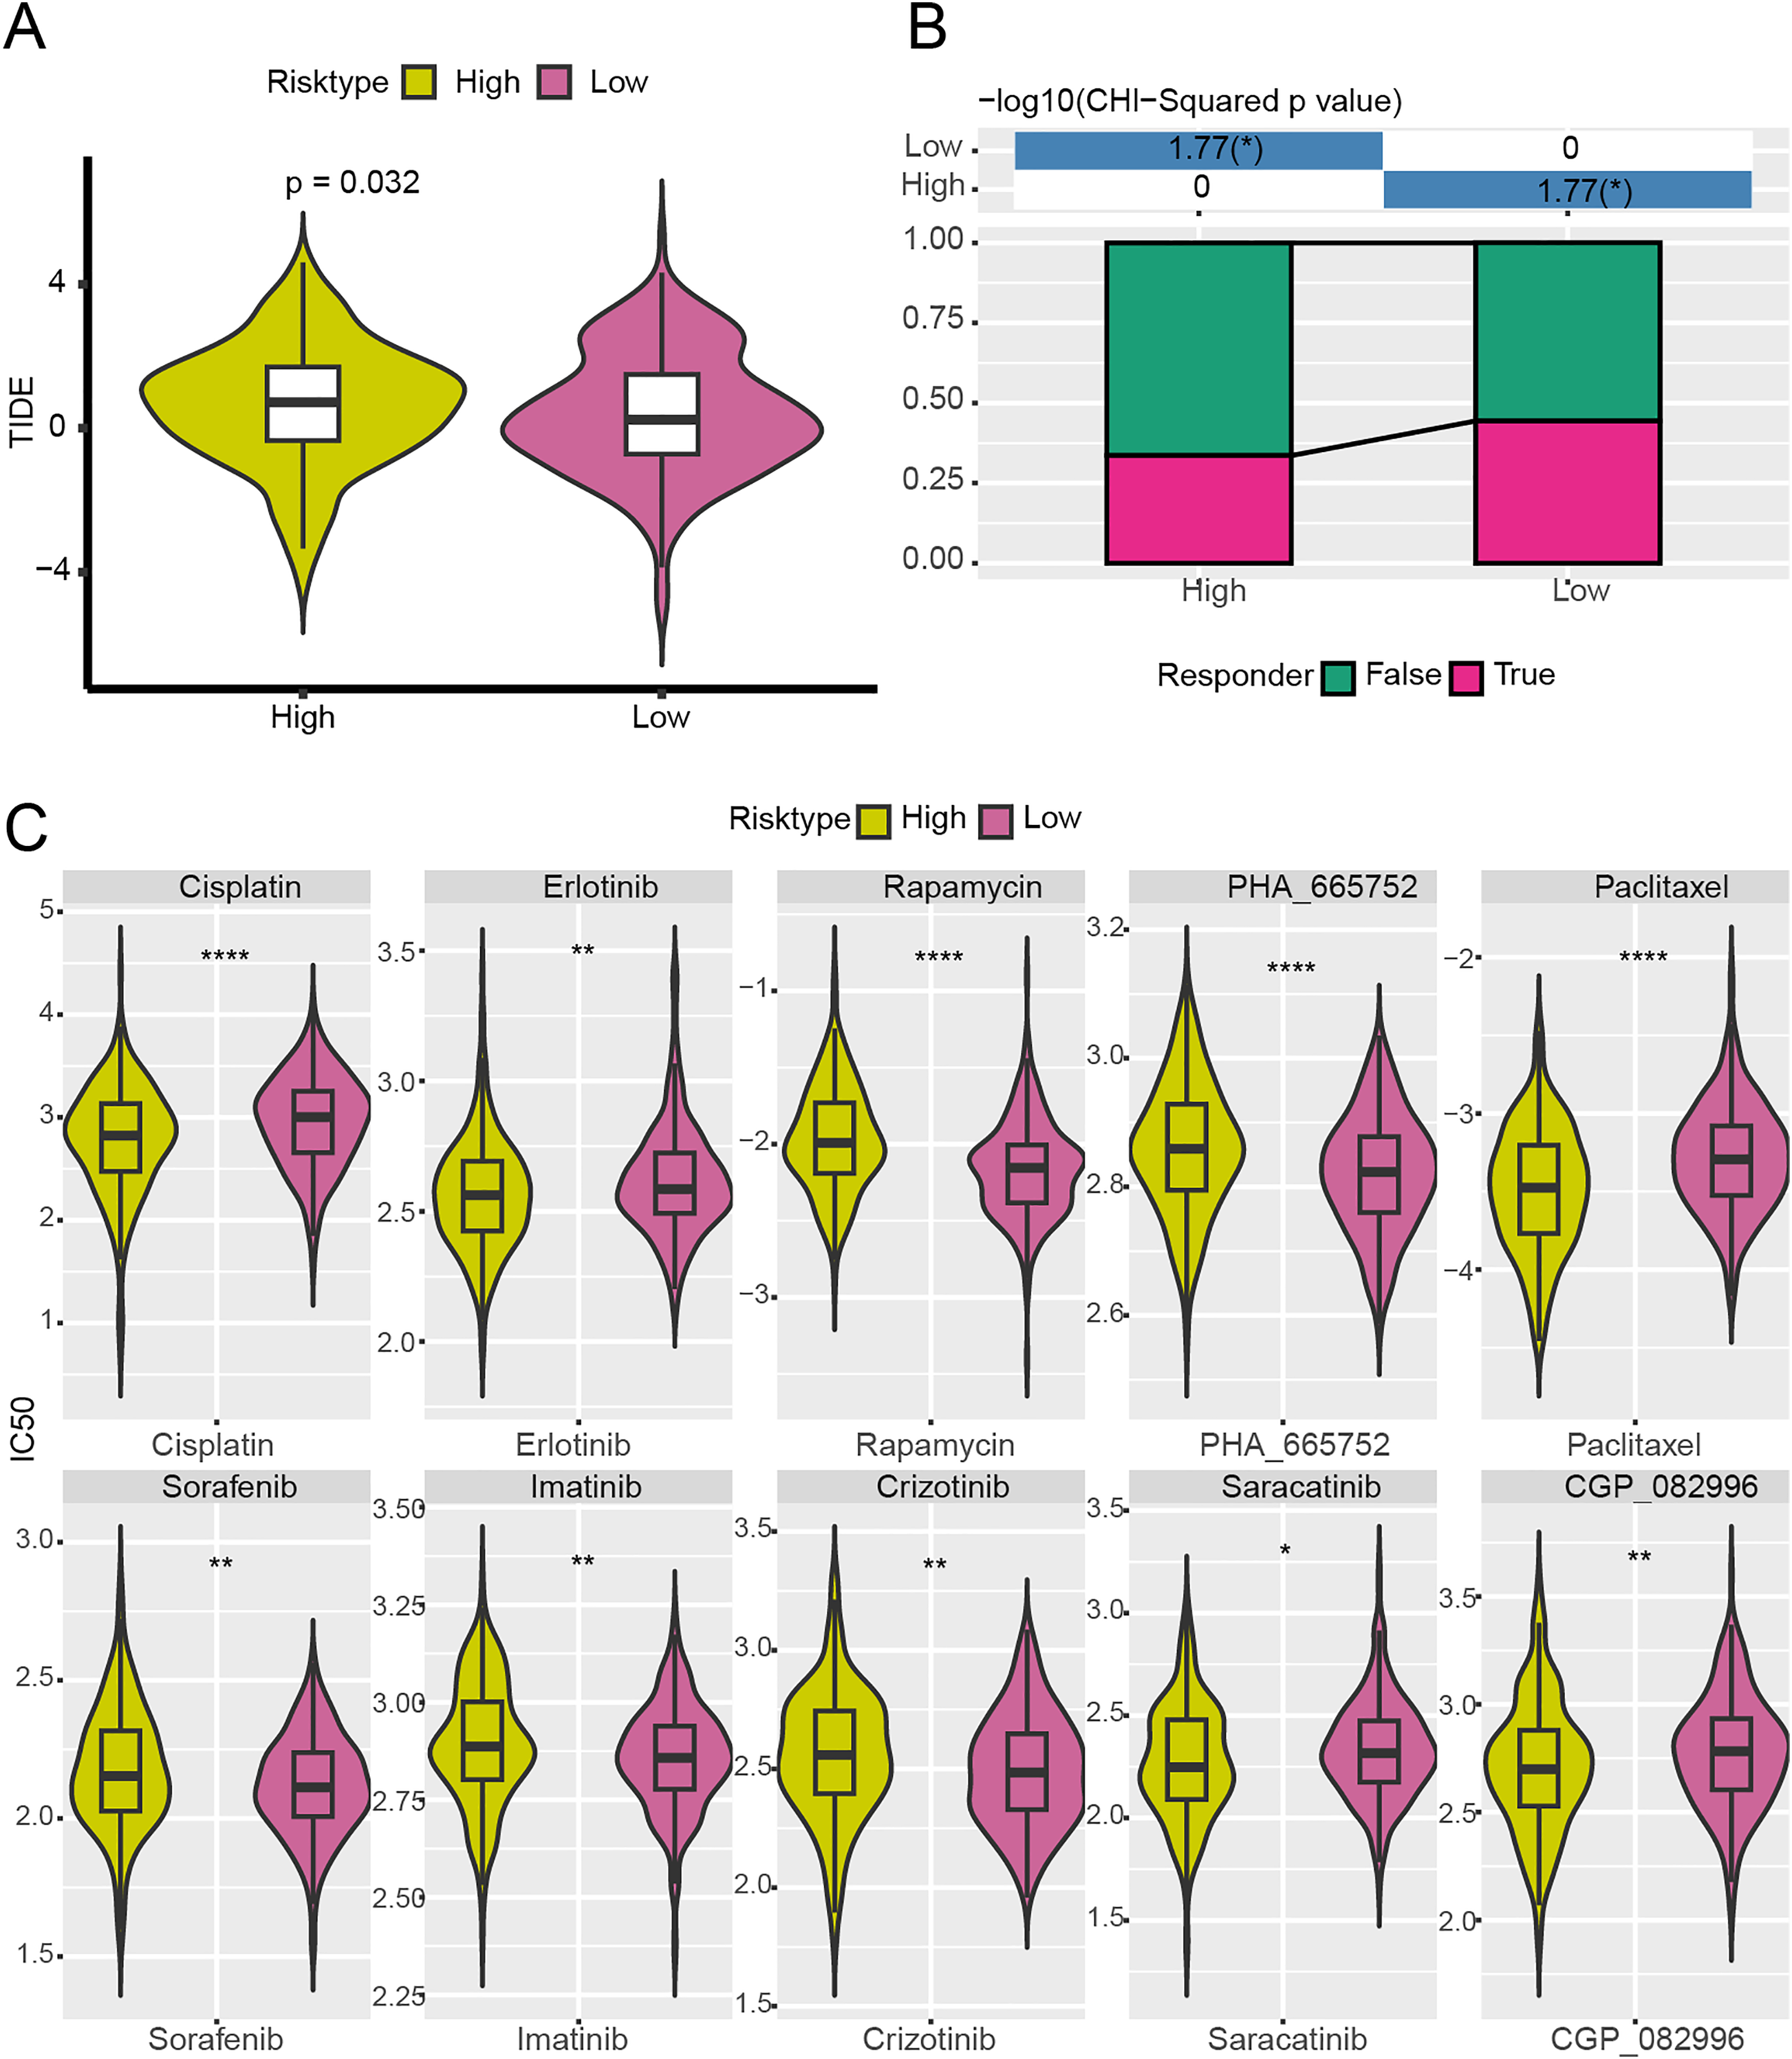
A nomogram with an excellent prediction performance was established
The univariate and multivariate Cox regression analysis verified that N.stage, RiskScore, and T.stage were independent factors for LUAD prognosis (Figs. 9A and 9B). Then, a nomogram was established, and the RiskScore exhibited the strongest influence on the prediction of survival probability (Fig. 9C). In addition, calibration curve showed that 1-year, 3-year, and 5-year calibration points were close to the ideal curves (Fig. 9D). According to DCA, the benefits of the nomogram were significantly higher than the baseline model (Fig. 9E), emphasizing the potential value of the nomogram in clinical decision-making. Moreover, the C-index of the nomogram was also higher than that of clinical features and RiskScore (Fig. 9F), which further confirmed its accurate prediction ability. The ROC curve of the nomogram was plotted, with an AUC value of 0.924 (Fig. 9G), which reflected a strong diagnostic performance of the nomogram.
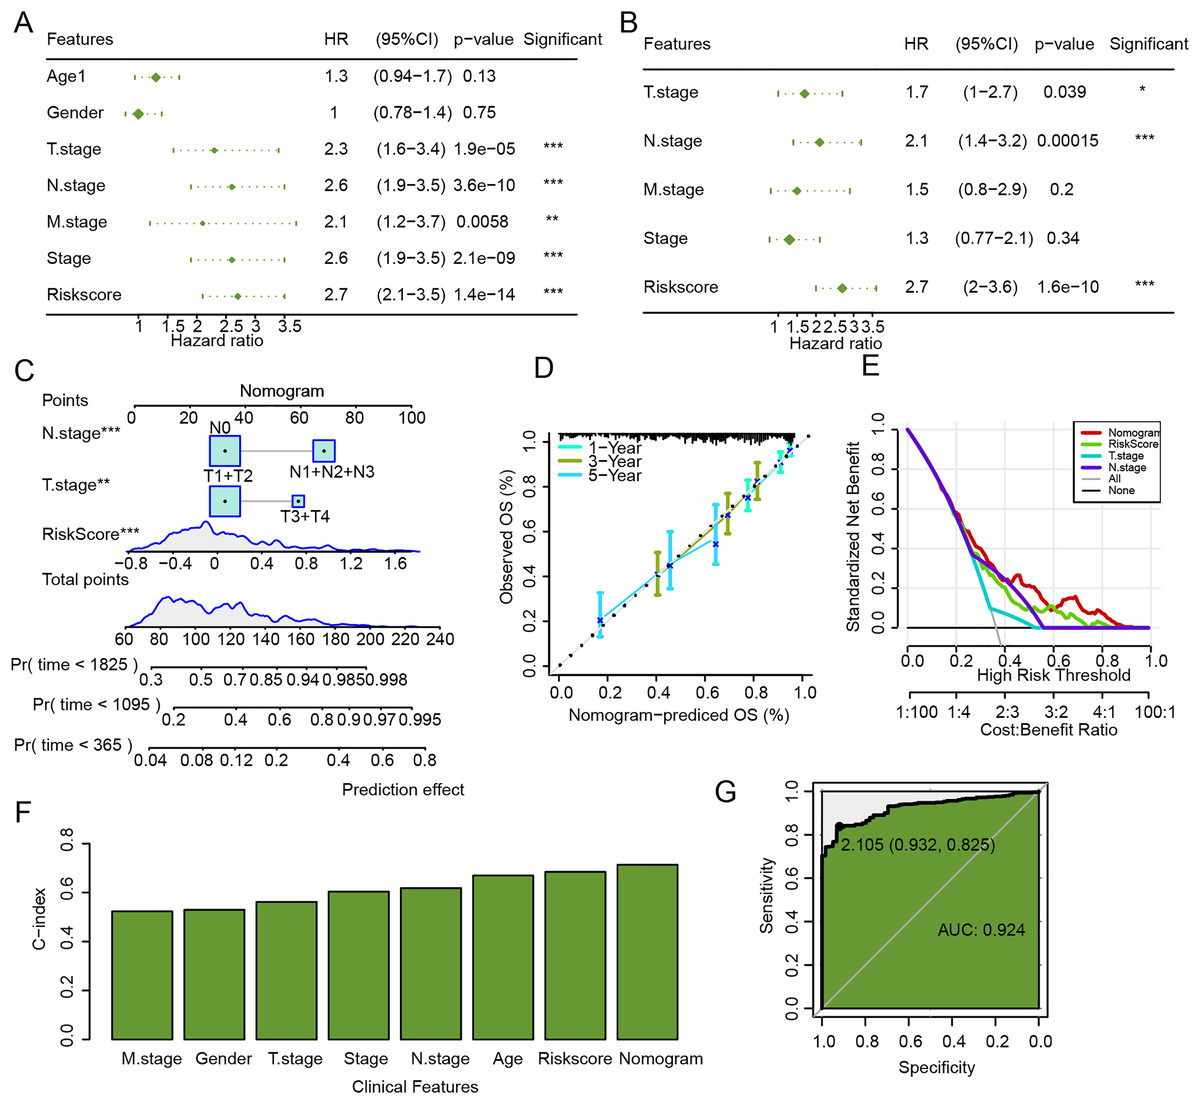
Figure 9: Establishment and assessment of nomogram combining RiskScore and clinical features.
(A) Univariate Cox regression analysis of RiskScore and clinical features. (B) Multivariate Cox regression analysis of RiskScore and clinical features. (C) Nomogram established by combining RiskScore and clinical features. (D) Calibration curve of nomogram. (E) Decision curve of nomogram. (F) C-index of clinical features, RiskScore, and nomogram. (G) ROC curve of nomogram.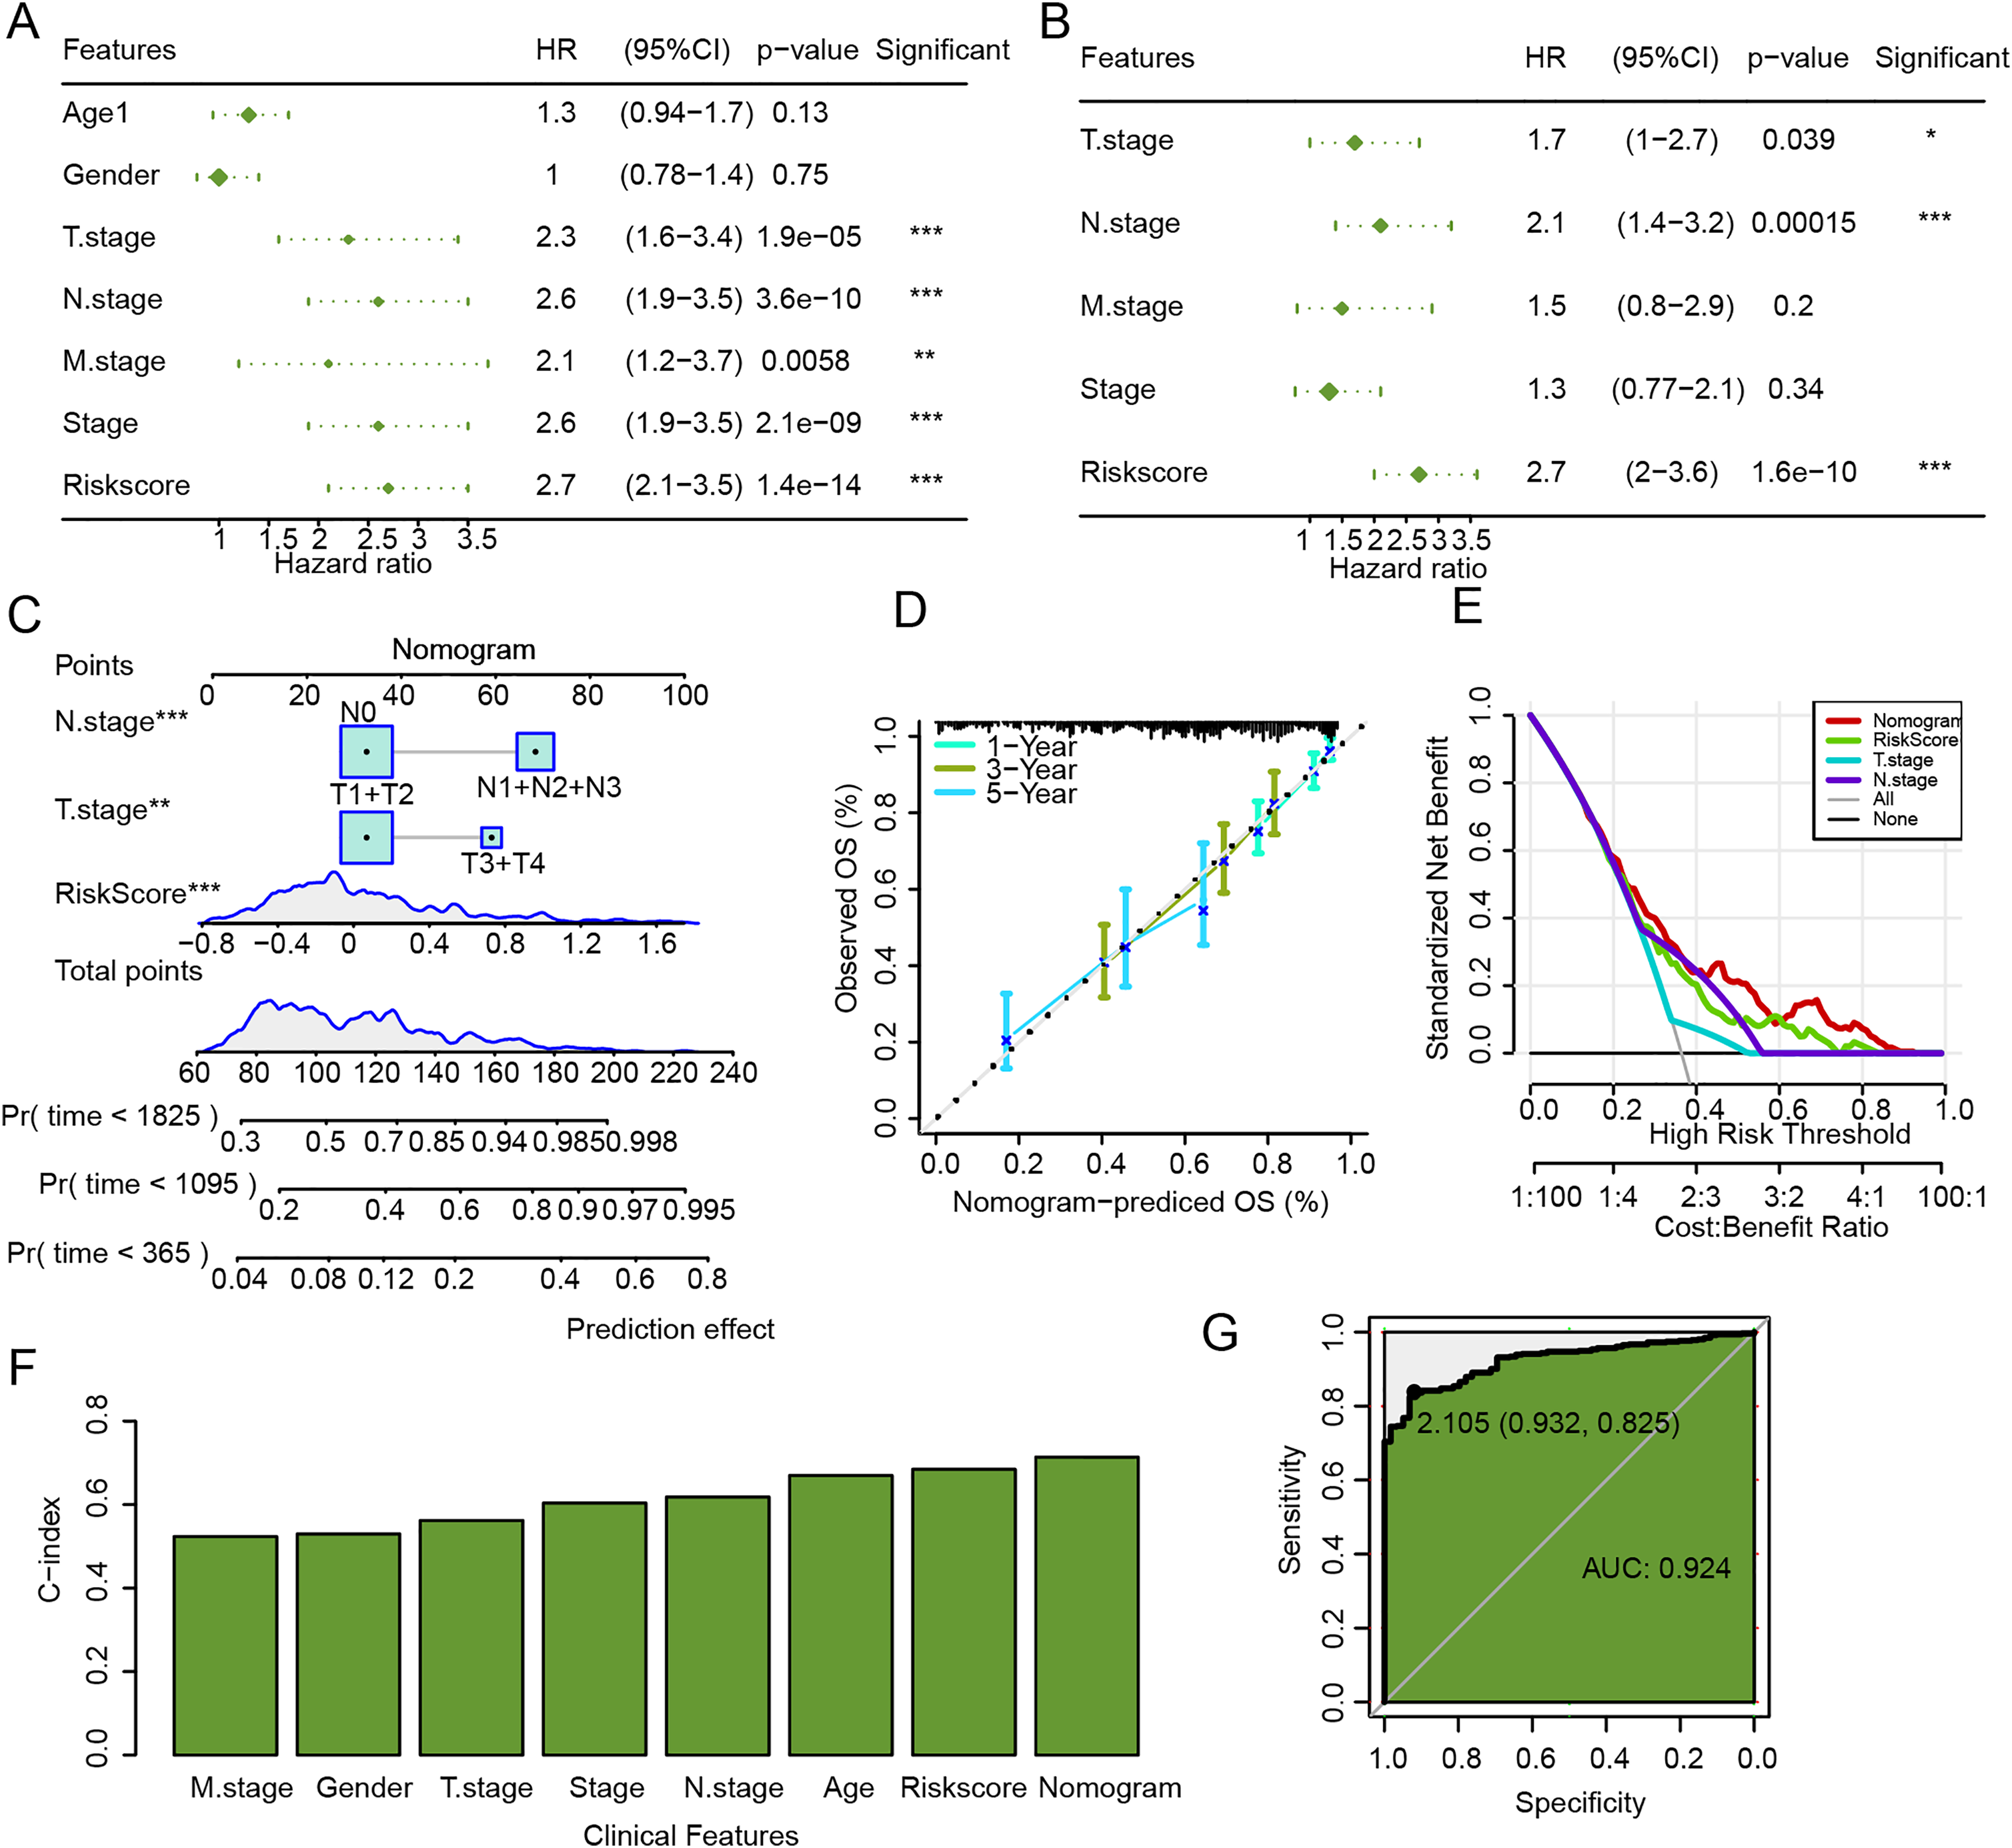
Silencing GJB3 inhibited the migration and invasion of LUAD cells
The data from qRT-PCR revealed that the mRNA expressions of GJB3, DKK1, CPA3, and KRT6A were all notably upregulated in A549 cells than in BEAS-2B cells (Figs.10A–10D). GJB3 is a member of a group of proteins known as connexins, which fulfill crucial functions in the formation of channels and connections and in turn support the communication between cells (Zeng et al., 2024). However, the role of GJB3 in cancers has been less studied, particularly LUAD. Here, the wound healing and Transwell assays demonstrated that the silencing of GJB3 reduced the numbers of migrated and invaded A549 cells (Figs.10E and 10F).
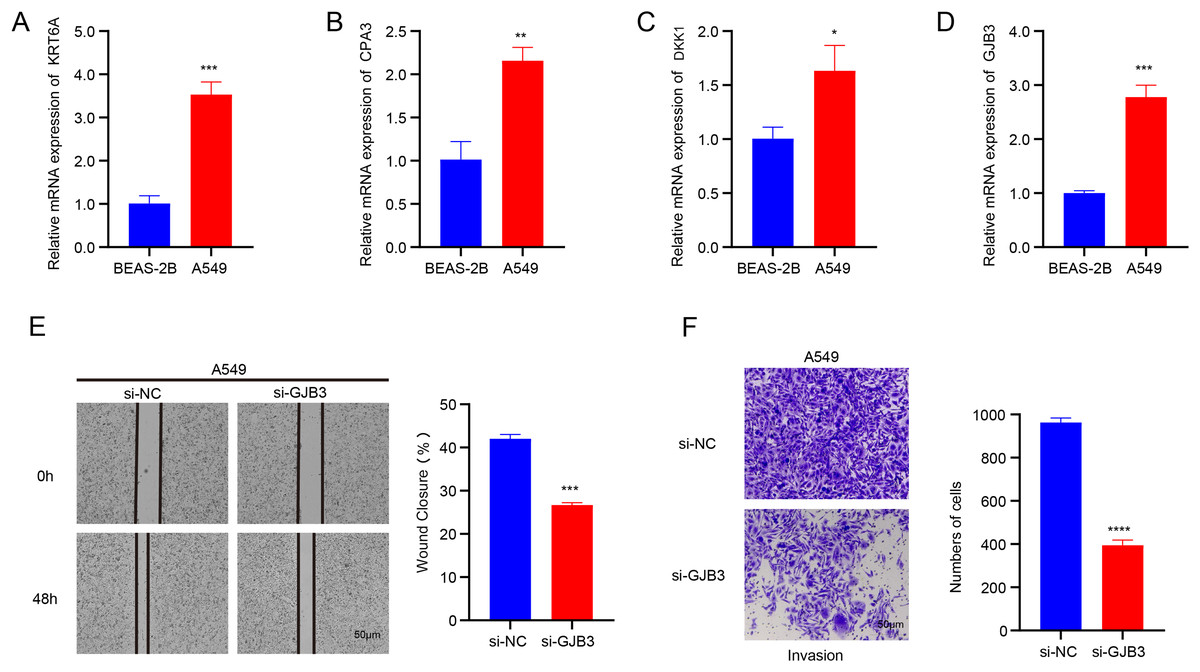
Figure 10: Validation assay in vitro using LUAD cells.
(A-D) The mRNA expression levels of four independent prognostic NMRGs, KRT6A, CPA3, DKK1, and GJB3, in LUAD cells A549 and normal lung epithelial cells BEAS-2B by qRT-PCR. (E) The impact of GJB3 silencing on the migration of LUAD cells A549 evaluated by wound healing assay. (F) The effect of GJB3 silencing on the invasion of LUAD cells A549 detected by Transwell assay. **** means p < 0.0001; *** means p < 0.001; ** means p < 0.01; * means p < 0.05.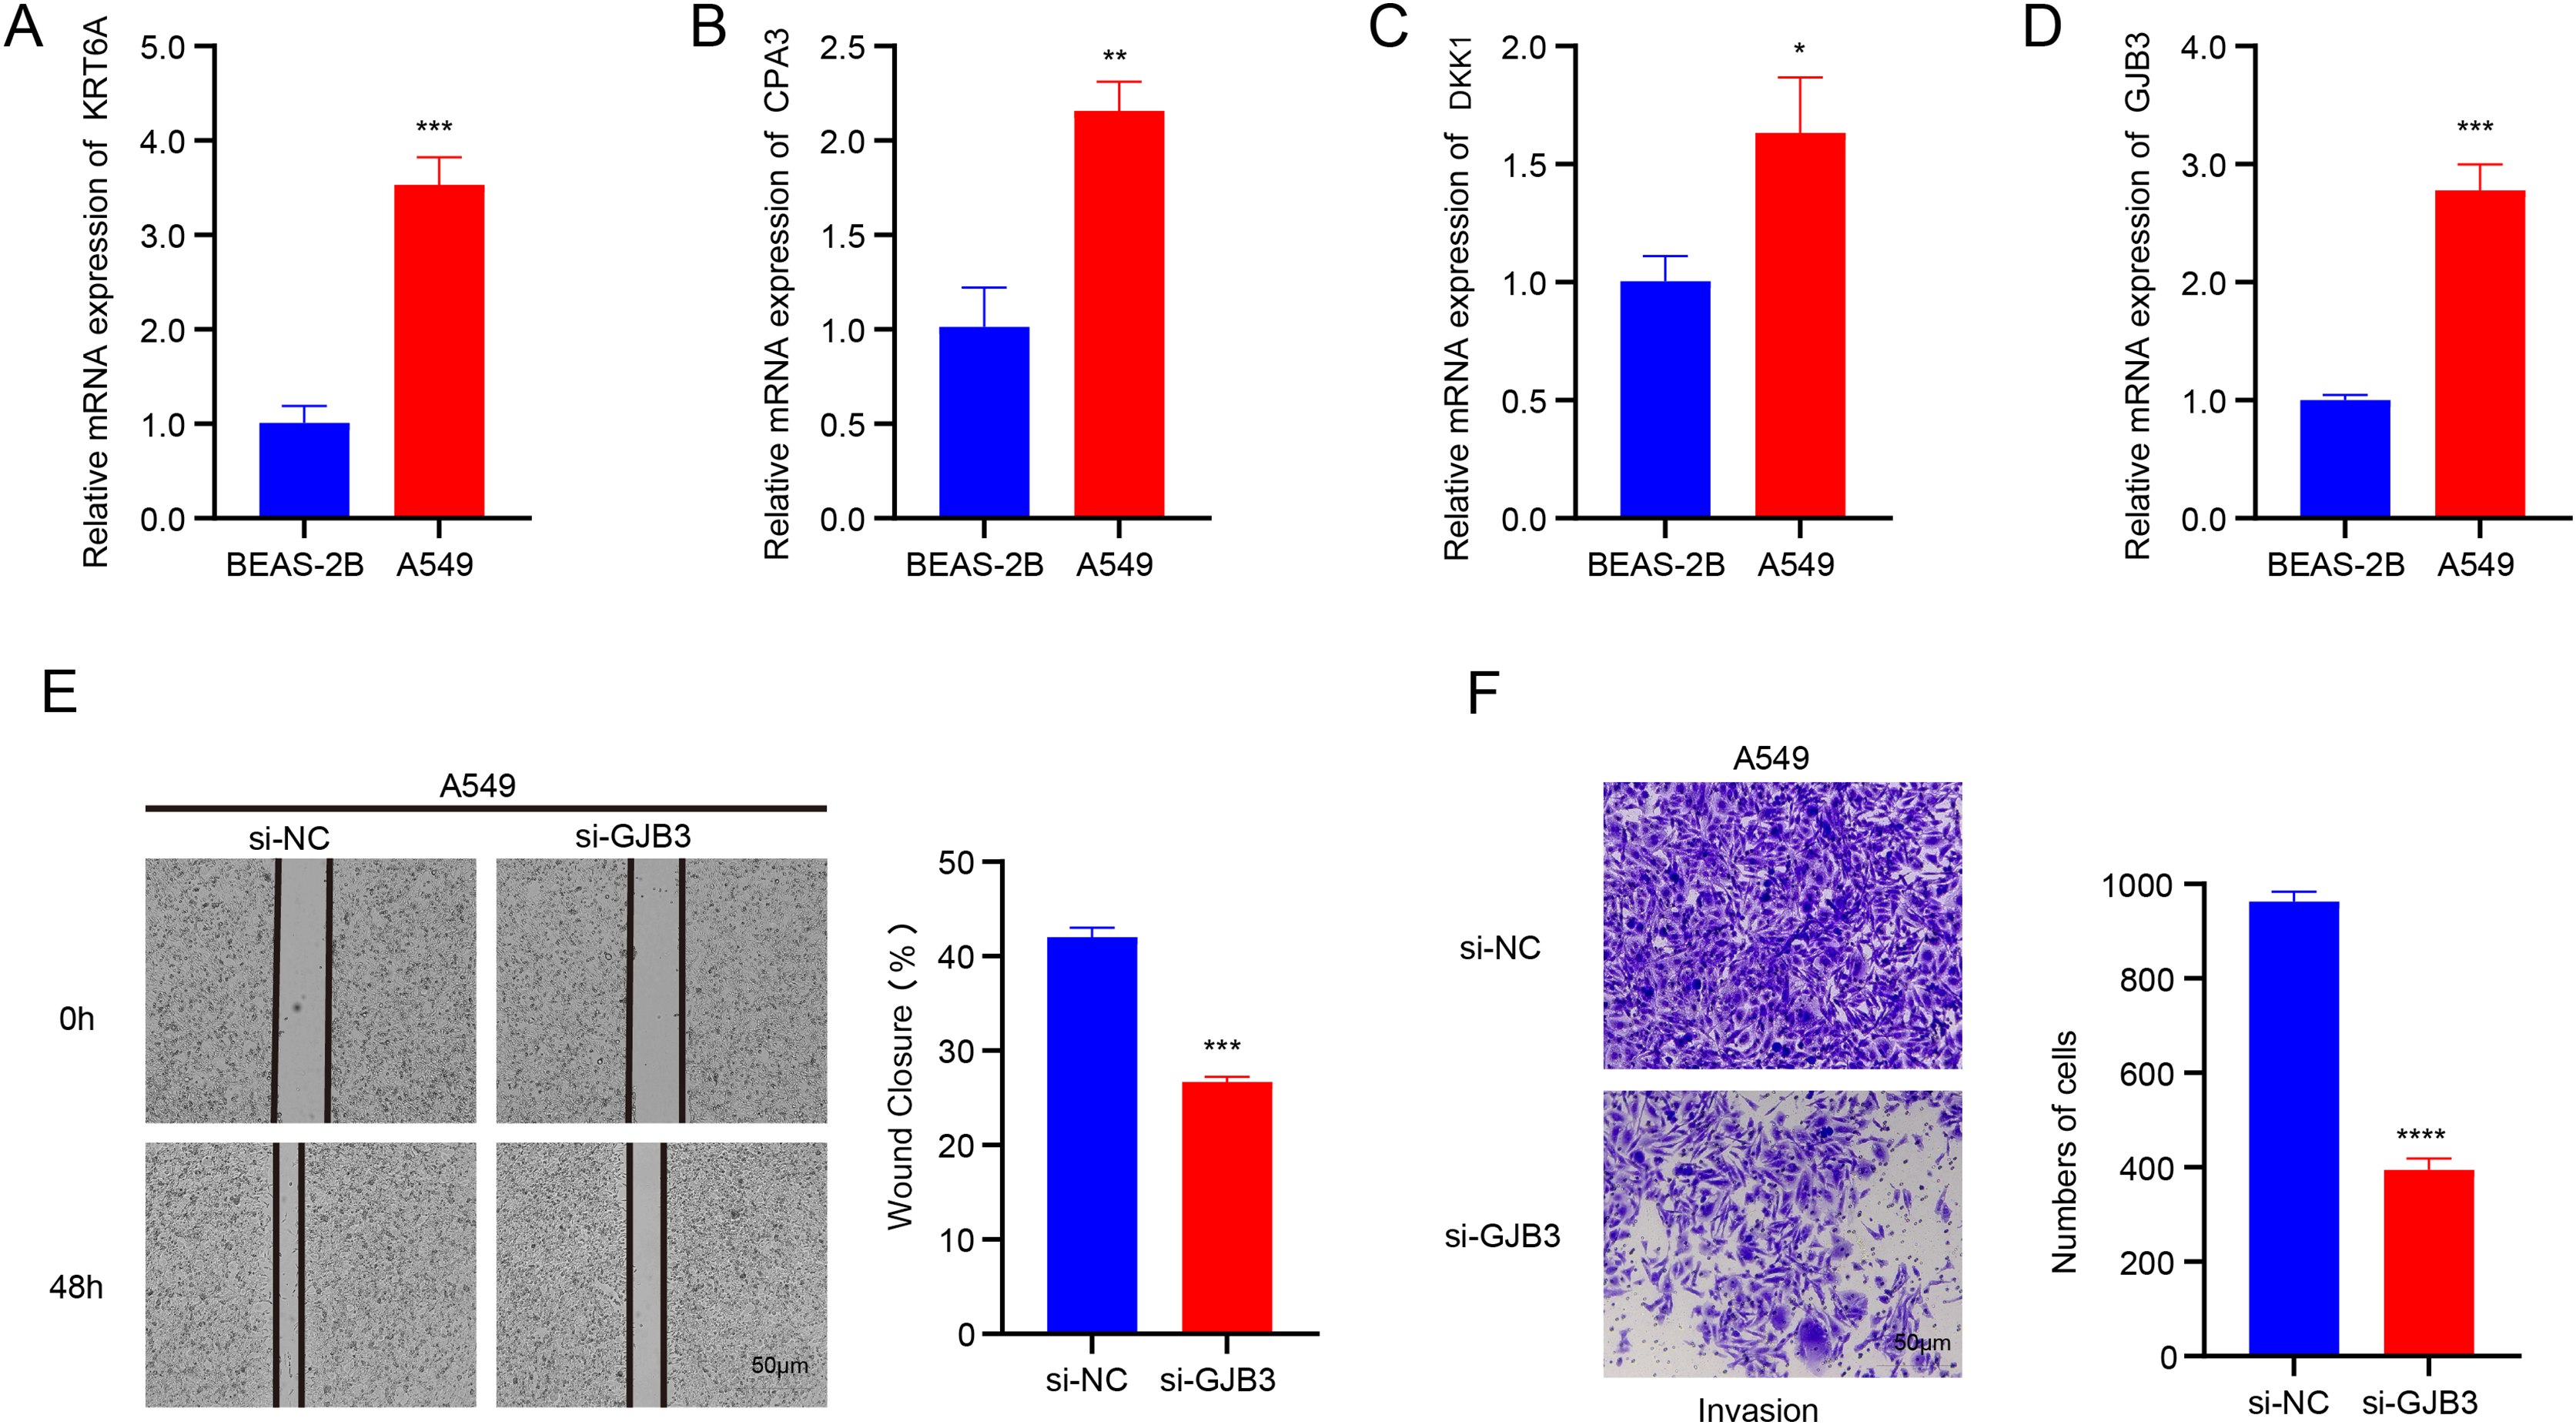
Discussion
Increased energy metabolism in cells has been linked to the initiation and progression of tumors by numerous studies (Park et al., 2012; Ullah et al., 2024). NAM is well-recognized as a crucial regulator of REDOX processes and mitochondrial function, thereby playing a key role in managing cellular energy metabolism. An accumulating body of evidence supports the involvement of NAM in cancer prevention and treatment (Chen et al., 2015). Recently, there has been a significant focus on the role of NAM in both the diagnosis and therapeutic strategies for tumors. For example, Yang et al. (2024) identified NAM-related genes applying bioinformatics analysis to predict the survival of patients with hepatocellular carcinoma. However, research on the role of NAM in LUAD remains limited. This studied delineated LUAD subtypes with NAM-related genes. We performed differential gene analysis and functional characterization to determine key genes and to develop a risk model that can effectively predict the immunotherapy response and prognosis of LUAD patients. Subsequently, we also evaluated the prognosis, immune cell infiltration and immunotherapy response of patients with LUAD categorized into different risk groups by the RiskScore model.
This study delineated two subtypes (C1 and C2) of LUAD based on the NMRGs, with C2 subtype exhibiting a better prognosis than C1 subtype. In comparison to C2 subtype, more patients in C1 subtype were in the pathologic_M1, pathologic_T3, T4, pathologic_N1, N2, and pathologic_stage II, III. TTN and FLG were the genes with higher mutation frequencies in both C1 and C2. Specifically, the frequency of TTN mutation was higher in C2 than in C1, while that of FLG was higher in C1 than that in C2. TTN is the largest protein that plays crucial roles in the structure, development, mechanics, and regulation of cardiac and skeletal muscles (Chauveau, Rowell & Ferreiro, 2014). FLG is a filaggrin protein critical for the formation of the stratum corneum (Yicheng et al., 2022). Studies have confirmed that mutations in TTN and FLG are closely involved in the occurrence of LUAD and its prognosis (Xue et al., 2021; Hasan et al., 2015; Cheng et al., 2019). Therefore, different mutation frequencies of the two genes may account for the prognostic differences between C1 and C2, but further in-depth research is required to validate the hypothesis. In addition, C1 subtype was associated with glycolytic metabolism-correlated pathways, while C2 subtype was more related to fatty acid metabolism pathway. These findings may offer a novel insight into the subtype classification and prognostic evaluation for LUAD patients based on NAM metabolism.
Furthermore, four independent prognostic NMRGs, including one protective gene (CPA3) and three risk genes (DKK1, GJB3, KRT6A), were screened to construct a RiskScore model. CPA3 is a specific zinc metalloproteinase expressed in mast cells and is involved in the degradation of endogenous proteins (Hämäläinen et al., 2022; Feng, Fu & Nie, 2023). DKK1, a secretory Wnt antagonist, is upregulated in a variety of human malignancies (Zheng et al., 2022; Zhu et al., 2021). Previous research showed that high-expressed DKK1 is indicative of a worse prognosis in LUAD (Li et al., 2023). GJB3 belongs to the gap junction protein family and encodes junction protein 31 (Chen, Zhao & Hu, 2023). It has been found that high-expressed GJB3 is closely linked to a worse prognosis in LUAD (Dou et al., 2024). This study also showed that GJB3 was high-expressed in LUAD patients, and that the silencing of GJB3 can inhibit the migration and invasion of LUAD cells. In addition, GJB3 knockdown suppressed PI3K/AKT pathway activation and inhibited the proliferation, migration, and viability of a variety of cancer cells, including LUAD (Zeng et al., 2024). This suggested that the function of GJB3 in the TME may be affected by the metabolic regulation of NAM, especially in regulating cell proliferation, apoptosis and immune cell infiltration. Huo et al. (2022) discovered that GJB3 promotes liver metastasis of pancreatic cancer by enhancing neutrophil polarization and survival. Our study also found an upregulated expression of neutrophils in the high-risk group, indicating that GJB3 facilitated tumor progression and metastasis through the modulation of neutrophil activity in high-risk LUAD patients. Zhou et al. (2021) demonstrated that the down-regulation of KRT6A expression mediated by siRNA inhibited the growth of non-small cell lung cancer (NSCLC) cells in vivo. Furthermore, high-expressed KRT6A may facilitate the proliferation and metastasis of LUAD via epithelial mesenchymal transformation (Sun et al., 2023). This indicated that NAM metabolism was involved in regulating cell proliferation and oxidative stress response, which may in turn affect the expression and function of KRT6A in cancer cells. Additionally, in vitro experiments in this study revealed that the mRNA expressions of DKK1, GJB3, KRT6A, and CPA3 in LUAD cell line A549 were significantly upregulated. Taken together, these findings further demonstrated that these four NMRGs were closely linked to LUAD and could be considered as biomarkers for LUAD.
Cancer cells undergo metabolic reprogramming and consume resources within the TME, which consequently creates a microenvironment hostile to the survival and functionality of immune cells (Yang et al., 2020). This metabolic competition offers novel targets for immunotherapy. By targeting the metabolic processes of cancer cells, it is possible to indirectly improve the function and survival of immune cells, thereby potentially enhancing immunotherapy outcomes (Cerezo & Rocchi, 2020). In this study, immune infiltration analysis demonstrated that the expressions of most immune cell types in the high-risk group were lower than the low-risk group. This suggested that the high-risk group may promote tumor cell evasion from immune surveillance by inhibiting the infiltration and activity of immune cells within the TME. Furthermore, the high-risk group was enriched in numerous HALLMARK pathways, indicating broad abnormalities in biological processes. Patients categorized into the low-risk group typically exhibited lower TIDE scores and were more likely to respond to immunotherapy. Conversely, the high-risk group showed higher sensitivity to some chemotherapeutic agents such as Erlotinib, Paclitaxel, Cisplatin, Saracatinib, and CGP_082996. Notably, Cisplatin, which treats a variety of solid tumors including LUAD (Galanski, 2006), functions by triggering DNA damage responses and mitochondrial apoptosis (Galluzzi et al., 2012). Erlotinib, used for NSCLC and pancreatic cancer, inhibits tumor cell division, leading to cell cycle arrest and programmed cell death in tumor cells (Abdelgalil, Al-Kahtani & Al-Jenoobi, 2020). Saracatinib is a Src kinase inhibitor. Src is a non-receptor tyrosine kinase closely related to growth factor and cytokine receptors and plays a pivotal role in invasion, motility, tumor cell adhesion, and angiogenesis (Thomas & Brugge, 1997). Studies have shown its effectiveness in the treatment of SCLC (Molina et al., 2014). These findings suggested that the low-risk group was more likely to benefit from immunotherapy, while high-risk group was more suitable for taking chemotherapeutic drugs, providing valuable insights for personalized treatment of patients with LUAD.
Despite the insight gained from our research, several limitations must be acknowledged. Firstly, the sample size of the TCGA-LUAD and GSE31210 datasets used in this study was relatively small, and future research should prioritize validating our findings in larger cohorts. Moreover, there is a need for cellular and animal model experiments to analyze the changes in NAM metabolism under different knockdown conditions, alongside assessments of the expressions of immune-related molecules on cell surface and the killing activity of immune cells. Experiments as such will help determine the pathways through which the genes affect the immune regulation in LUAD. Furthermore, the establishment of an in vitro co-culture model of LUAD cells and immune cells such as T cells at a specific ratio could stimulate the TME more accurately. This setup would allow for the observation of cell interaction and further clarify the association between NAM metabolism and immune escape.
Conclusion
This study identified four prognostic biomarkers closely associated with LUAD and examined the correlation between the expressions of these biomarkers and the clinical features of LUAD patients. Our results highlighted variations in treatment sensitivity across different risk groups. These findings deepen our understanding of the pathogenesis and progression of LUAD and provide crucial guidance for the improvement of personalized treatment of the cancer. By adopting stratified treatment based on risk groups, we can more accurately select suitable therapeutic interventions, which could improve the treatment efficacy and the survival of LUAD patients. The current findings significantly contribute to the precision and personalization of LUAD treatment.