
Integrated multiomics analysis highlights the immunosuppressive role of granulin precursor positive macrophages in hepatocellular carcinoma
- Published
- Accepted
- Received
- Academic Editor
- Vladimir Uversky
- Subject Areas
- Immunology
- Keywords
- Tumor-associated macrophages, Granulin precursor, Immune checkpoint blockade, Tumor microenvironment, T-cell exhaustion
- Copyright
- © 2025 Li et al.
- Licence
- This is an open access article distributed under the terms of the Creative Commons Attribution License, which permits using, remixing, and building upon the work non-commercially, as long as it is properly attributed. For attribution, the original author(s), title, publication source (PeerJ) and either DOI or URL of the article must be cited.
- Cite this article
- 2025. Integrated multiomics analysis highlights the immunosuppressive role of granulin precursor positive macrophages in hepatocellular carcinoma. PeerJ 13:e18879 https://doi.org/10.7717/peerj.18879
Abstract
It has been reported that tumor-associated macrophages (TAMs) play a complicated role in cancer occurrence and development, immune escape, and immune checkpoint blockade (ICB) resistance. However, the role of granulin precursor (GRN) highly expressed macrophages (hereafter refer to GRN+ macrophages) in hepatocellular carcinoma (HCC) remains poorly understood. Herein, we systematically integrated multiomics analysis of human tumor tissues to illustrate the functional role of GRN+ macrophages in HCC. GRN is selectively expressed by TAMs in different type of cancers including HCC, and was significantly associated with poor prognosis in several type of cancer. GRN was closely correlated with infiltration levels of most immune cells, especially the M2 macrophage cells in various cancers. In particular, both mRNA and protein expression level of GRN was significantly upregulated in HCC. Compared with tumor tissue, GRN was more significantly expressed in the stroma area between HCC tissues and adjacent non-tumor tissues. High expression of GRN was significantly correlated with M2-polarization of macrophages and T-cell exhaustion in HCC. GRN+ macrophages communicated with intratumoral immune cells, especially CD8+ T cells. Functionally, GRN+ macrophages contacted with CD8+ T cells, which inducing T-cell exhaustion. Our study offers a comprehensive understanding of the clinical relevance and immunological role of GRN+ macrophages in HCC, indicating its potential role as a promising target for immunotherapeutic strategies.
Introduction
Cancer is responsible for a leading cause of global deaths and major obstacle increasing life expectancy in every country despite advance in cancer treatments (Siegel & Miller, 2023). Immunotherapy, especially immune checkpoint inhibitors, has become a hot spot in tumor therapy (Rui, Zhou & He, 2023). Though significant advances of immunotherapy have been made, current immunotherapies, including programmed death-1 (PD-1), programmed death ligand-1 (PD-L1), and cytotoxic T lymphocyte associated antigen 4 (CTLA4) inhibitors, presented limited clinical efficacy in most tumors (Carlino, Larkin & Long, 2021; Nagasaki, Ishino & Togashi, 2022; Wang et al., 2023). The reasons for the ineffectiveness of immunotherapy are complicated, which may be linked to lacking the effective biomarkers that can guide individualized immunotherapy (Chan et al., 2019; Damei et al., 2023). Given the complexity of carcinogenesis, it is urgently need to discover ways that can predict clinical prognosis and efficacy of immunotherapy across different types. With the development and improvement of publicly funded single-cell RNA sequencing (scRNA-seq) and bulk cell RNA-seq data base, it is possible for scholars to find out novel immunotherapy targets by conducting pan-cancer expression analysis and investigate their correlation with clinicopathological features, immune infiltrations and related signaling pathways.
Macrophages server as the most abundant immunes cells present in most type of cancers, and those infiltrating in the tumor microenvironment (TME) known as tumor-associated macrophages (TAMs), act phenotypically and functionally like the alternately activated (M2-like) macrophages (Wei et al., 2022; Xiao et al., 2020). Accumulating evidence have been found that different subgroup of TAMs plays a complicated role in tumors occurrence and development, immune escape, and immune checkpoint blockade (ICB) resistance (DeNardo & Ruffell, 2019). For example, intratumoral MS4A4A+ macrophages reshape the TME by inducing infiltration of exhausted T cells, which leading to tumor progression and ICB resistance of colorectal cancer (Li et al., 2023). TREM2 is predominantly expressed by a macrophage subpopulation enriched in tumor tissues that resemble lipid-associated macrophages (LAMs) (Zhou et al., 2022). TREM2+ LAM-like macrophages recruited suppressive Treg cells, remodeling an immunosuppressive state of TME. TREM2+ LAM-like macrophages are associated with adverse clinical outcomes in patients with HCC. In addition, TREM2+ macrophages inhibit CD8+ T cells infiltration after transarterial chemoembolization in hepatocellular carcinoma (HCC) (Tan et al., 2023). Targeting TREM2+ macrophages augment the therapeutic efficacy of ICB by dramatically increasing the infiltration of CD8+ T cells (Tan et al., 2023). Thus, blocking the recruitment and infiltration of TAMs, reversing the M2-like phenotype are expected to be promising strategies to improve the efficacy of ICB and prolong the survival time of patients with cancers.
Granulin precursor (GRN) is a potent growth factor and mitogen that expresses in multiple tissues and organs including proximal digestive tract, bone marrow, lymphoid tissues, and respiratory system (Loei et al., 2012). It is well accepted that granulin is a pleiotropic growth factor that participates in cell proliferation, wound healing, inflammation, and carcinogenesis by acting as a cytokine-like activity (Zhang et al., 2024a). Evidence has shown that GRN expressed by tumor cells promotes the onset and development of cancers (Dong et al., 2021). However, whether GRN specifically expressed by immune cells involved in tumorigenesis remains poorly understood. Herein, we systematically interrogated the scRNA-seq in combination with bulk cell RNA-seq profiles to explore the expression level of GRN across various immune cells and malignant cells, illustrating that GRN was dominantly expressed by macrophages in various cancers including HCC. The expression level of GRN and its prognostic significance was exanimated using The Cancer Genome Atlas (TCGA) database. Comparative analyses of correlation between GRN and infiltration of immune cells, especially M2-like macrophages and exhaustion T-cell led to the identification of a novel immunosuppressive role of GRN in various cancers. In addition, we further investigated the expression pattern of GRN in HCC by correlating the spatial transcriptomics with bulk RNA-seq profiles and proteomics from publicly available datasets. Cellular interactions performed using the single-cell transcriptomes of human HCC tissues revealing the direct communication between GRN+ macrophages and CD8+ T cells. Finally, we conducted gain of function assays to further explore the mechanism by which GRN promoted macrophages M2 polarisation and induced CD8+ T cells exhaustion. Our findings elucidate the clinical relevance and immunological role of GRN+ macrophages in HCC, indicating its potential role as a promising target for immunotherapeutic strategies.
Methods
Expression datasets and data processing
RNA sequencing data and related clinical information of TCGA pan-cancer data which contains 11,069 samples of 33 cancer types were downloaded from UCSC Xena (https://xena.ucsc.edu/) database. Gene expression prolife of 31 normal tissues were obtained from GTEx (https://commonfund.nih.gov/GTEx). Strawberry Perl (Version 5.32.0, http://strawberryperl.com/) was conducted to extract GRN mRNA expression from forementioned datasets. The expression level of GRN was examined in 33 cancer types, and 31 normal tissues using the downloaded samples. Expression data of GRN was log2 (TPM+1) transformed and unmatched Wilcoxon rank-sum and Signed rank tests were used for difference significance analysis. A P < 0.05 was considered statistically significant. Data analysis was performed by R software version 4.0.2 (R Core Team, 2020), and the R package “ggpubr” was used to draw violin plots.
The UALCAN portal (http://ualcan.path.uab.edu/analysis-prot.html) was used to evaluate protein expression of GRN of HCC from CPTAC dataset (Clinical proteomic tumor analysis consortium).
Immunofluorescence image of GRN of three cell lines were obtained from the HPA (http://www.proteinatlas.org/) database.
“Expression Analysis-Stage Plots” module of the GEPIA2 (Gene Expression Profiling Interactive Analysis, version 2) online software (http://gepia2.cancer-pku.cn/#analysis) was used to analyze the correlation between GRN expression level and Exhausted T cells signature of HCC from TCGA datasets.
TISCH database (http://tisch.comp-genomics.org/) was used to explore GRN expression in various cancers using pan-cancer single-cell sequencing data set.
“Immune-Gene” module of TIMER web server (https://cistrome.shinyapps.io/timer/) was applied to calculate the relationships between GRN expression and levels of M2-like macrophage infiltration. Moreover, we applied “Exploration-Gene_Outcome” module of TIMER online software to evaluate the outcome significance of GRN expression adjusted by immune infiltration levels of macrophage.
Largescale data mining analysis of GRN mRNA expression from 80 HCC cohorts
Datasets containing tumor and non-tumor tissues were collected from publicly available GEO databases (GSE57555, GSE77314, GSE55048, GSE36376, GSE9839, GSE62232, GSE33294, GSE70089, GSE147888, GSE39791, GSE45114, GSE95698, GSE31370, GSE45050, GSE60502, GSE57957, GSE76427, GSE121248, GSE84402, GSE84598, GSE63898, GSE89377, GSE36411, GSE14323, GSE45267, GSE11819, GSE84005, GSE102083, GSE102079, GSE74656, GSE25097, GSE107170, GSE54238, GSE22405, GSE22058, GSE64041, GSE7473, GSE87630, GSE54236, GSE17548, GSE98383, GSE94660, GSE14811, GSE12941, GSE51401, GSE19665, GSE59259, GSE174570, GSE15654, GSE164760, GSE41804, GSE38226, GSE113996, GSE67764, GSE78737, GSE41160, GSE17967, GSE33006, GSE14520, GSE65485, GSE104310, GSE207435, GSE144269, GSE105130, GSE190174, GSE77509, GSE214846, GSE87410, GSE169289, GSE135631, GSE69164, GSE56545, GSE63863, GSE124535, GSE114564, GSE154964, GSE97214), TCGA databases (TCGA-LIHC), and ICGC databases (ICGC-LIRI-JP). R 4.0.2 software (R Core Team, 2020) and R packages (DESeq2, limma, etc.,) were used for the statistical analyses. Differentially expressed genes between HCC and adjacent non-tumor tissues were analyzed, and changes in mRNA levels of the GRN were determined. The degree of gene expression change was reflected by logarithmic fold change (LogFC), and the significance of differential expression was evaluated using an adjusted P-value threshold of 0.05.
Survival prognosis analysis
We downloaded the harmonized and standardized pan-cancer dataset: TCGA, TARGET GTEx (PANCAN, N = 19,131, G = 60,499) from the UCSC database (https://xenabrowser.net/), from which we further extracted the expression data of GRN genes in individual samples, and we also obtained high-quality prognostic dataset of TCGA from the TCGA prognostic study previously published in Cell (Liu et al., 2018). We used the UCSC cancer browser (https://xenabrowser.net/datapages/) to obtain the TARGET follow-up data as a supplement, samples whose follow-up time was shorter than 30 days were excluded, and log2 (TPM+1) transformation was further performed for each expression value. Finally, cancer species with less than 10 samples in a single cancer species were also excluded. Finally, the overall survival (OS) and disease-free survival (DFS) data of 44 cancer species (TCGA-GBM, TCGA-GBMLGG, TCGA-LGG, TCGA-UCEC, TARGET-LAML, TCGA-BRCA, TCGA-CESC, TCGA-LUAD, TCGA-ESCA, TCGA-STES, TCGA-SARC, TCGA-KIRP, TCGA-KIPAN, TCGA-COAD, TCGA-COADREAD, TCGA-PRAD, TCGA-STAD, TCGA-HNSC, TCGA-KIRC, TCGA-LUSC, TCGA-THYM, TCGA-LIHC, TARGET-WT, TCGA-SKCM-P, TCGA-SKCM, TCGA-BLCA, TCGA-SKCM-M, TCGA-THCA, TARGET-NB, TCGA-MESO, TCGA-READ, TCGA-OV, TCGA-UVM, TCGA-PAAD, TCGA-TGCT, TCGA-UCS, TCGA-LAML, TARGET-ALL, TCGA-PCPG, TCGA-ACC, TARGET-ALL-R, TCGA-DLBC, TCGA-KICH, TCGA-CHOL) were used to evaluate the survival prognosis of GRN. We built a cox proportional hazards regression model using the coxph function of the R package survival (version 3.2-7) to analyze the relationship between gene expression and prognosis in each tumor. Log rank statistical test was performed to obtain prognostic significance.
Association between GRN expression and immune infiltration
We downloaded the standardized pan-cancer dataset from the UCSC using the aforementioned method. We extracted the gene expression profile of each tumor, mapped the expression to Gene Symbol, and further used the R packages IOBR (version 0.99.9) of the Timer method (Li et al., 2017; Zeng et al., 2021) to calculate “The B cell”, “T cell CD4”, “T cell CD8”, “Neutrophil”, “Macrophage”, and “DC” infiltration scores of each patient in each tumor based on gene expression. Finally, we obtained six types of immune cell infiltration scores for 9,406 tumor samples from 36 tumor types. Pearson’s correlation between gene and immune cell infiltration scores in each tumor was calculated using the corr.test function of the R package psych (version 2.1.6).
Correlation between GRN and M2-Macrophages-related chemokines and immune checkpoint inhibitors
We conducted a co-expression analysis of GRN gene and M2-Macrophages-Related chemokines and immune checkpoint inhibitors in HCC from TCGA-LIHC and ICGC-LIRI-JP cohorts using R-packages “psych” (version 2.1.6).
Cell-cell communication analysis
Single-cell sequencing data GSE151530 and GSE149614 was selected from publicly available GEO databases and subjected to comprehensive bioinformatics analysis using R 4.3.3 software (R Core Team, 2024) and R package (Seurat and Cellchat). Because that our study focused on hepatocellular carcinoma, we extracted single-cell sequencing results from 25 patients with HCC including 56,721 cells in GSE15130. We utilized the Harmony algorithm for batch effect correction to achieve integration of all HCC sample data. After rigorous quality control, 36,681 cells remained for analysis. However, batch effect correction was not performed for GSE149614, as this dataset comprises both tumor and adjacent non-tumor tissues. To preserve the biological heterogeneity inherent to these two tissue types, the original data structure was retained, and finally 55,631 cells from GSE149614 remained for analysis. Principal component analysis (PCA) was initially performed based on 3,000 highly variable genes, followed by dimensionality reduction and clustering using the Uniform Manifold Approximation and Projection (UMAP) method or t-distributed Stochastic Neighbor Embedding (t-SNE). Through integration of genes exhibiting distinct expression patterns and manual annotations, the clustering process was further refined, resulting in the identification of seven cell types. By establishing thresholds for specific levels of gene expression, cells can ultimately be categorized into 10 distinct types. The CellChat package facilitated visualization and quantification of interactions between various cell types, listing detailed interaction relationships. This analysis focused on identifying both the number and strength of interactions, with interactions involving fewer than 10 designated cells excluded from the results.
Cell lines
The myeloid cell line THP-1 were purchased from the Chinese Academy of Sciences Shanghai Branch Cell Bank (Shanghai, China). Cell lines were cultured in Dubecco’s modified Eagle’s medium (DMEM; Gibco, Geand Island, NY, USA) with 10% fetal bovine serum (Gibco, NY, USA) at 37 °C in a humidified incubator with 5% CO2.
Stable cell line generation
Lentiviral vectors were established by Vigene Biosciences, Shangdong, China. GRN-overexpressing vectors (Lv-GRN) and control vectors (Lv-nc) were transfected into THP-1 cells according to the manufacturer’s protocols. To select clones stably overexpressing GRN, cells after transfection were treated with puromycin for 2 weeks. After 2 weeks, cells were harvested and examined the overexpression efficiency of GRN using qRT-PCR.
qRT-PCR
TRIzol reagent (TaKaRa, Tokyo, Japan) was used to extract the total RNAs of cells with the indicated treatment. cDNA was synthesized using the PrimeScript™ 1st Strand cDNA Synthesis Kit (TaKaRa). Real-time PCR was carried out by SYBR Green PCR Kit (TaKaRa). Primers used in the present study were shown in Table S1.
Patients and specimens
The study was reviewed and approved by the ethics committee of the First Huizhou Affiliated Hospital of Guangdong Medical University (Approval Number: KYLL-2024-003-01). All patients provided written informed consent before these clinical samples were used in the study. Fresh HCC samples were collected from two HCC patients who underwent hepatectomies at the Department of hepatobiliary surgery, the First Huizhou Affiliated Hospital of Guangdong Medical University.
Immunofluorescence assay
Fresh HCC tumor tissues were provided by the Department of hepatobiliary surgery, the First Huizhou Affiliated Hospital of Guangdong Medical University. Following a standardized application procedure, frozen HCC tissues were cut into 3-mm slices and glued to glass slides. The slides were washed with phosphate-buffered saline, fixed with 4% paraformaldehyde, permeabilized with 0.25% Triton-X-100, blocked with 5% bovine serum albumin at room temperature. The slides were then incubated with anti-GRN (Cat No. 10053-1-AP, dilution, 1:100; Proteintech Group, Wuhan, China) and anti-CD68 (Cat No. CL488-25747, dilution, 1:100; Proteintech Group, Wuhan, China) at 4 °C overnight, and incubated with Cy3-conjugated CA goat antibodies against rabbit IgG or FITC-conjugated CA goat antibodies against mouse IgG (Santa Cruz Biotechnology, Dallas, TX, USA) for 30 min at room temperature. The slides were further counterstained with 4, 6-diamidino-2-phenylindole (DAPI; Invitrogen, Waltham, MA, USA), and photographed using a microscope (Carl Zeiss LSM880; Zeiss, Oberkochen, Germany).
Macrophage induction assay in vitro
THP-1 cells were differentiated into M0 macrophages through incubating with 50 ng/ml PMA for 48 h. M0 macrophages were then stimulated with 100 ng/ml LPS for another 48 h to differentiated into M1 macrophage. For M2-like macrophages, M0 macrophages were treated with 20 ng/ml IL-4 for 48 h.
Co-cultured assay
THP-1 cells were pretreated with 50 ng/ml PMA for 48 h, and then stimulated with 20 ng/ml IL-4 for another 48 h to differentiated into M2 macrophages. Cells that have been polarized into M2 phenotype were added to the upper chamber of 24-well Transwell (8 μm pores, Corning Transwell). Then the aforementioned chamber was moved to 24-well plates seeding with activated CD8+ T cells and incubated at 37 °C for 48 h.
Flow cytometry assay
Co-cultured cells were stained with CD3-BV510, CD45-FITC, CD4-BV605, CD8-PE/CY7, PD-1-PE (eBioscience) for surface analysis. The cells were then incubated with fixation buffer (Biolegend, San Diego, CA, USA) for 20 min at room temperature, and the resuspended in 1× intracellular staining perm wash buffer (Biolegend, San Diego, California, U.S). Flow cytometry was performed on BD LSRFortessa and the data were analyzed by flowJo software.
ELISA assay
ELISA assay was conducted using the manufacturer’s instructions. In brief, cells with indication treatments were harvested for ELISA assay. The cell culture medium was removed and replaced with an equal volume of serum-free DMEM. Supernatants were collected after 24 h. The amount of IFN-γ protein in the supernatant of cell culture media was examined by human ELISA kits (Abcam, Cambridge, UK).
Statistical analysis
Gene expression of all samples enrolled in the current study was normalized by log2 transformation. t-test was used to compare the difference expression level of GRN between non-tumor and tumor tissues form TCGA-LIHC and ICGC-LIRI-JP datasets. Two tailed P < 0.05 was considered statistical significance. The Kaplan-Meier survival analysis, log-rank test and Cox proportional hazard regression model were conducted for survival analysis. A Spearman’s or Pearson’s test was used for correlation analysis. Two tailed P < 0.05 was considered statistical significance. All statistical analyses were performed using R language software.
Results
GRN is dominantly expressed by macrophages and upregulated in various cancers
GRN encoded a cytokine-like protein granulin precursor that is localized to lysosomes and endosomes (Fig. S1). The tumor Immune Single-cell Hub (TISCH) is a scRNA-seq database focusing on tumor microenvironment. TISCH provides detailed cell-type annotation at the single-cell level, enabling the exploration of TME across different cancer types (Sun et al., 2021). Using the TISCH database, we found that GRN gene was dominantly expressed in macrophages in various cancers, including breast cancer (BRCA), glioma, kidney renal clear cell carcinoma (KIRC), non-small cell lung cancer (NSCLC), colorectal cancer (CRC), head and neck squamous cell carcinoma (HNSC), HCC, and pancreatic adenocarcinoma (PAAD) (Figs. 1A, 2A, and Table S2). To explore whether GRN is also selectively expressed by macrophages in non-cancer tissues and organs, we integrated the scRNA-seq in normal tissues from The Human Protein Atlas. As expected, GRN is selectively expressed by macrophages in non-cancer tissues and organs (Figs. S2, and S3). To comprehensively analyze GRN expression and distribution in tumor tissues and normal tissues, we analyzed the expression status of GRN across various cancer types from TCGA database. After including the normal tissues of GTEx dataset as controls, GRN was highly expressed in 28 cancer types compared with nontumor tissues, with the highest levels in skin cutaneous melanoma (SKCM) and the lowest in brain lower grade glioma (LGG) (Fig. 2B). Except for those cancer types where no nontumor data was available, GRN was significantly upregulated in 18 cancer types, including glioblastoma multiforme (GBM), glioma (GBMLGG), LGG, cervical squamous cell carcinoma and endocervical adenocarcinoma (CESE), BRCA, esophageal carcinoma (ESCA), stomach and esophageal carcinoma (STES), kidney renal papillary cell carcinoma (KIRP), pan-kidney cohort (KIPAN), stomach adenocarcinoma (STAD), uterine corpus endometrial carcinoma (UCEC), HNSC, KIRC, HCC, thyroid carcinoma (THCA), pheochromocytoma and paraganglioma (PCPG), bladder urothelial carcinoma (BLCA), and cholangiocarcinoma (CHOL), whereas GRN was relatively downregulated in lung adenocarcinoma (LUAD), colon adenocarcinoma (COAD), lung squamous cell carcinoma (LUSC), rectum adenocarcinoma (READ), and kidney chromophobe (KICH) (Fig. 2C). These findings revealed that GRN was dominantly expressed by macrophages and upregulated in various cancers, suggesting that GRN may play an important role in innate immune response and the development of cancers.
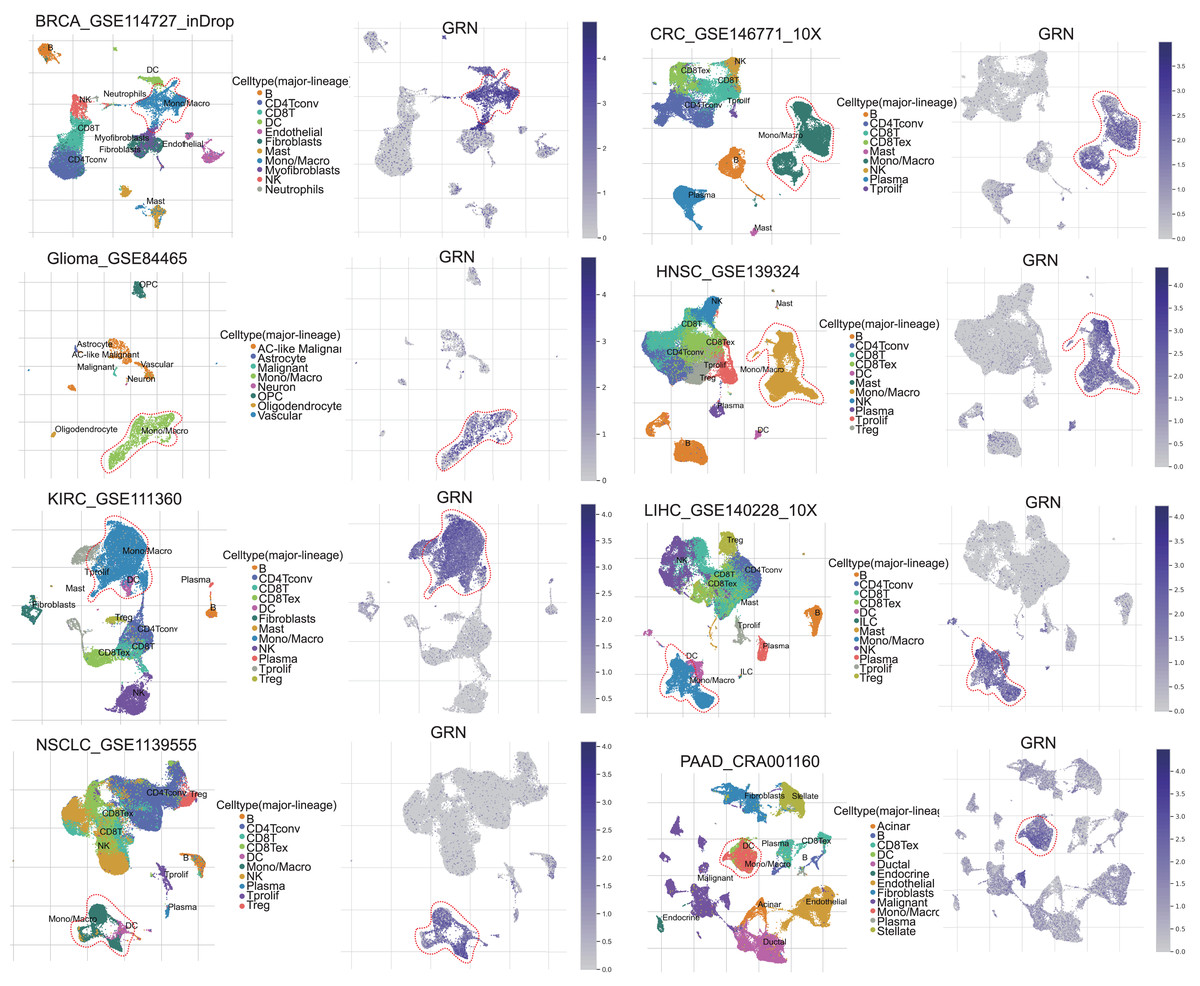
Figure 1: GRN, upregulated in various cancers, is selectively expressed by macrophage.
Analysis of GRN expression in various cancers using pan-cancer single-cell sequencing data set from the TISCH database (http://tisch.comp-genomics.org/).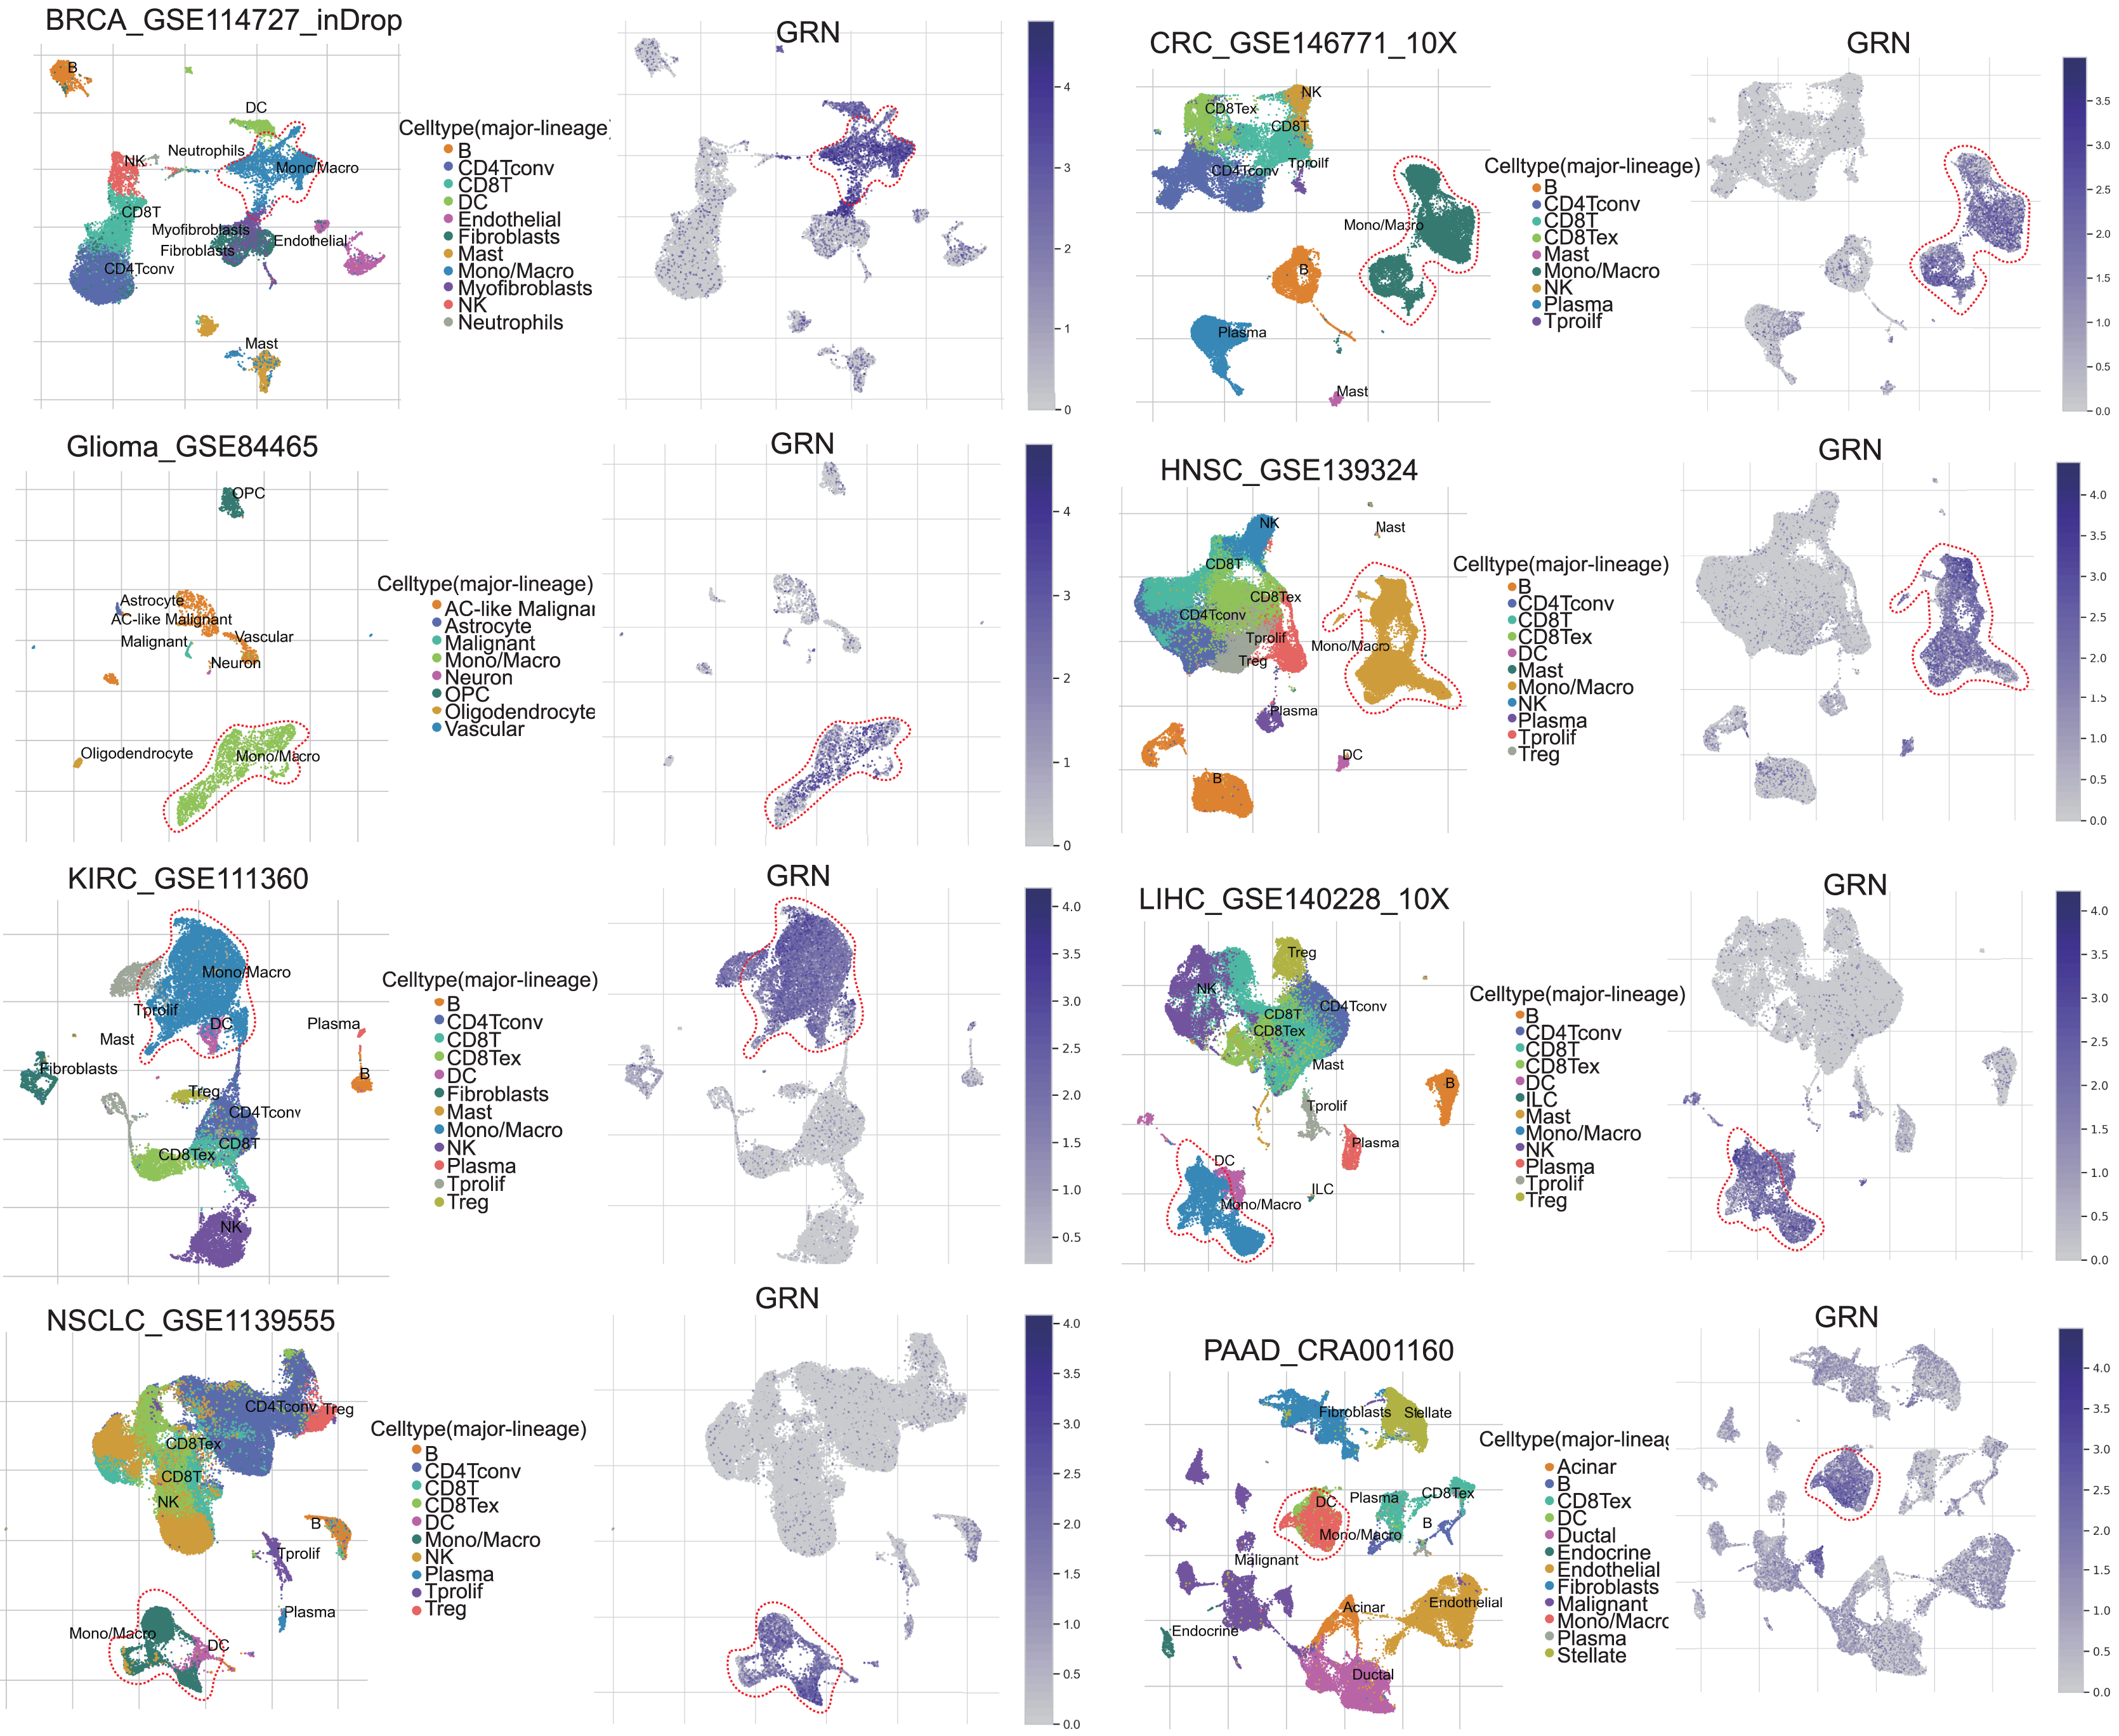
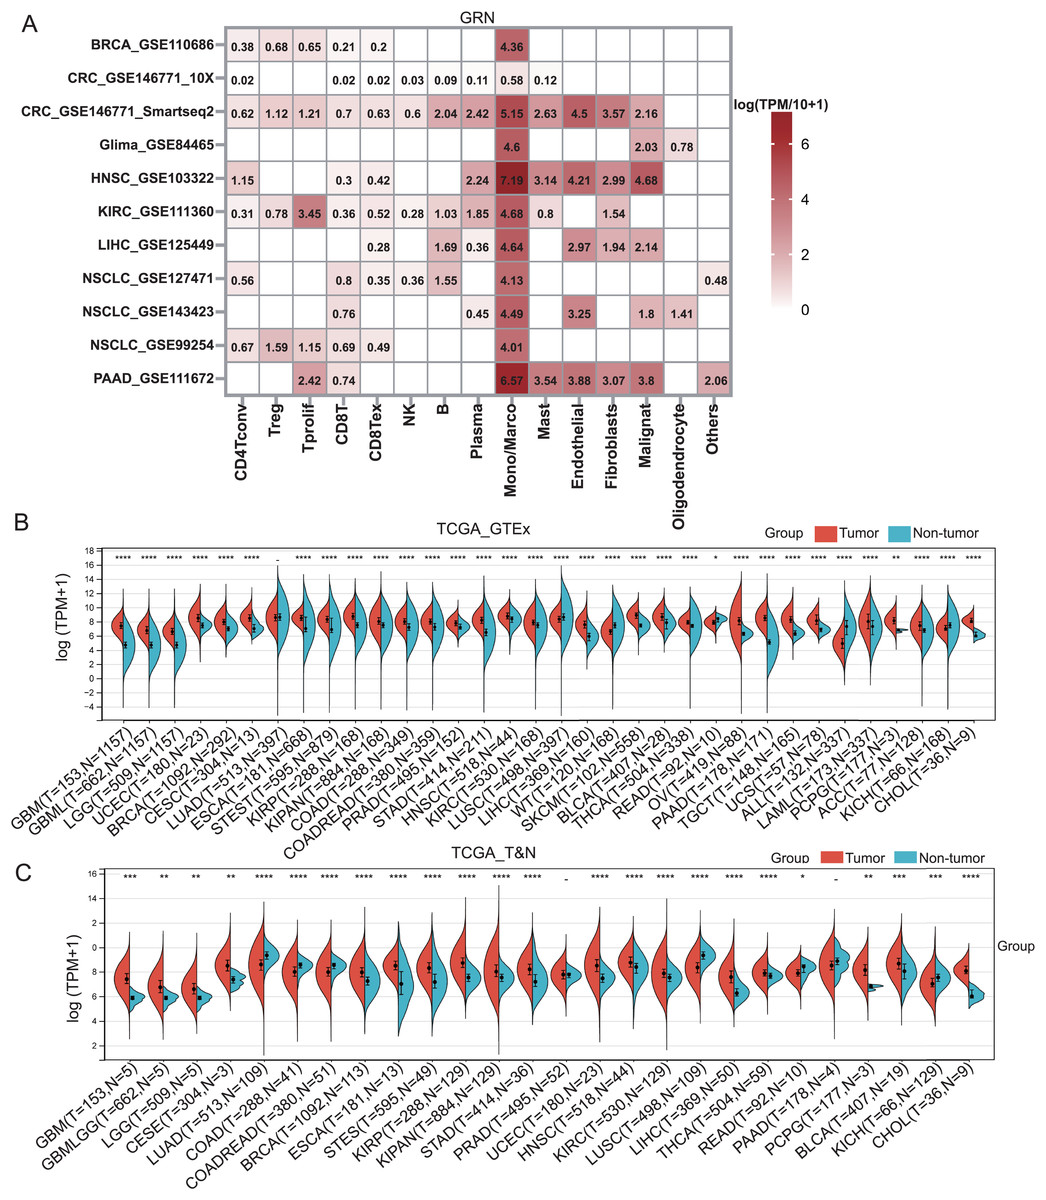
Figure 2: GRN is highly expressed in various cancers.
(A) The GRN expression heatmap of different cell types from the indicated cancers was downloaded from the TISCH database. (B) The corresponding non-tumor tissues of GTEx dataset were included as controls, and GRN expression in 33 cancer types were reanalyzed. * P < 0.05; ** P < 0.01; **** P < 0.0001. (C) The expression status of GRN gene in paired tumor and non-tumor tissues across 22 cancer types from TCGA. * P < 0.05; ** P < 0.01; *** P < 0.001; **** P < 0.0001.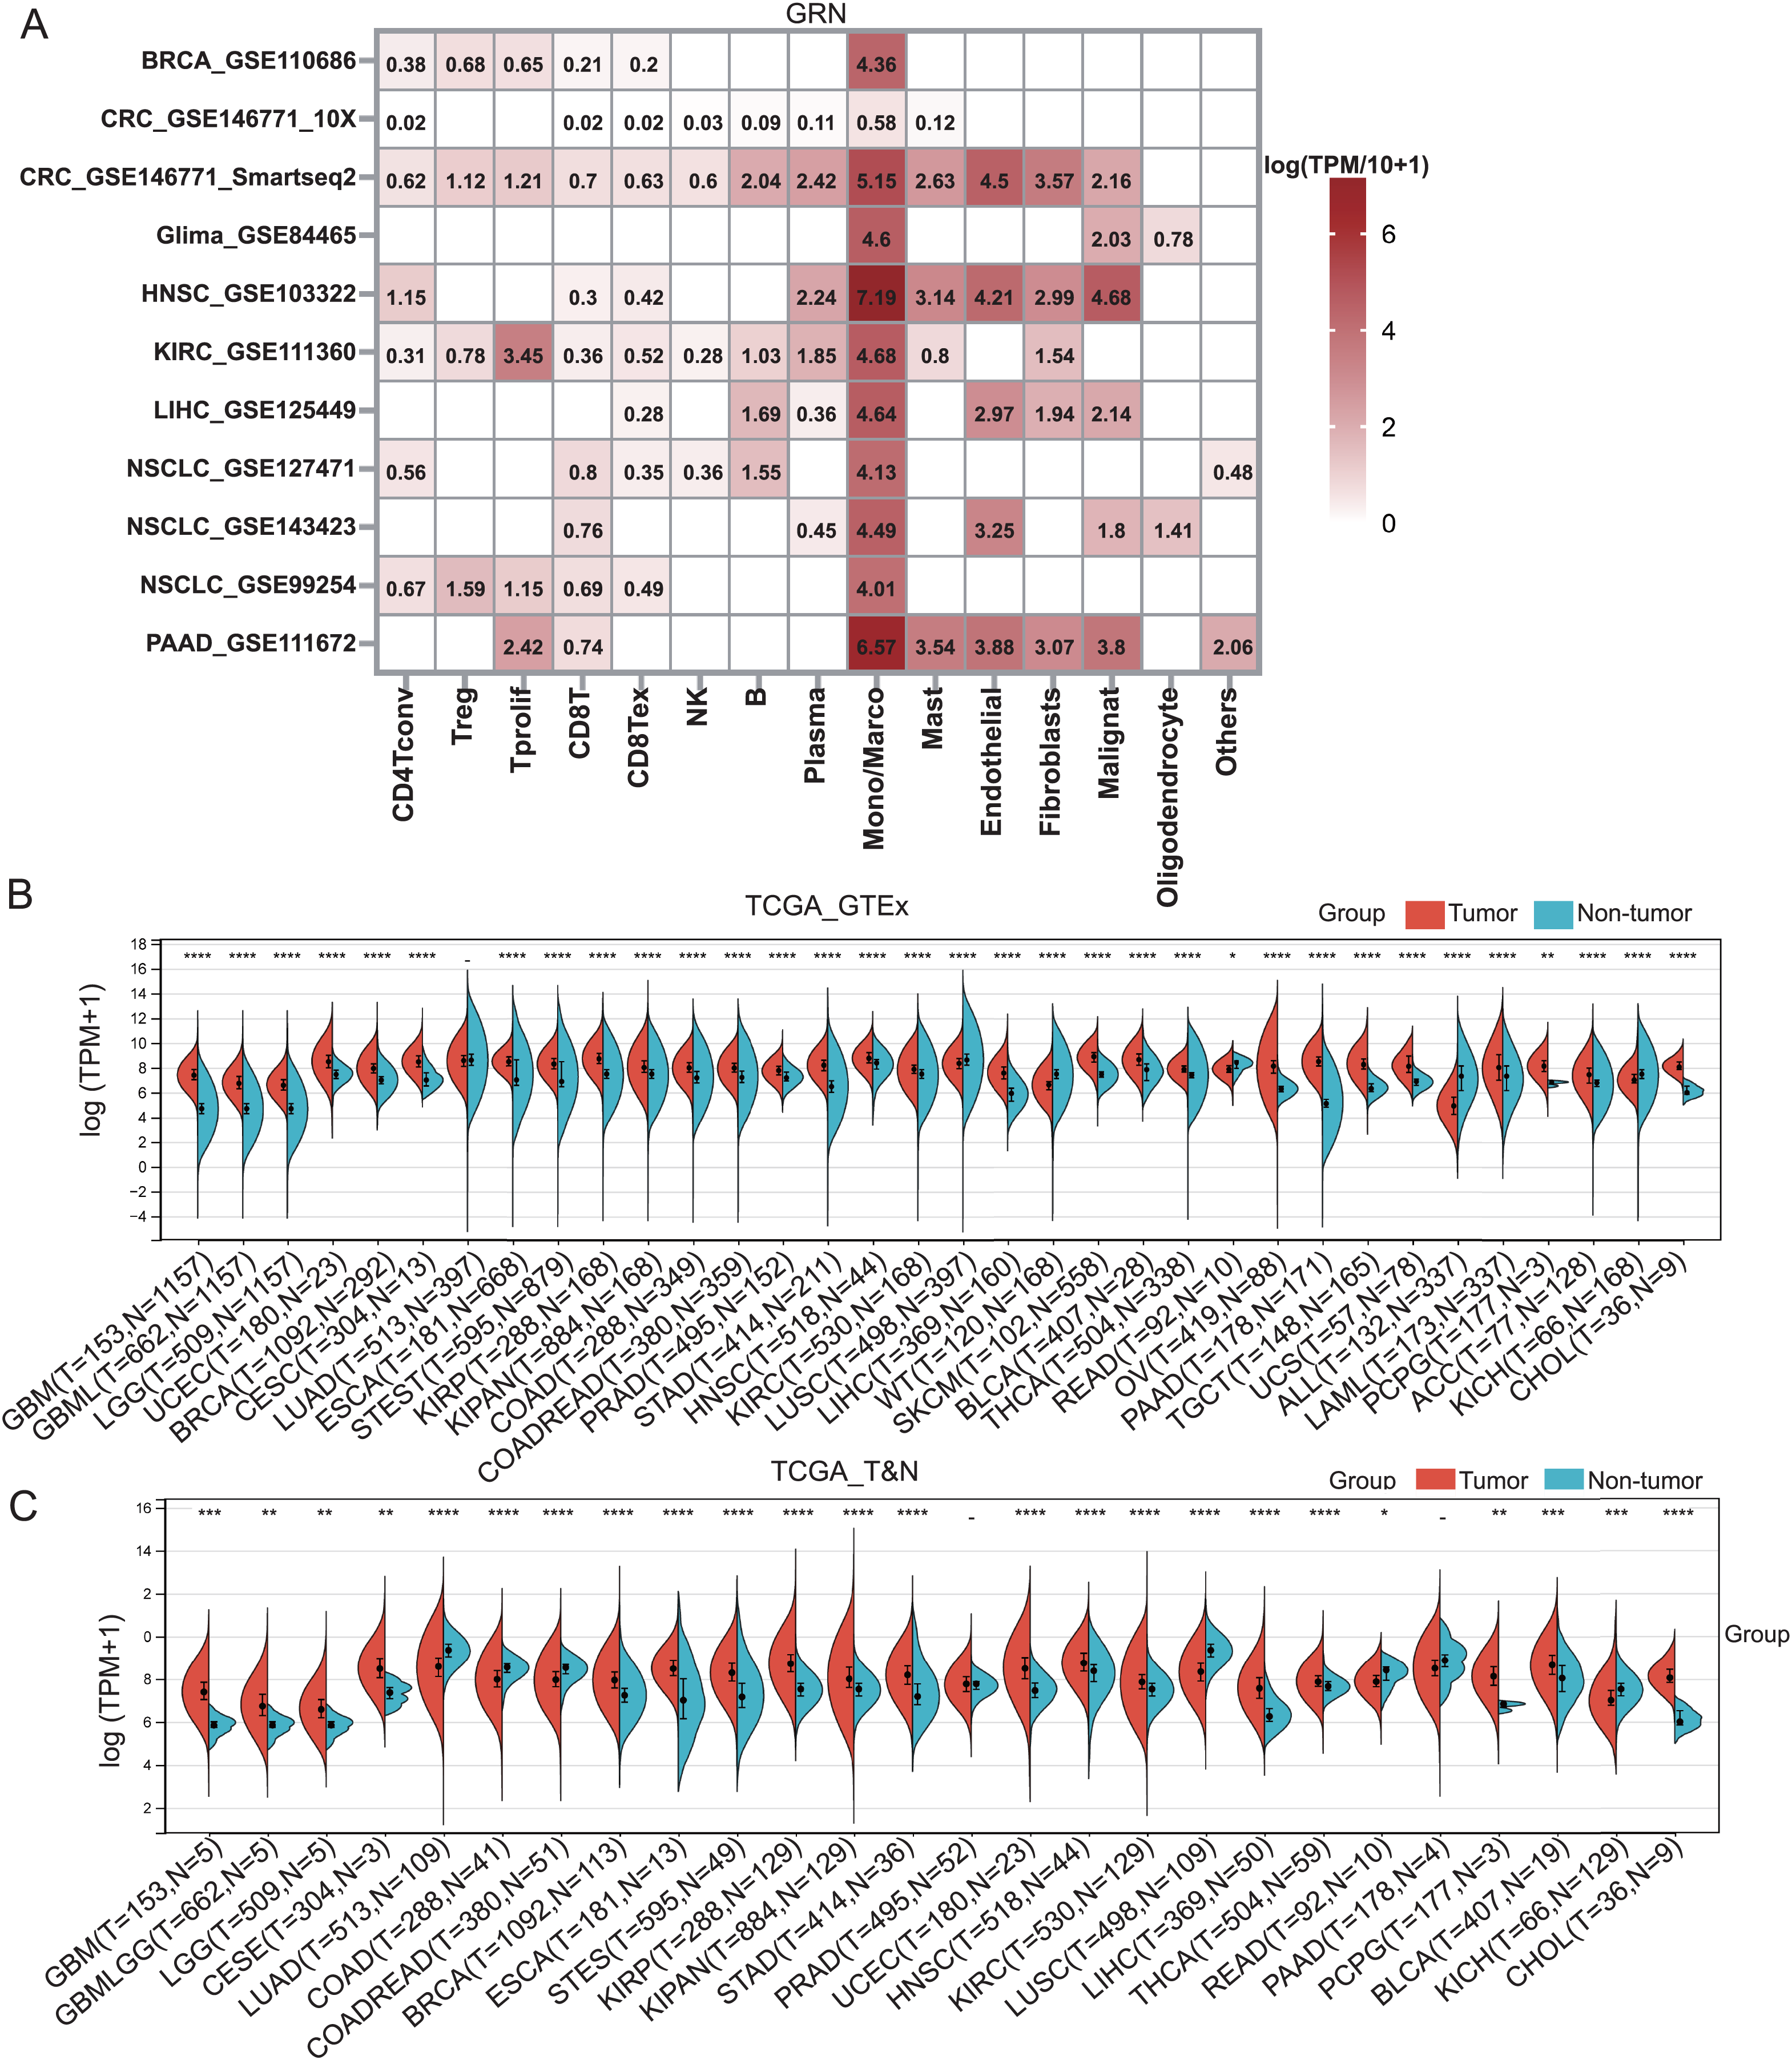
Prognostic value of GRN across cancer types
To investigate the prognostic value of GRN across 33 cancer types, we divided the tumor samples into high-GRN-expression and low-GRN-expression groups based on the expression levels of GRN and explored the association of GRN expression with the prognosis of patients with different cancers using TCGA and TARGET datasets. Cox proportional hazards regression model showed that GRN was an independent prognostics factor for OS in several cancer types, including GBMLGG, LGG, GBM, HCC, KIRP, acute myeloid leukemia (LAML), acute lymphoblastic leukemia (ALL), and lung squamous cell carcinoma (LUSC) (Fig. 3A). More importantly, data from both TCGA and TARGET datasets showed that GRN was an independent prognostics factor for OS in LAML. Consistently, Kaplan-Meier and log-rank test analyses showed that the aforementioned cancer patients with GRN overexpression exhibited a significantly shorter OS time as compared with those with low GRN expression level (Fig. 3B). Moreover, Cox proportional hazards regression model showed that GRN was an independent prognostics factor for DFS in KIPAN, KIRP, CHOL, and HCC (Fig. 3C). Kaplan-Meier plotter presented a positively correlation between high GRN expression and poor DFS in KIPAN, KIRP, CHOL, and HCC (Fig. 3D).
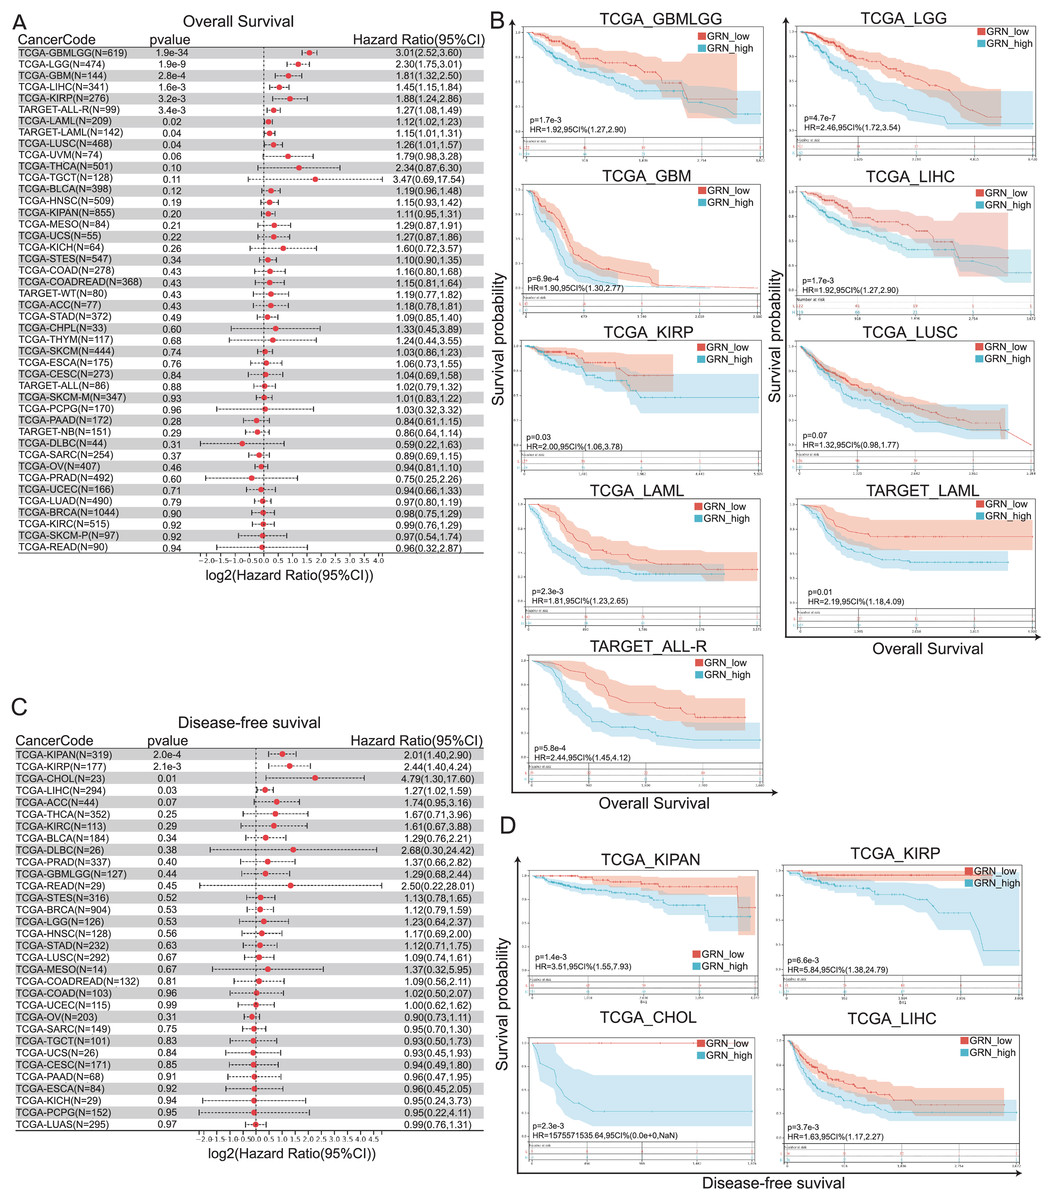
Figure 3: GRN correlates with poor prognosis in patients with cancer.
(A) Cox proportional hazards regression model showing GRN was an independent prognostics factor for OS in several cancer types, including GBMLGG, LGG, GBM, HCC, KIRP, and LUSC. (B) Kaplan-Meier and log-rank test analyses showing GRN overexpression exhibits a significantly shorter OS time as compared with those with low GRN expression level. (C) Cox proportional hazards regression model showing GRN was an independent prognostics factor for DFS in KIPAN, KIRP, CHOL, and HCC. (D) Kaplan-Meier plotter presenting a positively correlation between high GRN expression and poor DFS in KIPAN, KIRP, CHOL, and HCC.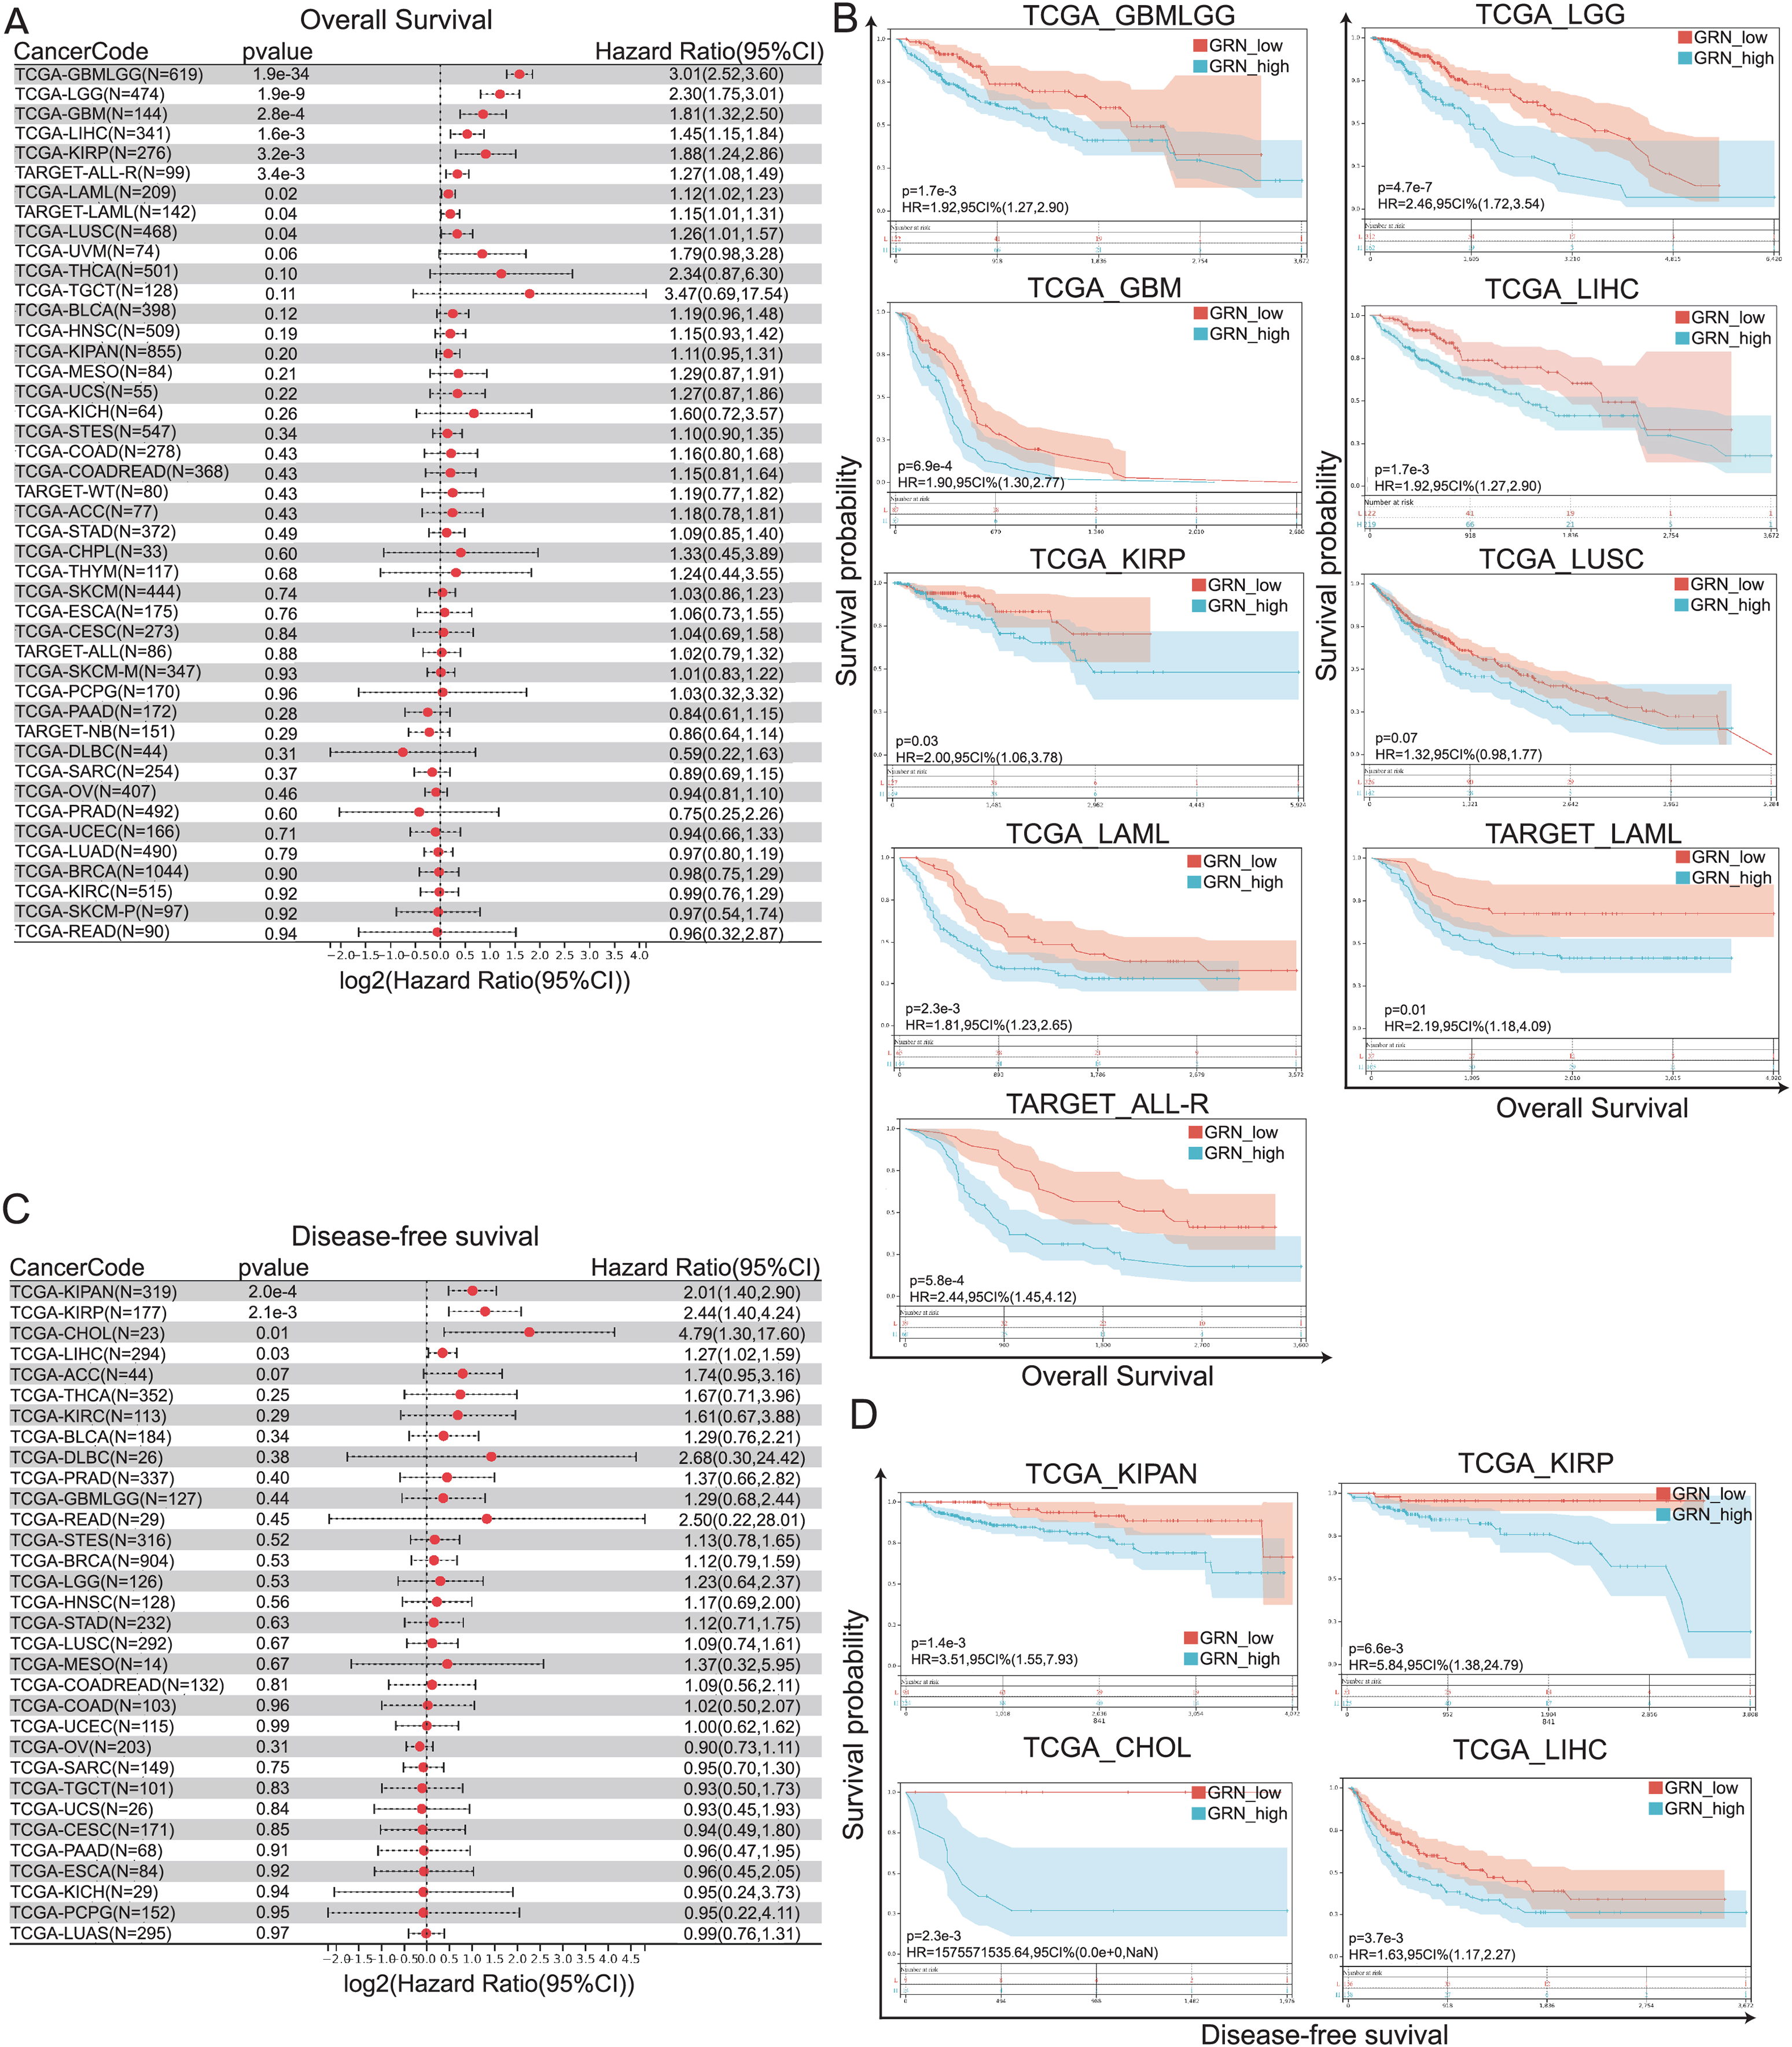
Association between GRN expression and levels of tumor immune cell infiltration
Tumor infiltrating immune cells, as the main component of the tumor microenvironment, play pivotal roles in tumor occurrence and development (Elhanani, Ben-Uri & Keren, 2023). Hence, we explored the association between GRN expression and levels of immune cells by TIMER algorithm. Our data revealed that levels of immune infiltration were closely correlated with GRN expression in most type of cancer (Fig. 4A). We observed a statistical positive correlation between the immune-infiltrating cells of macrophages and GRN expression in 28 cancer type (Fig. 4A). Among them, three tumors including KICH, TGCT, and UCS presented the strongest correlation between GRN expression level and macrophages infiltration level (Fig. 4A). Moreover, we found that GRN expression level was significantly upregulated in M2 macrophages in various cancer types using the GEPIA2021 online tool (Fig. 4B). Evidence has been proved that TAMs are often educated by TME and polarisation toward the M2-like phenotype, which induces T-cell exhaustion to promote tumor progression and ICB resistance (Chen et al., 2021; Li et al., 2022). Because GRN was selectively expressed by TAMs and was significantly upregulated in M2-phenotype, we next investigated the correlation between GRN and T-cell exhaustion signatures in multiple cancers. Intriguingly, GRN expression was positively correlated with the T-cell exhaustion signature in Adrenocortical carcinoma (ACC), BRCA, COAD, GBM, KIRP, LGG, HCC, and READ (Fig. 4C). These findings indicted that GRN might be associated with M2-phenotype polarization, which in turn leads to T-cell exhaustion.
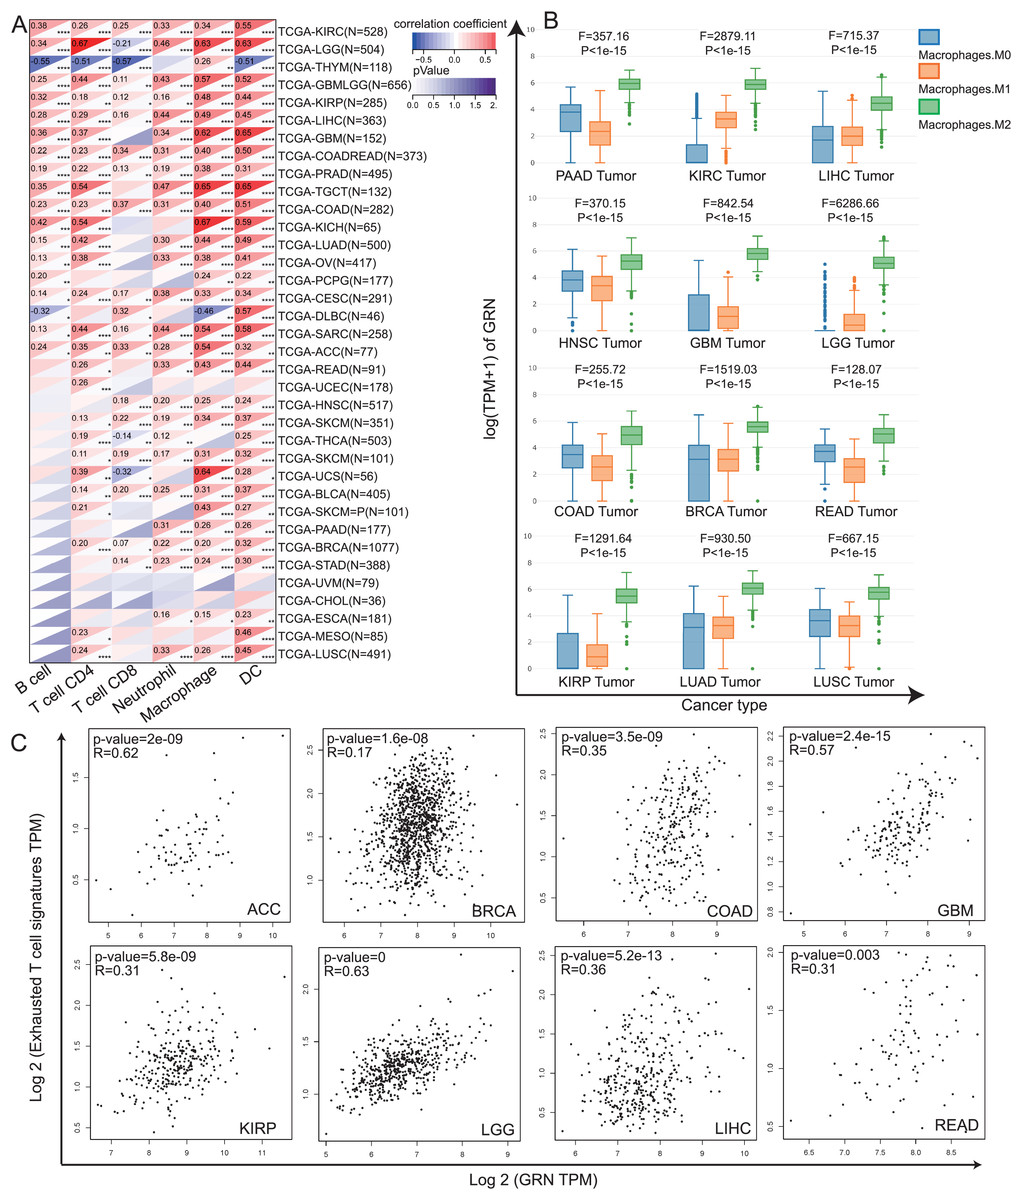
Figure 4: The correlation between GRN expression level and the infiltration of immune cells.
(A) Spearman’s correlation coefficients between GRN expression and six immune cell types in the TCGA-LIHC cohort. * P < 0.05; ** P < 0.01; *** P < 0.001; **** P < 0.0001. (B) Expression level of GRN in different macrophage subgroups was evaluated using the GEPIA2021 online tool (http://gepia2021.cancer-pku.cn/sub-expression.html). (C) The correlation between GRN expression level and exhausted T cell signature was examined from TCGA-LIHC cohort with the help of GEPIA2 online tool (http://gepia2.cancer-pku.cn/#index).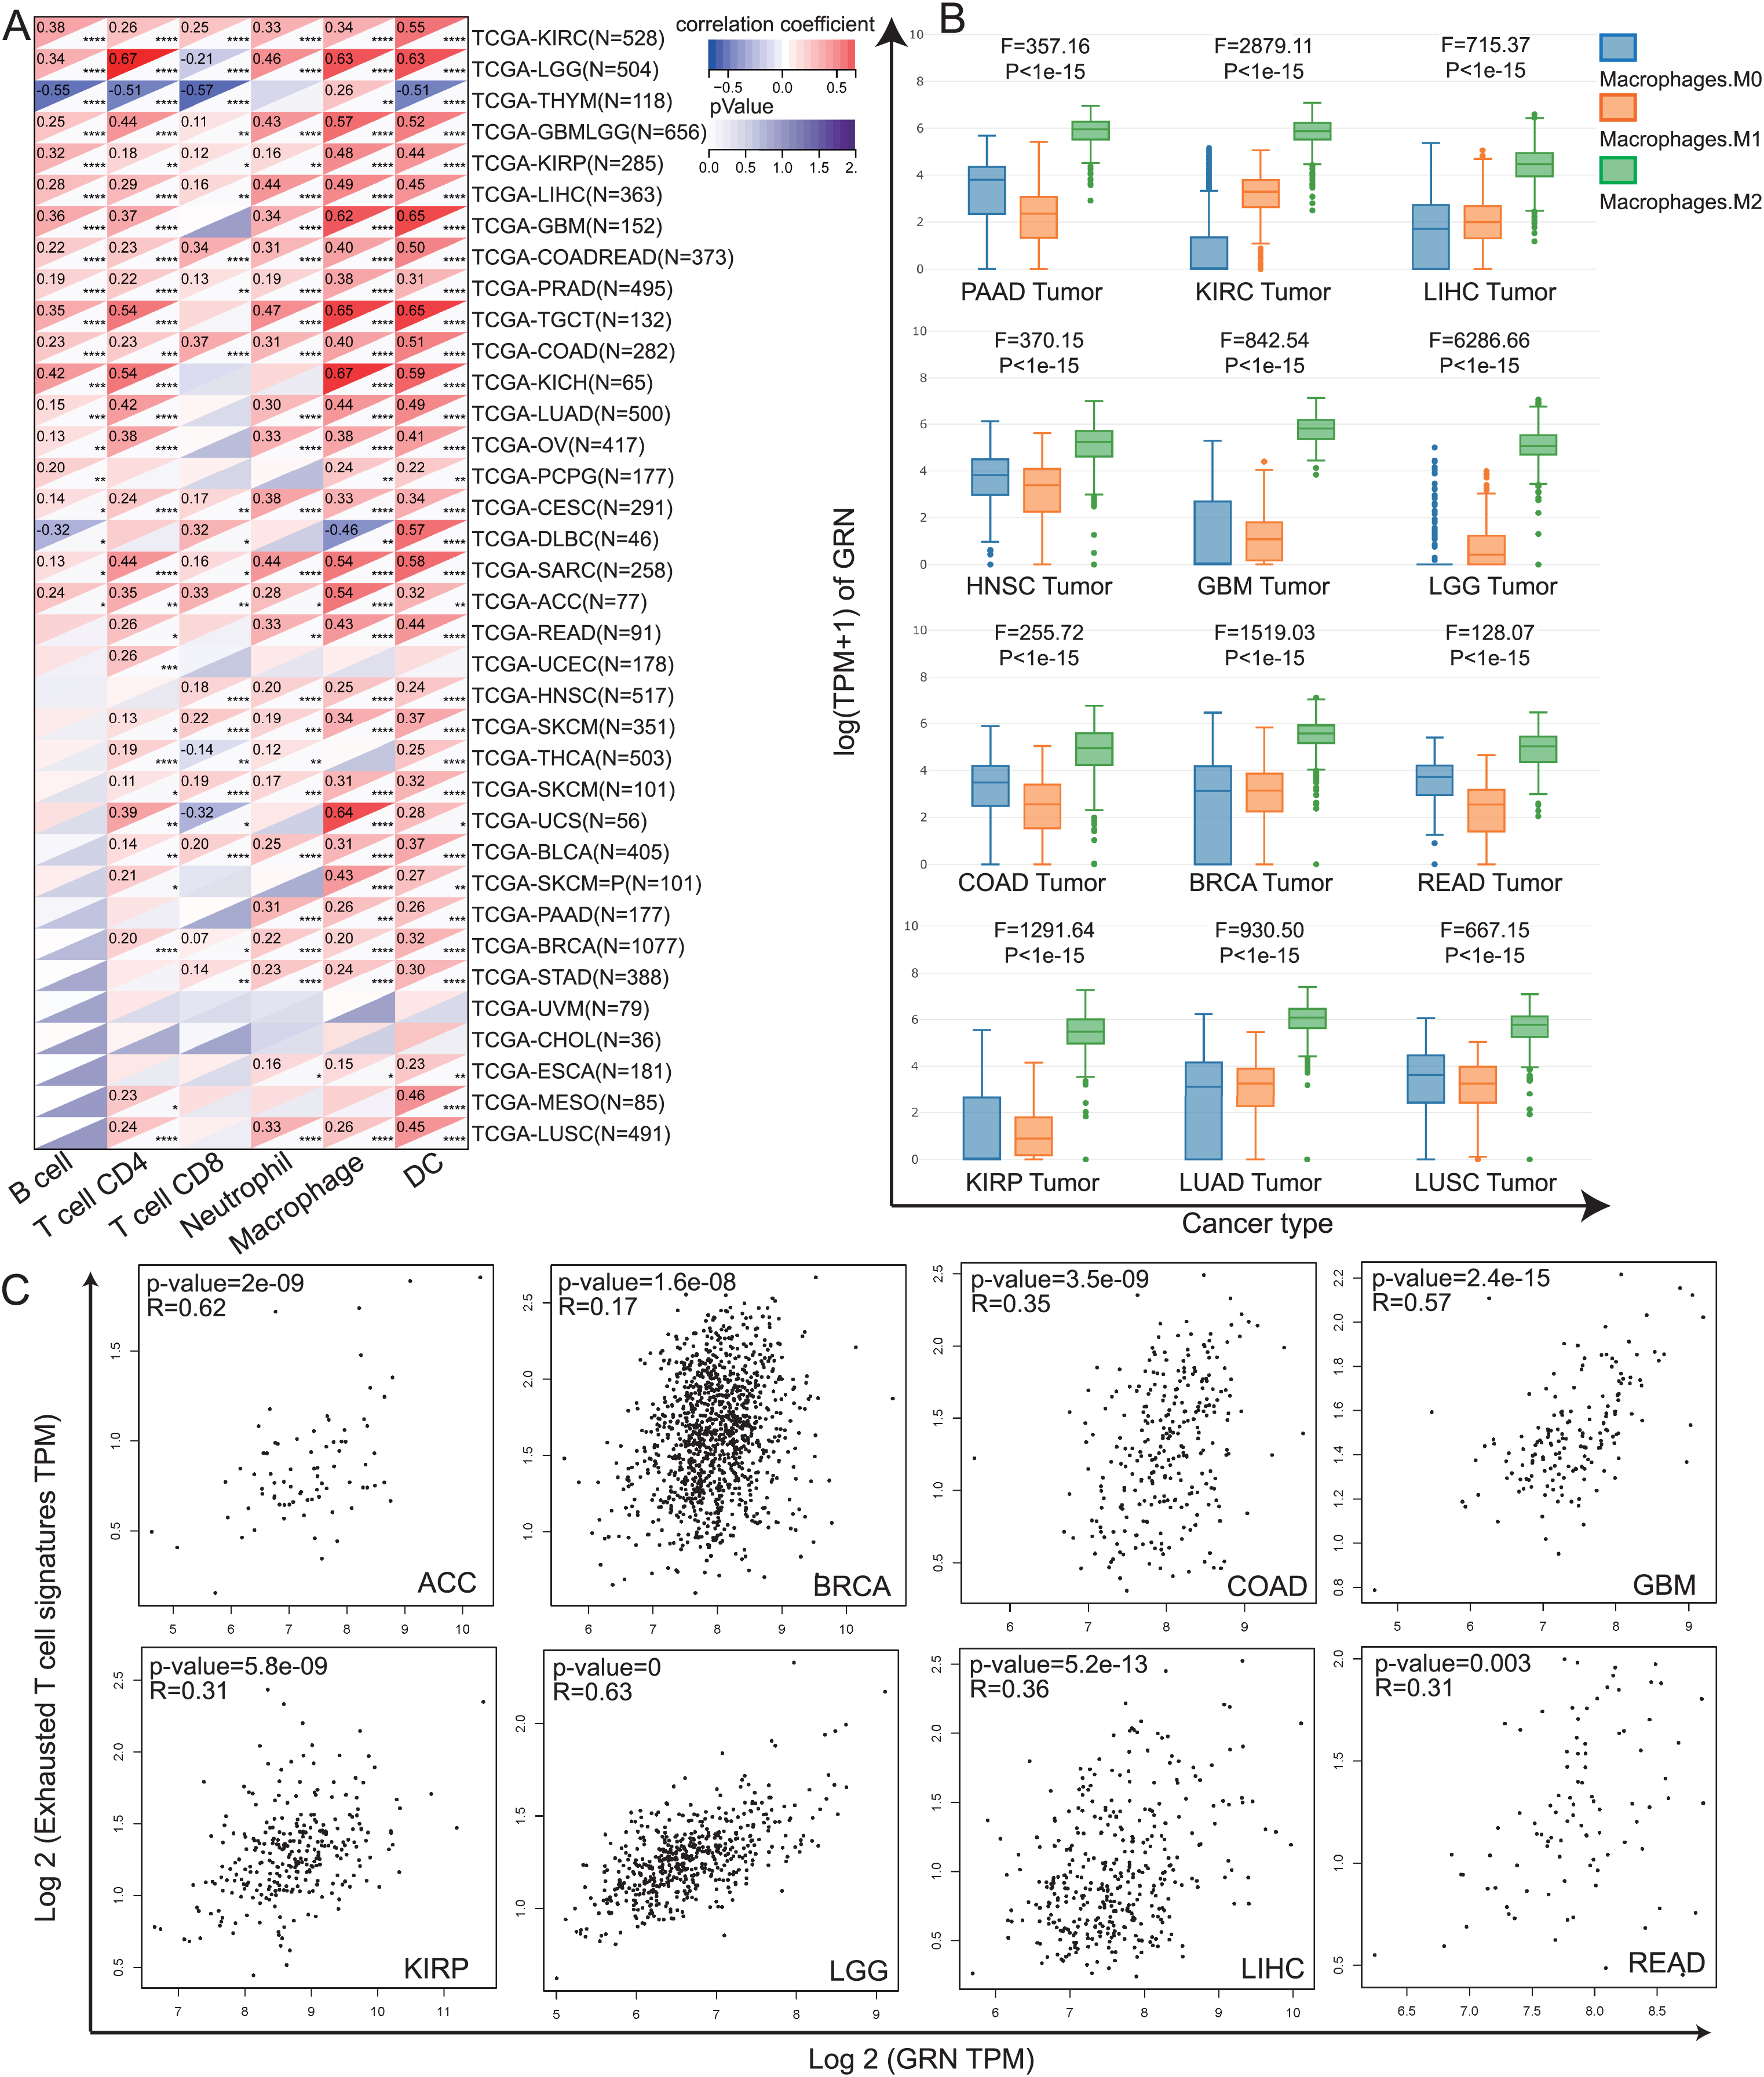
GRN is highly upregulated in HCC
We conducted a largescale data mining analysis of 80 HCC cohorts and found significant changes in GRN mRNA levels in 49 HCC cohorts. Among them, 47 HCC cohorts exhibited a significant increase in GRN mRNA expression level in HCC tissues (Fig. 5A). Two representative HCC cohorts with high GRN expression level were shown in Fig. 5B. To confirm GRN expression at protein level, we analyzed total protein expression from CPTAC dataset. CPTAC dataset showed higher protein expression level of GRN in primary HCC tissues than that in non-tumor tissues (Fig. 5C). Furthermore, spatial transcriptomics together with bulk cell RNA-seq profiles confirmed the highly expression of GRN in HCC tissues in comparison with adjacent non-tumor tissues. More importantly, compared with tumor tissue, GRN was more likely to be expressed in the stroma area between HCC tissues and adjacent non-tumor tissues (Fig. S4A). Additionally, SPP1+ macrophages highly expressed GRN were more observed near the tumor boundary (Fig. 4B). To explore whether GRN was highly expressed in macrophages, double immunofluorescence staining assay was performed using fresh HCC tissue specimens. The results showed that GRN had obvious colocalization with macrophage cell-type marker CD68, suggesting the infiltration of GRN+ macrophages in HCC tumor tissues (Fig. 5D).
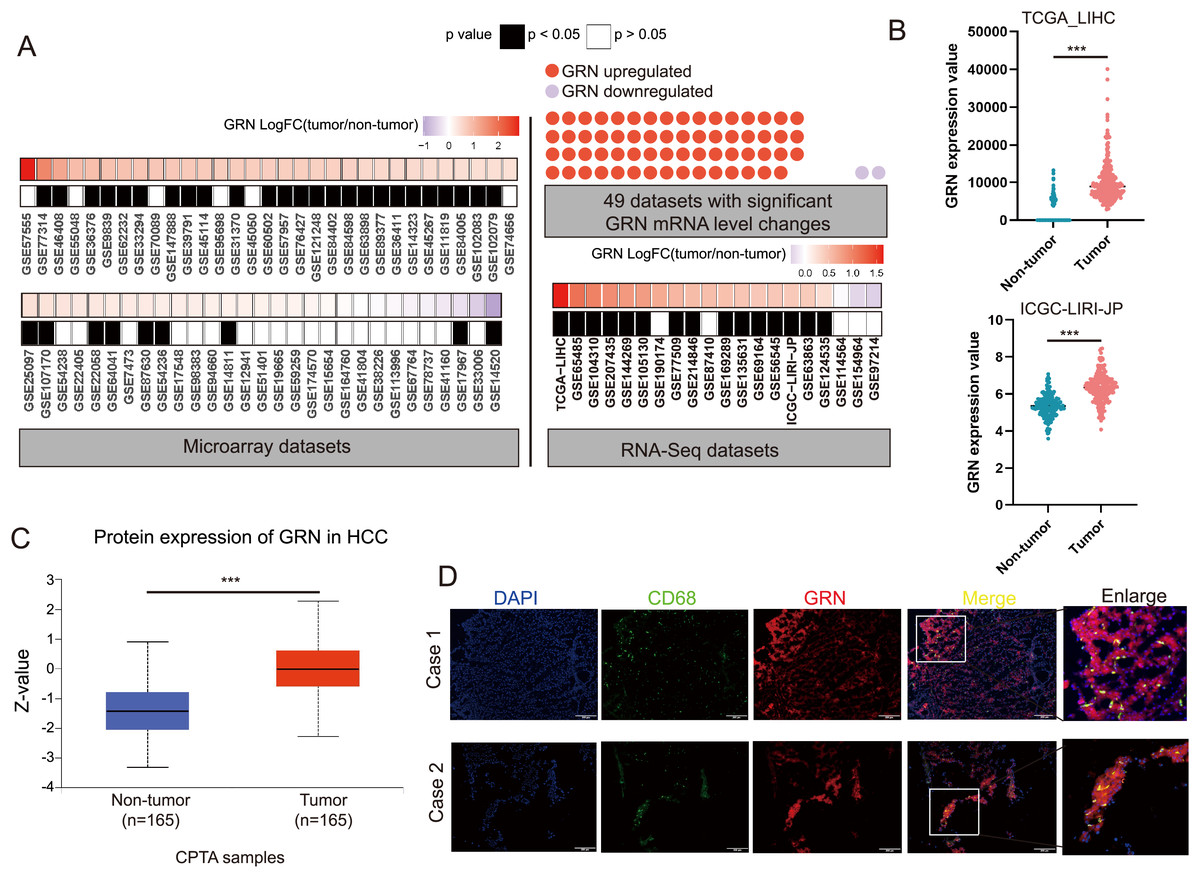
Figure 5: GRN is highly expressed in HCC both at mRNA and protein level.
(A) Large-scale data mining was used to compare the expression differences in GRN mRNA between HCC tumor and non-HCC tissues. (B) Comparison of GRN gene expression between non- tumor and tumor tissues from TCGA-LIHC and ICGC-LIRI-JP cohorts. *** P < 0.001. (C) GRN protein expression between non-tumor and tumor tissues from CPTAC (https://ualcan.path.uab.edu/cgi-bin/CPTAC). (D) Representative images of immunofluorescence co-staining for GRN (red) with macrophage cell-type marker CD68 (green) in HCC tissue specimens.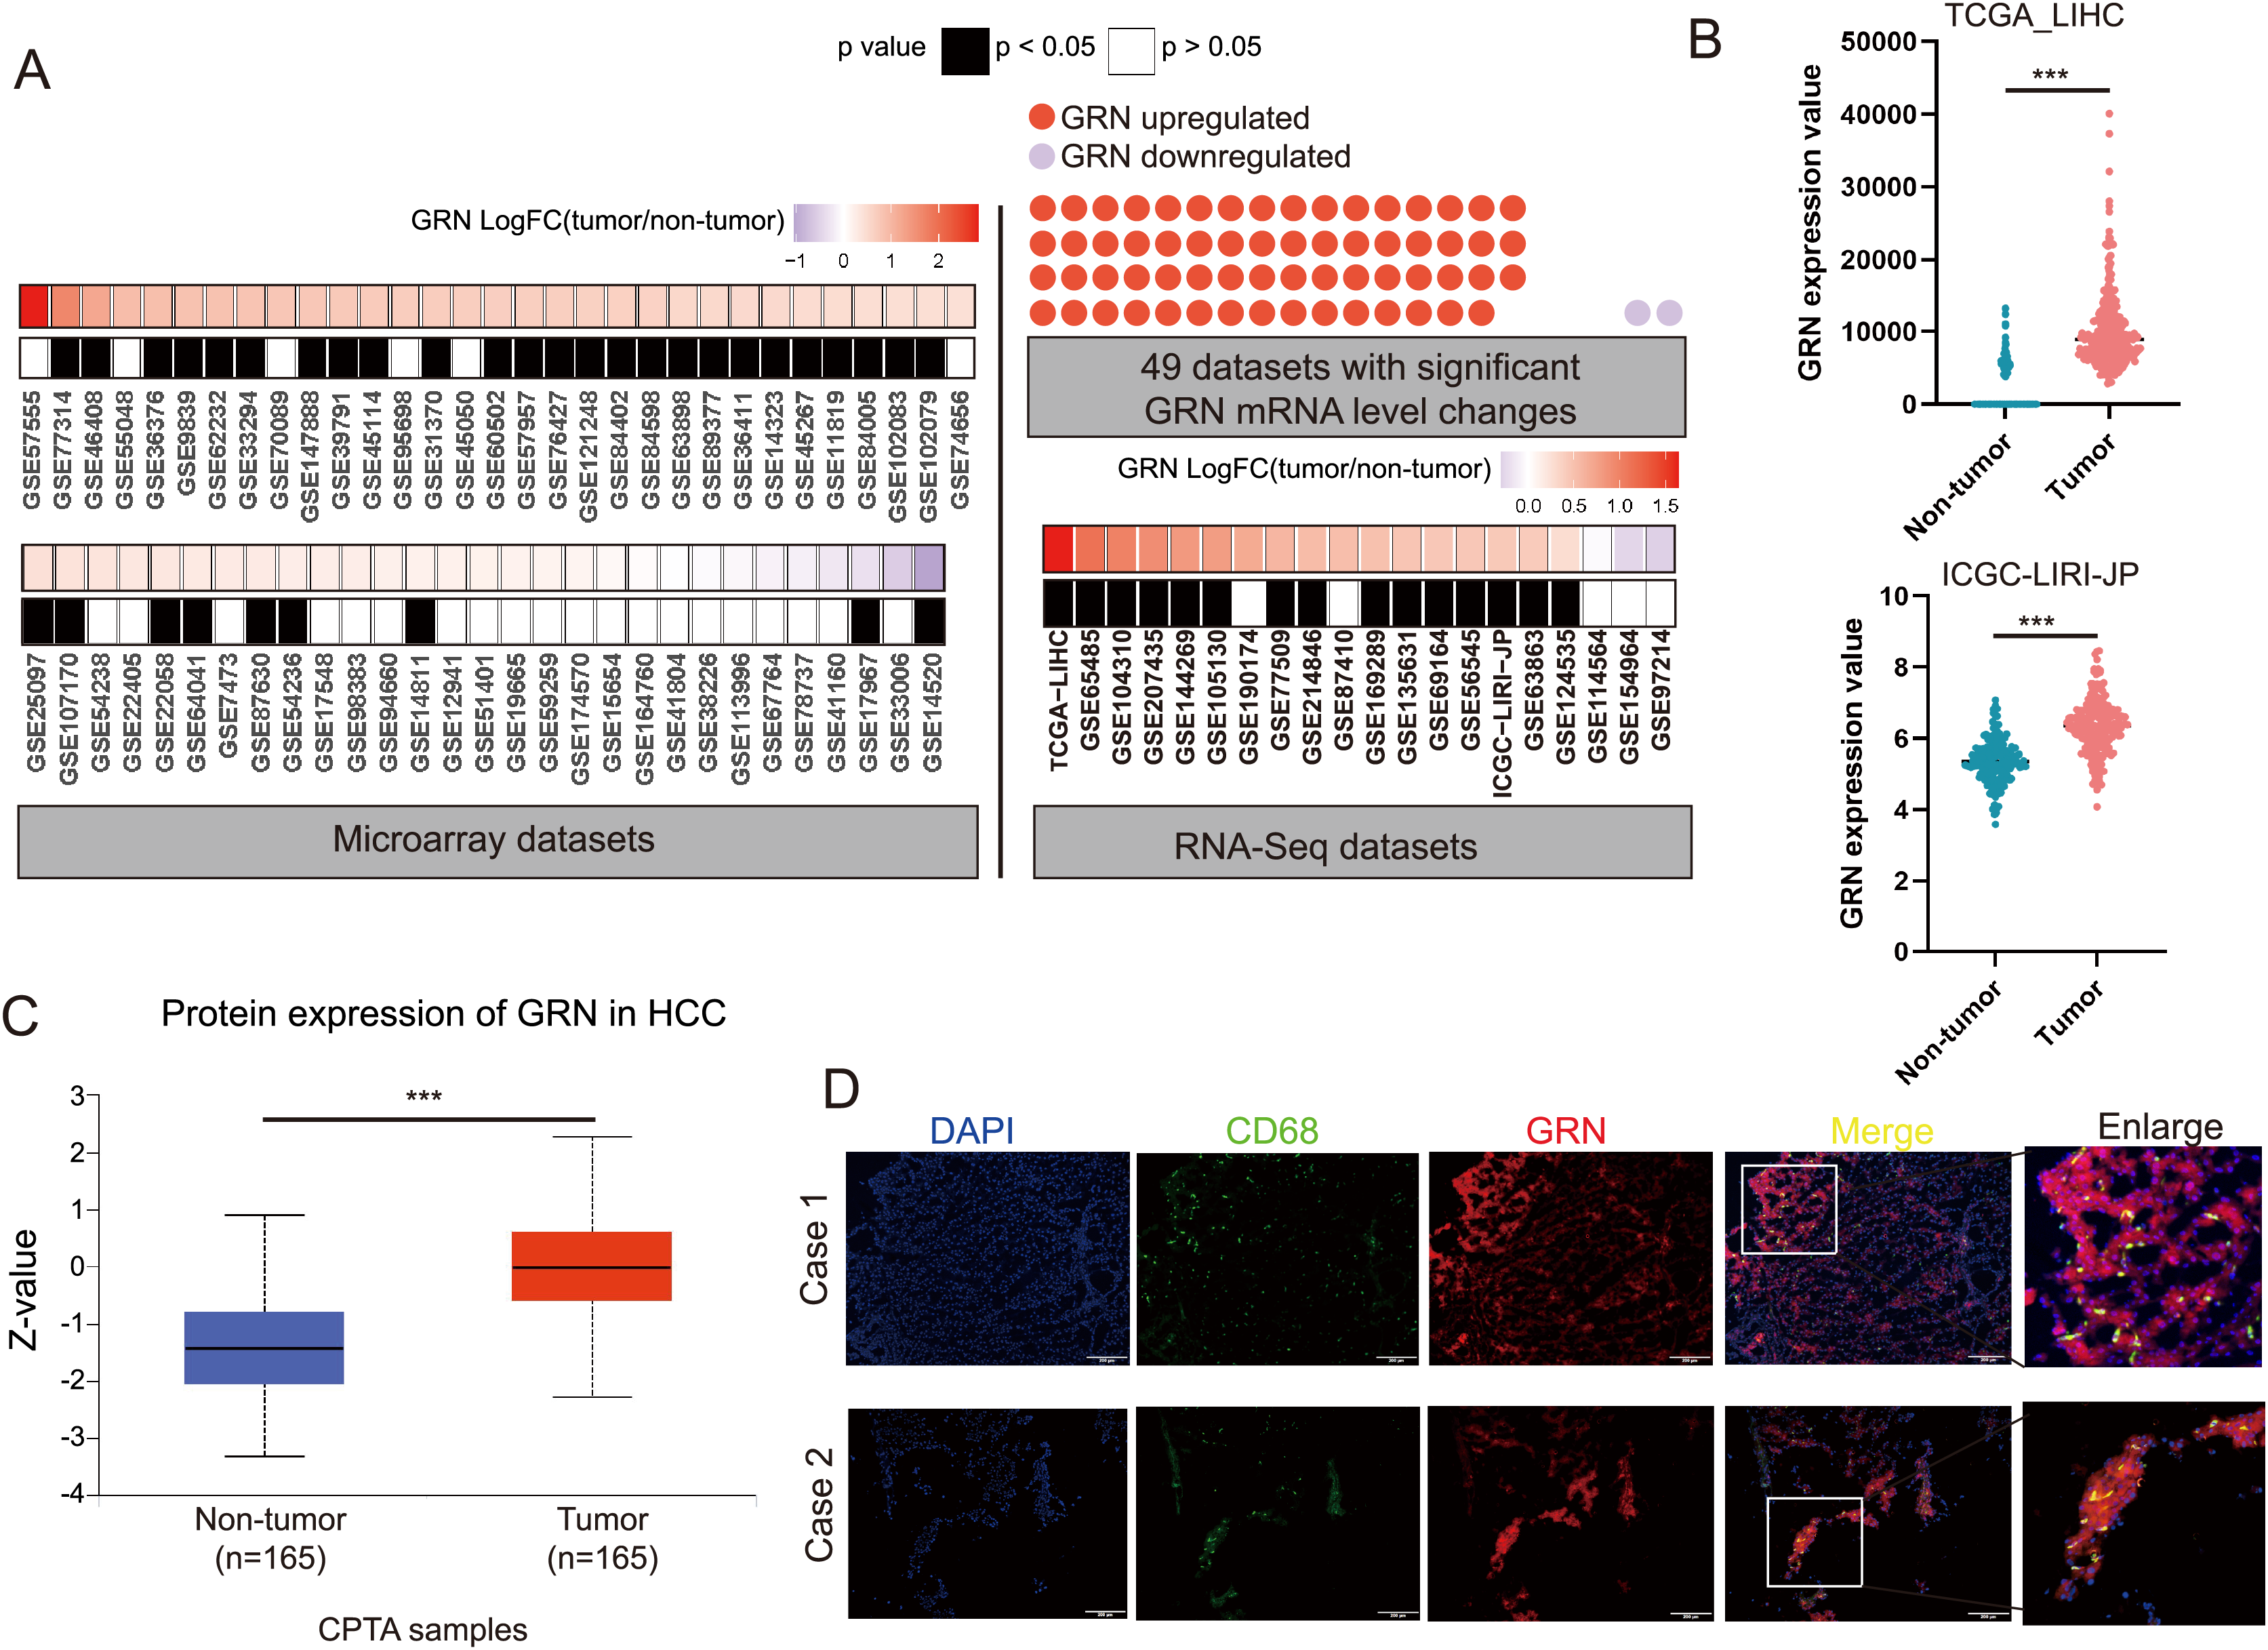
GRN correlates with M2-phenotype infiltrations and predicts an immunosuppressive microenvironment in HCC
We investigated the correlation between GRN expression and subgroups of infiltration macrophages in HCC. Significantly positive correlation between GRN expression level and infiltrating of M2 macrophages was observed in HCC (Fig 6A). We further investigated the survival of patients with high or low GRN expression stratified by levels of infiltrating M2 macrophages. Interestingly, in HCC, patients with high expression of GRN as well as increased infiltration of M2 macrophages showed the worst survival (Fig. 6B), suggesting that the combined analysis of GRN and infiltration of M2 macrophages could better predict the prognosis for patients with HCC. We then investigated the correlation between GRN and canonical biomarkers of M2 macrophages. GRN expression was positively associated with M2 macrophages biomarkers, such as TGFB1, TGFB2, TGFB3, IL10, and CD163 in HCC of the TCGA dataset, which were confirmed by another HCC cohort (Fig. 6C). We also took further step to investigate the correlation between GRN and immune checkpoints. A positive correlation between GRN and immune checkpoints including CTLA4, PDCD1, VSIG4, and HAVCR2 were observed, indicating that GRN may be a potential antitumoral targeting by regulating these immune checkpoint proteins (Fig. 6C).
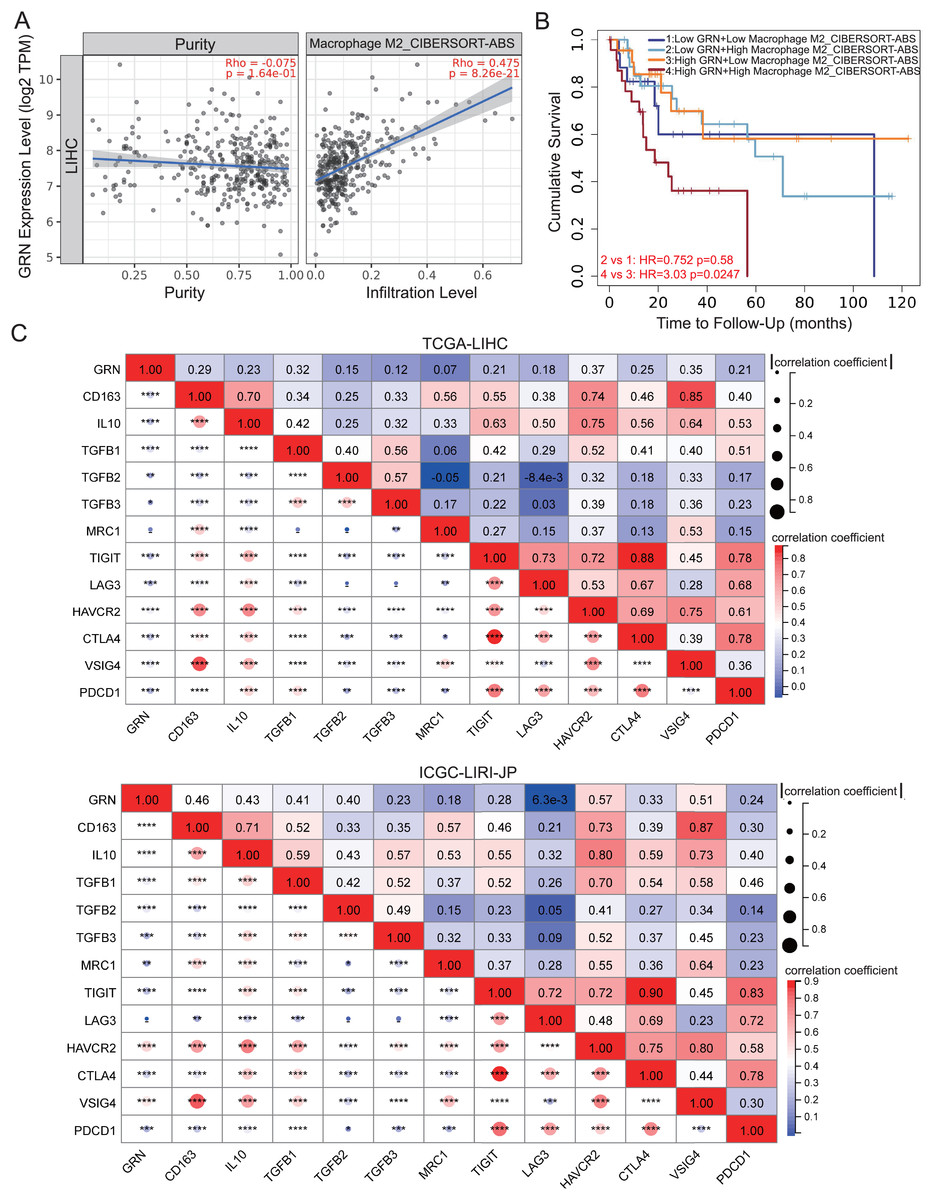
Figure 6: GRN correlates with M2-phenotype macrophage infiltrations and predicts an immunosuppressive microenvironment in HCC.
(A) Correlation between GRN expression level and infiltration of M2-like macrophages from TCGA-LIHC cohort was shown. (B) Kaplan-Meier survival of HCC patients with different GRN expression level stratified by levels of infiltrating M2 macrophages. (C) Co-expression heatmap illustrating the correlation between GRN expression and M2 macrophages biomarkers and inhibitory receptors from TCGA-LIHC and ICGC-LIRI-JP cohorts. * P < 0.05; ** P < 0.01; *** P < 0.001; **** P < 0.0001.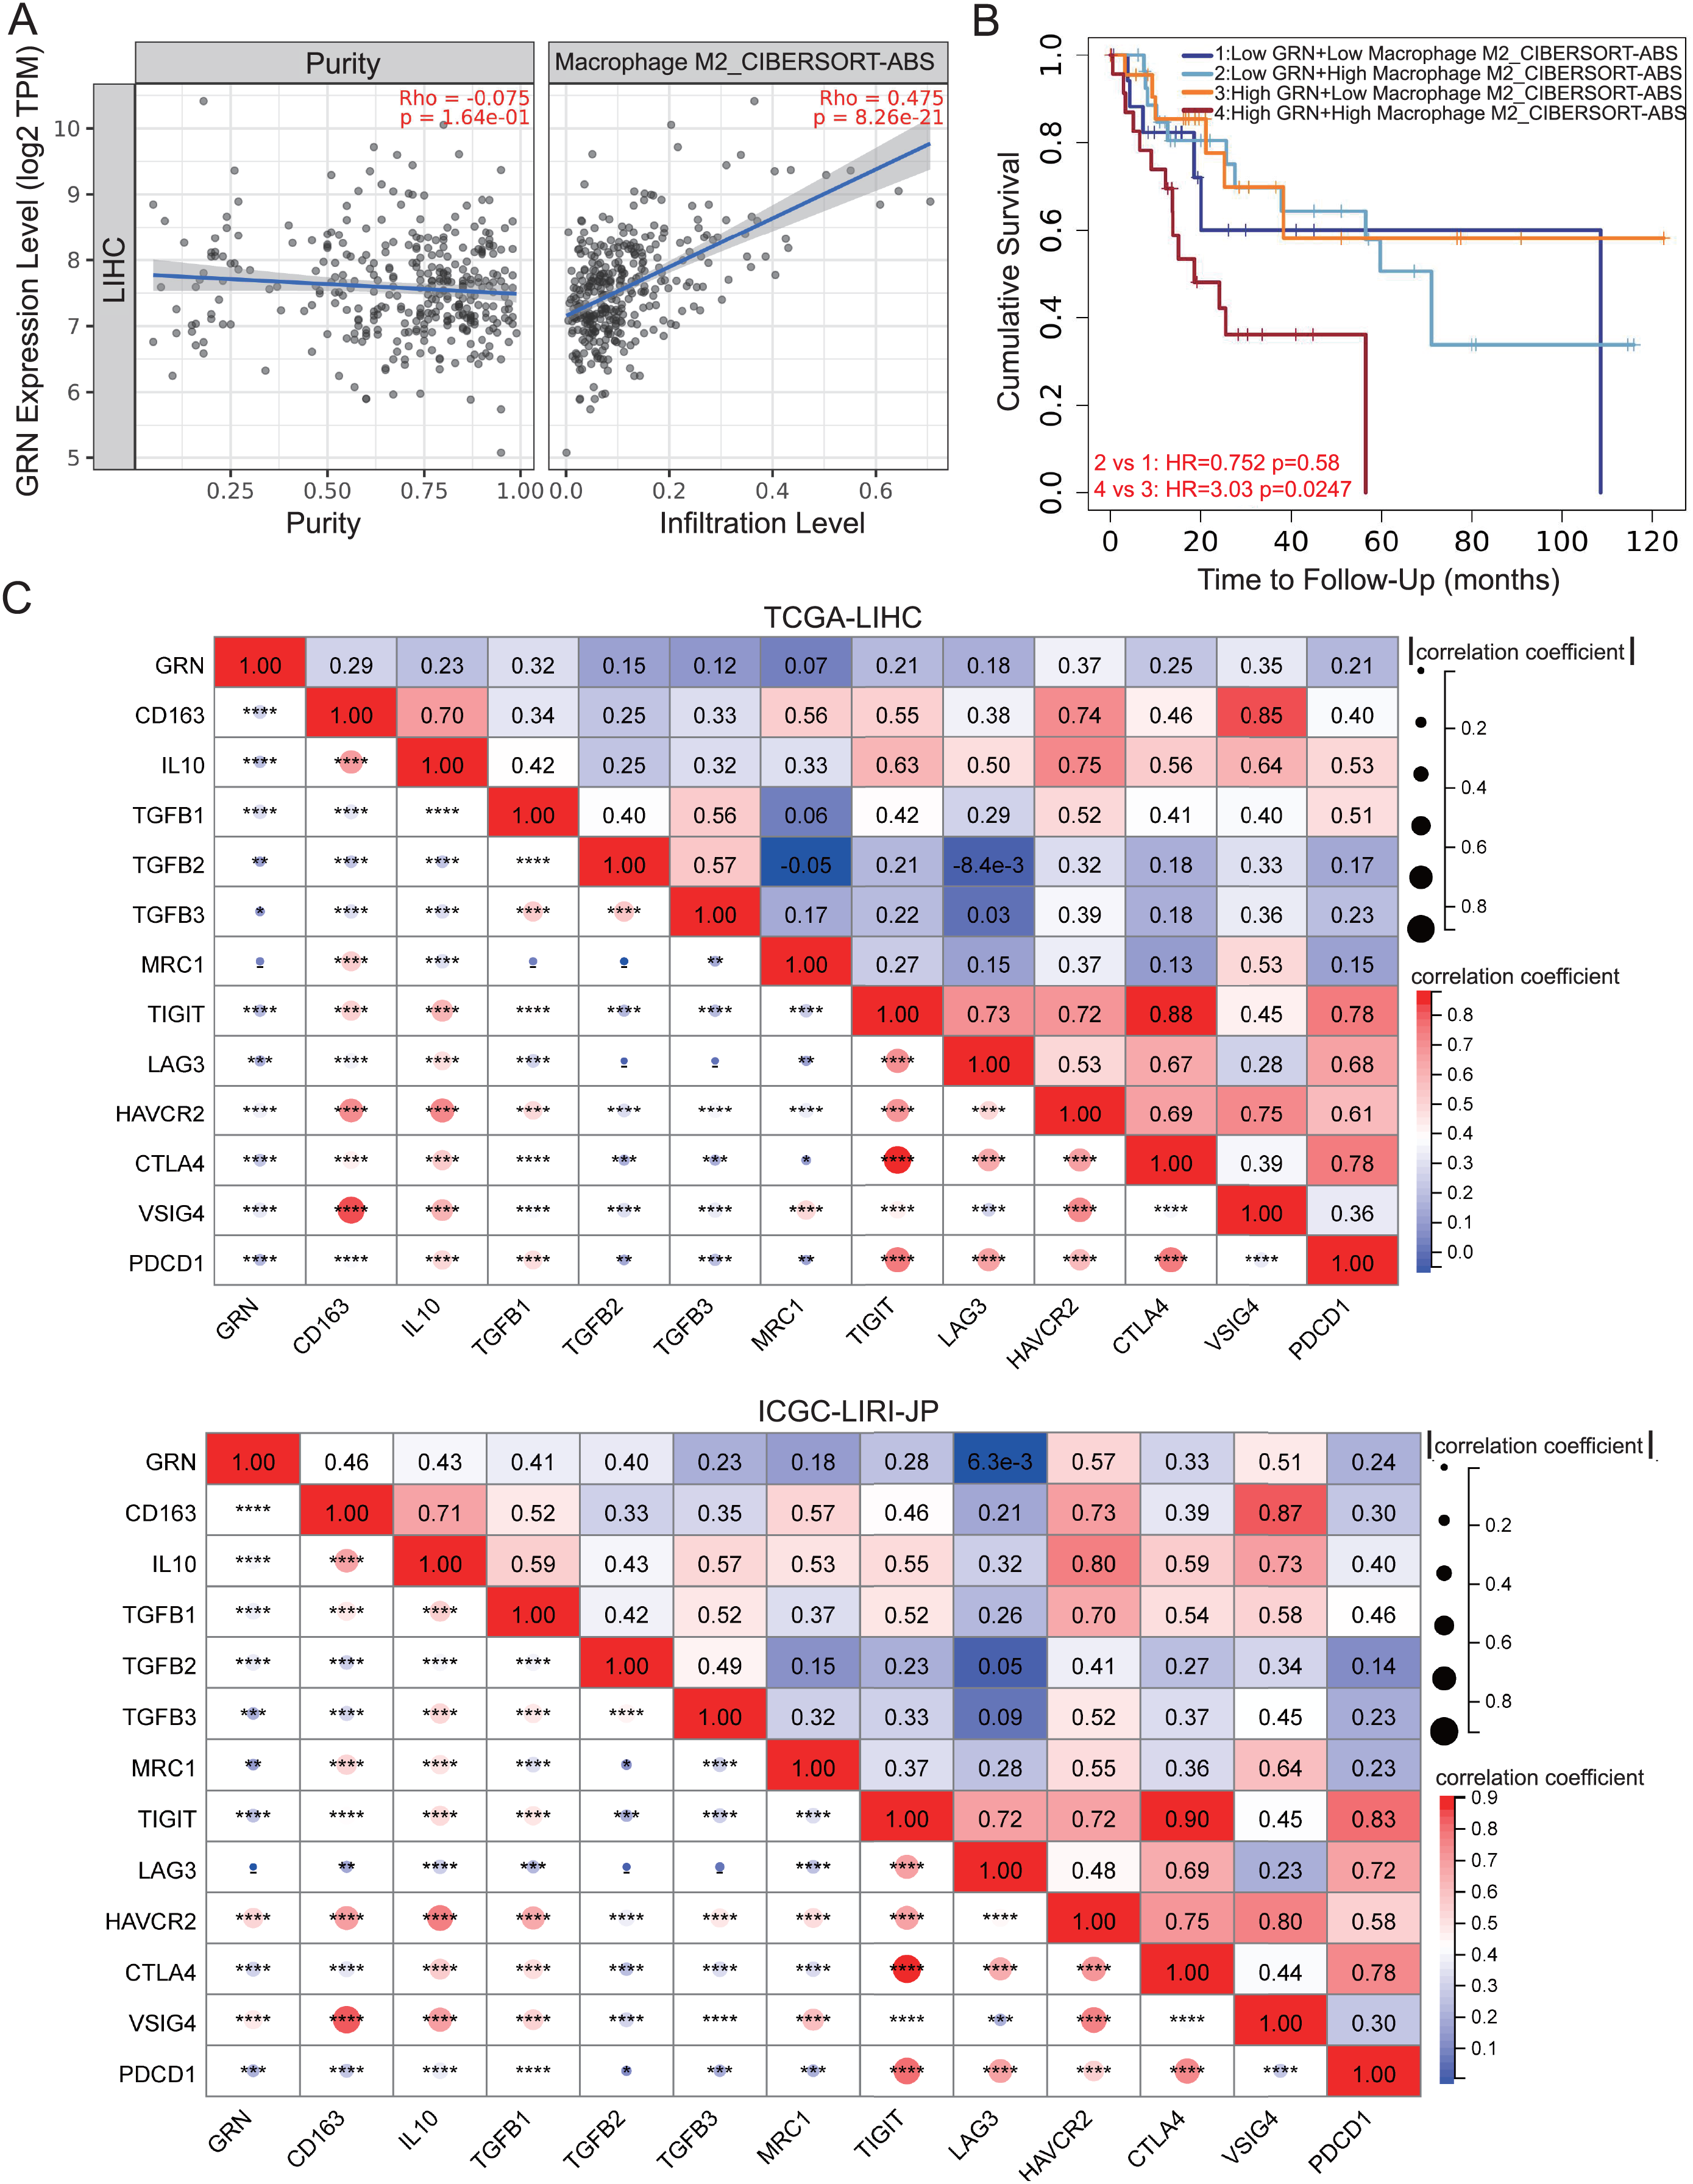
GRN promotes M2 macrophage polarisation and induces CD8+ T-cell dysfunction
The interaction of immune cells in the tumor environment leads to the formation of immunosuppressive microenvironment (Zhu et al., 2023). To explore the functions of GRN+ macrophages in TME, we first characterized the scRNA-seq transcriptome atlas from 25 HCC tissues. After quality control and removal of batch effects, 36,681 cells were subjected to downstream analyses. Through integration of genes exhibiting distinct expression patterns and manual annotations, the clustering process was further refined, resulting in the identification of seven cell types. By establishing thresholds for specific levels of gene expression, cells could ultimately be categorized into 10 distinct types including GRN+ macrophages (Figs. 7A, 7B). We next analyzed cell-cell interactions through observing ligand-receptor pairs with the help of CellChat based on the aforementioned scRNA-seq transcriptomic atlas. A strong communication was present between GRN+ macrophages and CD8+ T cells, as well as CD4+ T cells (Fig. 8A). Strikingly, strong cell-cell interactions between GRN+ macrophages and CD8+ T cells were observed through HLAs-CD8A/B receptors, as well as the MIF-CD74, and LGALS9-CD44 axis (Fig. 8B). Notably, other immune cells like fibroblast communicated with GRN+ macrophages through MIF-CD44, FN1-CD44, and COL6A3-CD44 axis (Figs. 8A, 8B, Fig. S5). To explore the communication changes between GRN+ macrophages and CD8+T cells in HCC vs. non-tumor samples, we downloaded the GSE149614 dataset from GEO databases for CellChat analysis, as this dataset comprises both tumor and adjacent non-tumor tissues. To preserve the biological heterogeneity inherent to these two tissue types, the original data structure was retained. Following rigorous quality control, a total of 55,631 cells from GSE149614 remained for analysis. Initial clustering identified seven distinct cell types through the integration of genes with distinct expression patterns and manual annotations. The dimensionality reduction clustering of these cells does not separate macrophages alone, because non-tumor tissues contained many immature cells. Subsequently, thresholds for specific levels of gene expression were applied to further refine the clustering, ultimately categorizing all cells into 10 distinct types including GRN+ Myeloid and GRN- Myeloid (Figs. S6A–S6C). CellChat analysis showed that the number of cell interactions seems to be more in tumor tissues than that in non-tumor tissues (Fig. S6D). Additionally, the interaction number between GRN+ Myeloid and CD8+ T cells was slightly increased (Fig. S6E). Furthermore, strong cell-cell interactions between GRN+ Myeloid and CD8+ T cells in HCC tumor tissues were observed through HLAs-CD8A/B receptors, as well as the MIF-CD74, whereas cell-cell interactions between GRN+ Myeloid and CD8+ T cells in non-tumor tissues was observed mainly by HLAs-CD8A/B receptors (Fig. S7).
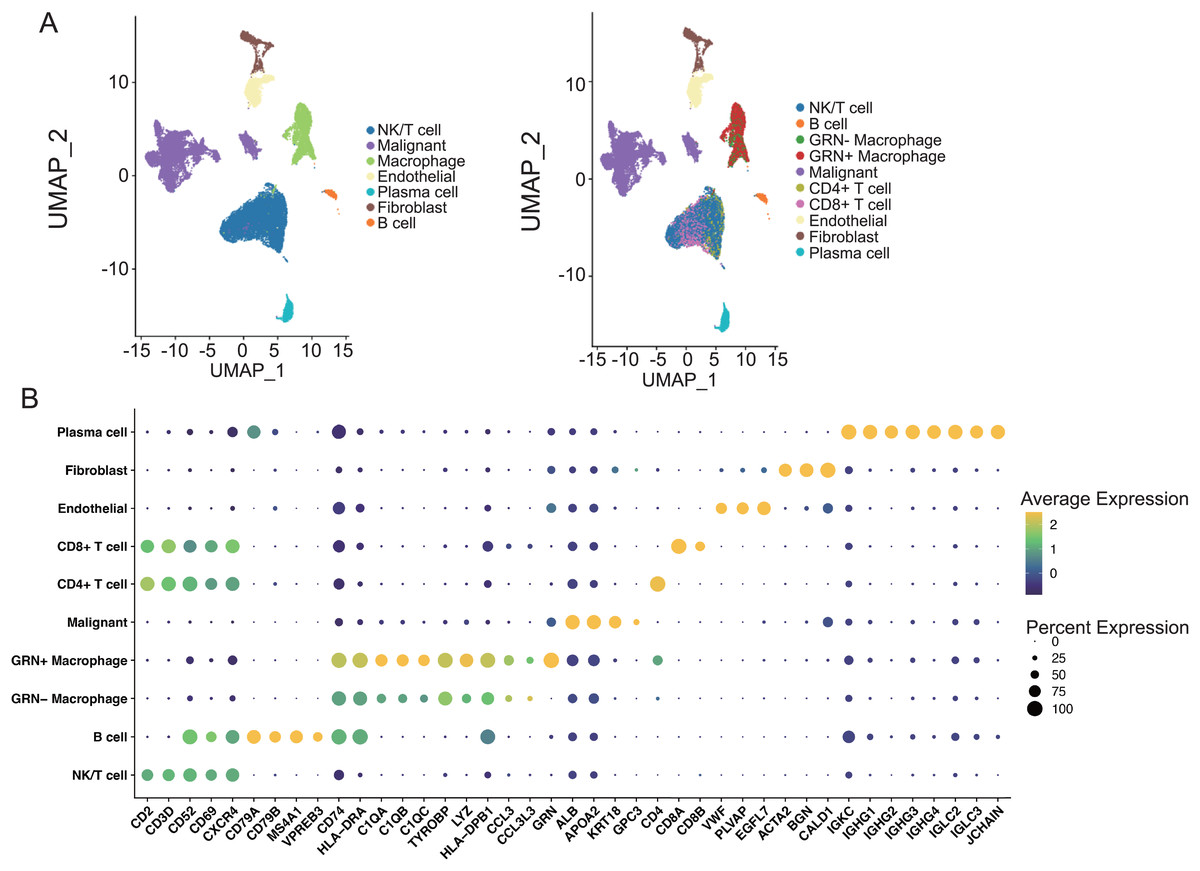
Figure 7: The Characterization of the scRNA-seq transcriptome atlas from 25 HCC tissues.
(A) UMAP projection of single cells derived from 25 HCC patients (GSE151530) colored by cell clusters. (B) Bubble heatmap depicting the expression levels of cluster-specific marker genes. The dot size indicates the fraction of expressing cells, and dots are colored based on average expression levels.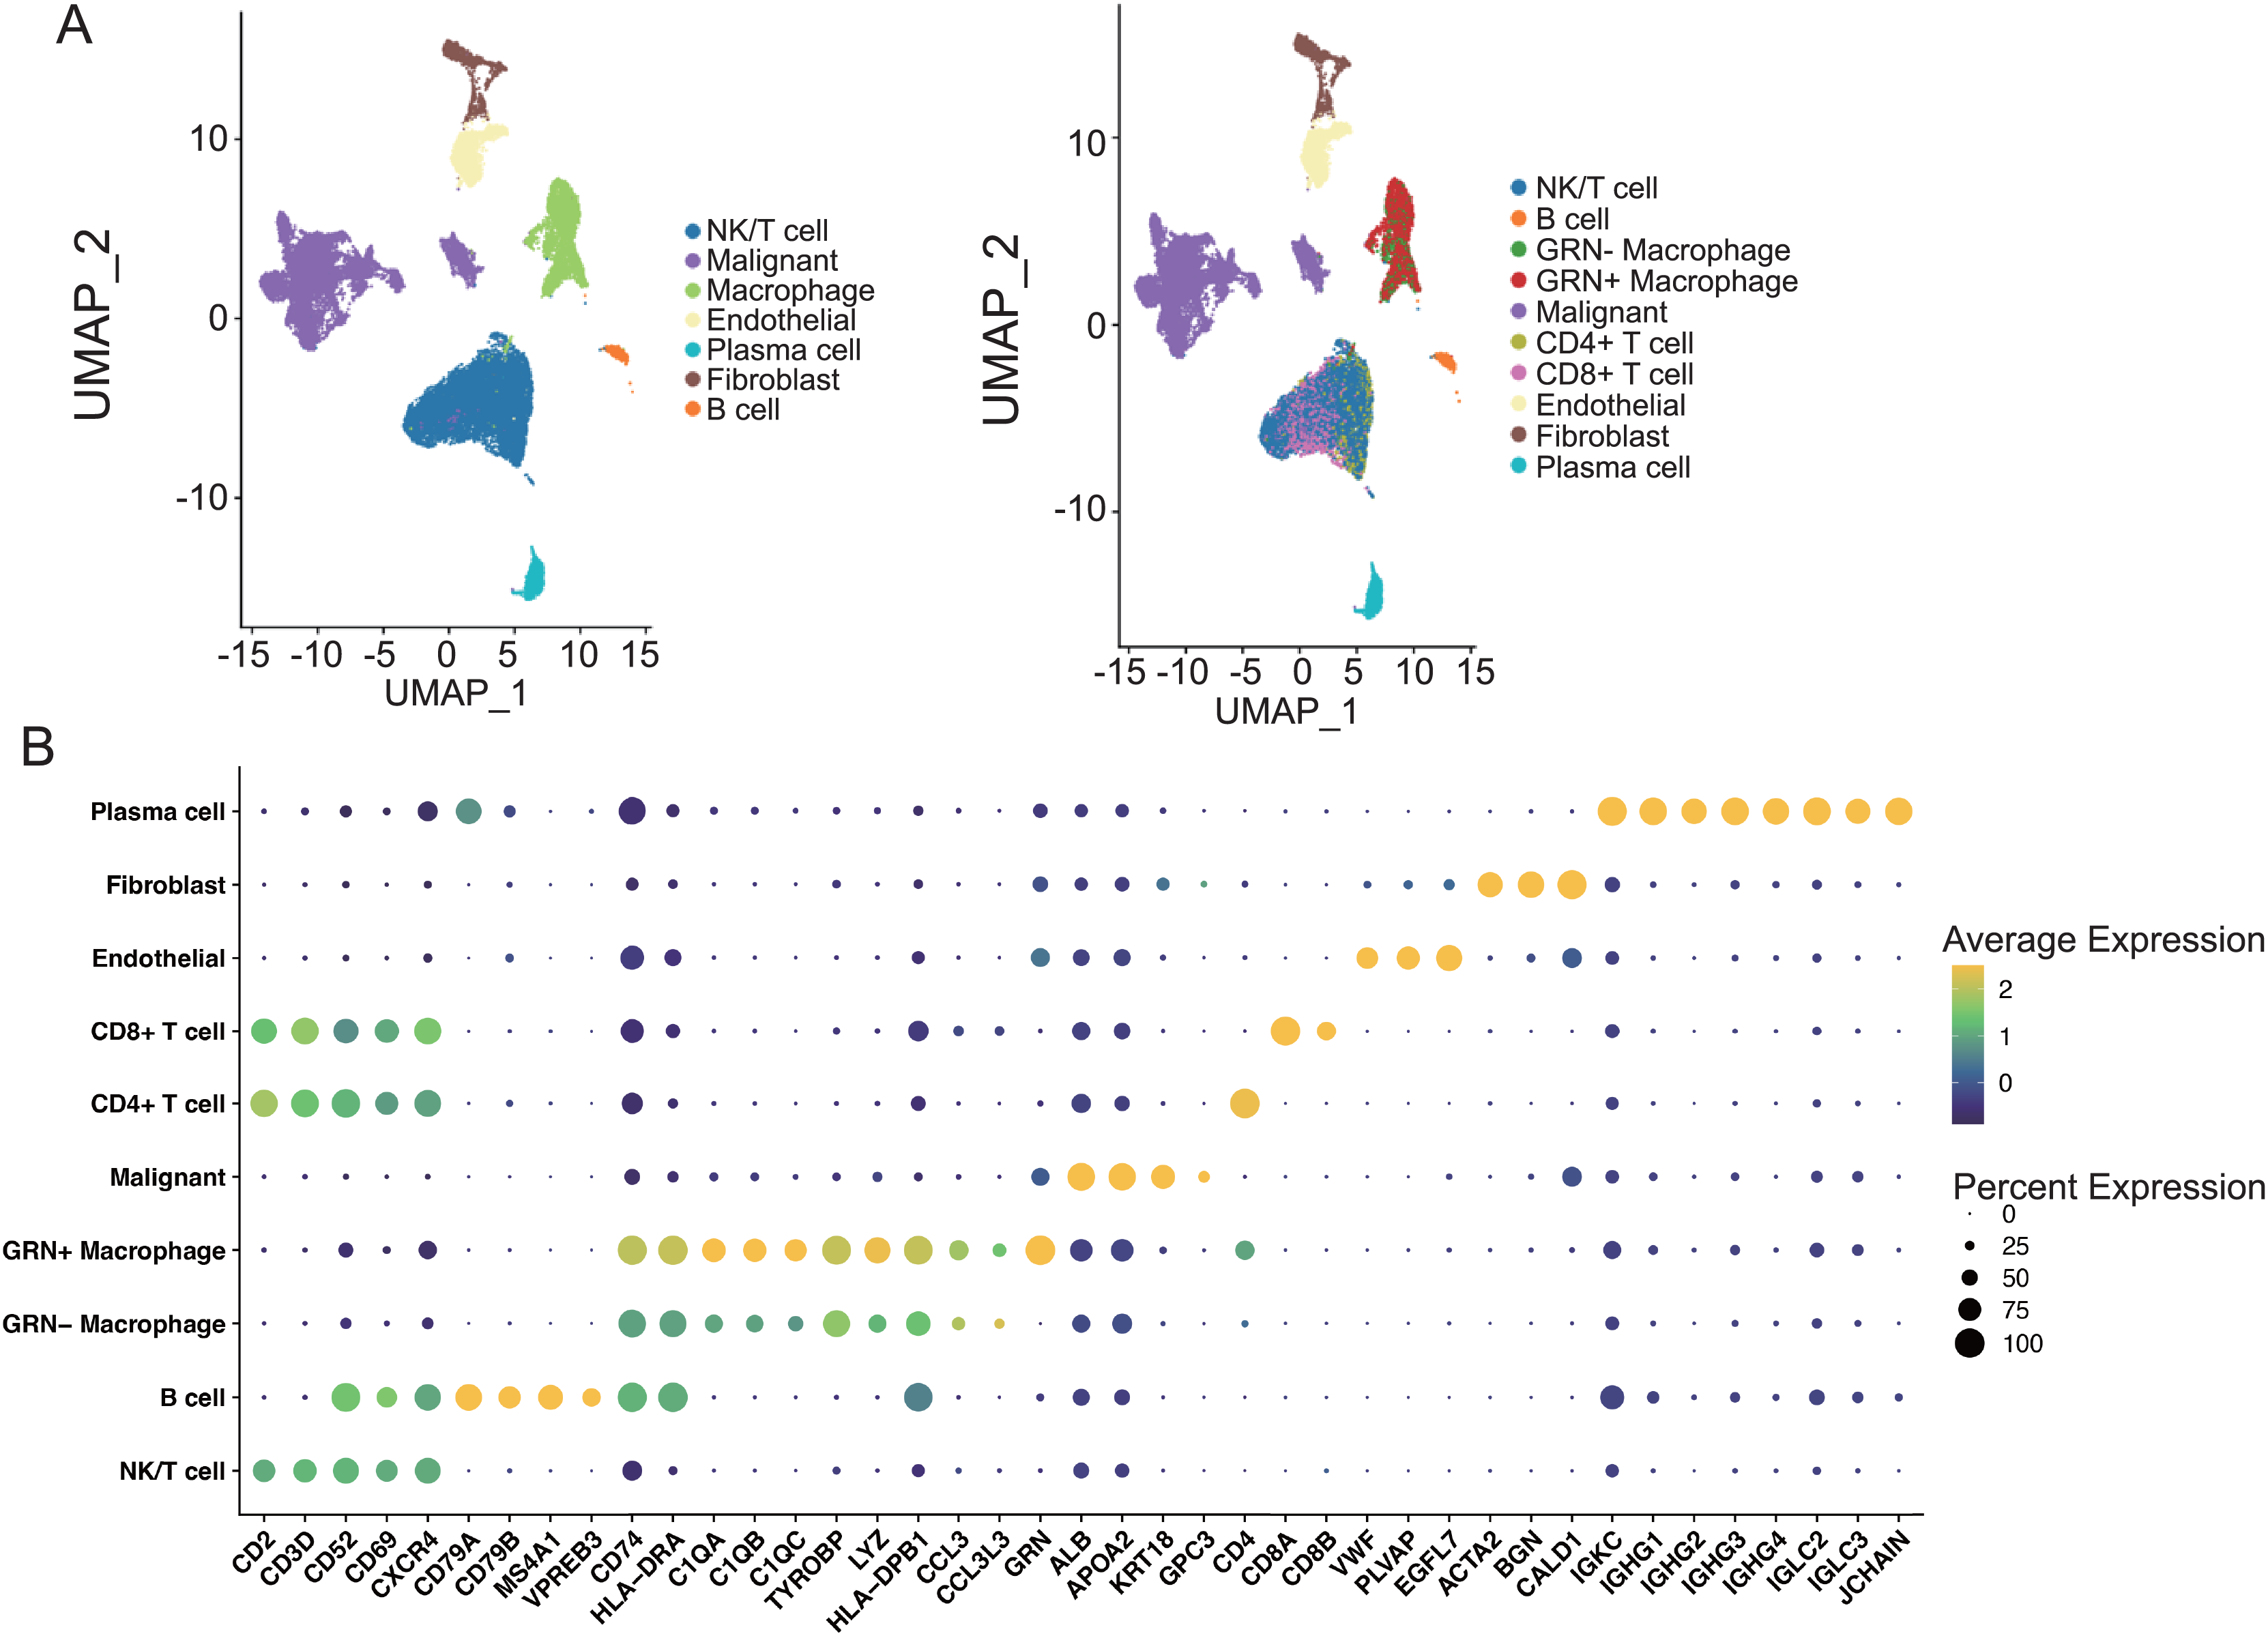
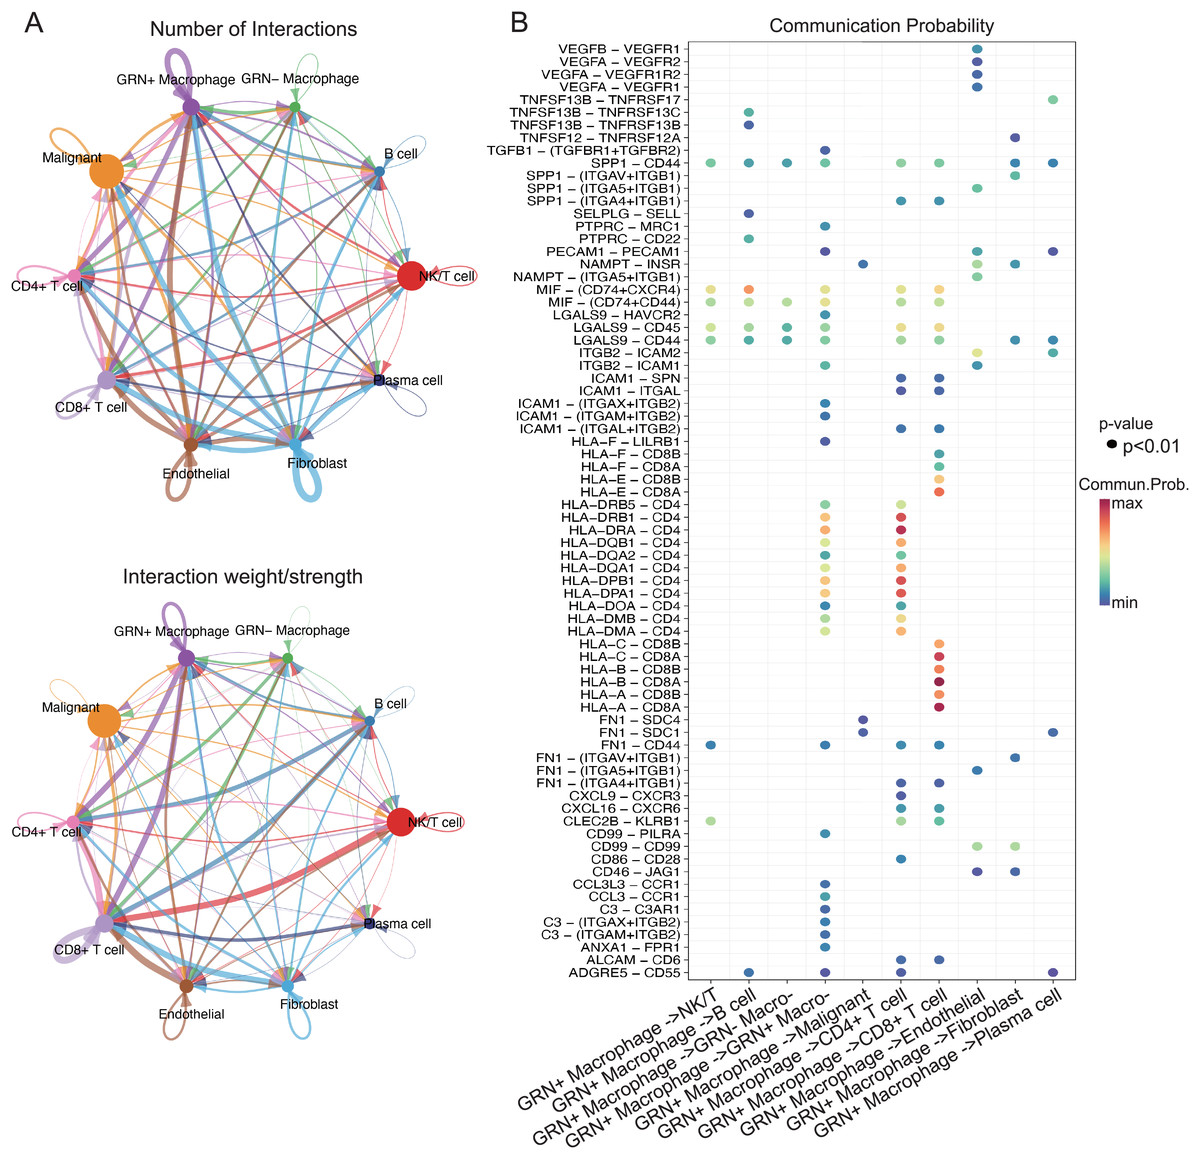
Figure 8: GRN+ macrophages communicate with other immune cell subgroups in HCC.
(A) The cell-cell interactions between GRN+ macrophages and other cell types indicated by the scRNA-seq data. Upper: The size of the various colored circles around the periphery indicates the number of cells, and the larger the circle, the more cells. The cell that emits the arrow expresses the ligand, and the cell that the arrow points to expresses the receptor. The more ligand-receptor pairs, the thicker the line. Bottom: Interaction probability or intensity value (intensity is the addition of probability values). (B) Bubble plot showing the significant ligand-receptor pairs between GRN+ macrophages and other cell types calculated by CellChat using scRNAseq data (GSE151530).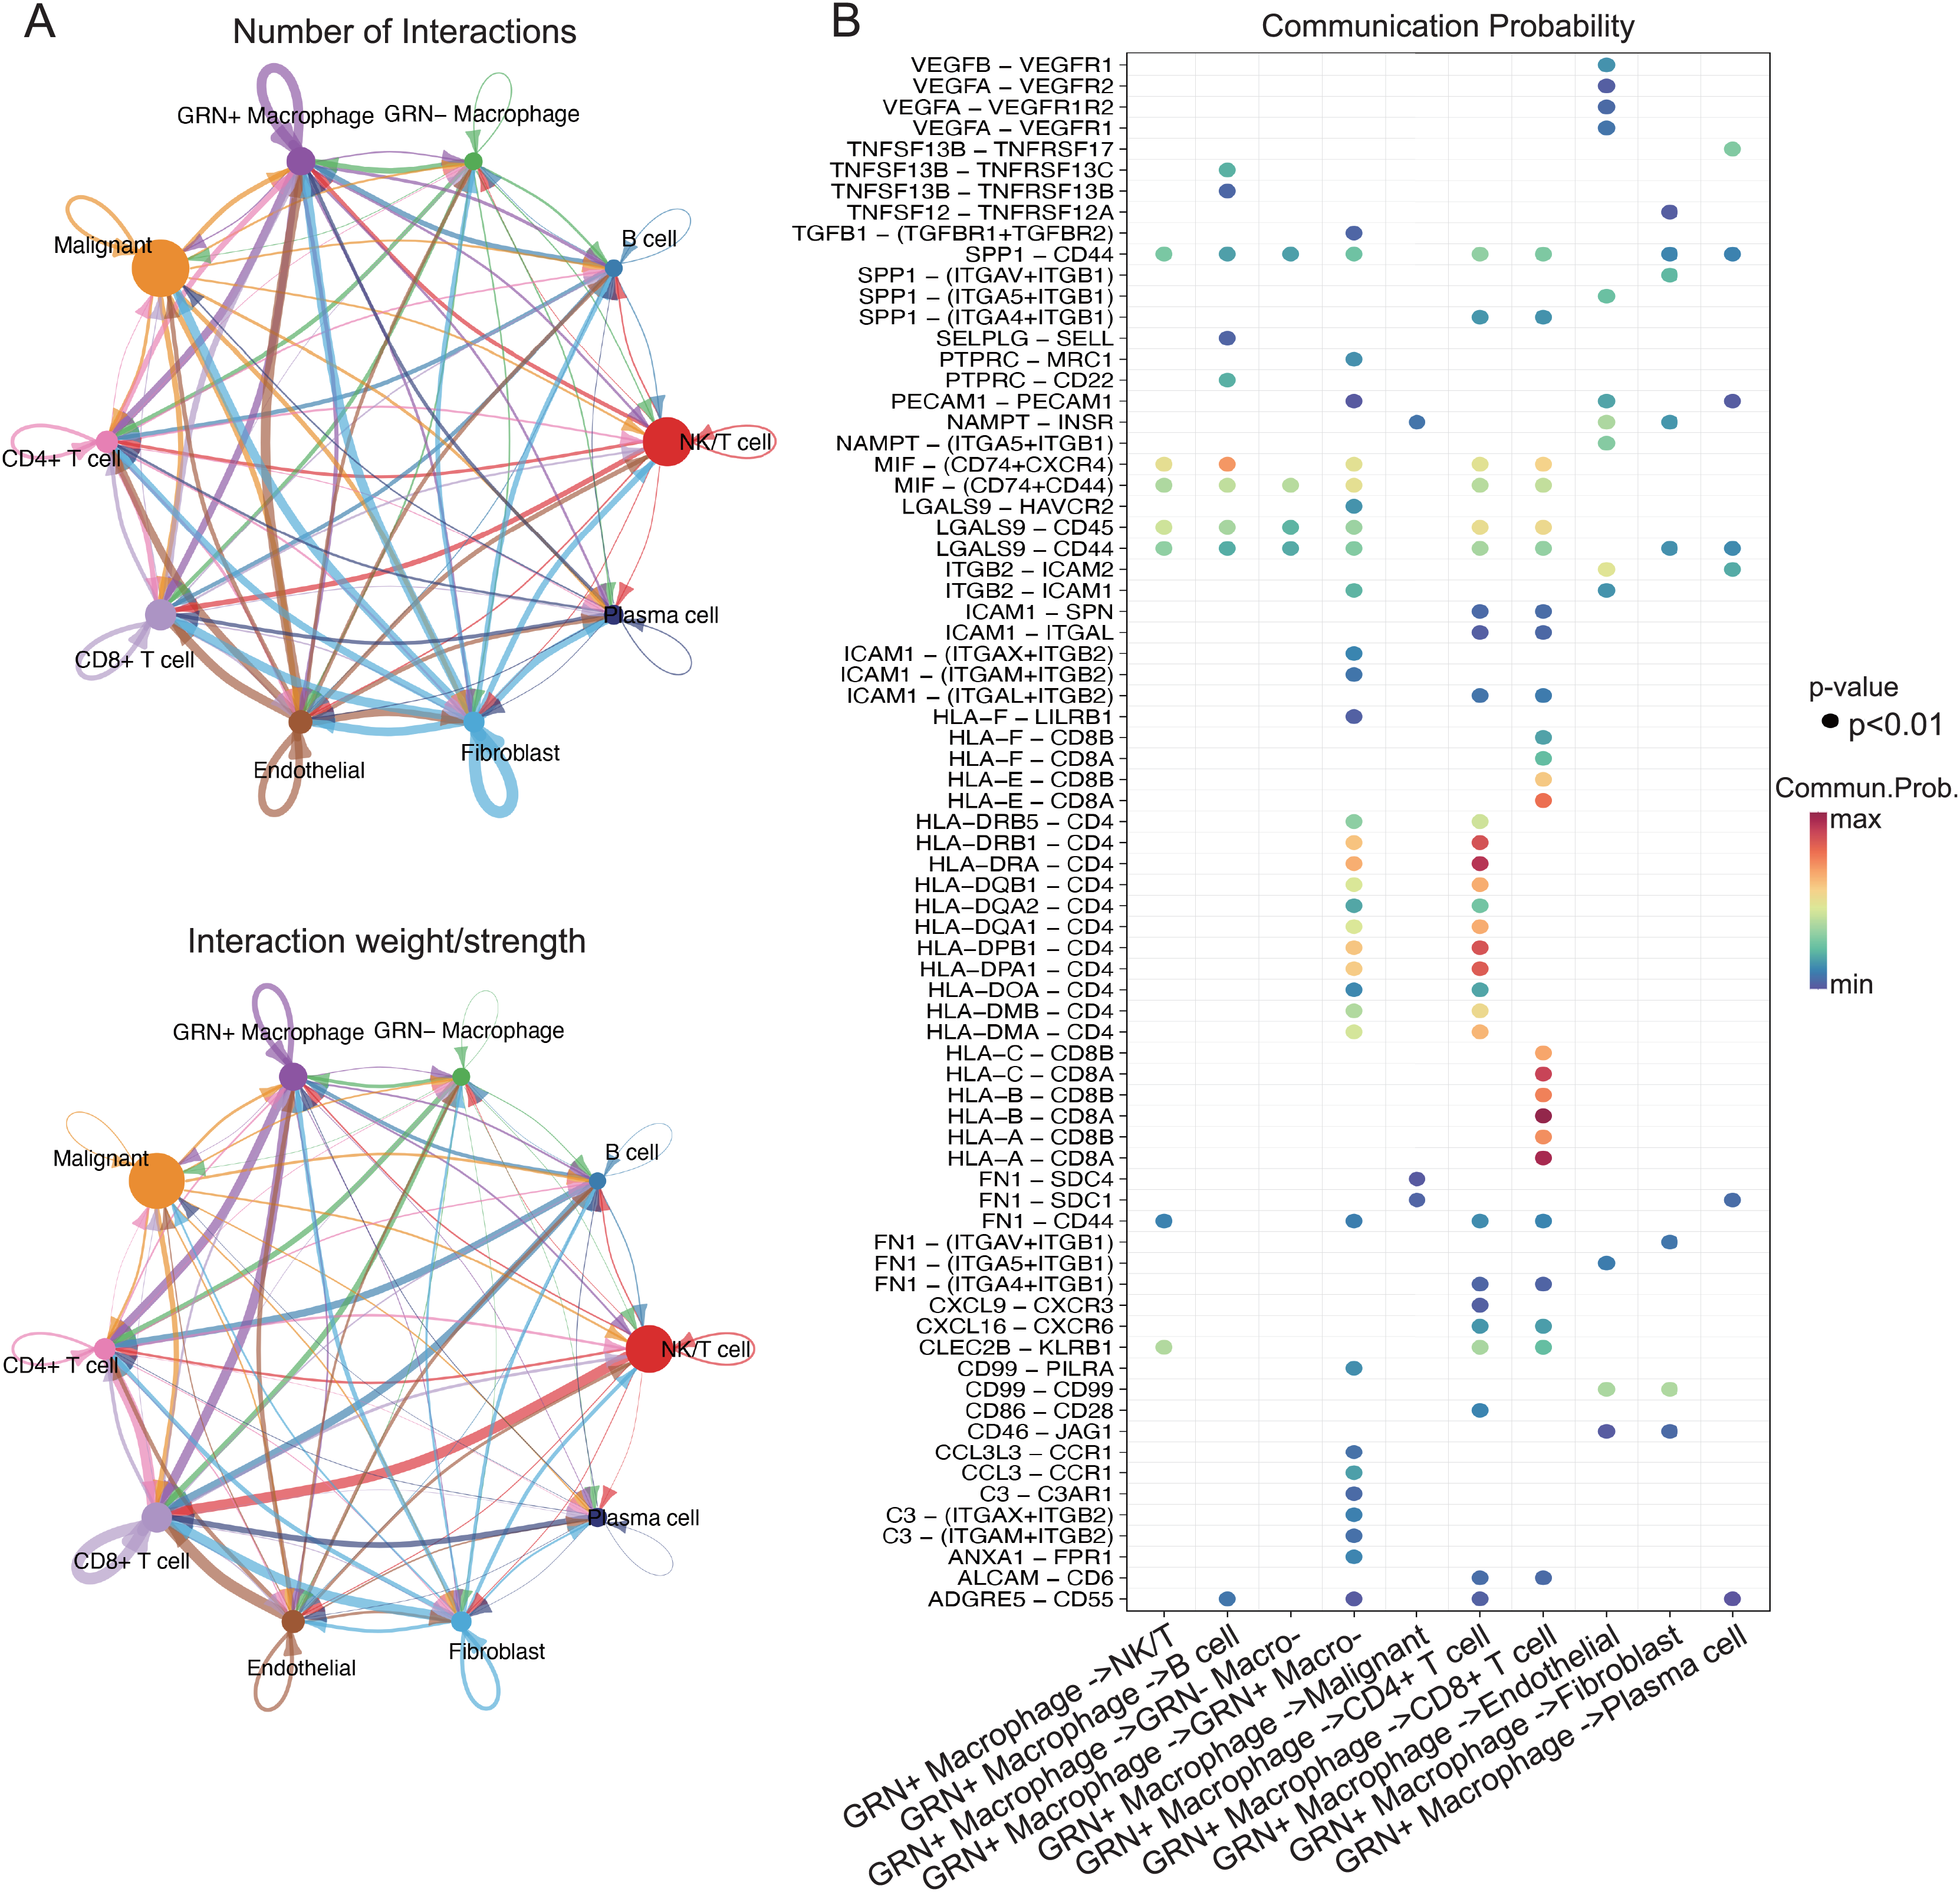
To explore whether GRN promotes M2 polarisation, we used lentivirus to establish a THP-1 cell line stably overexpressing GRN, and next induced THP-1 cells to differentiate into M0 macrophages with PMA and then induced M2 polarisation with IL-4. Our results showed that the M2 markers including CD163, TGFB1, and IL-10 were significantly increased in the GRN-overexpressing macrophages in comparison with the control macrophages (Fig. 9A). Moreover, GRN-overexpressing macrophages co-cultured with T cells strongly suppressed T cell activation (Fig. 9B). Additionally, flow cytometry assay showed that GRN-overexpressing macrophages increased the proportion of PD-1+CD8+ T cells (Fig. 9C), suggesting that GRN-overexpressing macrophages induced CD8+ T-cell exhaustion.
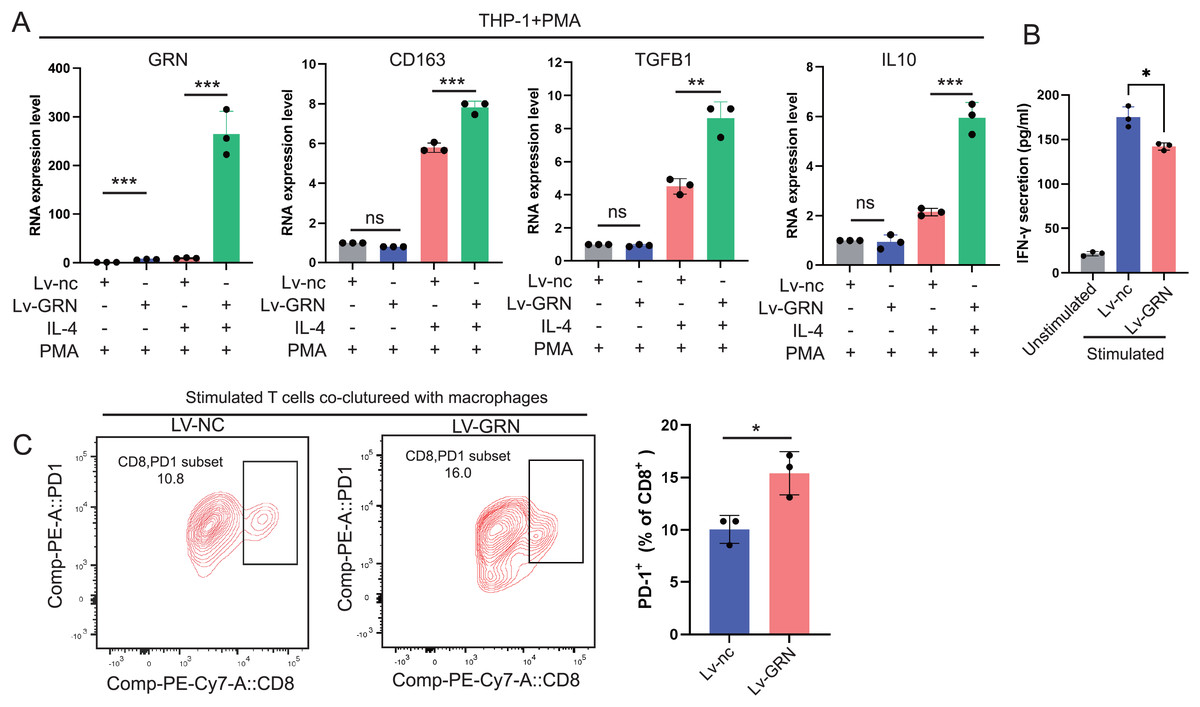
Figure 9: GRN promotes M2 macrophage polarisation and induces CD8+ T-cell dysfunction.
(A) An GRN-overexpressing cell line was constructed using the human monocyte cell line THP-1, and then the engineered THP-1 cells were induced to differentiate into M0 macrophages with PMA (50 ng/mL). IL-4 (20 ng/mL) was used to stimulate M0 macrophages to polarise into the M2-phenotype, and the expression levels of GRN and M2 markers (CD163, TGFB1, and IL-10) were measured by qRT-PCR. * P < 0.05; ** P < 0.01; *** P < 0.001. (B) IFN-γ secretion by CD8+ T cells in the co-cultured assay was measured by ELISA. * P < 0.05. (C) FACS analysis of PD-1 expression on CD8+ T cells from the co-culture system. * P < 0.05.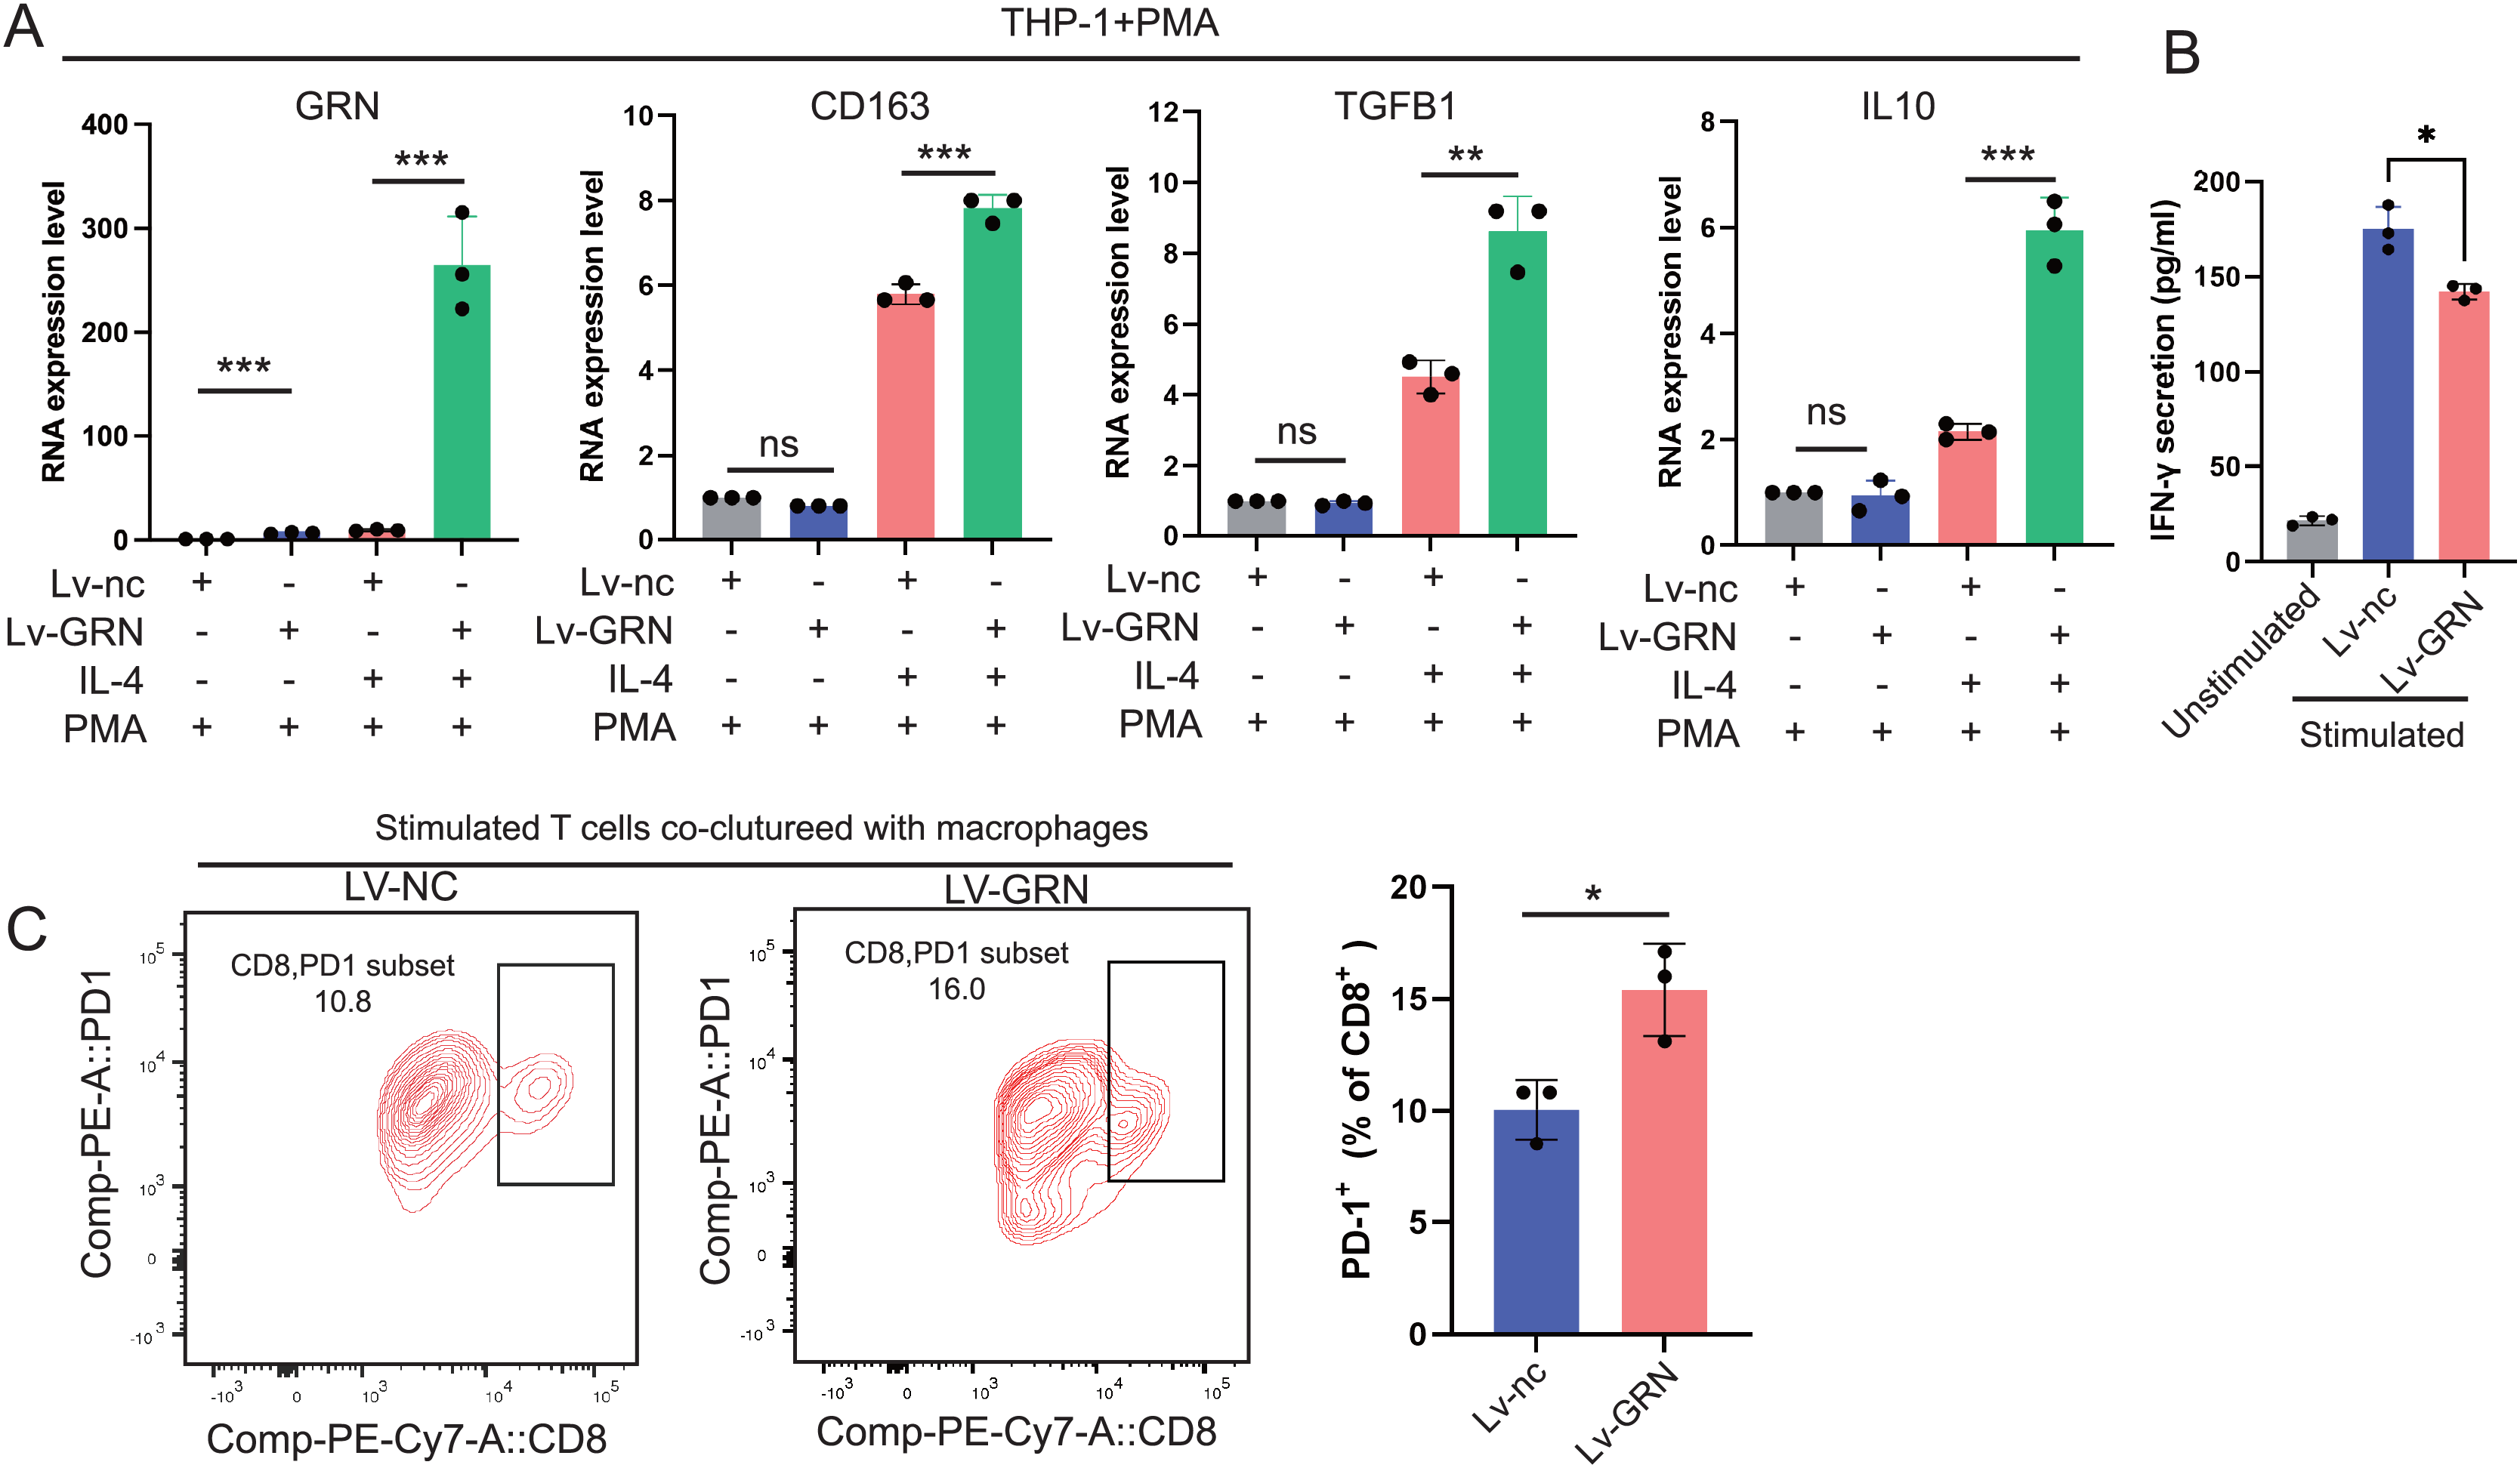
Discussion
The heterogeneity of the tumor ecosystem greatly reduces the ICB therapeutic effect and makes the prognostic prediction more complicated in various cancers (Cai et al., 2023). Recently, the research community has paid more attentions to the vital roles of myeloid cells participating in diverse pathologies, with TAMs being highlighted as an important pathology-induced immune signaling hub (Lam et al., 2021). In the present study, we systematically interrogated the scRNA-seq in combination with bulk cell RNA-seq profiles and identified a previously undiscovered subgroup of macrophages, called GRN+ macrophages, that played an immunosuppressive role in various cancers.
Growing reports have demonstrated a functional link between GNR and human malignancies (Dong et al., 2021). However, most research has focused on the role of GRN expressed by tumor cells in the onset and development of cancers (Xu et al., 2023). Whether GRN specifically expressed by immune cells involved in tumorigenesis need to be elucidated. Herein, we systematically interrogated the scRNA-seq in combination with bulk cell RNA-seq profiles to explore the expression pattern and function of GRN across various immune cells and malignant cells, illustrating that GRN was dominantly expressed by macrophages in various cancers including HCC. High expression level of GRN predicted poor prognosis in most cancer types. Overall, GRN was selectively expressed by GRN expressed by macrophages and may serve as a prognostic predictor in most cancer types.
TME, comprised of fibroblasts, immune cells, vascular cell and extracellular matrix, is a fundamental modulator of cancer initiation, development, and progression of cancers (Hinshaw & Shevde, 2019). Tumor-infiltrating immune cells play vital roles in the occurrence and progression of multiple cancers (Deepak et al., 2020). To date, the physiological and pathological meaning of infiltrating immune cells in TME calls for further investigation. Our results clarified that the predictive value of GRN has a broader applicability among tumors and demonstrated that GRN expression is closely related to level of tumor-infiltrating immune cells, including macrophages, dendritic cells, CD8+T cells, CD4+T cells, and neutrophil cells. It is worth mentioning that the expression level of GRN had the strongest correlation with the infiltration level of macrophages. Furthermore, GRN expression level was significantly upregulated in M2 macrophages in various cancer types. Evidence has been proved that TAMs are often educated by TME and polarisation toward the M2-like phenotype, which induces T-cell exhaustion to promote tumor progression and ICB resistance (Zhang et al., 2024b). GRN expression was positively correlated with the T-cell exhaustion signature in various cancers. Additionally, we further investigated the expression pattern of GRN in HCC by correlating the spatial transcriptomics with bulk RNA-seq profiles and proteomics from publicly available datasets, which confirms its highly expression in HCC at both mRNA and protein level. GRN correlated with M2-phenotype infiltration. And patients with high expression of GRN as well as increased infiltration of M2 macrophages showed the worst survival in patient with HCC. Although GRN was significantly upregulated during IL-4-induced differentiation of M0 to M2 macrophages and became a marker of M2, GRN+ macrophages may only be a subtype of M2 macrophages with unique functional properties. This is consistent with existing studies. Growing number of studies have pointed out that there is functional heterogeneity within M2 macrophages, and the expression of specific molecules (e.g., MS4A4A) may be associated with different immunoregulatory mechanisms (Li et al., 2023). Our results suggested that GRN+ macrophages may represent a functionally specialized subpopulation of M2, and that the value of this research lies not only in expanding the understanding of M2 macrophages, but also in providing new targets for disease diagnosis and treatment. In short, our findings for the first time suggested the relationship between GRN expression and levels of immune infiltration in different tumors. GRN might be associated with M2-phenotype polarization, which in turn leads to T-cell exhaustion.
It has been well accepted that dysfunctional interaction between innate and adaptive immune systems facilitate the evasion of immune surveillance by means of generating an immunosuppressive tumor microenvironment (Christofides et al., 2022). As an immune organ, there are a large number of macrophages in liver tissue (MacParland et al., 2018). Macrophages infiltrating in tumor tissue, also known as TAMs, are commonly functionally similar to M2-like macrophages which participates in immune escape and development of cancers (Gao, Liang & Wang, 2022). One potential way for M2-like macrophages to cancer cells evade the immune surveillance is by direct interaction with immune cells, which in turn induces exhaustion of T cells (Nixon et al., 2022). For example, XOR-null monocyte-derived TAMs increase the production of immunosuppressive metabolites including adenosine and kynurenic acid, which enhanced the exhaustion of CD8+ T cells and exacerbated the HCC progression (Lu et al., 2023). Herein, we analyzed cell-cell interactions through observing ligand-receptor pairs with the help of CellChat analysis based on the aforementioned scRNA-seq transcriptomic atlas. A strong communication was present between GRN+ macrophages and CD8+ T cells, as well as CD4+ T cells. Strikingly, strong cell-cell interactions between GRN+ macrophages and CD8+ T cells were observed through HLAs-CD8A/B receptors, as well as the MIF-CD74, and LGALS9-CD44 axis. These results indicate that GRN+ macrophages might function through direct interaction with CD8+T cells. Next, we conducted a direct co-culture system and found that GRN+ macrophages directly impaired the secretion function of CD8+ T cells. Notably, other immune cells like fibroblast communicated with GRN+ macrophages through MIF-CD44, FN1-CD44, and COL6A3-CD44 axis. Whether GRN+ macrophages play a role on other immune populations needs further investigation.
In summary, GRN, upregulated in various cancers, is selectively expressed by macrophages and predicts poor prognosis in most cancer types. Furthermore, GRN promotes the formation of immunosuppressive microenvironment by shifting macrophage polarization toward M2-like macrophages. Our findings elucidate the clinical relevance and immunological role of GRN+ macrophages in cancers, indicating its potential role as a promising target for immunotherapeutic strategies.