
Identification of crucial extracellular genes as potential biomarkers in newly diagnosed Type 1 diabetes via integrated bioinformatics analysis
- Published
- Accepted
- Received
- Academic Editor
- Mahesh Gokara
- Subject Areas
- Genomics, Diabetes and Endocrinology, Data Mining and Machine Learning
- Keywords
- Type 1 diabetes, Bioinformatic gene analysis, Biomarkers, Gene expression omnibus, Extracellular protein
- Copyright
- © 2025 Gao et al.
- Licence
- This is an open access article distributed under the terms of the Creative Commons Attribution License, which permits using, remixing, and building upon the work non-commercially, as long as it is properly attributed. For attribution, the original author(s), title, publication source (PeerJ) and either DOI or URL of the article must be cited.
- Cite this article
- 2025. Identification of crucial extracellular genes as potential biomarkers in newly diagnosed Type 1 diabetes via integrated bioinformatics analysis. PeerJ 13:e18660 https://doi.org/10.7717/peerj.18660
Abstract
Purpose
In this study, we aimed to study the role of extracellular proteins as biomarkers associated with newly diagnosed Type 1 diabetes (NT1D) diagnosis and prognosis.
Patients and Methods
We retrieved and analyzed the GSE55098 microarray dataset from the Gene Expression Omnibus (GEO) database. Using R software, we screened out the extracellular protein-differentially expressed genes (EP-DEGs) through several protein-related databases. Gene Ontology (GO) and Kyoto Encyclopedia of Genes and Genomes (KEGG) analyses were applied to describe the role and function of these EP-DEGs. We used the STRING database to construct the interaction of proteins, Cytoscape software to visualize the protein-protein interaction (PPI) networks, and its plugin CytoHubba to identify the crucial genes between PPI networks. Finally, we used the comparative toxicogenomics database (CTD) to evaluate the connection between NT1D with the potential crucial genes and we validated our conclusions with another dataset (GSE33440) and some clinical samples.
Results
We identified 422 DEGs and 122 EP-DEGs from a dataset that includes (12) NT1D patients compared with (10) healthy people. Protein digestion and absorption, toll-like receptor signaling, and T cell receptor signaling were the most meaningful pathways defined by KEGG enrichment analyses. We recognized nine important extracellular genes: GZMB, CCL4, TNF, MMP9, CCL5, IFNG, CXCL1, GNLY, and LCN2. CTD analyses showed that LCN2, IFNG, and TNF had higher levels in NT1D and hypoglycemia; while TNF, IFNG and MMP9 increased in hyperglycemia. Further verification showed that LCN2, MMP9, TNF and IFNG were elevated in NT1D patients.
Conclusion
The nine identified key extracellular genes, particularly LCN2, IFNG, TNF, and MMP9, may be potential diagnostic biomarkers for NT1D. Our findings provide new insights into the molecular mechanisms and novel therapeutic targets of NT1D.
Introduction
Type 1 diabetes (T1D) is an autoimmune metabolic disease characterized by the T cell-mediated destruction of pancreatic β cells, resulting in absolute insufficiency of insulin secretion, which requires lifelong treatment with exogenous insulin injections. In recent years, the incidence of T1D has increased rapidly around the world, making the complications of diabetes one of the most significant current public health issues (Federation (IDF), 2021). Therefore, early diagnosis of T1D and timely treatment are particularly important.
Studies have shown that the interplay of genetics and environmental factors has a key role in the pathogenesis of T1D (Atkinson & Eisenbarth, 2001). The widespread application of microarray technology in diabetes enables us to recognize gene expression of the newly diagnosed type 1 diabetes (NT1D) using bioinformatics analysis. It has also been acknowledged as a widely beneficial method to investigate new diagnostic and therapeutic biomarkers in T1D. Lin et al. (2021) used bioinformatics analysis to explore genes (such as NCR3 and TNF) related to immune that may play an important moderating role in the occurrence and progression of T1D, which may provide some new insights and promising immune-related therapeutic targets of T1D. Using computational analysis, Prashanth et al. (2021) identified ten hub genes linked with the development of T1D. Li et al. (2022) used bioinformatics analysis to reveal that a variety of biological pathways and functions associated with glucose metabolism and the immune system were changed in peripheral blood mononuclear cell (PBMC) of T1D. These findings suggest that differentially expressed genes (DEGs) and the proteins they encode may contribute to the development of T1D (Bhushan et al., 2020; Sur, 2020; Wang et al., 2021). Many T1D-related genes, however, have yet to be discovered.
Biomarker discovery has been a rapidly evolving field in the study of diabetes, especially in the context of early detection and personalized treatment approaches. Recent advances in genomic and proteomic technologies have significantly contributed to identifying new biomarkers that can predict disease onset or monitor disease progression in both T1D and Type 2 diabetes (Han et al., 2012).
Several studies have highlighted the role of immune-related genes and inflammatory cytokines as potential biomarkers for T1D. For example, the study by Klimontov et al. (2023) identified a panel of circulating cytokines and chemokines that are elevated in T1D, such as IL-1β, TNF-α, and IFN-γ. Another key area of research has focused on autoantibodies as early indicators of T1D. While autoantibodies against insulin, GAD65, and ZnT8 have been widely studied, their predictive value is limited, especially in distinguishing between individuals who will progress to clinical T1D and those who will remain asymptomatic. Proteomic profiling using advanced platforms such as mass spectrometry has led to the discovery of novel extracellular protein biomarkers. For instance, studies by Becker et al. (2023) demonstrated that extracellular vesicles contain a range of proteins involved in immune modulation and may serve as early biomarkers for diabetes.
The standard diagnostic tools for NT1D include the measurement of autoantibodies, fasting plasma glucose, and HbA1c levels. Although these methods are effective in detecting hyperglycemia and predicting disease onset in some cases, they are not always reliable for early detection. Autoantibody testing, despite being the most widely used, has limitations in specificity and sensitivity. It often fails to predict disease onset in individuals who do not exhibit autoantibodies or present only at later stages. Glycemic markers like HbA1c are limited in their ability to capture early-stage disease, as they reflect long-term glucose levels but do not indicate ongoing autoimmune activity. There is also a lack of diagnostic tools capable of detecting NT1D in its preclinical phase when immune interventions could have a preventative effect. This highlights the urgent need for biomarkers that can provide insights into disease mechanisms before overt hyperglycemia develops. One of the primary limitations in biomarker discovery is the heterogeneity of T1D, where multiple pathways lead to disease, complicating the identification of universal biomarkers. Another challenge is the timing of biomarker detection. Biomarkers identified in cross-sectional studies may reflect late-stage disease and not necessarily provide early detection. Sample size and cohort diversity also limit the generalizability of biomarker findings. Many studies use small sample sizes, which may not represent the broader population of NT1D patients.
Recent advances have made significant strides in identifying new extracellular protein biomarkers with potential diagnostic value in NT1D. However, the limitations of current diagnostic tools, particularly in early detection, underscore the need for ongoing research in this field.
Extracellular proteins play a crucial role in cell communication and immune response, both of which are significantly altered in autoimmune diseases like T1D (Atkinson, Eisenbarth & Michels, 2014). Given the pivotal role these proteins play in various pathological processes, including inflammation and immune regulation (Cooper & Stewart, 2003), it is reasonable to hypothesize that specific extracellular proteins may serve as biomarkers for the early detection and prognosis of NT1D. Identifying such proteins could provide deeper insights into disease mechanisms and potentially open up new avenues for targeted therapies.
We hypothesize that differentially expressed extracellular proteins are associated with the onset and progression of NT1D and that these proteins could serve as reliable biomarkers for diagnosis and prognosis. By identifying and validating these extracellular proteins, we aim to provide new molecular targets for therapeutic interventions and improve the understanding of NT1D pathophysiology.
Materials and Methods
Type 1 diabetes datasets
The NCBI GEO database (http://www.ncbi.nlm.nih.gov/) is a publicly accessible genomics database. It gathers a substantial number of functional genomics datasets of diseases data to date (Barrett et al., 2013). We used R software (http://www.r-project.org/) to download the microarray dataset of GSE55098 and GSE33440 from the NCBI GEO database. GSE55098 was obtained from the microarray platform of Affymetrix Human Genome U133 Plus 2.0 Array (HG-U133_Plus_2), which contains 12 NT1D and 10 healthy controls (HC) PBMC samples (Yang et al., 2015). GSE33440 was obtained from the microarray platform of Illumina HumanHT-12 V3.0 expression beadchip, which includes PBMC samples from 16 NT1D and six adult healthy individuals. T1D was diagnosed according to 2021 American Diabetes Association criteria: meet the diagnostic criteria for diabetes mellitus, absolute deficiency of islet function, and positive islet-associated autoantibodies. NT1D was defined as T1D diagnosed within 12 weeks (American Diabetes Association, 2021). The tissue source used for the microarrays was derived from human peripheral blood.
Data preprocessing
Chip matrix, clinical information, and chip platform were extracted by the R package “GEO query”. The R package “Bioconductor” was used to extract the gene symbols corresponding to probes. In bioinformatics, duplicated entries can skew data analysis by inflating the significance of certain proteins. For example, if the same extracellular protein appears multiple times, it might falsely seem over-represented in a particular pathway or function. De-duplication is also necessary when merging datasets from different sources, ensuring consistency and accuracy in the final protein list (Sayers et al., 2022). Therefore, multiple probes mapped to the same gene were randomly de-duplicated and then a gene expression matrix was acquired. Then we transformed the values by log base 2 for further analysis. We used the “combat” function from the “sva” R package to adjust the batch effects (Ritchie et al., 2015). The “combat” function is a widely used tool to correct batch effects in gene expression data, which arise when samples are processed at different times or on different machines, introducing unwanted technical variation. Finally, we performed the quality control on the extracted information using the removeBatchEffect function in the R package “limma” to adjust the data, ensuring that batch-related variability was minimized and the expression values were normalized (Ritchie et al., 2015).
Identification of DEGs and EP-DEGs
Firstly, we analyzed the differences in gene expression between NT1D and HC in GSE55098 using R package “limma” (Ritchie et al., 2015). In the differential expression analysis, we applied a multiple testing correction to control for false positives using the False Discovery Rate (FDR) approach. Specifically, the Benjamini-Hochberg procedure was used to adjust the p-values from the differential expression analysis. When identifying DEGs, setting appropriate thresholds ensures that the selected genes are biologically significant and not false positives. Probes with |log2FC| ≥ 0.5, and genes with adjusted p-values (q-values) below 0.05 after applying FDR correction, are considered significantly differentially expressed. Using log2 FC and adjusted p-value thresholds helps minimize false positives in DEG identification. Also, volcano plots and heatmap plots were used to visualize the DEGs (Khomtchouk, Van Booven & Wahlestedt, 2014). Secondly, we obtained a list of extracellular protein-related genes from two widely used databases: the Universal Protein Resource (Uniprot) and the Human Protein Atlas (HPA) (Uhlen et al., 2015; UniProt, 2021). From UniProt (http://www.uniprot.org/), we applied filters for proteins with the Gene Ontology (GO) term for “extracellular region” (GO:0005576). From the HPA (http://www.proteinatlas.org/), we selected proteins using the “Secreted proteins” filter under the “Subcellular Location” category.
Thirdly, we intersected the three lists and screened out the genes that overlapped DEGs respectively with the two gene lists downloaded from the Uniprot and HPA databases as EP-DEGs. The potential functions and importance of these differential genes were then described by conducting functional enrichment analysis.
Functional enrichment analyses on GO and KEGG
The Gene Ontology (GO, http://geneontology.org/) project, as an online fundamental bioinformatics tool, is the most important source of gene function information from all organisms worldwide (Ashburner et al., 2000). The Kyoto Encyclopedia of Genes and Genomes (KEGG) (https://www.kegg.jp/) is a well-recognized database that links genomic information with higher-level functional data. Its primary goal is to provide a systematic understanding of gene functions and the molecular and gene networks in which they operate (Kanehisa et al., 2019). The human genome annotation package “org.Hs.eg.db” was used to transform gene symbol codes to Entrez IDs prior to performing enrichment analysis. The R package “clusterProfiler” was applied for GO and KEGG functional enrichment analyses and adjusted p value < 0.05 were considered significantly enriched. All the results included cellular components (CCs), molecular functions (MFs), and biological processes (BPs) were presented by the plots made by the “ggplot2” package in R software with p < 0.05 as the cutoff of the significance level and the false discovery rate Q-value for the most significant pathways related to NT1D.
Construction of the PPI network and identification of key genes
As we all know, the STRING database (http://string-db.org/) is an online free tool for annotating protein-protein interaction (PPI) networks, which can be used to analyze the interaction between proteins as well as annotate complex regulatory mechanisms in disease (Szklarczyk et al., 2019). Cytoscape software visualizes PPI networks, and its plugin CytoHubba was applied to further identify key genes of the PPI networks (Shannon et al., 2003). The plugin of Molecular Complex Detection (MCODE) in Cytoscape was applied to construct a significant module for visualizing and analyzing PPI networks. The parameters of MOCDE we set were as follows: degree cutoff ≥ 2, node score cutoff ≥ 2, K-core ≥ 2, and maximum depth = 100. Based on these tools, all EP-DEGs were imported into STRING database for further analysis, a PPI network was built by Cytoscape, and then the key gene was selected by the plugin CytoHubba. The associated proteins in the central node were considered core genes with important biological regulatory functions.
Evaluation of crucial extracellular genes associated with NT1D and verification in GSE33440 and clinical samples
The CTD (http://ctdbase.org/) is another publicly accessible online database that provides manually detected data about the relationship between genes and diseases (Davis et al., 2019). This database is based on the RefSeq project of NCBI. In order to evaluate the biomarker relationships between the related diseases with each core gene, this study applied CTD.
The GSE33440 dataset retrieved from the NCBI GEO database, which included 16 NT1D and six HC, was applied to validate our results. In addition, clinical samples included six NT1D and 6 HC matched by age and sex for assessment of protein levels. The inclusion criteria for this part of study are a confirmed diagnosis of T1D, an age range of 6–70 years, HbA1c levels between 6.5% and 10%, insulin dependency, diagnosis within the past 12 weeks, and informed consent. Exclusion criteria include the presence of type 2 diabetes or other forms of diabetes, severe diabetic complications, autoimmune disorders or other chronic diseases, pregnancy, or recent use of immunosuppressive or experimental treatments.
Ethical approval for the cases used in this study came from the Ethics Committee of Sir Run Run Hospital Affiliated to Nanjing Medical University (number: 2017-SR-003). Written informed consent was obtained from all study participants prior to the commencement of the study, and the research adhered to the principles outlined in the Declaration of Helsinki.
We carried out t-test or Mann-Whitney U test and drew a boxplot using Graphpad prism 9.0.0.
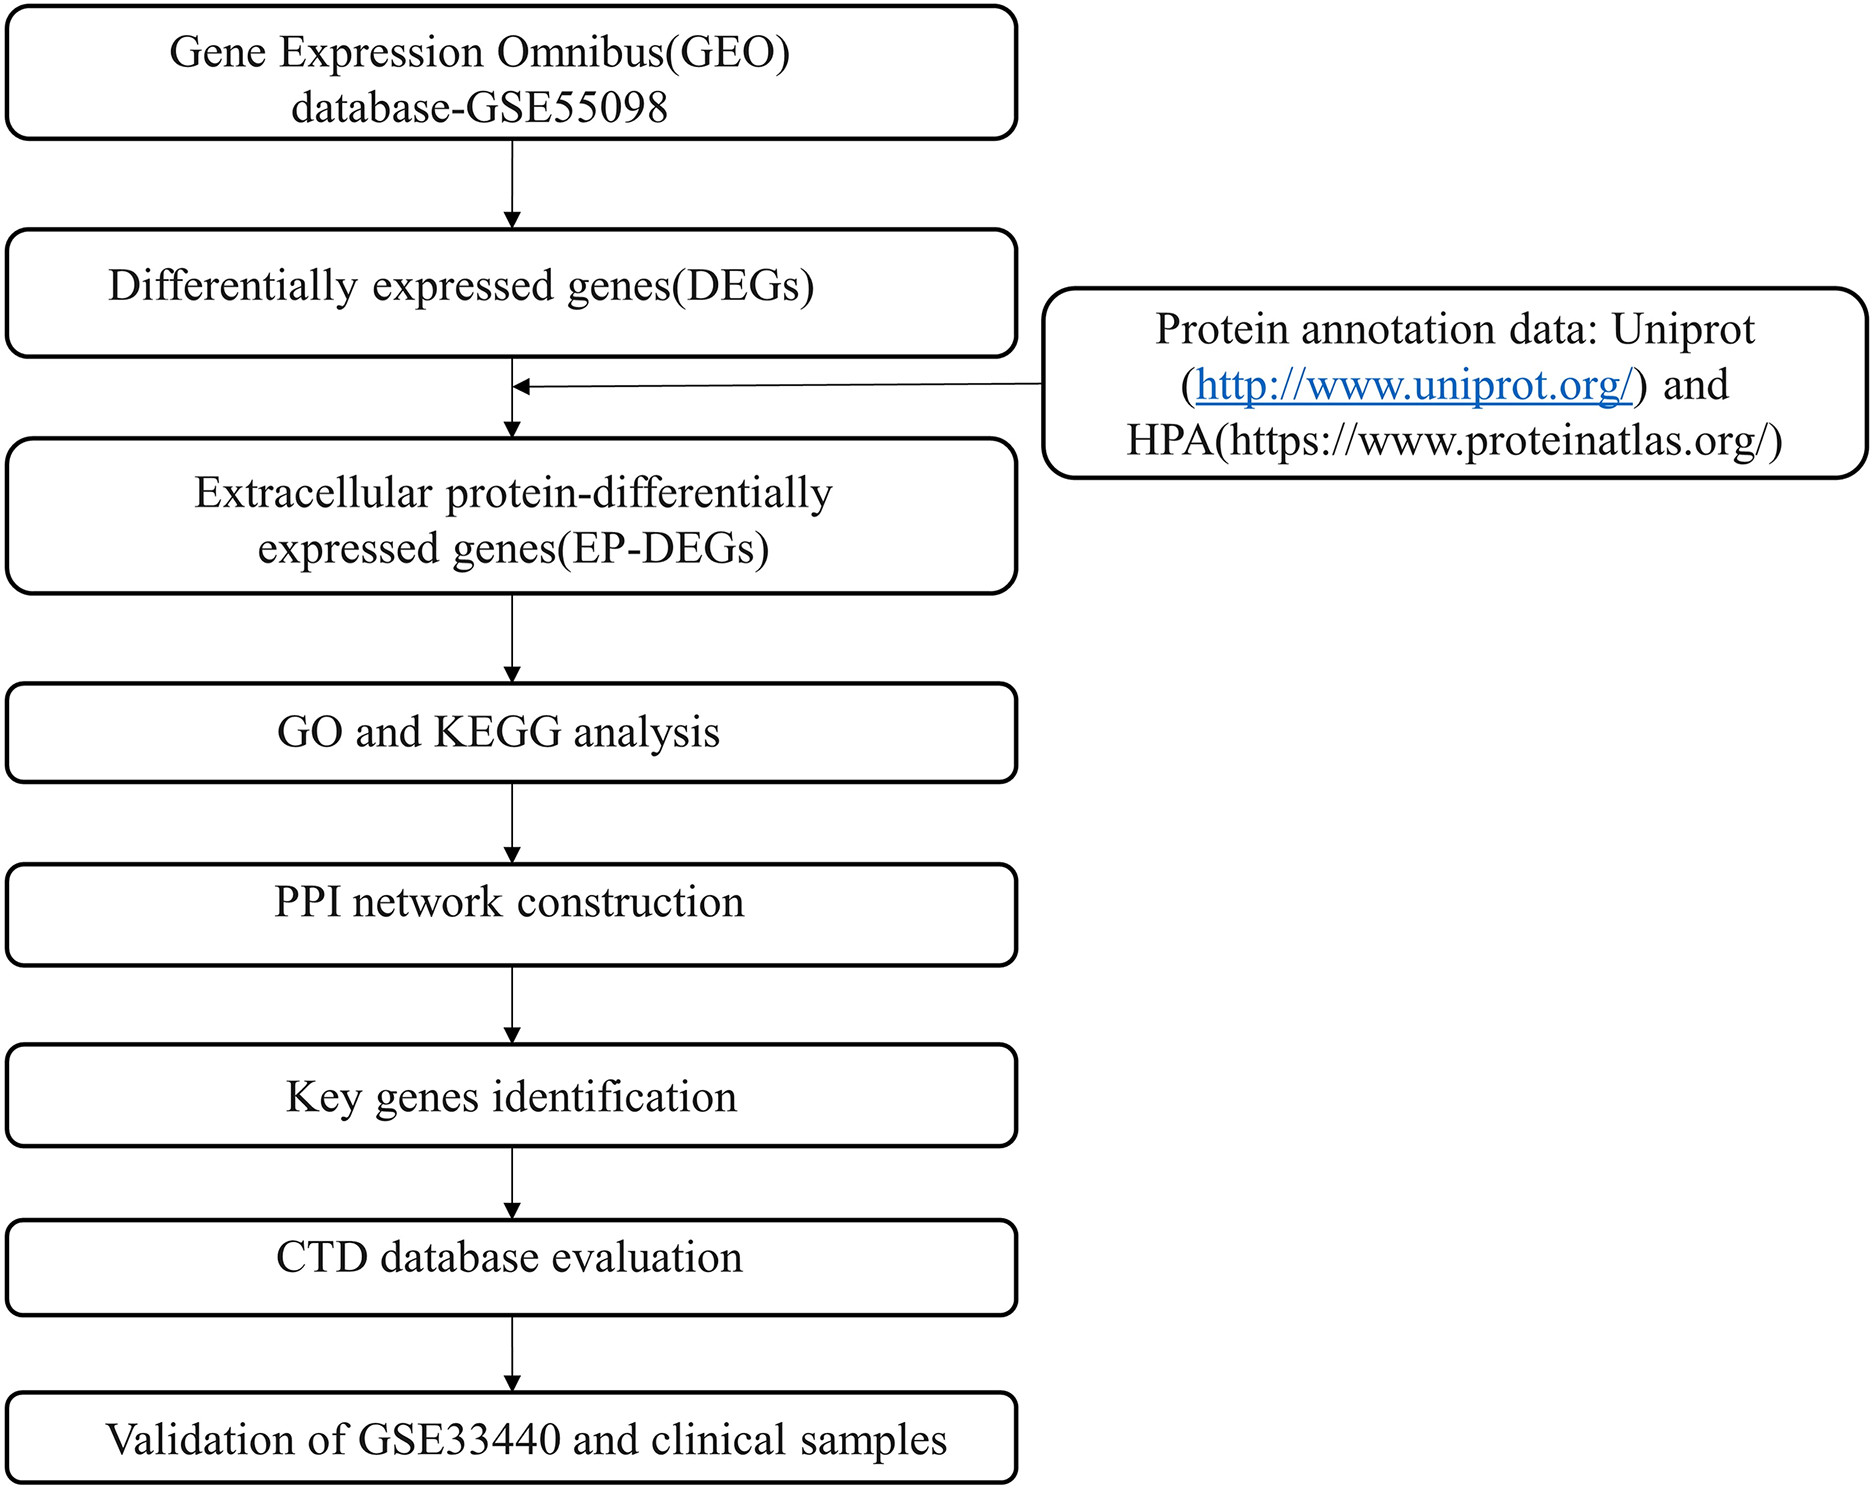
The flow chart of our research overview is illustrated in Fig. 1.
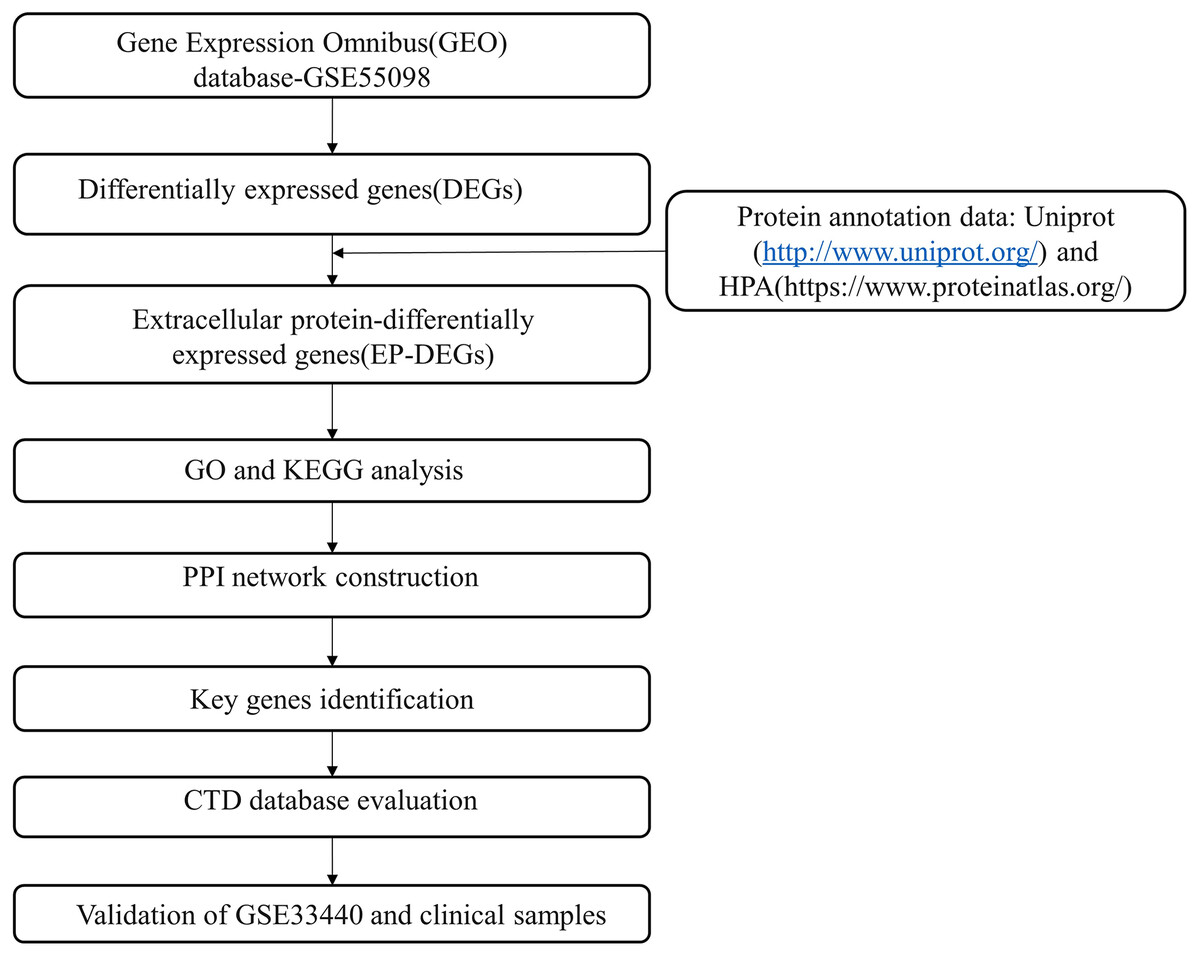
Figure 1: Flow chart of the study.
Results
Identification of DEGs
The datasets underwent a quality check, including outlier detection through principal component analysis (PCA), confirming no significant inconsistencies. All samples passed quality control, ensuring the robustness of subsequent analyses (Fig. 2A). The PCA plot circles of the two groups indicate that the DEGs of T1D and control groups are comparable (Fig. 2A). Using a cutoff of |log2FC| ≥ 0.5 and an adjusted p-value < 0.05, we identified 422 DEGs in GSE55098 after standardizing the microarray results. These include 180 up-regulated and 242 down-regulated genes, listed in Table S1. The top three up-regulated genes were GTF2IP20, ANP32A-IT1, and ST3GAL6, while the top three down-regulated genes were SEPTIN7, TSPOAP1, and MAGT1 (Fig. 2B). A volcano map was genernated to visualize these DEGs (Fig. 2C). The heatmap in Fig. 2C hightlights the top 20 DEGs showing significant up-regulation or down-regulation in NT1D patients.
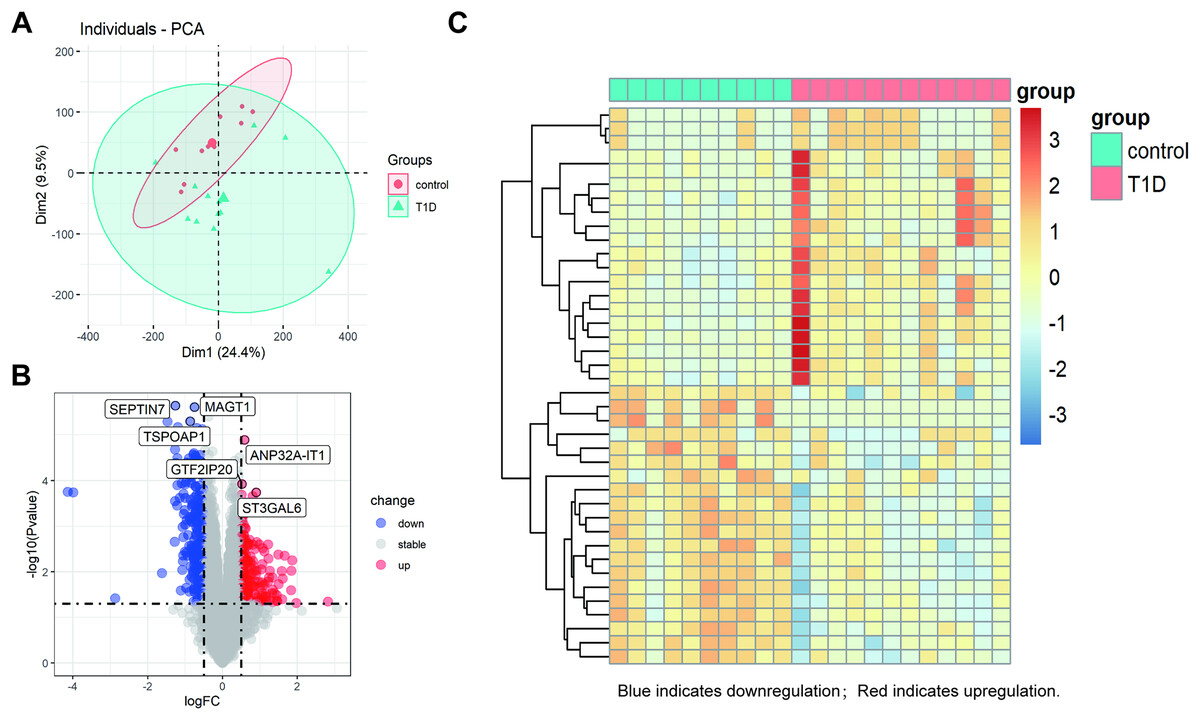
Figure 2: Differential gene expression analysis between NT1D and HC group in the dataset.
(A) Principal-component analysis (PCA). The center points of the NT1D group and the HC group are far apart in space, indicating that the principal components are different. (B) Volcano plot of DEGs in NT1D group compared to HC group. Red indicates the gene expression was up-regulated and blue indicates the gene expression was downregulated in NT1D group compared to HC group (adjust p value < 0.05 and |log2 FC| ≥ 0.5). Top 3 up- and-down-regulated genes with the smallest p-value are labeled on the map. (C) Heatmap of top 20 DEGs in NT1D group compared to HC group. Each row represents a sample, and each column represents a single gene. Red color represented NT1D group, and blue color represented HC group. The color scale shows the relative genes expression level in certain slide: blue indicates low relative expression levels; red indicates high relative expression levels.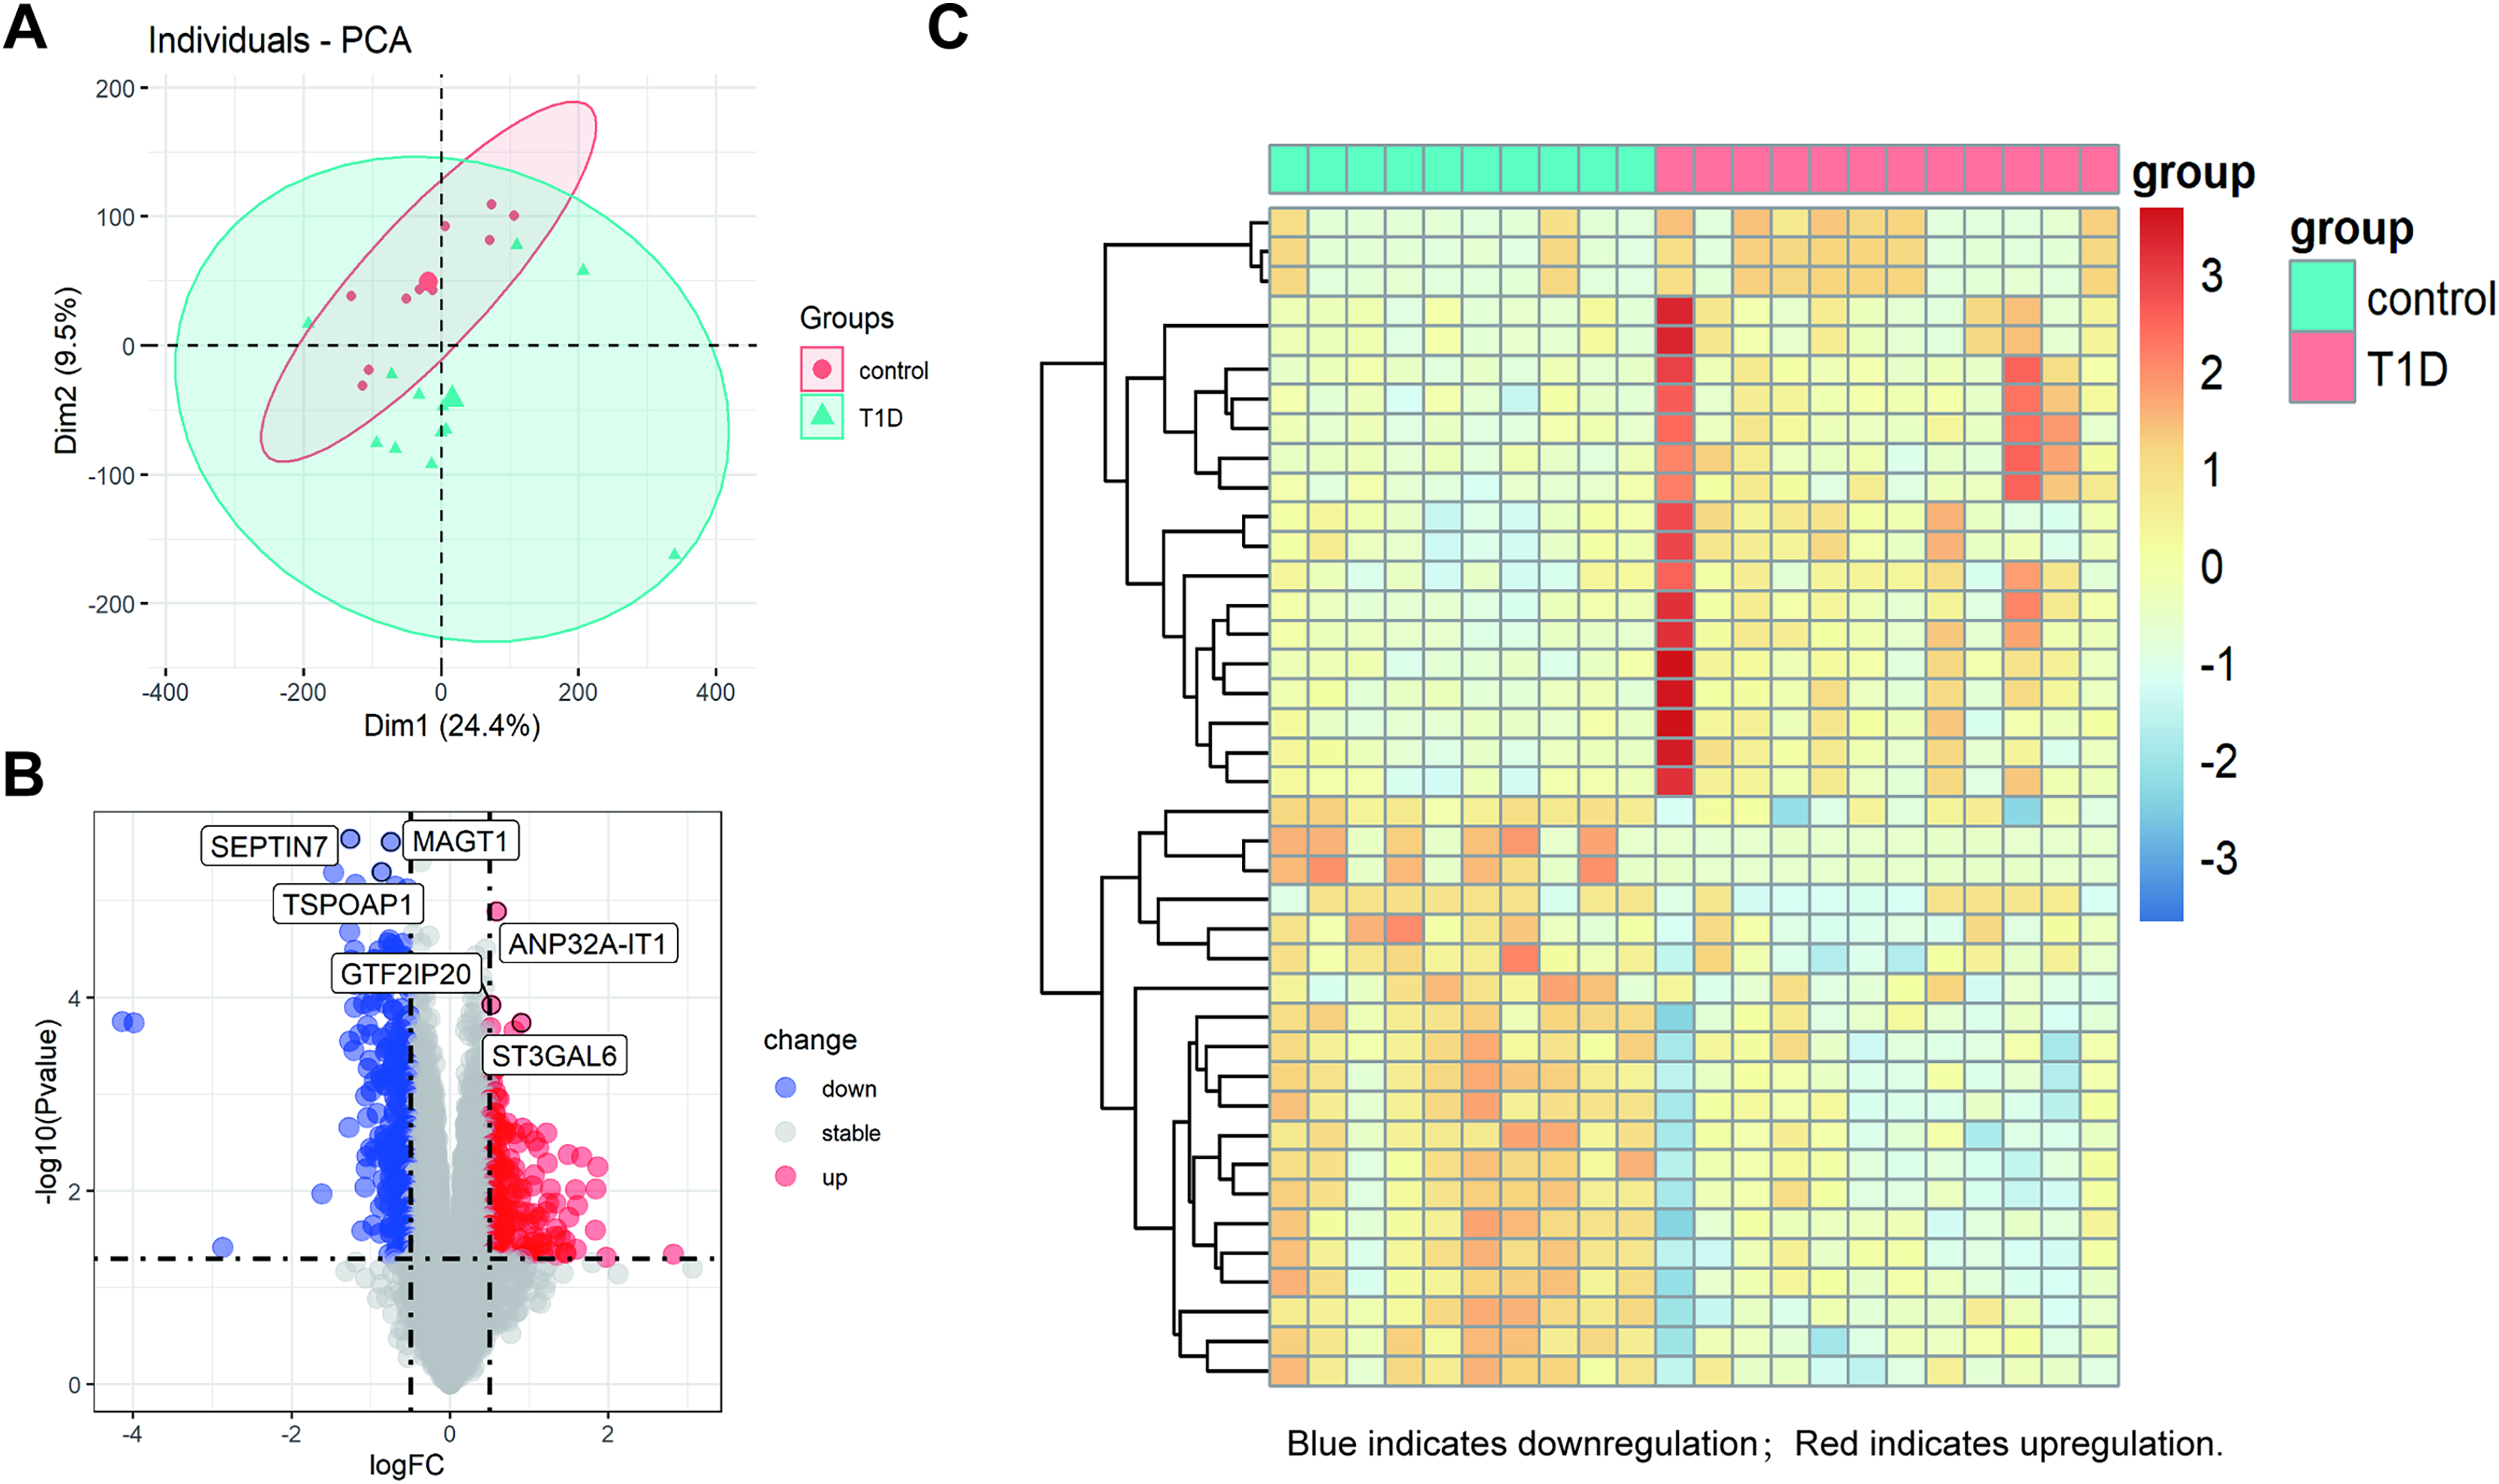
Identification of EP-DEGs
A venn diagram was used to identify extracellular protein-related DEGs (EP-DEGs) by intersecting DEGs with genes annotated in the HPA and Uniprot database encoding extracellular proteins (Fig. 3A). The process identified 122 EP-DEGs, including 68 up-regulated genes and 53 down-regulated genes (Table 1, Fig. 3B, and Table S2). According to the volcano plot of EP-DEGs, the top five up-regulated genes were MARCKS, ALOX5, ENTPD1, CD180, and ST3GAL6; the top five down-regulated genes were SEPTIN7, CCL4, NPC1, GNLY, and XCL1 (Fig. 3C). A heatmap in Fig. 3D illustrates distinct differences in the expression of EP-DEGs between NT1D and HC.
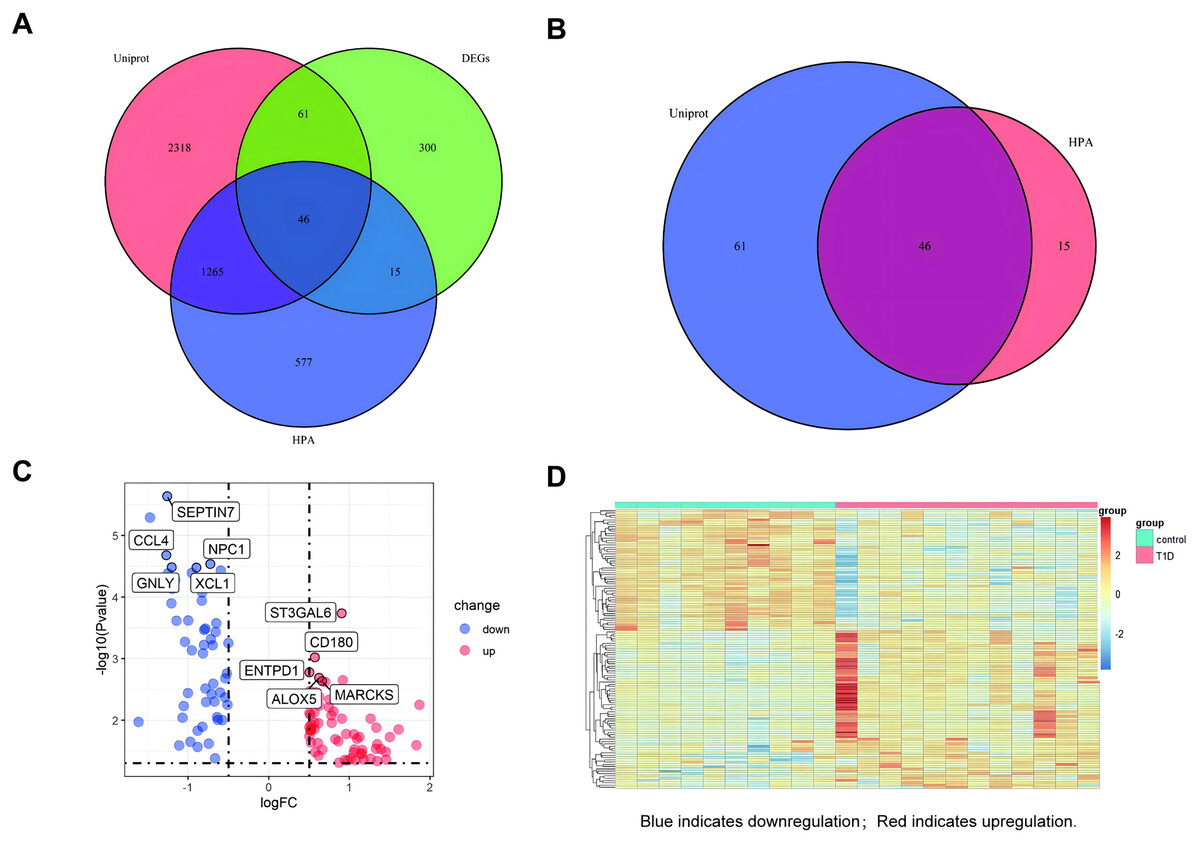
Figure 3: Screening for EP-DEGs between NT1D and HC group in the dataset.
(A) Venn diagram of three lists: DEGs, genes annotated in the HPA database encoding extracellular proteins and genes annotated in the UniProt database encoding extracellular proteins. (B) Select all differential genes associated with extracellular proteins. (C) Volcano plot of EP-DEGs. Label the top 5 up-and-down-regulated genes with the smallest p value. (D) Heatmap of all the EP-DEGs. The color scale shows the relative genes expression level in certain slide: blue indicates downregulation; red indicates upregulation.
| Genes | |
|---|---|
| Up-regulated | RALB, GCA, RPL14, CEACAM1, ENO1, RAB27B, CRYZ, AREG, SULF2, BASP1, PYGL, OSCAR, VCAN, MME, STX3, S100P, ACTN1, UBE2D3, PTGDS, ADM, THBS1, GPRC5D, TNFAIP6, NAMPT, PGLYRP1, LRG1, TNFAIP3, QPCT, DYSF, COL13A1, SLPI, CEACAM8, RPS19, PSMB4, RNASE3, LTF, CRISP3, NRG1, MMP9, ANXA3, NRF1, RETN, IGKV117, CAMP, CA4, CDC42, LCN2, BPI, HBD, SELENBP1, JCHAIN, IGKC, ARG1, CXCL1, CD160, GZMH, GZMA, NCAM1, B3GAT1GZMB, GFOD1, ADGRE3, GZMK, CSF2RA, GZMM, LAIR2, LILRA2, MMP25, PROK2 |
| Down- regulated | SEPTIN7, CCL4, NPC1, GNLY, XCL1, TLR3, RHOBTB3, PRSS23, PDGFD, SPON2, CLIC3, CST7, ADGRG1, TGFBR3, FGFBP2, ENPP4, RRAS2, CTSW, CCL5, TTC38, PAM, SLC4A4, ABCB1, SYNE2, TNF, TRDV3, AKR1C3, TRDC, ACOT7, GNAL, IGFBP3, FOLR1, IFNG, RPL14, RAB27B, CRYZ, AREG, PTGDS, TNFAIP3, COL13A1, RPS19, PSMB4, CDC42, CD160, GZMH, GZMA, NCAM1, B3GAT1, GZMB, GFOD1, GZMK, GZMM, LAIR2 |
Function enrichment analyses of EP-DEGs
We performed GO and KEGG enrichment analyses of EP-DEGs using R software’s “ClusterProfiler” package. GO analysis identified 37 processes in CCs, 447 processes in MFs, and 477 processes in BPs (Table S3). In CCs, genes were enriched on specific granules, secretory granules, and cytoplasmic vesicle lumens (Fig. 4). According to the enrichment analyses of MFs in GO, we identified The top MFs terms included lipopolysaccharide binding, cytokine activity, receptor-ligand activity, and signaling receptor activator activity (Fig. 4), all crucial for diabetes pathology. BP analysis revealed enrichment in processes such as defense response to bacterium, humoral immune response, and myeloid leukocyte activation (Fig. 4). KEGG analysis identified 209 enriched pathways, including protein digestion, the estrogen signaling pathway, the renin-angiotensin system, allograft rejection, and the toll-like receptor signaling pathway (Table S4 and Fig. 5A). In Fig. 5A, the use of positive −log10(p-values) serves to highlight the statistical significance of pathway enrichment results. KEGG highlighted that NT1D involves multiple interconnected pathways, not a single target mechanism. TNF, IFNG, and GZMB were enriched in allograft rejection and T1D-related pathways (Table 2).

Figure 4: GO enrichment of EP-DEGs in CCs, MFs and BPs.
The dotplots (A, D, G) and the barplots (B, E, H) show the top 10 processes enriched by EP-DEGs in CCs, MFs and BPs while the cnetplots (C, F, I) show the top five processes.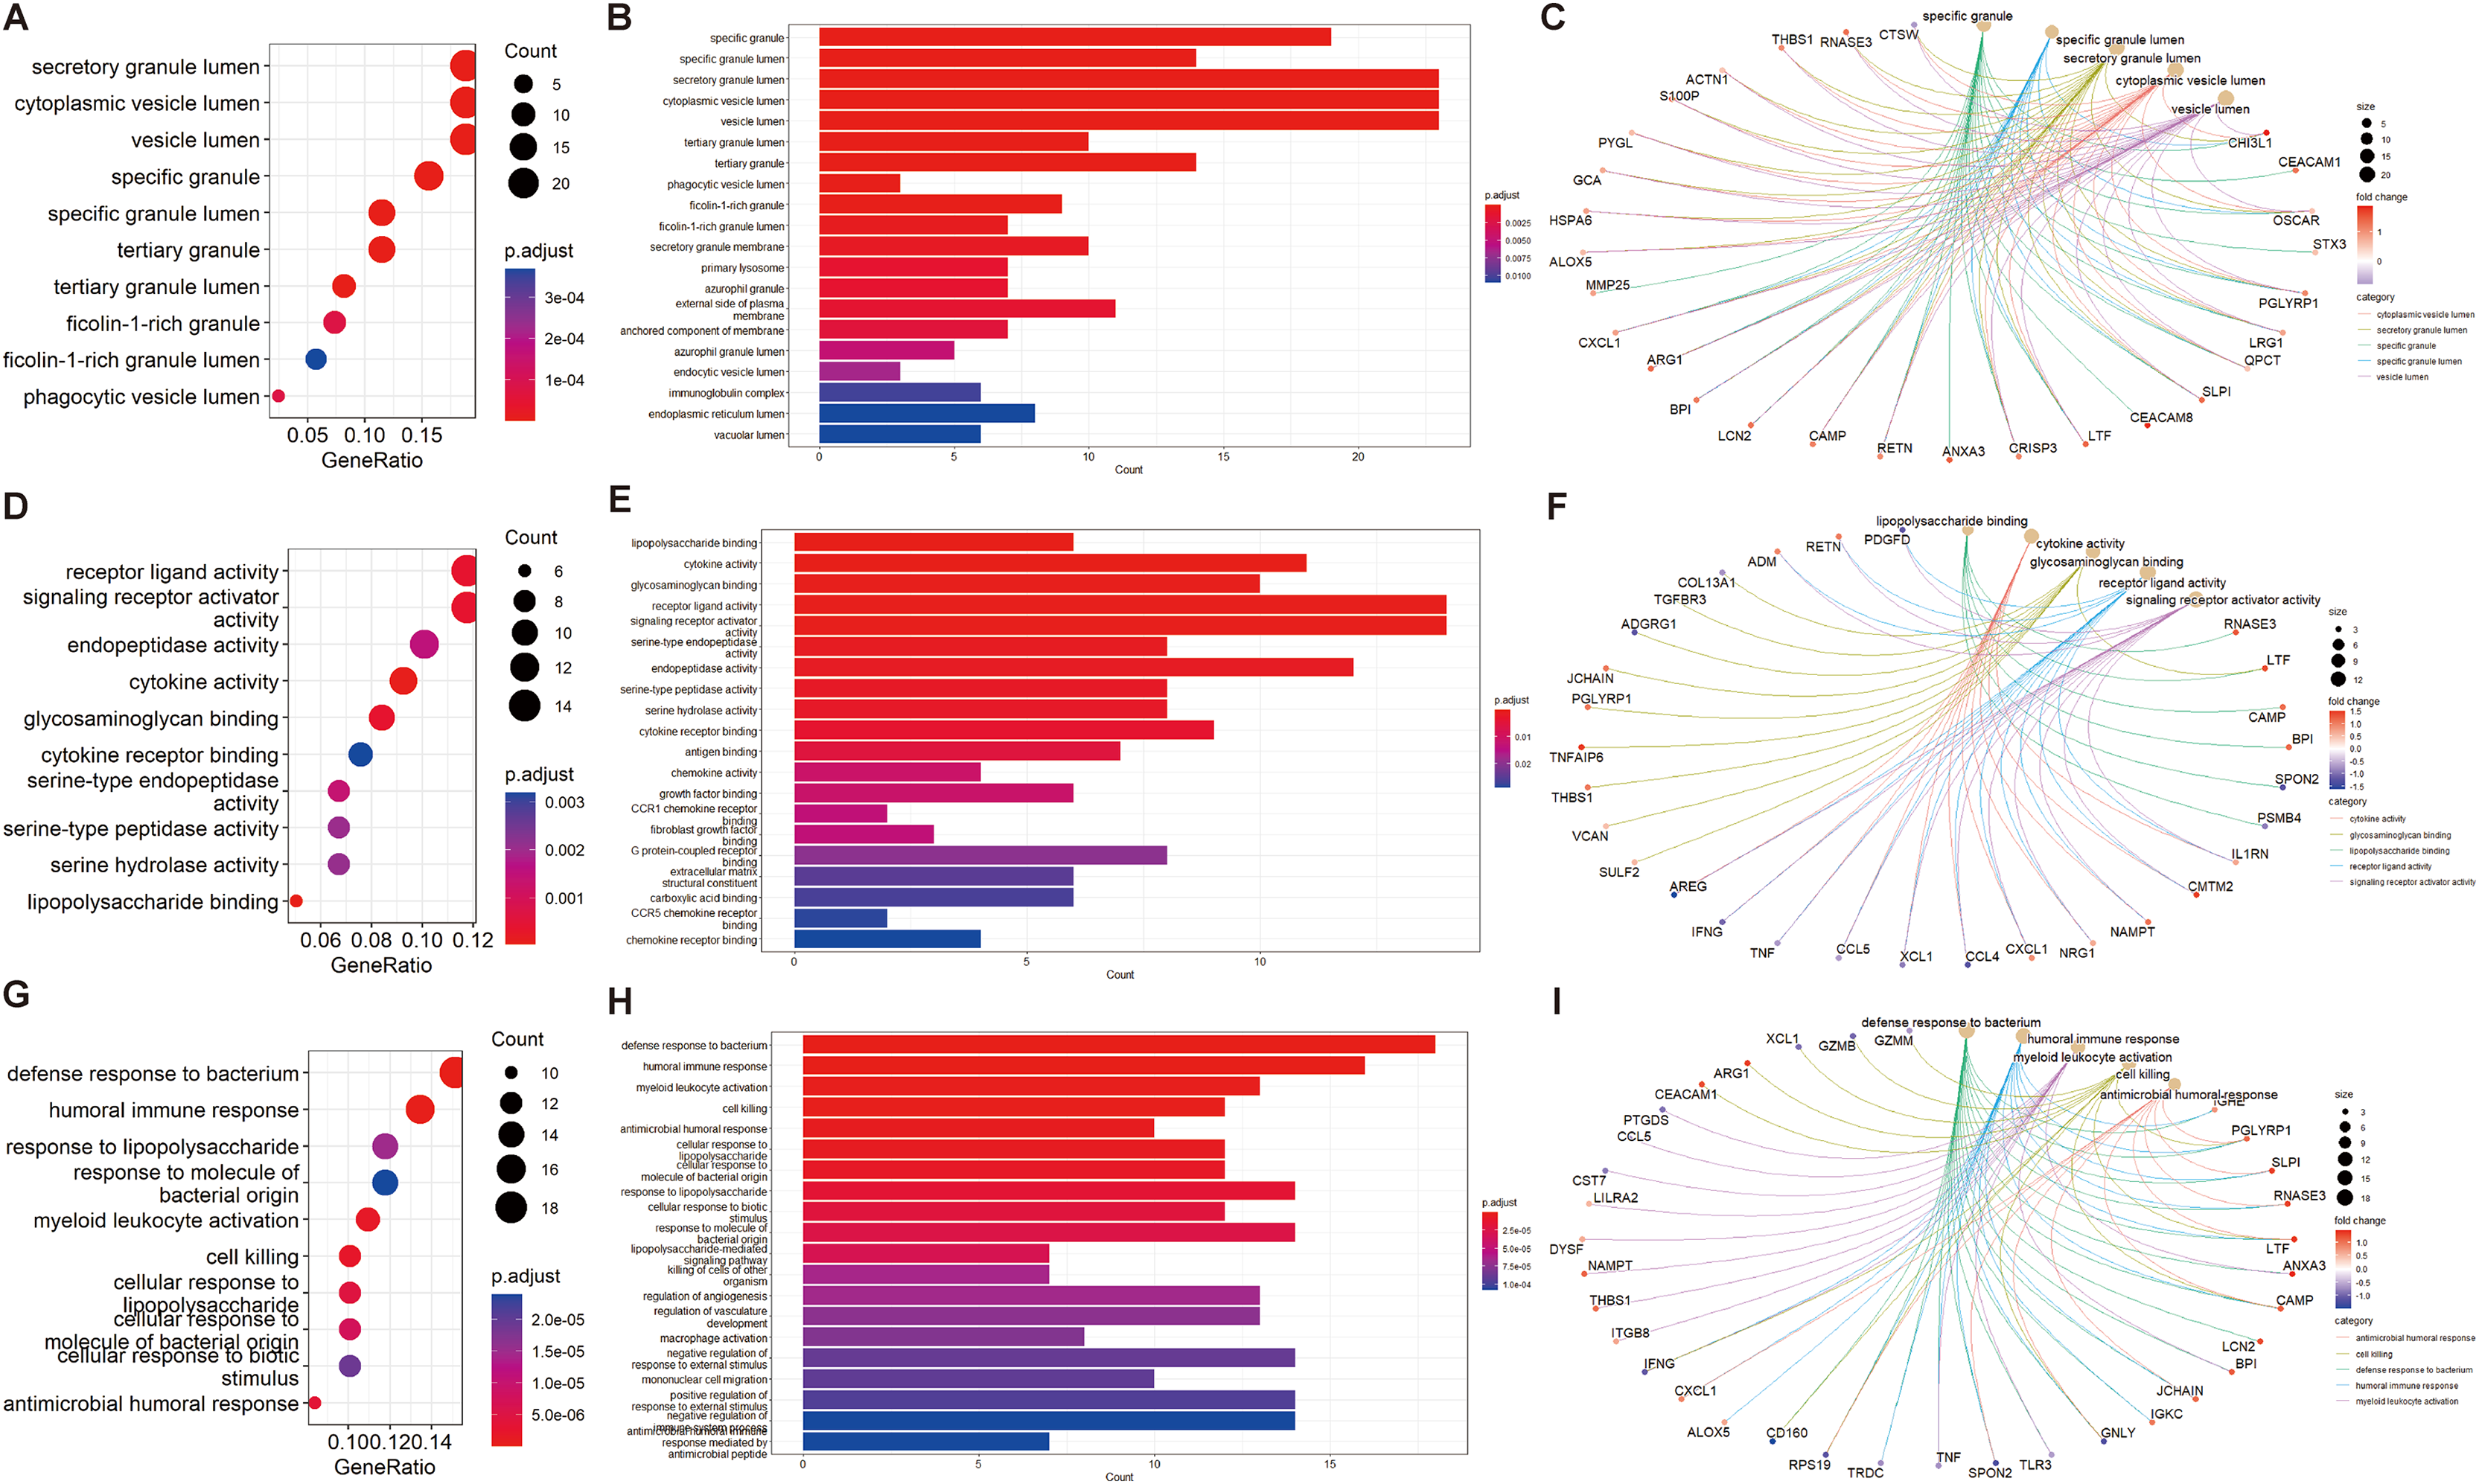
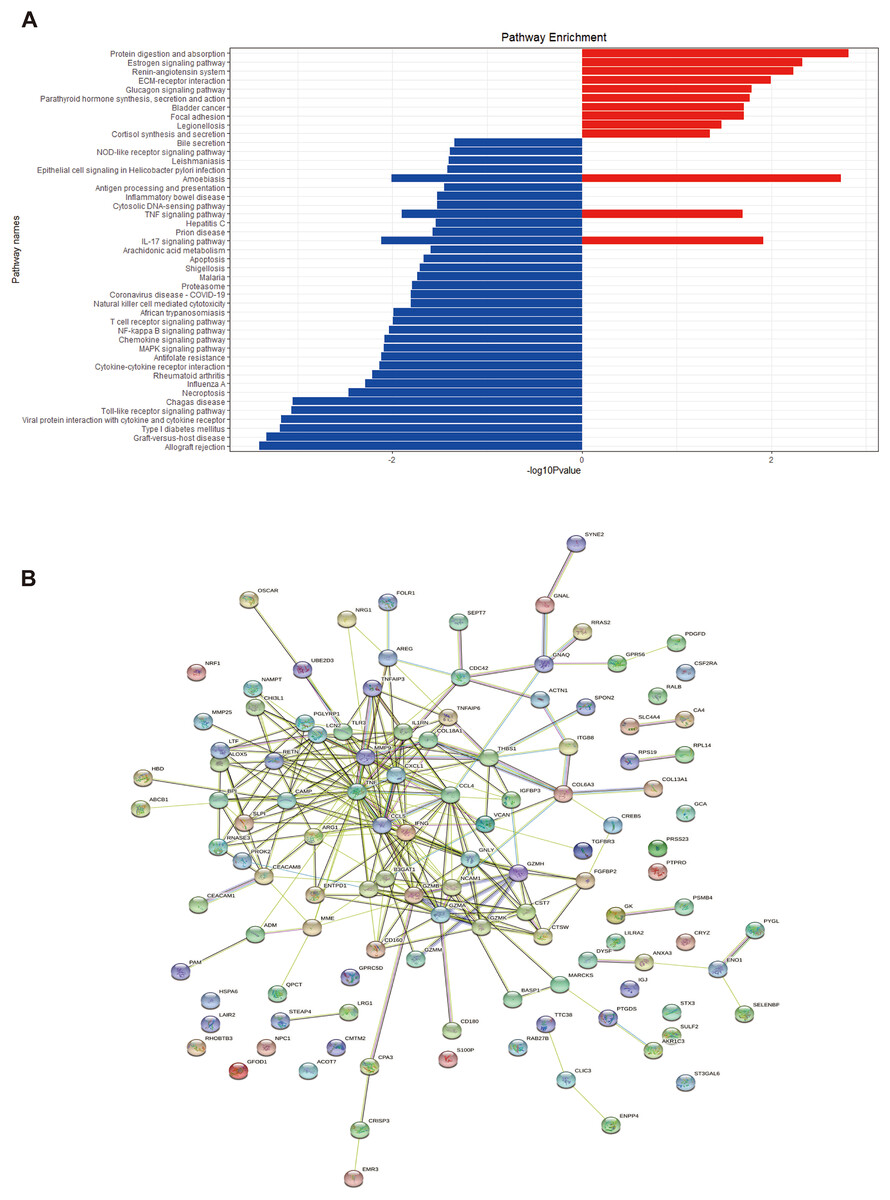
Figure 5: KEGG enrichment analysis of EP-DEGs and a EP-DEGs PPI network constructed by the STRING database.
(A) The barplot shows the pathways to which up-regulated genes and down-regulated genes are enriched. Red barplots represent up-regulated genes and blue barplots represent down-regulated genes. By plotting the −log10(p-value), smaller p-values (indicating higher significance) appear as larger bars, making it easier to visually identify the most enriched pathways. (B) A EP-DEGs PPI network constructed by the STRING database.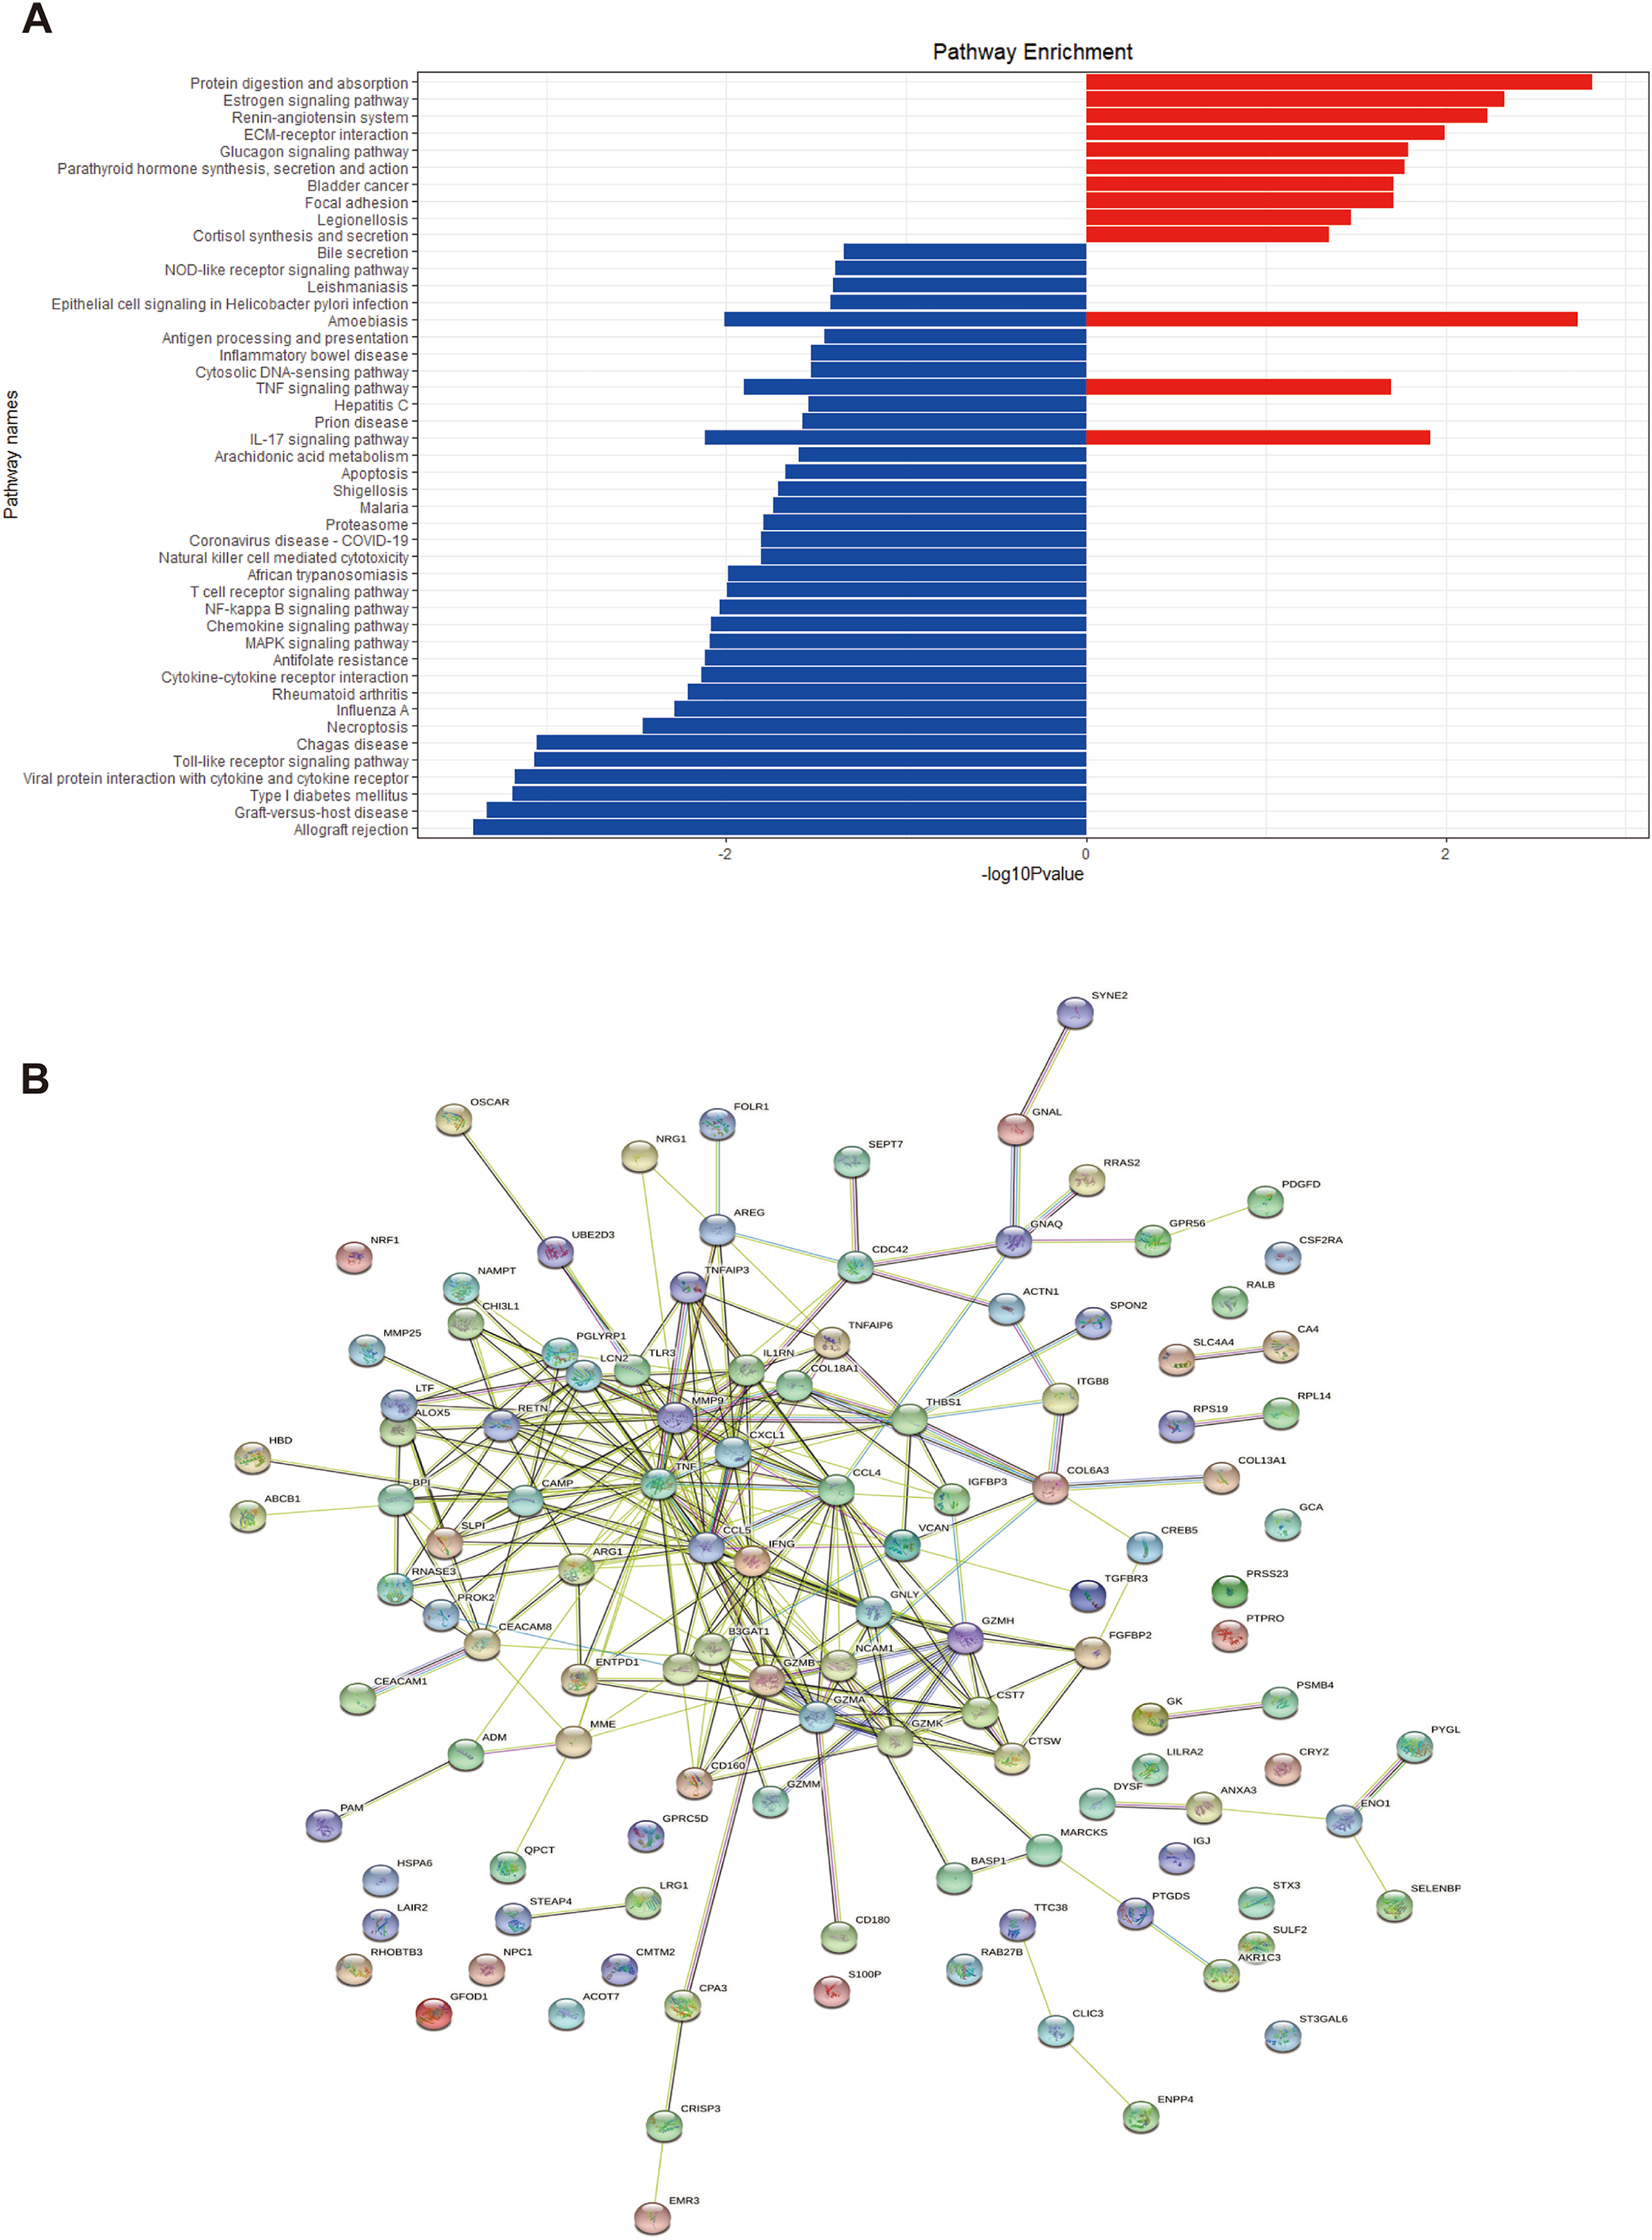
| ID | Pathway enrichment | Gene ID |
|---|---|---|
| hsa04974 | Protein digestion and absorption | COL6A3, COL18A1, CPA3, MME, COL13A1 |
| hsa05332 | Estrogen signaling pathway | TNF, IFNG, GZMB |
| hsa04614 | Renin-angiotensin system | CPA3, MME |
| hsa05330 | Allograft rejection | TNF, IFNG, GZMB |
| hsa05332 | Graft-versus-host disease | TNF, IFNG, GZMB |
| hsa04940 | Type 1 diabetes mellitus | TNF, IFNG, GZMB |
| hsa04620 | Toll-like receptor signaling pathway | CCL4, TLR3, CCL5, TNF |
| hsa04660 | T cell receptor signaling pathway | TNF, IFNG, CDC42 |
Construction of PPI network and identification of key genes
Using the STRING database, we constructed a PPI network of EP-DEGs consisting of 85 nodes and 185 interactions (Fig. 5B). Further analysis using Cytoscape v. 3.9.1 and MCODE revealed a significant cluster with 13 nodes and 28 edges (score ≥ 4, Fig. 6A). Genes with high degree values and genes clustered by MCODE are generally considered as key genes. The top nine key genes with the highest degree values were determined by ten topological analysis methods of CytoHubba in Cytoscape (Table S5). These methods enabled us to identify certain crucial genes including granzyme B (GZMB), C-C motif chemokine ligand 4 (CCL4), tumor necrosis factor (TNF), matrix metallopeptidase 9 (MMP9), C-C motif chemokine ligand 5 (CCL5), interferon gamma (IFNG), C-X-C motif chemokine ligand 1 (CXCL1), granulysin (GNLY), and lipocalin 2 (LCN2). Among these, GZMB, CCL4, and TNF were consistently identified as hub genes across multiple methods and were all down-regulated. The Maximal Clique Centrality (MCC) algorithm is considered as the most accurate approach out of all ten since it can accurately determine more significant genes in the top-ranked list than the other nine methods. The MCC algorithm identified CCL4 as the most significant down-regulated gene, while MMP9 was the highest-scoring up-regulated gene. We further analyzed the network interactions involving CCL4 and MMP9 (Figs. 6C and 6D).
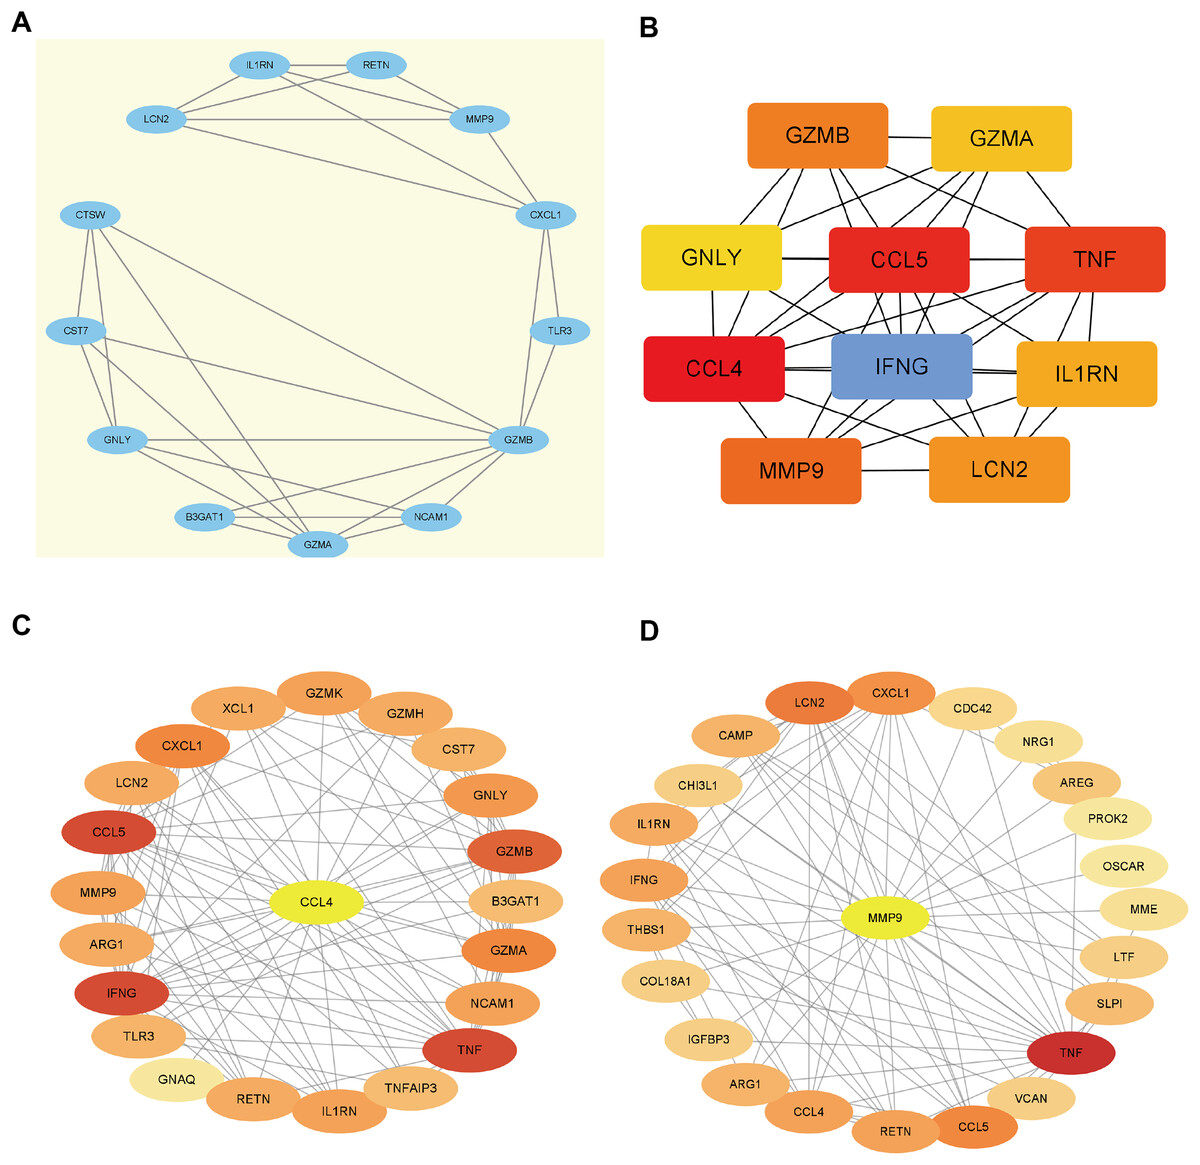
Figure 6: Hub gene identification.
(A) Gene cluster with the highest score constructed by MCODE in Cytoscape. (B) The top 10 genes with the highest degree values are identified using CytoHubba. These genes are ranked in descending degree order from red to orange to yellow. (C) The first stop node genes that interact with CCL4 is predicted by CytoHubba. (D) The first stop node genes that interact with MMP9 is predicted by CytoHubba.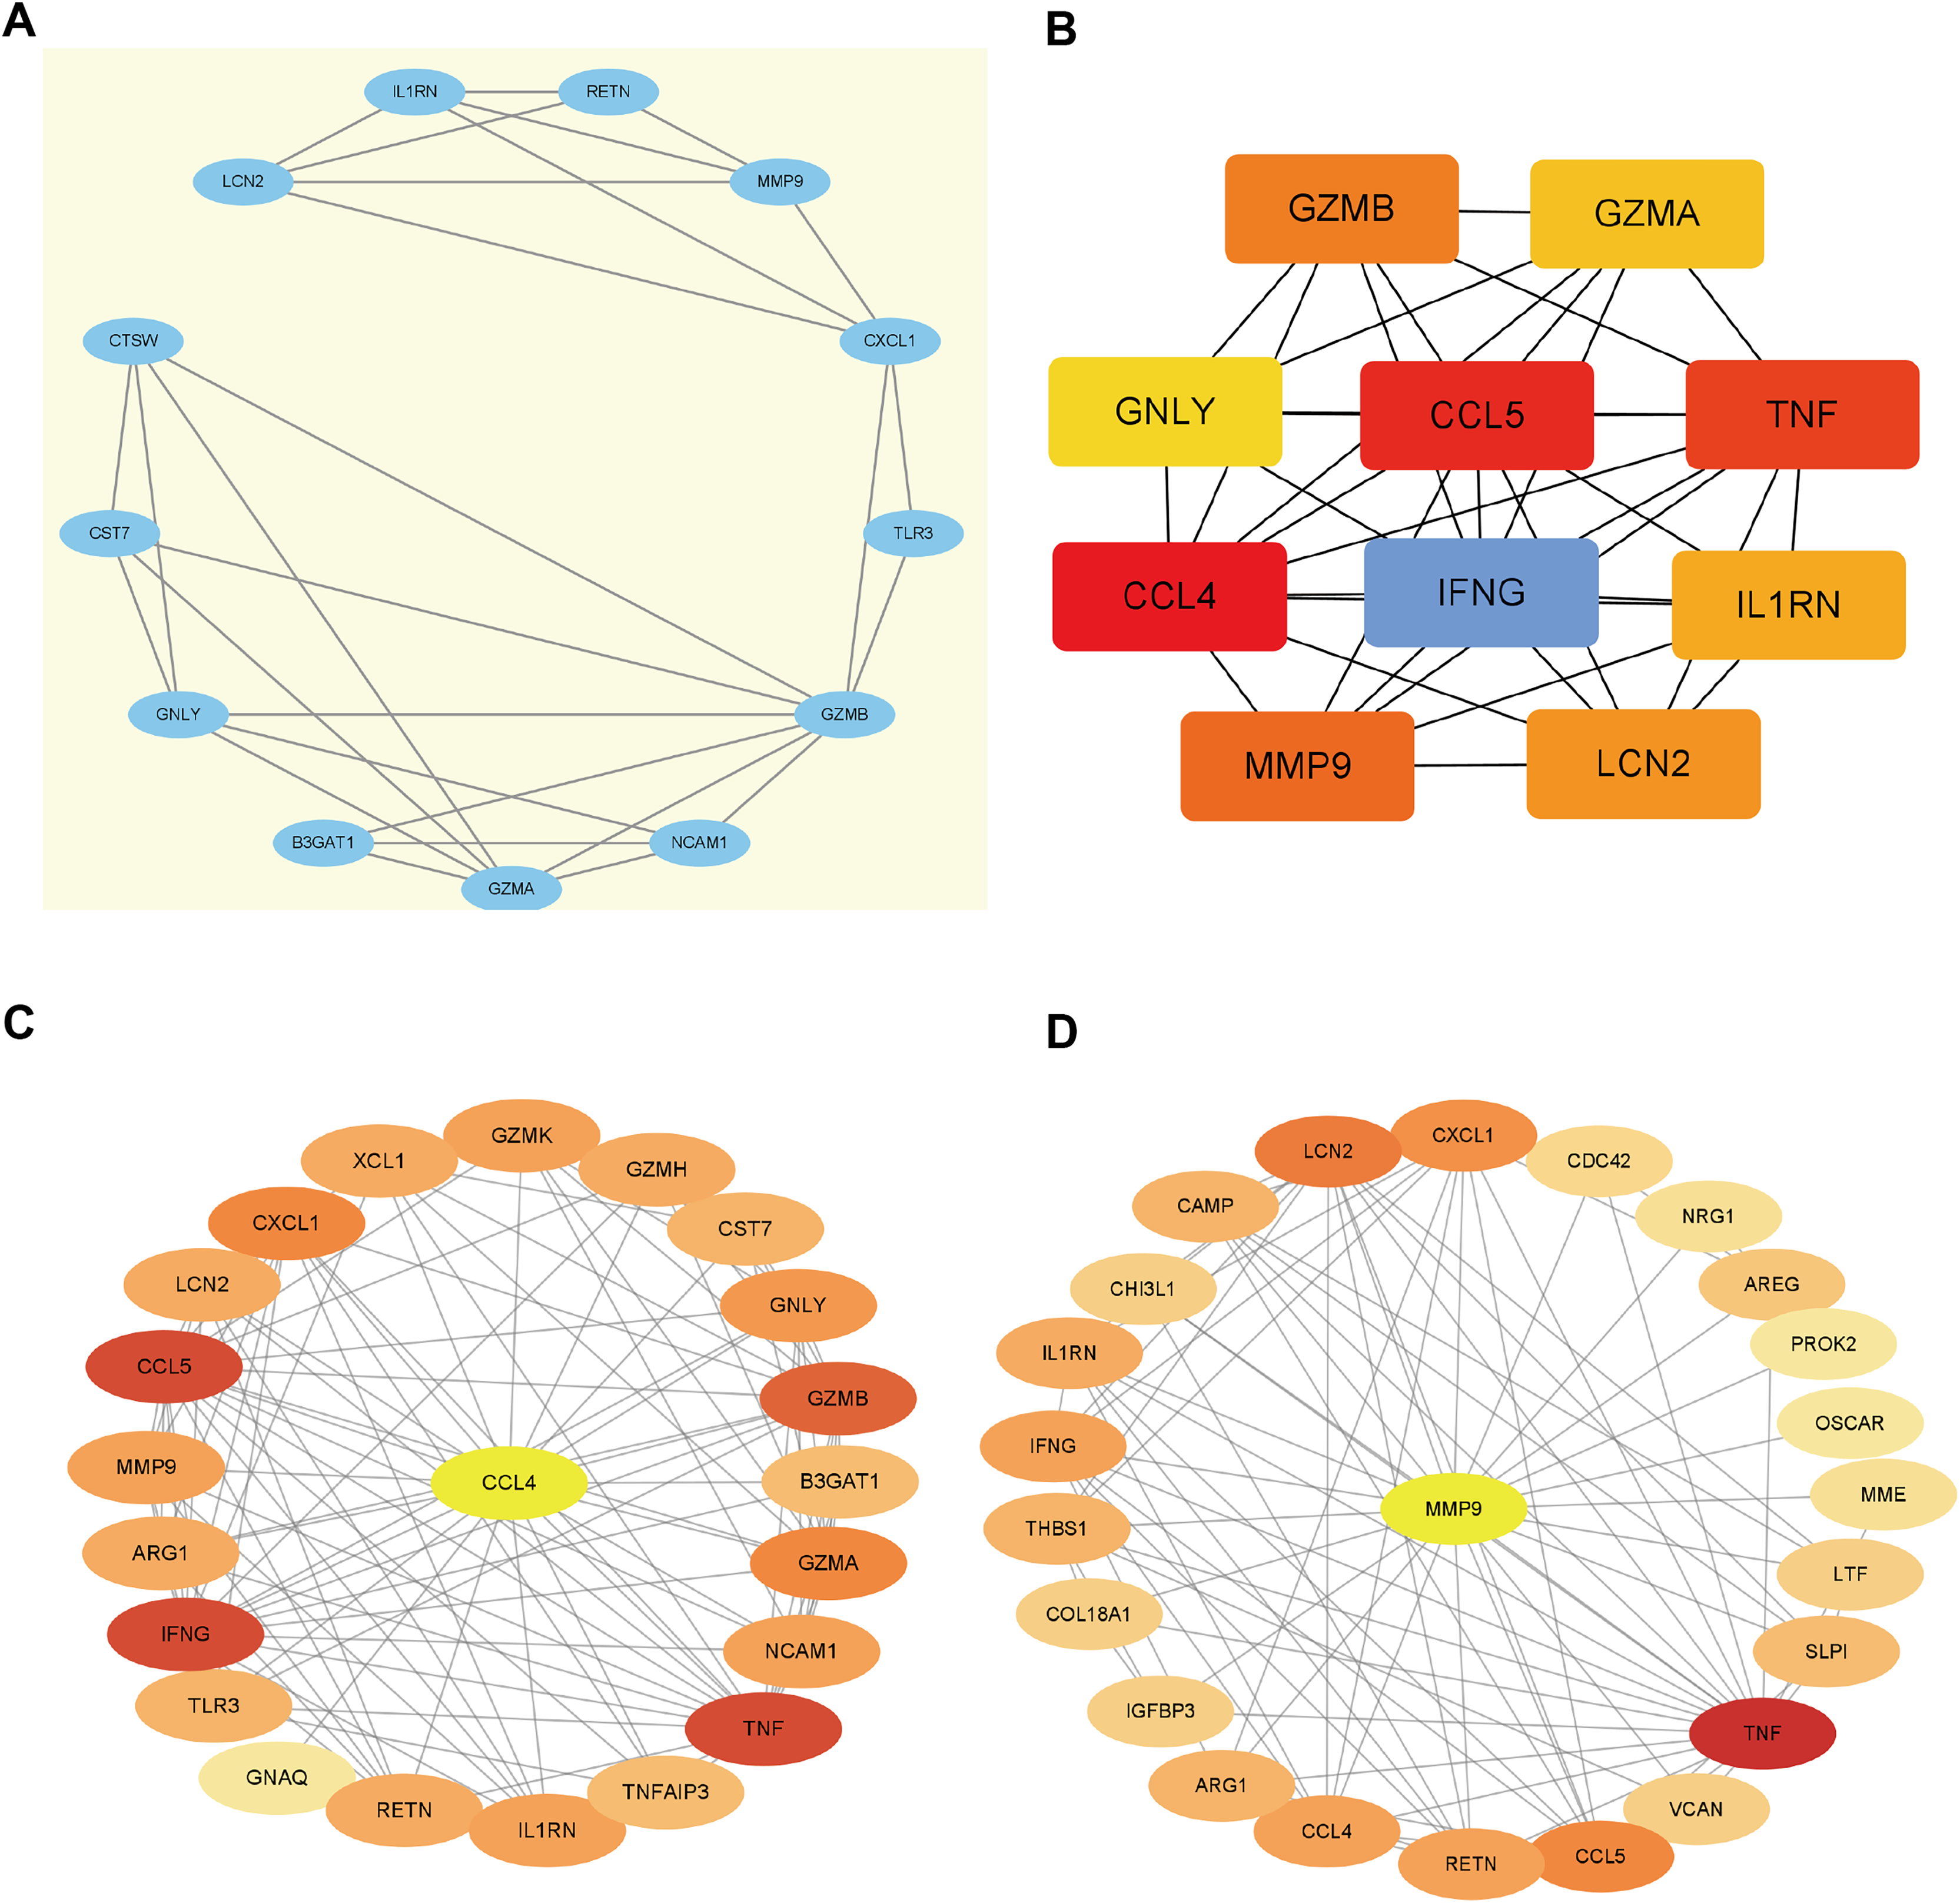
Evaluation of key extracellular genes and verification in GSE33440
CTD was applied to evaluate the relationships between NT1D and the identified extracellular-related genes. The CTD inference scores confirmed that LCN2, IFNG, and TNF were more closely related to NT1D and hypoglycemia, while TNF, IFNG, and MMP9 were linked to hyperglycemia (Figs. 7A–7C).
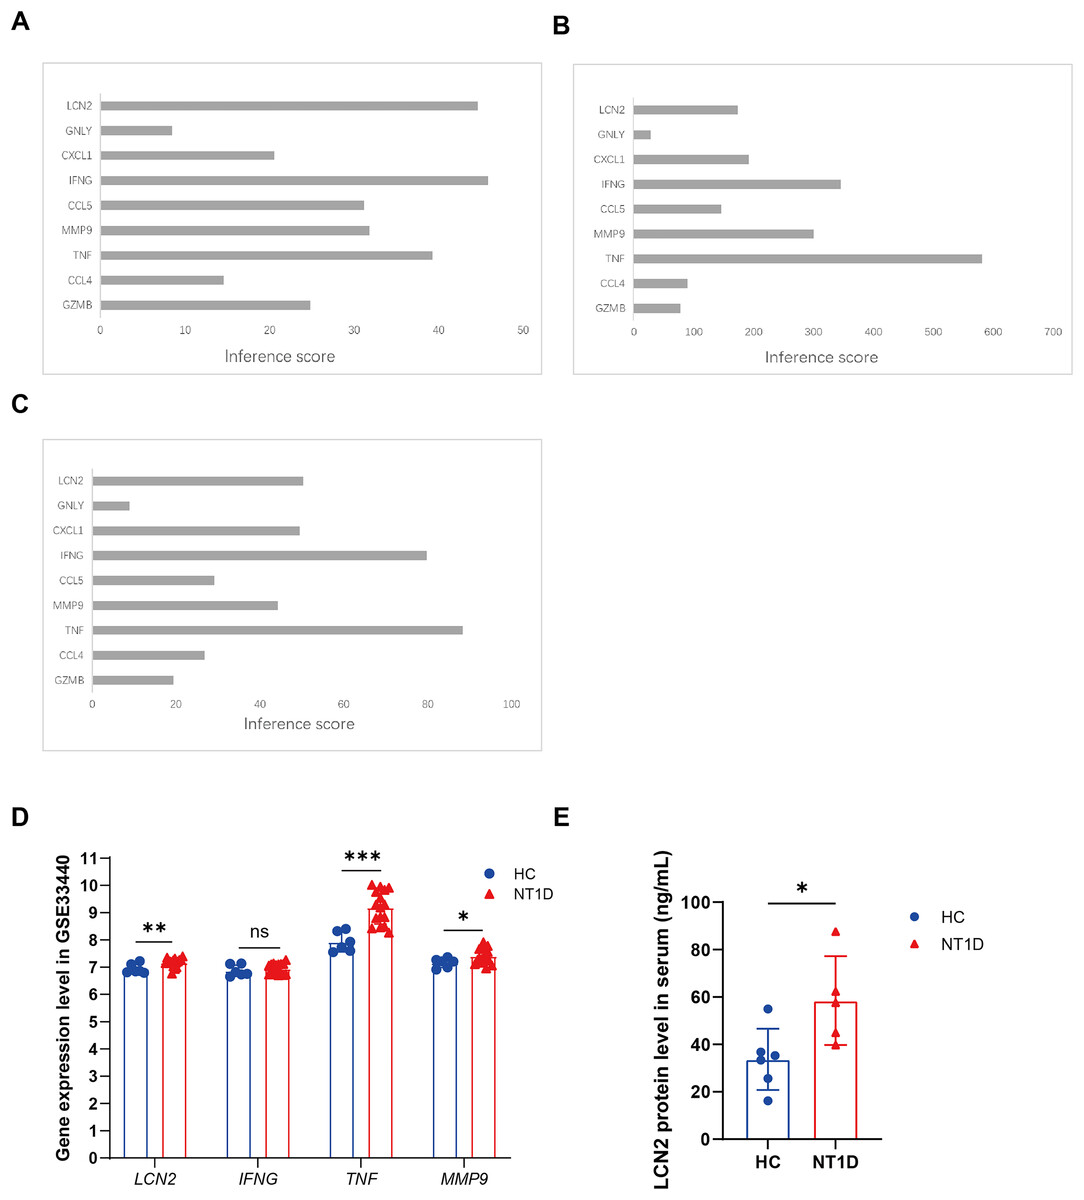
Figure 7: Identification of potential crucial extracellular-related genes associated with T1D and vailidation of potential crucial extracellular-related genes with GSE33440.
(A) The interaction of crucial genes and T1D. (B) The interaction of crucial genes and hyperglycemia. (C) The interaction of crucial genes and hypoglycemia. (D) The boxplots show the expression results of LCN2, IFNG, TNF, MMP9 of 16 NT1D and six HC in the GSE33440 dataset. Red is healthy control group, blue is NT1D group. *p < 0.05, **p < 0.01, ***p < 0.001. (E) The boxplot shows the expression results of LCN2 in protein level of serum of 6 NT1D and 6 HC. Red is healthy control group, blue is NT1D group. We performed skewness, kurtosis, and mahalanobis distance analyses as suggested. Our results suggest that Sample T1D number 1 is an outlier, and we have excluded it from further analysis. *p < 0.05.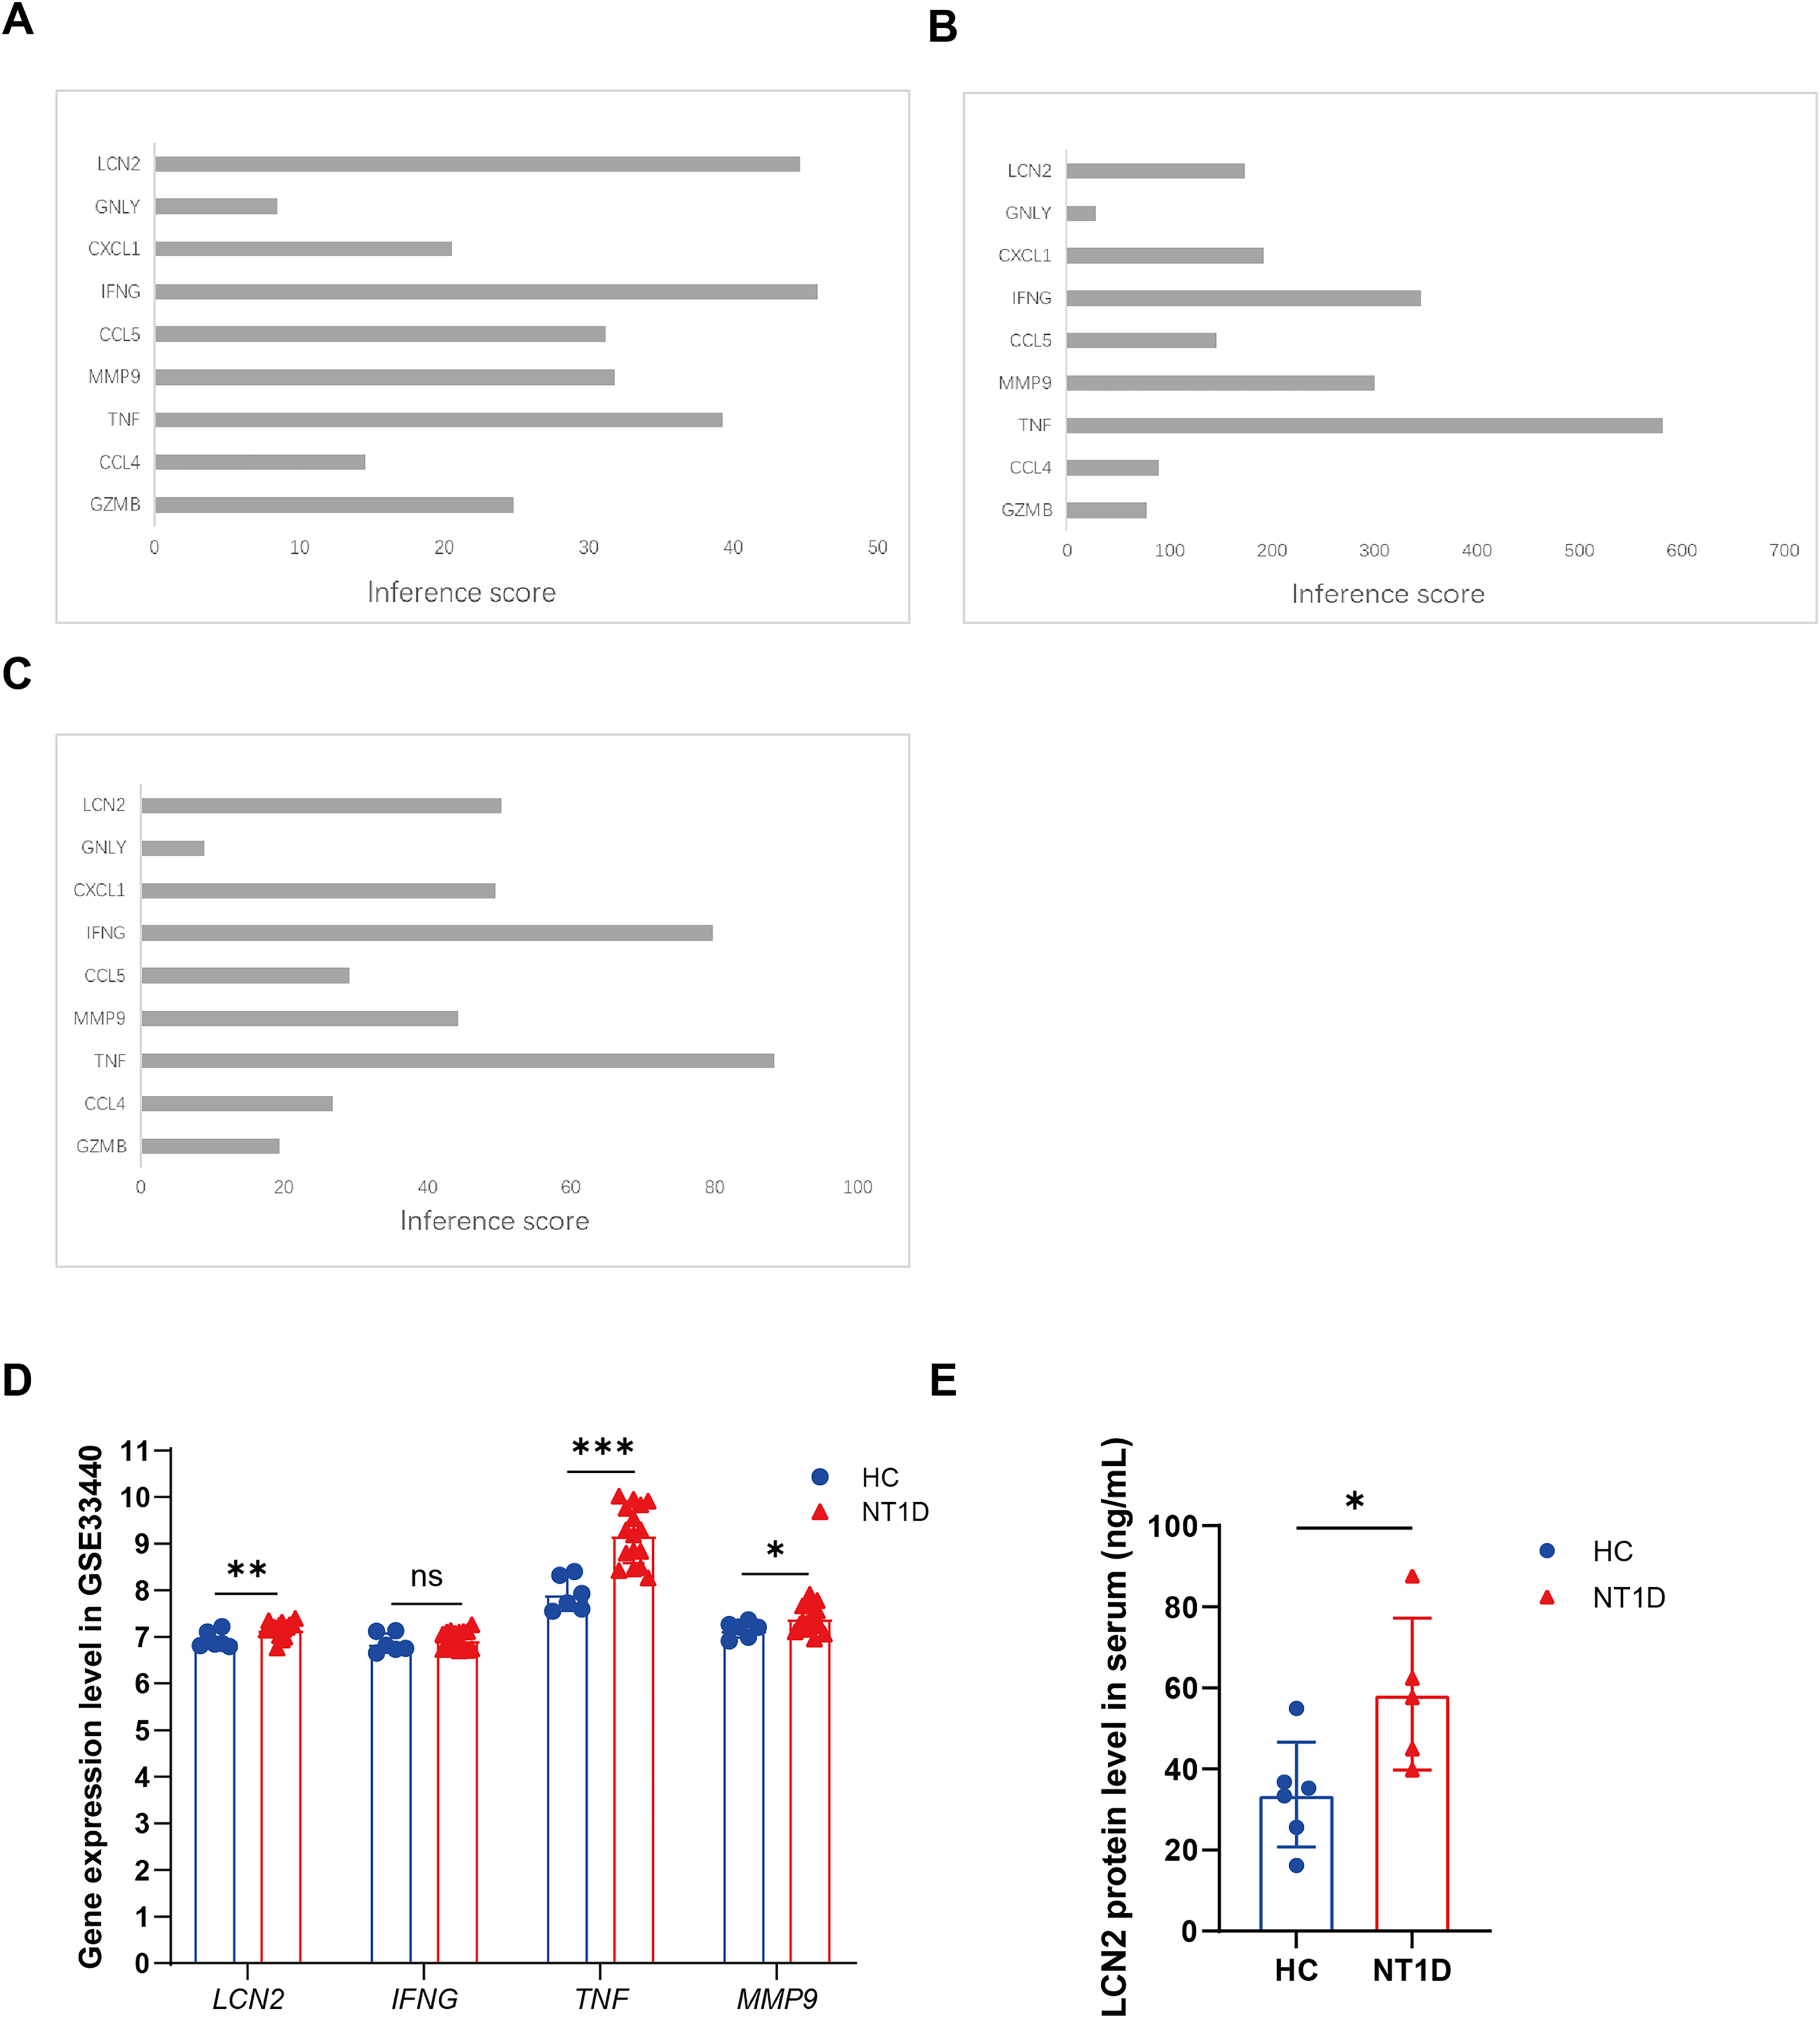
To verify our conclusions, we analyzed the GSE33440 dataset, which includes 16 NT1D patients and 6 HC. The specific gene expression can be found in Table S6. As shown in Fig. 7D, protein level of LCN2 (p = 0.010), MMP9 (p = 0.028), and TNF (p < 0.001) were significantly elevated in NT1D patients compared to healthy controls (Table S6).
Verification of LCN2 levels in clinical samples
We further verified LCN2 protein levels using clinical serum samples. Both the NT1D and control groiups were age-matched, with median ages of 30 years (NT1D: 21–54.75; controls: 22–52.5, quartiles). Serum LCN2 levels were significantly higher in NT1D patients (p = 0.009, Fig. 7E, Table S7), supporting its potential as a biomarker for NT1D.
The Supplemental Materials contain the original microarray datasets and analysis code, enabling researchers to validate or extend the findings by applying modified parameters or stricter filtering criteria.
Discussion
In our study, we obtained 422 DEGs by downloading the GSE55098 dataset from the GEO database, which includes PBMC samples of 12 NT1D and 10 healthy individuals. Then, 122 EP-DEGs (69 up-regulated and 53 down-regulated genes) were obtained by intersecting DEGs with two public databases related to extracellular proteins. GO and KEGG analyses were performed to give us a better understanding of the functions of EP-DEGs. According to the CCs analysis in GO, these EP-DEGs were mainly enriched in granule lumen and vesicle lumen, which are very common membrane vesicle structures transporting substances in eukaryotes. The MFs analysis in GO showed that EP-DEGs were significantly enriched in lipopolysaccharide (LPS) binding, cytokine activity, binding glycosaminoglycan, receptor-ligand activity, and signaling receptor activator activity. The findings of our study further confirm that some EP-DEGs play a significant role in the pathogenesis of NT1D. The BPs analysis of GO suggested that these EP-DEGs were mainly enriched in defense response to bacterium, humoral immune response, myeloid leukocyte activation, cell killing, and antimicrobial humoral response. That was consistent with the previous studies showing that T1D is a polygenic autoimmune disorder associated with islet inflammatory infiltration, β cell dysfunction and T cell-mediated β cell killing (Budd et al., 2021; Pietropaolo, Towns & Eisenbarth, 2012). The most enriched gene set of EP-DEGs according to BPs analysis of GO was the defense response to bacterium, which was in unison with the finding that extracellular proteins can produce a defense response to bacterium to protect the body from diseases (Gallotta et al., 2020). In addition, KEGG enrichment analysis of DEGs which included 45 signal pathways (10 up-regulated pathways, 32 down-regulated pathways, and three up-and-down-regulated pathways) showed that these EP-DEGs were mainly enriched in protein digestion and absorption, estrogen signaling pathway, renin-angiotensin system, allograft rejection, graft-versus-host disease, TLR signaling pathway, and T cell receptor signaling pathway.
According to the results of our analysis, several pathways are involved in the complex pathogenesis of NT1D, which requires a multi-target, multi-pathway comprehensive analysis. The involvement of these EP-DEGs in critical pathways such as toll-like receptor signaling and T cell receptor signaling, as indicated by KEGG enrichment analyses, reflects the importance of immune activation in the onset and progression of NT1D. These pathways not only orchestrate immune responses but also mediate inflammation and β-cell dysfunction, suggesting that the identified genes are closely linked to the key pathological processes in NT1D. In the past, T1D was considered as a cellular immune disease (Bach, 1994). However, an increasing number of research in the recent years has shown that the host innate immune system, which is primarily mediated by TLRs, is promoting the initiation of the autoreactive T cells in T1D and plays a critical function in the immune response (Lien & Zipris, 2009; Meyers et al., 2010; Zipris, 2008). TLRs are molecular patterns on immune cells that recognize pathogens or endogenous red flags and activates inflammatory responses that are attributed to the production of inflammatory mediators like interleukin-1β (IL-1β), which participates in the recruitment of pathogenic inflammatory cells to the islets and mediates direct toxic effects on pancreatic β cells (Donath et al., 2003; Mathis, Vence & Benoist, 2001; Shimabukuro et al., 1997). Meyers et al.’s (2010) study suggested that newly diagnosed diabetes patients have changes in innate immunity function in their peripheral blood, which are mainly manifested by elevated levels of serum IFN-α2, IL-1β, IFN-γ, and CXCL-10. The discovery of the mechanism by which the TLRs signaling pathway is involved in mediating the destruction of islet inflammation has a great prospect for the discovery of novel innate immune signaling molecules that might potentially utilized to specifically inhibit the development of T1D (Lien & Zipris, 2009).
In further continuation, we built the PPI network according to EP-DEGs. Based on module analysis and central gene identification of the PPI network, we obtained four modules and nine key genes (GZMB, CCL4, TNF, MMP9, CCL5, IFNG, CXCL1, GNLY, LCN2). GNLY, an immune protein produced by cytotoxic T cells and natural killer cells, further underscores the role of immune-mediated damage in NT1D pathogenesis by contributing to cytotoxicity and tissue injury. The top scoring module, Module 1, displayed enrichment in immune response, carbohydrate metabolism, and so on. In addition, GZMB, CCL4, and TNF were chosen as the top EP-DEGs and hub genes. First, GZMB is a serine protease that mediates cytotoxic T lymphocytes (CTL) and natural killer cells (NK), regulates apoptosis signaling pathways which involve in regulating immune responses and also contributes to the pathogenesis of many immune-mediated diseases (Kucuksezer et al., 2021). As GZMB levels increase when CTL accesses islets, we were able to concluded that a decrease in extracellular GZMB levels of NT1D suggests a decrease in peripheral CTL and NK levels, which is consistent with the previous studies of Li et al. (2022), but not with the study of Kobayashi et al. (2013). The reason may be that although the GZMB gene expression could be ascertained in NT1D, it is not equivalent to the GZMB protease concentration level, requiring further studies to clarify the role of GZMB in NT1D. Also, the chemokines CCL4, CCL5, and CXCL1 regulate immune cell trafficking, and their dysregulation can promote the infiltration of autoreactive immune cells into the pancreas, accelerating β-cell destruction (Szabo et al., 2019). CCL4 is a protein-coding gene, has been shown to protect against T1D development when expressed in the pancreas and secondary lymphoid organs (Meagher et al., 2007). Our findings align with this, supporting its potential in mitigating autoimmue responses.
Third, TNF is a cytokine involved in systemic inflammation and always leads to an acute phase response. It is produced by activated macrophages, CD4+ lymphocytes, natural killer cells, neutrophils, mast cells, eosinophils, and neurons. Serum TNF-α levels were significantly increased in T1D patients compared with healthy controls (Qiao et al., 2017). Studies have shown that TNF-α is gradually becoming a promising therapeutic target in newly-diagnosed diabetes (Koulmanda et al., 2012). Last but not least, according to the CTD analysis and vailidation of crucial extracellular-related genes in GSE33440, we found that LCN2, IFNG, TNF, and MMP9 may be potential diagnostic biomarkers for NT1D. The gene that codes interferon (IFN)-γ, IFNG, is called one of the plausible candidate susceptibility genes for T1D (De George et al., 2023; Sasaki et al., 2004). The increase of IFNG expression may be mainly caused by the up-regulation of autoreactive T cells in NT1D through the activation of TLR signaling pathway and T cell receptor signaling pathway to produce toxic effects on islet β cells (Vemulawada et al., 2024). TNF and IFNG are well-known pro-inflammatory cytokines implicated in autoimmune diseases, including T1D. Their elevated expression in NT1D patients and their association with hyperglycemia in our study suggest that these cytokines play a role in driving pancreatic β-cell destruction, exacerbating immune-mediated damage. Additionally, MMP9, a matrix metalloproteinase, has been linked to tissue remodeling and inflammation, and its increase in hyperglycemic conditions indicates that it may contribute to pancreatic islet degradation and loss of insulin production (De George et al., 2023), it is well-known that MMP9 belongs to the zinc metalloproteinase family and is associated with matrix renewal (Peeters et al., 2015). Our study revealed that MMP9 levels upregulate in NT1D, which is consistent with previous studies showing that plasma levels of MMP9 were elevated in T1D, and an increase in the ratio of MMP9 to tissue inhibitors is associated with diabetes-related retinopathy (Jacqueminet et al., 2006). Finally, LCN2, also known as neutrophil gelatinase-associated lipocalin (NGAL), is located on the chromosome 9q34 and is released by various cell types, making it a promising biomarker for inflammation, ischemia, infection (Sarkar et al., 2023). Elevated LCN2 levels are associated with intestinal and metabolic inflammation, as seen in obesity and related diseases (Moschen et al., 2017). It plays a critical role in metabolic regulation and immune modulation, with increased expression observed in both hypoglycemic and NT1D patients. Its involvement in glucose metabolism suggests it may indicate glucose instability and underlying β-cell stress. Increased serum level of LCN2 has also been reported in T1D patients (Xiang et al., 2011), undergoing its potential as a marker for metabolic dysfunction and disease monitoring. Our verification results also confirm this view. Carlos E. Irarrázabal’s study suggested that urinary exosom-like extracellular vesicles may be a new source of biomarkers for early detection of DKD tubular injury in patients with T1DM (Ugarte et al., 2021). In our NT1D patients, we observed elevated levels of LCN2, suggesting that detection of the extracellular protein LCN2 in the serum may be a biomarker for early detection in NT1D patients.
In this present study, we have identified nine possible key extracellular-related genes associated with the occurrence and progression of NT1D and verified four of the most relevant genes by another online dataset. These key extracellular-related genes represent preliminary findings and may be potentially applied to clinical testing in the future. For example, the identified extracellular proteins (LCN2, IFNG, TNF, MMP9, etc.) could be developed into non-invasive diagnostic tests, such as enzyme-linked immunosorbent assays (ELISA) or other immunoassays, to detect these proteins in blood or urine samples for earlier NT1D diagnosis compared to current methods relying on hyperglycemia detection. Combining these biomarkers with traditional screening tools (e.g., autoantibodies) could enhance diagnostic accuracy and improve risk stratification. Additionally, TNF, IFNG, and MMP9, which were found to increase in hyperglycemia, may serve as prognostic indicators for disease progression and metabolic instability, helping clinicians assess the risk of complications such as diabetic ketoacidosis or hypoglycemia. Therapeutic strategies targeting these proteins, such as anti-TNF therapy, could modulate the autoimmune response and potentially slow disease progression, while targeting MMP9 or IFNG might help mitigate hyperglycemia and inflammation. Finally, regular monitoring of LCN2 levels could further assist in evaluating treatment response and adjusting therapies to prevent hypoglycemic episodes, paving the way for more personalized therapeutic interventions.
However, implementing these biomarkers faces challenges, including the need for validation in larger, diverse populations to ensure reproducibility, as the small sample size limits applicability. Regulatory hurdles involve approvals and developing cost-effective, sensitive assays for routine use. Variability in expression across individuals and disease stages may require multi-marker panels for accuracy. Integrating these biomarkers will also require workflow adjustments, training, and tools to help clinicians interpret complex profiles alongside autoantibody screening. Our study offers a promising starting point for identifying extracellular biomarkers to enhance NT1D diagnosis, prognosis, and management. While our study identifies LCN2, IFNG, TNF, and MMP9 as potential biomarkers and contributors to NT1D pathogenesis, further in vitro and in vivo experiments are necessary to validate their biological roles. Such studies will help confirm their functional relevance, clarify the mechanisms by which they influence β-cell dysfunction and immune activation, and assess their potential as therapeutic targets.
Yet, our research still has several limitations that warrant attention. First, the use of statistical and bioinformatic analyses with relatively lenient filter criteria may have influenced the identification of key genes, highlighting the need for further studies with stricter filtering thresholds. While the study utilized publicly available GEO datasets, data quality was ensured by applying rigorous preprocessing steps, including normalization and batch effect correction, to minimize technical variability; however, potential biases inherent to public datasets, such as sample selection bias or inconsistent experimental conditions, must be acknowledged, warranting cautious interpretation and further validation through independent cohorts. Additionally, the relatively small sample size and lack of detailed cell-type data limit the generalizability of our findings, emphasizing the importance of larger, more comprehensive datasets. Expanding the sample size will also help address potential variability across patient subgroups and strengthen the reliability of the identified biomarkers for NT1D diagnosis and prognosis. Furthermore, the key genes identified among the EP-DEGs require validation through well-designed intervention experiments to confirm their biological relevance. Finally, the key genes can be reliably serve as predictors or therapeutic targets for NT1D remains uncertain and to be further studied.
Conclusion
Our study identified potential crucial genes,which involved in immune and metabolic pathways and plays critical roles in β-cell dysfunction and immune activation. Elevated levels of LCN2, IFNG, TNF, and MMP9 are linked to glucose instability and inflammation, offering new insights into NT1D pathogenesis. Further validation is needed to confirm their potential for personalized diagnostics and therapeutic targets.
Supplemental Information
The results of Gene Ontology (GO) enrichment analysis for Biological Processes (BP) associated with the identified extracellular genes in newly diagnosed Type 1 Diabetes.
The results of Gene Ontology (GO) enrichment analysis for Cellular Components (CC) associated with the identified extracellular genes in newly diagnosed Type 1 Diabetes.
The results of Gene Ontology (GO) enrichment analysis for Molecular Functions (MF) associated with the identified extracellular genes in newly diagnosed Type 1 Diabetes.
Top10 EP-DEGs by 10 topological analysis methods of CytoHubba in Cytoscape.
The specific protein expression in NT1D and HC serum.
Raw data for the tissue experiments.