
miR-101-3p suppresses proliferation of orbital fibroblasts by targeting pentraxin-3 in thyroid eye disease
- Published
- Accepted
- Received
- Academic Editor
- Gwyn Gould
- Subject Areas
- Biochemistry, Cell Biology, Molecular Biology, Ophthalmology
- Keywords
- Thyroid eye disease, Orbital fibroblasts, MiR-101-3p, Pentraxin-3, Proliferation, Apoptosis
- Copyright
- © 2024 Zhu et al.
- Licence
- This is an open access article distributed under the terms of the Creative Commons Attribution License, which permits using, remixing, and building upon the work non-commercially, as long as it is properly attributed. For attribution, the original author(s), title, publication source (PeerJ) and either DOI or URL of the article must be cited.
- Cite this article
- 2024. miR-101-3p suppresses proliferation of orbital fibroblasts by targeting pentraxin-3 in thyroid eye disease. PeerJ 12:e18535 https://doi.org/10.7717/peerj.18535
Abstract
Background
Excessive proliferation of orbital fibroblasts (OFs) is an essential factor in the pathogenesis of thyroid eye disease (TED). While existing evidence indicates that various microRNAs (miRNAs) significantly contribute to TED development, the precise function and targets of miR-101-3p in TED pathogenesis remain unknown. This research aims to elucidate the effects of miR-101-3p on TED-OFs and identify its potential targets.
Methods
Orbital adipose tissues were harvested from both TED patients and healthy controls to culture their fibroblasts. MiR-101-3p mimic or mimic negative control (mimic NC) was transfected into OFs from TED patients, with untreated OFs serving as an additional blank control group. Cell proliferation was assessed using cell counting kit-8 (CCK-8) assay, Ki-67 immunofluorescence staining, and the EdU assay, while apoptosis was evaluated via flow cytometry. Quantitative real-time polymerase chain reaction (qRT-PCR) was employed to measure the expression levels of miR-101-3p and pentraxin-3 (PTX3), and PTX3 protein levels were quantified using western blot. A dual-luciferase assay was conducted to ascertain how miR-101-3p and PTX3 interacted.
Results
The results demonstrated a significant downregulation of miR-101-3p in fibroblasts and TED orbital adipose tissues. Transfection with the miR-101-3p mimic upregulated miR-101-3p levels, significantly reducing OFs proliferation without affecting apoptosis. Overexpression of miR-101-3p led to the downregulation of PTX3 in OFs. The dual-luciferase assay validated miR-101-3p binding to PTX3’s 3’UTR, thereby repressing its expression. Moreover, overexpression of PTX3 partially rescued the miR-101-3p mimic’s inhibitory effect on TED-OFs proliferation.
Conclusion
Our findings illustrate miR-101-3p’s role in targeting PTX3 to regulate TED-OFs proliferation, providing novel insights into the pathological mechanisms underlying TED development.
Introduction
Thyroid eye disease (TED), also known as Graves’ ophthalmopathy, manifests as an autoimmune orbital disorder and commonly emerges as an extrathyroidal complication of Graves’ disease (Bahn, 2010). Patients typically present with a range of symptoms, such as exophthalmos, eyelid retraction, ocular pain, and restrictive strabismus. Notably, exophthalmos stands out as the principal clinical hallmark of TED, primarily attributed to the swelling of adipose and muscular tissues within the orbit. The edematous alterations result from a complex interplay of mechanisms, involving inflammatory cell infiltration, extracellular matrix accumulation, fibroblast proliferation, and adipose tissue expansion (Longo, Smith & Hegedüs, 2016). In rare cases, approximately 3% to 5% of patients may encounter vision-threatening conditions, like compressive optic neuropathy or exposed corneal ulcers (Wiersinga & Bartalena, 2002). Although significant advancements in elucidating the pathogenesis of TED, a comprehensive understanding of its mechanism remains elusive, presenting ongoing therapeutic challenges and dilemmas (Taylor et al., 2020).
Central to TED complex pathogenesis is the critical role of orbital fibroblasts (OFs), which serve as the primary cellular targets in this disorder (Dik, Virakul & van Steensel, 2016; Marinò et al., 2019). The activation of OFs is a pivotal event in TED pathogenesis, facilitated by interactions with immune cells and their secreted soluble factors (Huang et al., 2019). Upon activation, OFs contribute to the inflammatory milieu by producing inflammatory mediators and demonstrate heightened proliferative activity, as well as efficient synthesis of extracellular matrix components, particularly hyaluronan, thereby facilitating tissue expansion, remodeling, and fibrosis in TED (Bahn, 2010; Patel, Yang & Douglas, 2019). As TED progresses, OFs can further differentiate into adipocytes and myofibroblasts, perpetuating tissue alterations (Dik, Virakul & van Steensel, 2016). Notably, the basal proliferative activity of OFs in TED exceeds that of normal OFs (Kuriyan et al., 2013). Despite recognizing the significance of OFs in TED pathogenesis, the precise mechanisms underlying their involvement and potential as therapeutic targets remain incompletely elucidated.
MicroRNAs (miRNAs), as short and endogenous noncoding RNAs, play a vital role in physiological regulation by modulating the suppression of target mRNA translation and/or enhancing mRNA degradation (Bartel, 2009). Their involvement spans various biological functions, including immune responses, cell proliferation, apoptosis, differentiation, and metabolism (Martínez-Hernández & Marazuela, 2023). Recent epigenetic research highlights miRNAs as pivotal regulatory mediators influencing cellular proliferation (Zhao et al., 2023; Wang et al., 2024), with alterations in their expression tightly linked to fibroblast activation and fibrosis in the heart (Chang et al., 2024), liver (Hao et al., 2024), lung (Park et al., 2024), and kidney (Rajabi et al., 2024). Importantly, multiple miRNAs, including miR-103a-3p (Xie et al., 2023), miR-146a (Jang et al., 2018), miR-155 (Woeller et al., 2019), miR-21 (Lee et al., 2016), and miR-1287-5p (Wang et al., 2021), have been implicated in TED development by affecting OFs proliferation. In a prior microarray profiling study of peripheral blood mononuclear cells from TED patients (Liu et al., 2023), miR-101-3p was identified as significantly dysregulated, making it a compelling candidate for further investigation.
Our decision to focus on miR-101-3p is supported by several key findings. First, bioinformatic network analysis using the miRDB and TargetScan databases predicted pentraxin-3 (PTX3) as a potential target gene of miR-101-3p. PTX3, an acute-phase protein integral to innate immunity, inflammatory responses, and tissue remodeling (Zhang et al., 2022), belongs to the long pentraxin family and is expressed across various cell types, including human fibroblasts (Wang et al., 2015). Recent studies have highlighted PTX3’s involvement in TED, a condition where PTX3 functions as a thyroid-stimulating hormone (TSH)-inducible protein within OFs (Wang et al., 2015). TSH receptor signaling in these fibroblasts triggers a complex cascade of molecular events, ultimately influencing cellular behaviors such as growth, proliferation, and extracellular matrix production (Khong et al., 2016). In our prior research, elevated PTX3 levels have been observed in orbital tissues and fibroblasts obtained from TED patients (Wang et al., 2015; Mou et al., 2018), suggesting its involvement in TED-related fibrosis (Diao et al., 2020). Given the pivotal role of PTX3 in TED, miR-101-3p was hypothesized to act as a key regulator of PTX3 expression in OFs, thereby modulating proliferative and fibrotic activities.
Furthermore, miR-101-3p has been extensively studied in other diseases, where it has been shown to regulate critical cellular processes such as proliferation, apoptosis, and fibrosis (Xu et al., 2024; Fu, Ye & Hu, 2024; Lämmerhirt et al., 2024). For example, miR-101-3p plays an important role in the regulation of fibrosis in organs like the kidney (Song et al., 2022), lung (Li et al., 2022), and liver (Meroni et al., 2019), where its dysregulation contributes to pathological tissue remodeling. These findings further support the potential relevance of miR-101-3p in TED, as fibroblast activation and fibrosis are key features of the disease.
Although miR-150 has been reported to influence endothelial cell proliferation and migration by targeting PTX3 (Luo et al., 2018), the mechanisms underlying the combined involvement of PTX3 and miRNAs in TED progression remain unknown. Therefore, the current study aims to investigate the role of miR-101-3p in TED pathogenesis, focusing on its ability to regulate PTX3 expression and its impact on OFs proliferation. Through this research, we seek to uncover novel molecular mechanisms underlying TED and explore miR-101-3p as a potential therapeutic target for the condition.
Materials and methods
Source of samples
All surgical procedures were performed at Changzheng Hospital’s Department of Ophthalmology in Shanghai, China. The study included 10 patients diagnosed with TED (F/M = 5/5, mean age 44.9 ± 12.7 years) who underwent orbital decompressive surgery. These patients were in a stage ranging from moderate to severe or even sight-threatening, with Clinical Activity Scores (CAS) below 3, and had not received glucocorticoid therapy for at least 6 months prior to decompression. Additionally, the control group consisted of 10 healthy volunteers (F/M = 4/6, mean age 43.2 ± 21.8 years) who had blepharoplasty. None of the control subjects had a history of autoimmune thyroid disease or TED. Comprehensive patient details can be found in Table 1. The study protocol was approved by the Committee on Ethics of Biomedicine, Naval Medical University, and we received written informed consent from all participants in the study.
| Age, y/Sex | Duration of TED, y |
Proptosis (R/L), mm |
Smoking | CAS | Disease stage | Surgical treatment |
|---|---|---|---|---|---|---|
| Patients with TED | ||||||
| 49/F | 3.2 | 19/19 | No | 1/7 | Moderate to severe | Orbital decompression |
| 30/M | 3.4 | 18/19 | Previous | 2/7 | Moderate to severe | Orbital decompression |
| 47/F | 2 | 24/23.5 | No | 1/7 | Moderate to severe | Orbital decompression |
| 27/M | 5.8 | 25/23.5 | Previous | 1/7 | Moderate to severe | Orbital decompression |
| 41/M | 2 | 20/24.5 | Previous | 1/7 | Moderate to severe | Orbital decompression |
| 45/F | 2.8 | 20/19 | No | 2/7 | Moderate to severe | Orbital decompression |
| 66/F | 1.6 | 13/15 | No | 2/7 | Sight-threatening | Orbital decompression |
| 32/F | 15 | 22/20 | No | 0/7 | Moderate to severe | Orbital decompression |
| 53/M | 2 | 26/27 | Previous | 0/7 | Moderate to severe | Orbital decompression |
| 59/M | 1 | 16/17 | Previous | 2/7 | Moderate to severe | Orbital decompression |
| Control patients | ||||||
| 32/F | — | — | No | — | — | Eyelid pouch plasty |
| 53/M | — | — | Previous | — | — | Eyelid pouch plasty |
| 19/F | — | — | No | — | — | Upper lid blepharoplasty |
| 62/M | — | — | Previous | — | — | Eyelid pouch plasty |
| 18/M | — | — | No | — | — | Upper lid blepharoplasty |
| 23/M | — | — | No | — | — | Upper lid blepharoplasty |
| 72/F | — | — | No | — | — | Upper lid blepharoplasty |
| 70/F | — | — | No | — | — | Upper lid blepharoplasty |
| 25/M | — | — | No | — | — | Upper lid blepharoplasty |
| 58/M | — | — | Previous | — | — | Upper lid blepharoplasty |
Note:
CAS is a total of 7 points. L, left; R, right; F, female; M, male.
Cell culture
OFs were cultured following established protocols (Sorisky et al., 1996). Briefly, orbital adipose tissues were mechanically cut into 2 × 2 × 2 mm fragments and evenly distributed in 10-cm petri dishes. Following tissue adherence, OFs were grown in high-glucose DMEM (Gibco, Waltham, MA, USA) containing 20% FBS, 100 mg/L streptomycin, and 100 U/mL penicillin. Typically, OFs migrated from the tissue explants within 5 days and achieved confluence within 10 days. Subsequently, monolayer cells were passaged with 0.25% trypsin/EDTA (Gibco, Waltham, MA, USA) to establish a continuous cell line. The incubation conditions were set at 37 °C with 5% CO2 and high humidity to support fibroblast growth. To ensure a constant cell phenotype, three to eight passage cells were used for the subsequent experiments. Each experiment included at least three independent lines of OFs.
Immunofluorescence staining
Cells were seeded on sterile slides in a 24-well plate until the desired confluency was reached. They were then fixed for 15 min with 4% paraformaldehyde and permeabilized for 10 min using 0.1% Triton X-100 (Merck Millipore, MA, USA) in PBS. After blocking with 3% BSA for 30 min, the cells were incubated overnight at 4 °C with primary antibodies. For Ki-67 staining, a primary anti-Ki-67 antibody (Servicebio, Wuhan, China) was used, followed by 1 h incubation at room temperature in the dark with Alexa Fluor 488-conjugated goat anti-mouse IgG (Servicebio, Wuhan, China). Similarly, for vimentin staining, a primary anti-vimentin antibody (Servicebio, Wuhan, China) was used, followed by Alexa Fluor 488-conjugated goat anti-rabbit IgG (Servicebio, Wuhan, China) under the same conditions. Nuclear staining was achieved using mounting medium with DAPI. Fluorescence microscopy (Nikon, Tokyo, Japan) was utilized to examine and capture images of the stained cells, and the number of Ki-67 positive cells was quantified to assess cell proliferation.
Cell transfection and treatment
In our study, miR-101-3p mimic and mimic negative control (mimic NC) were procured from GenePharma (Shanghai, China). At a concentration of 2 × 10⁵ cells per well, cells in the exponential growth phase were carefully seeded onto 6-well plates and allowed to incubate for 24 h before transfection. Lipofectamine™ 2000 (Invitrogen, Carlsbad, CA, USA) was employed for the transfection process, following the manufacturer’s protocols precisely. After a 48 h transfection period, we assessed the gene and protein expression profiles in OFs, as well as cell proliferation. The transfection dosage for both the mimic and mimic NC was standardized at 50 nM to ensure optimal transfection efficiency. For recombinant human PTX3 (rhPTX3) (Abcam, Cambridge, UK) treatment, fibroblasts were exposed to 200 ng/mL rhPTX3 in DMEM supplemented with 10% FBS for 24 h.
Quantitative real-time polymerase chain reaction (qRT-PCR)
RNA extraction from tissues or cells was performed using TRIzol reagent (Thermo Fisher Scientific, Waltham, MA, USA), adhering closely to the manufacturer’s protocols. RNA concentration and purity were measured through the Nanodrop 2000 spectrophotometer (Thermo Fisher Scientific), ensuring the integrity of subsequent analyses. MiR-101-3p expression levels were examined using the miRNA qRT-PCR detection kit (A2030A001; Biotnt, Shanghai, China), with U6 snRNA serving as the internal reference. Reverse transcription of PTX3 and GAPDH mRNA was executed using the SuperScript® II Reverse Transcriptase kit (Invitrogen, Carlsbad, CA, USA). Subsequently, PTX3 mRNA levels were detected using the SYBR Green PCR quantitative kit (Invitrogen, Carlsbad, CA, USA), with GAPDH employed as an internal reference. To ensure accuracy and reproducibility, each quantitative PCR reaction was conducted in triplicate. Finally, gene expression levels were calculated utilizing the 2−ΔΔ Ct method, and detailed primer sequences are shown in Table 2.
| Gene name | Sequences (5′ to 3′) |
|---|---|
| PTX3 | Forward: GGCCGAGAACTCGGATGATT |
| Reverse: AGCATGCGCTCTCTCATCTG | |
| GAPDH | Forward: GTCTTCACCACCATGGAGAA |
| Reverse: TAAGCAGTTGGTGGTGCAG | |
| miR-101-3p | Forward: CCCTACAGTACTGTGATAACTGAA |
| Reverse: TCAACTGGTGTCGTGGA | |
| U6 | Forward: GCTTCGGCAGCACATAT |
| Reverse: ATTTGCGTGTCATCCTTG |
Western blot assay
Western blot analysis for PTX3 and β-actin was conducted following established protocols (Wang et al., 2015). Quantitative assessment of the Western blots was carried out with Image J software, using β-actin as an internal reference for normalization. We used antibodies purchased from Abcam (Cambridge, UK), specifically the anti-PTX3 antibody (ab125007) and the anti-β-actin antibody (ab8226), to ensure reliability and reproducibility.
5-ethyl-2′-deoxyuridine (EdU) assay
EdU reagents conjugated to Alexa Fluor 594 (Beyotime, Shanghai, China) were used. Cells (2 × 10⁵ per well) were seeded in 6-well plates and incubated overnight at 37 °C with 5% CO2. The following day, cells were treated with 10 μM EdU and incubated for 2 h to allow for EdU incorporation during DNA synthesis. After incubation, cells were washed three times using the provided wash buffer to remove any residual EdU reagent. EdU detection was performed following the manufacturer’s protocol, utilizing the click chemistry reaction to label incorporated EdU with a fluorescent dye. The cells were counterstained with DAPI to visualize nuclei. Fluorescent microscopy was used to capture images, and the proportion of EdU-positive cells was calculated relative to total DAPI-stained cells.
Cell counting kit-8 (CCK-8) assay
After transfection as detailed previously, each cohort of OFs in the exponential growth phase was gathered and distributed into 96-well plates at a density of 2 × 10³ cells per well. Cultivation ensued under standard conditions at 37 °C with 5% CO2. Each experimental condition was replicated in six duplicate wells. Subsequently, cells were cultured for 0, 24, 48, and 72 h. At each specified time point, 10 μL of CCK-8 reagent (Dojindo, Kumamoto, Japan) was added to each well, followed by a 2 h incubation at 37 °C. Optical density (OD) value measurements of each well were then recorded at 450 nm utilizing a microplate reader (MD2; Molecular Devices, San Jose, CA, USA). The resulting cell growth curve was subsequently plotted with time on the x-axis and OD values on the y-axis.
Flow cytometry
Following digestion, the cells were fixed for 2 h at 4 °C using 70% ethanol. After fixation, cells were centrifuged at 1,500 rpm for 5 min with 1 mL PBS, then washed twice. The cells were then again suspended in 100 μL of 1×Binding Buffer that had been chilled ahead. Each tube of cells was supplemented with 5 μL of Annexin V-APC and 5 μL of 7-AAD (Annexin V-APC/7-AAD Apoptosis Detection Kit; Keygen, Shanghai, China), the mixture was carefully mixed and the tubes were incubated for 15 min at room temperature in the dark. After incubation, 400 μL of 1×Binding Buffer that had been chilled ahead was added to each tube. The samples were then analyzed utilizing a NovoCyte 2060R flow cytometer (ACEA Biosciences, Hangzhou, China). Data analysis categorized the cells into live, dead, early apoptotic, and late apoptotic populations, allowing for comparative analysis of apoptotic cell percentages under various experimental conditions.
Bioinformatics analysis
Bioinformatics analysis serves as a powerful tool for studying miRNA functions. Employing the miRDB (http://www.mirdb.org/) and TargetScan database (https://www.targetscan.org/vert_80/), the binding sites of miR-101-3p within the PTX3 3’UTR were predicted.
Dual-luciferase assay
Based on bioinformatics predictions, the binding sites’ wild-type (WT) and mutant (MUT) sequences (PTX3 3’UTR-WT and PTX3 3’UTR-MUT) were created, synthesized, and cloned into a luciferase reporter vector (OBiO Tech, Shanghai, China). Following that, 293T cells were co-transfected with these constructs and either miR-101-3p mimic (100 nM) or mimic NC (100 nM). Using a dual-luciferase assay kit (Promega, Fitchburg, WI, USA), luciferase activity was assessed after the cells were cultivated 48 h. The relative luciferase activity was assessed by calculating the ratio of Firefly luciferase activity to Renilla luciferase activity, which served as the internal reference.
Statistical analysis
Data analysis and visualization were carried out with GraphPad Prism (version 9; GraphPad Software, La Jolla, CA, USA), with results presented as mean ± standard deviation. Comparisons between two groups were conducted using the t-test, while comparisons among multiple groups were performed using one-way analysis of variance (ANOVA). P < 0.05 was considered statistically significant.
Results
Immunofluorescence detection of orbital fibroblasts
To identify OFs, vimentin antibodies were used and observed with a laser scanning confocal microscope. Under microscopic examination, OFs isolated from human subjects displayed spindle or irregular shapes, a transparent cytoplasm, and a large surface area. The cells were densely packed, exhibiting overlapping growth patterns. Immunofluorescence analysis revealed positive expression of the vimentin antigen in OFs, with a purity exceeding 90% (Fig. 1). These results indicate that the cultured OFs possessed adequate purity for subsequent experimental procedures.
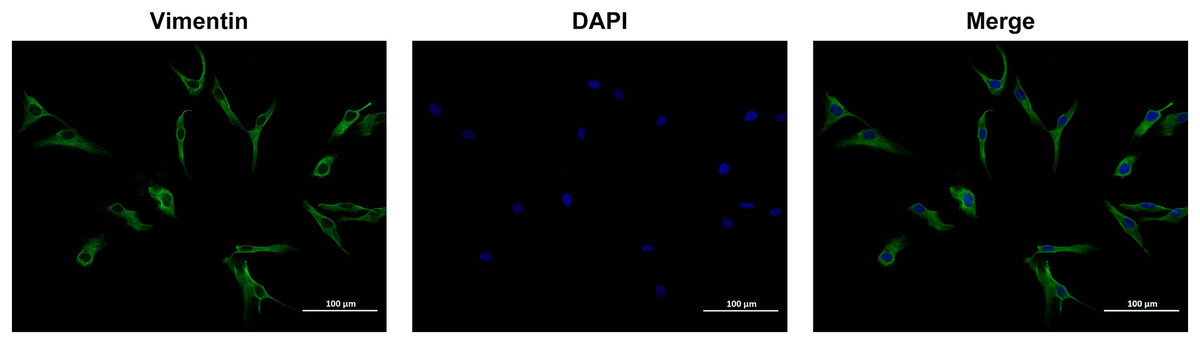
Figure 1: Identification of Vimentin protein by immunofluorescence method.
Images were taken at 200× magnification, scale bars = 100 µm.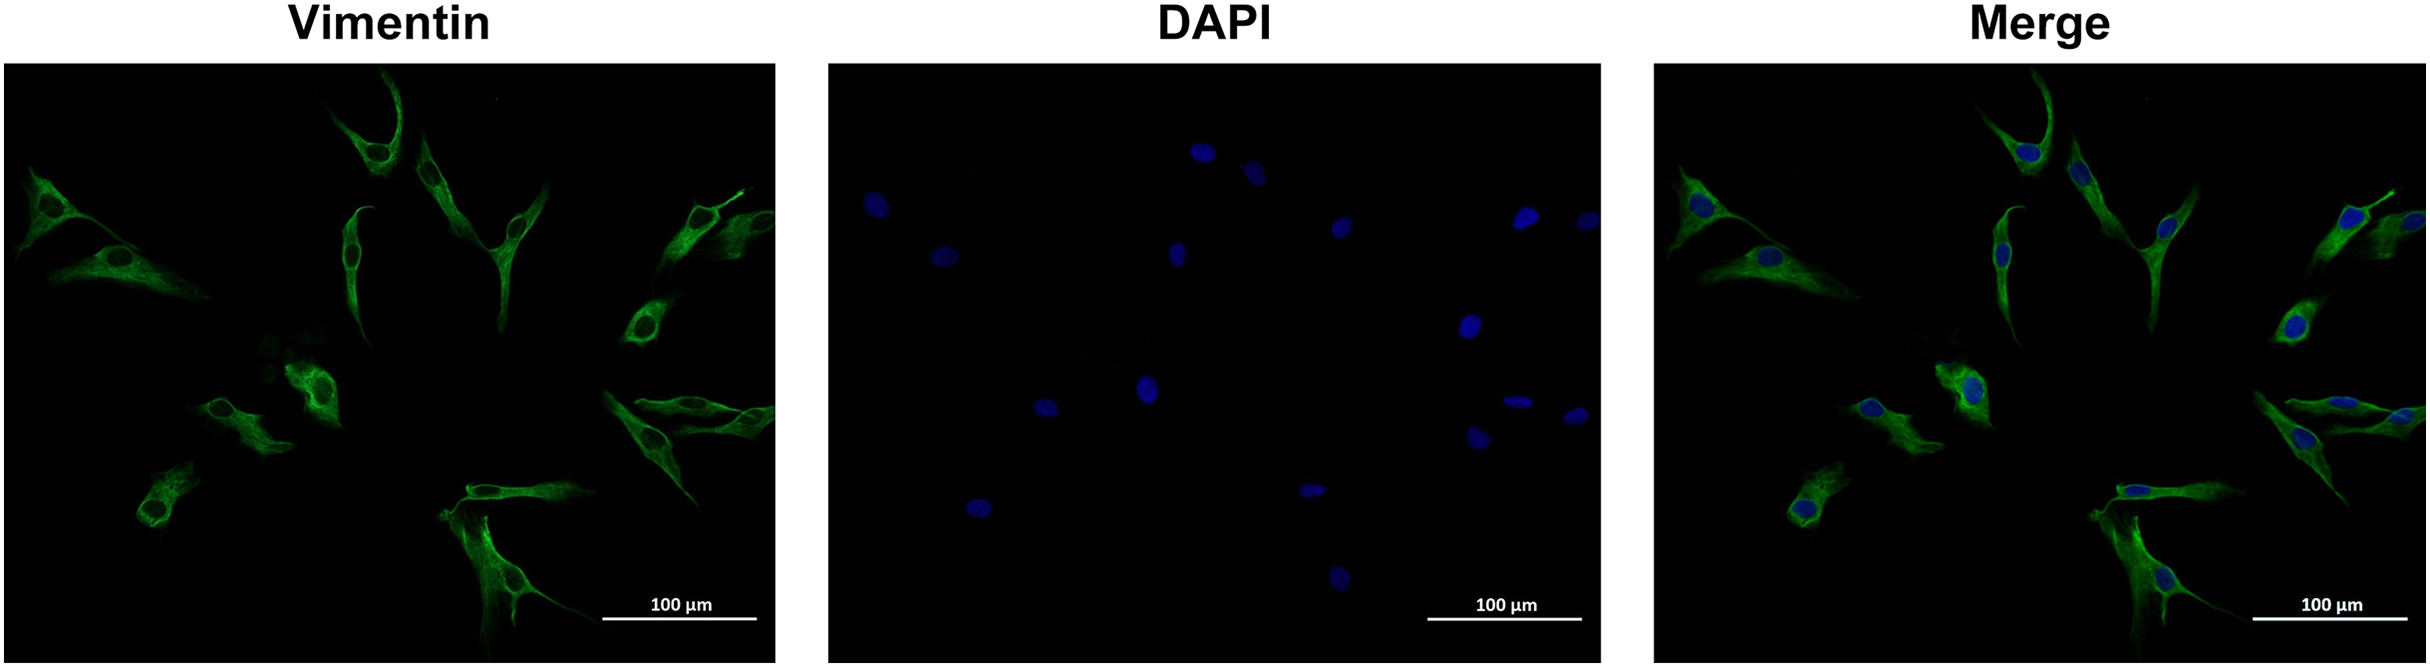
miR-101-3p was notably downregulated in TED orbital adipose tissues and OFs
To validate alterations in miR-101-3p expression within orbital adipose tissues of individuals with TED, we enrolled a cohort of 20 participants, comprising 10 patients diagnosed with TED and 10 healthy controls. Detailed clinical information for these individuals is listed in Table 1. No significant differences in age or gender were observed between the two cohorts. Subsequently, the expression levels of miR-101-3p were assessed using qRT-PCR, revealing a noteworthy reduction in miR-101-3p expression within orbital adipose tissues of TED patients compared to controls (Fig. 2A). Moreover, miR-101-3p expression was evaluated in OFs obtained from normal (n = 6) and TED (n = 6) tissues, exhibiting a consistent downregulation pattern in OFs from TED tissues compared to those from healthy controls (Fig. 2B). Taken together, these findings indicate a marked reduction in miR-101-3p expression within both orbital adipose tissues and OFs derived from individuals with TED.
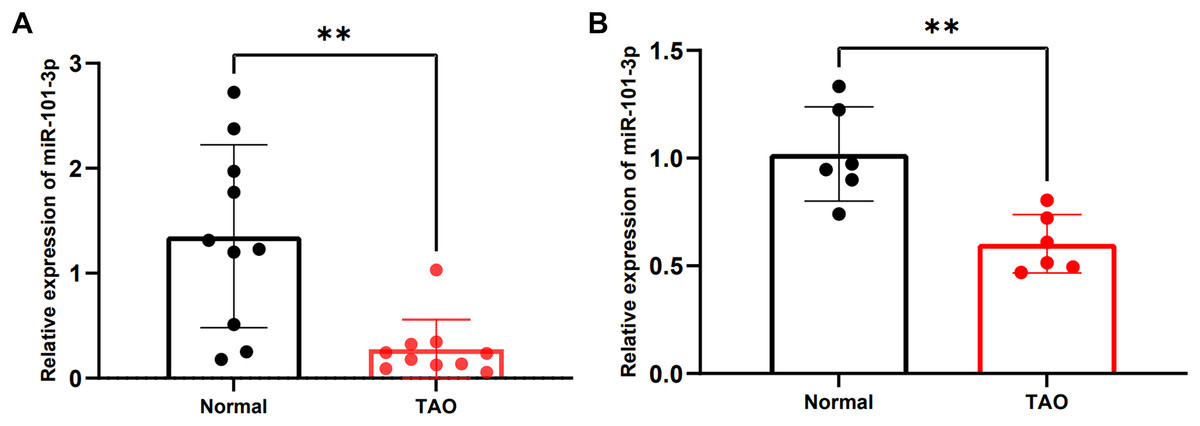
Figure 2: miR-101-3p was notably downregulated in TED orbital adipose tissues and OFs.
(A) miR-101-3p expression was evaluated using qRT-PCR in orbital tissues from 10 TED patients and 10 normal controls. (B) miR-101-3p expression was analyzed in OFs derived from orbital tissues of normal subjects (n = 6) and TED donors (n = 6). Relative quantification was standardized to U6. Data are presented as mean ± SD. **P < 0.01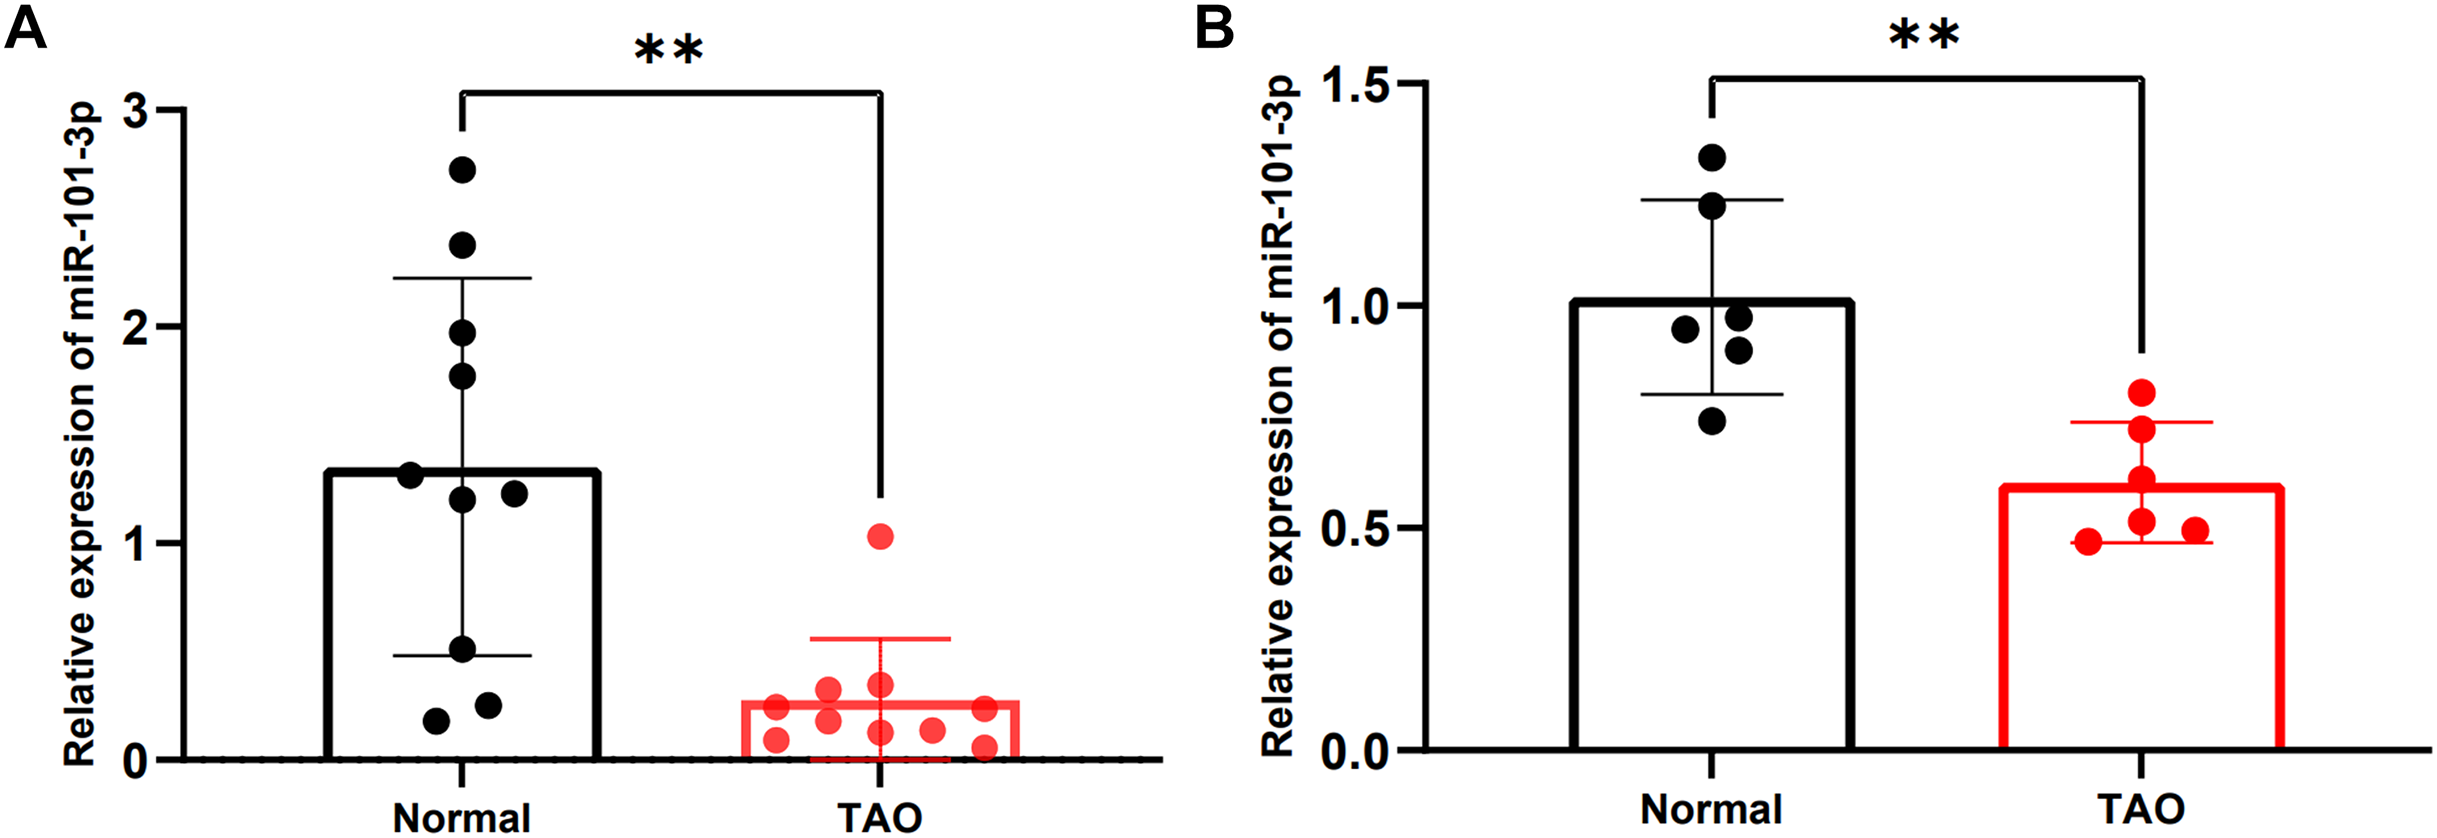
Overexpressed miR‑101‑3p suppressed proliferation of TED-OFs
To assess the impact of miR-101-3p on TED-OFs, cells were transfected with miR-101-3p mimic or mimic NC, and transfection efficiency was confirmed via qRT-PCR, showing a significant increase in miR-101-3p levels in the mimic group (Fig. 3A). Using the CCK-8 assay, a marked decrease in cell viability was observed in the miR-101-3p mimic group (Fig. 3B). Specifically, the mimic NC group, serving as the control, exhibited absorbance values at OD450 nm wavelength of 0.84 ± 0.05, whereas miR-101-3p mimic group displayed values of 0.61 ± 0.04 at 72 h. Furthermore, immunofluorescence analysis was conducted to assess the localization and expression of proliferation marker Ki-67 in cultured OFs. Comparisons showed the proportion of Ki-67-positive cells was notably reduced in the miR-101-3p mimic group, indicating suppressed proliferation (Fig. 3C). To further confirm this effect, an EdU assay was performed, which showed results consistent with the Ki-67 immunofluorescence findings. The EdU-positive cells were notably lower in the miR-101-3p mimic group (Fig. 3D). Finally, to explore whether cell apoptosis correlates with OFs growth inhibition induced by miR-101-3p, we assessed apoptosis in OFs with Annexin V-APC and 7-AAD staining via flow cytometry. Unexpectedly, analysis showed no significant difference in cell apoptosis between those transfected with miR-101-3p mimic and mimic NC group (Fig. 3E). These results suggest that miR-101-3p may act as an inhibitor of TED-OFs proliferation without inducing apoptosis.
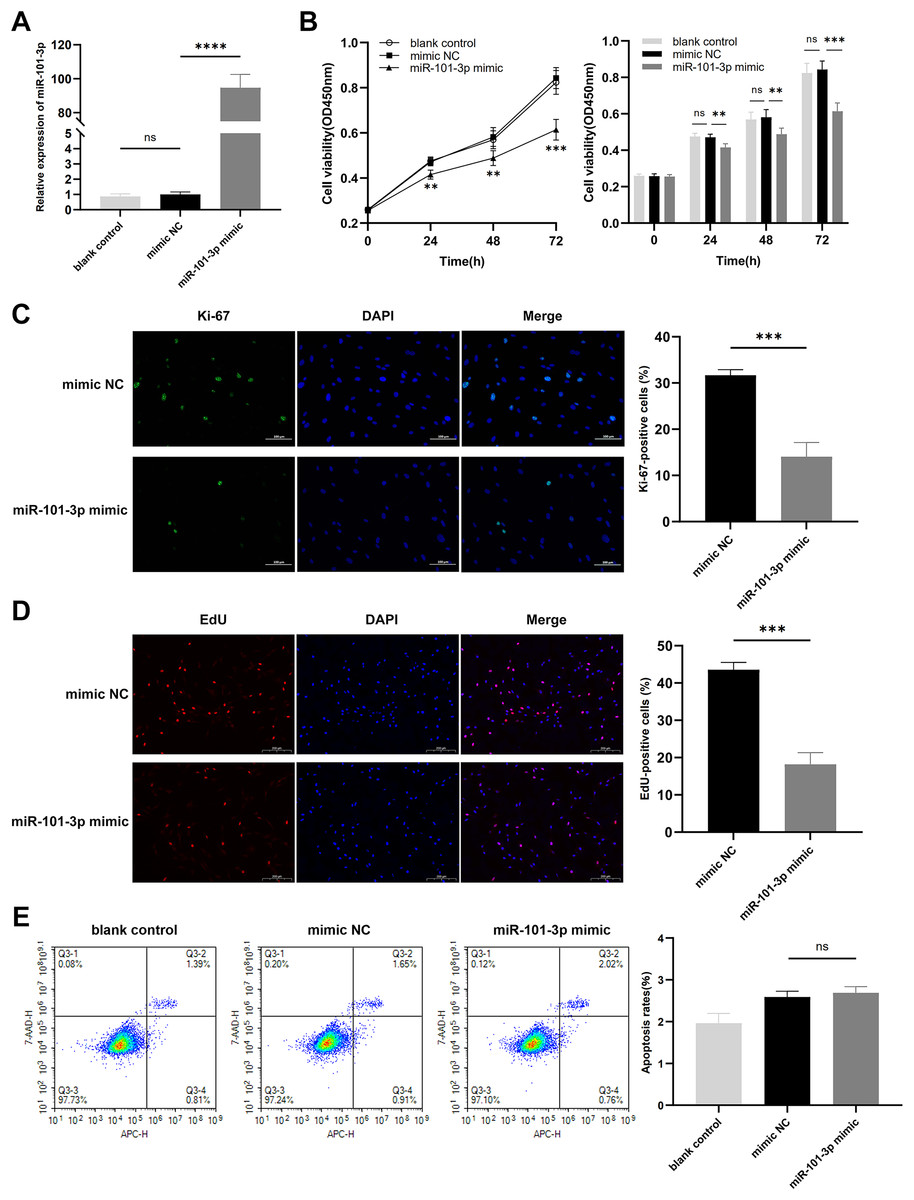
Figure 3: Overexpressed miR‑101‑3p suppressed TED-OFs proliferation without affecting apoptosis.
(A) miR-101-3p overexpression in TED-OFs was confirmed via qRT-PCR after transfection with miR-101-3p mimic. (B) TED-OFs transfected with miR-101-3p mimic were assessed for cell viability using the CCK-8 assay at specified time points. (C) Immunofluorescence staining was used to examine the intranuclear distribution and expression of Ki-67 in TED-OFs. Images were taken at 200× magnification, scale bars = 100 µm. The bar graph shows the mean ratio of Ki-67-positive cells for each group. (D) EdU staining evaluated the proportion of EdU-positive cells in TED-OFs. Images were taken at 200× magnification, scale bars = 200 µm. (E) The impact of miR-101-3p on cell apoptosis was analyzed using flow cytometry. Data are presented as mean ± SD. Three biological replicates, **P < 0.01, ***P < 0.001, ****P < 0.0001, ns was considered as non-significant.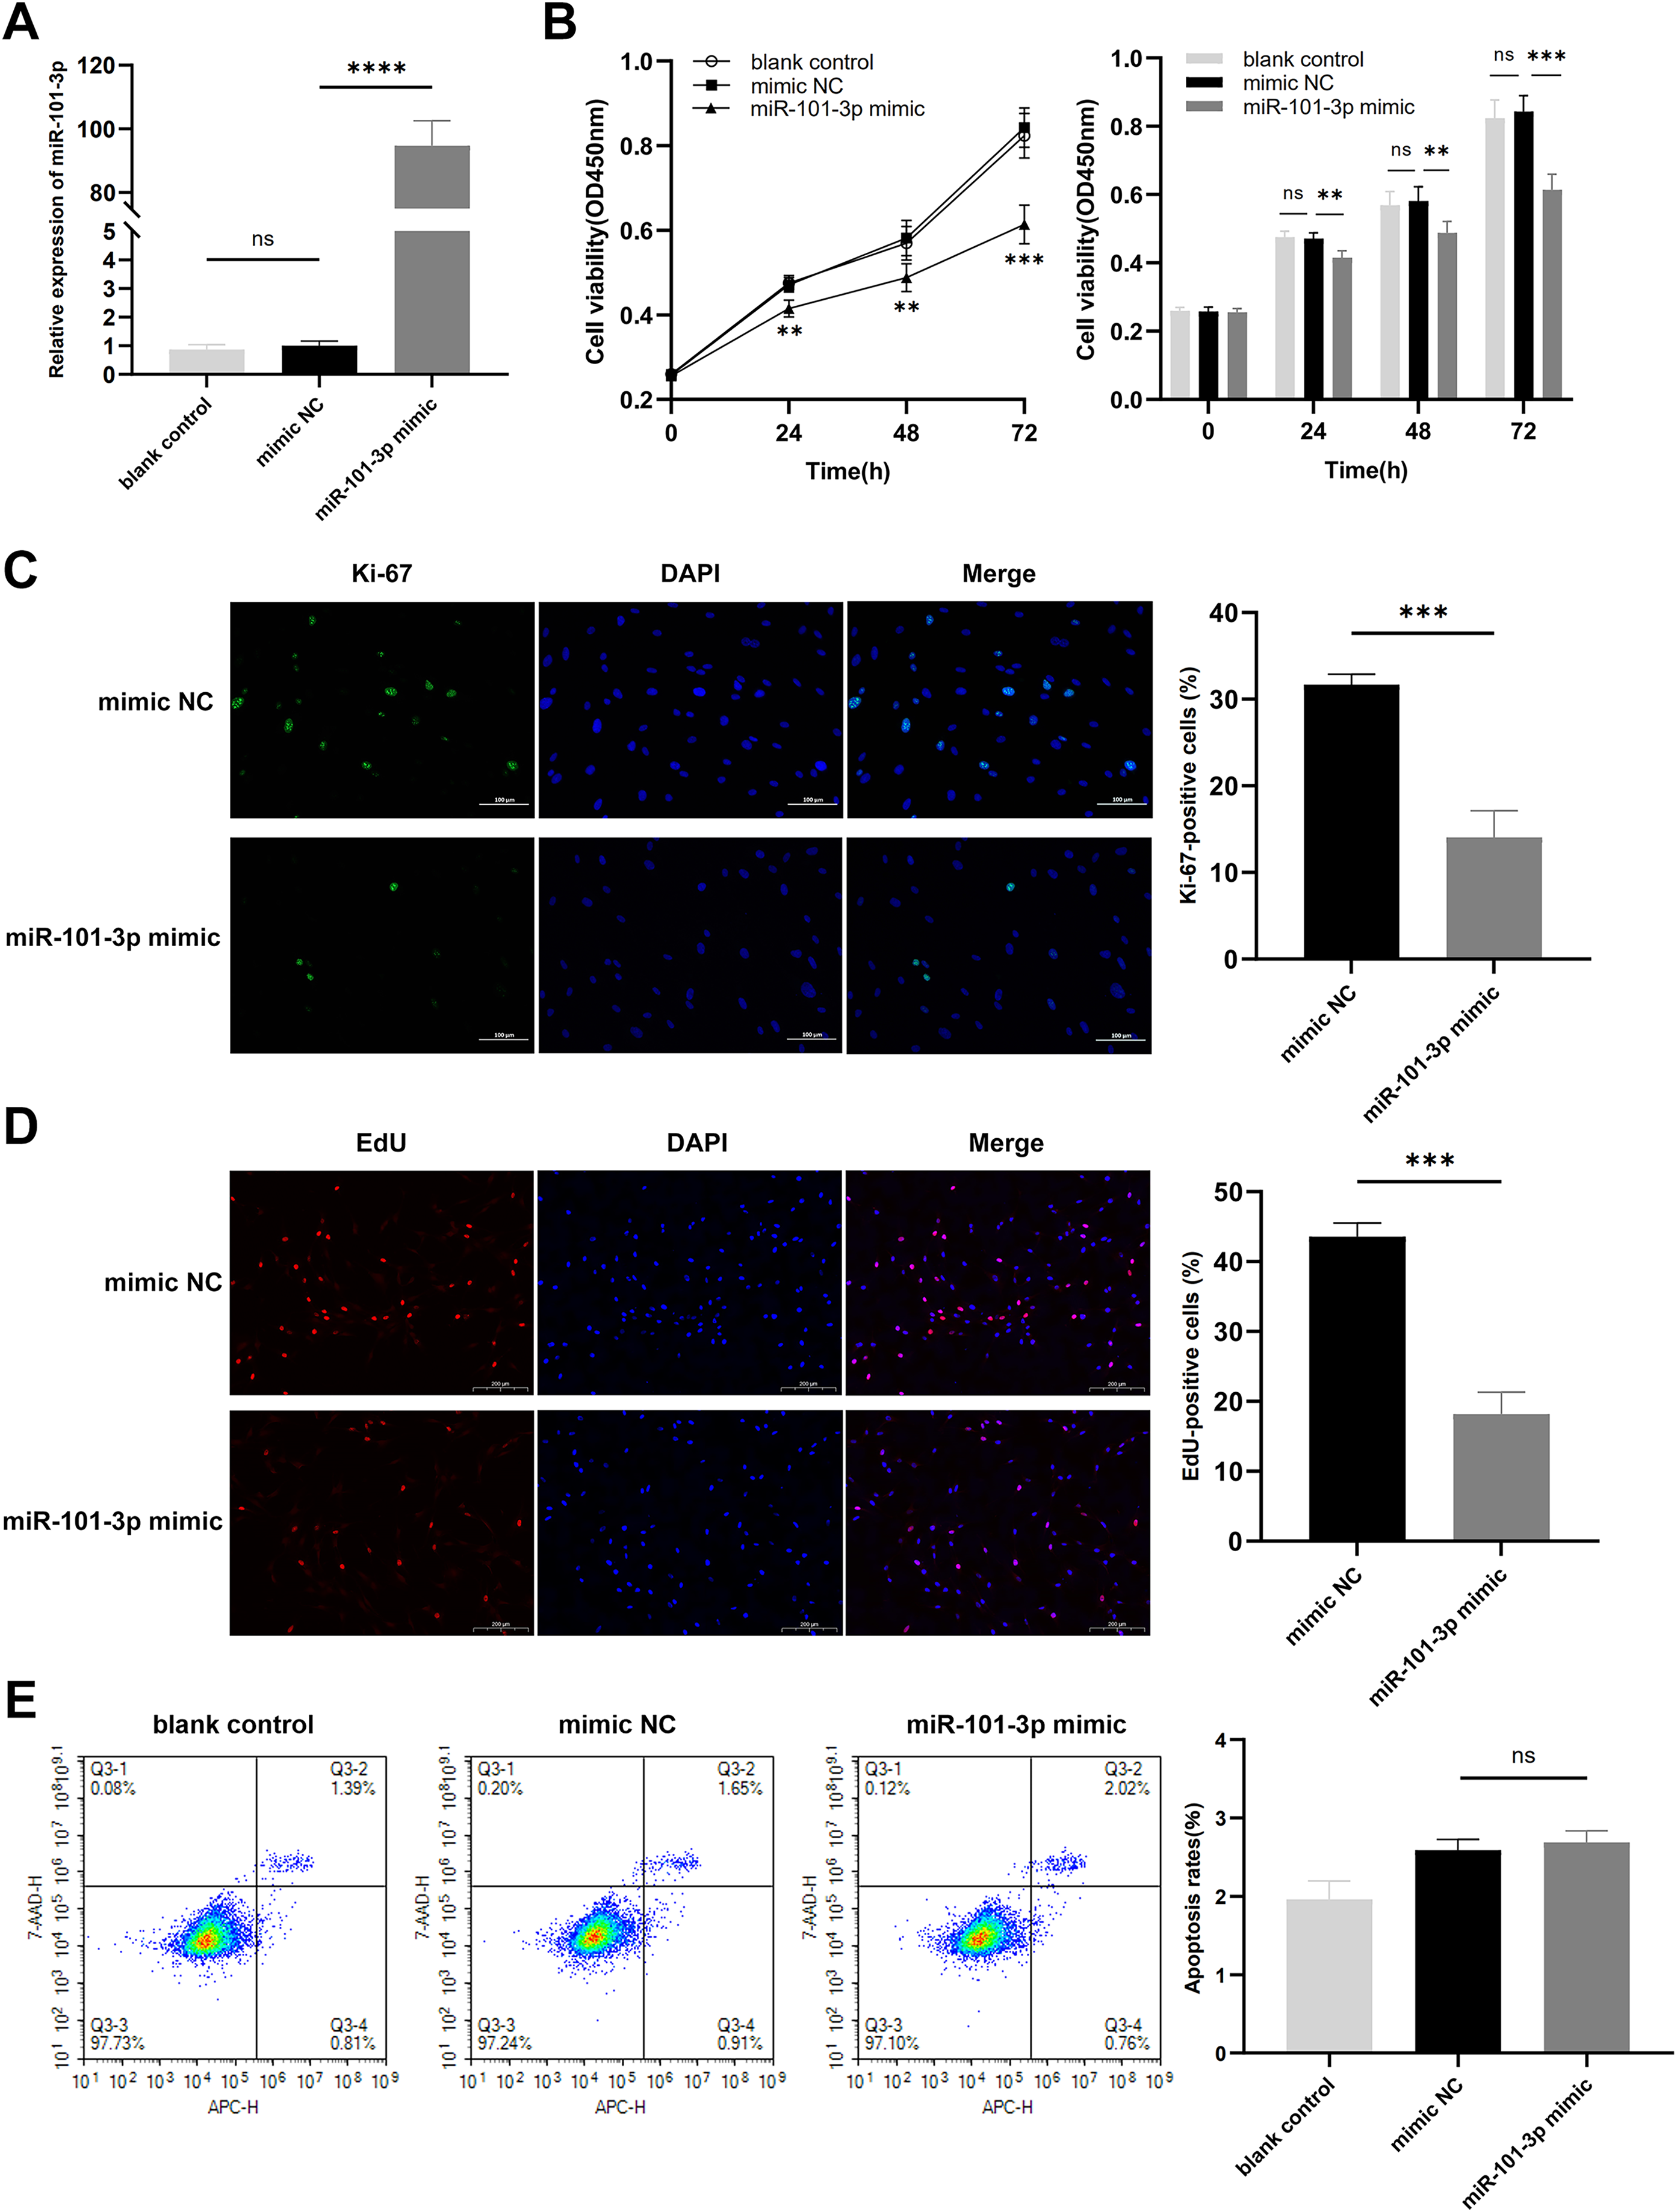
miR-101-3p directly targeted PTX3 and suppressed PTX3 expression
It is widely recognized that miRNAs function by targeting downstream genes. To elucidate the mechanism underlying miR-101-3p involvement in TED pathogenesis, we employed the online tool miRDB and TargetScan to predict its potential targets, identifying a highly conserved binding sequence between miR-101-3p and PTX3 3’UTR among the candidate genes (Fig. 4A). Subsequently, the impact of miR-101-3p on PTX3 mRNA expression and protein levels was investigated. As depicted in Figs. 4B and 4C, transfection with miR-101-3p mimic significantly reduced PTX3 mRNA and protein expression. Additionally, we evaluated PTX3 mRNA expression levels in 10 TED orbital adipose tissues and 10 normal samples, revealing a significant upregulation of PTX3 mRNA expression in TED orbital tissues (Fig. 4D). Furthermore, we observed a negative correlation between PTX3 and miR-101-3p expression in both TED and normal orbital tissues (Fig. 4E). Moreover, PTX3 3’UTR-WT and PTX3 3’UTR-MUT luciferase reporter plasmids were constructed and used in a dual-luciferase assay to confirm the binding of miR-101-3p to PTX3. The results demonstrated that PTX3 3’UTR-WT luciferase activity was significantly suppressed by co-transfection with the miR-101-3p mimic. However, cells co-transfected with the miR-101-3p mimic and PTX3 3’UTR-MUT showed no significant changes in luciferase activity (Fig. 4F). Collectively, these results indicate that miR-101-3p binds to PTX3 and inhibits PTX3 expression.
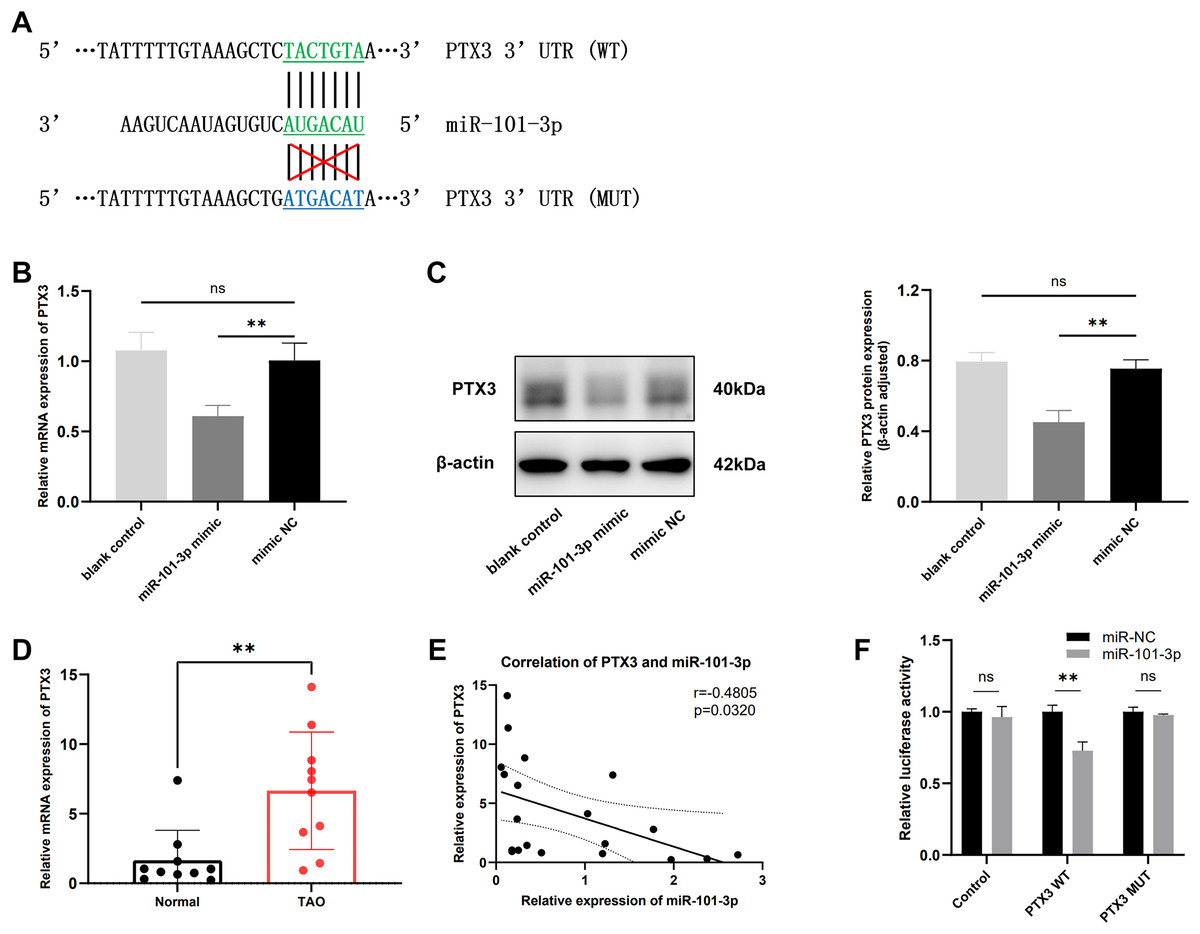
Figure 4: miR-101-3p directly targeted PTX3 and suppressed PTX3 expression.
(A) Interaction of miR-101-3p with PTX3 3’UTR-WT and PTX3 3’UTR-MUT. (B and C) After transfection with miR-101-3p mimic or mimic NC, TED-OFs were analyzed for PTX3 mRNA expression using qRT-PCR and for protein levels using immunoblotting. (D) PTX3 mRNA expression in orbital tissues from both TED patients and normal controls was assessed via qRT-PCR. (E) Pearson’s correlation analysis was used to assess the relationship between PTX3 and miR-101-3p expression in orbital adipose tissues. (F) The dual-luciferase assay indicated that the miR-101-3p mimic reduced luciferase activity when PTX3 3’UTR-WT was co-transfected into 293T cells, but not with the PTX3 3’UTR-MUT vector. Data are presented as mean ± SD. Three biological replicates, **P < 0.01, ns was considered as non-significant.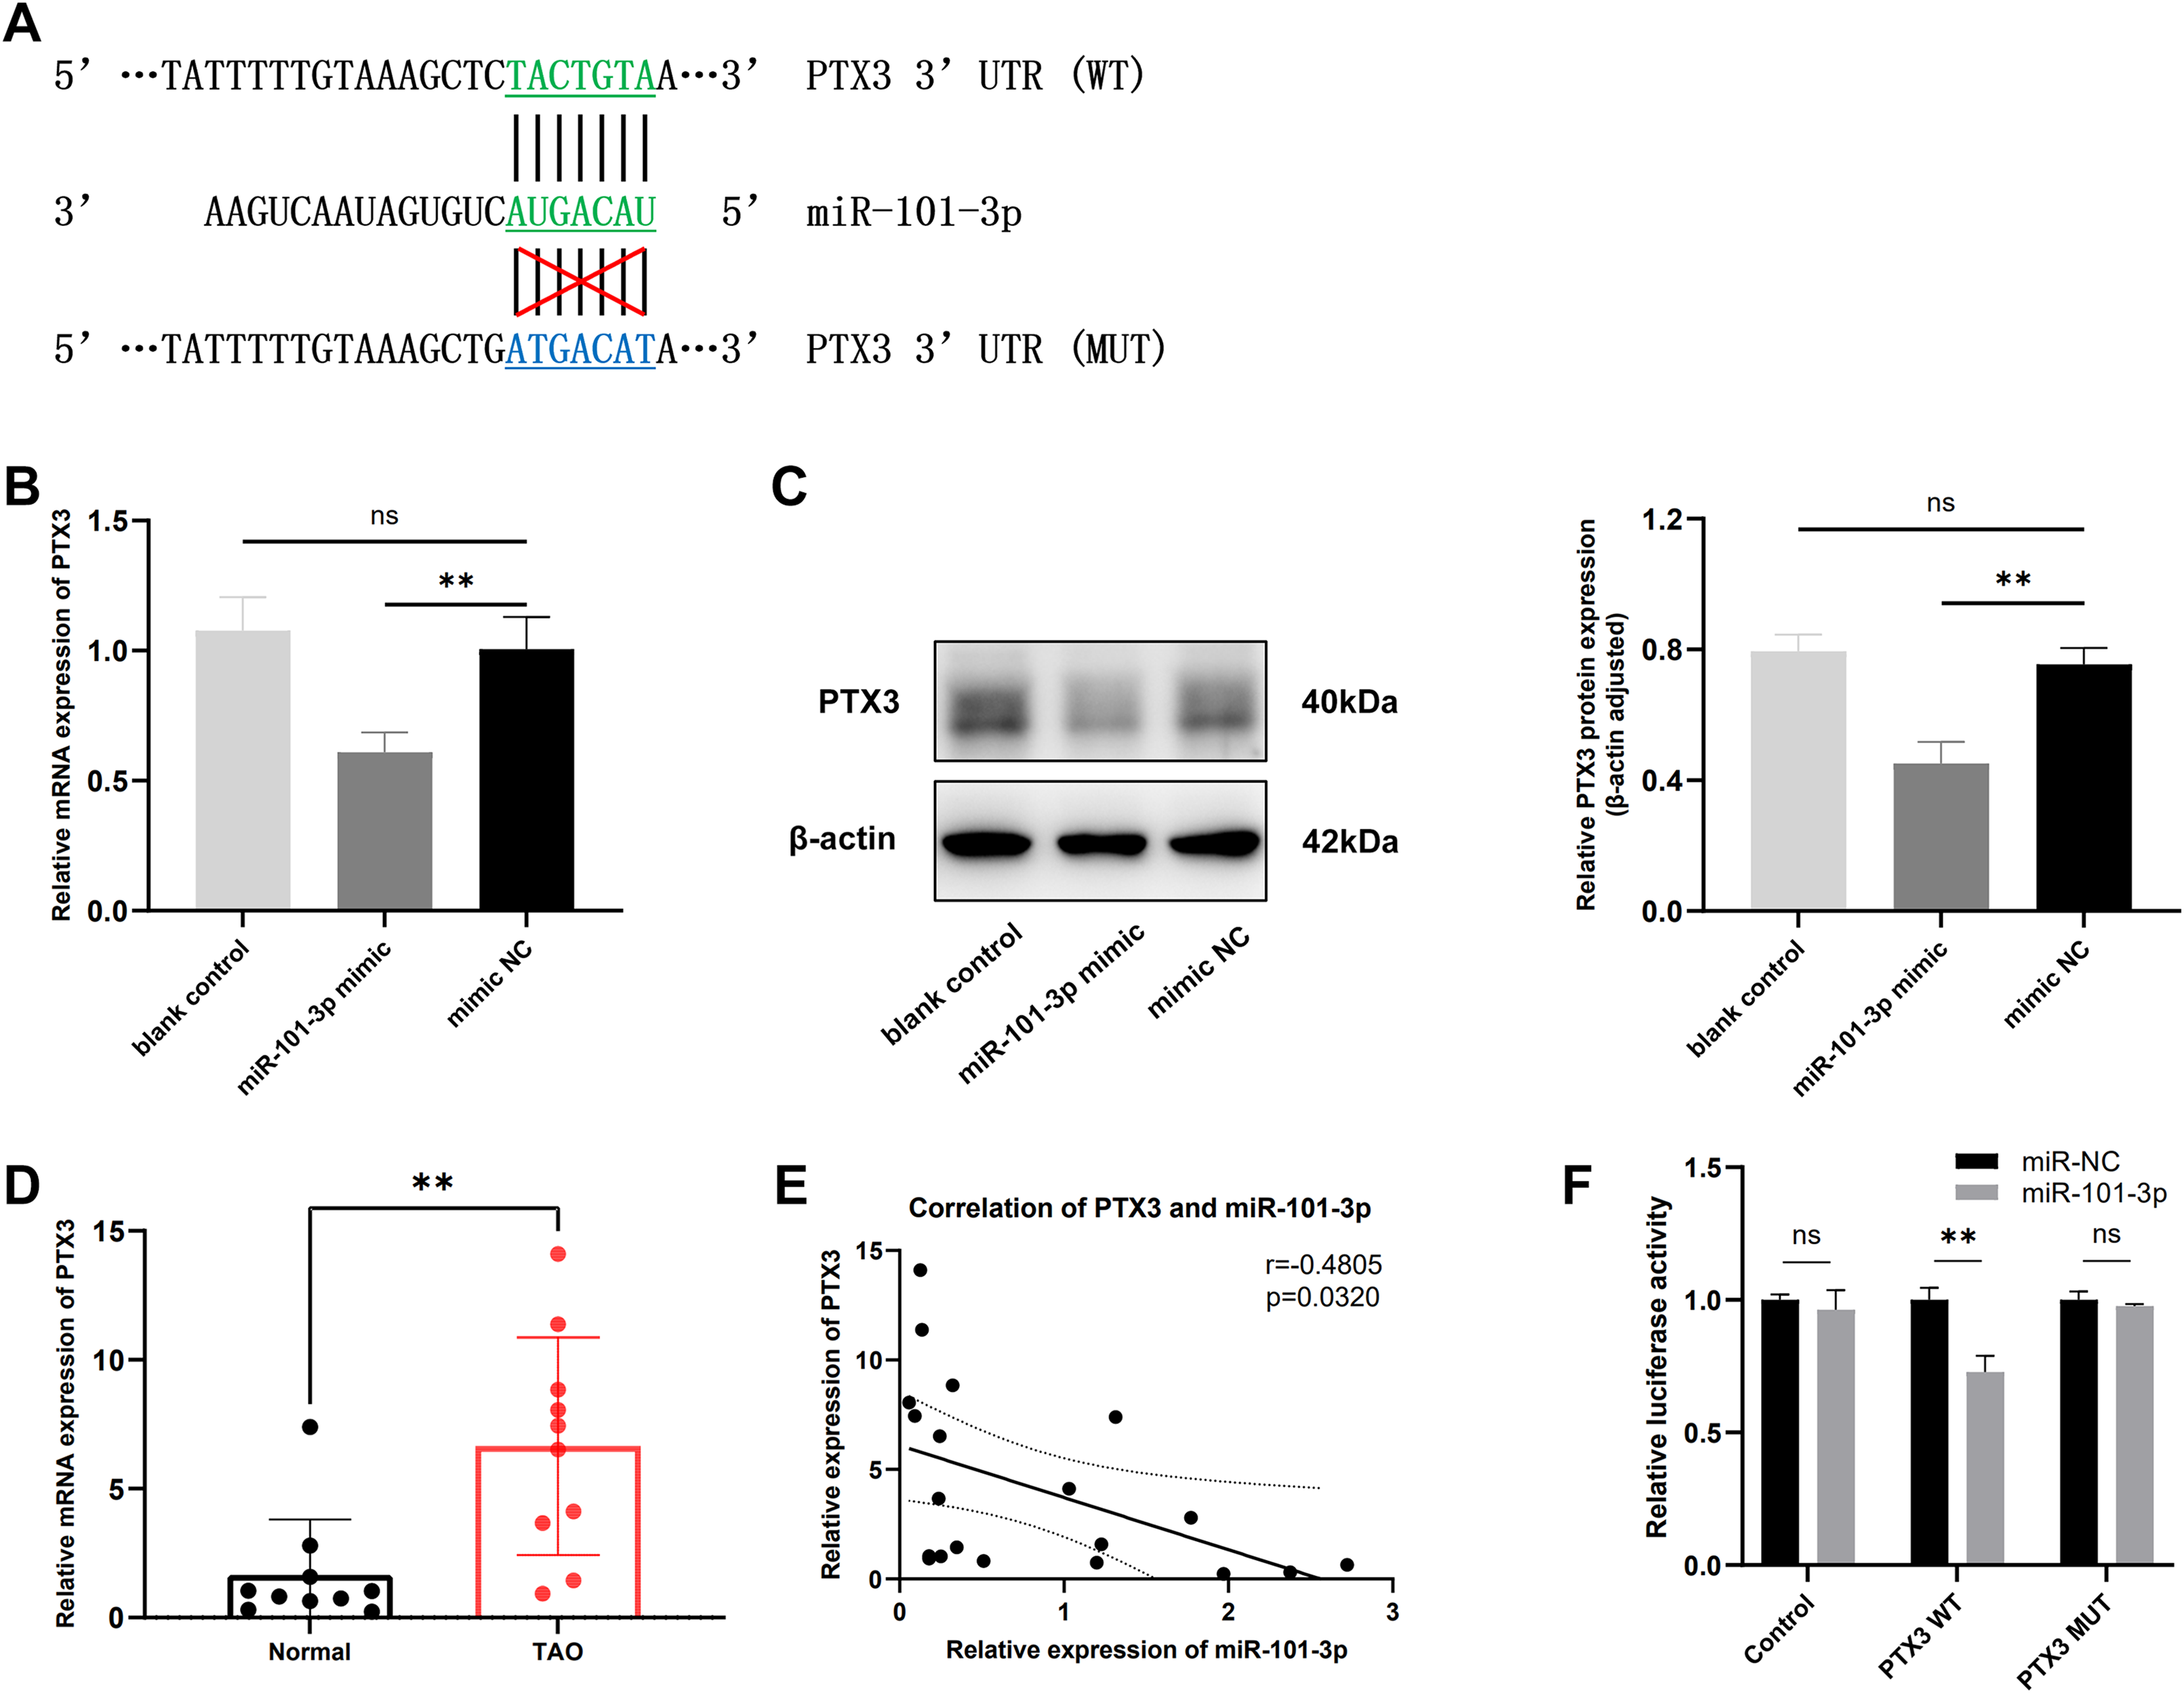
miR-101-3p suppressed TED-OFs proliferation by targeting PTX3
In light of our previous experiments demonstrating the direct modulation of PTX3 by miR-101-3p, we formulated an assumption: miR-101-3p inhibits TED-OFs proliferation by directly targeting PTX3. To test whether overexpression of PTX3 could antagonize the effects of miR-101-3p on cell proliferation, we stimulated miR-101-3p-overexpressing TED-OFs for 24 h with exogenous rhPTX3 (200 ng/mL). As expected, the miR-101-3p mimic reduced PTX3 protein levels, but this effect was reversed upon rhPTX3 treatment, which significantly increased PTX3 expression (Fig. 5A). Importantly, qRT-PCR analysis confirmed that miR-101-3p expression remained similar between the mimic and the mimic+rhPTX3 groups, indicating that rhPTX3 specifically reversed the protein-level effects without altering miR-101-3p expression itself (Fig. 5B). Consistent with earlier findings, CCK-8 assays showed that miR-101-3p overexpression significantly reduced cell viability, while rhPTX3 supplementation partially rescued this effect (Fig. 5C). Furthermore, immunofluorescence analysis of Ki-67 revealed fewer proliferating cells in the miR-101-3p mimic group, but rhPTX3 treatment restored Ki-67 expression (Fig. 5D). Similarly, the EdU assay, which provides a more direct measure of DNA synthesis, showing fewer EdU-positive cells in the miR-101-3p mimic group, which was partially reversed by rhPTX3 supplementation (Fig. 5E). Overall, these results demonstrate that miR-101-3p suppresses TED-OFs proliferation by directly targeting PTX3, and that restoring PTX3 levels can counterbalance miR-101-3p’s inhibitory effects.
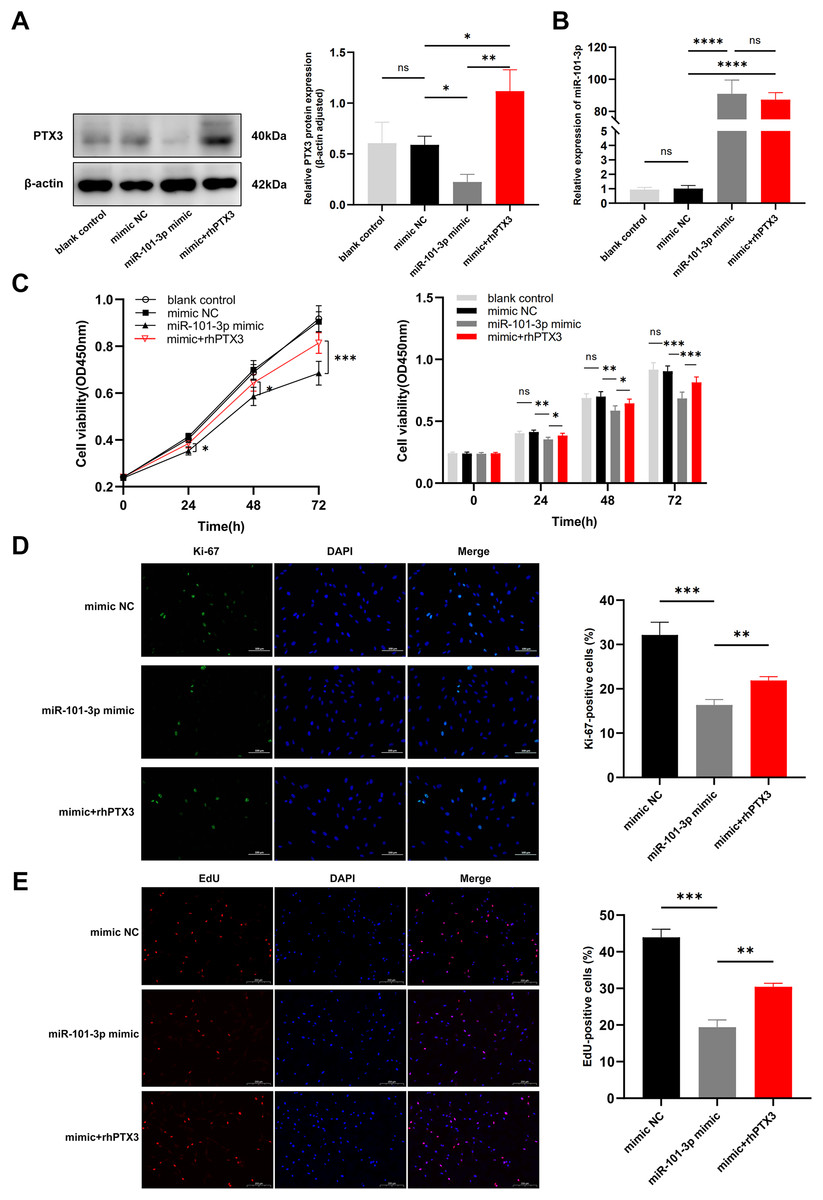
Figure 5: miR-101-3p suppressed TED-OFs proliferation by targeting PTX3.
(A) PTX3 protein levels in transfected TED-OFs (blank control, mimic NC, miR-101-3p mimic, and mimic+rhPTX3). (B) miR-101-3p expression in transfected TED-OFs was assessed via qRT-PCR. (C) The proliferative ability of TED-OFs was detected by CCK-8 assay. (D) Immunofluorescence staining was used to examine the intranuclear distribution and expression of Ki-67 in TED-OFs. Images were taken at 200× magnification, scale bars = 100 µm. The bar graph shows the mean ratio of Ki-67-positive cells for each group. (E) EdU staining evaluated the proportion of EdU-positive cells in TED-OFs. Images were taken at 200× magnification, scale bars = 200 µm. Data are presented as mean ± SD. Three biological replicates, *P < 0.05, **P < 0.01, ***P < 0.001, ****P < 0.0001, ns was considered as non-significant.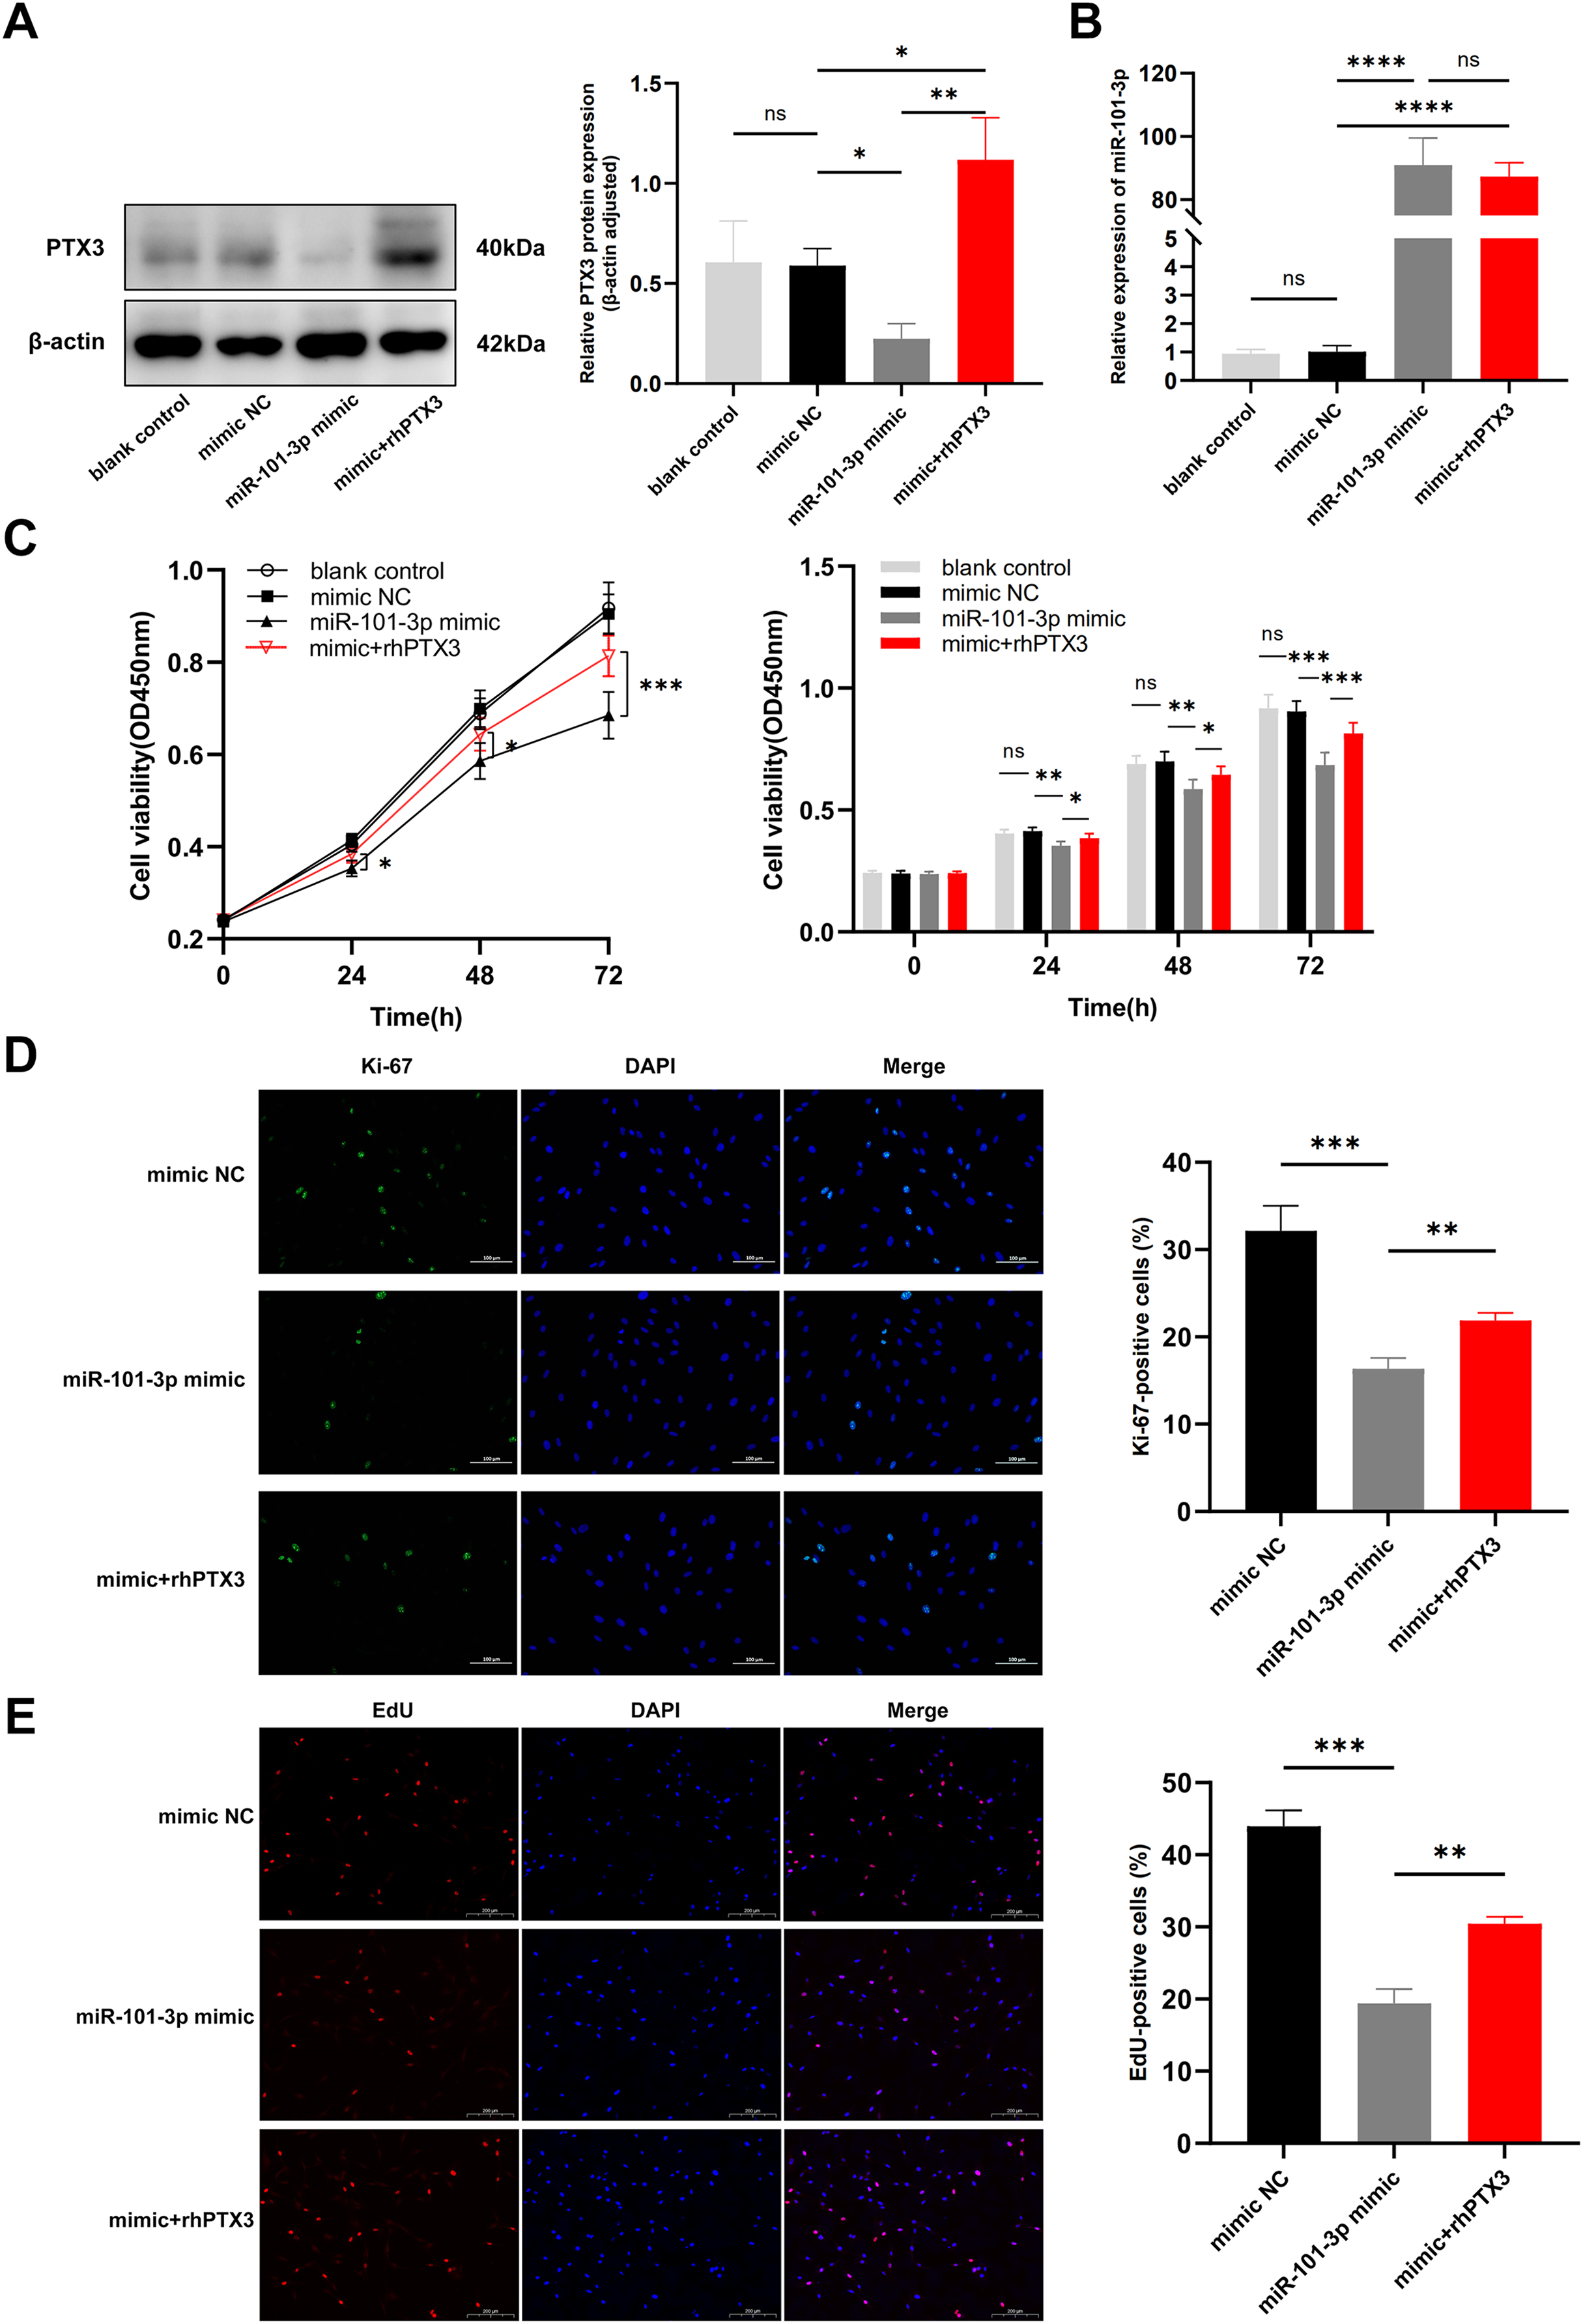
Discussion
Recent research has increasingly focused on the epigenetic mechanisms of TED, particularly emphasizing the role of miRNAs (Shahraki et al., 2023). By binding to messenger RNAs, miRNAs affect the expression of target genes and the development of disease (Bartel, 2009). The malignant progression of TED may be driven by changes in miRNA expression, with miRNA levels in TED patients differing according to their CAS (Wei et al., 2014). MiRNAs also play a crucial role in predicting treatment outcomes and influencing the clinical manifestations of TED (Shen et al., 2015; Martínez-Hernández et al., 2018). In this research, we found a significant reduction of miR-101-3p in TED orbital tissue samples and fibroblasts. While PTX3 mRNA was upregulated in TED orbital tissue samples, consistent with our previous study (Mou et al., 2018). MiR-101-3p directly targeted PTX3, and its overexpression inhibited TED-OFs proliferation. Importantly, we confirmed this anti-proliferative effect through three independent methods: CCK-8 assay, Ki-67 immunofluorescence, and EdU assay. Additionally, supplementation with rhPTX3 reversed the miR-101-3p mimic’s inhibition of PTX3 expression and cell proliferation. The findings indicate that elucidating miRNA expression alterations in TED can deepen our understanding of its pathogenesis and provide new diagnostic and therapeutic avenues.
Excessive proliferation of OFs is a hallmark feature of TED and drives further disease progression (Kuriyan, Phipps & Feldon, 2008). As the number of fibroblasts increases within the orbit, their capacity to fuel orbital remodeling escalates, characterized by sustained activation and heightened production of hyaluronan and inflammatory mediators (Dik, Virakul & van Steensel, 2016; Khong et al., 2016). Moreover, fibroblasts can differentiate into adipocytes or myofibroblasts, thereby exacerbating TED progression (Dik, Virakul & van Steensel, 2016; Kuriyan et al., 2013). In fact, multiple miRNAs have been implicated in TED development by affecting OFs activation. For example, miR-103a-3p was identified as overexpressed in TED orbital tissues and fibroblasts, promoting OFs activation and orbital fibrosis (Xie et al., 2023). Similarly, miR-155 and miR-146a enhance the proliferation of TED-OFs by suppressing target genes that inhibit cell proliferation (Woeller et al., 2019). Aligns with previous research, miR-101-3p expression has been noted in various tumors and tumor cell lines, correlating with its role in regulating cell proliferation (Lämmerhirt et al., 2024; Gao et al., 2024; Sun et al., 2024). This implies that the decreased levels of miR-101-3p may contribute to the abnormal proliferation of fibroblasts observed in TED.
However, few reports have focused on the role of miRNAs in regulating TED-OFs apoptosis. Given that miR-101-3p has been shown to promote apoptosis in several tumor cells (Lämmerhirt et al., 2024; Gao et al., 2024), we hypothesized that modulation of miR-101-3p expression could induce changes in TED-OFs apoptosis. Unexpectedly, flow cytometry analysis did not reveal increased apoptosis in TED-OFs transfected with the miR-101-3p mimic (Fig. 3E). This result suggests that the effect of miR-101-3p on apoptosis may be context-dependent, with TED-OFs exhibiting unique signaling pathways or characteristics that alter their sensitivity to miR-101-3p-mediated apoptosis. Relying solely on the CCK-8 assay made it difficult to determine if reduced cell viability was due to decreased proliferation or increased apoptosis. Therefore, the flow cytometry results indicate that the decline in cell activation is attributed to decreased proliferation rather than increased apoptosis. It’s also important to note that no apoptosis-inducing agent was used as a positive control in this study. Including a positive control would have confirmed the sensitivity of our assay and provided a more thorough evaluation of miR-101-3p’s role in apoptosis. Future studies should incorporate such controls to better assess this aspect.
Mechanistically, miRNAs function by binding to and regulating the expression of downstream mRNAs. In our study, dual-luciferase assay identified PTX3 as a target for miR-101-3p. PTX3, a member of the long pentraxin subfamily, has been reported to promote cell proliferation. For instance, increased expression of PTX3 promotes proliferation and differentiation in human osteoblasts (Greggi et al., 2021). Moreover, in desmoid tumors, PTX3 secretion from nonmutant fibroblastic cells has been shown to stimulate mutant cell proliferation via STAT6 activation (Al-Jazrawe et al., 2023). Building on our previous findings suggesting a potential link between PTX3 and the pathological mechanism of TED (Mou et al., 2018; Diao et al., 2020), we sought to explore how PTX3 influences the proliferation of TED-OFs. Here, we show that PTX3 overexpression partially reversed the inhibitory effect of miR-101-3p overexpression on TED-OFs proliferation (Figs. 5C–5E), indicating that miR-101-3p regulates OFs proliferation by targeting PTX3. This might partially account for the excessive proliferation of OFs observed in TED.
Indeed, miR-101-3p likely targets other mRNAs in addition to PTX3, as miRNAs generally have multiple targets. Several studies have reported that miR-101-3p suppresses tumor cell proliferation by directly targeting EZH2 (Chen et al., 2022; Dong et al., 2021; Xue et al., 2022). In early-onset preeclampsia, upregulation of miR-101-3p decreases VEGFA expression, thereby inhibiting trophoblast cell proliferation (Li et al., 2023). Thus, miR-101-3p may modulate multiple genes during the activation process of OFs in TED, not solely targeting PTX3. Additionally, miR-101-3p might have other significant roles in TED pathophysiology. In diabetic retinopathy, it regulates VEGFA expression, stimulating angiogenesis and inflammatory responses (Fu, Ye & Hu, 2024). Downregulation of miR-101-3p exacerbates inflammation by targeting MAPK1 in systemic lupus erythematosus (Zhao et al., 2021). Moreover, miR-101-3p is pivotal in the protective effect of Dexmedetomidine against kidney fibrosis in diabetic mice (Song et al., 2022). Thus, miR-101-3p could potentially exert a profound influence on cell proliferation, inflammatory signaling, and fibrosis, consequently impacting orbital tissue remodeling in TED.
While OFs play a crucial role in the pathogenesis of TED, the disease also involves contributions from various immune cell types (Lehmann et al., 2008). However, the specific impact of miR-101-3p on other immune cells in TED remains poorly understood. Furthermore, TED tissues were obtained from orbital decompression surgeries, whereas non-TED tissues were harvested from upper eyelid blepharoplasty. Although obtaining non-TED orbital tissue is exceedingly rare, the use of eyelid tissue as a control is a more feasible approach given the practical limitations. Nevertheless, this may introduce some differences in fibroblast behavior due to the distinct origins of the tissues. Despite these limitations, this research is the first to demonstrate that miR-101-3p targets PTX3 and highlights its potential role in regulating TED-OFs proliferation. Future studies using animal models or other methods of obtaining appropriate controls will further clarify the role of miR-101-3p in TED pathogenesis.
Conclusions
In conclusion, our research highlights the regulatory role of the miR-101-3p/PTX3 axis in TED-OFs proliferation. As clinical trials of miRNA-based therapeutics for diverse types of cancer increase (Seyhan, 2024), our findings offer a potential novel target for TED therapy. Developing a safe delivery system for miRNAs into fibroblasts is imperative for advancing TED treatment.