
Accuracy of self-reported height, weight, and waist circumference in poor, rural areas of China
- Published
- Accepted
- Received
- Academic Editor
- Manuel Jimenez
- Subject Areas
- Anatomy and Physiology, Obesity
- Keywords
- Accuracy, Self-reported, BMI, Waist circumference, Poverty, Rural, China, Height, Weight, Subgroup
- Copyright
- © 2024 Cao et al.
- Licence
- This is an open access article distributed under the terms of the Creative Commons Attribution License, which permits using, remixing, and building upon the work non-commercially, as long as it is properly attributed. For attribution, the original author(s), title, publication source (PeerJ) and either DOI or URL of the article must be cited.
- Cite this article
- 2024. Accuracy of self-reported height, weight, and waist circumference in poor, rural areas of China. PeerJ 12:e18525 https://doi.org/10.7717/peerj.18525
Abstract
Objectives
There are differing opinions and findings about the accuracy of self-reported data. This study sought to assess the accuracy of self-reported height, weight, and waist circumference (WC) data among adult residents in poor, rural areas of China.
Methods
Multi-stage stratified cluster random sampling was used to sample rural adult residents in Jinzhai County. Intraclass correlations (ICCs), Bland-Altman plots with limits of agreements (LOAs), and Cohen’s kappa were used to examine the accuracy of self-reported data. Multiple linear regression was used to explore the effect of demographic and socioeconomic variables.
Results
Height was over-reported by an average of 0.67 cm, weight and WC were both under-reported, by an average of 0.004 kg and 1.09 cm, respectively. The ICC for height was 0.92, the ICC for weight was 0.93, and the ICC for WC was 0.93. Bland-Altman plots showed no trend in variability with increasing height, weight, and WC, but 95% of the LOAs were wide, especially for WC. The percentage agreement (kappa) for BMI was 82.10% (0.71), and the percentage agreement for WC was 83.56% (0.66). Overall, obesity, overweight, and increased WC were underestimated by 0.56%, 2.64%, and 6.89%, respectively. Assessments of which demographic and socioeconomic factors were associated with statistically significant differences between self-reported and measured data showed that education (junior school vs. primary or below: β = −0.56, 95% CI [−1.01 to −0.11]) and occupation (others vs. professionals: β = 2.16, 95% CI [0.62–3.70]) were associated with differences between measured and self-reported height; occupation (industrial and commercial service vs. professionals: β = 1.57, 95% CI [0.52–2.61]) was associated with differences between measured and self-reported weight; and gender (women vs. men: β = −1.74, 95% CI [−2.51 to −0.97]) and age (60– vs. 18–44: β = −1.62, 95% CI [−2.88 to −0.36]) were associated with differences between measured and self-reported WC.
Conclusions
Self-reported height and weight were shown to be reliable in poor, rural areas of China, but self-reported WC should be used with caution. To improve the accuracy of self-reported data, certain subgroups should be targeted for educational interventions.
Introduction
Body mass index (BMI) is a commonly used and widely accepted measure for classifying overweight and obesity. It is calculated using weight in kilograms divided by height in meters squared. Self-reported height and weight are often used in BMI measurements to save time and money, especially in large-scale nutritional surveys (Niedhammer et al., 2000). The accuracy of self-reported weight and height has been studied frequently in epidemiological studies (Araujo et al., 2017; Beghin et al., 2013; Bowring et al., 2012; Dekkers et al., 2008; Jenkins et al., 2017; Ko et al., 2022; Lee et al., 2011; Lin et al., 2012; Lipsky et al., 2019; Lu et al., 2016; Luo et al., 2019; Neermark et al., 2019; Okamoto et al., 2017; Poston et al., 2014; Roystonn et al., 2021; Wada et al., 2005; Xie et al., 2014; Yazawa et al., 2020; Zhou et al., 2010). The majority of published studies indicate that self-reported weight and/or height are generally reliable and accurate (Araujo et al., 2017; Bowring et al., 2012; Dekkers et al., 2008; Jenkins et al., 2017; Lee et al., 2011; Lin et al., 2012; Lipsky et al., 2019; Luo et al., 2019; Neermark et al., 2019; Okamoto et al., 2017; Poston et al., 2014; Roystonn et al., 2021; Wada et al., 2005; Xie et al., 2014; Yazawa et al., 2020), while a small number of studies suggest that self-reported data may be inaccurate (Beghin et al., 2013; Ko et al., 2022; Lu et al., 2016; Zhou et al., 2010). For example, Araujo et al. (2017) found that self-reported data were valid for their study population and could be used in populations with similar characteristics, while Beghin et al. (2013) found that self-reported weight and height were inaccurate among adolescents.
Waist circumference (WC) is used as a measurement of abdominal or central adiposity (Lipsky et al., 2019) and can predict the risk of obesity-related disorders more accurately than BMI (Janssen, Katzmarzyk & Ross, 2004). For example, several studies have shown that WC is more strongly associated with the risk of cardiovascular disease, type 2 diabetes, and cancer than BMI (Balkau et al., 2007; Dale et al., 2017; Ohlson et al., 1985; Pischon et al., 2008; Rexrode et al., 1998; Wannamethee et al., 2010). Therefore, it is important to assess the accuracy of self-reported WC. However, there is currently limited research on the accuracy of self-reported WC (Contardo Ayala, Nijpels & Lakerveld, 2014; Dekkers et al., 2008; Lu et al., 2016; Okamoto et al., 2017; Spencer, Roddam & Key, 2004; Tuomela et al., 2019; Xie et al., 2014), with nearly half of the studies recommending that it be used with caution (Contardo Ayala, Nijpels & Lakerveld, 2014; Lu et al., 2016; Okamoto et al., 2017).
The majority of current studies on this topic are from Western countries. The accuracy of self-reported height, weight, and WC have rarely been studied in China, especially in poor, rural areas. Therefore, this study assessed the self-reported accuracy of height, weight, and waist circumference among adult residents in poor, rural areas of China. The effect of demographics and socioeconomics on self-reported data accuracy was then assessed.
Methods
Setting and sample
Jinzhai County is located in the western region of Anhui Province in Eastern China (Li et al., 2014). It has a total area of 3,918.97 km2 and a population of 672,000 people. Jinzhai County was one of the birthplaces of the Chinese Revolution and the people’s armed forces. Jinzhai County also has one of the highest rates of poverty nationally, with a recorded poverty rate of 22.1% in 2014 (The People’s Government of Jinzhai County, 2020).
Portions of this text were previously published as part of a preprint (Li et al., 2019). The data in this study came from the first Non-communicable and Chronic Disease Risk Factor Surveillance (NCD Surveillance) in Jinzhai County, which was launched in 2017 by the Jinzhai County Health and Family Planning commission, Lu’an Municipal Center for Disease Control and Prevention, and Jinzhai County Center for Disease Control and Prevention. The subjects of this survey were permanent residents of Jinzhai County, aged 18 and above, who had continuously lived in the monitored area for more than 6 months. Participants who did not agree to participate or sign the consent form, as well as those unable to effectively communicate, were excluded. Multi-stage stratified cluster random sampling was used to sample rural adult residents in Jinzhai County. First, probability proportionate to size (PPS) sampling was used to randomly select six towns from the 23 towns and townships of Jinzhai County. Then, five administrative villages were randomly selected by PPS sampling from each of the six selected towns. Simple random sampling was then used to randomly select two village groups from each selected administrative village. A total of 45 residential households were randomly selected from each village group by cluster random sampling, and one permanent resident aged 18 or older in each residential household was randomly selected to participate in this survey by Kish grid sampling.
The sample size was calculated using the following formula:
where α = 0.05, μ = 1.96, p = 9.7% (study data came from the NCD Surveillance, and to expand the sample size, the value of p was based on the prevalence of diabetes in China due to its relatively low prevalence among common chronic diseases (Yang et al., 2010)), design effect (deff) = 1.5, relative error (RE) = 15%, and permissible error (d) = RE * P = 15% * 9.7%. Using this calculation, N ≈ 2,385. If considering a participation refusal rate of 10%, a final sample size N = 2,623.5, rounded to 2,700, would assure adequate power to detect statistical significance. A total of 2,729 participants were included in the final study.
Demographic and socioeconomic data
The uniform questionnaire from the Non-communicable and Chronic Disease Risk Factor Surveillance in China (Wang et al., 2017) was used to collect the demographic and socioeconomic information of participants, including gender, age, occupation (agriculture and forestry, professionals, industrial and commercial service, housework, others), marital status (single, married/cohabitation, divorced/widowed/separated), education (primary or below, junior school, senior or above), and annual family income (Yuan). Generally, the ages of children in primary school range from 6 to 11 years, those in junior school from 12 to 14 years, and those in senior school from 15 to 17 years in China.
Self-reported data of height, weight, and waist circumference
The self-reported data of height, weight, and waist circumference were collected before the actual measurements were performed. Participants were not informed in advance that they would need to provide self-reported data. The participants were asked: “Do you know your height?”; “Do you know your weight?”; “Do you know your waist circumference?” If the participants answered “Yes” to any question, the self-reported data was then collected for that measurement. To address potential confusion regarding null values for self-reported measurements—where a null value may indicate either a missing response or a conscious choice to say “I don’t know”—self-reported data was only collected from participants who indicated they knew their measurements. Each questionnaire was carefully reviewed to confirm this. Among the 2,729 participants, 920 did not know their height, and 484 did not know their weight, resulting in the exclusion of 952 individuals from the BMI analysis, leaving an analytical sample size of 1,777. Additionally, 1,074 participants did not know their WC, which led to an analytical sample size of 1,655 for the WC analysis. The final Kappa values obtained in this study were 0.71 for BMI and 0.66 for WC. PASS software was used to calculate statistical power, and the results showed that both analyses achieved 100% power with sample sizes of 1,777 and 1,655 subjects, respectively.
Body measurement
The body measurements of height, weight, and waist circumference were conducted by trained NCD Surveillance fieldworkers. Measurements of weight and WC were conducted in the morning, with the respondents having been informed one day in advance of the measurements to not eat prior to the measurements. Participants were instructed to remove their shoes and heavy clothing when being measured for height and weight. Height was measured using a portable height-measuring instrument with an accuracy of 0.1 cm. Participants stood with their backs to the measuring device, keeping their bodies naturally straight, heads held high, and gazes directed forward. Weight was measured using a calibrated electronic scale with an accuracy of 0.1 kg. Participants were instructed to stand naturally on the scale and remain still until the scale reading stabilized. WC was measured at the iliac crest by two investigators to the nearest 0.1 cm using a soft ruler made of non-stretchable material. During WC measurement, the waist of the participants was fully exposed, and participants were instructed to stand naturally, look straight ahead, and maintain a natural breathing state. One investigator measured while the other checked that the soft ruler was positioned horizontally around the body and then recorded the data.
Definition of index
Classification of BMI
BMI was calculated using the following formula: BMI = weight (kg)/height2 (m). Both self-reported BMI and measured BMI data were recorded. Due to the differences in race and lifestyle between the West and China, we did not use the BMI cut-off values established in Western countries. Instead, the classification of BMI in this study was based on the Chinese adult BMI classification system (Liu et al., 2019; Zhou & Cooperative Meta-Analysis Group of the Working Group on Obesity in China, 2002): underweight (BMI < 18.5 kg/m2); normal weight (18.5 ≤ BMI < 24.0 kg/m2); overweight (24.0 ≤ BMI < 28.0 kg/m2); and obesity (BMI ≥ 28 kg/m2).
Classification of increased WC
WC was classified as either normal WC or increased WC, with increased WC defined as WC ≥ 85 cm for men and WC ≥ 80 cm for women, according to the sex-specific cut-offs for normal WC in Chinese adults (Ruan et al., 2013; Zhou & Cooperative Meta-Analysis Group of the Working Group on Obesity in China, 2002).
Difference value between self-reported and measured data
The difference value (D) was calculated by subtracting the measured data values from the self-reported data values for each measurement. A negative value indicated the participants under-reported the measurement, and a positive value indicated they over-reported the measurement.
Ethics approval
The need for ethics approval was deemed unnecessary because the NCD Surveillance program is a government program for measuring chronic diseases and chronic disease risk factors. This study was approved by the government and launched by Jinzhai County Health and Family Planning commission, Lu’an Municipal Center for Disease Control and Prevention, and Jinzhai County Center for Disease Control and Prevention. Each participant signed an informed consent before participation.
Statistical methods
Epi Data 3.1 software (Epi Data foreign (Epi Data Association), Odense, Denmark) was used for data entry, and SPSS 10.01 (SPSS Inc., Chicago, IL, USA) was used for the data analysis. The accuracy of self-reported data was described by the mean difference value (D = self-reported data minus measured data) and 95% CI. A paired sample t-test was used to compare the self-reported and measured data between the different groups. The agreement between self-reported data and measured data was analyzed by intraclass correlations (ICCs). Bland-Altman plots with limits of agreements (LOAs), which give the mean and 95% CI of the differences between the self-reported and measured values, were also used to assess the concordance (Bland & Altman, 1986). The impact of self-reported measurements on the categorization of BMI (underweight, normal weight, overweight, obesity) and categorization of WC (normal WC and increased WC) were also assessed using Cohen’s kappa and 95% CI. The criteria of Landis & Koch (1977) were used to assess accuracy on the following scale: <0 is poor; 0–0.20 is slight; 0.21–0.40 is fair; 0.41–0.60 is moderate; 0.61–0.80 is substantial; and 0.81–1.00 is almost perfect accuracy. The accuracy of self-reported height, weight, and WC was analyzed by multiple linear regression, which used the difference value (D = self-reported data minus measured data) as the dependent variable, and p-values < 0.05 were considered to be significant.
Results
Characteristics of participants
Of the 2,729 participants, 35.91% were men and 64.09% were women. The age distribution of the participants was as follows: 24.51% were aged 18–44, 54.27% were aged 45–59, and 21.22% were aged 60 and above. This sample had a higher proportion of women than the overall demographics of Janzhai County or the nation, but the age distribution results were similar (Table S1). In terms of education level, 63.83% of participants had completed primary education or below, 29.42% had completed junior school, and 6.74% had completed senior school or above. Additionally, 91.79% of participants were married, and 71.38% were employed in agriculture and forestry.
Reliability of self-reported height, weight, WC, and BMI
The mean self-reported and measured height were 161.54 cm (SD: 7.89 cm) and 160.88 cm (SD: 7.73 cm), respectively; the mean self-reported weight was 61.56 kg (SD: 10.29 kg) and the mean measured weight was 61.56 kg (SD: 10.27 kg); the mean self-reported and measured WC were 80.44 cm (SD: 10.43 cm) and 81.53 cm (SD: 9.91 cm), respectively. Compared with the measured value, height (p < 0.001) was over-reported by an average of 0.67 (0.48–0.86) cm, weight (p > 0.05) was under-reported by an average of 0.004 (−0.17 to 0.16) kg, and WC (p < 0.001) was under-reported by an average of 1.09 (−1.42 to −0.76) cm. In the subgroup analysis, the difference between self-reported and measured height had a statistical difference in the majority of subgroups, and the difference between self-reported and measured WC had a statistical difference in more than half of the subgroups; however, the difference between self-reported and measured weight had a statistical difference in only two subgroups (Table 1).
| Variable | Height (cm) | Weight (kg) | WC (cm) | |||||||||
|---|---|---|---|---|---|---|---|---|---|---|---|---|
| Self-reported | Measured | D (SD, 95% CI) | p | Self-reported | Measured | D (SD, 95% CI) | p | Self-reported | Measured | D (SD, 95% CI) | p | |
| Gender | ||||||||||||
| Men | 166.90 (6.21) | 166.07 (6.00) | 0.83 (3.96, [0.55–1.11]) | <0.001 | 66.10 (10.64) | 66.06 (10.71) | 0.03 (4.05, [−0.24 to 0.30]) | 0.813 | 83.68 (10.69) | 83.77 (9.76) | −0.10 (7.01, [−0.66 to 0.46]) | 0.732 |
| Women | 157.77 (6.67) | 157.22 (6.63) | 0.55 (4.27, [0.29–0.81]) | <0.001 | 58.79 (9.01) | 58.81 (8.960 | −0.03 (3.87, [−0.23 to 0.17]) | 0.795 | 78.56 (9.80) | 80.23 (9.77) | −1.67 (6.74, [−2.08 to −1.26]) | <0.001 |
| Age (years) | ||||||||||||
| 18–44 | 160.91 (7.60) | 160.55 (7.40) | 0.36 (3.86, [0.05–0.67]) | 0.027 | 59.93 (10.17) | 59.91 (10.27) | 0.02 (3.88, [−0.29 to 0.33]) | 0.903 | 78.37 (11.59) | 79.12 (10.02) | −0.65 (6.81, [−1.29 to 0.01]) | 0.046 |
| 45–59 | 161.74 (7.98) | 161.02 (7.91) | 0.72 (4.12, [0.46–0.98]) | <0.001 | 63.00 (10.25) | 62.89 (10.27) | 0.11 (3.80, [−0.10 to 0.32]) | 0.309 | 81.43 (9.94) | 82.56 (9.80) | −1.14 (6.89, [−1.58 to −0.70]) | <0.001 |
| 60– | 162.33 (8.10) | 161.11 (7.72) | 1.21 (4.84, [0.58–1.84]) | <0.001 | 59.47 (9.88) | 59.89 (9.68) | −0.42 (4.46, [−0.87 to 0.03]) | 0.068 | 80.31 (9.59) | 81.96 (9.38) | −1.65 (6.93, [−2.49 to −0.81]) | <0.001 |
| Education | ||||||||||||
| Primary or below | 160.62 (7.60) | 159.65 (7.45) | 0.97 (4.40, [0.69–1.25]) | <0.001 | 61.21 (10.18) | 61.27 (10.14) | −0.06 (3.99, [−0.27 to 0.15]) | 0.562 | 80.66 (10.45) | 82.12 (9.98) | −1.46 (7.41, [−1.93 to −0.99]) | <0.001 |
| Junior school | 161.84 (8.10) | 161.62 (7.79) | 0.22 (3.91, [−0.07 to 0.51]) | 0.131 | 61.83 (10.25) | 61.77 (10.21) | 0.06 (3.41, [−0.19 to 0.31]) | 0.61 | 80.19 (10.33) | 80.65 (9.75) | −0.46 (6.03, [−0.96 to 0.04]) | 0.072 |
| Senior or above | 165.37 (7.285) | 164.52 (7.45) | 0.85 (3.40, [0.34–1.36]) | 0.001 | 63.04 (11.22) | 62.88 (11.53) | 0.16 (5.43, [−0.65 to 0.97]) | 0.702 | 79.90 (10.70) | 80.93 (9.80) | −1.03 (6.04, [−2.03 to −0.03]) | 0.046 |
| Marital status | ||||||||||||
| Single | 163.60 (7.44) | 163.39 (7.61) | 0.20 (4.11, [−1.04 to 1.44]) | 0.752 | 59.24 (8.68) | 59.74 (8.49) | −0.50 (3.31, [−1.38 to 0.38]) | 0.275 | 79.03 (9.46) | 79.57 (9.03) | −0.54 (5.25, [−2.28 to 1.20]) | 0.545 |
| Married/cohabitation | 161.51 (7.89) | 160.82 (7.71) | 0.69 (4.14, [0.49–0.89]) | <0.001 | 61.71 (10.35) | 61.69 (10.35) | 0.02 (3.93, [−0.15 to 0.19]) | 0.817 | 80.41 (10.34) | 81.55 (9.93) | −1.14 (6.69, [−1.47 to −0.81]) | <0.001 |
| Divorced/widowed/separated | 161.02 (8.13) | 160.69 (8.05) | 0.33 (4.40, [−0.82 to 1.48]) | 0.576 | 59.28 (9.51) | 59.55 (9.25) | −0.28 (4.50, [−1.22 to 0.66]) | 0.566 | 82.10 (13.24) | 82.21 (9.84) | −0.11 (11.79, [−3.28 to 3.06]) | 0.947 |
| Occupation | ||||||||||||
| Agriculture and forestry | 161.58 (8.17) | 160.87 (7.88) | 0.71 (4.16, [0.48–0.94]) | <0.001 | 61.36 (10.22) | 61.42 (10.24) | −0.05 (3.87, [−0.24 to 0.14]) | 0.573 | 80.51 (10.24) | 81.75 (9.75) | −1.24 (6.59, [−1.62 to −0.86]) | <0.001 |
| Professionals | 164.28 (6.91) | 164.33 (7.18) | −0.05 (3.11, [−0.70 to 0.60]) | 0.878 | 63.16 (11.40) | 63.73 (11.49) | −0.58 (2.79, [−1.15 to −0.01]) | 0.051 | 79.57 (11.57) | 79.84 (9.37) | −0.27 (6.72, [−1.88 to 1.34]) | 0.744 |
| Industrial and commercial service | 164.27 (7.16) | 163.71 (6.92) | 0.56 (4.22, [−0.09 to 1.21]) | 0.093 | 64.83 (10.57) | 64.12 (10.43) | 0.71 (4.61, [0.04–1.38]) | 0.039 | 83.23 (11.80) | 83.48 (9.49) | −0.25 (9.02, [−1.86 to 1.36]) | 0.762 |
| Housework | 158.76 (6.36) | 158.21 (6.69) | 0.55 (4.29, [0.04–1.06]) | 0.037 | 60.56 (9.75) | 60.49 (9.62) | 0.06 (4.15, [−0.38 to 0.50]) | 0.781 | 79.26 (9.96) | 80.49 (10.66) | −1.22 (7.40, [−2.14 to −0.30]) | 0.01 |
| Others | 162.11 (7.34) | 160.23 (7.36) | 1.88 (4.22, [0.70–3.06]) | 0.003 | 59.93 (10.63) | 60.30 (11.08) | −0.38 (3.81, [−1.39 to 0.63]) | 0.469 | 78.56 (11.18) | 78.49 (10.70) | 0.07 (4.21, [−1.22 to 1.36]) | 0.912 |
| Annual family income* | ||||||||||||
| Less than 10,000 Yuan | 162.03 (7.23) | 161.83 (7.71) | 0.20 (3.90, [−0.86 to 1.26]) | 0.71 | 58.69 (9.32) | 60.08 (9.39) | −1.39 (4.76, [−2.37 to −0.41]) | 0.006 | 80.06 (9.83) | 81.30 (9.20) | −1.23 (6.93, [−2.91 to 0.45]) | 0.155 |
| 10,000 Yuan | 161.75 (7.56) | 160.78 (7.45) | 0.98 (4.46, [0.68–1.28]) | <0.001 | 61.61 (10.29) | 61.57 (10.28) | 0.04 (3.80, [−0.19 to 0.27]) | 0.719 | 80.09 (10.30) | 81.20 (9.90) | −1.11 (7.34, [−1.62 to −0.60]) | <0.001 |
| 50,000 Yuan | 161.54 (7.42) | 161.00 (7.20) | 0.54 (3.69, [0.25–0.83]) | <0.001 | 62.13 (10.16) | 62.08 (10.23) | 0.05 (3.87, [−0.23 to 0.33]) | 0.727 | 81.30 (10.73) | 82.01 (9.85) | −0.71 (6.32, [−1.23 to −0.19]) | 0.007 |
| 100,000 Yuan | 161.34 (7.57) | 161.10 (7.53) | 0.23 (3.50, [−0.30 to 0.76]) | 0.385 | 61.67 (10.42) | 61.29 (10.40) | 0.38 (3.44, [−0.11 to 0.87]) | 0.138 | 80.46 (9.87) | 82.14 (10.13) | −1.68 (6.37, [−1.23 to −0.19]) | 0.138 |
| Total | 161.54 (7.89) | 160.88 (7.73) | 0.67 (4.14, [0.48–0.86]) | <0.001 | 61.56 (10.29) | 61.56 (10.27) | −0.004 (3.94, [−0.17 to 0.16]) | 0.959 | 80.44 (10.43) | 81.53 (9.91) | −1.09 (6.88, [−1.42 to −0.76]) | <0.001 |
Notes:
CI, confidence interval; D, self-reported data minus physical measured data; SD, Standard deviation; WC, waist circumference.
The average ICC values for height (0.92), weight (0.93), and WC (0.93) showed good coherence between self-reported and measured data. This good coherence was also found in the different subgroups (Table 2).
| Variable | Height | Weight | WC |
|---|---|---|---|
| Gender | |||
| Men | 0.87 (0.84–0.89) | 0.88 (0.87–0.90) | 0.91 (0.89–0.92) |
| Women | 0.87 (0.85–0.88) | 0.89 (0.87–0.90) | 0.90 (0.88–0.91) |
| Age (years) | |||
| 18–44 | 0.93 (0.92–0.94) | 0.93 (0.92–0.94) | 0.95 (0.93–0.96) |
| 45–59 | 0.93 (0.92–0.94) | 0.93 (0.92–0.94) | 0.93 (0.93–0.94) |
| 60– | 0.90 (0.87–0.92) | 0.90 (0.87–0.92) | 0.90 (0.87–0.93) |
| Education | |||
| Primary or below | 0.91 (0.89–0.92) | 0.91 (0.90–0.92) | 0.91 (0.89–0.92) |
| Junior school | 0.94 (0.93–0.94) | 0.94 (0.93–0.95) | 0.95 (0.95–0.96) |
| Senior or above | 0.94 (0.92–0.96) | 0.94 (0.92–0.96) | 0.94 (0.92–0.96) |
| Marital status | |||
| Single | 0.92 (0.85–0.96) | 0.9290.85–0.96) | 0.90 (0.78–0.95) |
| Married/cohabitation | 0.92 (0.92–0.93) | 0.93 (0.92–0.93) | 0.93 (0.93–0.94) |
| Divorced/widowed/separated | 0.92 (0.86–0.95) | 0.92 (0.86–0.95) | 0.93 (0.86–0.96) |
| Occupation | |||
| Agriculture and forestry | 0.93 (0.92–0.94) | 0.93 (0.92–0.94) | 0.94 (0.93–0.94) |
| Professionals | 0.95 (0.92–0.97) | 0.95 (0.92–0.97) | 0.96 (0.93–0.98) |
| Industrial and commercial service | 0.90 (0.87–0.93) | 0.90 (0.87–0.93) | 0.91 (0.87–0.94) |
| Housework | 0.88 (0.85–0.90) | 0.88 (0.85–0.91) | 0.89 (0.85–0.92) |
| Others | 0.91 (0.84–0.95) | 0.90 (0.83–0.95) | 0.89 (0.79–0.94) |
| Annual family income | |||
| Less than 10,000 RMB | 0.93 (0.87–0.96) | 0.93 (0.87–0.96) | 0.94 (0.89–0.97) |
| 10,000 RMB– | 0.90 (0.89–0.92) | 0.91 (0.89–0.92) | 0.91 (0.89–0.92) |
| 50,000 RMB– | 0.93 (0.92–0.94) | 0.93 (0.92–0.94) | 0.95 (0.94–0.96) |
| 100,000 RMB– | 0.94 (0.92–0.96) | 0.94 (0.92–0.96) | 0.95 (0.93–0.96) |
| Total | 0.92 (0.92–0.93) | 0.93 (0.92–0.93) | 0.93 (0.93–0.94) |
Note:
WC, waist circumference.
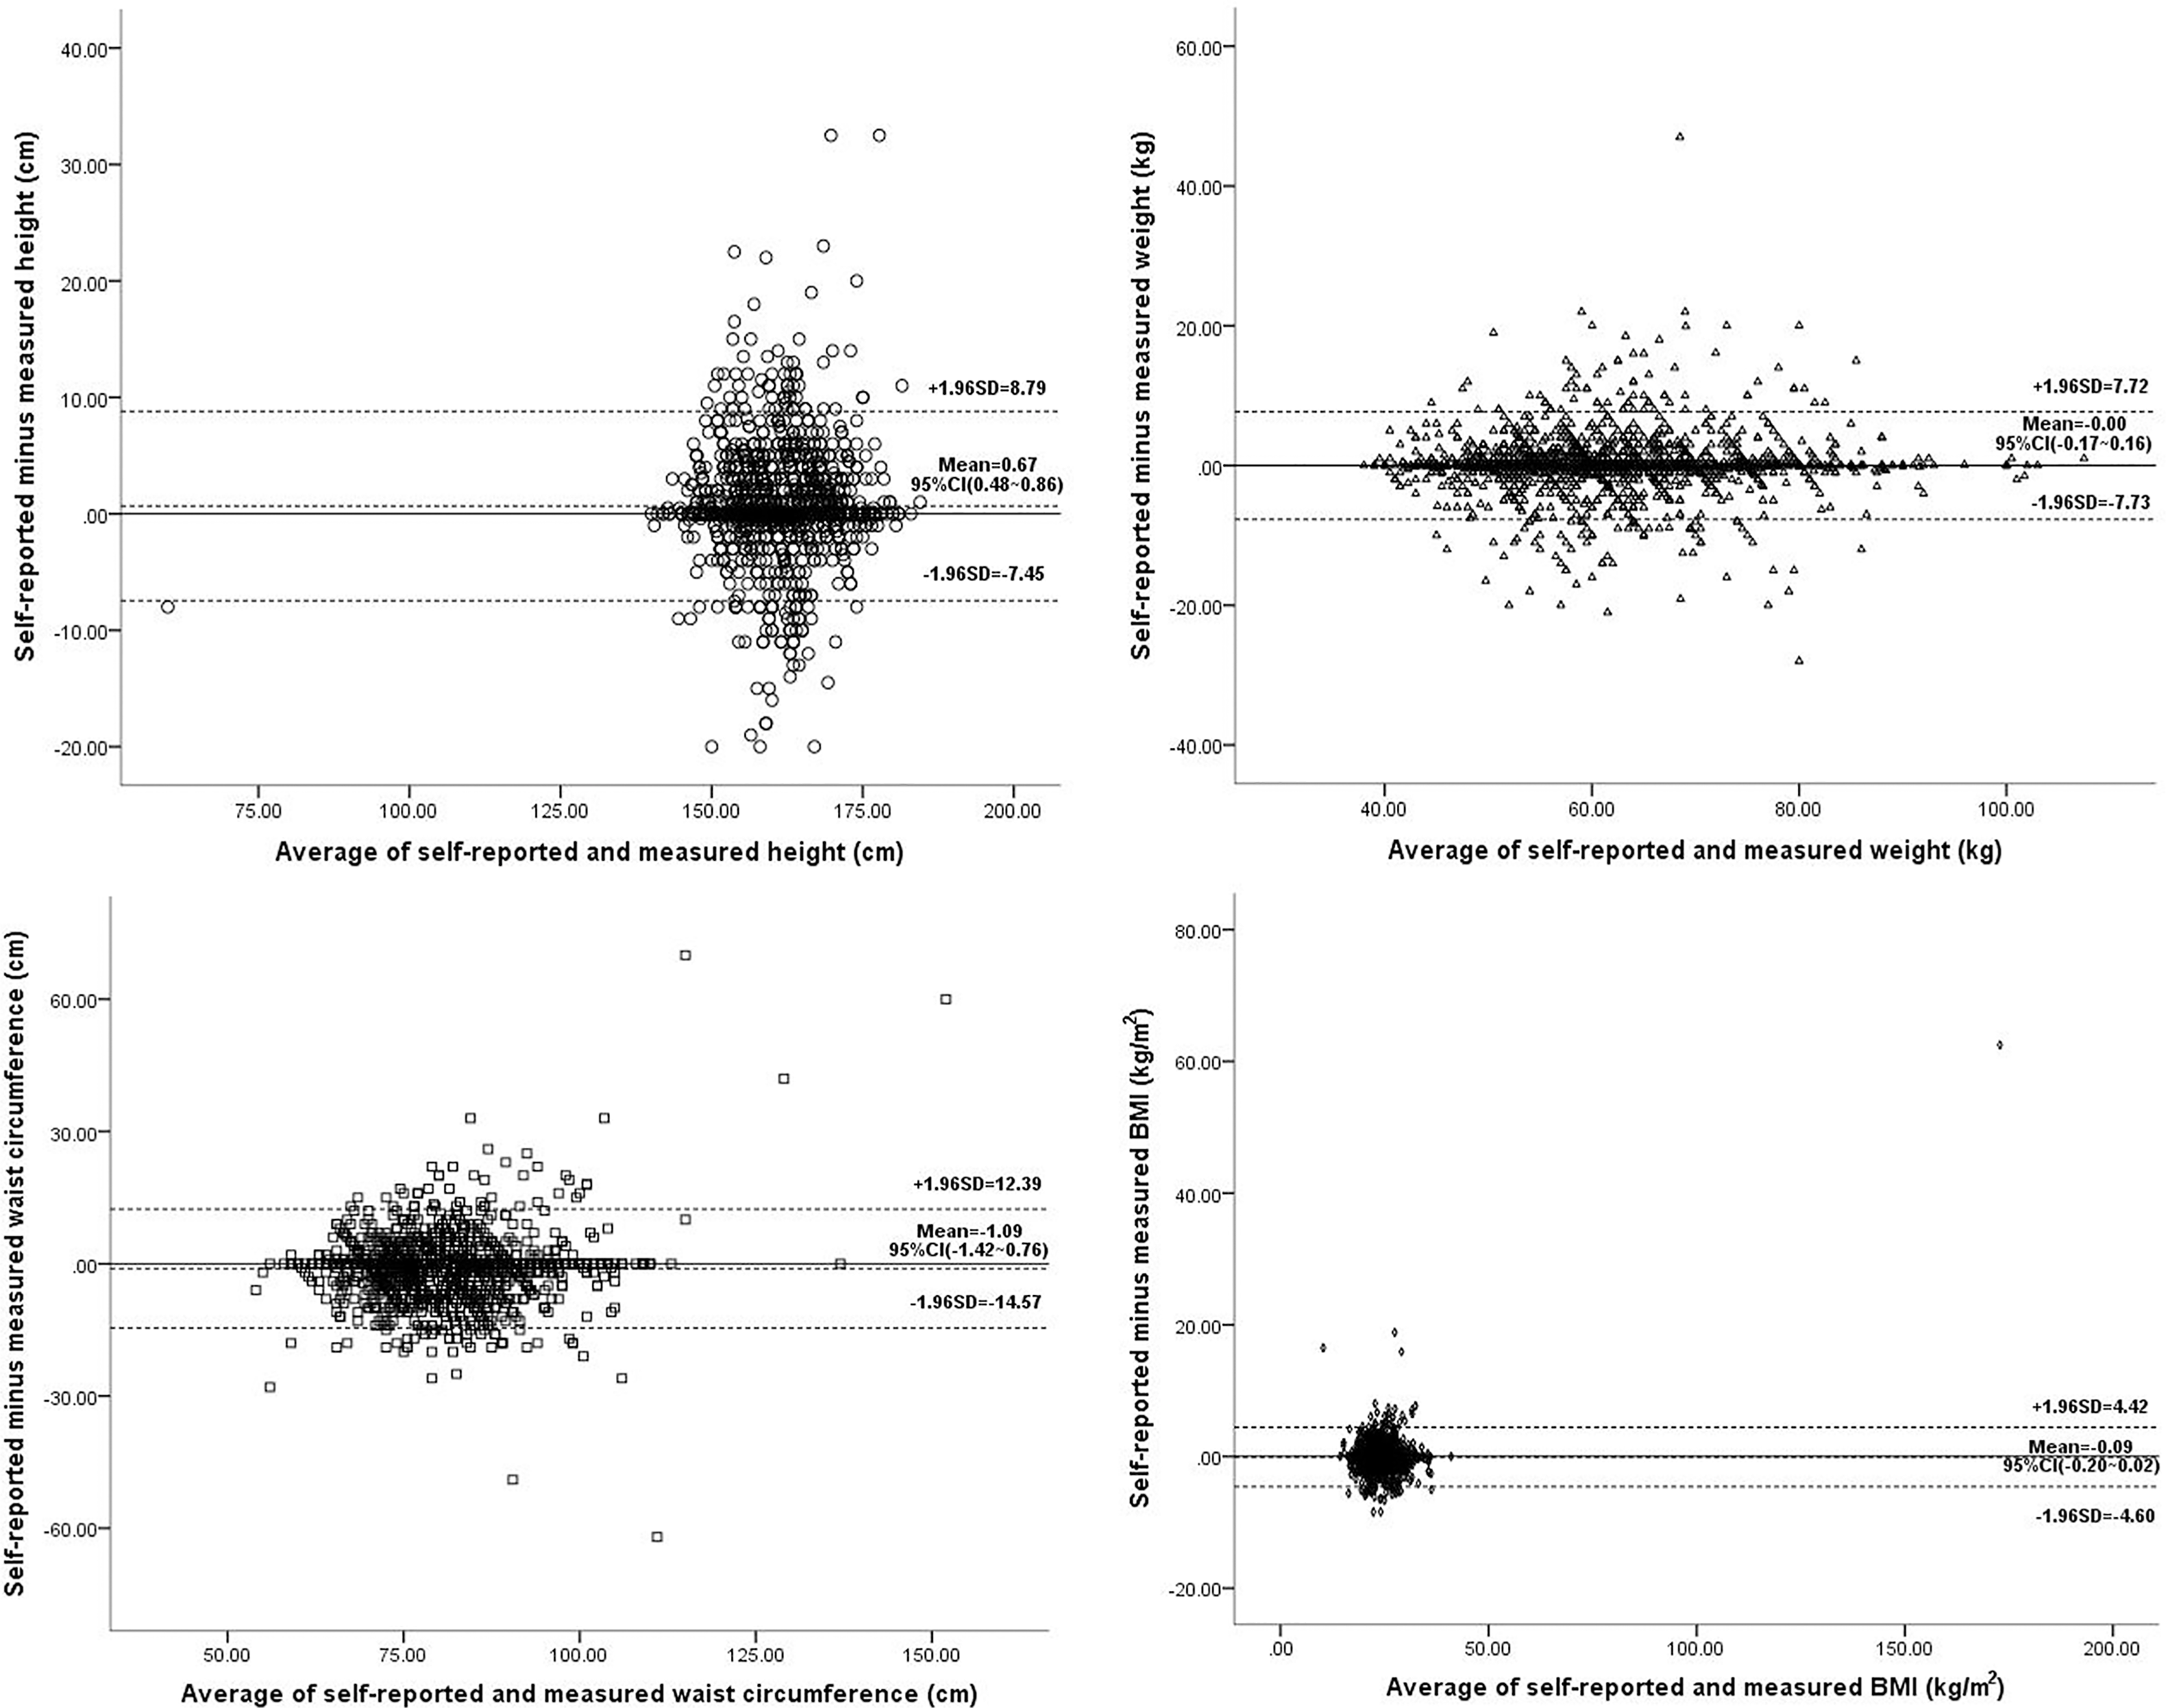
Bland–Altman plots showed no trend in variability with increasing mean height, weight, WC, or BMI (Fig. 1).
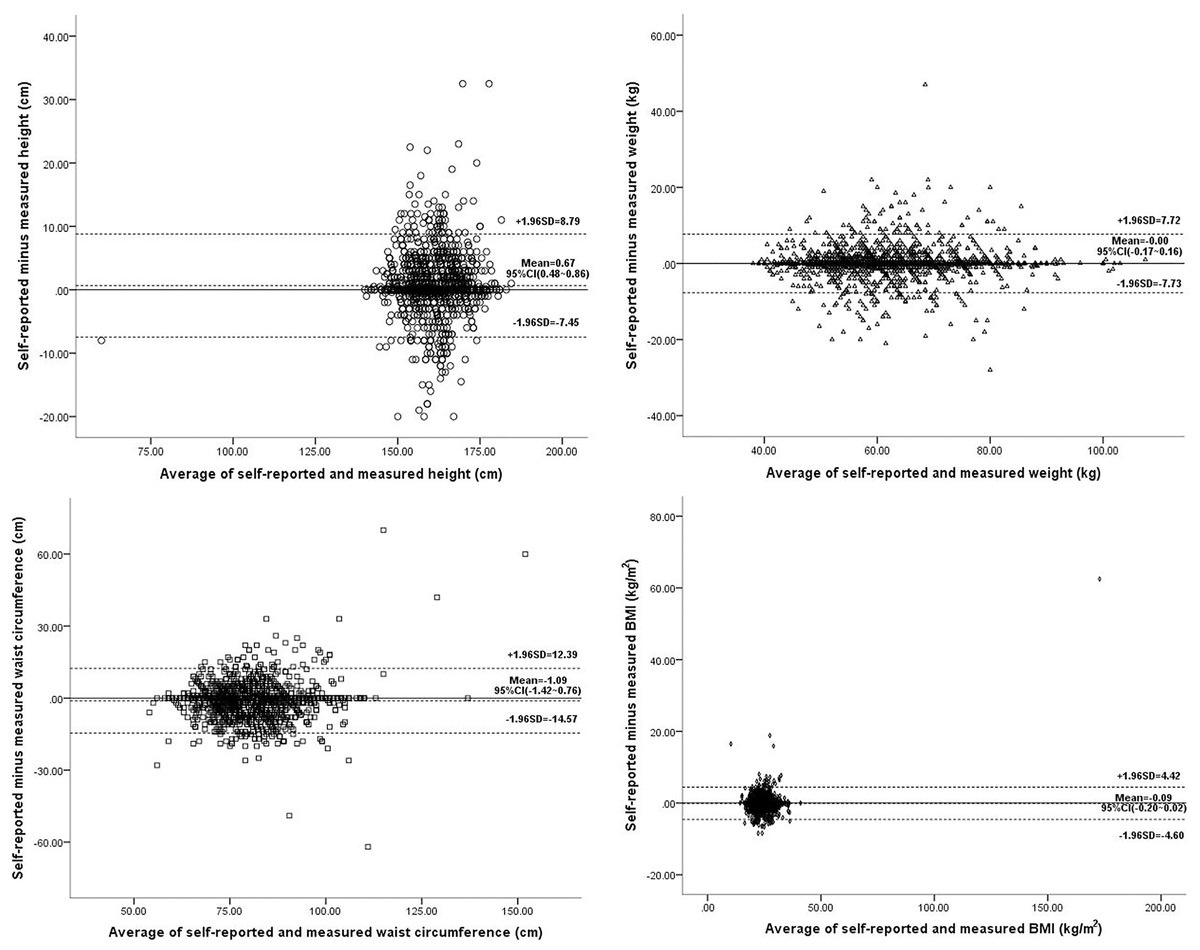
Figure 1: Bland Altman plots of the difference vs. the average of self-reported and measured data.
The percentage agreement between self-reported and measured BMI classification was 82.10% (95% CI [80.32–83.88%]), and the percentage agreement between self-reported and measured WC classification was 83.56% (95% CI [81.77–85.35%]). Among the measured overweight population, 19.27% were categorized as normal weight according to self-reported height and weight. Among the measured obese population, 23.38% were categorized as overweight according to self-reported height and weight. Overall, the prevalence of obesity was only underestimated by 0.56%, overweight was underestimated by 2.64%, and underweight was overestimated by 0.67%. Among the measured increased WC population, 26.73% were categorized as normal WC in self-reported measurements. Overall, the prevalence of increased WC was underestimated by 6.89% (Table 3).
| Self-reported | Measured | ||||
|---|---|---|---|---|---|
| Self-reported BMI | Measured BMI | ||||
| Underweight | Normal weight | Overweight | Obese | Total | |
| Underweight | 48 (73.85) | 28 (3.17) | 1 (0.16) | 0 (0.00) | 77 (4.33) |
| Normal weight | 16 (24.62) | 787 (89.13) | 121 (19.27) | 4 (1.99) | 928 (52.22) |
| Overweight | 0 (0.00) | 60 (6.80) | 474 (75.48) | 47 (23.38) | 581 (32.70) |
| Obese | 1 (1.54) | 8 (0.91) | 32 (5.10) | 150 (74.63) | 191 (10.75) |
| Total | 65 (3.66) | 883 (49.69) | 628 (35.34) | 201 (11.31) | 1,777 |
| Self-reported WC | Measured WC | ||
|---|---|---|---|
| Normal WC | Increased WC | Total | |
| Normal WC | 854 (91.53) | 193 (26.73) | 1,047 (63.26) |
| Increased WC | 79 (8.47) | 529 (73.27) | 608 (36.74) |
| Total | 933 (56.37) | 722 (43.63) | 1,655 |
Note:
WC, waist circumference.
The kappa value for BMI classification was 0.71 (95% CI [0.68–0.74]) with p < 0.001, and the kappa value for WC classification was 0.66 (95% CI [0.62–0.70]) with p < 0.001.
Effect of demographic and socioeconomic variables on accuracy of self-reported measurements
Results of univariate regression analyses showed the effect of gender, age, education, annual family income, and occupation on the difference between self-reported and measured height, weight, and/or WC were all statistically significant (Table 4). However, the results of multivariate regression analyses (Table 5) showed that only education (junior school vs. primary or below: β = −0.56, 95% CI [−1.01 to −0.11], p < 0.05) and occupation (others vs. professionals: β = 2.16, 95% CI [0.62–3.70], p < 0.01) were significantly independently associated with a difference in self-reported and measured height; only occupation (industrial and commercial service vs. professionals: β = 1.57, 95% CI [0.52–2.61], p < 0.01) was significantly independently associated with a difference in self-reported and measured weight; and only gender (women vs. men: β = −1.74, 95% CI [−2.51 to −0.97], p < 0.001) and age (60– vs. 18–44: β = −1.62, 95% CI [−2.88 to −0.36], p < 0.05) were significantly independently associated with a difference in self-reported and measured WC.
| Variable | Height | Weight | WC |
|---|---|---|---|
| Gender | |||
| Men | Ref | Ref | Ref |
| Women | 1.11 (0.46–1.75)c | −0.06 (−0.40 to 0.28) | −1.57 (−2.26 to −0.89)c |
| Age (years) | |||
| 18–44 | Ref | Ref | Ref |
| 45–59 | 0.37 (−0.05 to 0.79) | 0.09 (−0.29 to 0.47) | −0.49 (−1.27 to 0.29) |
| 60– | 0.86 (0.22–1.50)b | −0.44 (−0.94 to 0.07) | −1.00 (−2.06 to 0.05) |
| Education | |||
| Primary or below | Ref | Ref | Ref |
| Junior school | −0.75 (−1.15 to −0.34)c | 0.13 (−0.23 to 0.48) | 1.00 (0.28–1.72)b |
| Senior or above | −0.12 (−0.80 to 0.56) | 0.22 (−0.40 to 0.85) | 0.43 (−0.79 to 1.65) |
| Annual family income | −0.29 (−0.56 to −0.02)a | 0.27 (0.04–0.50)a | −0.01 (−0.48 to 0.46) |
| Marital status | |||
| Married/cohabitation | Ref | Ref | Ref |
| Single | −0.49 (−1.76 to 0.78) | −0.52 (−1.58 to 0.55) | 0.60 (−1.71 to 2.90) |
| Divorced/widowed/separated | −0.36 (−1.46 to 0.75) | −0.30 (−1.13 to 0.54) | 1.03 (−0.85 to 2.92) |
| Occupation | |||
| Professionals | Ref | Ref | Ref |
| Agriculture and forestry | 0.76 (−0.13 to 1.65) | 0.52 (−0.31 to 1.35) | −0.97 (−2.66 to 0.73) |
| Industrial and commercial service | 0.61 (−0.46 to 1.68) | 1.29 (0.30–2.27)a | 0.02 (−2.04 to 2.08) |
| Housework | 0.60 (−0.40 to 1.59) | 0.64 (−0.27 to 1.54) | −0.96 (−2.81 to 0.90) |
| Others | 1.93 (0.48–3.37)b | 0.20 (−1.13 to 1.52) | 0.34 (−2.33 to 3.02) |
| Variable | Height | Weight | WC |
|---|---|---|---|
| Gender | |||
| Men | Ref | Ref | Ref |
| Women | −0.16 (−0.60 to 0.27) | −0.11 (−0.49 to 0.26) | −1.74 (−2.51 to −0.97)c |
| Age (years) | |||
| 18–44 | Ref | Ref | Ref |
| 45–59 | 0.10 (−0.37 to 0.57) | 0.14 (−0.28 to 0.55) | −0.55 (−1.41 to 0.32) |
| 60– | 0.26 (−0.48 to 1.01) | −0.40 (−1.00 to 0.20) | −1.62 (−2.88 to −0.36)a |
| Education | |||
| Primary or below | Ref | Ref | Ref |
| Junior school | −0.56 (−1.01 to −0.11)a | −0.03 (−0.43 to 0.37) | 0.38 (−0.44 to 1.20) |
| Senior or above | 0.24 (−0.55 to 1.03) | 0.33 (−0.39 to 1.05) | −0.65 (−2.11 to 0.81) |
| Annual family income | −0.25 (−0.53 to 0.03) | 0.23 (−0.00 to 0.47) | −0.05 (−0.53 to 0.43) |
| Marital status | |||
| Married/cohabitation | Ref | Ref | Ref |
| Single | −0.82 (−2.16 to 0.51) | −0.45 (−1.55 to 0.65) | −0.24 (−2.57 to 2.09) |
| Divorced/widowed/separated | −0.79 (−1.93 to 0.34) | −0.26 (−1.16 to 0.64) | 1.60 (−0.38 to 3.58) |
| Occupation | |||
| Professionals | Ref | Ref | Ref |
| Agriculture and forestry | 0.76 (−0.24 to 1.76) | 0.78 (−0.15 to 1.71) | −0.87 (−2.80 to 1.07) |
| Industrial and commercial service | 0.85 (−0.28 to 0.99) | 1.57 (0.52–2.61)b | −0.37 (−2.57 to 1.84) |
| Housework | 0.67 (−0.43 to 1.78) | 0.97 (−0.04 to 1.98) | −0.57 (−2.68 to 1.53) |
| Others | 2.16 (0.62–3.70)b | 0.73 (−0.70 to 2.16) | 0.55 (−2.30 to 3.40) |
Discussion
Most existing research on self-reported height, weight, and WC focuses on Western countries. Only a limited number of studies on the topic have been performed in China; for example, Zhou et al. (2010) studied self-reported height and weight in Chinese adolescents, and Lu et al. (2016) explored the accuracy of self-reported height, weight, and WC in the Jiangsu Province, which has the highest-ranking GDP per capita in China. However, to our knowledge, there are no published studies that investigate the validity and reliability of self-reported height, weight, and especially WC, in poor, rural areas of China. Therefore, this study was conducted and the results suggest that self-reported height and weight are reliable in poor, rural areas of China, but self-reported WC should be used with caution. This study also found that the accuracy of self-reported data could be affected by some demographic and socioeconomic variables.
Consistent with previous studies that have found that people tend to over-report their height (Araujo et al., 2017; Beghin et al., 2013; Dekkers et al., 2008; Lipsky et al., 2019; Lu et al., 2016; Moreira et al., 2018; Niedhammer et al., 2000), height was over-reported in the present study by an average of 0.67 cm, with statistically significant differences between self-reported and measured height in the majority of subgroups. Most previous studies have also shown that people tend to under-report their weight (Araujo et al., 2017; Beghin et al., 2013; Dekkers et al., 2008; Lipsky et al., 2019; Lu et al., 2016; Moreira et al., 2018; Niedhammer et al., 2000). However, the difference between self-reported and measured weight was almost zero in this study, and this was true in nearly all of the subgroups. This finding is worthy of further study and may be related to health education or the degree of recognition of overweight and/or obesity. In China, research on obesity prevention and control at the population level began in the late 1990s. Scholars from various disciplines, including nutrition, epidemiology, endocrinology, cardiovascular disease, exercise science, and health management, started investigating the BMI and WC cut-off points for Chinese adults (Liu, Li & Zhao, 2024). This research included associations between BMI, WC, and chronic diseases such as hypertension, diabetes, and cardiovascular diseases, as well as the overall disease burden. Subsequently, China issued a series of guidelines related to obesity prevention and control, such as the Guidelines for the Prevention and Control of Overweight and Obesity and the Guidelines for Physical Activity. A series of national obesity prevention and control interventions have also been launched, such as the National Healthy Lifestyle Action. Recently, the Chinese government issued the Core Knowledge of Weight Management for Residents, which includes a total of eight key points. One of these key points emphasizes the importance of understanding BMI and WC and advocates for the regular monitoring of weight, WC, and other indicators (General Office of National Health Commission, 2024). Although central or abdominal obesity, which is measured by WC, is more dangerous than a simple increase in BMI, studies about self-reported WC are rare. Among these studies, some indicated that WC was over-reported or that it was overestimated in certain subgroups, such as the male population (Contardo Ayala, Nijpels & Lakerveld, 2014; Dekkers et al., 2008; Okamoto et al., 2017). The authors suggested that there was no apparent reason for the discrepancy, or that the inconsistency may be attributed to the heterogeneity of populations across the studies. However, consistent with the results of the present study, most studies found that WC was under-reported (Lu et al., 2016; Spencer, Roddam & Key, 2004; Tuomela et al., 2019; Xie et al., 2014). The inconsistent results between different countries also show the importance of studying self-reported WC.
In this study, the average ICC values were high, indicating a high agreement between self-reported and measured height, weight, and WC, and this was true in all of the different subgroups. The Bland-Altman plots also showed no trend in variability with increasing mean height, weight, WC, and BMI. Moreover, the percentage of agreement for classification of BMI and WC was high, and the kappa values also showed substantial agreement. Previous research has suggested that individuals with higher BMI may be more likely to under-report their weight (Magnusson et al., 2014; Shields, Connor Gorber & Tremblay, 2008; Wada et al., 2005). This context may help explain the observed discrepancies in self-reported data. Overall, the prevalence of obesity and overweight was only underestimated by 0.56% and 2.64%, respectively, in the self-reported data in the present study, indicating self-reported data could be used to estimate the prevalence of overweight and obesity in this population with reasonable accuracy. However, it should be noted that the 95% LOAs were wide, especially for WC, indicating substantial discrepancies between self-reported and measured values at the individual level, which is in line with the findings of many previous studies (Hanneman, 2008; Dekkers et al., 2008; Kee et al., 2017; Lu et al., 2016; Yoong et al., 2013; Zhou et al., 2010). The prevalence of increased WC was underestimated by 6.89% in self-reported WC measurements in the present study. This may be because people are more likely to measure their height and weight more frequently than their WC. This hypothesis is supported by the present study, which found that more individuals reported not knowing their WC than their height and weight. As a result, there may not be an educational or recall effect associated with WC (Okamoto et al., 2017). Additionally, measuring WC may require more skill than measuring height and weight. WC differs significantly according to measurement site (Mason & Katzmarzyk, 2009; Ostchega et al., 2021; Seimon et al., 2018). Because of this, self-reported WC data were not suitable for assessment at an individual level and should be used cautiously.
Multiple linear regression analyses showed that participants with a junior school education had higher accuracy in reporting height compared to those with primary education or below. This suggests that individuals with higher education levels may possess better health literacy and greater awareness of their health (Waters et al., 2022), indicating that populations with lower education levels require more focused support. However, the population with a senior education level or above did not show higher accuracy in reporting height, and this phenomenon may be a chance finding that requires further investigation. Additionally, individuals in industrial and commercial service occupations exhibited lower accuracy in reporting weight than individuals employed as professionals. This difference may reflect variations in socio-economic status (SES), as individuals with low SES have less access to weight management knowledge and may be less able to afford high-quality scales (Dekkers et al., 2008). Female participants and individuals aged 60 and older also had lower accuracy in self-reported WC measurements than male participants and individuals aged 18–44, respectively. Previous research indicates that there are differences in how men and women perceive WC measurements. Without specific instructions, men most commonly measure their waist circumference at the navel and iliac crest, while women tend to measure it at the navel and at their narrowest point (Brown et al., 2018). These differences can translate into significantly different WC results (Mason & Katzmarzyk, 2009; Ostchega et al., 2021; Seimon et al., 2018). Additionally, memory functions tend to decline with age, which may be one of the reasons for the inaccuracy of self-reported waist circumference among older adults. Therefore, to improve the accuracy of self-reported data, targeted health education and interventions should be provided for these key populations.
In addition, when people believe that their responses will be validated, they are more inclined to provide truthful answers (Jones & Sigall, 1971). For example, Black, Taylor & Coster (1998) divided participants into two groups: the intervention group, which was informed prior to self-reporting their height and weight that measurements would be taken, and the control group, which was only informed that they would be measured after they had self-reported their height and weight. The results indicated that participants in the intervention group reported their height and weight with significantly greater accuracy than those in the control group. In the present study, participants were informed that their weight and height would be measured before they self-reported, which may explain the relatively accurate reporting of their height and weight in this study. However, participants were not informed in advance that they would need to provide self-reported data. Therefore, the accuracy of the participants’ self-reported data may be influenced by their measurement skills and their understanding of the ’proper’ way to take measurements. For example, WC differs significantly by measurement site (Mason & Katzmarzyk, 2009; Ostchega et al., 2021; Seimon et al., 2018), which may explain the significant differences between self-reported WC and measured WC in this study.
This is the first study to assess the accuracy of self-reported height, weight, and WC in poor, rural areas of China. However, this study also has some limitations. First, more than 60% of study participants reported only primary school education or lower, which may have an adverse effect on study results. Second, participants were not asked the time of their last measurements or the frequency of measurements, which may influence self-reported data. Third, participants were not informed that self-reported weight and height should be recorded without shoes and heavy clothing, which may have affected the accuracy of the data. Finally, this study was only conducted in one county, so the generalization of the results is limited. However, the study results indicate that the agreement between self-reported and measured values is likely to be greater among certain groups, such as self-reported height among professionals, self-reported weight among the younger population aged 18–44, or self-reported WC among men, as shown in Table 1. This highlights the variability in self-reported data across different demographics, suggesting that the applicability of the study findings may differ based on specific population characteristics.
Conclusions
In conclusion, the results of this study showed that although self-reported height is biased, self-reported weight is not biased, and self-reported BMI, which was calculated using self-reported height and weight, was sufficiently accurate for the assessment of overweight and obesity in poor, rural areas of China. Self-reported WC also had a high agreement with measured WC and was able to assess the rate of increased WC with a high sensitivity, but the 6.89% underestimate of increased WC using self-reported WC should be noted. The accuracy of self-reported data was also found to be affected by some demographic and socioeconomic variables. Therefore, interventions such as targeted health education and regular monitoring of weight and WC should target certain key populations with poorer self-reporting accuracy to improve the reliability of their self-reported data. Differences in the findings of this study and findings from Western countries should be further discussed and investigated as all previous studies showed that people tend to under-report weight, but self-reported weight was amazingly accurate in the present study. Also, contrary to the findings of studies in Western countries, the present study found that people tend to under-report WC.