

Different immunological characteristics of asymptomatic and symptomatic COVID-19 patients without vaccination in the acute and convalescence stages
- Published
- Accepted
- Received
- Academic Editor
- Octavio Barbosa Neto
- Subject Areas
- Allergy and Clinical Immunology, Epidemiology, Immunology, Infectious Diseases, COVID-19
- Keywords
- COVID-19, SARS-CoV-2, Asymptomatic, Symptomatic, Immune status, Mass cytometry
- Copyright
- © 2025 Li et al.
- Licence
- This is an open access article distributed under the terms of the Creative Commons Attribution License, which permits using, remixing, and building upon the work non-commercially, as long as it is properly attributed. For attribution, the original author(s), title, publication source (PeerJ) and either DOI or URL of the article must be cited.
- Cite this article
- 2025. Different immunological characteristics of asymptomatic and symptomatic COVID-19 patients without vaccination in the acute and convalescence stages. PeerJ 13:e18451 https://doi.org/10.7717/peerj.18451
Abstract
The immune status of Coronavirus disease 2019 (COVID-19) patients in different stages of infection remains difficult to determine. In this study, we performed high-throughput single-cell mass cytometry on peripheral blood samples from 10 COVID-19 patients and four healthy donors to analyze their immune status at acute and convalescence phases. During the acute stage, the proportion of neutrophils increased significantly while natural killer (NK) cells decreased. In contrast, during the convalescence phase, the proportion of plasma cells decreased from the acute stage of disease onset and was lower than normal. The proportions of B, mast and plasma cell subsets decreased significantly with the process of disease recovery. Further analysis of the subsets of major immune cell types in COVID-19 patients with different clinical presentations in different stages showed that in the acute stages of disease progression, the T helper cell 1 (Th1), IgD+ B and neutrophil subsets increased in COVID-19 patients, especially in symptomatic patients, while the central memory CD4+T cells (CD4 TCM), mucosa-associated invariant T (MAIT) and NK cell subsets decreased significantly, especially in symptomatic patients. Then CD4 TCM and MAIT returned to normal levels at the recovery phase. Dynamic assessment displayed that the immune imbalance at the onset of COVID-19 could be corrected during recovery. Our study provides additional information on the immune status of COVID-19 patients with different clinical manifestations in different stages. These findings may provide new insights into COVID-19 immunotherapy and immune intervention.
Introduction
Coronavirus disease 2019 (COVID-19), caused by severe acute respiratory syndrome coronavirus 2 (SARS-CoV-2), has led to a global public health emergency and attracted worldwide attention over the past three years. In addition to asymptomatic infections, the clinical classification of COVID-19 is mild, moderate, severe and critical (Guan et al., 2020; Su et al., 2020; Xu et al., 2022, 2020; Yang et al., 2020).
The immune response plays an important role in the fight against viral infections, including SARS-CoV-2, and may play a protective or pathogenic role in disease progression (Cao, 2020; Primorac et al., 2022; Sette, Sidney & Crotty, 2023). Currently, several studies have focused on acute phase-specific immune responses (Chevrier et al., 2021; Ren et al., 2021; Saichi et al., 2021; Wang et al., 2020b), and changes of the immune system during recovery from COVID-19 (Abarca-Zabalía et al., 2023; Wen et al., 2020). A study of acute and convalescent COVID-19 patients found that acute SARS-CoV-2 infection resulted in a severe reduction in several immune cells, including T cells (Walter et al., 2023), B cells (Mendez-Cortina et al., 2022), natural killer (NK) cells, monocytes and dendritic cells (DC) (Li et al., 2022b; Zhou et al., 2020). Wang et al. (2020a) found that total lymphocytes, CD4+ T cells, CD8+ T cells, B cells and NK cells were lower in severe patients than those in mild COVID-19 patients. Immune status varies with disease severity (Nasrollahi et al., 2023; Shi et al., 2021; Yao et al., 2021). However, few studies have investigated continuous immune changes in different disease stages in the same individual with different disease manifestations (Maamari et al., 2022). Therefore, a comprehensive immune response profile of COVID-19 patients remains to be validated.
Time-of-flight cytometry (CyTOF) is an advanced technique that integrates the principles of flow cytometry with mass spectrometry. In CyTOF, cells are tagged with isotopically labeled antibodies, allowing these markers to be precisely detected via mass spectrometry (Simoni et al., 2018). This enables the analysis of single cells in great detail, facilitating a comprehensive characterization of immune system changes under various conditions through multiparametric single-cell analysis (Simoni et al., 2018). In the present study, we used CyTOF to detect changes in immune cell surface markers in peripheral blood mononuclear cells from patients with asymptomatic infection and moderate/severe patients in the acute and convalescent stages of COVID-19. Based on this study, we were able to construct immune profiles for different periods of SARS-CoV-2 infection. The data from this study provide a comprehensive map of immunological responses in different stages after SARS-CoV-2 infection, which is of great importance for further understanding and treatment of COVID-19.
Materials and Methods
Study subjects
A total of 10 COVID-19 patients and four healthy controls (HCs) were recruited from the Fifth Hospital of Shijiazhuang from January 2021 to April 2021. All individuals were unvaccinated against SARS-CoV-2. The definitions and classifications of COVID-19 patients comply with the guidelines of the “World Health Organization, Chinese Diagnosis and Treatment Protocol for COVID-19 Patients (Tentative 8th Edition)” and Chinese Prevention and Control of COVID-19. The COVID-19 patients confirmed by positive SARS-CoV-2 nucleic acid test were divided into two groups: (1) symptomatic cases (four moderate cases and two severe cases), (2) asymptomatic cases (n = 4). Patients with moderate disease have symptoms such as fever, respiratory symptoms, etc., and imaging showed pneumonia. Patients who meet any of the following are classified as severe patients (1) Shortness of breath, RR ≥ 30 per min. At rest, oxygen saturation ≤93% when sucking air; Arterial partial pressure of oxygen (PaO2)/oxygen absorption concentration (FiO2) ≤300 mmHg (1 mmHg = 0.133 kPa). Asymptomatic cases are defined as those with positive for SARS-CoV-2 test and without any clinically recognizable or self-perception symptoms over the latest 14 days. HCs were defined as individuals without any clinical symptoms and had two consecutive negative SARS-CoV-2 nucleic acid tests (interval >24 h). Individuals who had other infections, tumors, severe hepatic and renal system diseases and previous major diseases, such as autoimmune diseases and metabolic diseases, were excluded.
A total of 24 peripheral blood mononuclear cell (PBMCs) samples were collected, including samples from 10 patients at both acute and convalescent time points and four samples from HCs. Blood samples were collected within 7 days of onset (acute) and 21 days after admission when they reached the standard of discharge (convalescence).
Patients in the acute stage was defined as individuals who tested positive for SARS-CoV-2 nucleic acid through quantitative real-time polymerase chain reaction, and were within 7 days of symptom onset. Among these, cases exhibiting no symptoms and those presenting symptoms were designated as asymptomatic_1 and symptomatic_1, respectively. On the other hand, patients in the convalescent stage were characterized by having two consecutive negative SARS-CoV-2 tests with an interval of more than 24 h once they met the discharge criteria. Additionally, all the collected samples were obtained 21 days after the onset of symptoms. The subgroups within the convalescent stage were labeled as asymptomatic_2 and symptomatic_2.
Demographic features, clinical and laboratory testing data were extracted from electronic medical records. Detailed information on the participants was shown in Table S1. This study was discussed and approved by the Ethics Committee of the Fifth Hospital of Shijiazhuang (IRB number: 2020008) and obtained the paper version of informed consent.
Preparation of PBMCs
Peripheral blood samples from all subjects were collected into blood collection tubes containing ethylenediaminetetraacetic acid (EDTA). PBMCs were isolated by density gradient centrifugation using human PBMC isolation buffer (produced by Serumwerk Bernburg AG for Alere Technologies AS, Oslo, Norway). The mononuclear cells were collected and washed twice with phosphate buffered saline (PBS). The cells were stored at liquid nitrogen until analysis.
Antibodies and antibody labeling for mass cytometry
A total of 42 antibodies were designed to characterize the immune cell phenotype. All antibodies utilized for analysis were documented in Table S2, inclusive of their specificity information. Purified primary antibodies were purchased from Fluidigm were already labeled with metal isotopes. Antibodies from other companies were labeled with metal isotopes using a Maxpar antibody labeling kit (Fluidigm, South San Francisco, CA, USA). Antibody stabilization buffer (Candor Bioscience, Allgäu, Germany) was added, and the antibodies were stored at 4 °C. Prior to the experiment, the conjugated antibodies were titrated to determine the optimal concentration.
Staining of PBMCs
PBMCs were stained with 50 nM cisplatin solution (Life Sciences, Amsterdam, Netherlands) for 1 min at room temperature to reject suitability. Cisplatin was quenched with five volumes of MaxPar Cell Staining Buffer (CSB; Fluidigm, South San Francisco, CA, USA), and the cells were stained with monoclonal antibodies conjugated to metal isotopes for 30 min at 4 °C. Cells were fixed overnight at 4 °C with MaxPar Fix and Perm Solution (Fluidigm, South San Francisco, CA, USA) containing 125 nM Cell-ID Intercalator-Ir (Fluidigm, South San Francisco, CA, USA). After washing with CSB and Milli-Q water, the cells were resuspended in cell acquisition solution and stored at 4 °C until collection.
Mass cytometry data acquisition and analysis
On average, cells for each sample were identified into mass cytometry. Mass cytometry data were randomized using the Fluidigm acquisition algorithm (V6.0.626). Individual samples were artificially gated using FlowJo to exclude normalizing beads, cell debris, dead cells, and duplexes for further analysis to identify cells. The removal of EQ beads and isolation of cells were achieved by setting the x-axis to Event_length, adjusting the range to 0–60, and the y-axis to the EQ beads channel, selecting regions where the x-values are below 40 and y-values are below 102. Isolate individual cells by setting both axes to DNA, with the brightest area in the graph indicating the target cells, and continue with further processing of these cells. Isolate live immune cells by setting the x-axis to CD45 and the y-axis to Pt platinum dye, typically selecting around 102 or below on the y-axis and generally above 101 on the x-axis for immune cells. Finally, for each sample were used for data analysis. Data were subsequently transformed using asinh (cofactor 5) and normalized to the 99.9th percentile for each channel in the R environment (V3.6.1). For dimensionality reduction analysis, the Barnes-Hut implementation of the T-distributed stochastic neighbor embedding (t-SNE) algorithm was applied using the Rtsne package. Then, they were clustered with the phenograph algorithm by the cytofkit package using k = 30.
Detection of SARS-CoV-2 nucleic acid
Nasopharyngeal swab or throat swab samples from all subjects were collected according to the “Technical Guidelines for Laboratory Testing of COVID-19” formulated by the National Health Commission of China (Chinese Center for Disease Control and Prevention, 2020). Nucleic acid testing was performed within 24 h of sample collection. Viral RNA was extracted using an RNA extraction kit (Cat No. DA0930-DA0932; DaAnGene, Guangzhou, China) according to the manufacturer’s instructions. Real-time reverse-transcriptase quantitative PCR (RT‒qPCR) analysis was performed using a novel coronavirus nucleic acid detection kit (DaAnGene, Guangzhou, China). The cycle threshold (CT) values of nucleic acids of the SARS-CoV-2 ORF1ab/N gene were less than or equal to 40, and there was a clear amplification curve, which could be judged as positive according to the manufacturer’s instructions.
Serum IgM and IgG antibody detection
Prior to testing, all serum samples were stored at −20 °C and subsequently inactivated using a 56 °C water bath or oven for 30 min at ambient temperature following thawing. IgM and IgG antibody levels were assessed utilizing the Novel Coronavirus (2019-nCoV) IgM Antibody Detection Kit (approval number: 20203400769) and the novel coronavirus (2019-nCoV) IgG antibody detection kit (approval number: 20203770) supplied by Shenzhen Yahuilong Biotechnology Co., Ltd (Shenzhen, China). Subsequently, a calibration curve was constructed to quantify the levels of IgM and IgG antibodies. Results with a detection value ≥10.0 AU/mL were classified as positive.
Statistical analysis
Statistical analyses were carried out using the SPSS 25.0 statistical package (IBM, Armonk, NY, USA). Differences between groups were determined by Wilcoxon rank-sum test and visualized using the R package ggplot2. The results were presented as the mean ± standard deviation or median and interquartile range. Statistical significance was assessed using the Mann‒Whitney U test for two groups or Kruskal‒Wallis test with Dunn’s posttest for multiple groups. P value ≤ 0.05 was considered to indicate significance.
Results
Clinical characteristics and single immune cell map design of COVID-19 patients
To chase the immunological responses in different stages after SARS-CoV-2 infection, 10 patients and four health control were involved in this study. The demographic and clinical characteristics of all patients and HCs were presented in Table S1. The 10 patients including two males and eight females and ranged from age 30 to 89 years old, with a median of 60 years old. A total of five (50%) people suffered from chronic diseases, such as hypertension and diabetes. The age of the HCs group was 50.50 (47.50–53.75) years old and without chronic diseases (Tables S1, S4). Cycle threshold (CT) values were shown in Tables S1, S5. In acute stage, the CT values of ORF1ab gene in symptomatic and asymptomatic patients were 23.18 (19.95–34.95) and 29.6 (26.25–30.82), respectively. The CT values of the N gene in symptomatic and asymptomatic cases were 22.09 (18.54–33.75) and 30.12 (26.79–30.62), respectively. A detailed laboratory examination results were shown in Fig. 1A, Tables S1 and S5. Lymphocyte counts were significantly lower in the acute phase than in the convalescence phase only among those with symptomatic cases (Fig. 1A). As for IgM and IgG antibodies against SARS-CoV-2, IgG antibody level in the symptomatic group was significantly higher in the convalescent period than that in the acute period (Fig. 1A). Meanwhile, IgM antibody levels in all COVID-19 patients were significantly higher in the convalescent period than that in the acute period, but IgM antibody level in the symptomatic group was significantly higher than in the HCs group (Fig. 1A).
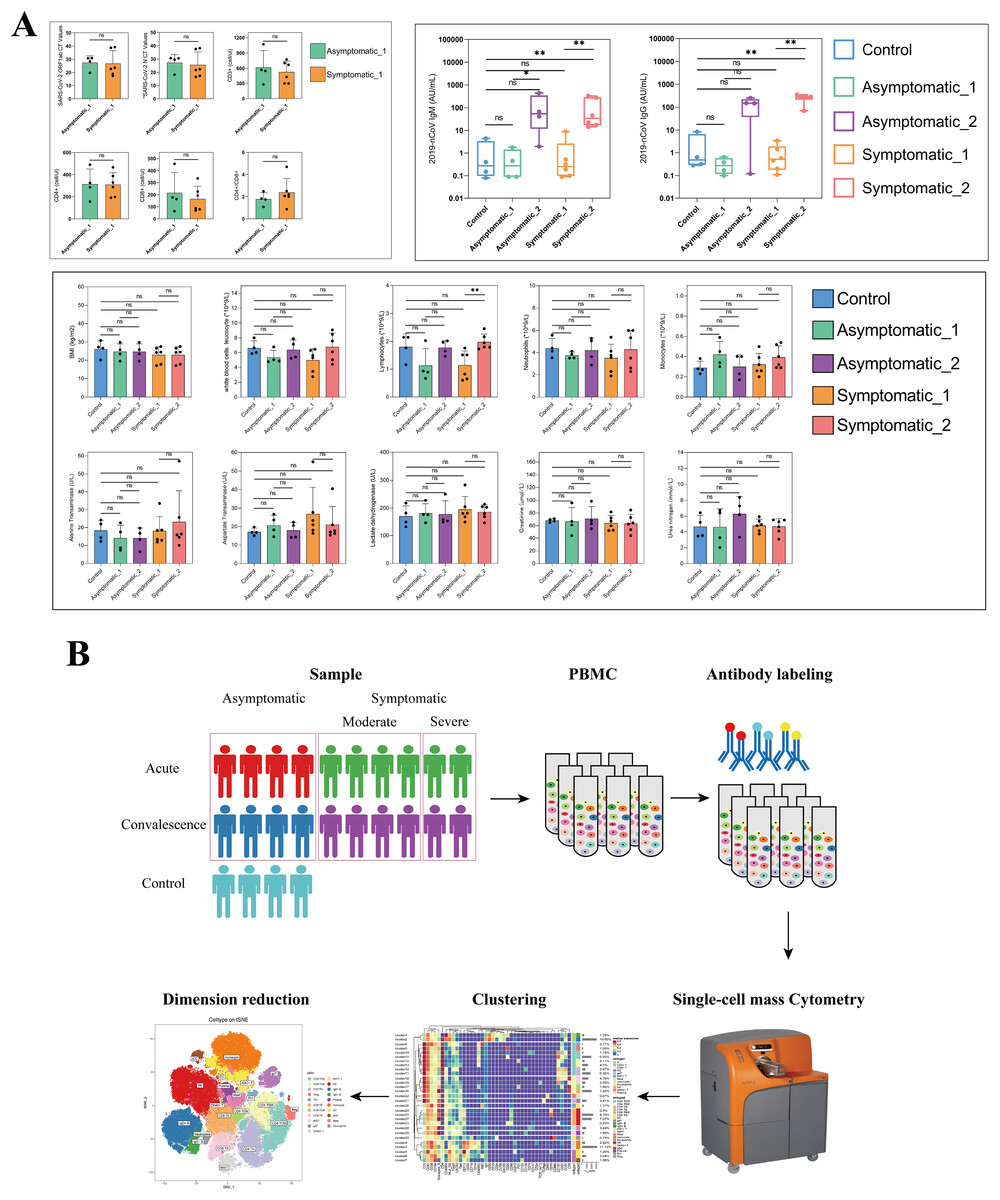
Figure 1: Major clinical parameters and study design and in different groups.
(A) Quantification of key clinical laboratory indices in the different stages of COVID-19 and healthy controls (ns p > 0.05, *p < 0.05, **p < 0.01). (B) Schematic of study design based on mass cytometry (CyTOF) in peripheral blood mononuclear cells (PBMCs) of COVID-19 patients and healthy controls.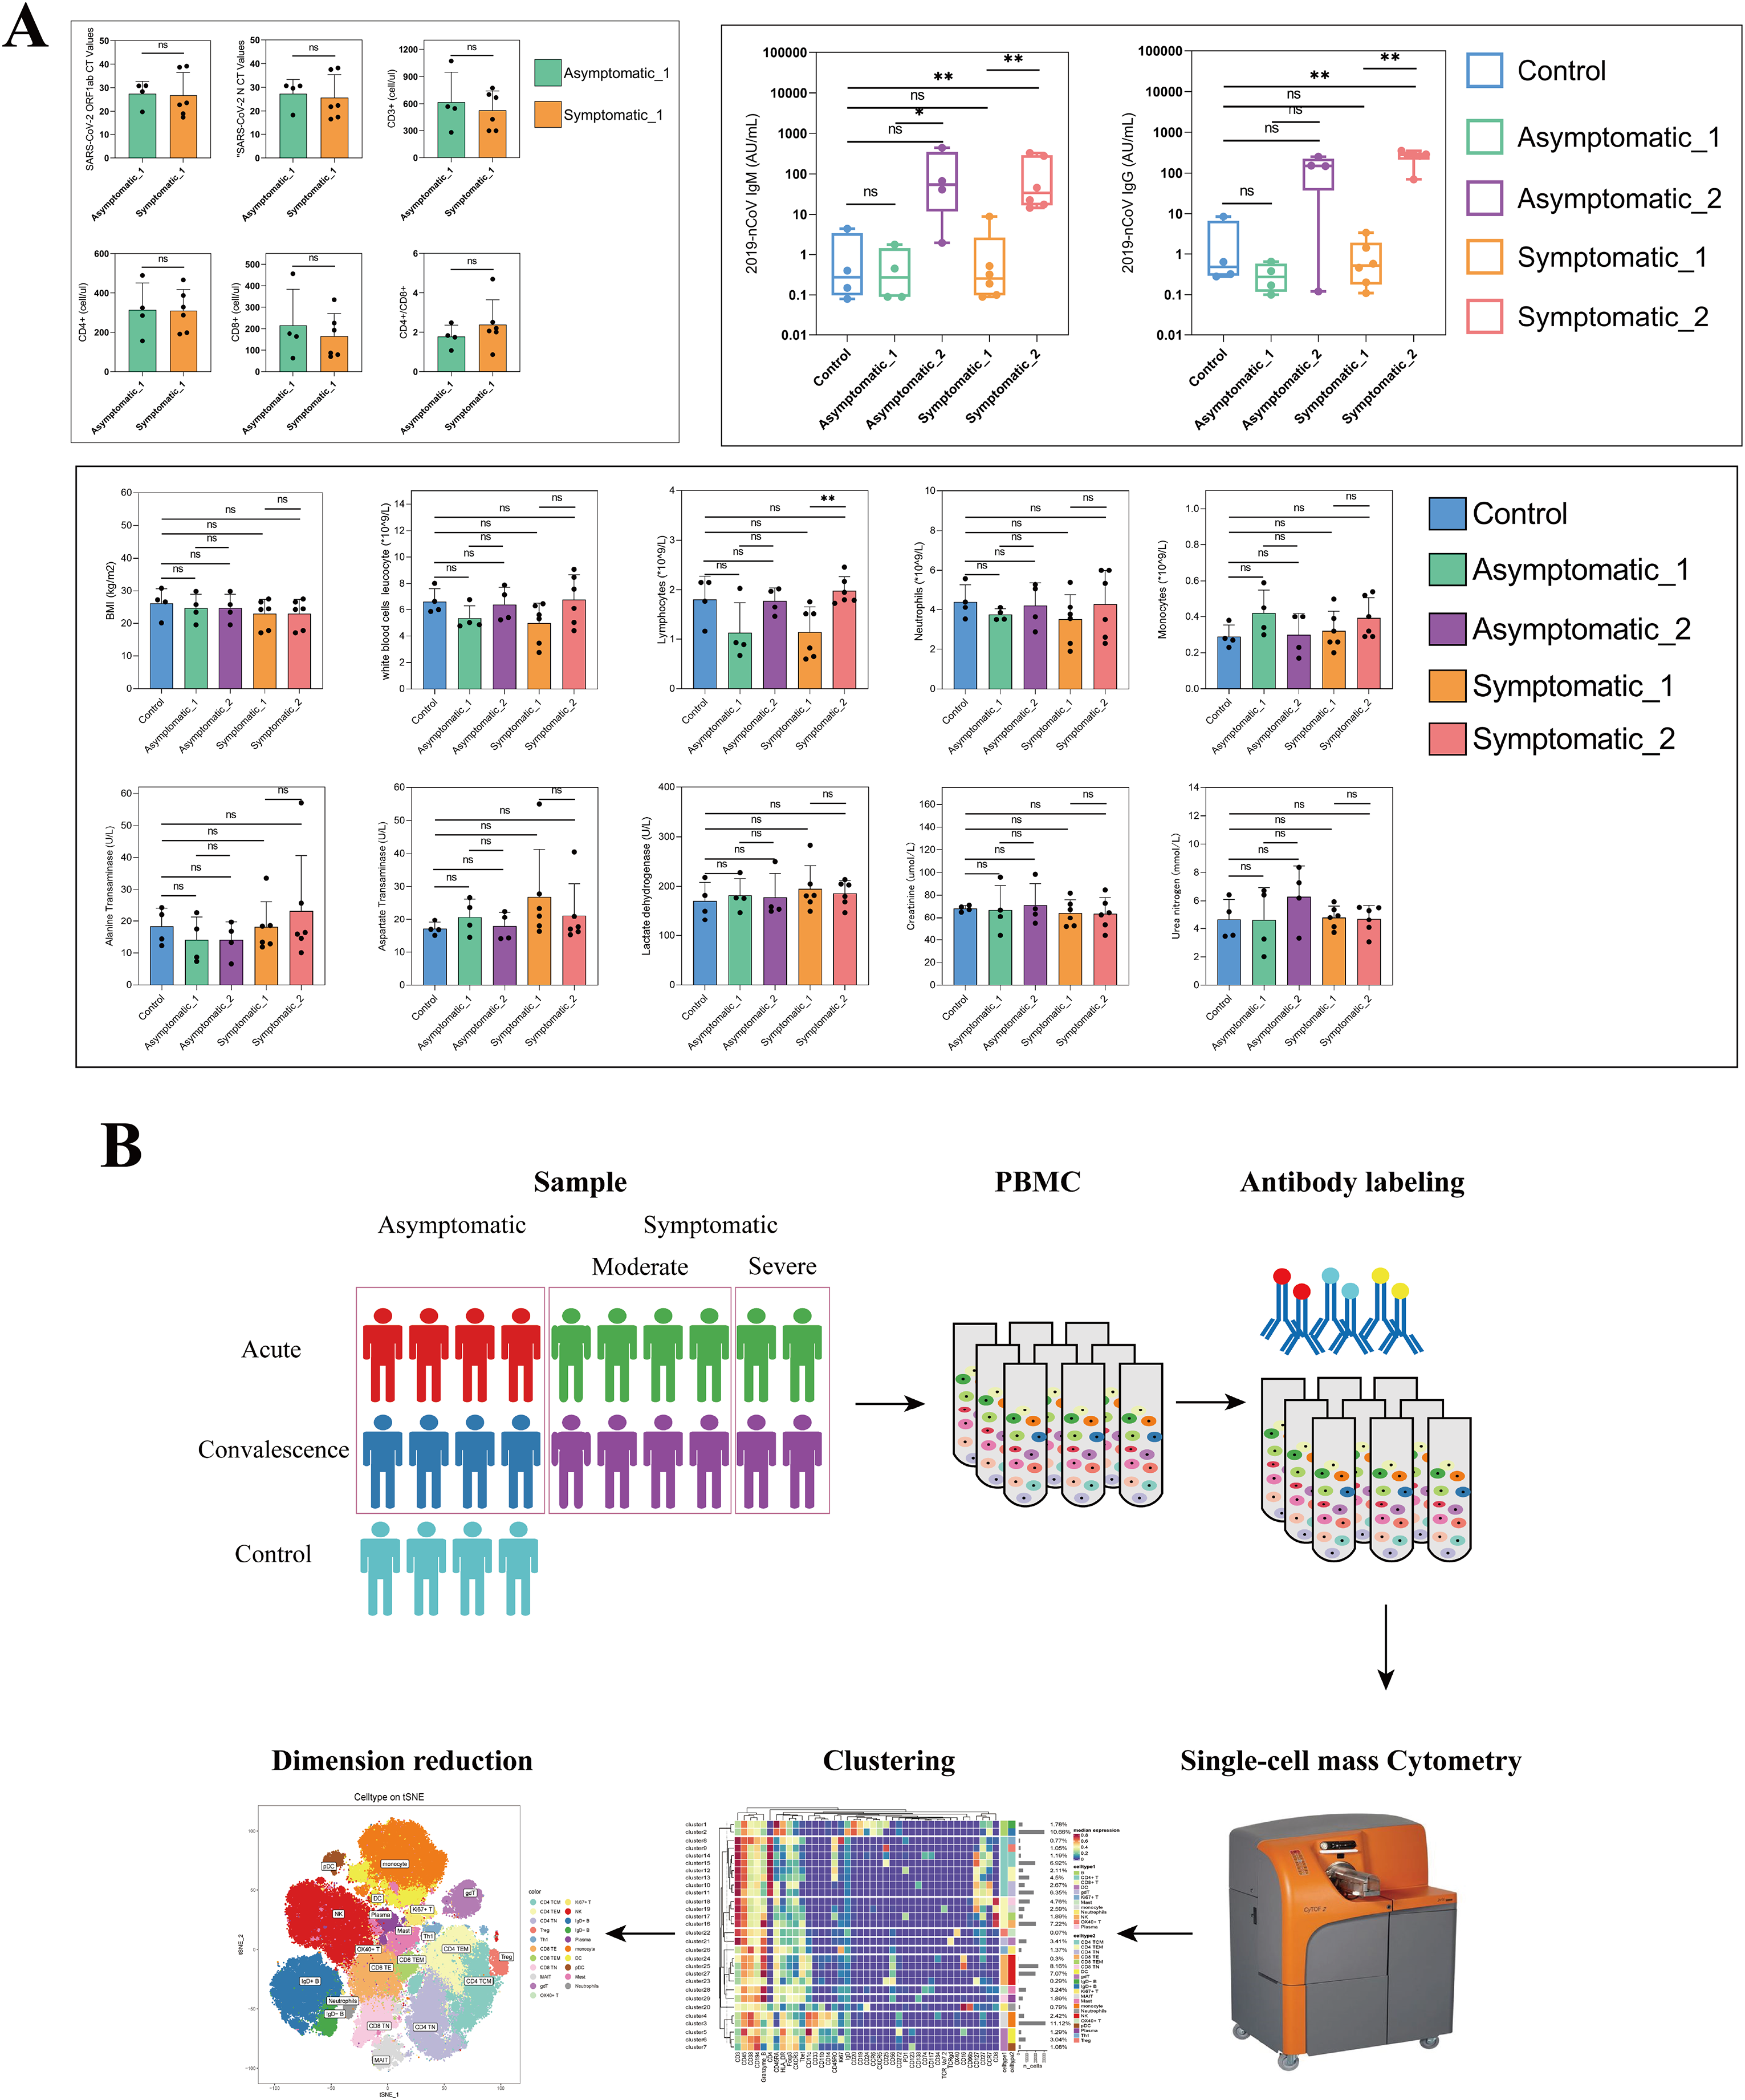
To reveal the immunological responses at the single-cell level, CyTOF was used in this study. A schematic overview of the CyTOF workflow is depicted in Fig. 1B. The CD45+ cells of COVID-19 patients and HCs were divided into 29 immune cell subsets (Fig. S1A, Table S3), including four NK-cell subsets, two B-cell subsets, three DC subsets, two monocyte subsets, eight CD4+ T-cell subsets, four CD8+ T-cell subsets, one neutrophil subset, one gdT cell subset, one OX40+ T cell subset, one Ki67+ T cell subset, one mast subset and one plasma cell subset (Fig. S1B). t-SNE analysis was used to visualize the high-dimensional data and the expression level of each protein maker were illustrated by color scale from blue to red in Fig. 2A. So the immune maps of 12 types of major immune cell subgroups of all patients and HCs were obtained (Fig. 2B). Expression pattern of each protein markers was summarized for major cell subsets of immune cell clusters (Fig. S1C, Table S3). Variances in the distribution and composition of the primary immune cell subsets were noted between COVID-19 patients exhibiting varying symptoms and healthy controls (Figs. 2C, S1E). Simultaneously, the composition of different cell subsets in each sample was described (Fig. S1D).
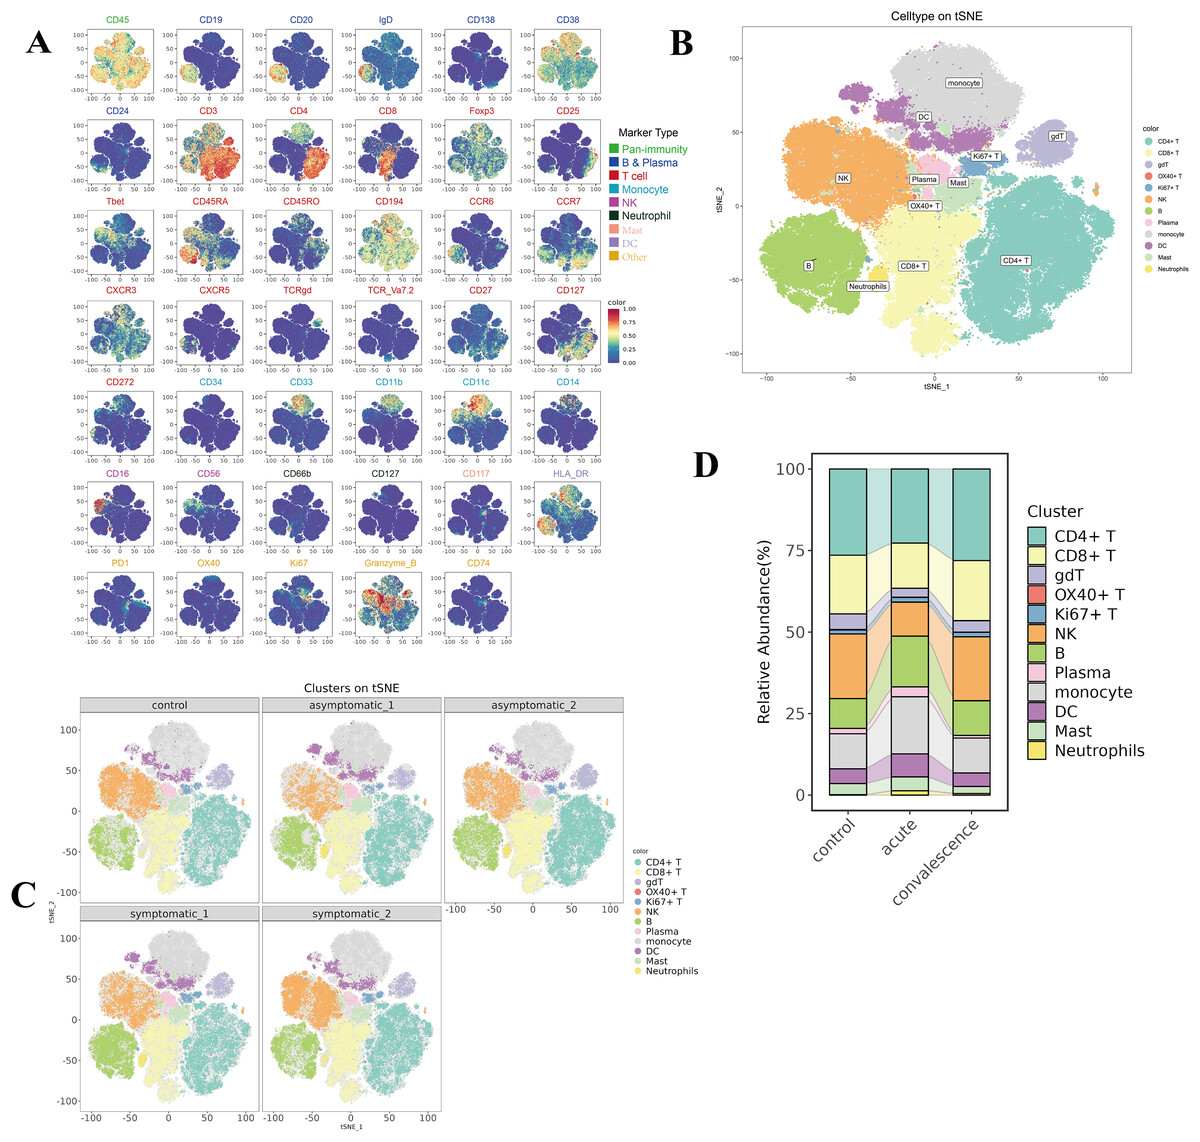
Figure 2: Identification of diverse cell clusters and subclusters in PBMCs from patients.
(A) t-Distributed Stochastic Neighbor Embedding (t-SNE) plot of the distribution of each subset of 12,000 cells per sample from COVID-19 patients, including CD4+ T cells, CD8+ T cells, B cells, NK cells and other subpopulations, a total of 9 major immune populations with their respective labels indicated by color of marker type legend. (B) t-SNE plots of the distribution of major cell subsets in acute and convalescence stages of symptomatic and asymptomatic COVID-19 patients and healthy controls. (C) t-SNE plots of the distribution of the expression of each marker protein from all the PBMCs. Each point in the figure is a cell, and the colour is the expression of the marker protein in the cell. The redder the colour, the higher the expression of the protein. (D) Sankey diagram of cellularity of major cell subsets from the control, acute and convalescent.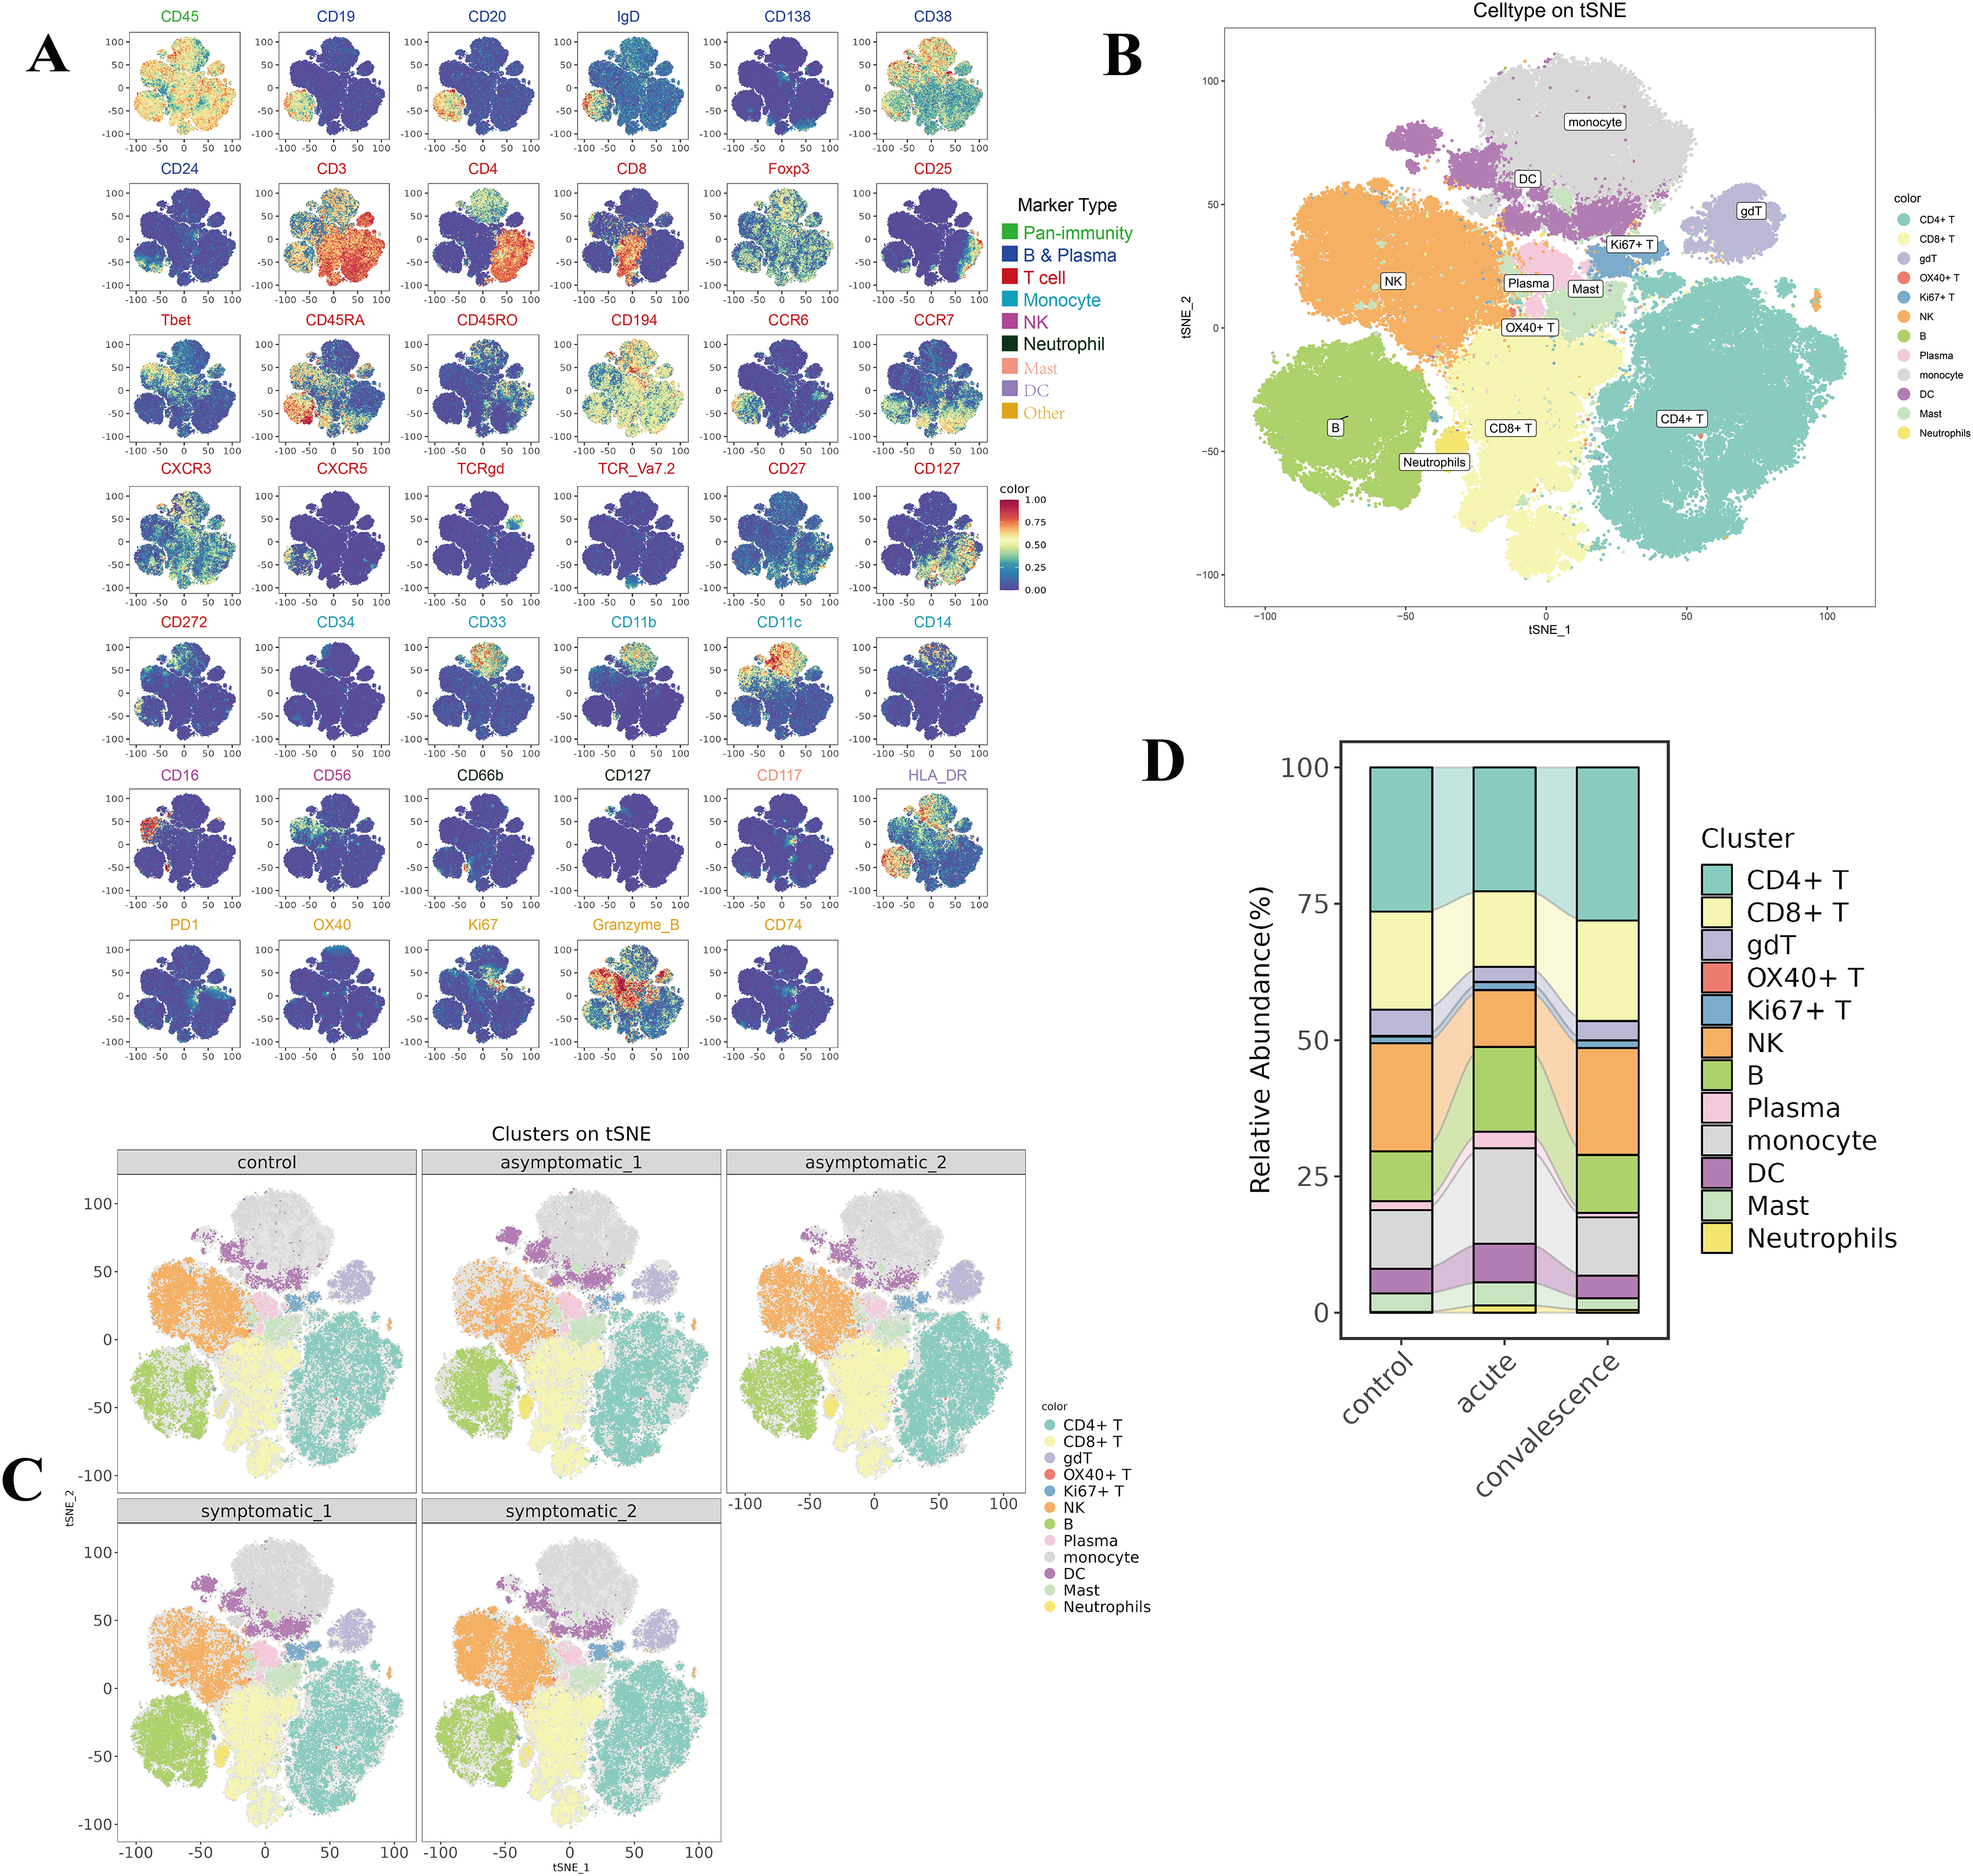
By comparing the percentage profiles of major immune cell subsets in COVID-19 patients with different clinical manifestations in the acute and convalescence phases and HCs, we found that the immune cell subsets in patients with COVID-19 were distinct from HCs, (Figs. 2D, S1E). Specifically, we focused on the variations observed in T cells, B-cell subsets, NK cells, DCs, monocyte subsets, neutrophil cells, and mast cells.
Altered immune signatures of T-cell subsets
Human T cells are the main immune cells against viral infection and play an important role in viral clearance. In this study, fifteen T lymphocyte subsets were differentiated into five types of CD4+ T cells, CD8+T cells, gdT, OX40+ T cells and Ki67+T cell subsets according to the expression of typical lineage markers (Fig. S1C), and were mapped into t-SNE of all participants (Fig. 3A). Moreover, we analyzed the changes in major T-cell subsets in patients with different stages and clinical presentations and healthy controls (Fig. 3B).
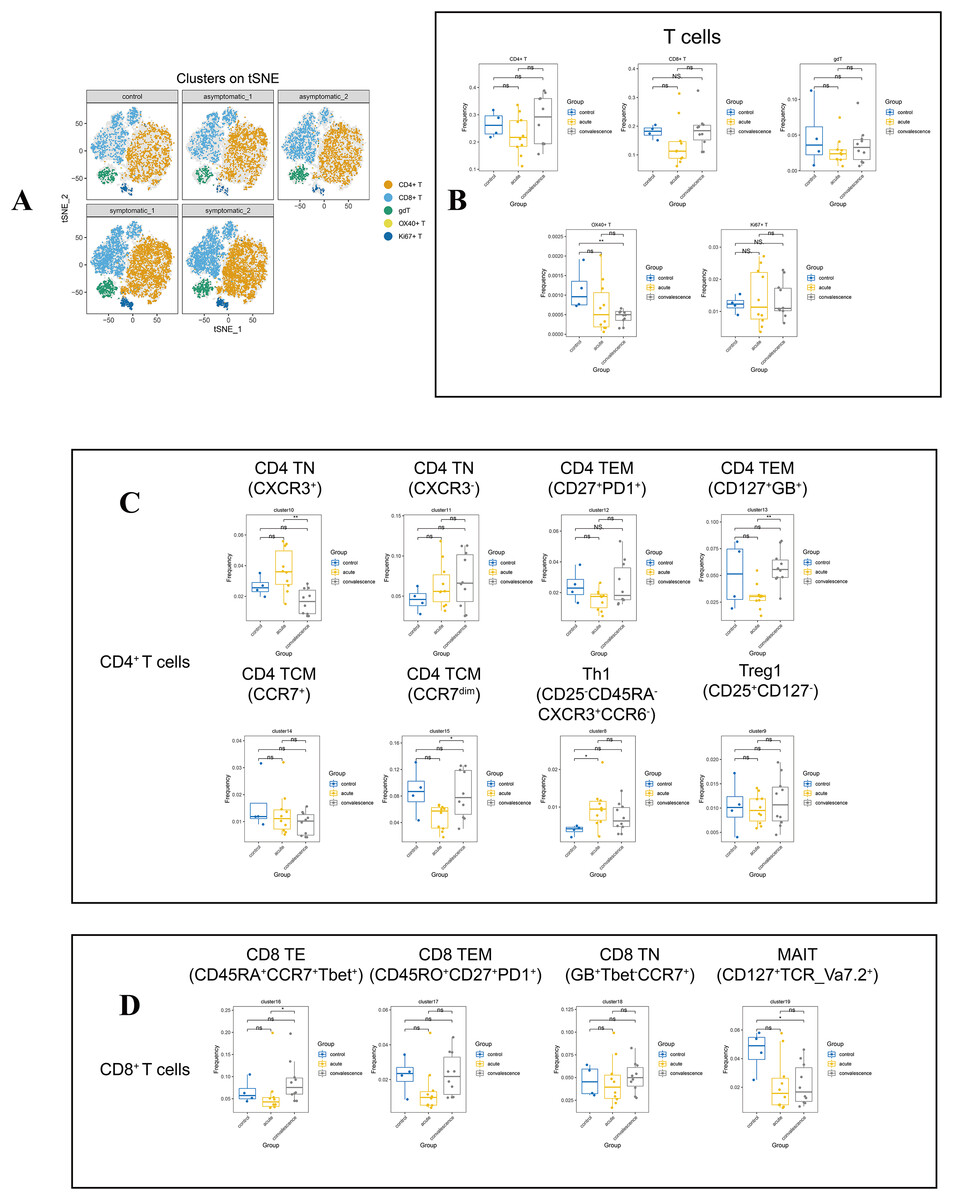
Figure 3: In-depth signature of T cells in COVID-19 patients and healthy controls.
(A) t-SNE plot of normalised marker expression on the T-cell subsets from all patients and controls. (B) Boxplots showing the differences in the proportion of CD4+ T cell, CD8+ T cell, and other major T cell subsets from the acute, convalescence and control groups (ns p > 0.05, *p < 0.05, **p < 0.01). (C) Boxplots showing the differences in the frequencies of the CD4 T cell clusters from acute, convalescence and control (ns p > 0.05, *p < 0.05, **p < 0.01). (D) Boxplots showing the differences in the frequencies of the CD 8 cell clusters from acute, convalescence and control (ns p > 0.05, *p < 0.05, **p < 0.01).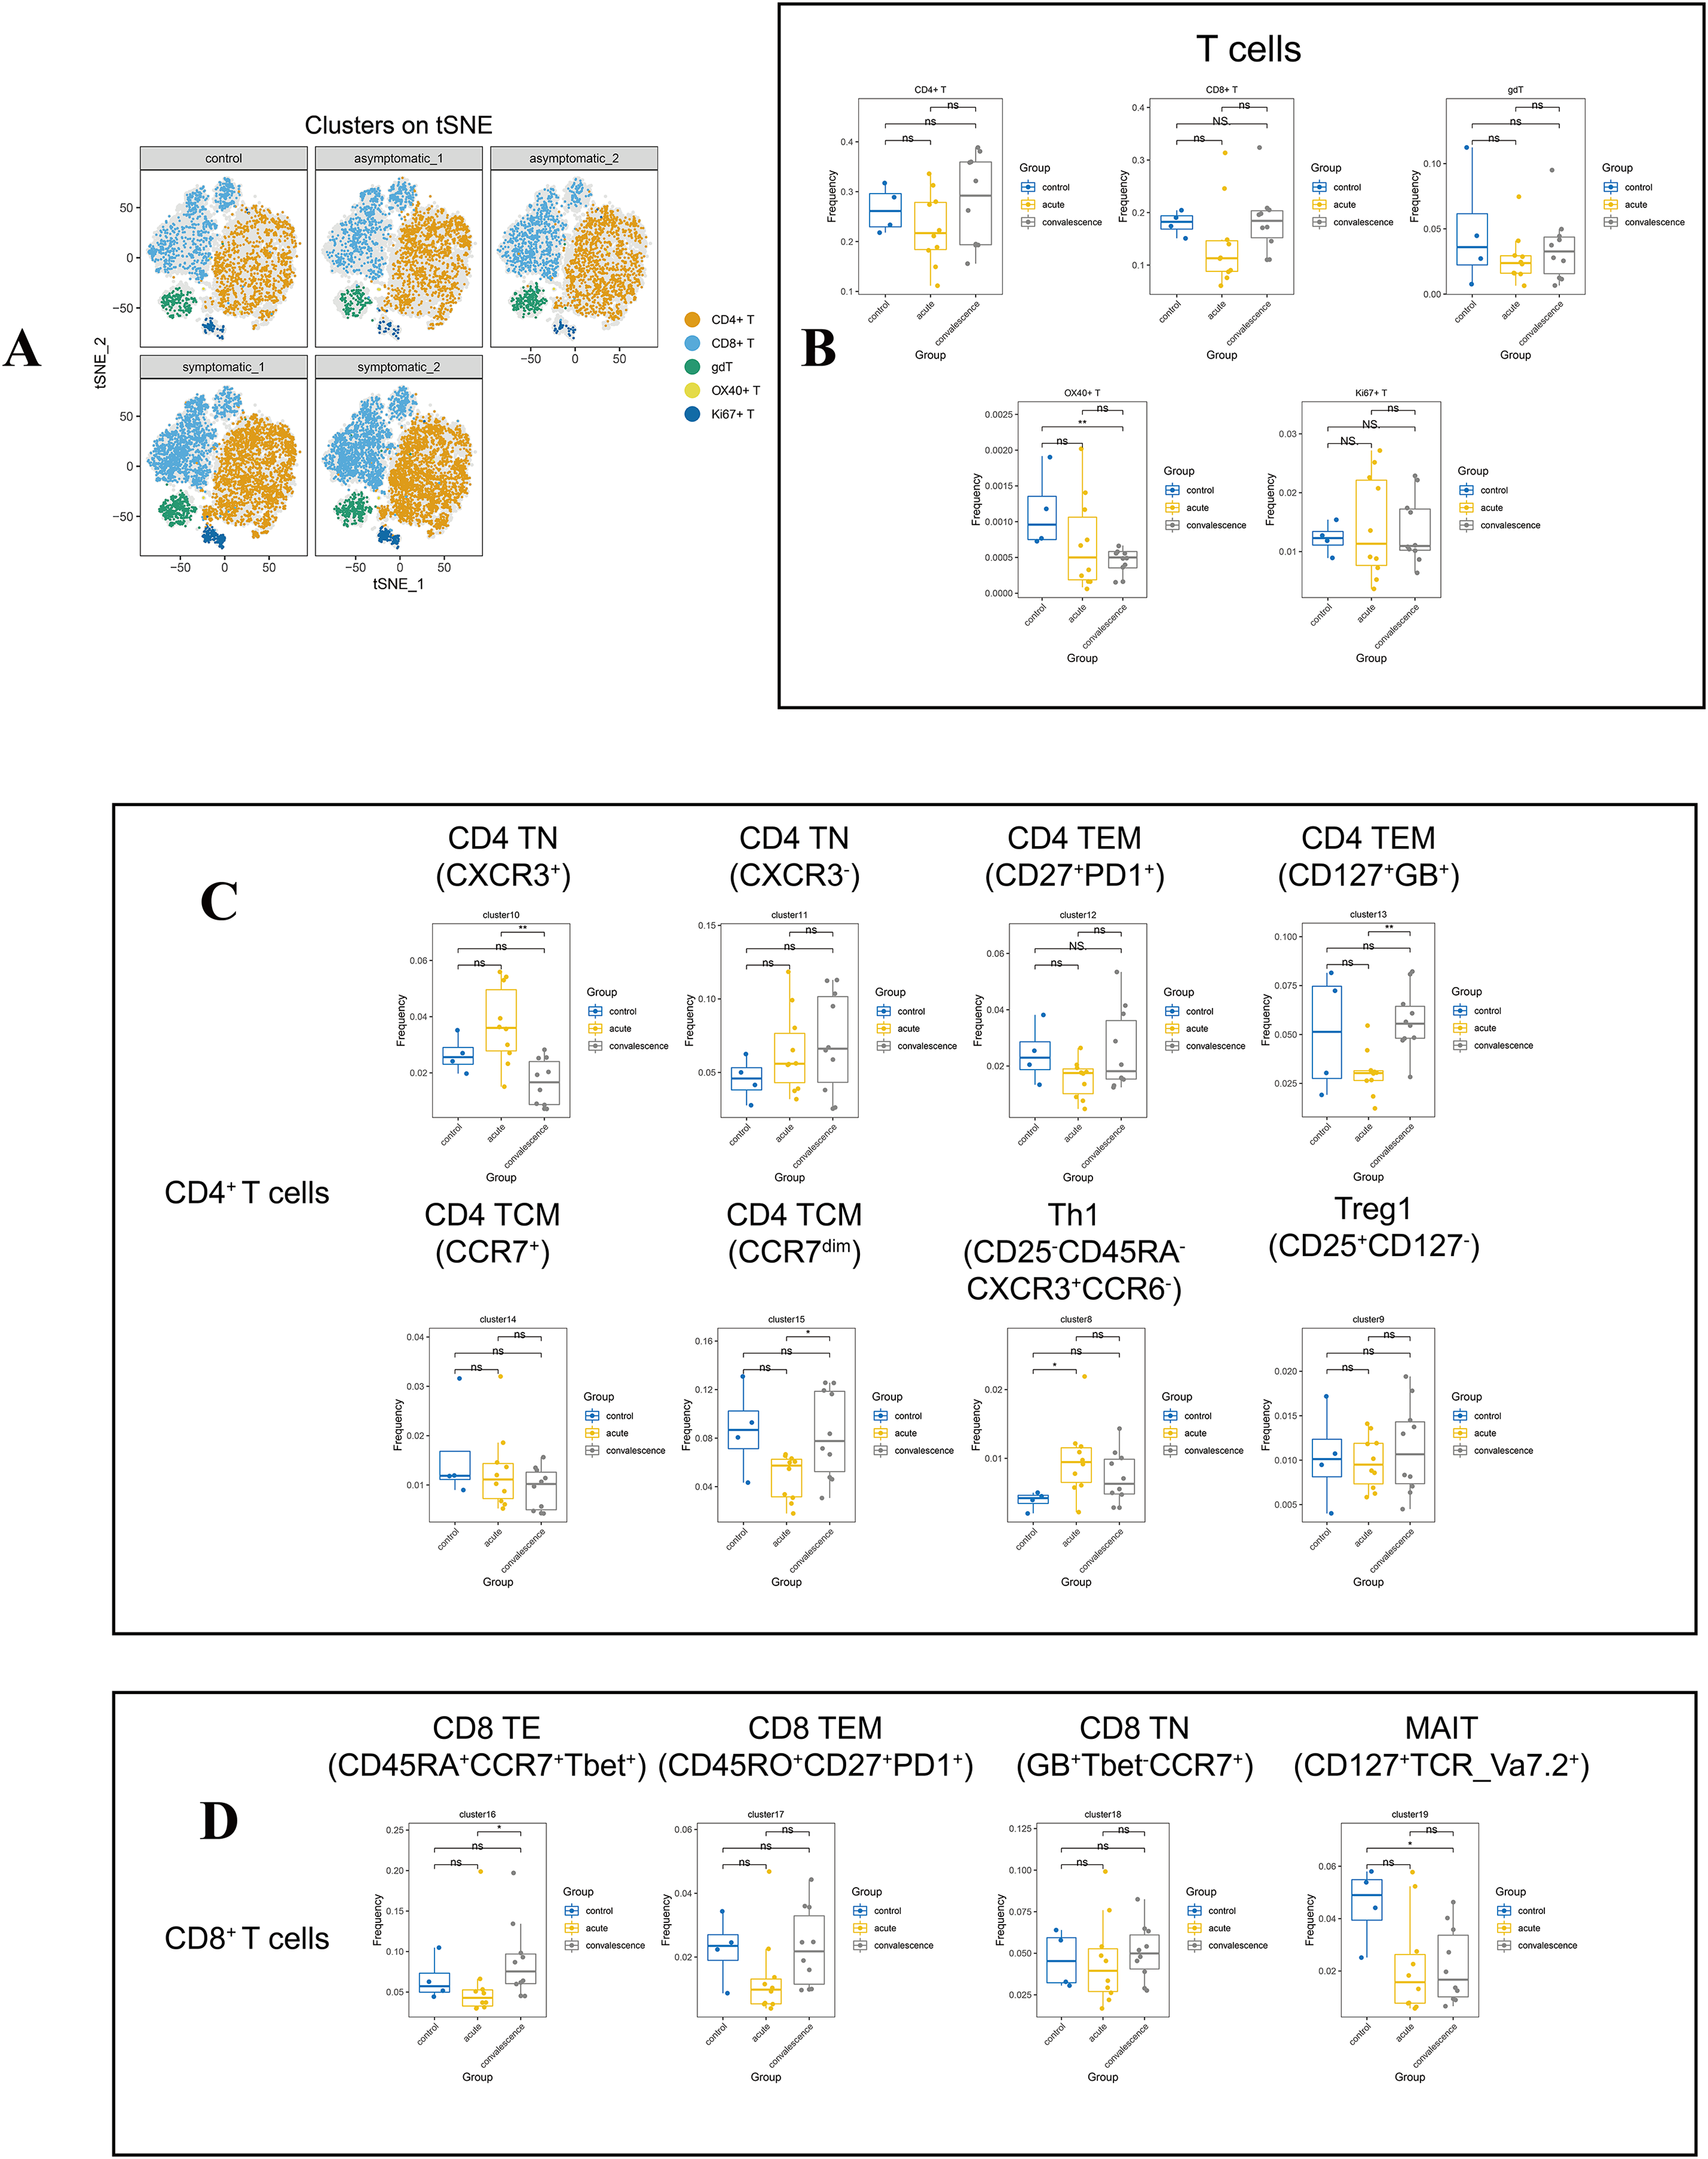
By comparing the changes in the main T lymphocyte subsets in different disease stages, the frequency of OX40+ T cells (CD3+OX40+) in the convalescence stage of COVID-19 patients were significantly lower than healthy controls (Figs. 3B, S2B). According to the different functional characteristics of T cells, we divided CD4+ T cells into five categories: naïve CD4+ T cells (CD4 TN) (CD3+CD4+CD45RA+CD45RO−CD127+CCR7+), effector memory CD4+ T cells (CD4 TEM) (CD3+CD4+CD45RA−CD45RO+CD127+CCR7−), central memory CD4+T cells (CD4 TCM) (CD3+CD4+CD45RA−CD45RO+CD127+), type 1 T helper (Th1) (CD3+CD4+Foxp3+ CXCR3+CD45RO+ki67+CD127−) and regulatory T cells (Tregs) (CD3+CD4+Foxp3+ CD25+CD45RO+ki67−CD127−) (Fig. S1C, Table S3). According to Figs. 3C and S2C, cluster 10 (CXCR3+) of CD4 TN cell subsets in both symptomatic and asymptomatic patients decreased during convalescence stage than that at acute stage, while the frequency of cluster 15 (CD25+CD27dimCCR7dim) in CD4 TCM and cluster 13 (CD127+Granzyme_B+) in CD4 TEM showed the opposite trend. In addition, the frequency of Th1 cells was increased obviously in the acute stage of COVID-19 compared to healthy controls.
In addition, in the CD8+ T cell subsets, there were effector CD8+ T (CD8 TE) cells (CD3+CD8+CD45RA−CCR7−Tbet+), effector memory CD8+ T (CD8 TEM) cells(CD3+CD8+CD45RO+CD45RA−CCR7-CD27+PD1+), naïve CD8+ T (CD8 TN) cells (CD3+CD8+CD45RA+CD127+CD27+CCR7+CXCR3+), mucosa-associated invariant T (MAIT) (CD3+CD8+CD45RA−CCR7−CD127+TCR_Va7.2+). Also it was found that cluster 21 as gdT cluster (CD3+TCRgd+), cluster 22 as OX40+T cells (CD3+OX40+), and cluster 26 (CD3+CD45+Ki67+) as Ki67+T cells. Cluster 16 (CD45RA+CCR7+Tbet+) in CD8 TE cell subsets was significantly increased in convalescence stage than that in acute stage. The frequency of MAIT cell subset and OX40+ T cell were decreased significantly in patients at convalescent stage than that in healthy controls (Figs. 3B, 3D). In contrast, no differences were observed in the frequencies of all the CD8+ T-cell subsets and other T-cell subsets in acute or convalescence COVID-19 patients with different clinical presentations (Figs. S2D, S2E).
We also observed differences in surface markers of major T-cell subsets between symptomatic and asymptomatic groups of patients with COVID-19 during acute and convalescence stage vs healthy controls (Fig. S3A), the overall expression of cell-defining markers was consistent with changes in cell subsets.
Alterations in the immune profile of B-cell subsets, NK cells, DCs, monocyte subsets, neutrophil cells and Mast cells
B cells play a crucial role in the immune response to COVID-19 by producing antibodies that target the virus and aid in its clearance from the body. The frequency of B cells was significantly higher in acute phase than that in convalescence phase (Fig. 4A). Symptomatic COVID-19 patients at the acute phase had higher B cell levels than HCs. To further investigate the variation in B-cell subsets, we detected three major peripheral blood B-cell subsets by clustering, namely IgD− B cell subset (CD3−IgD−CD19+CD20+CD25+CD24+CCR6+), IgD+ B cell subset (CD3−IgD+CD19+CD20+CD25−CD24−CCR6+CCR7+) and plasma cell subset (Fig. 4A). By analyzing the t-SNE plots of all B-cell frequencies in patients with different disease stages (Fig. S4A), we found that the frequency of B-cell subsets in COVID-19 patients decreased significantly in the convalescent phase compared to the acute phase, especially the IgD+ B-cell subsets and plasma cell subsets (Fig. 4A). While the proportion of IgD+ B-cell subsets in the symptomatic group increased significantly in the acute phase compared to the convalescent phase and HCs (Fig. 4A). The proportion of IgD− B-cell subsets in the asymptomatic group increased significantly in convalescence phase compared to the acute phase (Fig. S4B). In addition, the expression levels of CD19, CD24, CD27, IgD and CXCR5 in B cells were significantly different between the asymptomatic group and the healthy control group in the acute and convalescent phases of COVID-19 patients (Fig. 4B).
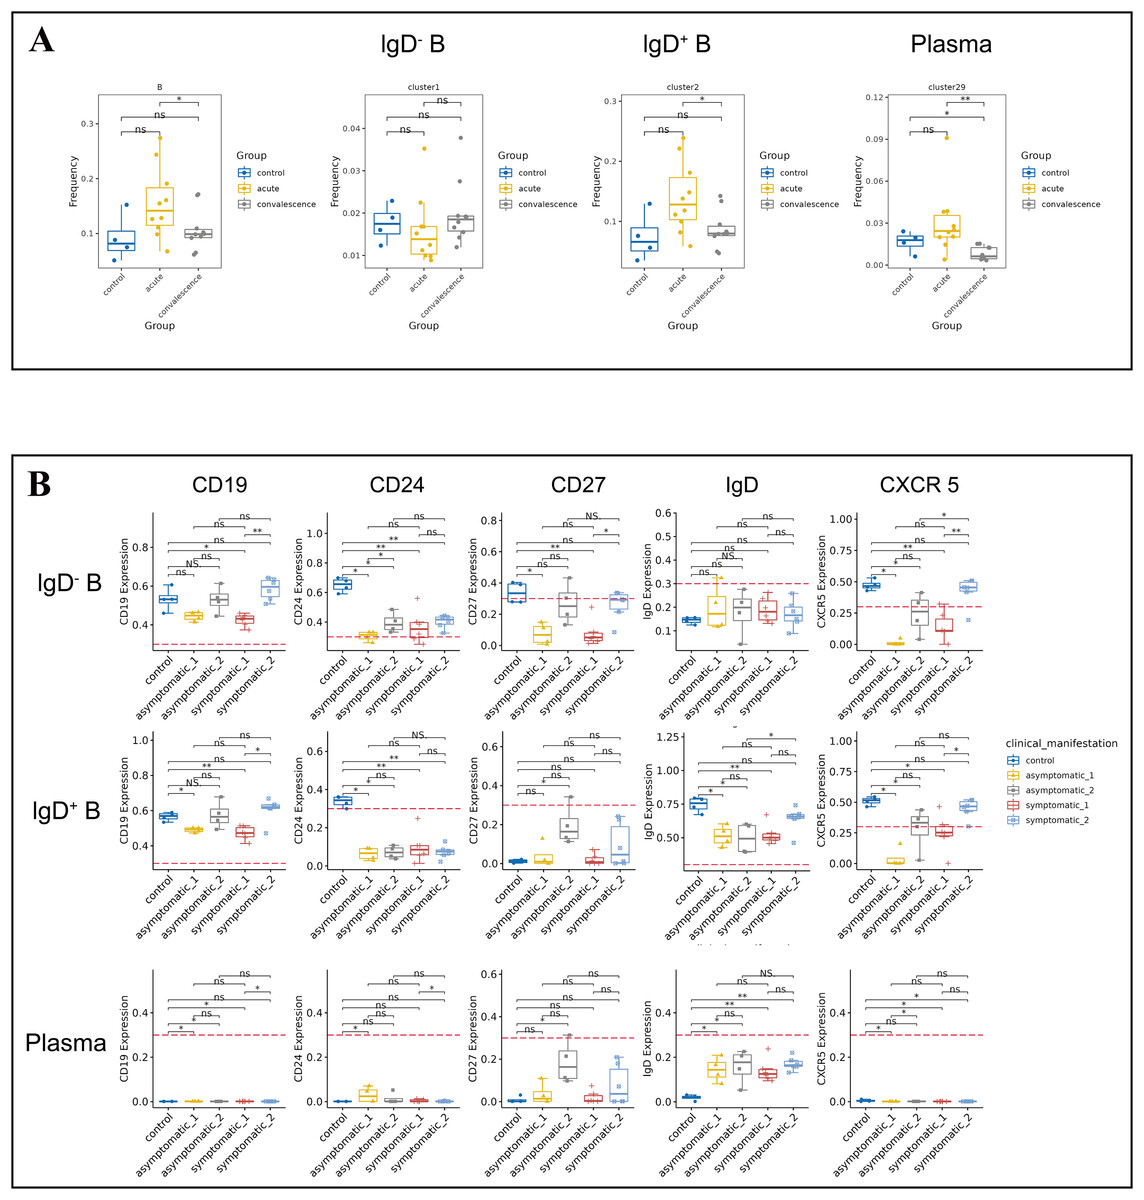
Figure 4: Immunological characteristics of B cells in COVID-19 patients and healthy controls.
(A) Boxplots showing the differences of total B-cell and each major B-cell subsets in acute and convalescence COVID-19 patients and healthy controls (ns p > 0.05, *p < 0.05). (B) Boxplots demonstrating the expression of normalised markers in the major B-cell subsets in different groups (ns p > 0.05, *p < 0.05, **p < 0.01).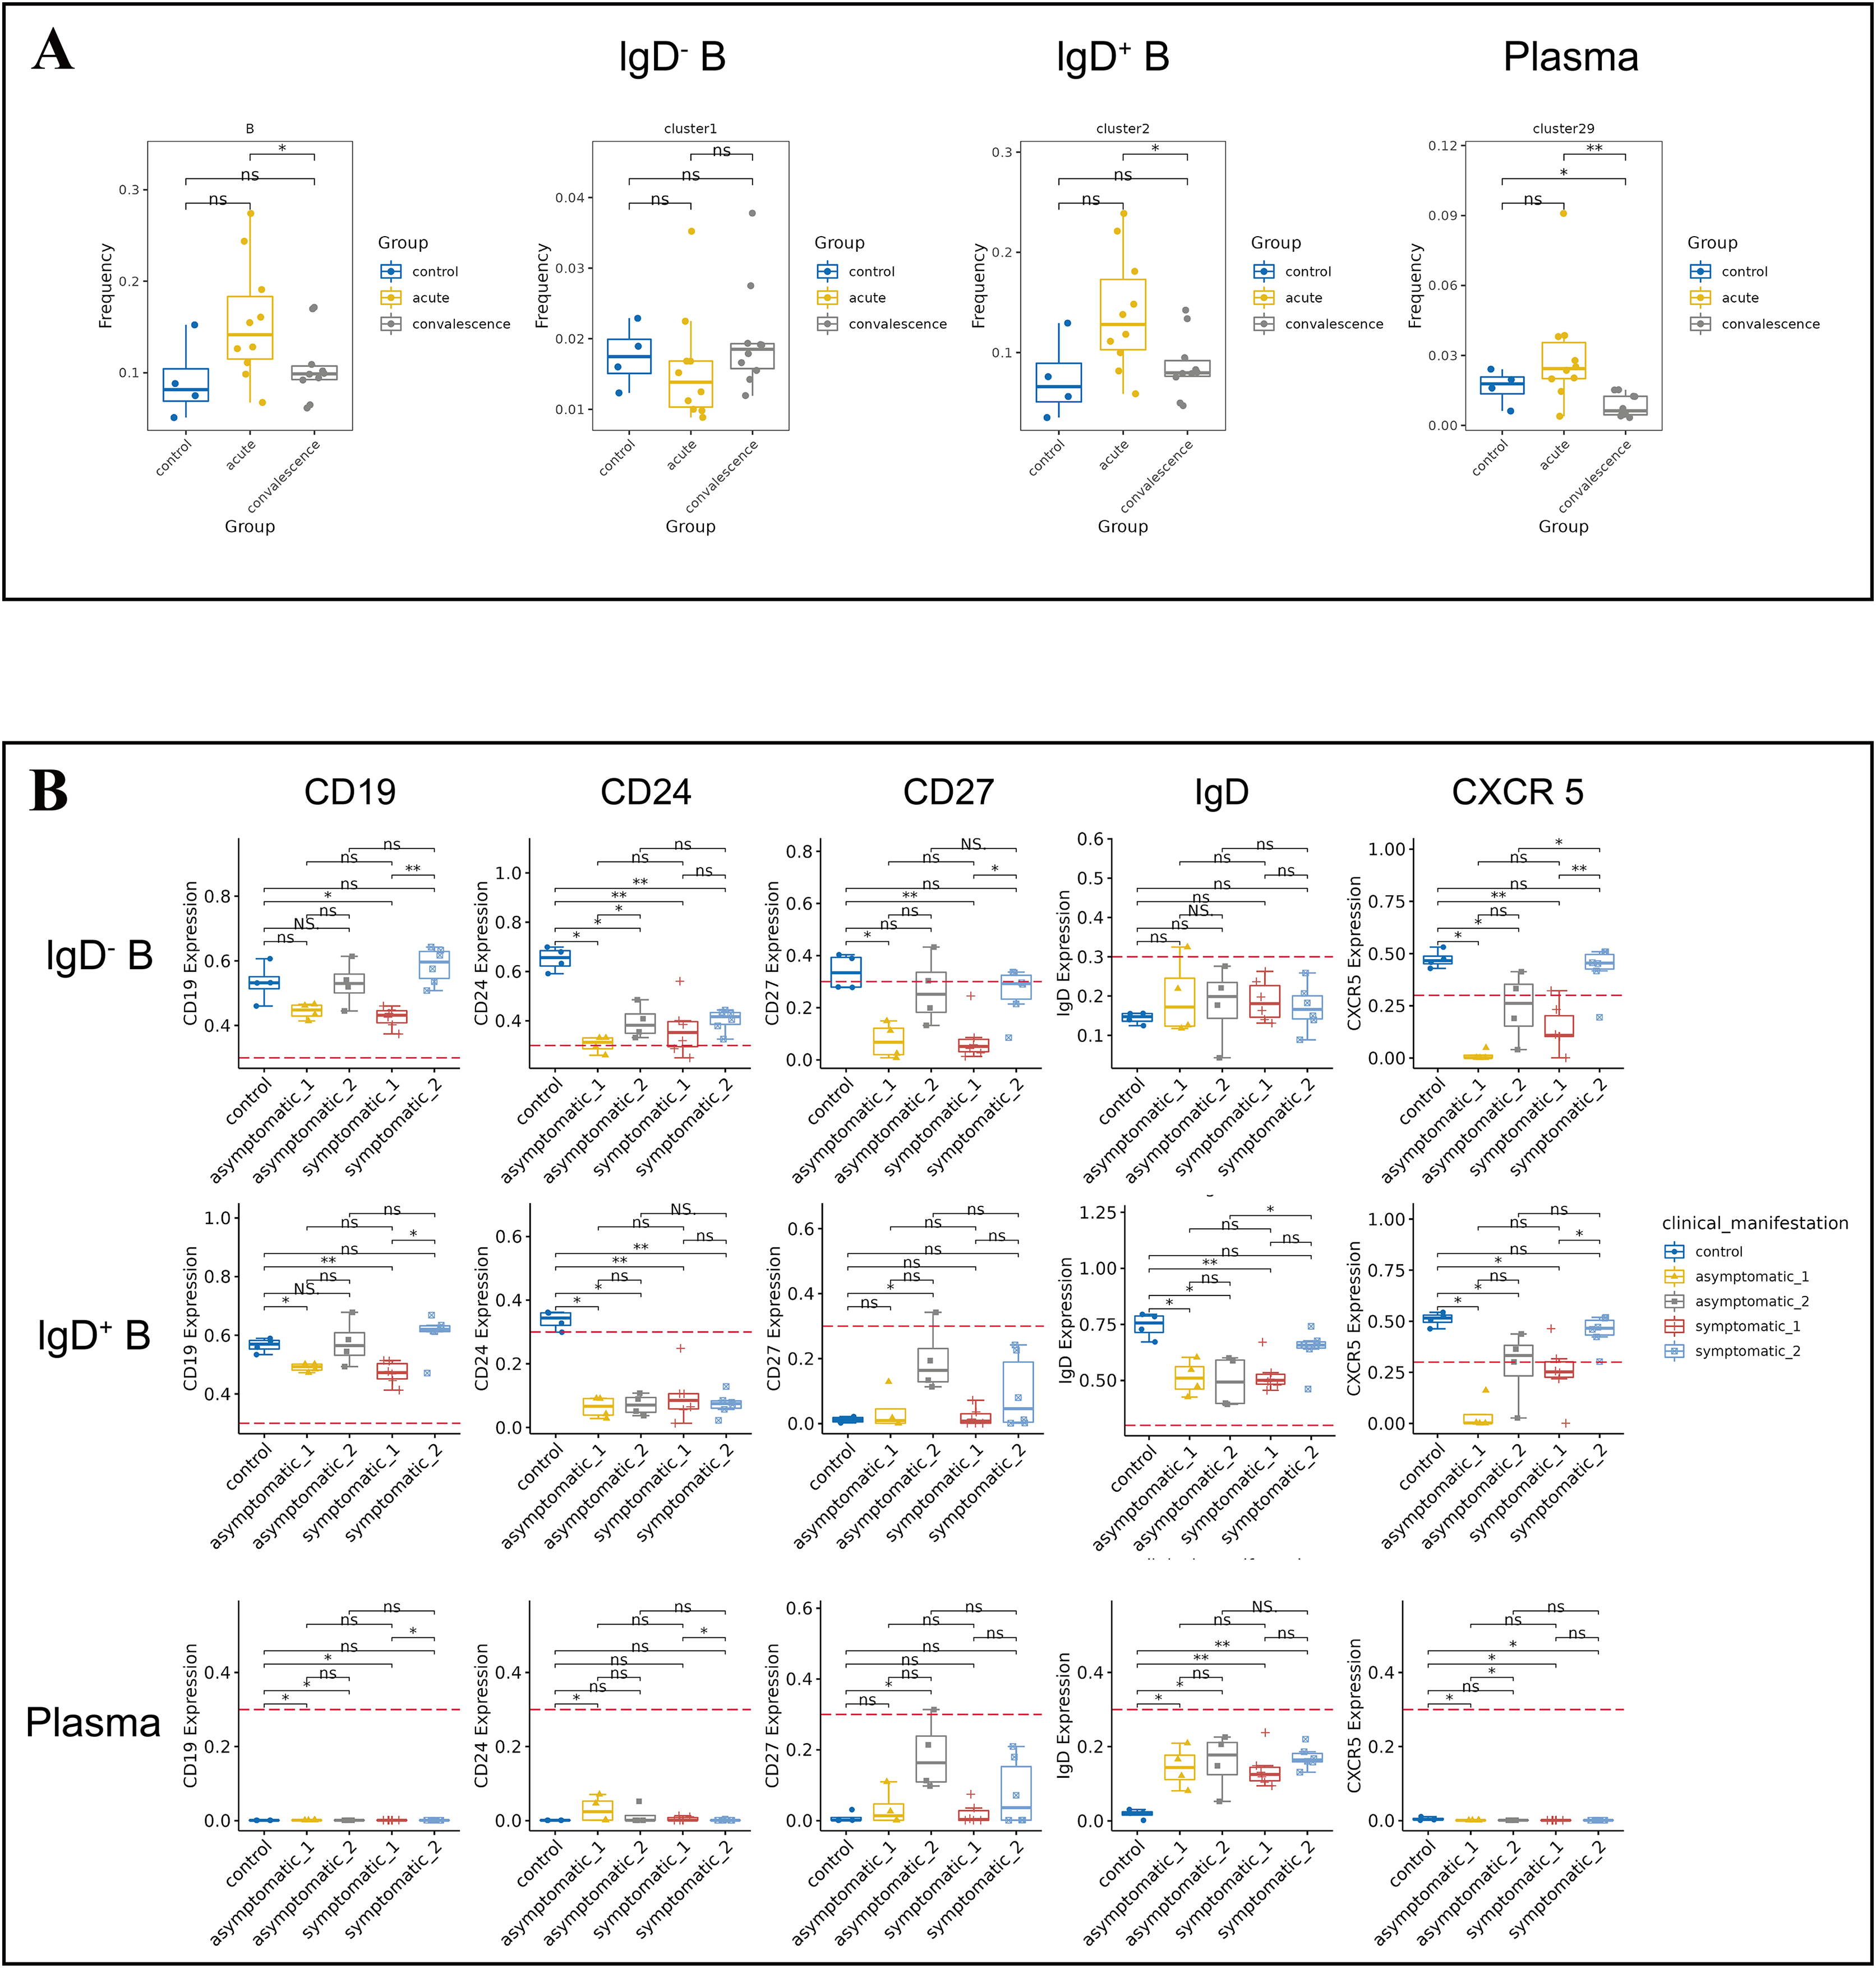
NK cells are the main components of cytotoxic lymphocytes and innate immunity. From the t-SNE plots of all NK cell subpopulations in all participants (Fig. S4C), the percentage of NK cells decreased significantly in the acute phase of COVID-19 compared to healthy controls and increased significantly in the convalescence phase compared to the acute phase, and then returned to normal levels (Fig. 5A). While the frequency of CD3−CD56dimCD16-NK cell subsets was obviously lower in acute phase than in convalescence phase, especially in the symptomatic group (Figs. 5A, S4D). In addition, the expression levels of CD56, CD11c, CD127 and CD25 in NK cells were significantly different between asymptomatic and symptomatic groups of COVID-19 patients in the acute and convalescence phases with healthy controls (Fig. 5B).
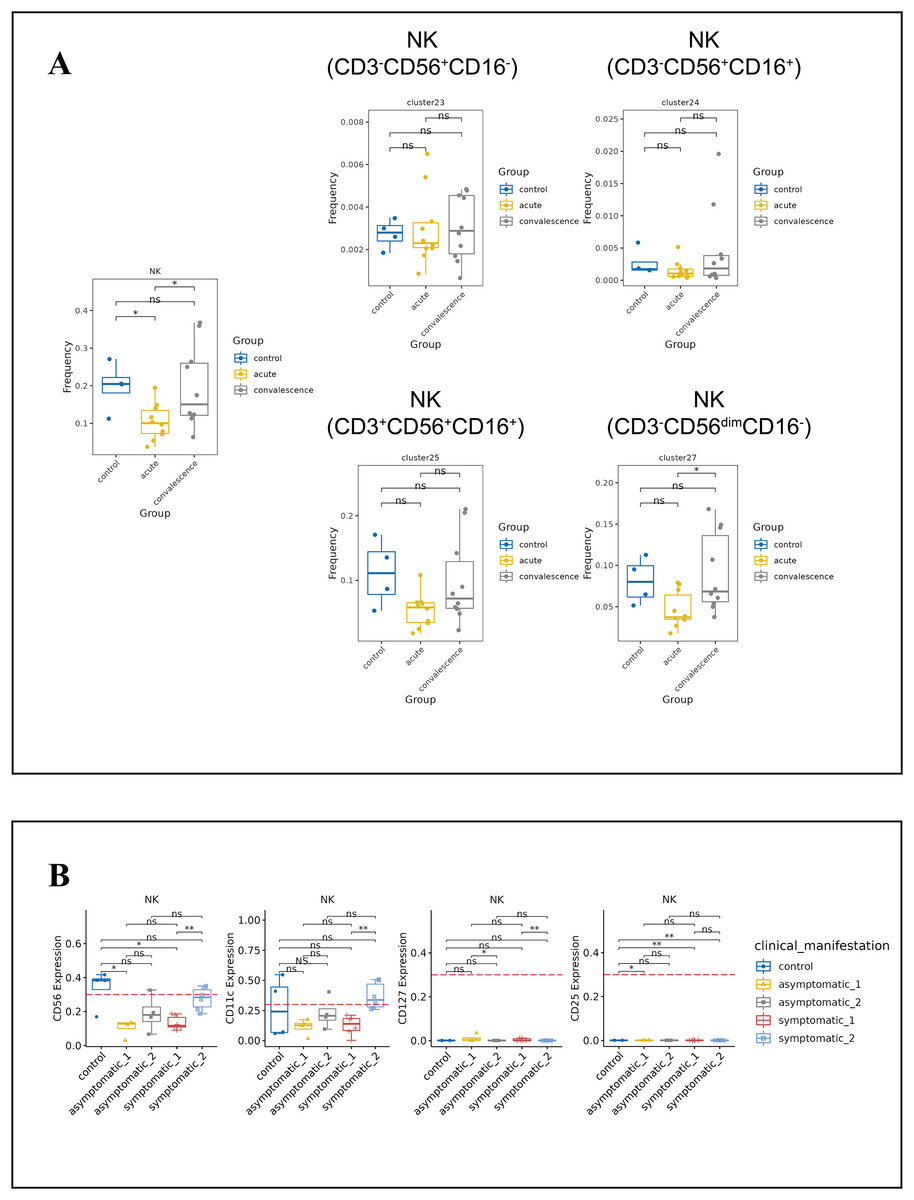
Figure 5: Immunological characteristics NK cells in COVID-19 patients and healthy controls.
(A) Boxplot showing the differences in the frequencies of the NK-cell clusters in different groups (ns p > 0.05, *p < 0.05). (B) Boxplots revealing the differences of each NK-cell subset in acute and convalescence stages of COVID-19 patients and healthy controls (ns p > 0.05, *p < 0.05, **p < 0.01).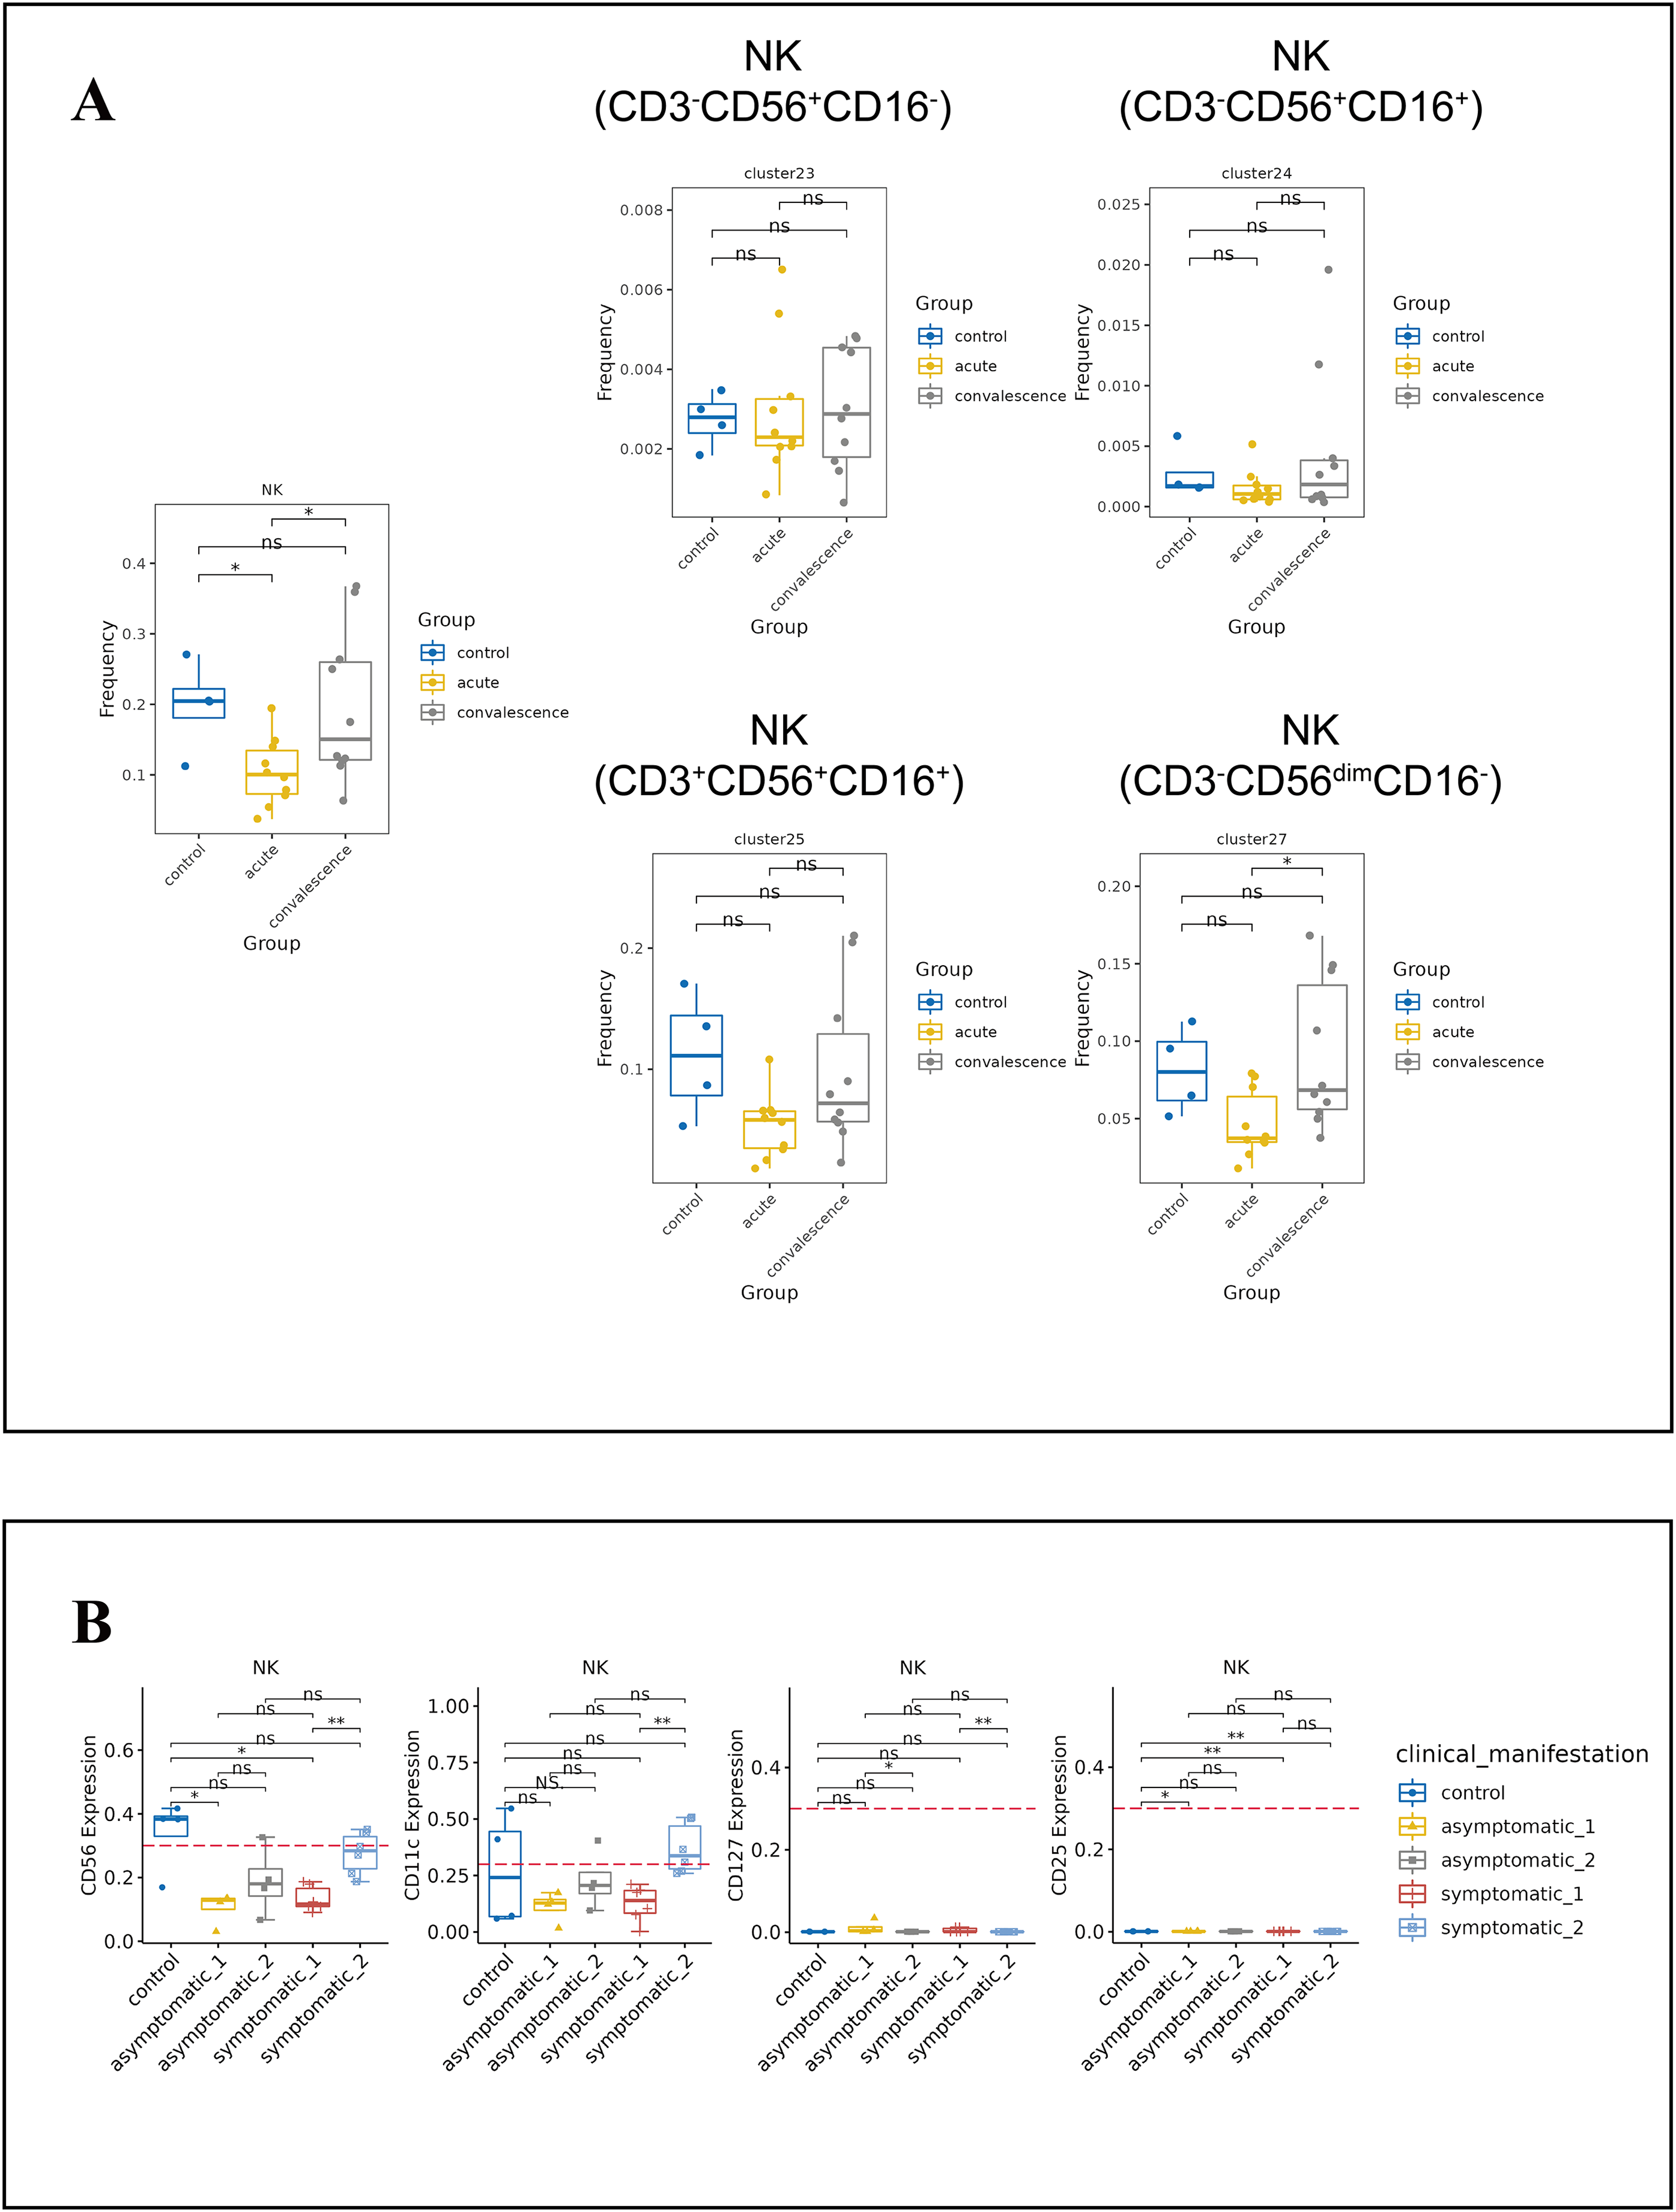
Monocytes are the precursors of antigen presenting DCs during inflammation. Generally, monocytes are mainly characterized by the expression of CD14 and CD16 and are further divided into classic monocyte subsets, non-classical monocyte subsets, and intermediate monocytes. We further identified two classical monocyte subsets by PhenoGraph and t-SNE as cluster 3 (CD3−CD4+CD11c+CD33+CD11b+CD14+HLA_DR+Granzyme_B− CD16−), Cluster 4 (CD3−CD4+CD11c+CD33+CD11b+CD14+HLA_DR+CD16−). This study showed a significant reduction of CD14+CD16−GB−CXCR3+ classical monocyte in convalescence phase of COVID-19 patients, especially in the asymptomatic group. DCs are antigen-presenting cells that initiate and lead CD4+ and CD8+ T-cell immune responses. In this study cluster 5 (CD3−CD4+CD11c+CD33+CD272+CD16+), cluster 6 (CD3−CD4+CD33+CD11c+CD11bdimCCR3+Ki67+HLA_DR+) and cluster 7 (CD3−CD4+CD11c+CD33dimCD11B−CD123+HLA_DR+) were defined as subsets of DCs. The frequencies of DC subsets in COVID-19 patients in the acute and convalescence periods were not significantly different compared to healthy controls (Figs. 6A, S4E, S4F).
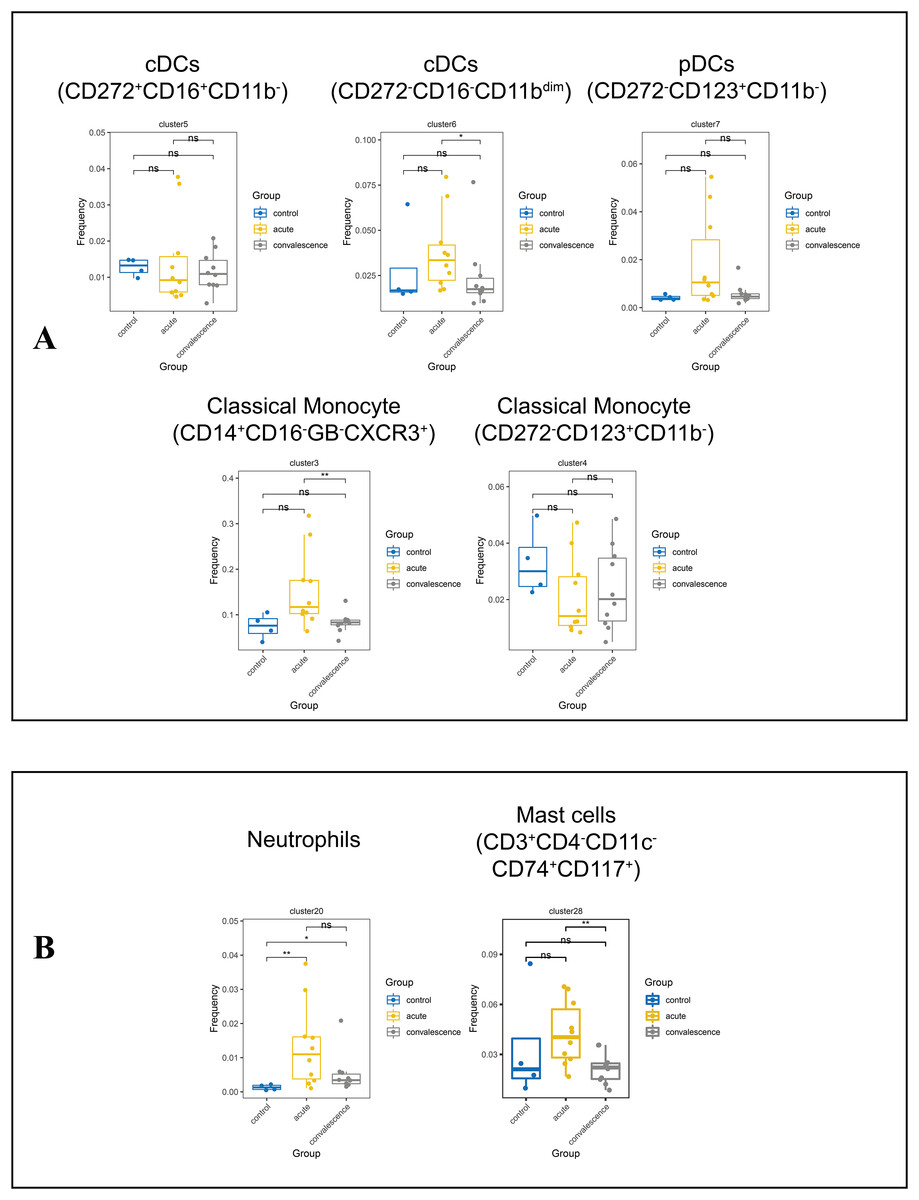
Figure 6: Immunological characteristics of DCs, neutrophils, monocytes and mast cells in COVID-19 patients and healthy controls.
(A) Boxplots showing the frequencies of DC and monocyte subsets in different groups (ns p > 0.05, *p < 0.05). (B) Boxplots showing the frequencies of neutrophil subset and mast cell subsets in different groups (ns p > 0.05, *p < 0.05, **p < 0.01).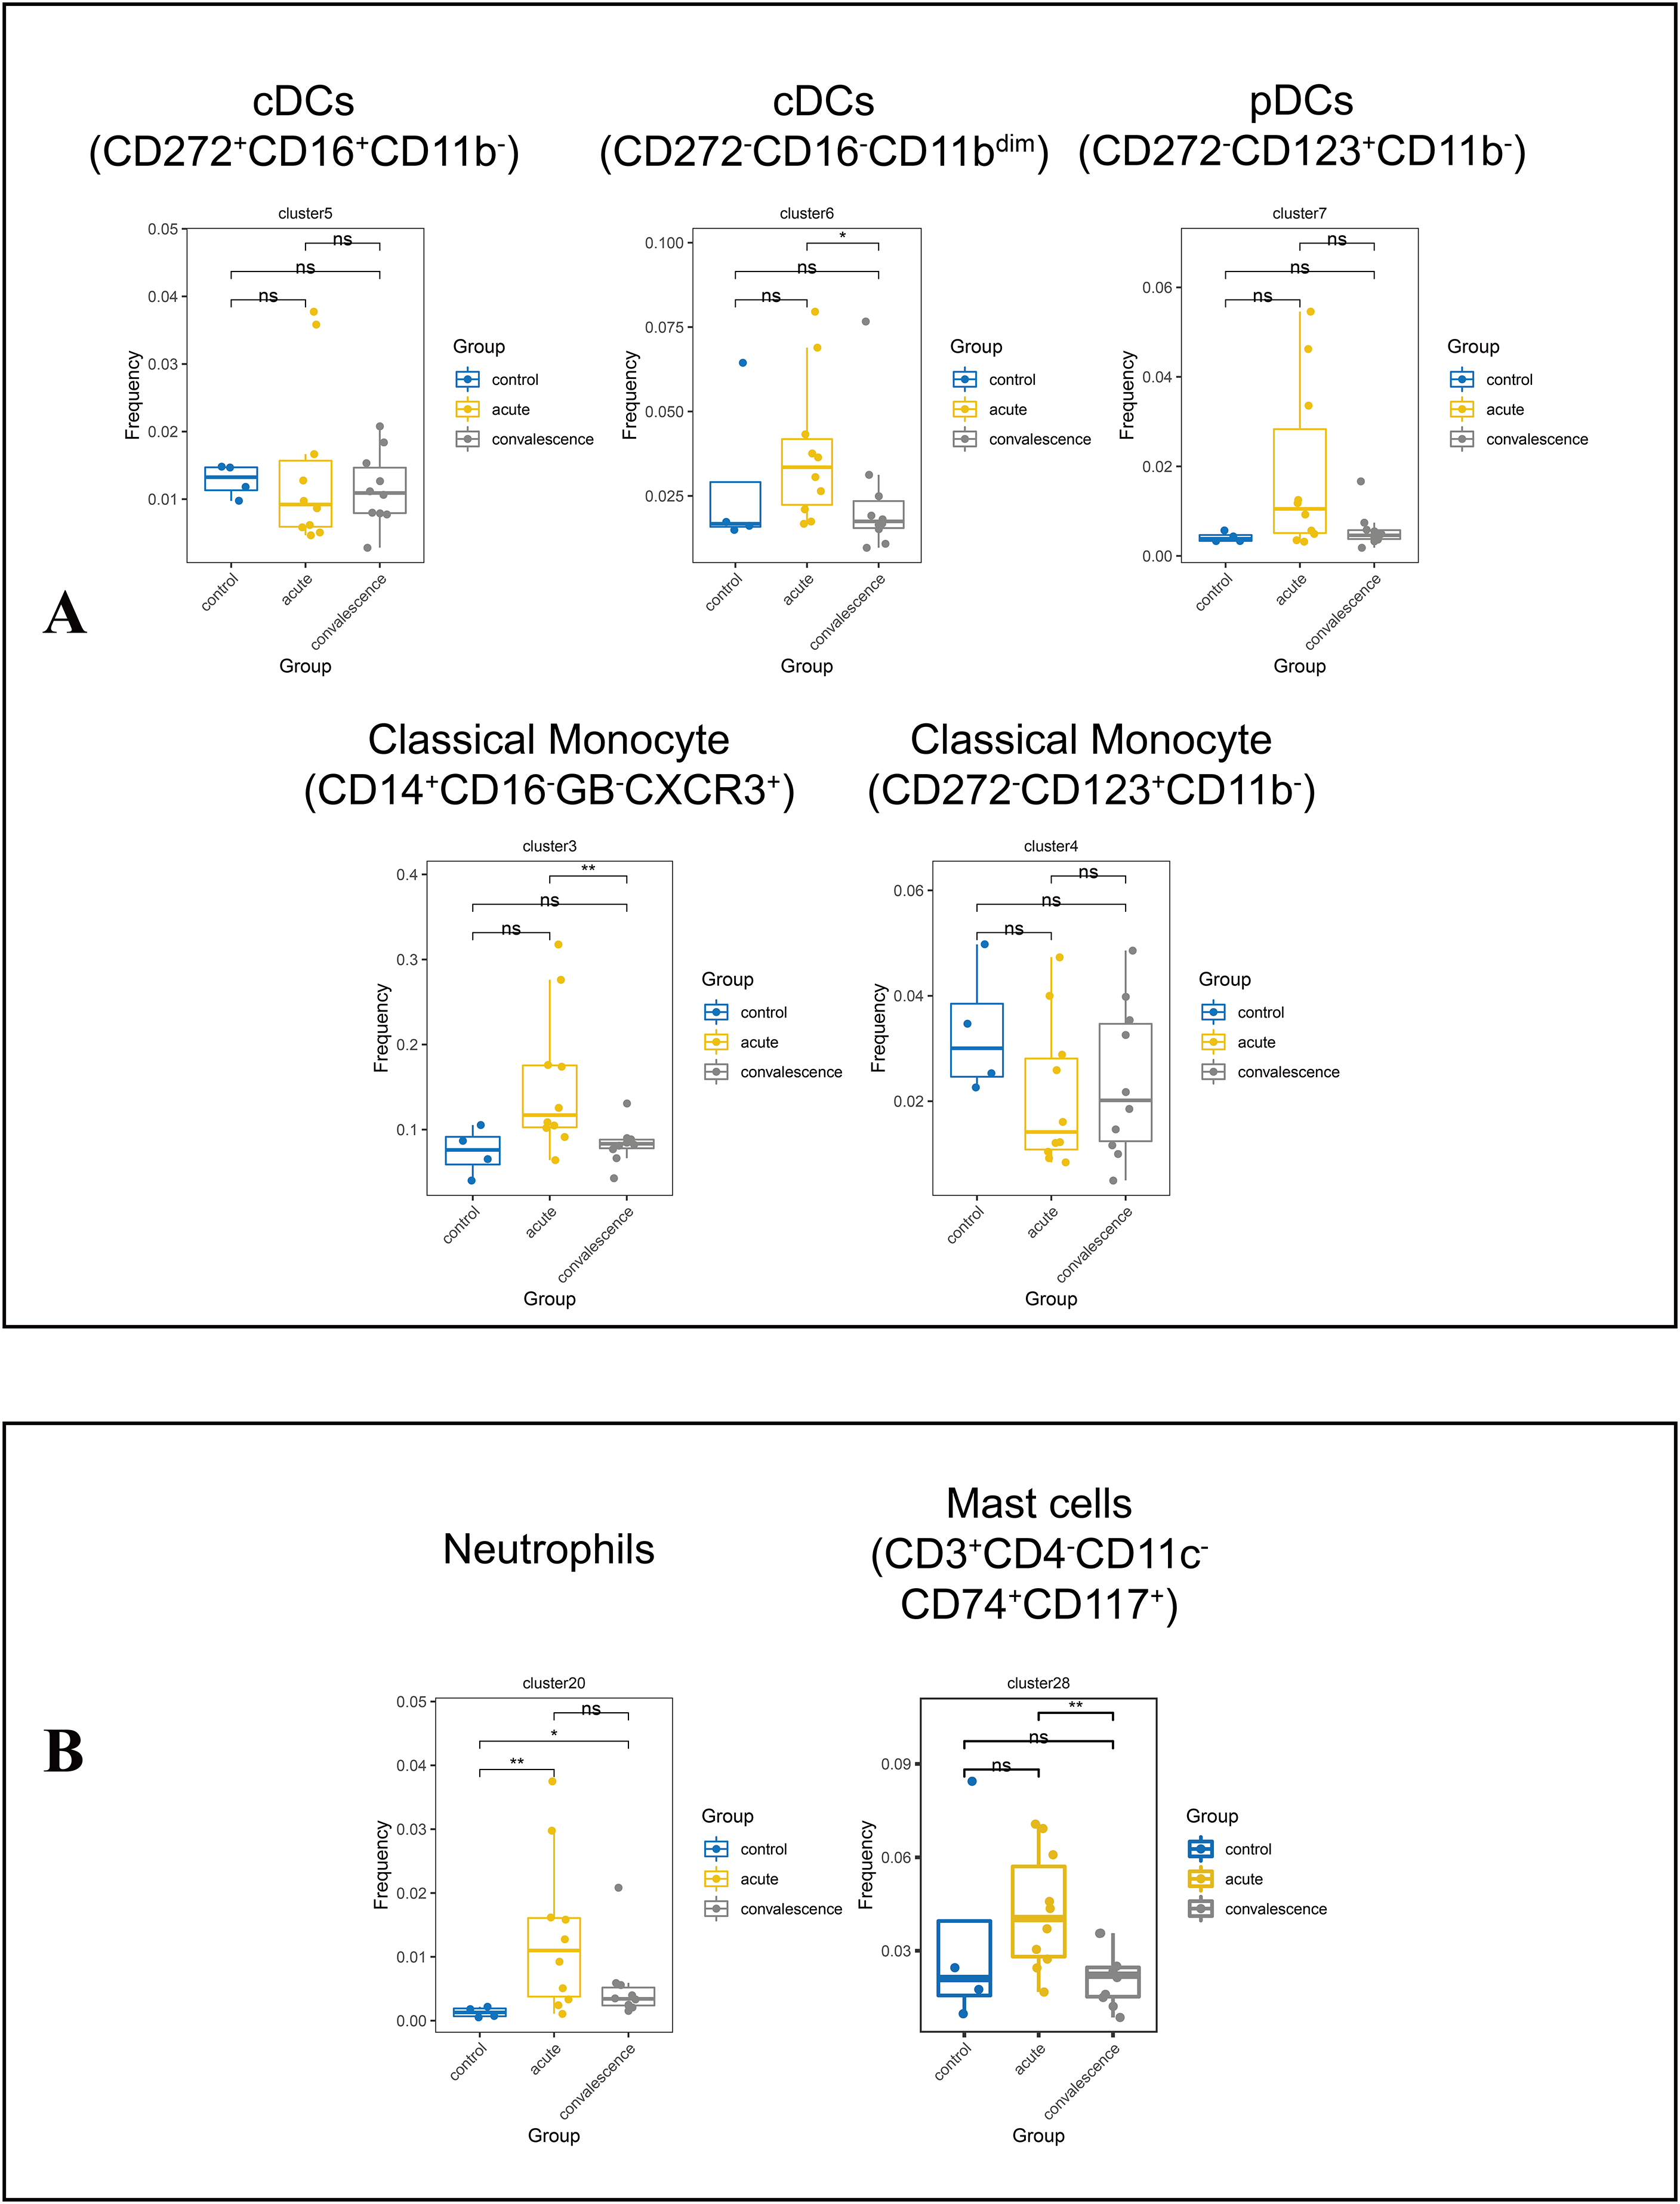
We also identified cluster 20 (CD3dimCD11b+CD16+CD66b+CD24+) as a neutrophil subpopulation and cluster 28 (CD3+CD4−CD11c−CD74+CD117+) as a mast cell subpopulation (Fig. S4G). Compared to healthy controls, the frequency of neutrophils was significantly increased in COVID-19 patients in both the acute and convalescence phases. However, there was no significant difference between the acute and convalescence phases. In contrast, the frequency of mast cells was significantly lower in patients recovering from COVID-19, especially in symptomatic patients, compared to the acute phase (Figs. 6B, S4H).
Discussion
COVID-19 is an acute self-limiting viral infection (Chan et al., 2020; Li et al., 2022a) in which the host immune response plays an antiviral role against acute SARS-CoV-2 infection and determines disease progression. A limited number of studies used CyTOF technology to investigate specific immune cell responses to SARS-CoV-2 infection, and even fewer studies focused on the comparison of disease progression vs recovery in the same patient. In addition, the changes in immune cells across clinical conditions during the disease process are unknown. In this study, we used CyTOF to compare not only the immune status of symptomatic vs asymptomatic patients with COVID-19, but also the changes in the acute and convalescence periods. And we observed expansion of B-cell subsets, Th1-cell subsets and neutrophil subsets in the acute stage, particularly in IgD+ B-cell subsets in symptomatic patients in the acute stage. The frequencies of CD4 TEM cell subsets and NK-cell subsets tended to decrease early in SARS-CoV-2 infection and gradually increased during the convalescent period. The frequency of NK-cell subsets decreased significantly in the acute phase especially in symptomatic patients.
T cells are central players in antiviral immunity. Better investigation of T-cell changes in COVID-19 patients could help understand the pathogenesis of SARS-CoV-2 infection. Many studies have shown that the decrease and dysfunction of T-cell lymphocytes have occurred in COVID-19 (De Biasi et al., 2020; Kuri-Cervantes et al., 2020; Mathew et al., 2020; Song et al., 2020), especially in severe patients, which are very prominent features, and lymphocytopenia may result from T-cell apoptosis, migration, proliferation or differentiation (Adamo et al., 2021). Our study found a trend of decreased T cells in COVID-19 patients.
Human peripheral blood T cells are distinguished according to the expression of CCR7 and CD45RA into naive (CCR7+CD45RA+), central memory (CCR7+CD45RA−) and effector memory (CCR7−CD45RA−) cells, which respond differently when exposed to antigen (Sallusto, Geginat & Lanzavecchia, 2004). Effector T cells exert intrinsic antiviral responses by clearing virus-infected cells and may assist B cells in the eventual production of specific antiviral antibodies (Cervia et al., 2021). In our study, we found a decrease of CD4 TCM in COVID-19 patients compared to healthy controls, more pronounced in the acute stage of infection, which was more prominent in the symptomatic group, similar to the previous study (Adamo et al., 2021). While CD4 TCM and CD8 TE showed a trend of decreasing in the acute stage and increasing significantly over time in the recovery phase compared to the acute stage in both the symptomatic and asymptomatic groups. It could be due to two reason: This could be due to two reasons: studies have found hypoplastic bone marrow and decreased numbers of lymphocytes, cell degeneration and necrosis in the spleen, and high levels of pro-apoptotic molecules such as FAS or TRAIL produced by hyperactivated T cells (Mathew et al., 2020; Xu et al., 2020; Yao et al., 2020). In contrast, previous findings found higher frequencies of CD4 TEM and lower frequencies of CD4 TCM in recovering patients with severe disease compared to healthy controls and mild disease (Akhtar et al., 2023; Gong et al., 2020; Weiskopf et al., 2020). These results suggest that effector T cells play an active role after SARS-CoV-2 virus enters the host; while certain T cell subsets, such as Th1, expanded significantly in the acute stage of the disease, especially in symptomatic patients. We know that Th1 cell subsets exert antiviral effects by producing cytokines and mediating cellular immunity (Romagnani, 2000). Similarly, a significant increase in Th1 cell response in COVID-19 patients was found in other studies (Elizaldi et al., 2020; Mahmoud Salehi Khesht et al., 2021). These findings suggest that the more pronounced Th1 elevation in symptomatic COVID-19 patients may be related to their more intense inflammatory response.
MAIT cells are innate, nontraditional T lymphocytes with significant resistance to host defense and immune regulation. In our study, there was a decreasing trend in the frequency of MAIT after SARS-CoV-2 infection compared to healthy controls, with a significantly lower frequency of MAIT in the recovery period and similar result was founded in the symptomatic group during the acute phase. Also, CCR6 expression on the surface of MAIT cells in COVID-19 patients showed a trend of decreased expression compared to healthy controls. Some previous reports showed that blood MAIT cells were reduced in COVID-19 patients and that changes in MAIT cells in peripheral blood were positively correlated with the severity of SARS-CoV-2 (Flament et al., 2021). It has also been demonstrated that MAIT cells are enriched in airway-infiltrating T cells of COVID-19 patients, which is consistent with a decrease in circulating MAIT cells (Parrot et al., 2020). It has likewise been indicated that the expression of the tissue migrating chemokine receptor CCR6 is reduced on blood MAIT cells during SARS-CoV-2 infection (Chua et al., 2020). These findings suggest that the reduced number of peripheral MAIT cells may be related to the migration of peripheral MAIT cells to inflammatory tissues, and that pulmonary recruitment may contribute to MAIT cell reduction and COVID-19 immunopathogenesis.
Our study confirmed that patients with COVID-19 develop significant humoral immune responses during disease progression. During the acute phases of SARS-CoV-2 infection, the number of B cells increased significantly, and their activation was enhanced. Under large-scale virus invasion, the immune system may recruit mature B-cell precursors from the bone marrow into the periphery as a “last blow” against the invading virus. Naïve B cells are in a “susceptible” state to antigens, which can increase autoreactivity and polyreactive (de Campos-Mata et al., 2021).
In response to a viral infection, B cells bind viral proteins through their antigen receptors and begin secreting effector molecules to help control the infection. After the infection disappears, approximately 90% of these virus-specific “effector cells” die, while 10% survive as long-lived memory cells (Ruterbusch et al., 2020). This is consistent with a significant decrease in the proportion of B cells during convalescence compared to earlier periods in our study. B cells possess the ability to identify viral antigens upon viral infection, leading to the formation of IgD specific memory B cells. These memory B cells exhibit lower affinity and do not promptly differentiate into Plasma blasts upon subsequent exposure. However, they retain the capacity to recognize viral protein variants (Herzenberg et al., 1980). This is supported by the changes we observed in the expression of IgD+ B cells in the symptomatic group. For the symptomatic group of COVID-19 patients IgD+ B cell subsets were significantly increased in the acute stage compared to the convalescence period. IgD is a marker of B cell maturation, and IgD+ B cells are the fraction that produce an immune response to antigens. This is consistent with the high expression of IgD on the surface of B cells in our study. The research by Weisel & Shlomchik (2017) also proved this point. Our work shown that SARS-CoV-2 induces persistent, multifaceted immune memory. The coordinated response of these memory lymphocytes to SARS-CoV-2 re-exposure may help boost immunity and thus control the pandemic (Rodda et al., 2021).
Studies have shown that the recruitment of monocytes is critical for the effective control and clearance of infection (Shi & Pamer, 2011). Monocyte subsets were categorized into classic, nonclassical, and intermediate subsets based on the expression levels of CD14 and CD16 (Thomas et al., 2017). The classical monocyte subpopulation may be an important clearance cell, and this subpopulation plays a crucial role in the first line of intrinsic immune defense of the blood system. In our study, there were no significant differences in total monocyte subpopulations in COVID-19 patients compared to controls in both the symptomatic and asymptomatic groups in acute and convalescent periods. Whereas the frequency of granzyme_B-negative classical monocyte subpopulations was significantly higher in asymptomatic COVID-19 patients in the acute stage compared to the convalescence stage. However, in a previous report (Wang et al., 2022), it was found that the frequency of classical monocyte subpopulations was significantly increased in asymptomatic COVID-19 patients. In contrast, it was reported that total monocyte frequencies were found to be significantly lower in the pre-symptomatic and moderate groups compared to the healthy group, whereas no reduction in total monocyte frequencies was found in the asymptomatic and mild groups, while classical monocyte subpopulations were also found to be significantly lower in patients with mild/moderate COVID-19 (Yu et al., 2021).
NK cells are the first line of defense against SARS-CoV-2 infection. Cytotoxic NK cells can function by clearing virus-infected cells (Wilk & Blish, 2018). Several studies reported a decrease in the number of NK cells after SARS-CoV-2 infection (Maucourant et al., 2020). In our study, NK cell frequencies decreased significantly in COVID-19 patients early after infection compared to healthy controls and gradually increased to normal levels as the disease recovered. This may be related to immunosuppression, apoptosis and direct cytotoxicity after infection with SARS-CoV-2 (Wen et al., 2020). Studies have also shown that the number of NK cells in the bronchoalveolar lavage fluid (BAL) was increased in COVID-19 patients and that most pulmonary NK cells were nonresident cells (Marquardt et al., 2017; Wang et al., 2020a). These data suggest that NK cells in patients with COVID-19 may also be recruited from peripheral blood to the lungs (Wang et al., 2020a).
Neutrophils play a role in viral infection by secreting inflammatory mediators and cytokines (Zhang et al., 2022). Our study found that the proportion of neutrophil subsets was significantly increased in patients with COVID-19 compared to healthy controls. Recent evidence has shown that patients with severe acute respiratory syndrome coronavirus (SARS-CoV-2) infection have a large number of neutrophils (Liu et al., 2020), and the degree of neutrophil increase is closely related to the severity of the patient (Chiang et al., 2020; Mann et al., 2020). Autopsy findings in the lungs of severe COVID-19 patients showed increased neutrophil infiltration, which may be associated with a decrease in peripheral blood neutrophils, which are recruited to lung tissue to clear lung pathogens, and possibly with neutrophils functioning as neutrophil extracellular trap (NETs) (Barnes et al., 2020; Bratton & Henson, 2011; Tian et al., 2020).
Mast cells fight invading pathogens, including viruses, by coordinating an effective immune response (Rathore & St John, 2020). In recent years, the important role of mast cells in regulating host immunity against pathogens such as bacteria, parasites, and viruses has received increasing attention. Mast cell activation has been clinically confirmed in COVID-19 patients (Motta Junior et al., 2020). Mast cells are important effector cells in SARS-CoV-2 induced inflammatory injury in the lung. The reason for the decrease in the recovery period may be related to the fact that mast cells are important effector cells in the inflammatory damage induced by SARS-CoV-2 in the lung. Some studies have also shown that SARS-CoV-2 activates mast cells in the respiratory tract during the acute stages of the disease (Kempuraj et al., 2020).
In addition, the main limitation of this study is the relatively small sample size, but we tested hundreds of thousands of cells for nearly 40 markers, obtaining a wealth of cellular information. Nevertheless, the results we obtained need to be confirmed by applying other assays, such as flow cytometry, in a larger patient population.
Conclusions
Our study found that patients with COVID-19 have undergone significant changes in their immune profiles, clearly describes the changes in immune cell subsets in different stages after infection in the same unvaccinated COVID-19 patient. It also highlights the differences in immune responses across clinical presentations. The specificity of the different clinical presentations will provide benefits for COVID-19 immunotherapy and immune interventions.
Supplemental Information
Clinical characteristics of SARS-CoV-2 infections and healthy donors recruited in this study.
Routine blood and immunological and other laboratory findings of SARS-CoV-2 infections in acute and convalescence stage and healthy donors recruited in this study.
Overview of immune cell surface markers and cell composition for each cluster and each sample.
(A) t-SNE plot of cells in each cluster sampling 10,000 cells in each sample. Doublets are not included. Colours represent different cell types. (B) t-SNE plot of cells in each major immune cluster. Doublets are not included. Colors represent different cell types. (C) Heatmap of all 29 clusters in PBMCs of normalised expression of 42 surface markers identified with phenoGraph. Each grid represents the expression of that marker in that subset. The bluer the colour, the lower the expression level and the redder the higher the expression level. The histogram on the right represents the proportion of this subgroup in the sample. (D) Sankey diagram of the cellularity of the major cell subsets in each sample. (E) Sankey diagram of major cell subsets in the acute and convalescence stages of COVID-19 with different disease manifestations and healthy controls.
Depth characteristics of T cells in COVID-19 and controls associated with Fig. 3.
(A) t-SNE plots of the distribution of major T-cell subpopulations in all COVID-9 patients and healthy controls.
(B) Boxplots showing the frequency of major T-cell populations in asymptomatic and asymptomatic COVID-19 patients in the acute and recovery phases (ns p > 0.05, * p < 0.05).
(C) Boxplots showing the frequency of CD4+ T-cell populations in asymptomatic and asymptomatic COVID-19 patients in the acute and recovery phases (ns p > 0.05, * p < 0.05).
(D) Boxplots showing the frequency of CD8+ T-cell populations in asymptomatic and asymptomatic COVID-19 patients in the acute and recovery phases (ns p > 0.05).
(E) Boxplots showing the frequencies of other T-cell populations in symptomatic and asymptomatic COVID-19 patients in the acute and recovery phases (ns p > 0.05).
(F) Boxplots showing the expression of normalised markers in major T cell populations (ns p > 0.05, * p < 0.05, ** p < 0.01).
Expression level of T cells markers in COVID-19 and controls associated with Fig. 3.
(A) Boxplots showing the expression of normalised markers in major T cell populations (ns p > 0.05, * p < 0.05, ** p < 0.01).
In-depth characterization of B cells, NK cells, DCs, monocytes, neutrophils and mast cells in patients with different clinical manifestations of COVID-19 in the early and recovery phases and in healthy controls.
•(A) t-SNE plots showing the major B-cell populations in the acute (_1) and recovery (_2) phases of COVID-19 patients with different clinical manifestations and healthy controls. •(B) Boxplots reveal differences between symptomatic and asymptomatic COVID-19 patients and healthy controls for each B-cell subpopulation at different stages (ns p > 0.05, * p < 0.05). •(C) t-SNE plots of the distribution of all NK subpopulations in the acute and recovery phases in asymptomatic and asymptomatic COVID-19 patients and healthy controls. •(D) Boxplots revealing differences in each NK cell subpopulation in different groups (ns p > 0.05, * p < 0.05). •(E) Boxplots revealing the frequencies of all DC and monocyte subpopulations in different groups (ns p > 0.05, ** p < 0.01). •(F) Boxplots revealing differences in each monocyte and DC subpopulation between symptomatic and asymptomatic COVID-19 patients in the acute and convalescence phases and healthy controls (ns p > 0.05, * p < 0.05). •(G) t-SNE plots showing neutrophil and mast cell subpopulations in symptomatic and asymptomatic COVID-19 patients during the acute and convalescence phases and healthy controls. •(H) Boxplots revealing the differences in neutrophil and mast cell subsets between symptomatic and asymptomatic COVID-19 patients in the acute and convalescence phases (ns p > 0.05, * p < 0.05).