
Genome-wide identification of the Gossypium hirsutum CAD gene family and functional study of GhiCAD23 under drought stress
- Published
- Accepted
- Received
- Academic Editor
- Diaa Abd El-Moneim
- Subject Areas
- Agricultural Science, Bioinformatics, Genetics, Genomics, Plant Science
- Keywords
- Cotton, CAD, Drought stress, Lignin accumulation, Gene function
- Copyright
- © 2024 Zhang et al.
- Licence
- This is an open access article distributed under the terms of the Creative Commons Attribution License, which permits using, remixing, and building upon the work non-commercially, as long as it is properly attributed. For attribution, the original author(s), title, publication source (PeerJ) and either DOI or URL of the article must be cited.
- Cite this article
- 2024. Genome-wide identification of the Gossypium hirsutum CAD gene family and functional study of GhiCAD23 under drought stress. PeerJ 12:e18439 https://doi.org/10.7717/peerj.18439
Abstract
Cinnamyl alcohol dehydrogenase (CAD) is a crucial enzyme in the final stage of lignin monomer biosynthesis. This study focuses on the CAD gene family within Gossypium hirsutum. Through comprehensive genomic analysis, we identified 29 GhiCAD genes within the Gossypium hirsutum genome using a bioinformatics approach. Phylogenetic analysis revealed that the GhiCAD family can be categorized into four subgroups, which are closest to the evolutionary relationship with Arabidopsis thaliana. There are multiple cis-acting elements on the promoters of GhiCAD genes associated with abiotic stress responses. Some GhiCAD genes demonstrated high expression in various tissues like root, leaf, and sepal, as well as in fiber and ovule at different developmental stages (10 days post anthesis (DPA), 15 DPA, 20 DPA, 25 DPA). The transcript levels of GhiCAD23 were notably elevated when exposed to PEG treatment and drought stress (DS). GhiCAD23 is also co-expressed with many known drought response genes, suggesting its involvement in the plant’s reaction to DS. Employing virus-induced gene silencing (VIGS) technology to silence the GhiCAD23 gene, it was found that silencing GhiCAD23 reduced the tolerance of cotton to DS. Under DS, the relative leaf water content, superoxide dismutase (SOD), and catalase (CAT) enzyme activities of the GhiCAD23-silenced cotton plants were decreased by 31.84%, 30.22% and 14.19%, respectively, while malondialdehyde (MDA) was increased by 72.16% compared with the control cohort. Drought promotes the accumulation of lignin, and it was found that silencing the GhiCAD23 reduces lignin accumulation in cotton under DS. The analysis of phenotypic and physiological indicators indicates that GhiCAD23 is vital in cotton’s resistance to DS. This investigation provides an important reference for future comprehensive exploration of the GhiCAD23 gene’s function in cotton’s DS response mechanism.
Introduction
Cotton is an important cash crop that is typically grown in arid and semi-arid regions, where its cultivation relies entirely on irrigation. With the increasing scarcity of water for agriculture worldwide, cotton cultivation is highly vulnerable to drought stress (Lin et al., 2024). Drought stress (DS) can severely affect cotton growth, leading to reduced yield and quality (Gao et al., 2021). Throughout their long evolutionary history, plants have developed a complex metabolic regulatory network that adjusts the accumulation of certain metabolites to adapt to various environmental changes (Sharma et al., 2024). Lignin is an important secondary metabolite in plants. As a crucial structural element in the secondary cell walls of vascular plants, it provides mechanical strength and hydrophobicity to plant tissues, playing a key role in plant structure and facilitating the transport of water and minerals throughout the plant (Weng & Chapple, 2010). Lignin primarily derives from the dehydrogenative polymerization of three lignin monomers, namely coniferyl alcohol yielding guaiacyl (G)-lignin, sinapyl alcohol producing syringyl (S)-lignin, and p-coumaryl alcohol generating p-hydroxyphenyl (H)-lignin (Vanholme et al., 2010; Fraser & Chapple, 2011). As a crucial constituent of the plant cell wall, lignin forms a unique complex with cellulose and hemicellulose, constituting the plant’s framework (Mellerowicz et al., 2001; Gosselink et al., 2004). Simultaneously, lignin fills the spaces between cellulose microfibrils in the cell wall, imparting rigidity to the plant cell wall (Zhang et al., 2021).
Research has demonstrated that lignin plays a crucial role in plant defense against environmental stressors (Tripathi et al., 2003). Under DS conditions, both ABA and lignin content in maize are significantly upregulated to enhance drought tolerance to DS (Jiao et al., 2024). The NAC transcription factor OsNAC5 mediates rice’s drought resilience by modulating lignin deposition (Bang et al., 2022). Overexpression of PaLectinL7 increases the lignin content of sweet cherries and enhances salt stress tolerance (Wu et al., 2023). The above studies indicate that lignin is involved in the process of plant resistance to abiotic stress.
The biosynthesis of lignin can be categorized into three primary phases: the synthesis of monolignols via the phenylpropanoid pathway in the cytosol, the transport of lignin precursors to the apoplast, and their subsequent polymerization within the cell wall (Vanholme et al., 2010; Fraser & Chapple, 2011; Xie et al., 2018). The three stages of lignin synthesis in plants are mainly catalyzed by various enzymes, including phenylalanine ammonia lyase (PAL), cinnamate 4-hydroxylase (C4H), p-coumarate 3-hydroxylase (C3H), caffeic acid O-methyltransferase (COMT), 4-coumarate-CoA ligase (4CL), cinnamoyl-CoA reductase (CCR), cinnamyl alcohol dehydrogenase (CAD), peroxidase (PRX), and laccases (LACs) (Vanholme et al., 2019).
Recent studies have elucidated the functions of certain enzymes involved in lignin synthesis in plant drought responses. Overexpression of FuPAL1 from Fritillaria unibracteata significantly increased drought tolerance in transgenic Arabidopsis (Qin et al., 2022). Similarly, overexpression of RgC4H in Rehmannia glutinosa enhanced its tolerance to DS (Yang et al., 2021). Elevated expression of NtCOMT1 resulted in reduced wilting in genetically modified tobacco plants under water deprivation (Yao et al., 2022b). Tobacco overexpressing Fm4CL2 exhibited greater drought tolerance compared to the wild type under DS conditions (Chen et al., 2020). Genetically modified rice specimens with elevated expression of OsCCR10 exhibited improved resilience to water scarcity throughout developmental phases, accompanied by increased photosynthetic capacity, reduced water depletion rates, and elevated lignin levels in root structures relative to non-modified controls (Bang et al., 2022). CAD, the key and final enzyme in monolignol biosynthesis, catalyzes the synthesis of G, H, and S lignin units in the presence of NADPH (Jiang et al., 2022). To date, many CAD gene families in plants have been identified and analyzed, and some functions of CAD genes have been documented (Yusuf et al., 2022; Hu et al., 2022). Overexpression of GsCAD1 from wild soybean in cultivated soybean effectively enhances resistance to mosaic virus (Xun et al., 2022). Introduction of CAD1 from Physcomitrium patens into Arabidopsis increases lignin content, resistance to pathogens, and results in thicker roots and early flowering (Jiang et al., 2022). However, most studies on CAD genes have focused on their functions in plant growth, development, and defense against biotic stress, with limited reports on their functions in abiotic stress. Therefore, this research seeks to investigate the function of CAD genes in plant drought responses to further enhance our understanding of the functional diversity of the plant CAD gene family.
In this study, we employed the cotton genome data to systematically identify and characterize the CAD gene family, focusing on phylogenetic relationships and promoter cis-element compositions. We analyzed tissue-specific expression patterns of CAD gene family members using transcriptomic data. Integrating transcriptomic data under PEG treatment, qPCR, and co-expression analysis, we screened CAD gene family members involved in drought stress responses in cotton. Subsequently, we employed VIGS technology to silence selected candidate genes, allowing us to assess phenotypic and physiological variations between control and gene-silenced plants under drought stress conditions. This investigation is the first to elucidate the functional role of CAD genes in cotton’s response to drought stress and provides valuable genetic resources for the molecular breeding of drought-resistant cotton varieties.
Materials and Methods
Plant materials and growth conditions
The cotton seeds (Gossypium hirsutum cv. Zhongmian 113) were sterilized in 75% (v/v) ethanol for 5 min, then rinsed three times with distilled water. They were subsequently immersed in a 1% (v/v) NaClO solution for 10 min, rinsed again with distilled water, placed between two damp filter papers, and germinated in darkness at 28 °C for 2 days. The seedlings were then planted in pots containing a mixture of nutrient soil and vermiculite (3:1 by volume). The soil in each pot was pre-weighed to ensure a consistent soil volume. Following this, the pots were relocated to a greenhouse maintained at 25 °C/22 °C (day/night) with a 16-h light/8-h dark cycle.
RNA extraction and quantitative analysis of gene expression
Treatment of 3-week-old seedlings of upland cotton variety Zhongmian 113 was carried out, dividing them into two cohorts: a control cohort with usual watering and a drought-treated cohort. The relative soil water content (RSWC) was used to assess the level of drought stress experienced by the cotton plants. Prior to the onset of drought, each pot is allowed to fully absorb the water, and the total weight of the pots is measured. The saturated weight of the soil is calculated by subtracting the weight of the empty pots from the total weight of the pots. The calculation formula for the RSWC (%) = (measured soil wet weight − dry weight)/(saturated weight − dry weight) × 100%. When the relative soil moisture content of the drought-treated cohort dropped below 50%, cotton leaves from both the normal watering cohort and the drought-treated cohort were collected. RNA was isolated from the cotton leaf samples using a plant RNA extraction kit (FOREGENE, Chengdu, China), followed by reverse transcription of the RNA into cDNA using a reverse transcription kit (FOREGENE, Chengdu, China). The UYS900 system was used for the qPCR experiments, with the specific reaction program as follows: 95 °C for 3 min, followed by 40 cycles of 95 °C for 10 s, 58 °C for 10 s, 72 °C for 20 s, 95 °C for 15 s, 58 °C for 1 min, and 95 °C for 15 s. qPCR was performed utilizing specific primers for CAD genes (Table S1) with a double-strand chimeric fluorescent dye (SYBR Green I), and the GhHIS3 gene served as the reference gene. The qPCR primer sequence of GhiCAD23were obtained from this website (https://qprimerdb.biodb.org/organisms). The average of three biological replicates was taken, and gene expression levels were computed utilizing the 2−ΔΔCT approach.
Identification and physicochemical property analysis of the cotton CAD gene family members
To locate the CAD gene family members within the upland cotton genome, Arabidopsis CAD protein sequences were obtained from TAIR (https://www.arabidopsis.org). The amino acid sequences of the AtCAD family (AT2G21890.1, AT2G21730.1, AT3G19450.1, AT4G34230.1, AT4G37970.1, AT4G37980.1, AT4G37990.1, AT4G39330.1, AT1G72680.1) were used as probes to search the upland cotton genome using the BLASTp program with an E-value threshold of 1e−5. Concurrently, the HMM model files of the CAD family (PF08240, PF00107) were retrieved from the Pfam protein domain database (http://pfam.xfam.org), and the upland cotton CAD family members were identified using HMMER with parameters set to E-value = 1e−5. The protein sequences of the potential CAD family members identified from BLAST and HMMER analyses were submitted to Cotton MD (https://yanglab.hzau.edu.cn/CottonMD/gene_search.1) for annotation, resulting in the identification of upland cotton CAD gene family members, designated as GhiCAD1-GhiCAD29 based on their chromosomal positions. The essential physicochemical properties of the proteins were examined using the TBtools software. The GhiCAD protein sequences were submitted to the WOLF PSORT (https://wolfpsort.hgc.jp) database to predict the intracellular localization of GhiCAD family constituents.
Systematic evolutionary analysis
The CAD protein sequences from Gossypium hirsutum, Arabidopsis thaliana, Zea mays, Brachypodium distachyon, and Oryza sativa were aligned using MEGA 11 for multiple sequence alignment. Subsequently, the alignment results were then used to construct a phylogenetic tree with FastTree. The resulting unrooted tree was uploaded to Evolview (http://evolgenius.info/evolview-v2/#mytrees/SHOWCASES/showcase%2001) to generate a circular phylogenetic tree.
Analysis of promoter cis-acting elements
The 2,000 bp region preceding the initiation codon of the GhiCAD gene was obtained as the promoter sequence and analyzed for cis-regulatory elements using PlantCARE (http://bioinformatics.psb.ugent.be/webtools/plantcare/html/). Subsequently, TBtools software was utilized to visually represent the distribution of cis-acting elements within the CAD gene promoter.
Expression analysis of CAD gene family members in Gossypium hirsutum
Transcriptome data for GhiCAD genes from 18 samples, encompassing various tissues, ovule developmental phases, and fiber growth stages in Gossypium hirsutum, were procured from the Cotton MD database (https://yanglab.hzau.edu.cn/CottonMD/heatmap.1). The expression levels of the transcriptome data were standardized to log2TPM values. TBtools software was used to generate expression heatmaps. Transcriptome sequencing was performed on cotton leaves treated with 18% PEG6000 hydroponics for 4 h, the data have been deposited in the OMIX, China National Center for Bioinformation/Beijing Institute of Genomics, Chinese Academy of Sciences (https://ngdc.cncb.ac.cn/omix: accession no. OMIX007375) (CNCB-NGDC Members and Partners, 2024). The expression data of CAD genes was extracted from the transcriptome, and then a heatmap was generated using TBtools.
Gene co-expression network analysis
A total of 26 transcriptome datasets of Gossypium hirsutum under abiotic stress conditions were obtained from the Cotton MD database (https://yanglab.hzau.edu.cn/CottonMD/heatmap.1). The WGCNA package in R was used to build a co-expression network for these 26 transcriptome datasets, and the gene expression correlations were calculated. The genes that were co-expressed with the GhiCAD23 gene were identified and functionally annotated. Cytoscape software was subsequently employed to visualize the network.
Virus induced gene silencing (VIGS)
The VIGS experiments utilized the binary expression vectors TRV1 and TRV2 of the tobacco rattle virus (TRV). The cotton CLA gene, which is involved in chloroplast development and highly conserved throughout evolution, exhibits a distinct albino phenotype when silenced, thus serving as the positive control for VIGS experiments. A combination of Agrobacterium cultures harboring the TRV1 vector and the TRV2:GhCLA recombinant vector was injected into cotton cotyledons to generate positive control plants designated as TRV2:GhCLA. A 400 bp sequence of the GhiCAD23 gene was selected as the target sequence, amplified from a cotton cDNA library to construct the TRV2:GhiCAD23 recombinant vector. Mixtures of Agrobacterium cultures containing TRV1 vector with TRV2 empty vector, TRV2:GhCLA, and TRV2:GhiCAD23 recombinant vector were injected into cotton cotyledons. Plant lines injected with TRV1 and TRV2 served as control plants, denoted as TRV2:00, while plant lines injected with TRV1 and TRV2:GhiCAD23 were considered silenced for the GhCAD23 gene, labeled as TRV2:GhiCAD23. Appearance of albino phenotype in TRV2: GhCLA plants indicated successful silencing of the target gene. RNA was extracted from the leaves of TRV2:00 and TRV2:GhiCAD23 plants for qPCR experiments to assess the effective silencing of the GhiCAD23 gene, using GhHIS3 as the reference gene. Expression levels of the target genes were calculated using the 2−ΔΔCt method and averaged from three biological replicates (Table S1).
Physiological parameters analysis of cotton plants under DS
Before initiating drought treatment, cotton plants with consistent growth were selected from TRV2:00 and TRV2:GhiCAD23 lines and placed under identical conditions, receiving water every 3 days. On the 4 days after the final watering, drought treatment began, marking this day as day one of the drought treatment. After 18 days of period of natural drought, phenotypic observations and photographs of the TRV2:00 and TRV2:GhiCAD23 cotton plants were taken. Leaves from both plant lines were collected for analysis of superoxide dismutase (SOD), catalase (CAT), and malondialdehyde (MDA) enzyme activities using visible spectrophotometry. The specific procedures for these measurements were in accordance with the instructions of the biochemical index assay kit (Grace, Suzhou, China; http://www.geruisi-bio.com/pro/index/classid/1). Samples were prepared according to the manufacturer’s instructions. Total CAT activity was assayed by measuring the rate of decomposition of H2O2 at 510 nm. MDA contents were determined using thiobarbituric acid aspreviously described (Wang et al., 2017). SOD activity was determined by measuring the percentage of inhibition of the pyrogallol autoxidation. Each physiological indicator was measured with three biological replicates, and the data from these three biological replicates were subjected to a one-way ANOVA in GraphPad Prism 8 to calculate the standard deviation of the three biological replicates. The T-test in GraphPad Prism 8 software was used to analyze whether there is a significant difference in physiological indicator data between TRV2:00 and TRV2:GhiCAD23. At the same time, GraphPad Prism 8 software was used to draw bar graphs.
Measurement of lignin content
The lignin content was measured using a lignin content measurement kit according to the manufacturer’s instructions (Solarbio, Beijing, China). In brief, cotton stems were dried to a constant weight at 80 °C, then were filtered through a 40-mesh sieve, and approximately 3 mg was weighed into a 1.5 mL vial. An acetyl bromide and acetic acid mixture was then added and incubated at 80 °C for 40 min. Post-centrifugation, the supernatant was collected, 200 μL was introduced to a 96-well UV plate, and light absorption was evaluated at 280 nm to determine the lignin content.
Results
Identification and systematic evolutionary analysis of CAD gene family members in Gossypium hirsutum
A total of 29 CAD genes were identified within the Gossypium hirsutum genome and designated based on their chromosomal positions: GhiCAD1-GhiCAD29. As shown in Table S2, the proteins encoded by GhiCAD genes comprise 118–378 amino acids, with molecular weights spanning from 12.7 to 44.0 kD and isoelectric points between 5.32 and 8.48. Subcellular localization prediction indicated that the majority of GhiCAD genes are located in the cytoplasm, while a few are found in peroxisomes, mitochondria, and the nucleus (Table S2).
To elucidate the phylogenetic associations within the GhiCAD gene family, a multiple sequence alignment was performed using the protein sequences of CAD genes from Arabidopsis thaliana, Oryza sativa, Zea mays, and Brachypodium distachyon with the CAD proteins from Gossypium hirsutum, and a systematic evolutionary tree was constructed. The evolutionary analysis showed that the 55 plant CAD family members were divided into four subfamilies, and the Gossypium hirsutum CAD family members were unevenly distributed among the four subfamilies. Group 1 included seven GhiCAD genes, Group 2 included four genes, and Group 4 included two genes, and Group 3 included the largest number of GhiCAD genes, totaling 16, indicating that Group 3 has expanded during the evolution of Gossypium hirsutum. It was also found that only Gossypium hirsutum CAD family members and Arabidopsis thaliana CAD family members were present in Group 2 and 3, suggesting that the Gossypium hirsutum CAD gene family is more closely linked to the Arabidopsis thaliana family (Fig. 1).
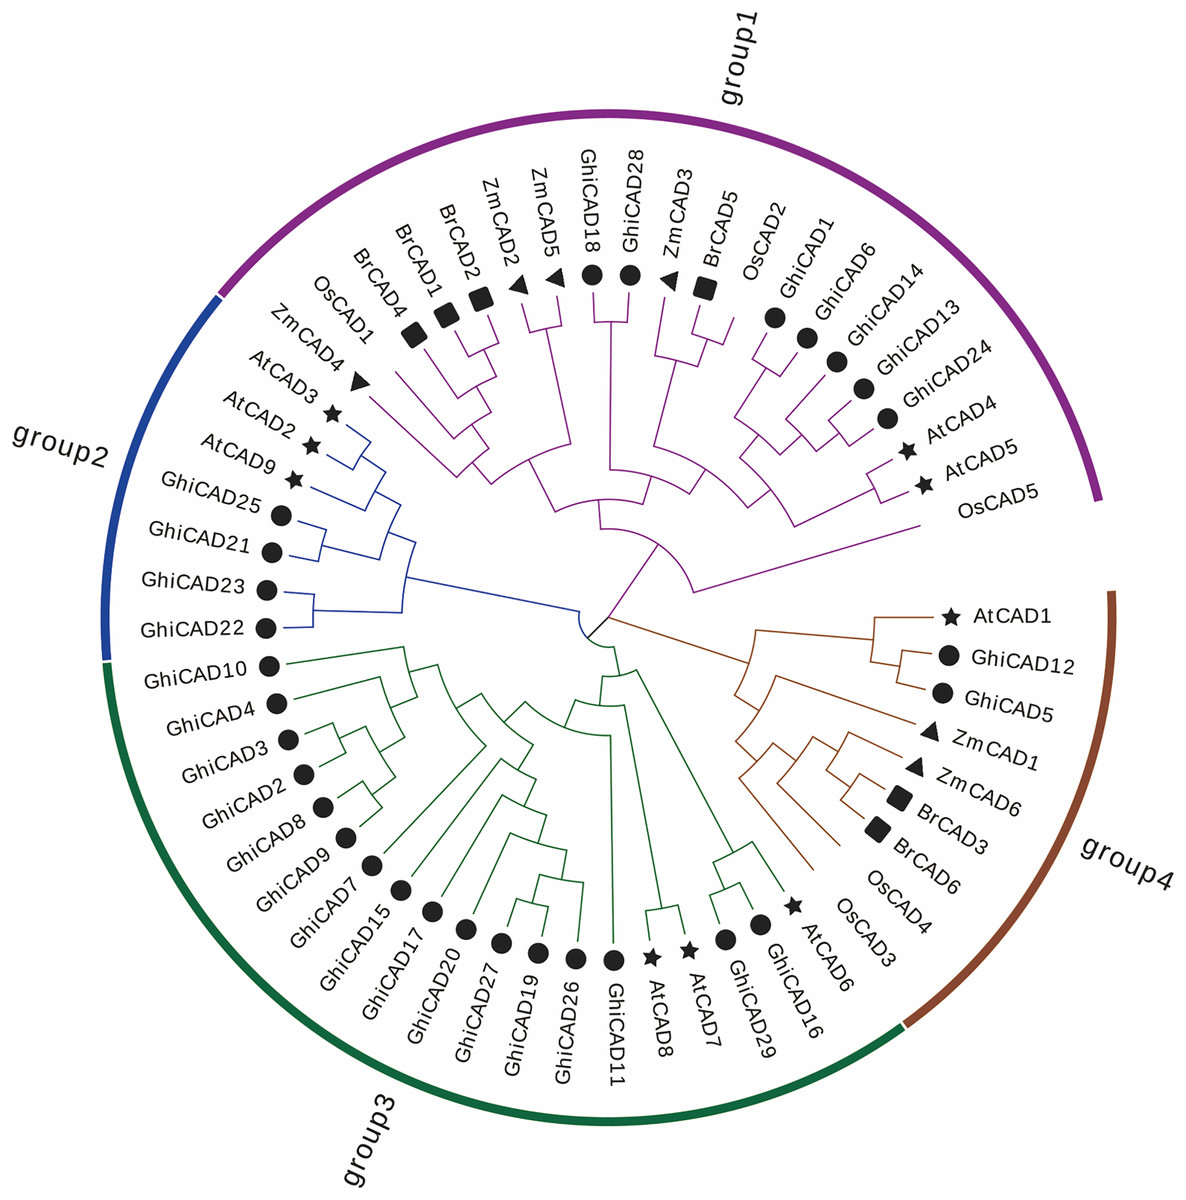
Figure 1: The phylogenetic relationship of CAD proteins in Gossypium hirsutum, Arabidopsis thaliana, Oryza sativa, Zea mays, and Brachypodium distachyon.
The unrooted systematic evolutionary tree was constructed using FastTree by the maximum likelihood method with 1,000 bootstrap iterations. These four clusters depicted in distinct hues, while varied symbols denote genes originating from diverse plant taxa.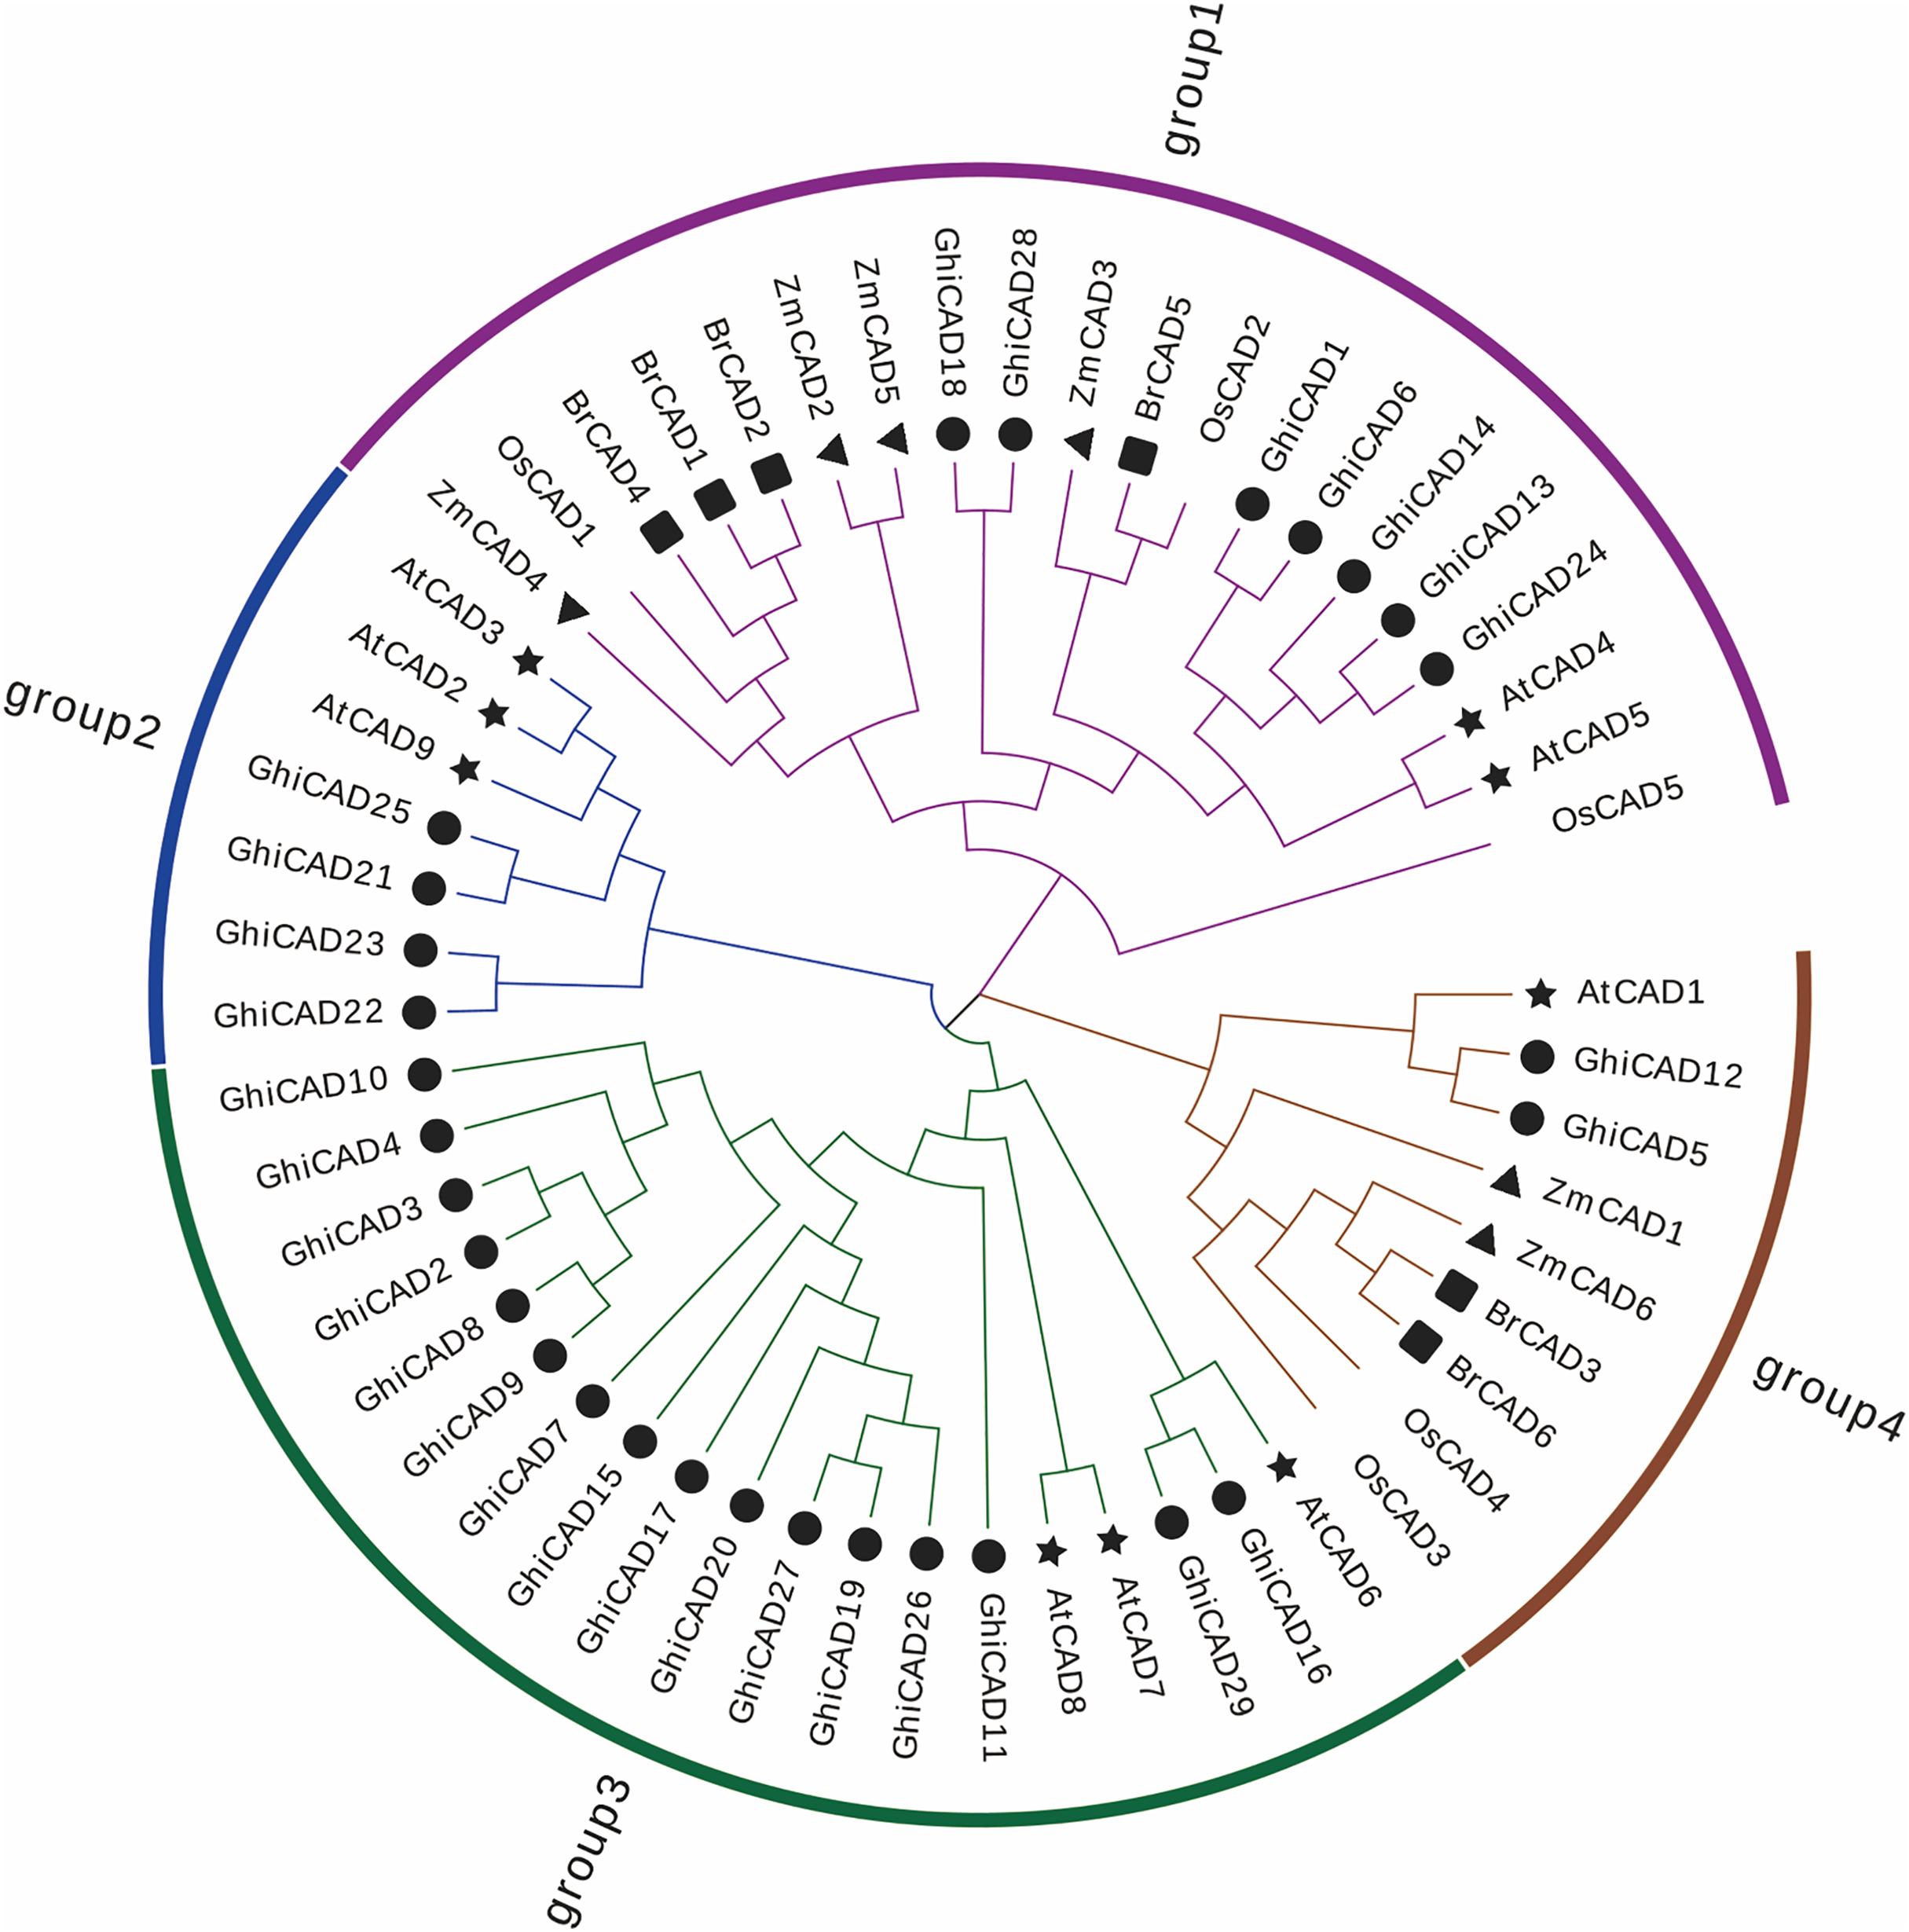
Analysis of cis-acting elements in the GhiCAD gene promoters
To further elucidate the biological processes involved in GhiCAD genes, we examined cis-acting elements within the promoter sequences of the 29 GhiCAD genes. Our findings revealed that the promoters of GhiCAD genes contain numerous cis-acting elements associated with environmental stress responses, including the abscisic acid response element ARE, ABRE3a, and ABRE4; the gibberellin response element TATC-box; the methyl jasmonate response element CGTCA-box; the drought stress response elements DRE core, DRE1, and MBS; and the flavonoid biosynthesis element MBSI, indicating that the GhiCAD genes are related to environmental stress responses in cotton. Cis-acting elements linked to transcription factor regulation, like MYB, MYC, are also abundantly present in the promoters of GhiCAD genes, indicating that the transcription of GhiCAD genes may be influenced by multiple transcription factors (Fig. 2, Table S3).
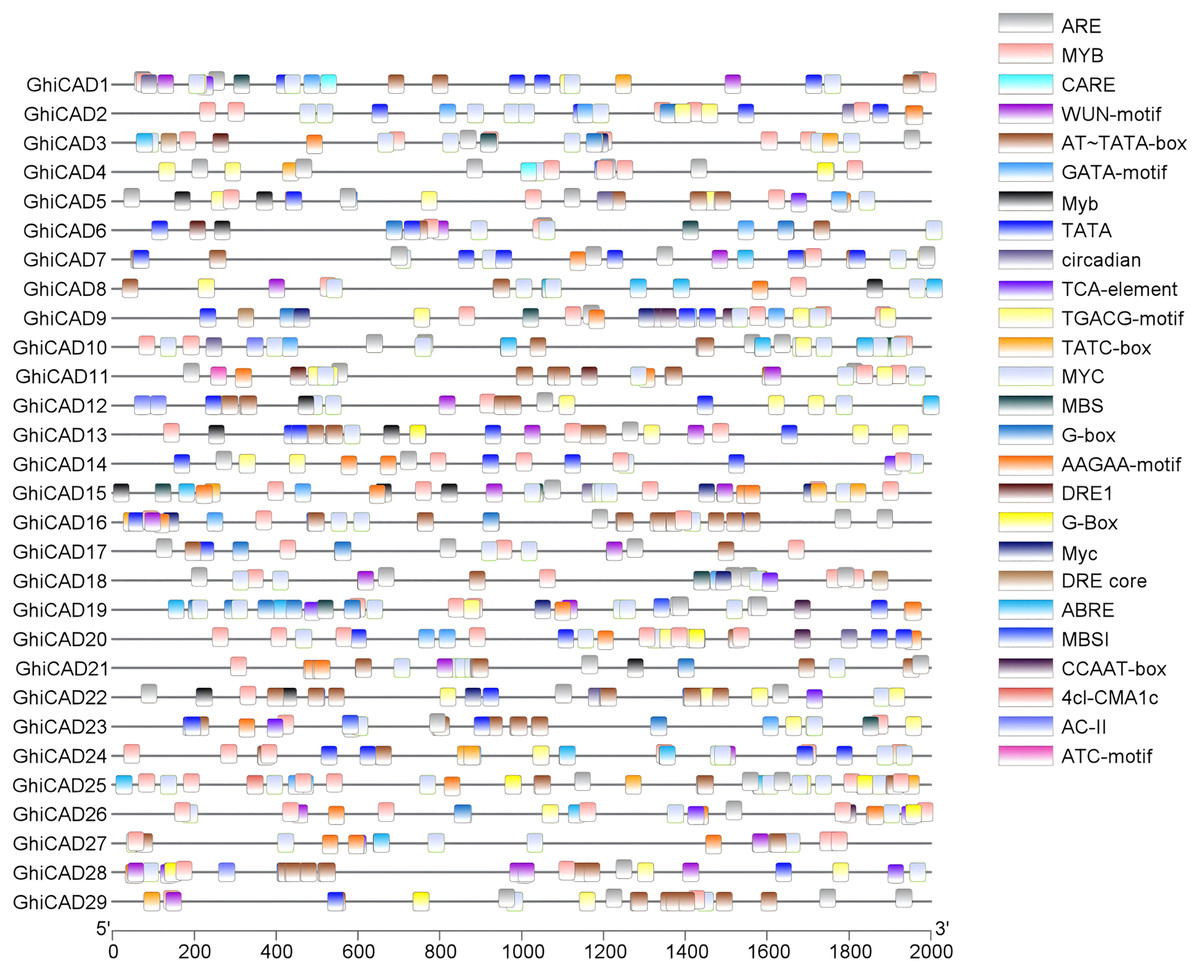
Figure 2: Analysis of cis-acting elements on CAD gene promoters in Gossypium hirsutum.
Different small boxes in the figure represent different promoter cis-acting elements, and the small boxes labelled at the top right represent cis-acting elements.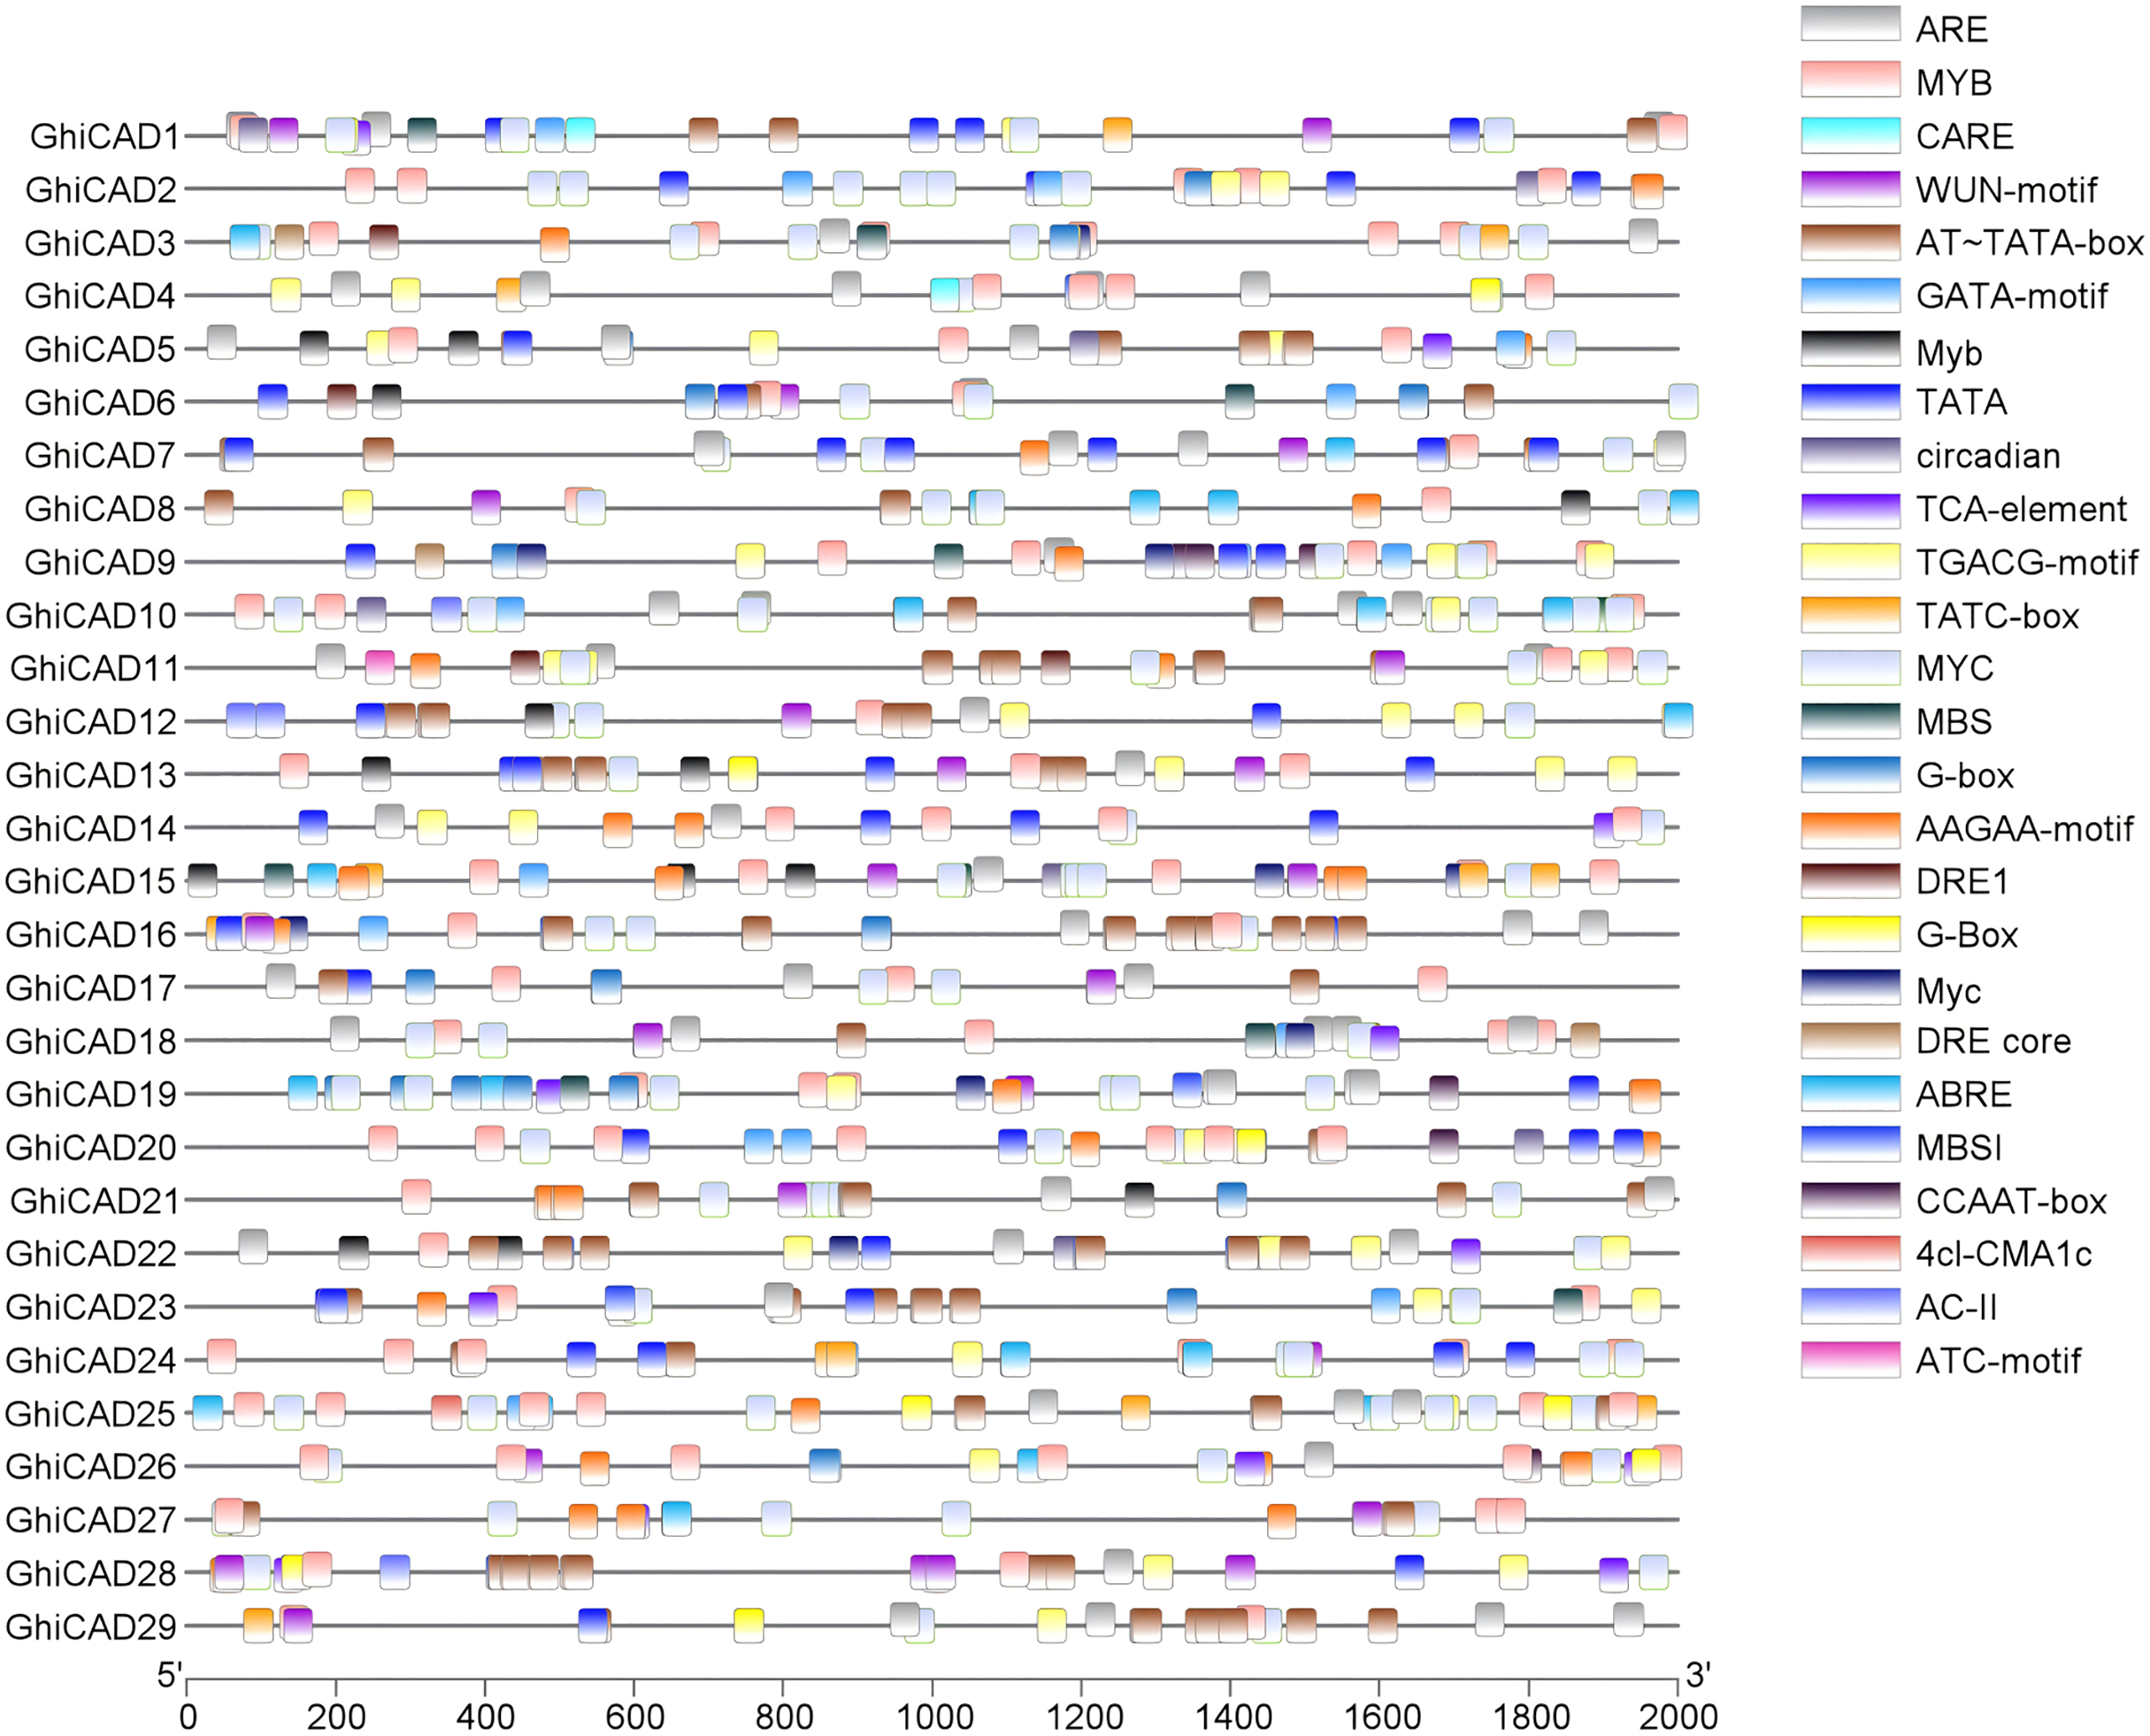
Tissue expression patterns of CAD genes in Gossypium hirsutum
To investigate the potential involvement of Gossypium hirsutum CAD genes in cotton growth and development, we analyzed published transcriptome data to examine the expression of 29 GhiCAD genes across various tissues, including roots, leaves, sepals, stems, anthers, bracts, filaments, pistils, ovules, and fibers at different developmental stages. The growth phases of cotton ovules and fibers are measured in days post anthesis (DPA). As shown in Fig. 3 and Table S4, certain CAD gene families, such as GhiCAD10, GhiCAD25, and GhiCAD21, are highly expressed in multiple tissues, including roots, leaves, sepals, ovules, and fibers at various developmental stages. This indicates that GhiCAD10, GhiCAD25, and GhiCAD21 play roles in the development of several cotton tissues. Conversely, some CAD genes exhibit tissue-specific expression. For instance, GhiCAD23 is predominantly expressed in roots, GhiCAD4 in pedicels, and GhiCAD18 in filaments and stamens. These observations imply that these latter genes primarily contribute to the developmental processes of specific tissues.
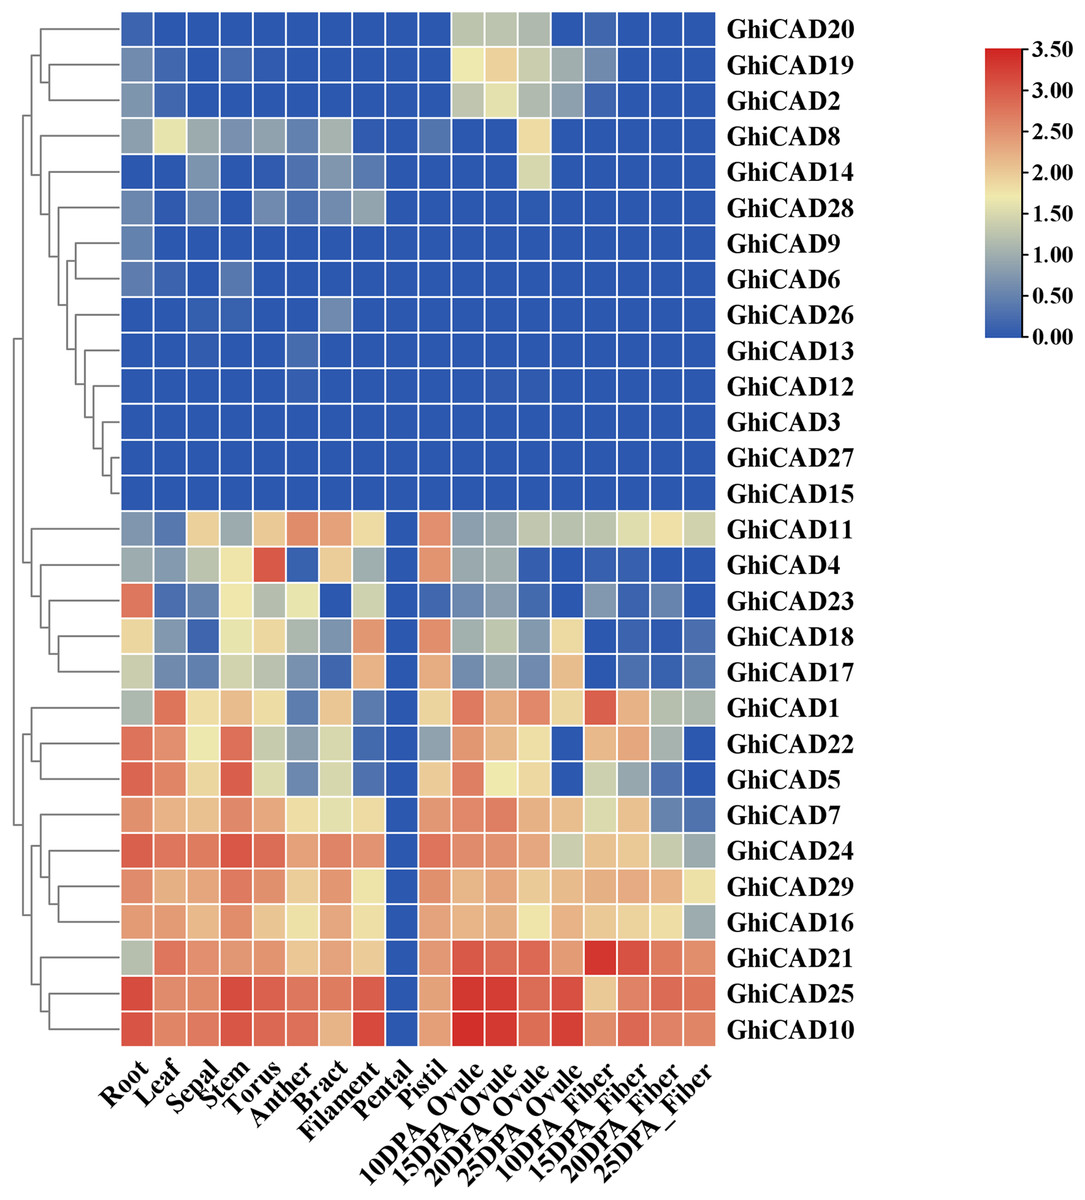
Figure 3: Tissue expression analysis of CAD genes in Gossypium hirsutum.
Each small square displays the log2 TPM values of CAD genes in different samples, with red or blue indicating the difference in expression levels in each sample.
Expression analysis of CAD genes in Gossypium hirsutum under DS
To further investigate the potential function of CAD genes in cotton’s response to DS, we examined the expression profiles of CAD gene family members under conditions of PEG treatment using transcriptome data. The data indicated that most GhiCAD genes did not show significant changes in expression levels before and after PEG treatment. However, the expression of GhiCAD10 and GhiCAD23 changed significantly under PEG treatment conditions. GhiCAD23 was markedly elevated by PEG, suggesting that the GhiCAD23 gene might implicated in the cotton’s response to DS (Fig. 4, Table S5).

Figure 4: Expression pattern of GhiCAD genes under PEG treatment.
Each small square displays the log2 FPKM values of CAD genes in the control group and the PEG treatment group, with red or blue indicating the difference in expression levels in each sample.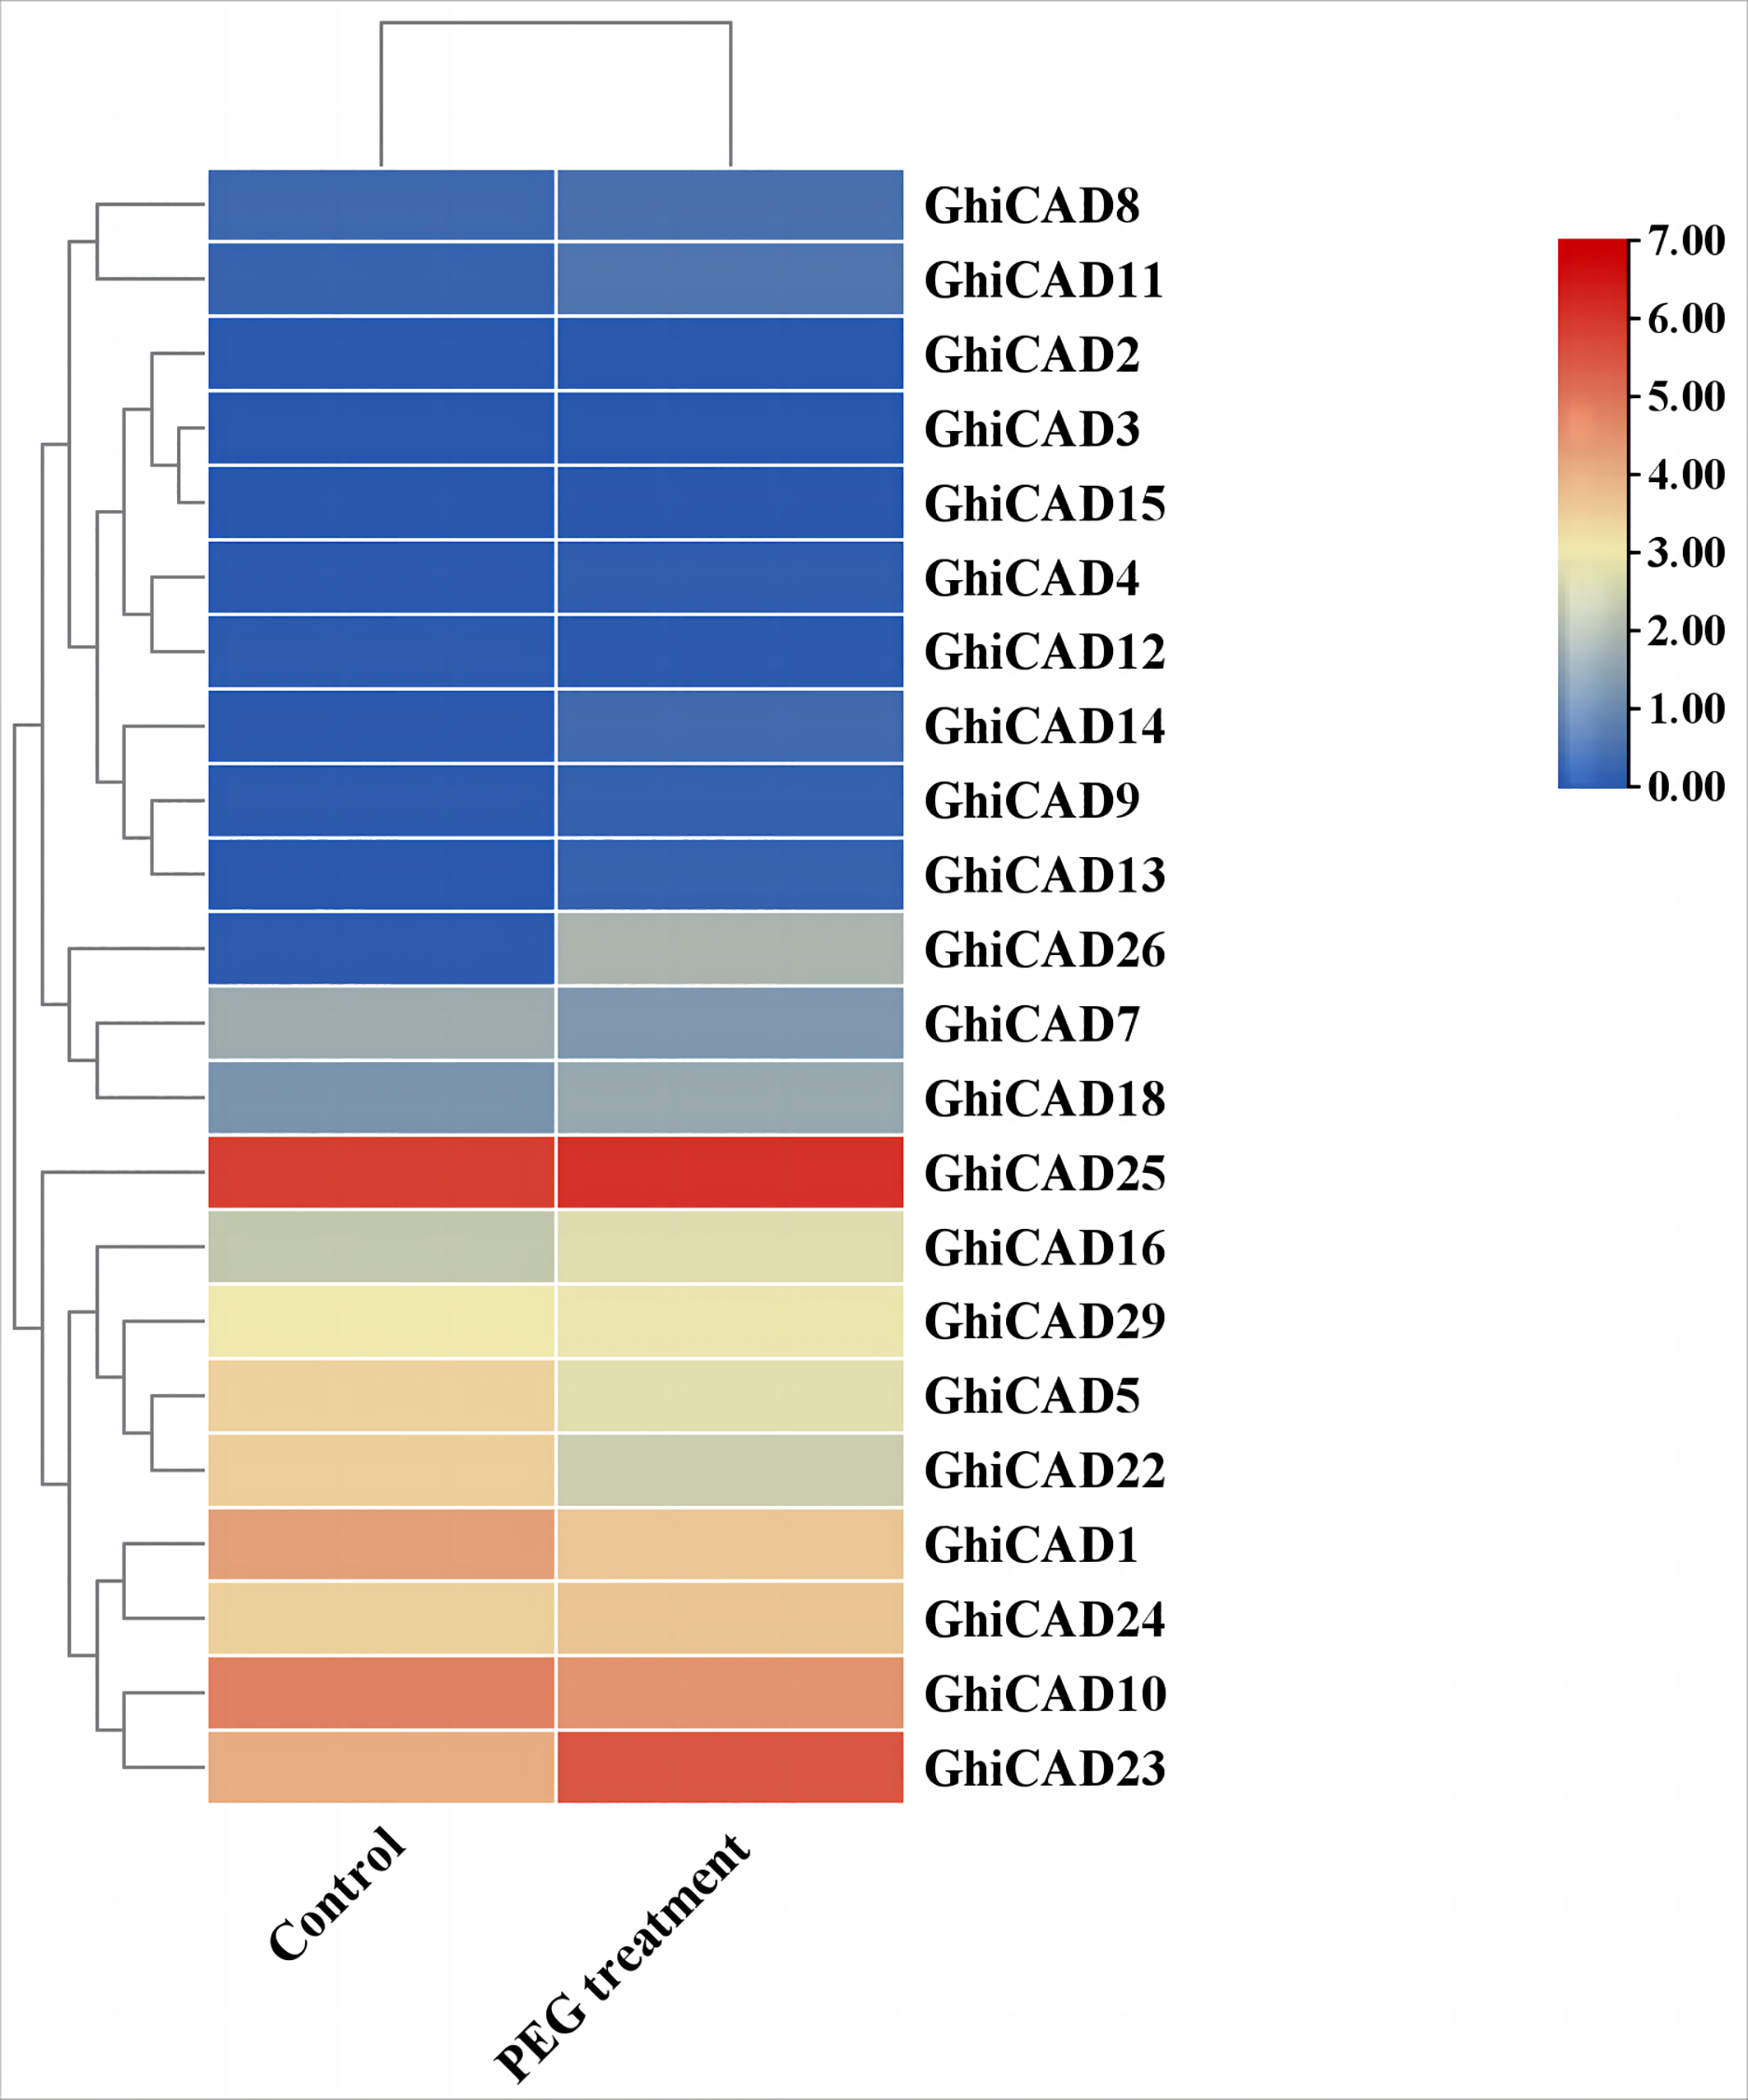
To further examine whether GhiCAD23 responds to DS, we utilized qPCR to evaluate the expression of GhiCAD23 in cotton plants under normal watering and drought treatment conditions. The results showed that the transcription level of GhiCAD23 was significantly higher in drought-treated cotton plants compared to normally watered plants, indicating that GhiCAD23 is implicated in cotton’s resistance to DS (Fig. S1).
Co-expression network analysis of the GhiCAD23 gene
We conducted a co-expression network analysis of the GhiCAD23 gene and performed functional annotation of the genes co-expressed with GhiCAD23. The analysis indicated that GhiCAD23 displays expression patterns similar to several known drought-responsive genes, further corroborating that GhiCAD23 is related to DS response in cotton (Fig. 5).
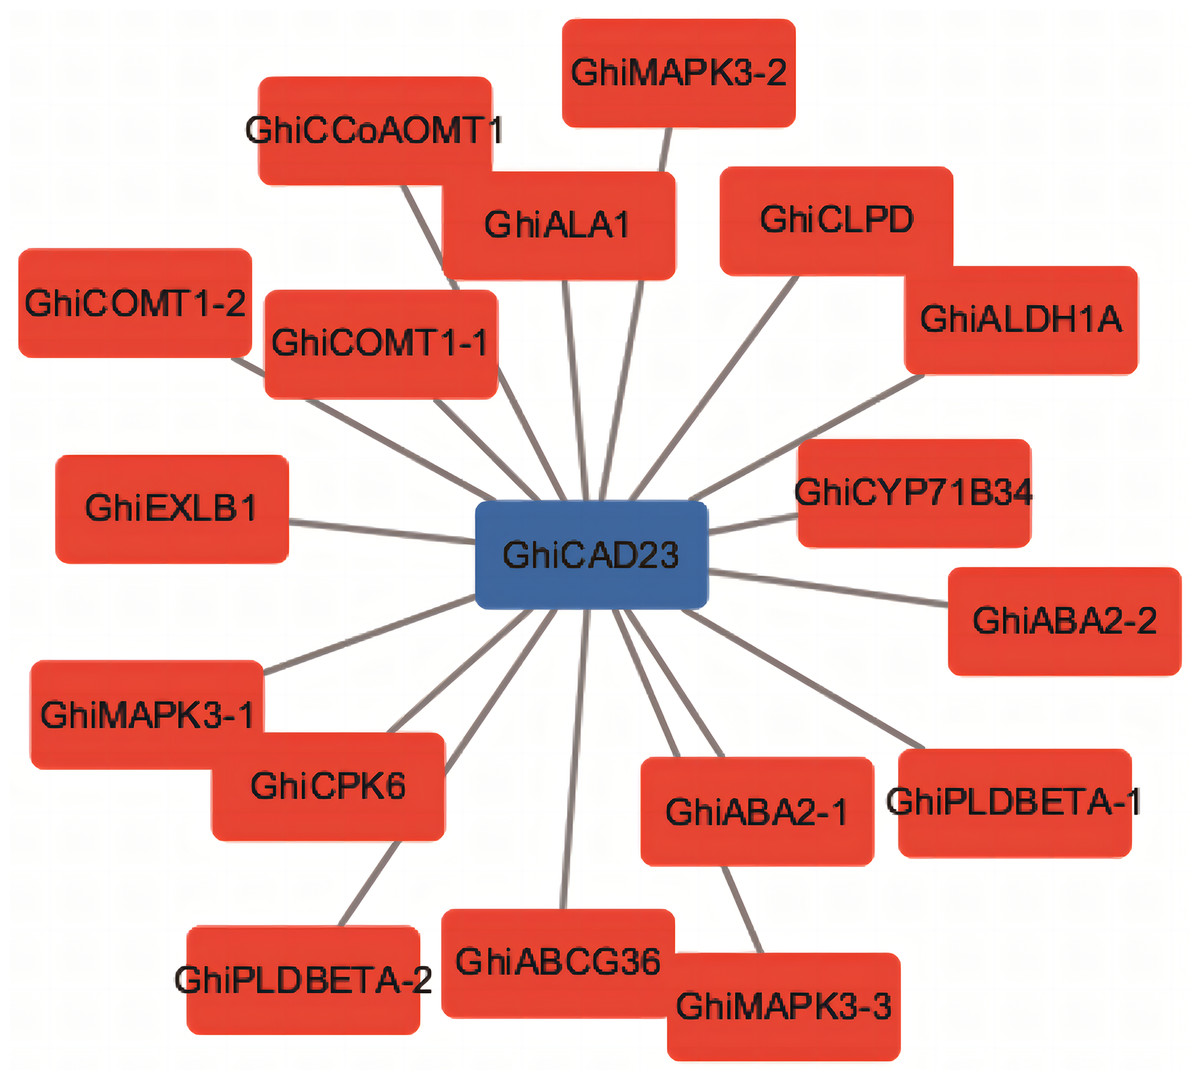
Figure 5: Co-expression analysis of GhiCAD23 gene.
Each red box represents a known drought-responsive gene.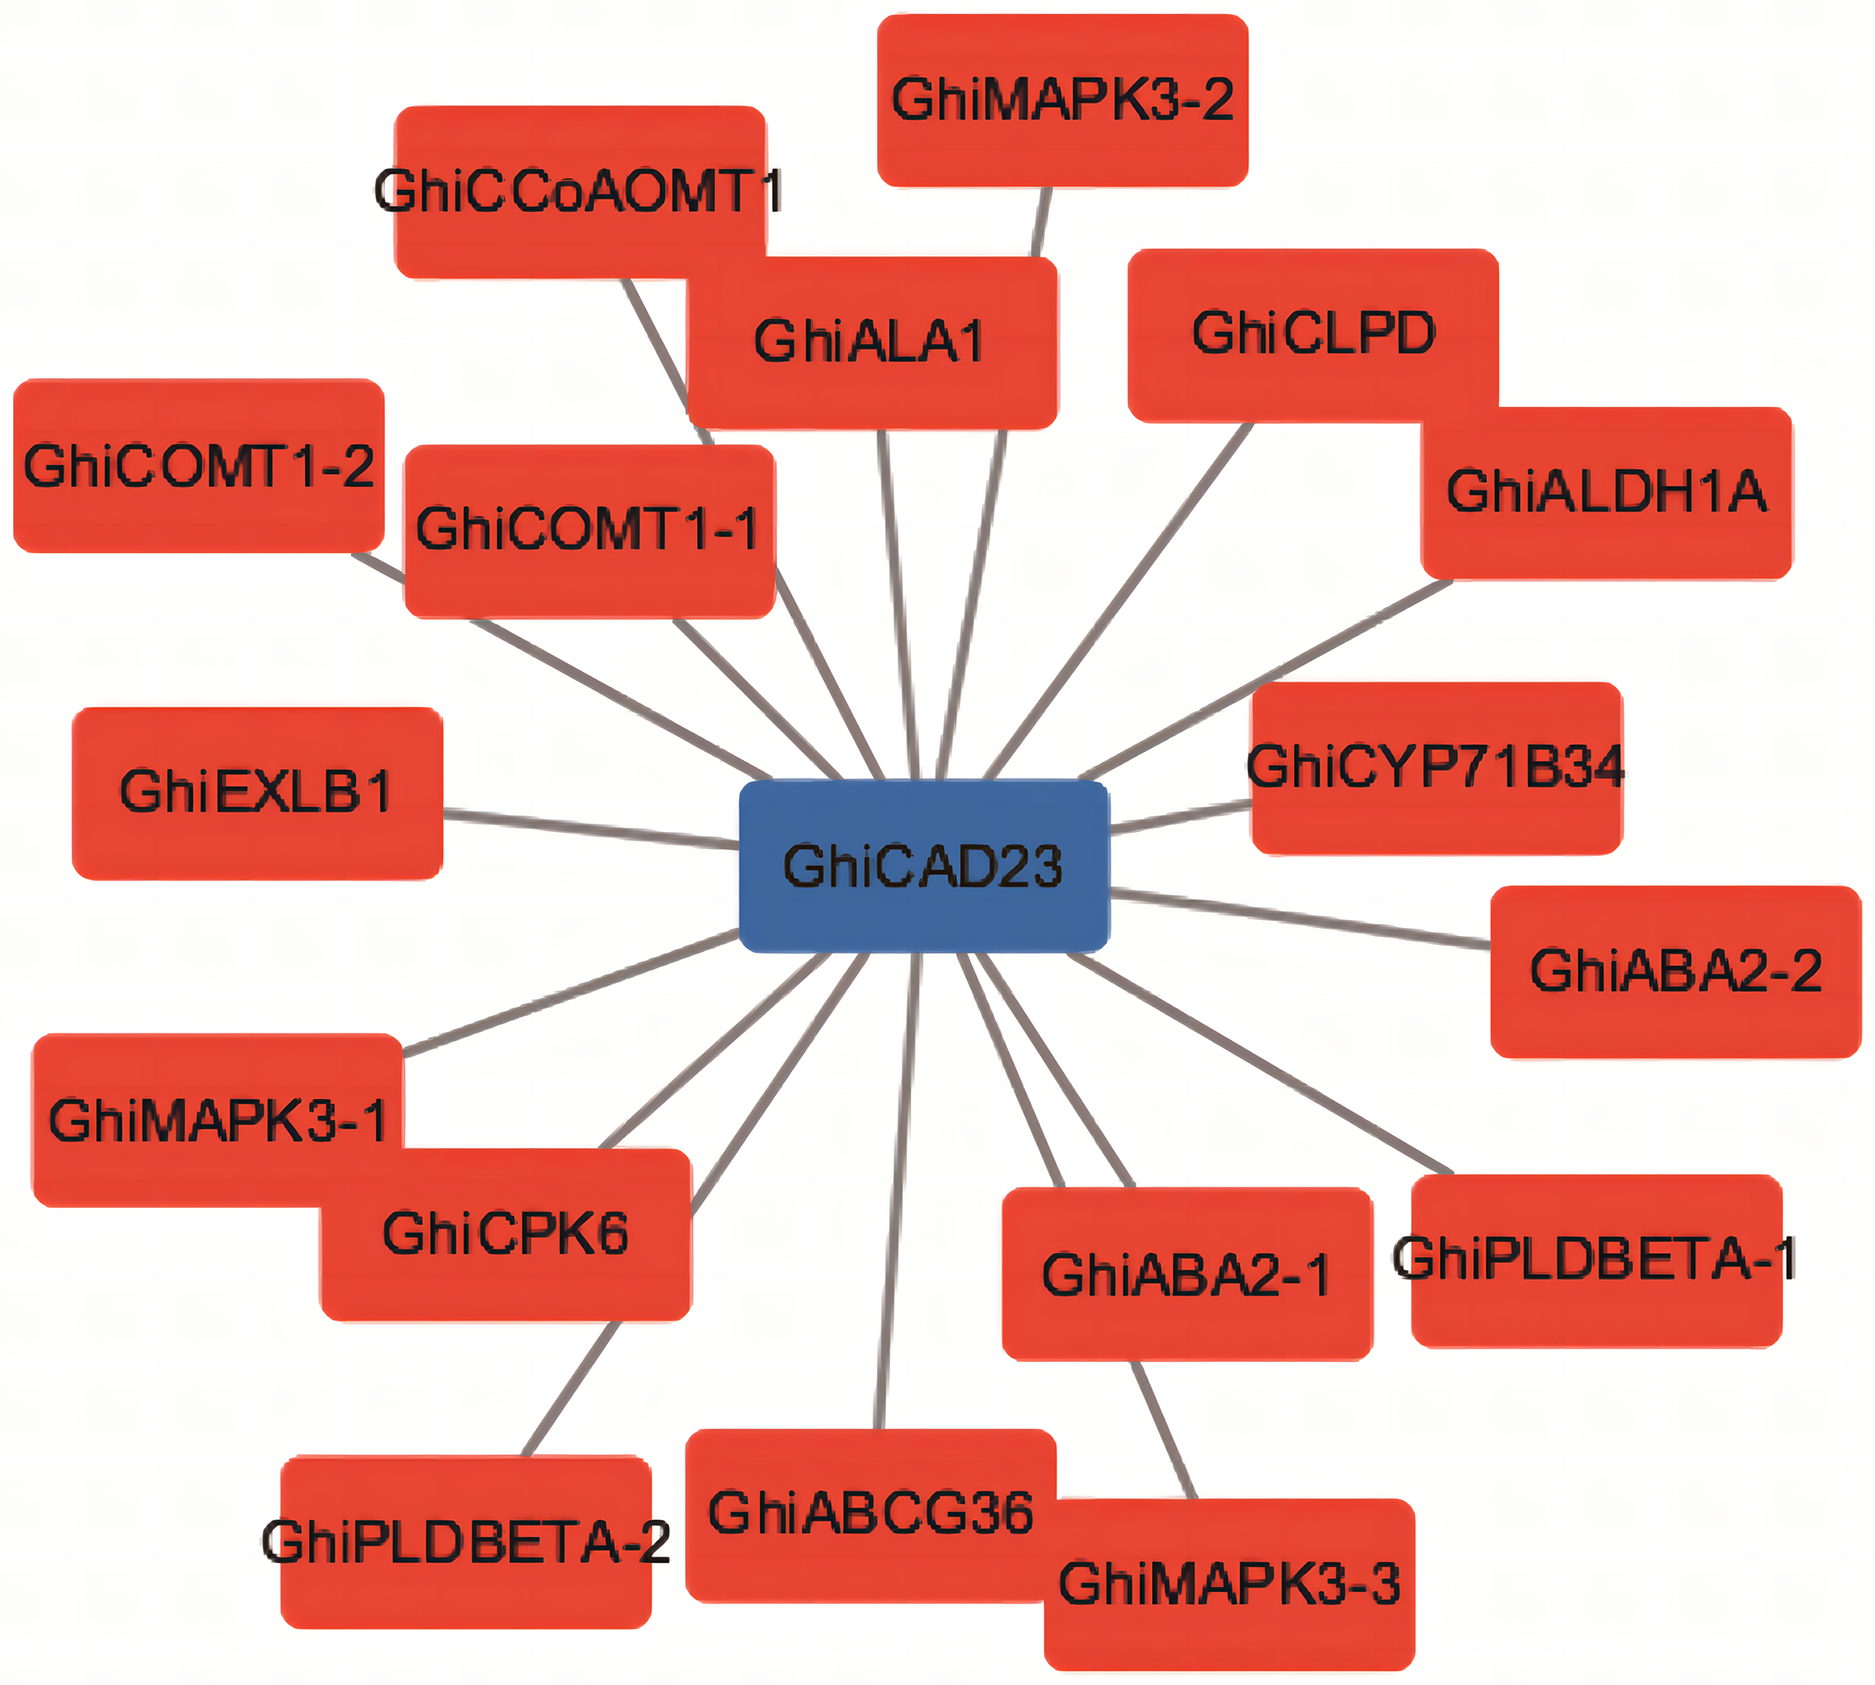
Knocking down the GhiCAD23 gene decreases the drought tolerance of cotton
The gene was silenced using VIGS methodology to further examine the function of the GhiCAD23 gene in DS response in cotton. When positive plants (TRV2: GhCLA) exhibited albino symptoms, it indicated effective silencing of the target gene (Fig. 6A). Quantitative polymerase chain reaction (qPCR) was utilized to evaluate the expression level of GhiCAD23 in TRV2:00 and TRV2:GhiCAD23 plants, confirming the effective silencing of the GhiCAD23 gene. The findings revealed a significantly lower transcription level of GhiCAD23 in TRV2:GhiCAD23 plants was markedly lower compared to that in TRV2:00 plants (p < 0.01), indicating effective suppression of GhiCAD23 transcription (Fig. 6B). Subsequently, 3-week-old TRV2:00 and TRV2:GhiCAD23 plants were subjected to drought treatment. At 0 d of drought, no notable phenotypic differences were discovered between TRV2:00 and TRV2:GhiCAD23 plants. After 18 d of period of natural drought, TRV2:00 plants displayed noticeably superior development compared to TRV2:GhiCAD23 plants.
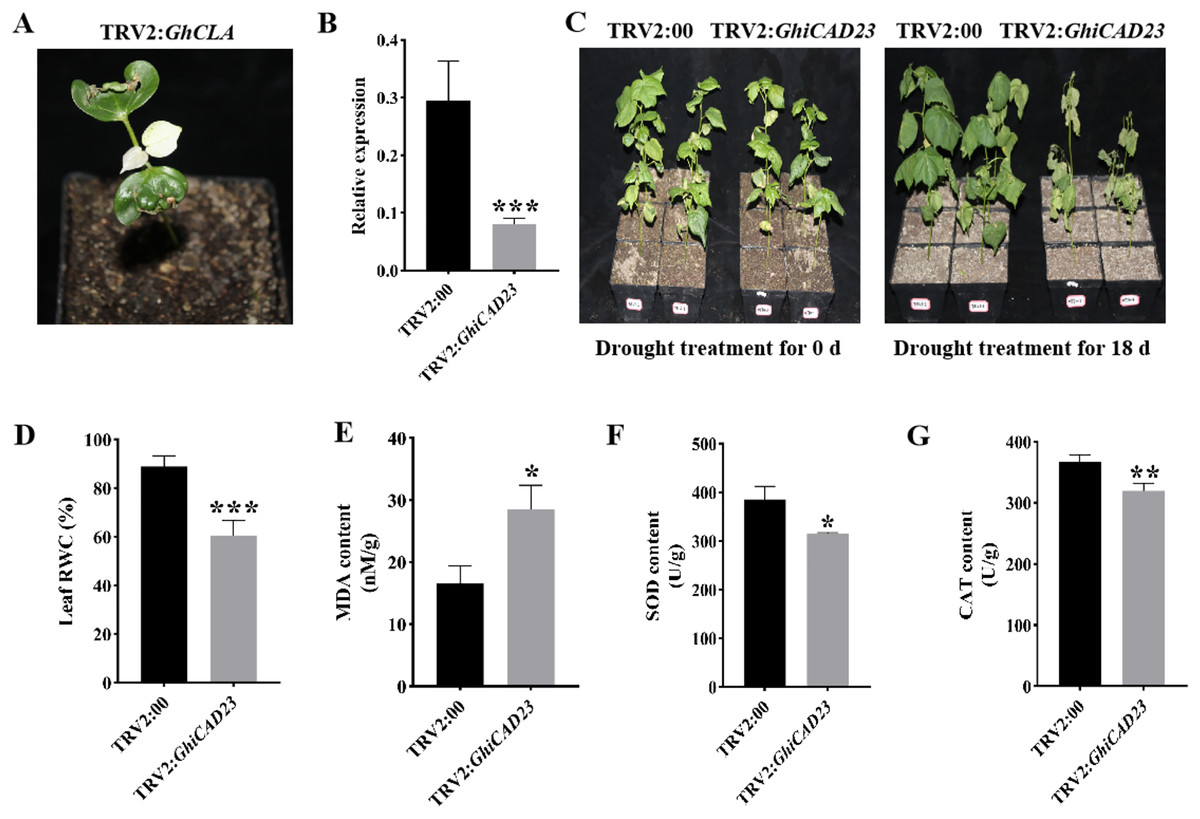
Figure 6: Silencing of GhiCAD23 reduced cotton tolerance to drought stress.
(A) Positive control plants. (B) Expression of GhiCAD23 in TRV2:00 and TRV2:GhiCAD23 plants. (C) Phenotype of TRV2:00 and TRV2:GhiCAD23 plants under DS. (D) Relative water content (RWC) of TRV2:00 and TRV2:GhiCAD23 plants under DS. (E–G) The content of MDA (E), SOD (F) and CAT (G) of TRV2:00 and TRV2:GhiCAD23 plants under DS. SD represents the standard deviation derived from three separate trials. *p < 0.05; **p < 0.01; ***p < 0.001. Student’s t-test.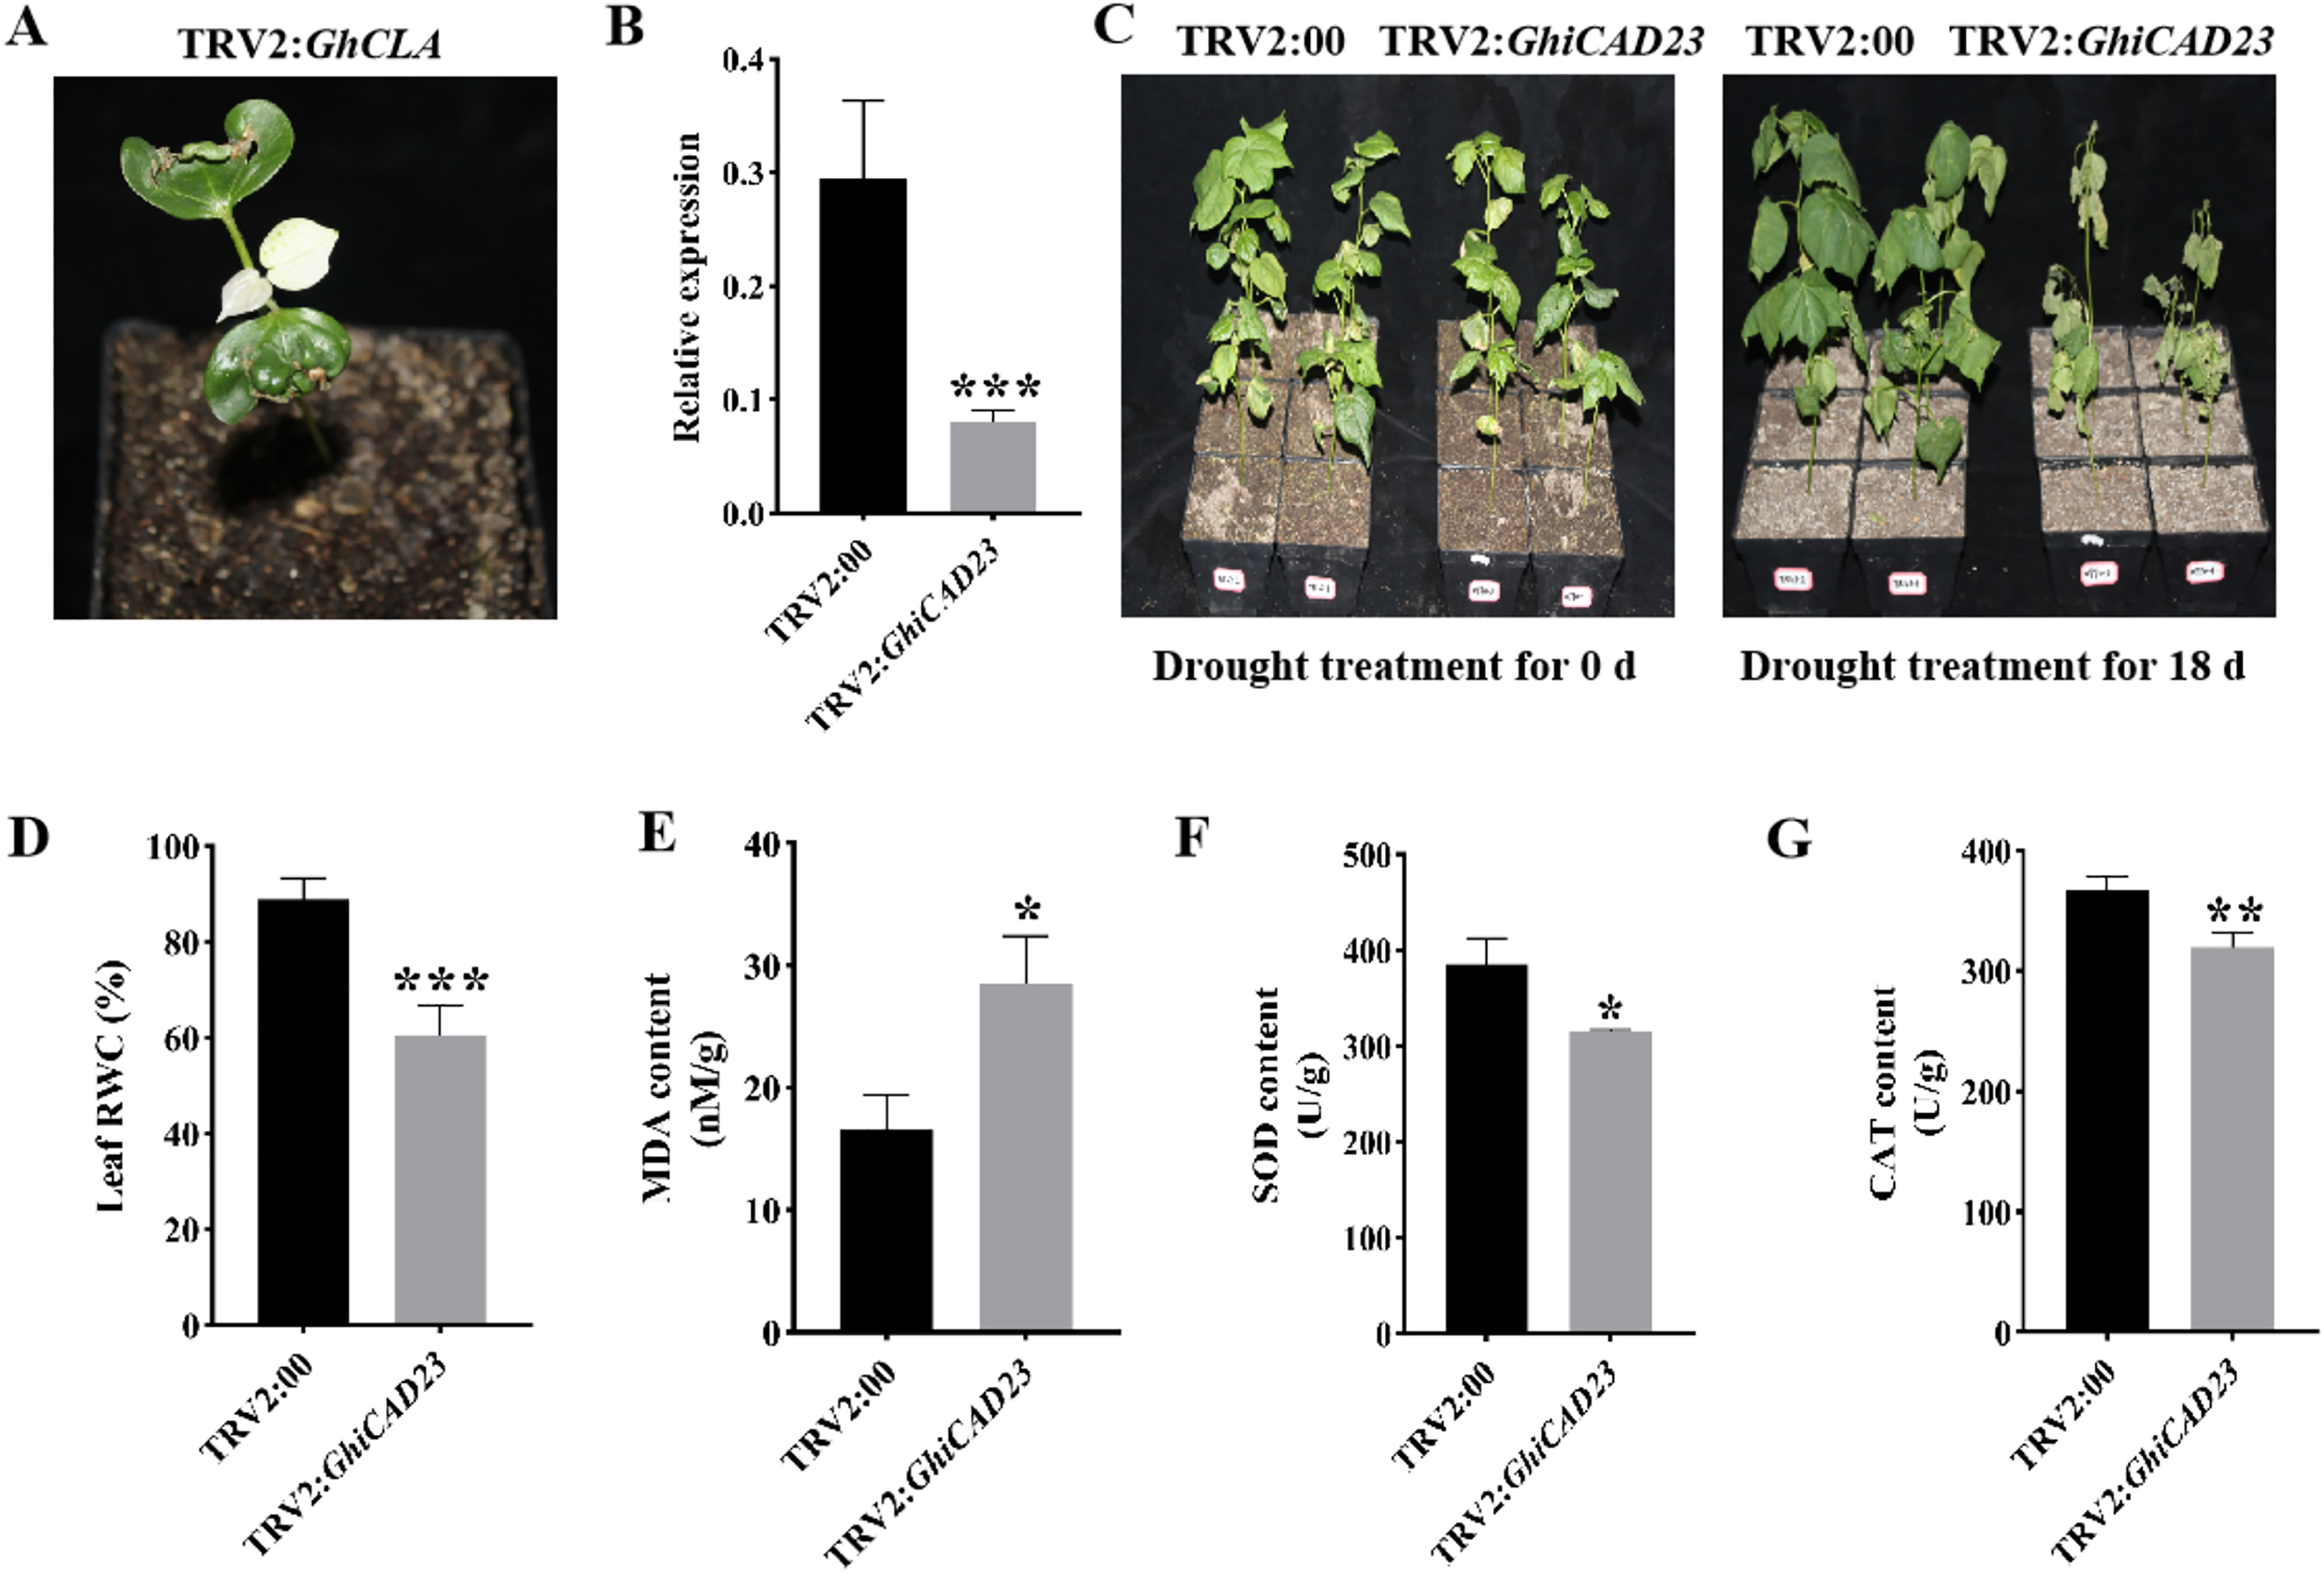
Additionally, the wilting rate was observed to be 33.33% in TRV2:00 plants, while TRV2:GhiCAD23 plants exhibited a wilting rate of 100% (Fig. 6C). TRV2:00 not only had a lower wilt rate, but also a lower degree of wilt than TRV2:GhiCAD23.
Physiological parameters of TRV2:00 and TRV2:GhiCAD23 plants were further assessed under DS conditions. The results revealed that the relative water content of TRV2:00 plant leaves was 31.84% higher relative to the TRV2:GhiCAD23 plants, while the MDA content in TRV2:00 cotton plants was 72.16% lower than in TRV2: GhiCAD23 plants (Figs. 6D, 6E). Additionally, the SOD and CAT contents in TRV2:GhiCAD23 plants were reduced by 30.22% and 14.19%, respectively, compared to TRV2:00 plants (Figs. 6F, 6G). Both phenotypic observations and physiological parameter measurements suggest that silencing the GhiCAD23 gene diminishes the drought resilience of cotton.
GhiCAD23 responds to DS by affecting the accumulation of lignin
To investigate determine whether the lignin content of cotton during the seedling stage changes under DS, we measured the lignin content in cotton plants under normal watering and DS conditions. Our results showed a significant increase in lignin content in cotton plants under DS compared to those under normal watering, indicating that DS significantly promotes lignin accumulation in cotton (Fig. 7A). Additionally, to assess the impact of silencing the GhiCAD23 gene on lignin accumulation under DS, we measured the lignin content in TRV2:00 and TRV2:GhiCAD23 plants under DS. The outcomes demonstrated that the lignin content in TRV2:GhiCAD23 plants was reduced compared to the TRV2:00 plants, suggesting that silencing GhiCAD23 reduces lignin accumulation in cotton plants under DS (Fig. 7B).
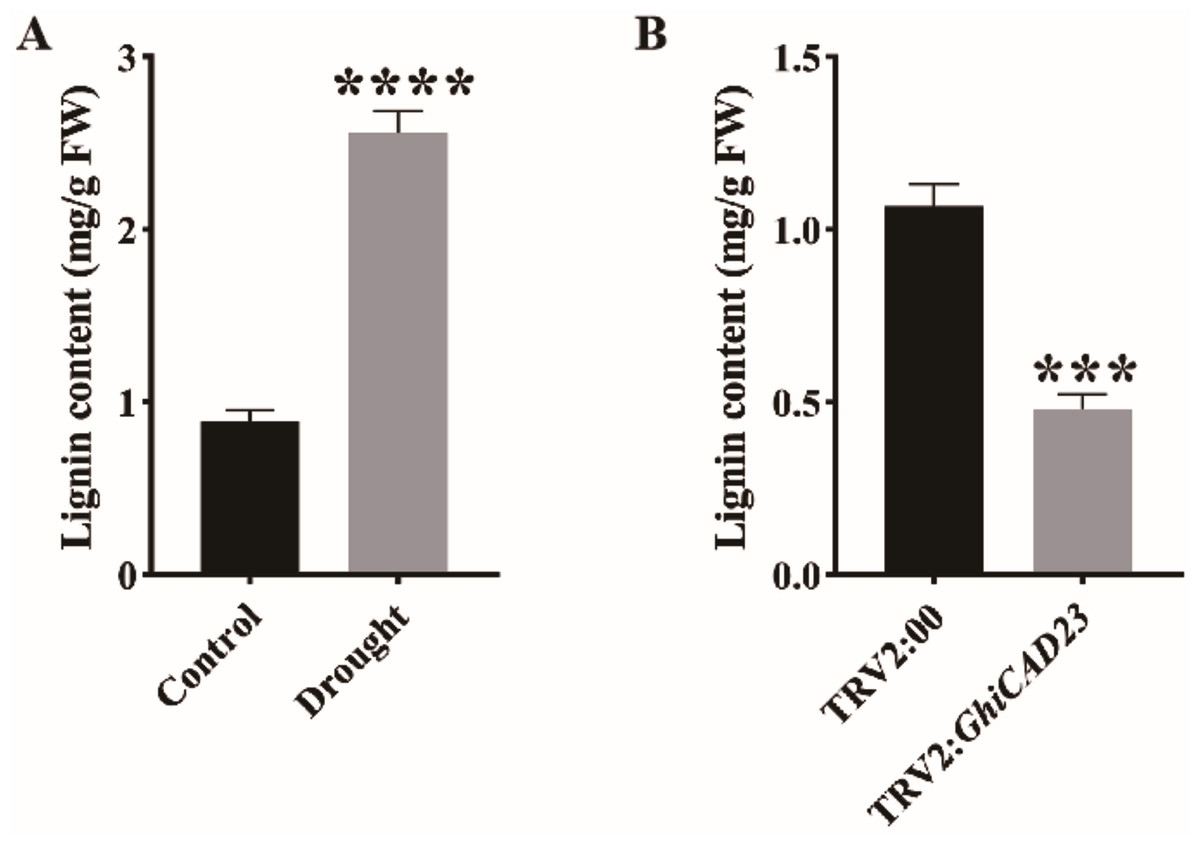
Figure 7: Lignin content analysis.
(A) Lignin content in the stem of cotton plants was evaluated under normal watering and DS conditions. (B) Lignin contents in three-leaf stage TRV2:00 and TRV2:GhiCAD23 cotton stems. SD represents the standard deviation derived from three separate trials. ***p < 0.001; ****p < 0.0001. Student’s t-test.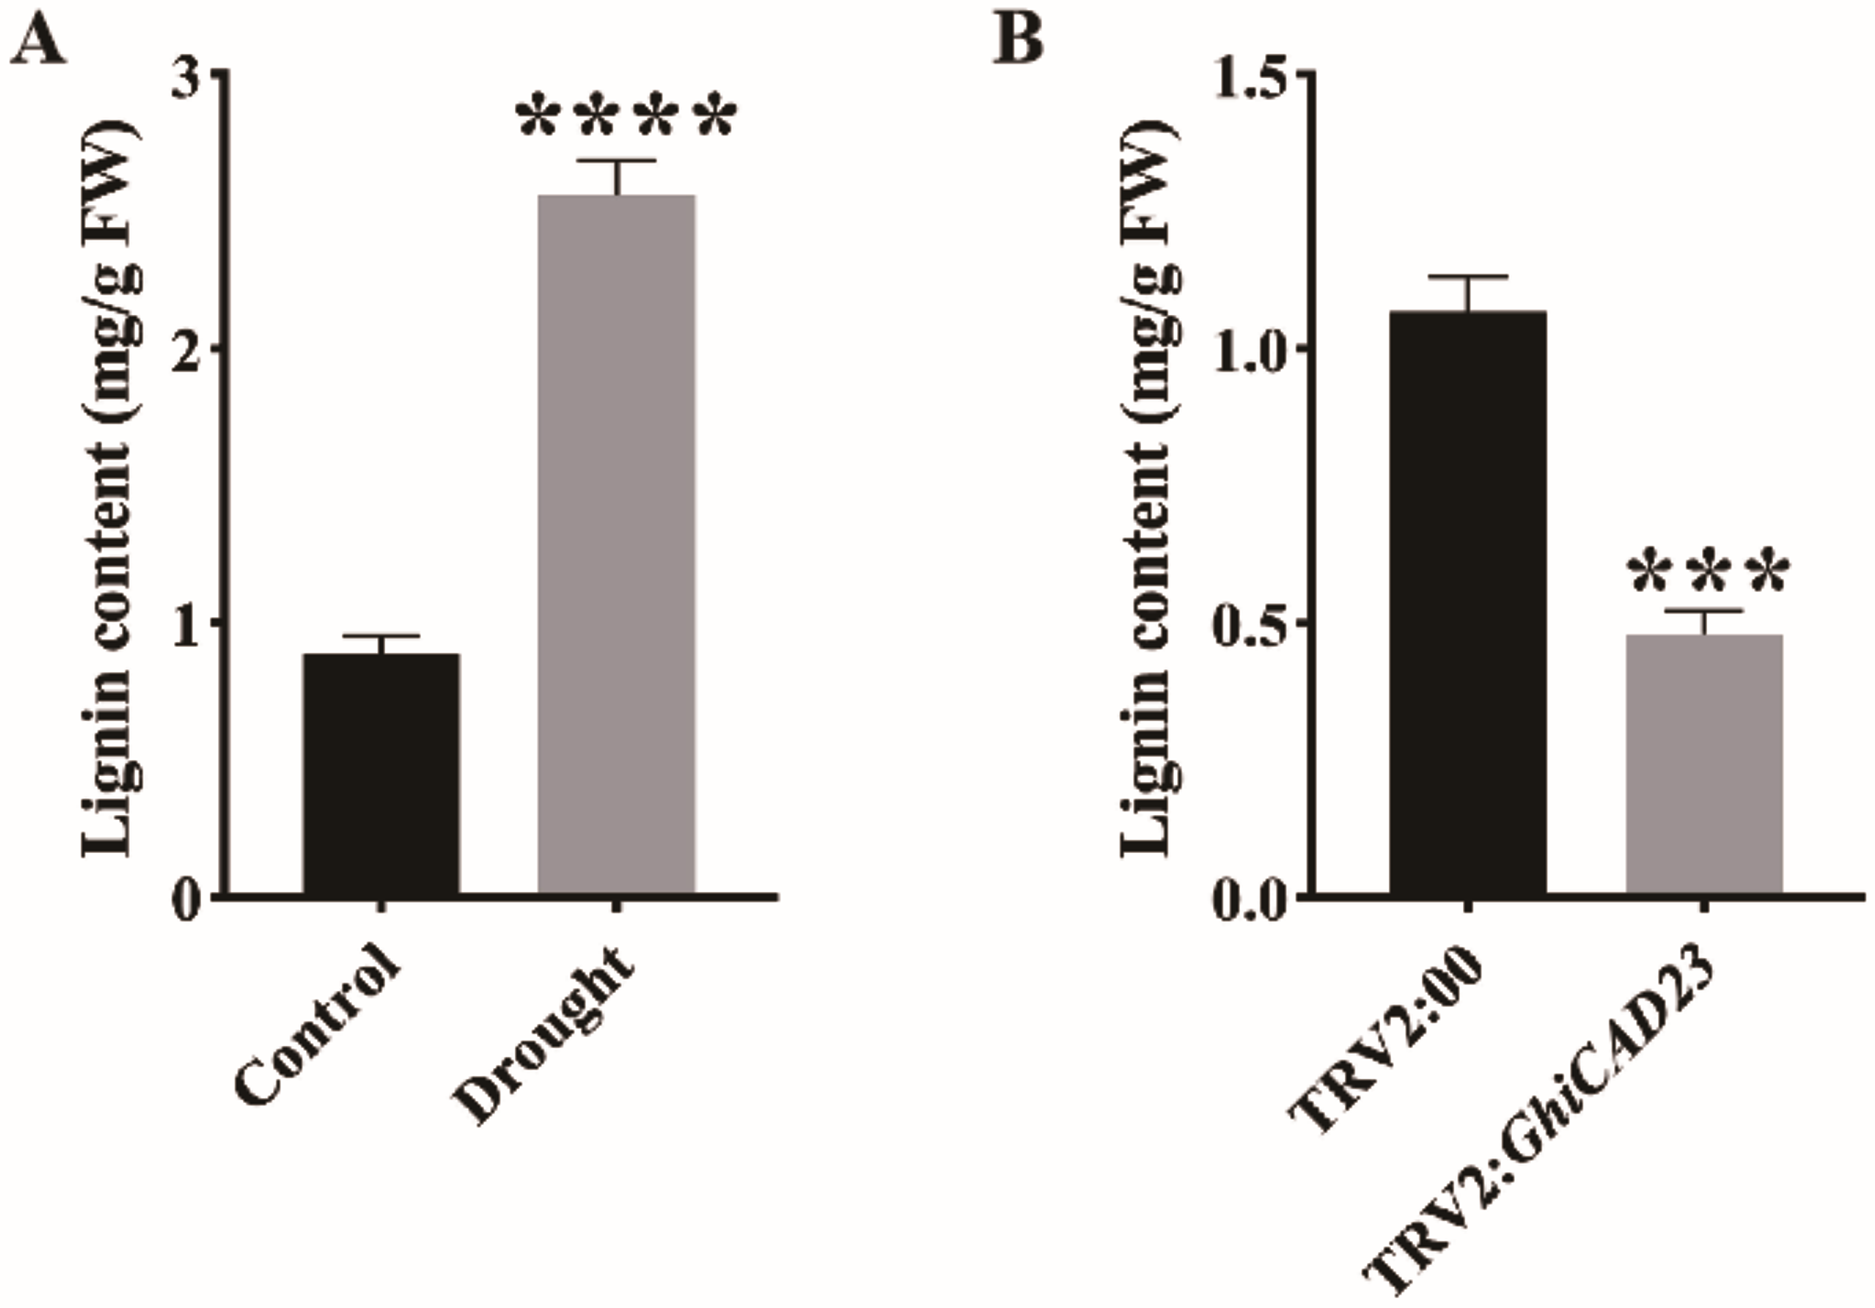
Discussion
CAD assumes a crucial role in lignin synthesis, responsible for catalyzing the final step in the lignin monomer biosynthesis pathway (Weng & Chapple, 2010; Bagniewska-Zadworna et al., 2014). Previous studies have systematically analyzed the CAD gene family in species like Arabidopsis (Sibout et al., 2003), Populus (Barakat et al., 2009), Rice (Tobias & Chow, 2005), and Brachypodium distachyon (Bukh, Nord-Larsen & Rasmussen, 2012). However, research on the cotton CAD gene family remains limited. In this study, we identified 29 CAD genes in cotton using bioinformatics methods and systematically analyzed the GhiCAD gene family, further expanding our understanding of the plant CAD gene family.
Lignin plays a pivotal function in plant growth and development (Wang et al., 2022). It enhances the hydrophobicity of plant cell walls, promotes the development of plant tissues and organs, and is significant for plant adaptation to the environment (Vanholme et al., 2019). Lignin biosynthesis is notably enhanced under drought stress (Xie, Cao & Xu, 2024). For example, when Glycine max is subjected to DS, the expression level of the CCoAOMT gene in the elongation zone of soybean roots is significantly upregulated, leading to an increase in lignin content and thereby reducing water loss in soybean roots (Yamaguchi et al., 2010). OsOLP1 augments drought resilience in rice by promoting lignin accumulation (Yan et al., 2023). Down regulation of microRNA 397 expression increases lignin accumulation in chickpea roots, thereby enhancing chickpea’s tolerance to DS (Sharma et al., 2023). In maize, elevated expression of the peroxidase gene ZmPRX1 promotes lignin accumulation in maize roots and increases seedling drought tolerance (Zhai et al., 2024). Our study found that DS significantly increases lignin content in cotton, further illustrating the close relationship between lignin accumulation and plant drought tolerance.
As a crucial rate-limiting enzyme in lignin biosynthesis, CAD is vital in plant defense against environmental stresses (Kim et al., 2004, 2007; Dong & Lin, 2021). The transcription levels of multiple NtCAD genes in tobacco change under drought stress conditions (Wu et al., 2024). DS induces the expression of three melon CAD genes, CmCAD1, CmCAD2, and CmCAD3, to enhance lignin biosynthesis (Jin et al., 2014; Liu et al., 2020). Examination of Phyllostachys edulis PheCAD gene expression patterns under abiotic stress conditions showed that PheCAD2 was notably elevated following abiotic stress exposure (Vasupalli et al., 2021). Our experimental data reveal that drought stress induces the accumulation of transcripts from multiple GhiCAD genes. Notably, GhiCAD23 shows an expression pattern similar to several well-known drought response genes, suggesting that CAD genes play a role in the plant’s response to drought stress.
CAD-C and CAD-D are the principal genes implicated in lignin synthesis in Arabidopsis, and they play a significant role in defense against the bacterial pathogen Pseudomonas syringae pv. tomato (Tronchet et al., 2010; Sibout et al., 2005). Transcription factors RhbZIP17 and RhWRKY30 enhance rose resistance to the pathogen Botrytis cinerea by activating the transcription of RhCAD1 (Li et al., 2024). Previous studies have elucidated the function of CAD genes in plant biotic stress responses, while research on the role of CAD genes in plant abiotic stress responses has primarily focused on expression pattern analyses. Our study revealed the role of the GhiCAD23 gene in cotton drought response, finding that suppression of this gene’s expression diminished cotton’s resilience to DS. This offers compelling support for the involvement of CAD genes in plant reactions to environmental stressors and enhances our comprehension of plant CAD gene functionality.
Drought stress leads to the accumulation of excessive reactive oxygen species (ROS) within plants, which can cause oxidative damage to biomolecules and even cell death (Li et al., 2023). Plants use an enzymatic reaction system to remove excess ROS, with CAT and SOD being key enzymes in the ROS detoxification system (Raza et al., 2021; Luo et al., 2024). Under DS conditions, both SOD and CAT enzyme activities are lower in GhiCAD23 gene-silenced plants compared to the control plants. This indicates that suppressing GhiCAD23 gene expression weakens the cotton plant’s ROS scavenging ability, leading to increased sensitivity to drought stress. Four-coumarate-CoA ligases (4CL) are crucial enzymes involved in lignin biosynthesis in plants. Silencing the cotton Gh4CL7 gene weakens the plant’s drought resistance, with lignin content in Gh4CL7-silenced plants decreasing by about 20% compared to control plants (Sun et al., 2020). Our research found that silencing the GhiCAD23 gene reduces lignin accumulation in cotton plants under drought stress. This further indicates that lignin biosynthesis-related genes participate in the plant’s response to drought stress by affecting lignin accumulation under such conditions. Many genes that encode catalytic enzymes also participate in the biological processes of plant growth, development, and stress resistance by influencing the expression of other genes (Qin et al., 2017; Yao et al., 2022a; Zhang et al., 2024; Guo et al., 2024). Therefore, we speculate that silencing the GhiCAD23 gene may also weaken the drought resistance of cotton by affecting the expression of other genes.
Drought stress severely affects crop growth, yield, and quality. Exploring drought-resistant gene resources in crops and using genetic engineering techniques to enhance drought tolerance is an effective approach for developing drought-resistant germplasm resources (Oladosu et al., 2019). In this study, we identified a new drought-resistant gene in cotton, GhiCAD23, which serves as a potential target gene for the subsequent creation of new drought-resistant germplasm resources in cotton using genetic engineering techniques.
Conclusions
This article identifies 29 CAD genes at the whole-genome level in cotton. Evolutionary analysis reveals that the CAD gene family can be divided into four subgroups. Multiple cis-acting elements related to plant abiotic stress responses are present in the promoters of CAD family genes. Members of the CAD gene family are expressed in various tissues of cotton, indicating their involvement in the developmental processes of these tissues. Through transcriptome data, qPCR, and co-expression analysis, we identified a CAD gene, GhiCAD23, that participates in cotton’s response to drought stress. Further functional studies demonstrate that suppressing the GhiCAD23 gene weakens cotton’s drought resistance, reduces SOD and CAT enzyme activities under drought stress, and increases MDA accumulation. Additionally, silencing the GhiCAD23 gene also decreases lignin accumulation in cotton under DS conditions. These results provide a basis for further understanding the role of CAD in plant resistance to drought stress. At the same time, this study will contribute to future genomics-assisted breeding programs in cotton to improve its drought tolerance.
Supplemental Information
Expression of GhiCAD23 in cotton plants under normal watering and drought stress.
SD represents the standard deviation derived from three separate trials. The asterisks indicate significant differences according to the Student’s t-test (***, p < 0.001).