
Identification of a novel immune infiltration-related gene signature, MCEMP1, for coronary artery disease
- Published
- Accepted
- Received
- Academic Editor
- Fanglin Guan
- Subject Areas
- Cell Biology, Cardiology, Data Mining and Machine Learning
- Keywords
- Coronary artery disease, Machine learning algorithm, Immune cell infiltration, MCEMP1, ox-LDL treatment HUVECs cells
- Copyright
- © 2024 Ye et al.
- Licence
- This is an open access article distributed under the terms of the Creative Commons Attribution License, which permits using, remixing, and building upon the work non-commercially, as long as it is properly attributed. For attribution, the original author(s), title, publication source (PeerJ) and either DOI or URL of the article must be cited.
- Cite this article
- 2024. Identification of a novel immune infiltration-related gene signature, MCEMP1, for coronary artery disease. PeerJ 12:e18135 https://doi.org/10.7717/peerj.18135
Abstract
Background
This study aims to identify a novel gene signature for coronary artery disease (CAD), explore the role of immune cell infiltration in CAD pathogenesis, and assess the cell function of mast cell-expressed membrane protein 1 (MCEMP1) in human umbilical vein endothelial cells (HUVECs) treated with oxidized low-density lipoprotein (ox-LDL).
Methods
To identify differentially expressed genes (DEGs) of CAD, datasets GSE24519 and GSE61145 were downloaded from the Gene Expression Omnibus (GEO) database using the R “limma” package with p < 0.05 and |log2 FC| > 1. Gene ontology (GO) and pathway analyses were conducted to determine the biological functions of DEGs. Hub genes were identified using support vector machine-recursive feature elimination (SVM-RFE) and least absolute shrinkage and selection operator (LASSO). The expression levels of these hub genes in CAD were validated using the GSE113079 dataset. CIBERSORT program was used to quantify the proportion of immune cell infiltration. Western blot assay and qRT‐PCR were used to detect the expression of hub genes in ox-LDL-treated HUVECs to validate the bioinformatics results. Knockdown interference sequences for MCEMP1 were synthesized, and cell proliferation and apoptosis were examined using a CCK8 kit and Muse® Cell Analyzer, respectively. The concentrations of IL-1β, IL-6, and TNF-α were measured with respective enzyme-linked immunosorbent assay (ELISA) kits.
Results
A total of 73 DEGs (four down-regulated genes and 69 up-regulated genes) were identified in the metadata (GSE24519 and GSE61145) cohort. GO and Kyoto Encyclopedia of Genes and Genomes (KEGG) analysis results indicated that these DEGs might be associated with the regulation of platelet aggregation, defense response or response to bacterium, NF-kappa B signaling pathway, and lipid and atherosclerosis. Using SVM-RFE and LASSO, seven hub genes were obtained from the metadata. The upregulated expression of DIRC2 and MCEMP1 in CAD was confirmed in the GSE113079 dataset and in ox-LDL-treated HUVECs. The associations between the two hub genes (DIRC2 and MCEMP1) and the 22 types of immune cell infiltrates in CAD were found. MCEMP1 knockdown accelerated cell proliferation and suppressed cell apoptosis for ox-LDL-treated HUVECs. Additionally, MCEMP1 knockdown appeared to decrease the expression of inflammatory factors IL-1β, IL-6, and TNF-α.
Conclusions
The results of this study indicate that MCEMP1 may play an important role in CAD pathophysiology.
Introduction
Coronary artery disease (CAD) is characterized by the accumulation of atherosclerotic plaque, formed by lipid and immune cells, in the coronary arteries (Medina-Leyte et al., 2021). The Global Burden of Disease study estimated that the global prevalence of CAD, at 154 million, accounted for 32.7% of the total global burden of cardiovascular disease in 2016 (GBD 2016 Disease and Injury Incidence and Prevalence Collaborators, 2017). According to China’s cardiovascular diseases report in 2018, there were approximately 290 million patients with cardiovascular disease in the country (Ma et al., 2020). Epidemiological studies have shown that older age, male sex, hypertension, diabetes, obesity, hyperlipidemia, smoking, and a sedentary lifestyle all increase the risk of CAD (Malakar et al., 2019). CAD is a complex disease influenced by the interactions between genetic and environmental factors. Previous studies have identified several CAD-related genes, such as CKDN2A, CDNK2B, GUCY1A3, and NOS3 (Ehret et al., 2016; Harismendy et al., 2011). Additionally, several CAD risk-related gene expression patterns have been identified using RNAseq technique (Wang et al., 2021; Kalayinia et al., 2018). Microarray analysis is a widely used research method for screening novel biomarkers for diagnosis, predicting disease severity, and identifying new drug targets (Behzadi & Ranjbar, 2019). For instance, one study found that BTRC, FBXL4, and ASB1 genes were downregulated in CAD, while UBE2D2 was upregulated (Chen et al., 2021).
The Gene Expression Omnibus (GEO) database is a publicly available website supported by National Center for Biotechnology information (NCBI), which is utilized for identifying key genes and underlying mechanisms in disease onset and progression (Barrett et al., 2013). With the continuous development and widespread application of bioinformatics, many algorithms, such as those based on machine learning algorithms, have been widely applied in cancer research (Zhao et al., 2022; Donovan et al., 2018; Li et al., 2020). Studies have also demonstrated that machine-learning algorithms are highly effective for risk prediction and for screening potential CAD biomarkers (Balashanmugam et al., 2019; Qi et al., 2020).
Many inflammatory biomarkers, primarily cytokines, acute phase proteins, and cell surface receptors of dividing cells, have been identified as being associated with CAD in some way (Kott et al., 2020). The extent of inflammatory cell infiltration into the adventitia has also been found to be related to the severity of atherosclerotic plaques (Milutinović, Šuput & Zorc-Pleskovič, 2020). Furthermore, immune checkpoint suppression therapy has been associated with an increased proportion of inflammatory CD3 T cells and CD68 macrophages in coronary atherosclerotic plaques (Newman & Stone, 2019). These cumulative findings indicate that immune cell infiltration plays a crucial role in the development and progression of CAD.
In this study, a differentially expressed gene (DEG) analysis was conducted between healthy samples and CAD samples from the GEO database. Potential hub genes for CAD were identified using machine learning algorithms. Additionally, the relationship between immune cell infiltration and the identified hub genes of CAD was characterized. The expression levels of these hub genes were validated in oxidized low-density lipoprotein (ox-LDL) treatment human umbilical vein endothelial cells (HUVECs), and the cell function of MCEMP1 in ox-LDL-treated HUVECs was also investigated.
Methods
Screening and enrichment analysis of differentially expressed genes (DEGs)
The GEO DataSets database stores curated gene expression DataSets, as well as original Series and Platform records in the GEO repository (https://www.ncbi.nlm.nih.gov/gds/?term=). CAD-related gene expression data (GSE24519, GSE61145, and GSE113079) was obtained from the GEO DataSets database. The GSE24519 and GSE61145 datasets, used as the metadata datasets, included 67 CAD patient samples and 21 normal control samples, and the GSE113079 dataset, used as a validation dataset, included 93 CAD patient samples and 48 normal control samples. All samples from these databases were derived from human peripheral blood.
The R “SVA” package (https://rdrr.io/bioc/sva/src/R/sva-package.R) was used for background correction and standardization of the metadata. DEGs between CAD samples and normal samples were identified using the R “limma” package (https://bioconductor.org/packages/release/bioc/html/limma.html) with a significance threshold of p < 0.05 and |log2 FC| > 1. Volcano and heat maps were generated using the online SangerBox software (http://sangerbox.com/). Gene ontology (GO) and pathway analyses were conducted to identify the biological functions of DEGs, performed using the R “clusterProfiler” package (https://guangchuangyu.github.io/software/clusterProfiler/) and Metascape database (http://metascape.org).
Selection and verification of hub genes
Two machine learning algorithms—support vector machine-recursive feature elimination (SVM-RFE) and least absolute shrinkage and selection operator (LASSO)—were applied to search for CAD-related gene signatures in the metadata cohort. The SVM-RFE algorithm (https://github.com/johncolby/SVM-RFE) was implemented using the R “mlbench” and “caret” packages, while the LASSO model (https://glmnet.stanford.edu/) was executed by the R “glmnet,” “survival,” and “survminer” packages. A Venn diagram was plotted using the R “VennDiagram” package to display the intersection of hub genes filtered by both the SVM-RFE and LASSO algorithms.
The GSE113079 dataset was employed to validate the expression of overlapping gene signatures between CAD patients and the control group.
Association between CAD-related candidate gene signatures and immune-related features
The CIBERSORT program (https://cibersortx.stanford.edu/) was utilized to quantify the proportion of immune cell infiltration (22 different cell types) in CAD gene expression profiles using the R “ggplot2,” “corrplot,” and “forcats” packages. A gene set enrichment analysis (GSEA, https://www.broadinstitute.org/gsea/) was conducted to explore the underlying functional mechanisms of the hub genes using the R “ggplot2,” “clusterProfiler,” “enrichplot,” and “ggridges” packages.
HUVEC culture and treatment
Human umbilical vein endothelial cells (HUVECs) were purchased from iCell Bioscience (iCell-h110; iCell Bioscience, Shanghai, China). These HUAECs were cultured within an endothelial cell growth medium (PriMed-iCell-002, Shanghai, China) supplemented with 5% (v/v) FBS, 1% endothelial cell growth supplement (ECGS), and 1% penicillin streptomycin at 37 °C in 5% CO2. HUVECs within passages 3–7 were applied for the experiments. Then, human ox-LDL (Yiyuan Biotechnologies, Guangzhou, China) at concentrations of 50 and 100 μg/mL were added into the cell cultures according to the experimental requirements (Kang et al., 2021; Di et al., 2021).
Knockdown interference sequences for MCEMP1 were provided by GenePharma (Shanghai, China). The optimal working concentration of these interference sequences was selected experimentally prior to the formal experiments. Theinterference sequence information for MCEMP1 is as follows: siMCEMP1#1, sense 5′-GACCCAGACUAUGAGAAUATT-3′, anti-sense 5′- UAUUCUCAUAGUCUGGGUCTT-3′, siMCEMP1#2, sense 5′-CAGCCUUCAUCAUGGUGAATT-3′, anti-sense 5′-UUCACCAUGAUGAAGGCUGTT-3′, siMCEMP1#3, sense 5′-GAGCAAGAUUGAUAGAUUATT-3′, anti-sense 5′-UAAUCUAUCAAUCUUGCUCTT′.
Cell proliferation and apoptosis assay
After a 24-h treatment with ox-LDL, 2 × 10³ cells (100 μL) were inoculated within each well of the 96-well culture plate. About 3–4 h later, when cells had adhered to the wall, 100 μL of RPMI 1,640 complete medium and 10 μL of CCK-8 were added. Then, the cells were cultured in 5% CO2 at 37 °C for 2 h. The OD450 values were determined with a microplate reader (Infinite M200, Tecan, Salzburg, Austria) at the wavelength of 450 nm.
The Muse® Cell Analyzer (Milipore, Burlington, MA, USA) was used to assess the effects of MCEMP1 on apoptosis in ox-LDL treated HUVECs. The cells were suspended in 100 μL of 1% BSA, and an equal volume of apoptosis working fluid was added. Apoptosis was detected after 20 min of gentle resistance. HUVECs were harvested after the indicated treatments, re-suspended at a concentration of 106/mL, and stained with a Muse Annexin V & Dead Cell Kit in darkness. The Muse® Cell analyzer (CogtoFLEX, BECKMAN) was used to quantify the percentage of apoptotic cells. The apoptotic rate was defined as the percentage of “UR+LR” cells.
Lactate dehydrogenase (LDH) and nitric oxide (NO) assay
HUVECs were cultured in 96-well plates at a density of 1 × 10⁴ cells/mL, and pretreated with ox-LDL (100 μg/mL) for 48 h. The supernatants from ox-LDL treated HUVEC were collected by centrifugation at 5,000 g for 10 min. Then, the LDH content and NO content in the media was assessed using an LDH activity kit (BC0685; Solarbio, Beijing, China) and a NO assay kit (AKNM005C; Boxbio, Beijing, China), respectively.
Quantitative real-time polymerase chain reaction (qRT-PCR)
Total RNA was extracted from the HUVECs using TRIzol reagent (Accurate Biology, Changsha, China). The RNA was reverse-transcribed into cDNA using a PrimeScript RT Reagent Kit (TakaRa Biotechnology, Dalian, China). Real-time PCR was performed using SYBR green fluorescence (TakaRa) for the relative quantification of mRNA expression. Quantification was achieved using the 2−ΔΔCt method, with GAPDH used to normalize mRNA levels. The following primers were used in this study: DIRC2 forward primer: 5′-GTCCATAGTTGGAGGCTGTGTTG-3′ and reverse primer: 5′-ACGTGGATGACAGTGTAGCTCC-3′; MCEMP1 forward primer: 5′-CTGAGATGTCCAAGGAGCTGCT-3′ and reverse primer: 5′-TGGTGATGCTCTGCTGAACGGA-3′; GAPDH forward primer: 5′-GGAGCGAGATCCCTCCAAAAT-3′ and reverse primer: 5′-GGCTGTTGTCATACTTCTCATGG-3′.
Western blotting
Proteins were extracted from HUVECs using RIPA lysis buffer (Solarbio, Beijing, China) for 20 min, followed by centrifugation at 12,000 rpm for 15 min at 4 °C to collect the proteins. Protein concentrations were measured by a BCA protein assay kit (Beyotime, Shanghai, China). Equal amounts of proteins (60 μg) and a pre-stained protein ladder (YESEN, Shanghai, China) were separated by 10% SDS-PAGE gel, electro-transferred to nitrocellulose membranes, and incubated with primary antibodies overnight at 4 °C. The anti-DIRC2 antibody (1:1,000, 26750-1-AP; Proteintech), anti-MCEMP1 antibody (1:3,000, 25700-1-AP, proteintech), anti-ICAM1 antibody (1:500, 200350-F12; ZEN BIO), and anti-GAPDH antibody (1:2,000, 60004-1-Ig; Proteintech) were used in this study. The membranes were incubated with secondary antibodies for 1.5 h at room temperature. Bands with antigen-antibody complexes were visualized using Immobilon ECL substrate (YESEN, Shanghai, China), and the blots were imaged with an E-BLOT luminescent image analyzer (e-BLOT, Shanghai, China).
Enzyme-linked immunosorbent assay (ELISA)
HUVECs were cultured in 96-well plates at a density of 1 × 10⁴ cells/mL and pretreated with ox-LDL (100 μg/mL) for 48 h. The cultured HUVEC supernatants were collected by centrifugation at 5,000 g for 10 min. The levels of IL-1β, IL-6, and TNF-α were detected using respective ELISA kits (Jianglai Biotechnology, Shanghai, China).
Results
Screening and enrichment analyses of DEGs in CAD
In our study, a comprehensive analysis was conducted to identify DEGs in CAD. A total of 73 DEGs (four down-regulated genes and 69 up-regulated genes, Table S1) were discovered between 67 CAD patient samples and 21 normal control samples from the metadata cohorts (GSE24519 and GSE61145) cohort. Volcano (Fig. 1A) and heatmap (Fig. 1B) plots depicted these DEGs.
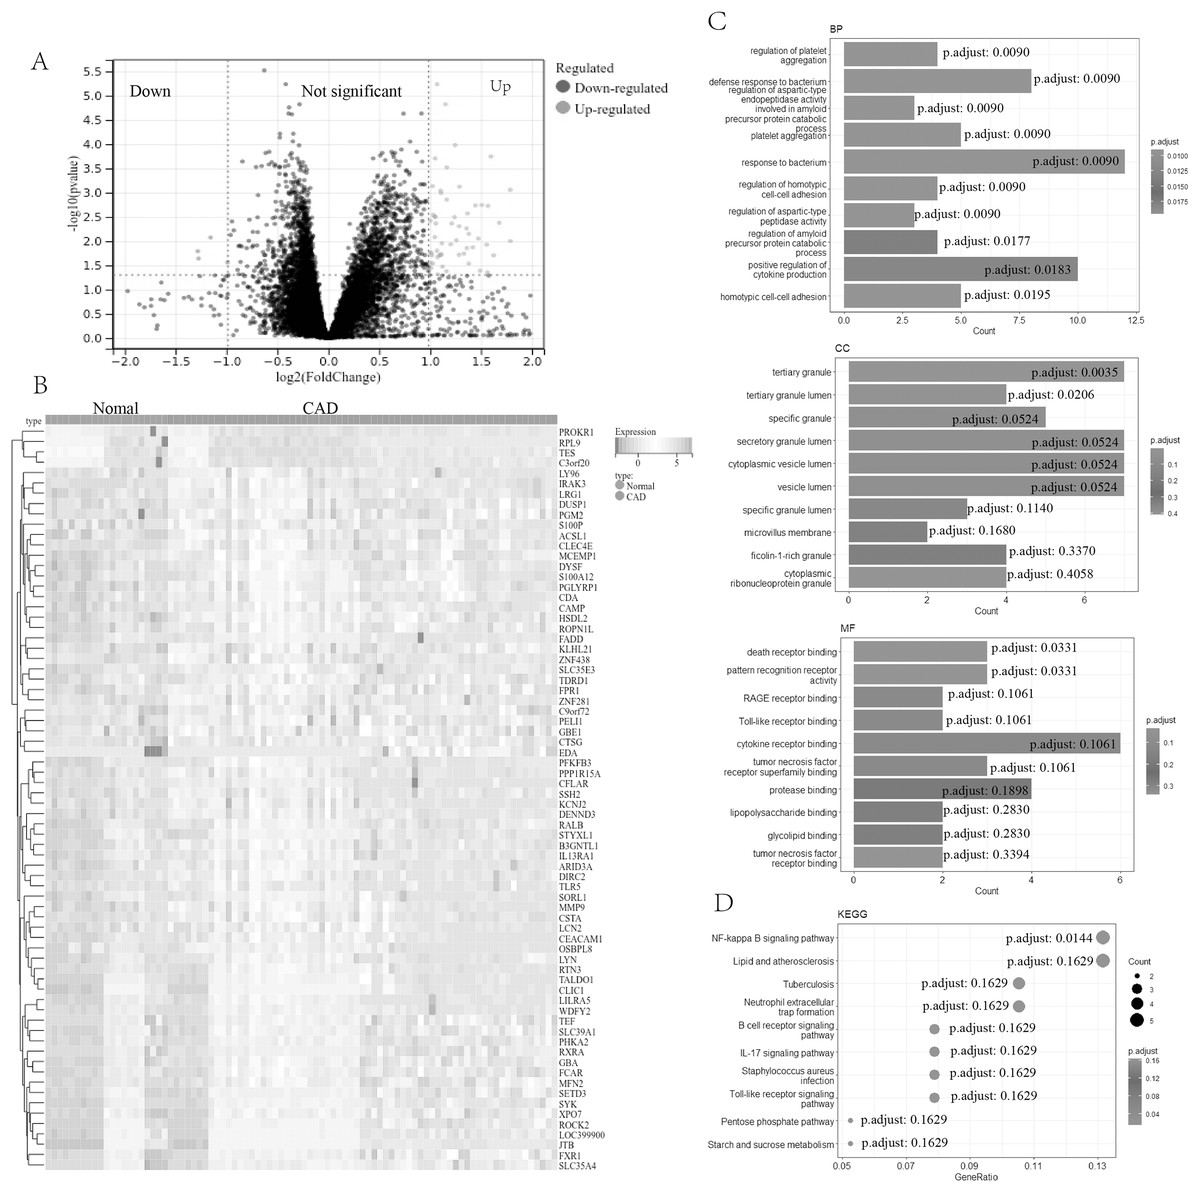
Figure 1: Screening and enrichment analyses of DEGs in CAD.
(A) Volcano plot of DEGs in CAD. The x-axis represents log2FC, and the y-axis represents -log10 (p-value). Green dots represent downregulated genes, and red dots represent upregulated genes. (B) Heatmap of DEGs. The x-axis represents the samples, and the y-axis represents DEGs. Red indicates upregulated, and blue represents downregulated. The darker the color, the higher the expression level. (C) Bar chart for GO enrichment analysis, including biological process, cellular component, and molecular function (top 10, respectively). (D) Bubble diagram for KEGG enrichment of DEGs (top 10). DEGs, differentially expressed genes; CAD, coronary artery disease; GO, gene ontology; KEGG, Kyoto Encyclopedia of Genes and Genomes.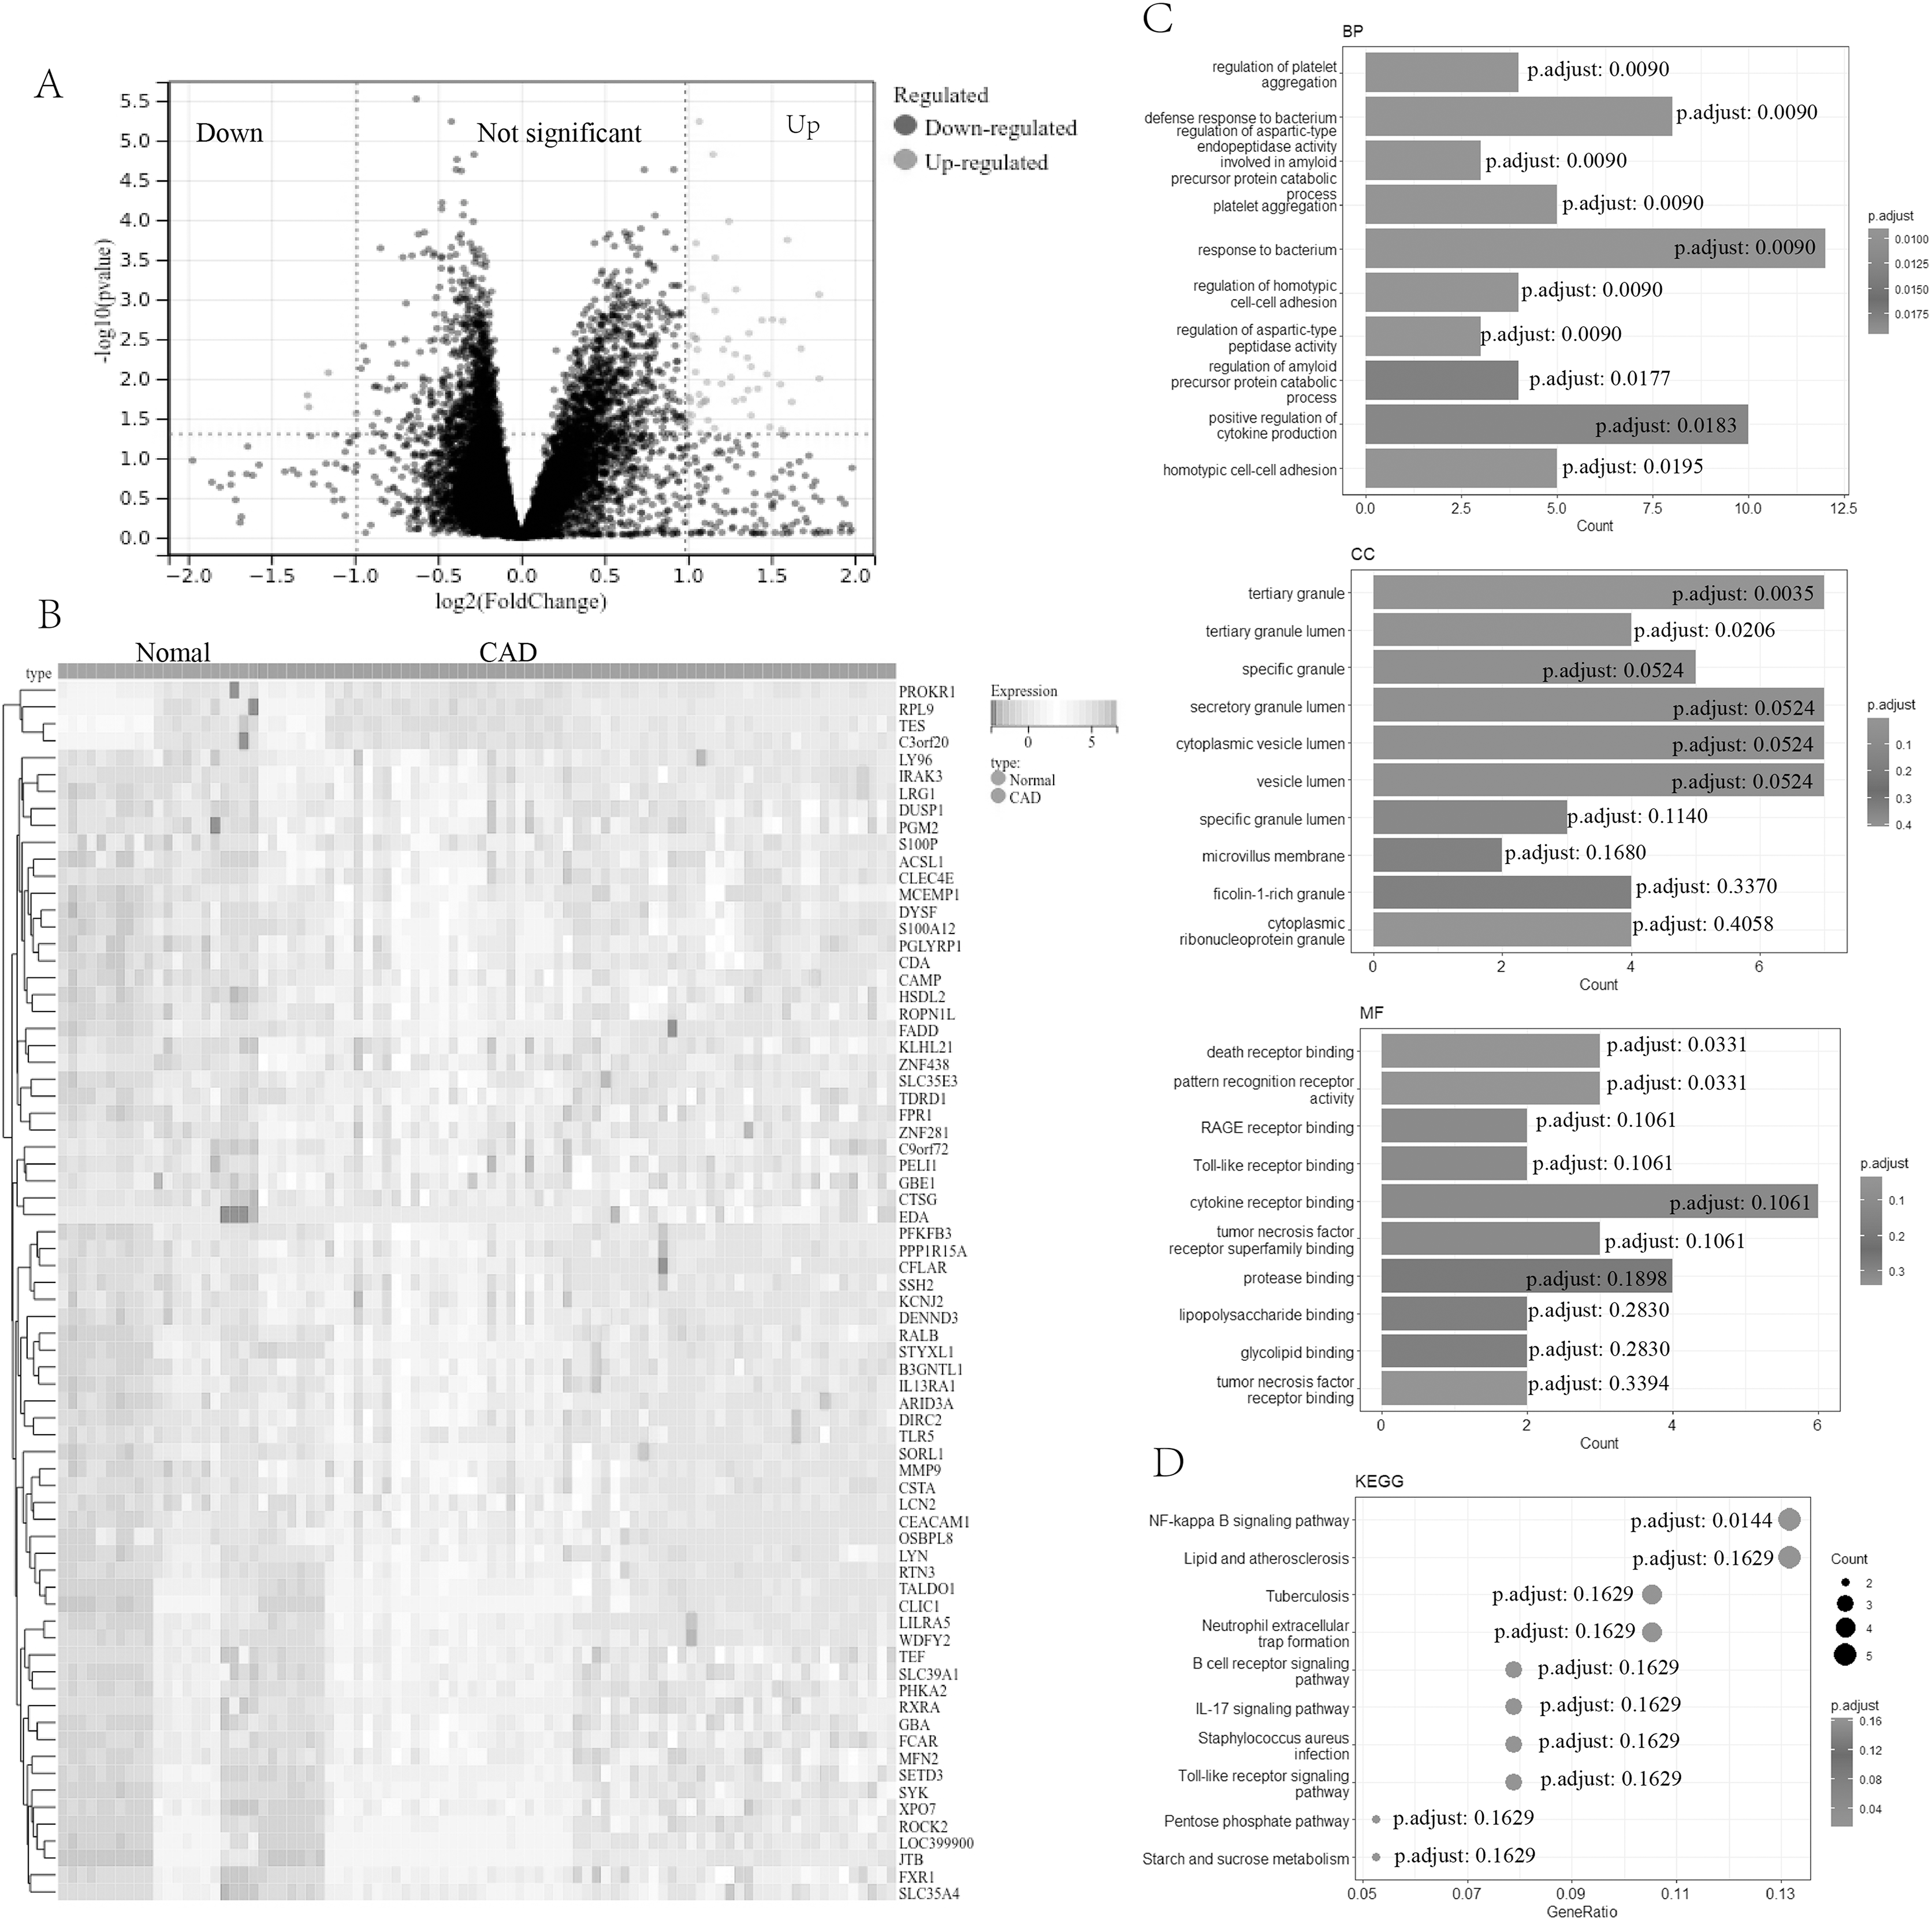
Further functional characterization of these DEGs was performed using GO and Kyoto Encyclopedia of Genes and Genomes (KEGG) pathway analyses. The GO analysis (Fig. 1C) results indicated potential associations of DEGs with a range of biological processes, including the regulation of platelet aggregation, defense response or response to bacterium, regulation of aspartic-type endopeptidase activity involved in the amyloid precursor protein catabolic process, regulation of homotypic cell-cell adhesion, and positive regulation of cytokine production. Additionally, the KEGG pathway analysis (Fig. 1D) revealed significant involvement of DEGs in pathways such as the NF-kappa B signaling pathway, lipid and atherosclerosis, the B cell receptor signaling pathway, the IL-17 signaling pathway, among others.
Selection and verification of hub genes
To identify key genes that might serve as potential biomarkers or therapeutic targets, SVM-RFE and LASSO logistic regression algorithms were employed. The SVM-RFE algorithm identified 18 gene signatures in the determined DEGs (Fig. 2A), while the LASSO logistic regression algorithm recognized 16 gene signatures (Fig. 2B). Through intersection analysis, seven overlapping hub genes (HSDL2, PGLYRP1, CAMP, MCEMP1, IRAK3, DIRC2, and PFKFB3) were finally selected in the metadata cohort (Fig. 2C).

Figure 2: Selection and verification of diagnostic hub genes.
(A) Accuracy of candidate gene selection in the SVM-RFE algorithm. (B) Coefficient profiles of candidate genes in the LASSO model. (C) Venn diagram showing the overlap of characteristic genes of the two algorithms. (D) Bar chart for validation of the expression of candidate diagnostic markers in the GSE113079 dataset. Red represents the case group and blue represents the control group. *p < 0.05; ***p < 0.001; NS, not significant. SVM-RFE, support vector machine-recursive feature elimination; LASSO, least absolute shrinkage and selection operator.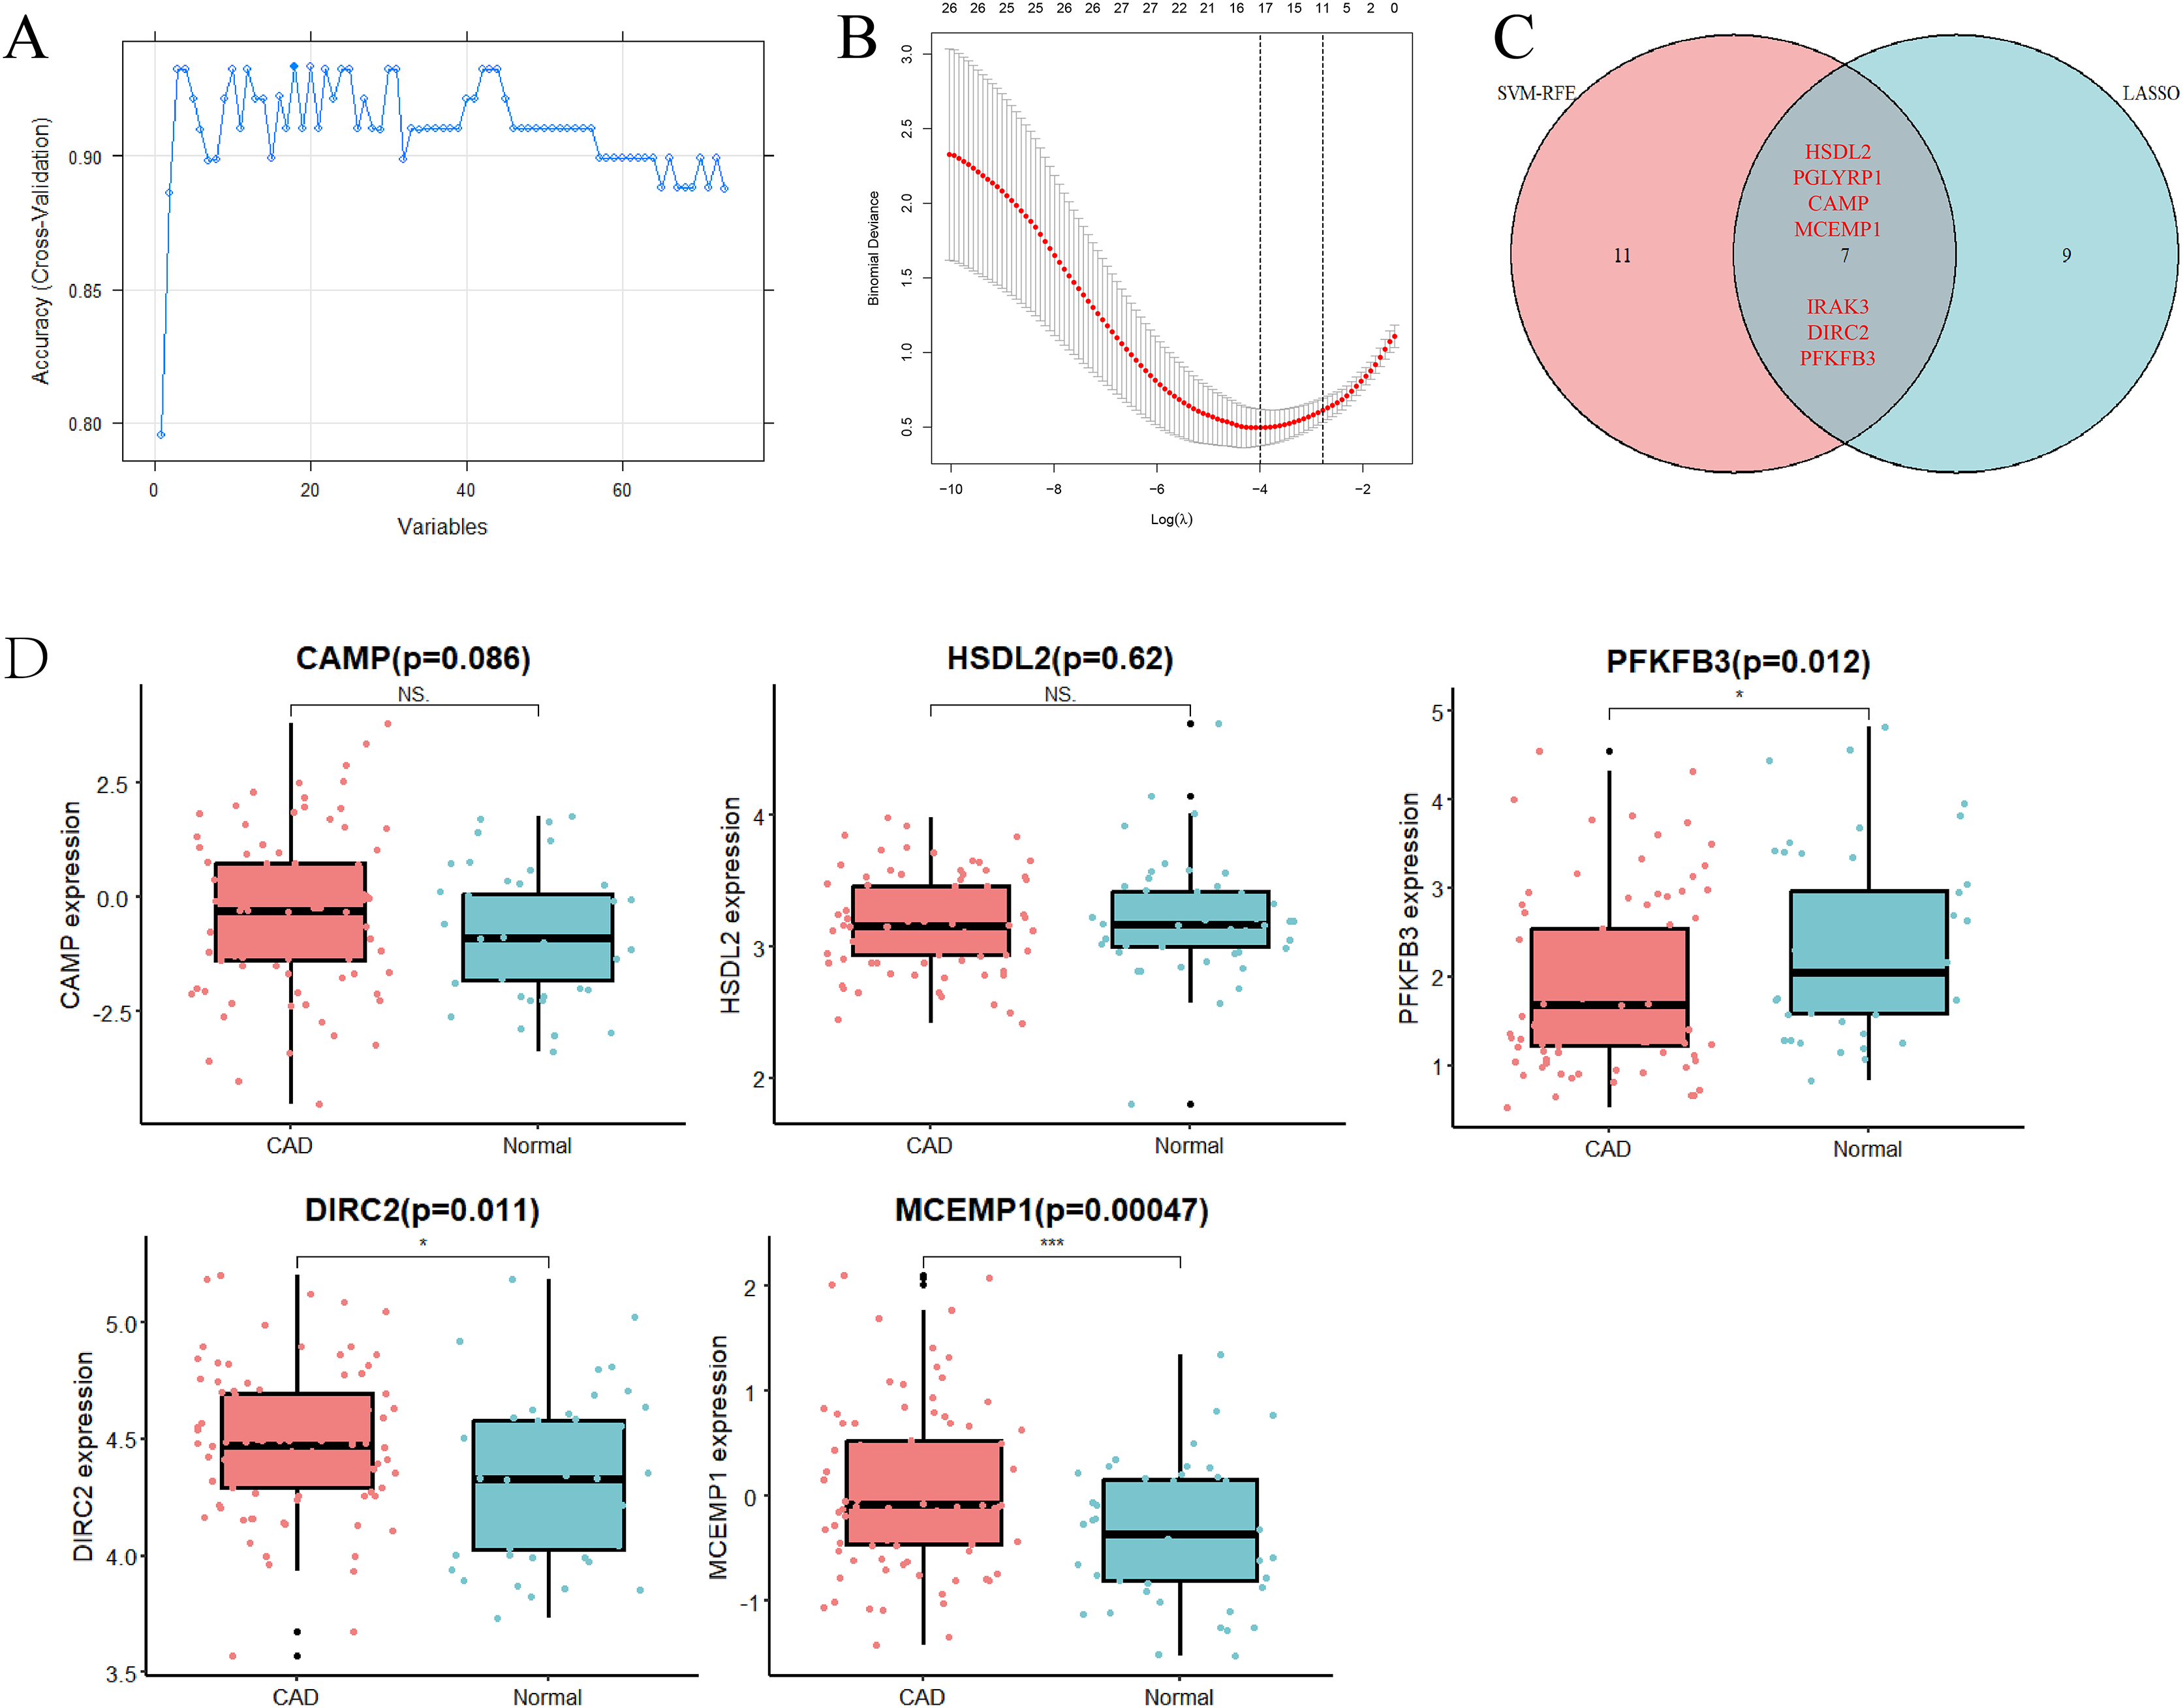
The GSE113079 dataset (93 CAD patient samples and 48 normal samples) was used to validate the accuracy of the approach and the expression levels of the seven hub genes (Fig. 2D). Notably, the expression levels of PGLYRP1 and IRAK3 were not detected in the validation set. Furthermore, CAMP and HSDL2 expression levels did not show significant differences between CAD and normal samples. Interestingly, PFKFB3 expression was found to be down-regulated in CAD samples, contrasting with the metadata results. However, DIRC2 (p = 0.011) and MCEMP1 (p = 0.00047) were significantly up-regulated in CAD samples compared to control samples, aligning with the metadata. Therefore, DIRC2 and MCEMP1 were selected for further investigation in the follow-up studies.
Correlation of DIRC2 and MCEMP1 with immune cell infiltration and signal pathways
In our study, we investigated the correlation between the expression levels of two key genes, DIRC2 and MCEMP1, and the infiltration of immune cells in CAD tissues. The proportions of 22 different types of immune cell infiltrates were calculated and compared between CAD and normal tissue (Fig. S1A). Our findings revealed that the degree of infiltration of regulatory T cells (Tregs, p = 4.3e-4), resting dendritic cells (p = 8.4e-4), and resting mast cells (p = 0.03) in CAD tissues was lower than in normal tissues. Conversely, CAD samples displayed a higher infiltration of activated mast cells (p = 6.3e-3) and neutrophils (p = 1.2e-3). Additionally, the correlation among these infiltrating immune cells was calculated (Fig. S1B), showing that activated mast cells had a negative correlation with resting mast cells but a positively associated with neutrophils.
The relationships between the two hub genes (DIRC2 and MCEMP1) and the 22 types of immune cell infiltrates in CAD were further explored (Figs. 3A and 3B). DIRC2 was negatively associated with regulatory T cells (Tregs, p < 0.001), CD8 T cells (p = 0.001), resting dendritic cells (p = 0.015), and CD4 memory activated T cells (p = 0.033), but positively associated with activated NK cells (p = 0.028) and neutrophils (p = 0.001, Fig. 3A). Similarly, MCEMP1 was negatively associated with regulatory T cells (Tregs, p < 0.001), resting dendritic cells (p = 0.009), and CD4 memory activated T cells (p = 0.020), but positively associated with macrophages M0 (p = 0.048), CD4 naive T cells (p = 0.028), monocytes (p = 0.005), activated mast cells (p = 0.003), and neutrophils (p = 0.002, Fig. 3B).
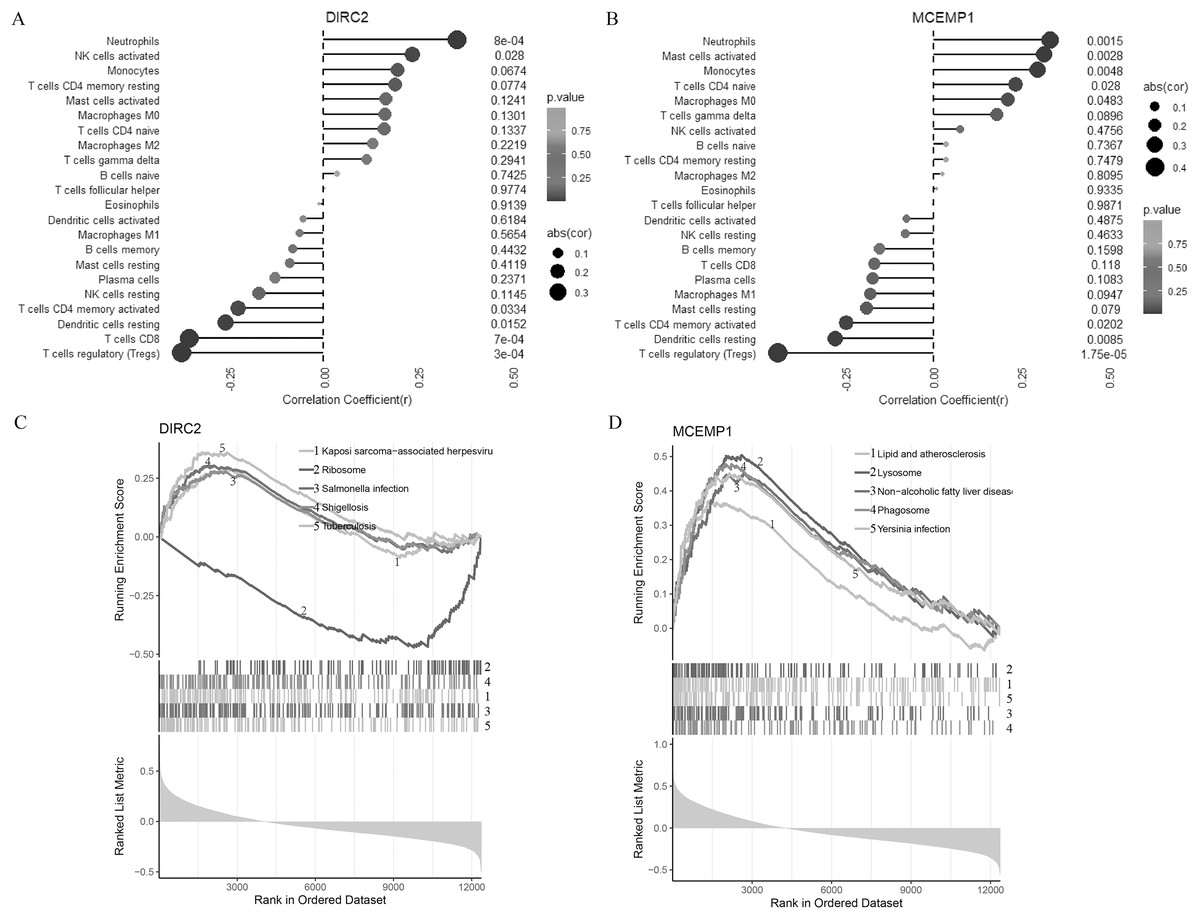
Figure 3: Correlation of two diagnostic markers with immune cell infiltration and signal pathway.
Lollipop chart for immune cell infiltration with DIRC2 (A) and MCEMP1 (B). Line graph GSEA analysis for the top five pathways of DIRC2 (C) and MCEMP1 (D).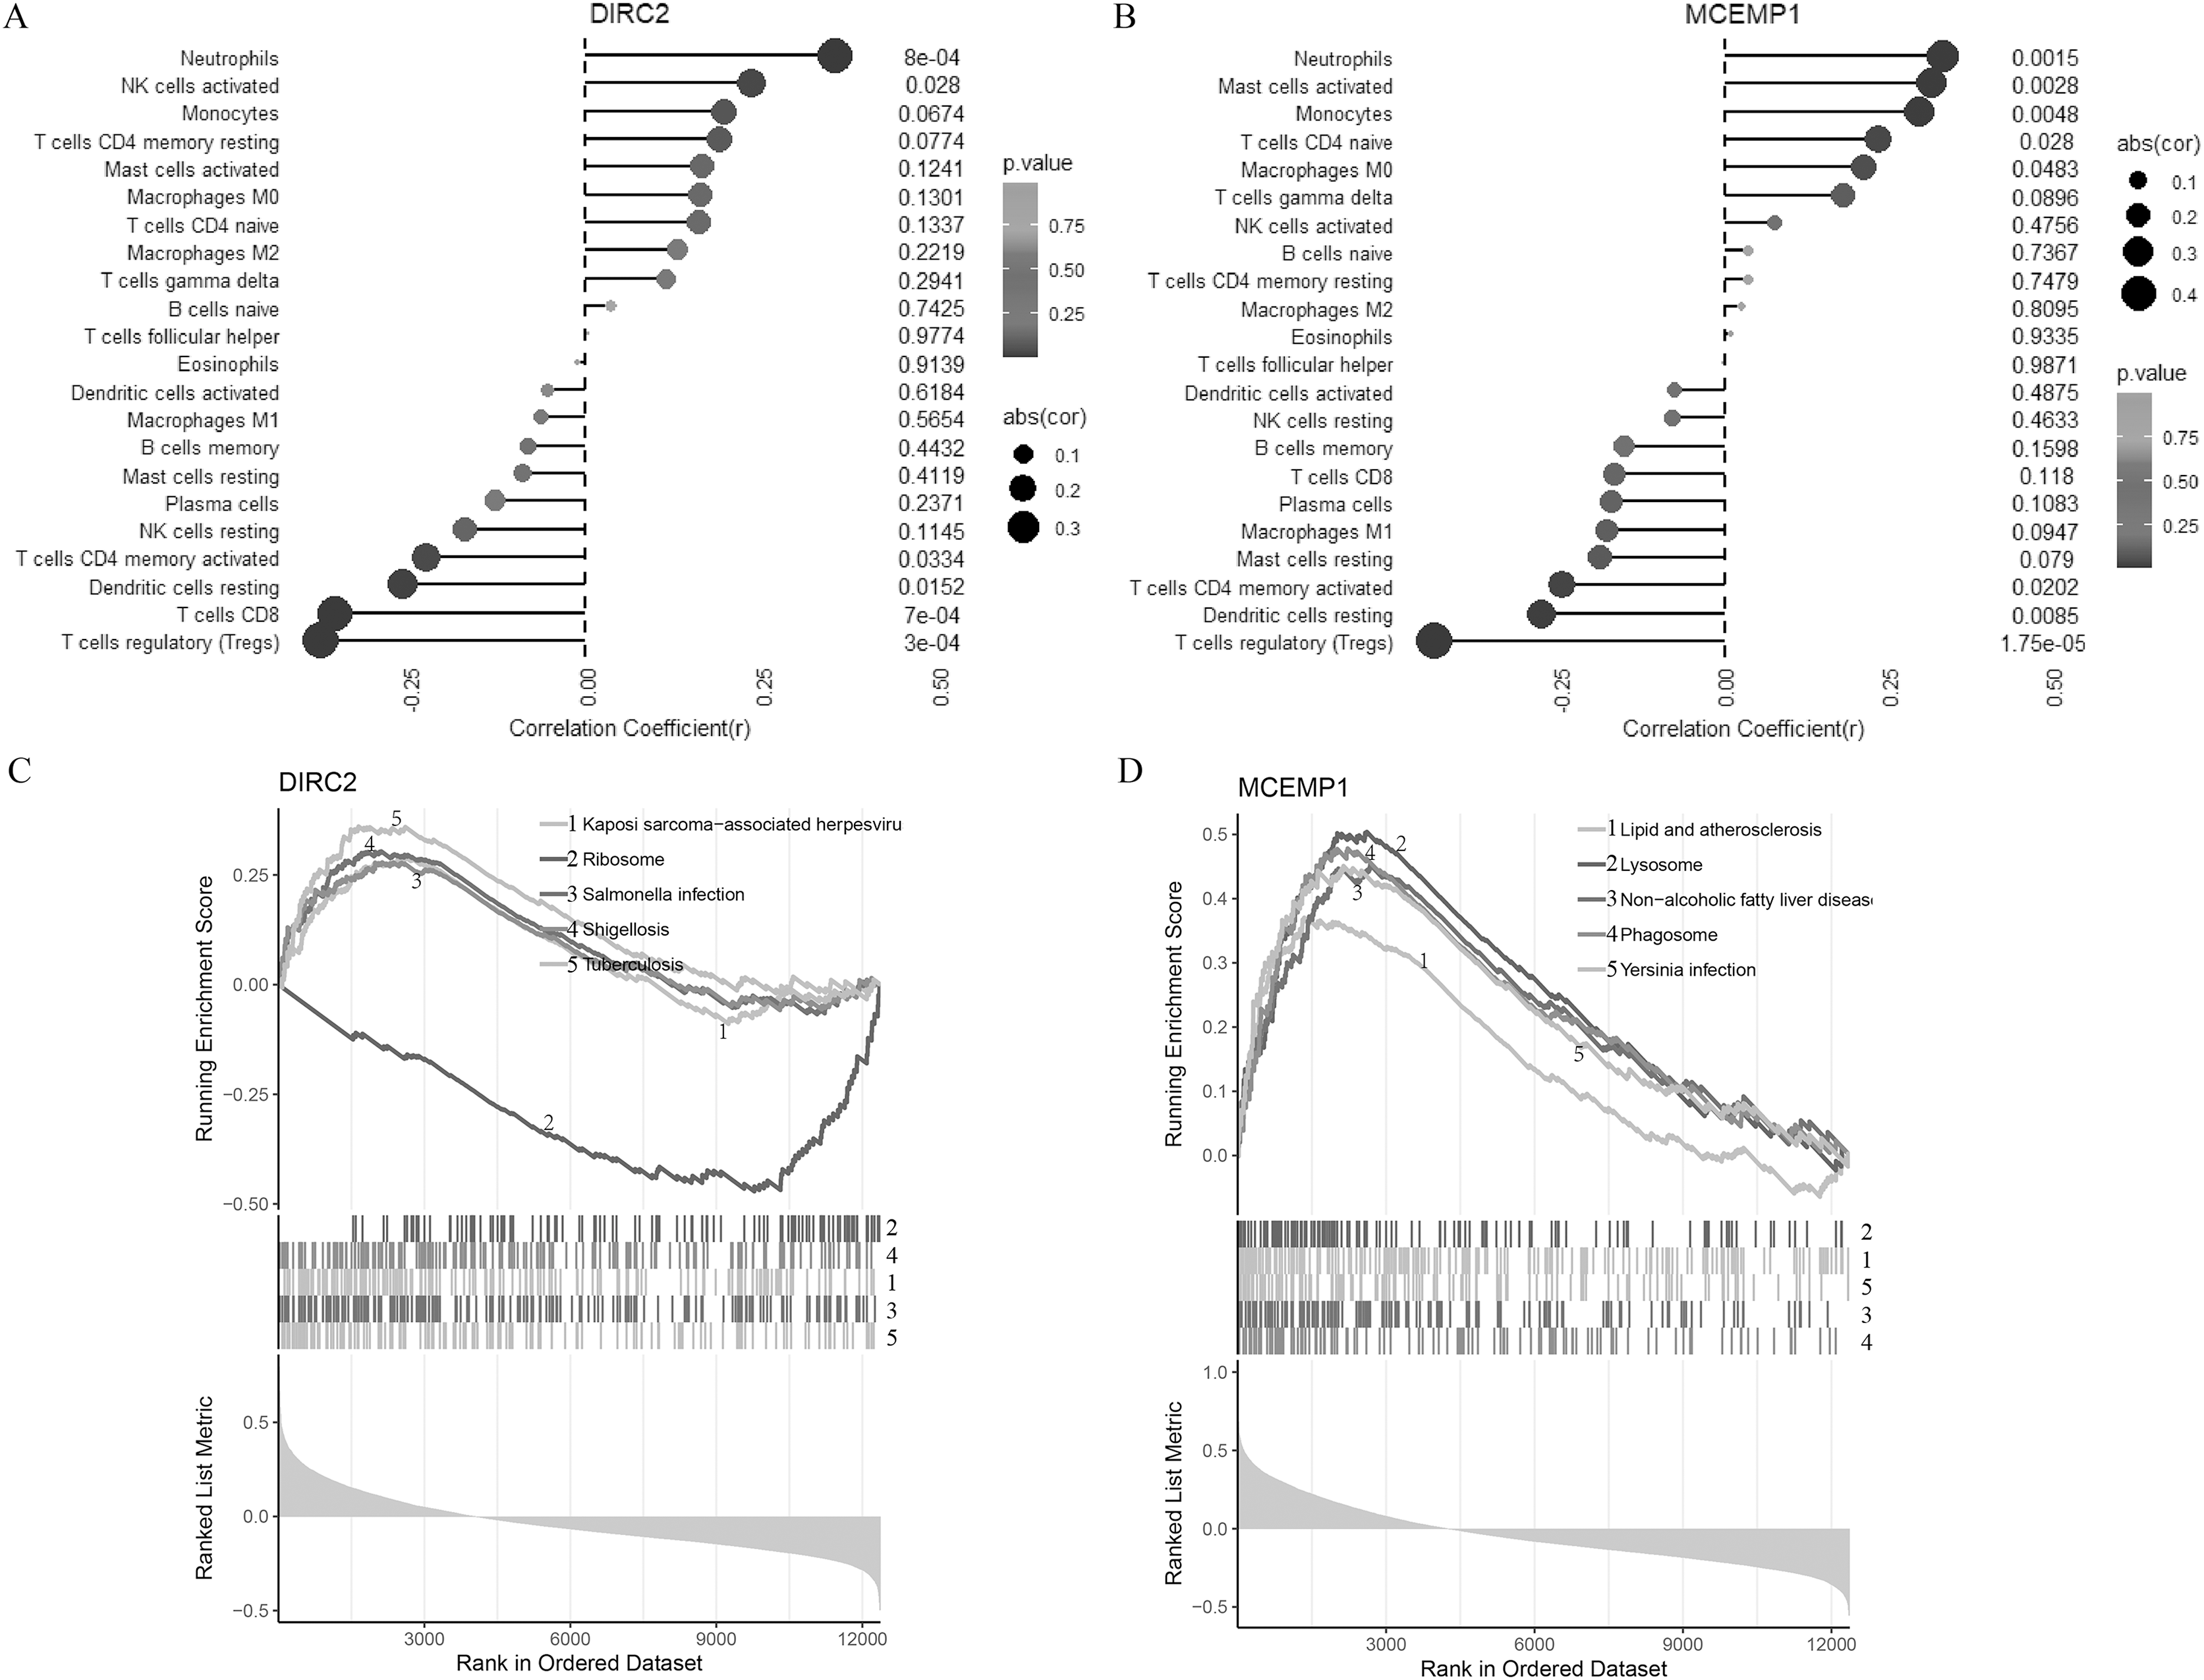
To further understand the potential roles of DIRC2 and MCEMP1 in the pathogenesis of CAD, GSEA was used to identify the related signal pathways (Figs. 3C and 3D). DIRC2 was positively linked to Kaposi sarcoma-associated herpesvirus, salmonella infection, shigellosis, and tuberculosis, and negatively linked to ribosomes (Fig. 3C). On the other hand, MCEMP1 was positively linked to lipid and atherosclerosis, lysosomes, non-alcoholic fatty liver disease, phagosomes, and Yersinia infection (Fig. 3D). These findings indicate that DIRC2 and MCEMP1 may play an important role in the pathogenesis of CAD, potentially through their involvement in these immune-related signaling pathways.
The expression of DIRC2 and MCEMP1 in ox-LDL-treated HUVECs
In ox-LDL-treated HUVECs, the HUVECs were exposed to ox-LDL (50 and 100 μg/mL) for 24 h. The impact on cell viability was assessed using a CCK-8 assay, which indicated that the cultured HUVECs displayed reduced cell viability after both 50 and 100 μg/mL ox-LDL treatment (Fig. 4A). Additionally, ox-LDL induced cellular injury in HUVECs, as evidenced by remarkably increased LDH and decreased NO in all tested concentrations (Figs. 4B and 4C). Moreover, the expression of ICAM1 was upregulated in response to both concentrations of ox-LDL (Fig. 4D).
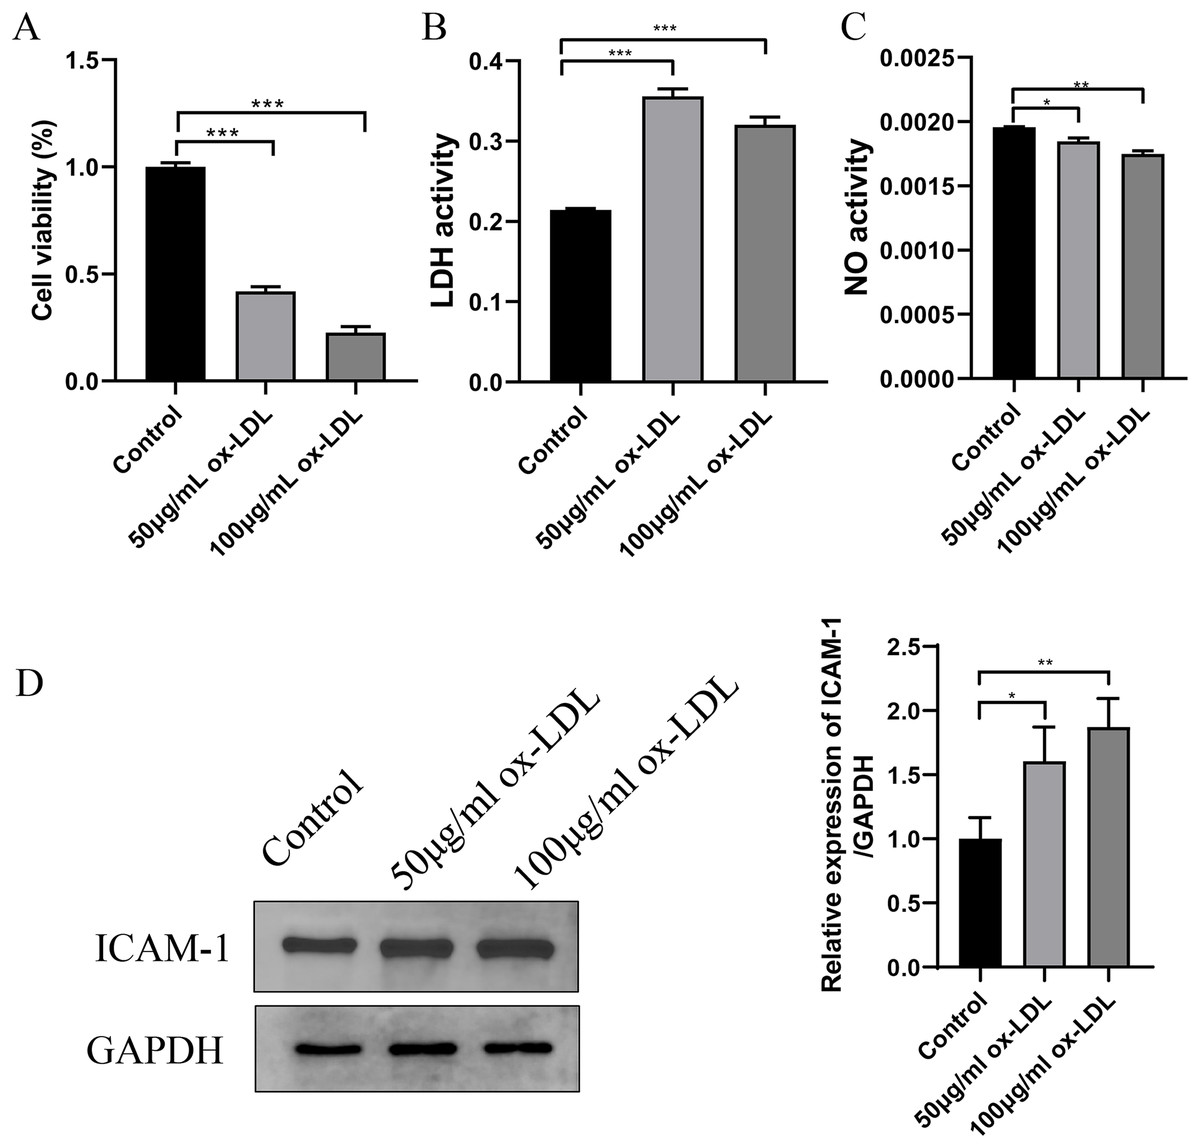
Figure 4: Establishment of ox-LDL-treated HUVECs.
(A) Cellular viability was detected by CKK-8 assay, which was normalized to the control group. (B and C) LDH and NO levels in ox-LDL-treated HUVECs were analyzed by chromometry using commercially available assay kits. (D) The expression of ICAM-1 was detected by western blot assay. *p < 0.05; **p < 0.01; ***p < 0.001.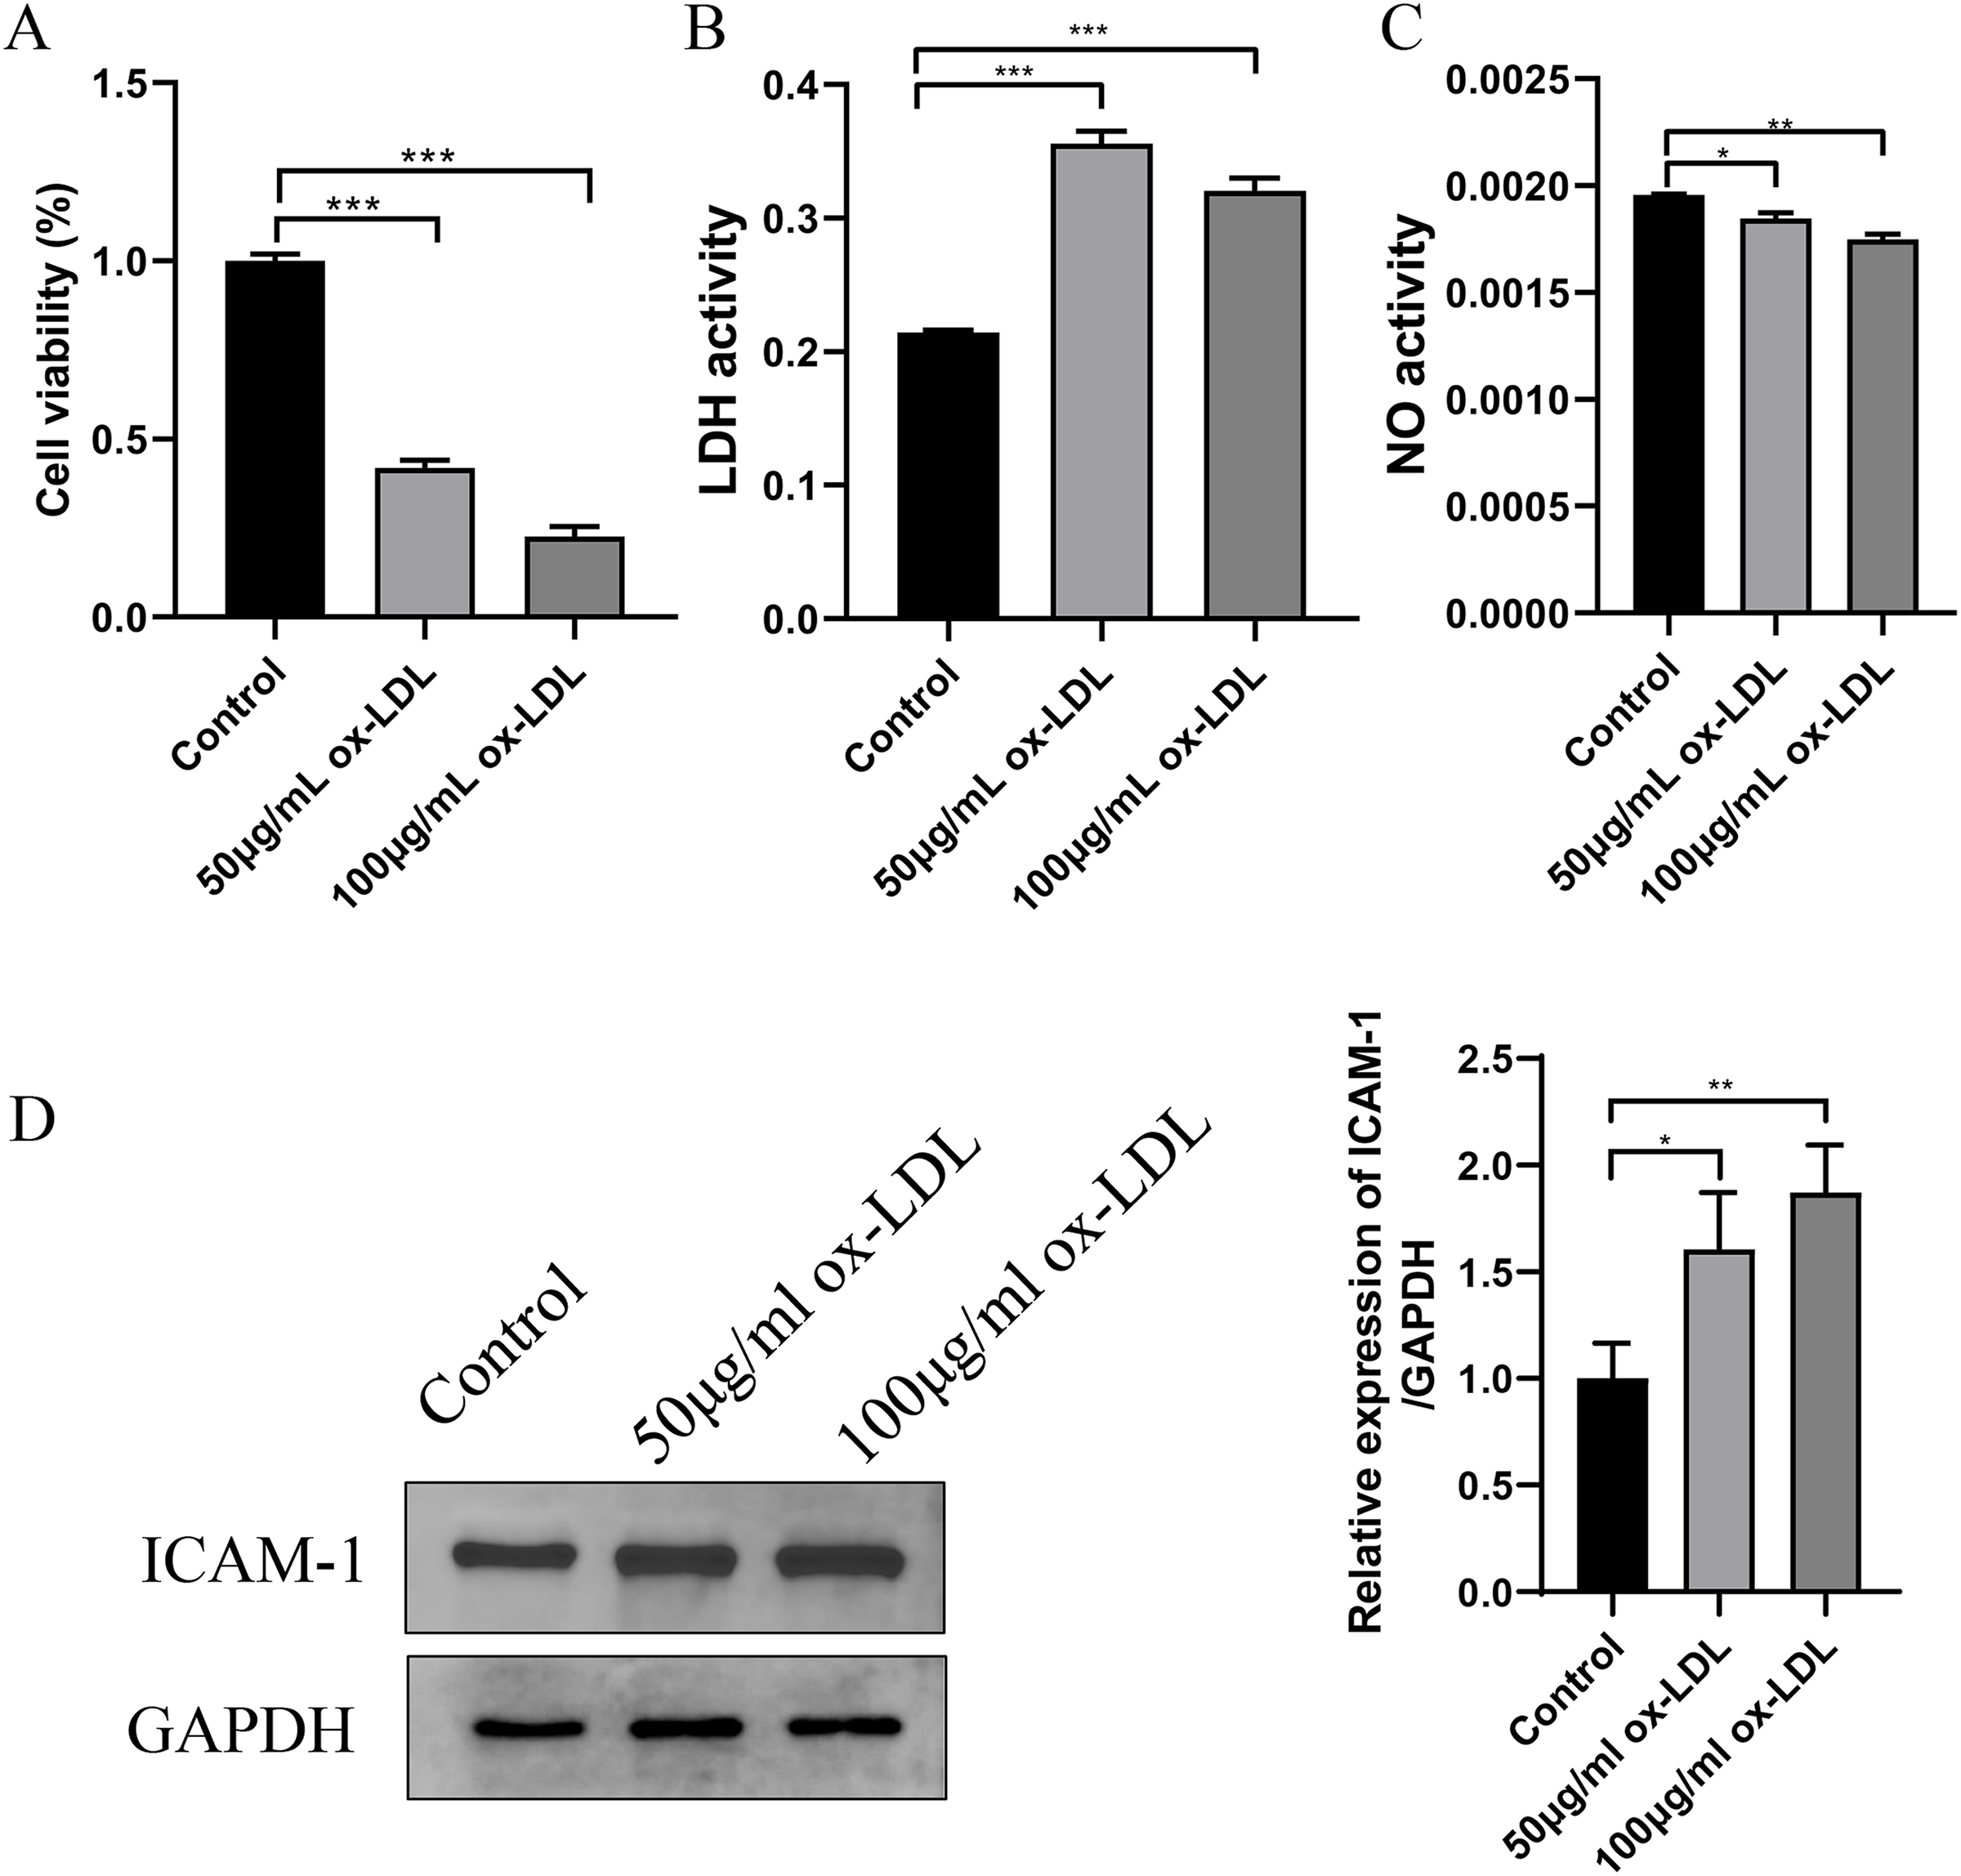
Western blot assay and qRT-PCR revealed that both the mRNA and protein levels of DIRC2 and MCEMP1 were upregulated in ox-LDL-treated HUVECs (Fig. 5), which was consistent with the results obtained from bioinformatics analysis. Based on these results, the MCEMP1 gene with a high expression level was selected for subsequent experiments.
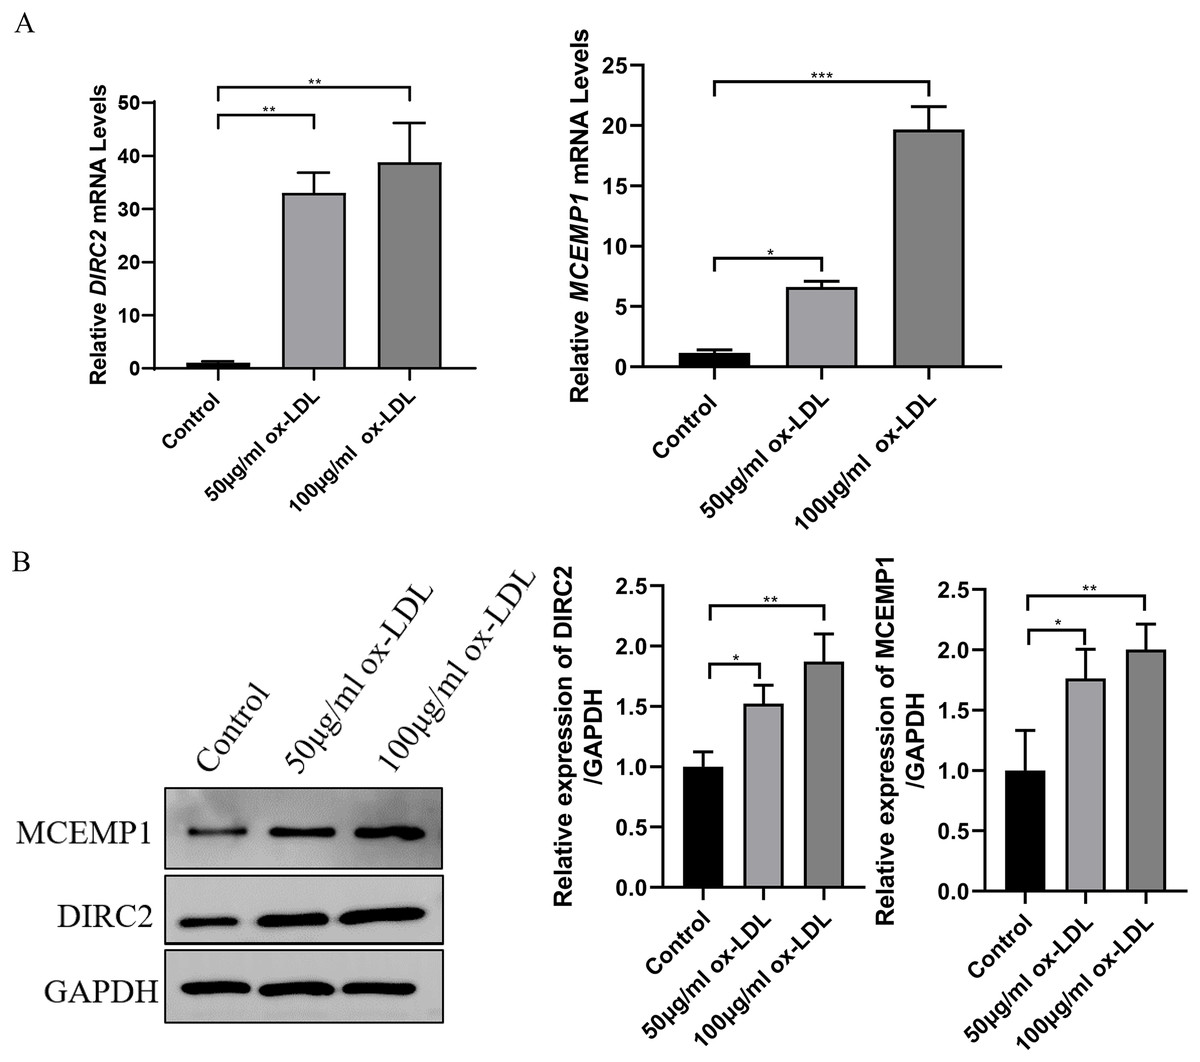
Figure 5: The expression of DIRC2 and MCEMP1 in ox-LDL-treated HUVECs.
(A) The mRNA and protein expression of DIRC2 and MCEMP1 in ox-LDL-treated HUVECs by qRT‐PCR assay and Western blot assay. *p < 0.05; **p < 0.01; ***p < 0.001. ox-LDL, oxidized low-density lipoprotein; HUVECs, human umbilical vein endothelial cells; qRT‐PCR, quantitative real‐time polymerase chain reaction.
Low expression of MCEMP1 promoted the dysfunction of ox-LDL-treated HUVECs
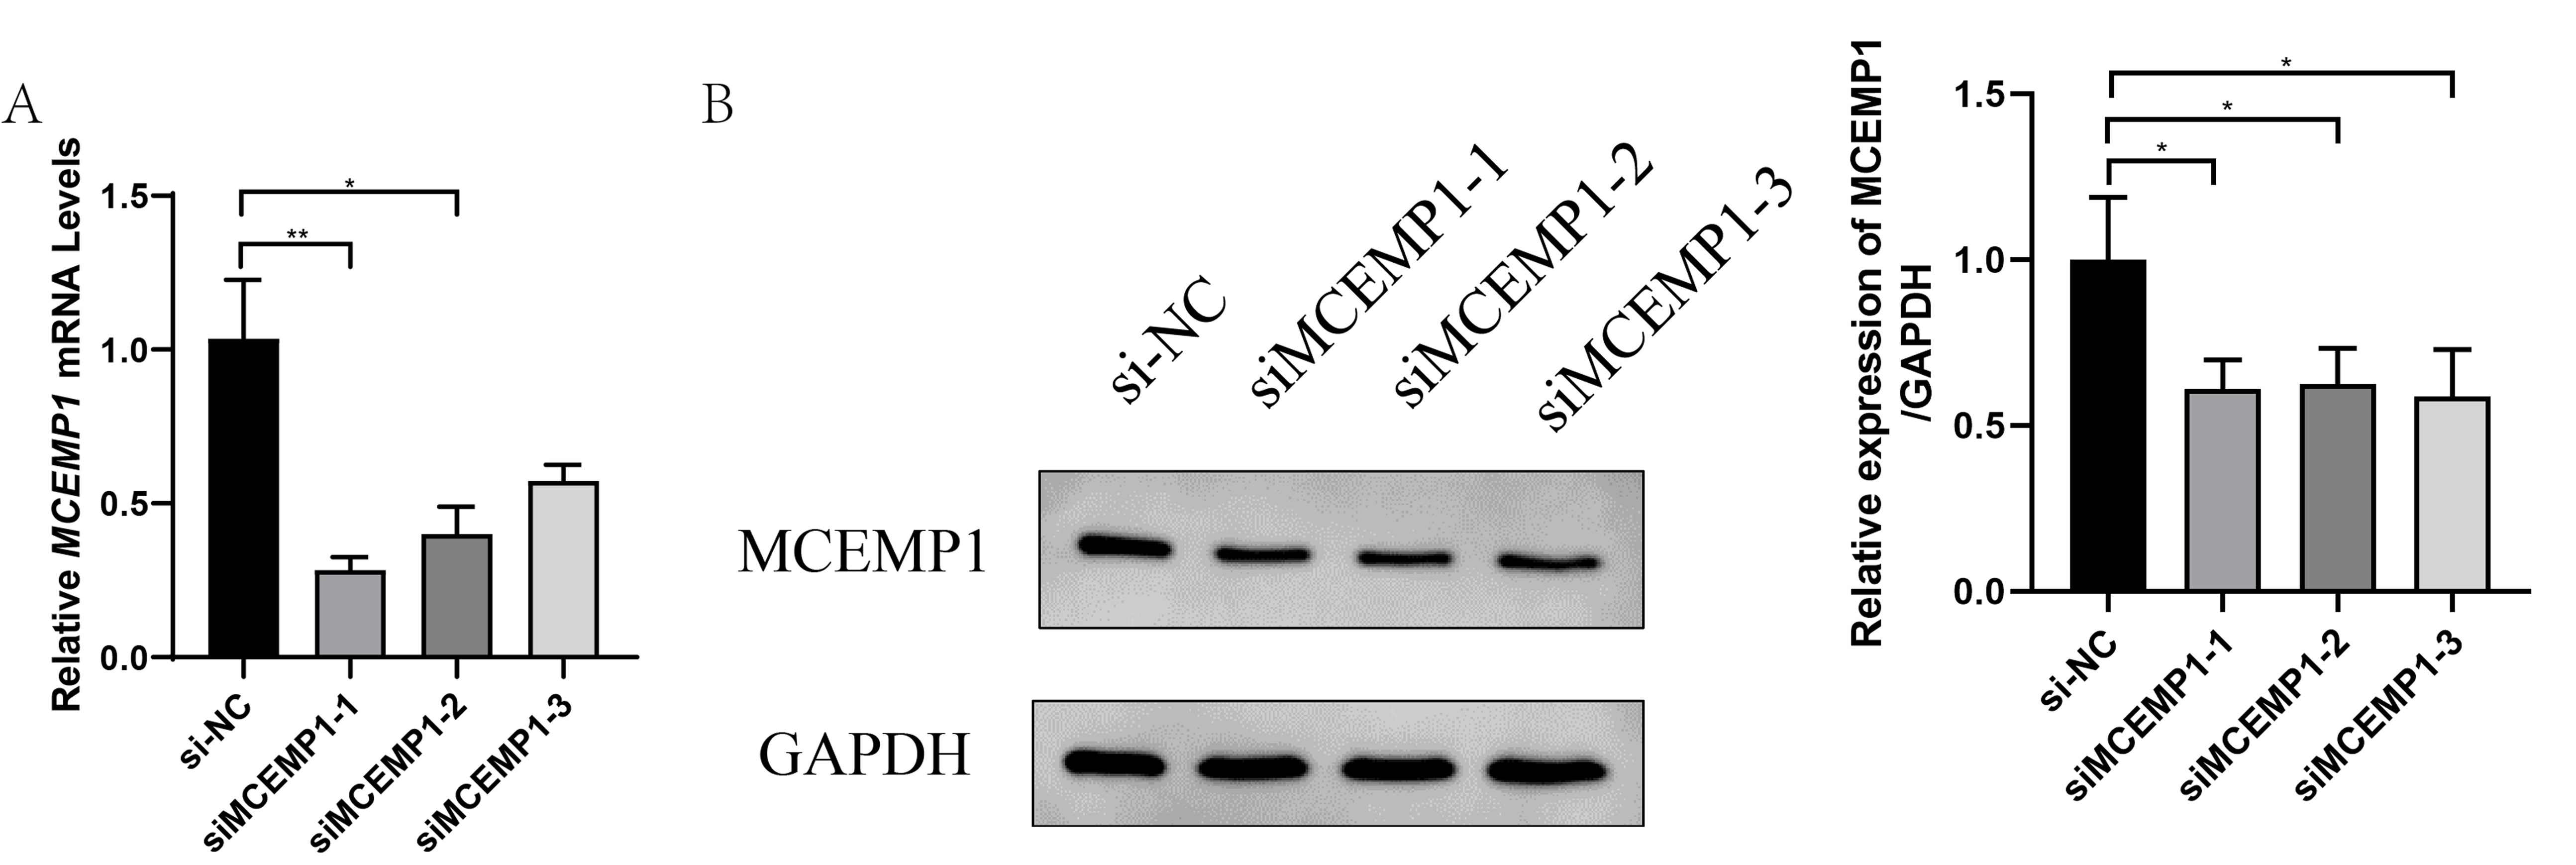
To explore the role of MCEMP1 in the dysfunction of ox-LDL-treated HUVECs, interference sequences targeting MCEMP1 were synthesized. The interference efficiency was evaluated in HUVECs, as shown in Fig. S2. Both siMCEMP1-1 and siMCEMP1-2 were selected for subsequent experiments. Interference sequences for MCEMP1 significantly reduced the ox-LDL-induced expression of MCEMP1, especially siMCEMP1-1 and siMCEMP1-2 (both p < 0.001, Figs. 6A and 6B).
Figure 6: Low expression of MCEMP1 promoted the dysfunction of ox-LDL-treated HUVECs.
The expression of MCEMP1 in ox-LDL-treated HUVECs by qRT-PCR (A) and Western blot (B). The effect of MCEMP1 knockdown on cell viability by CCK-8 assay. (C) The effect of MCEMP1 knockdown on cell apoptosis by Muse® Cell Analyzer. (D) The levels of IL-1β, IL-6, and TNF-α in ox-LDL-treated HUVECs by ELISA Kits. *p < 0.05; **p < 0.01; ***p < 0.001. ox-LDL, oxidized low-density lipoprotein; HUVECs, human umbilical vein endothelial cells; qRT‐PCR, quantitative real‐time polymerase chain reaction; ELISA, enzyme-linked immunosorbent assay.
The effect of MCEMP1 knockdown on the function of ox-LDL-treated HUVECs was investigated. The results, shown in Figs. 6C–6E, indicated that MCEMP1 knockdown promoted cell proliferation (p < 0.01, Fig. 6C) but inhibited apoptosis (p < 0.001, Fig. 6D). Additionally, MCEMP1 knockdown appeared to decrease the expression of inflammatory cytokines IL-1β, IL-6, and TNF-α (Fig. 6E). Collectively, these findings suggested that MCEMP1 knockdown could inhibit the inflammation response in ox-LDL-treated HUVECs.
Discussion
This study aimed to uncover the key characteristic genes associated with CAD by integrating from three CAD datasets. Utilizing bioinformatics analyses and machine learning algorithms, two upregulated genes (DIRC2 and MCEMP1) were identified in both the metadata and validation databases. GSEA analysis indicated a significant association of DIRC2 and MCEMP1 genes with infection and inflammation pathways. Furthermore, the CIBERSORT algorithm revealed a correlation between these genes and immune cell infiltration, suggesting a role in the immune response in CAD. Moreover, mRNA and protein levels of DIRC2 and MCEMP1 were upregulated in ox-LDL-treated HUVECs, aligning with the bioinformatics findings. Importantly, MCEMP1 knockdown accelerated cell proliferation and suppressed cell apoptosis for ox-LDL-treated HUVECs. Additionally, MCEMP1 knockdown might also reduce the expression of inflammatory factors IL-1β, IL-6, and TNF-α, further implicating this gene in the inflammatory processes associated with CAD.
The GEO database serves as a vital international public repository, facilitating the archiving and freely downloading high-throughput gene expression and other functional genomics datasets (Clough & Barrett, 2016). In our study, four down-regulated genes and 69 up-regulated genes were identified between CAD and control samples in a metadata cohort by merging two GEO datasets. GO analysis suggested that these DEGs might be involved in processes such as platelet aggregation regulation, defense response or response to the bacterium, regulation of amyloid precursor protein catabolic process, and positive regulation of cytokine production. These findings are consistent with previously identified CAD-related factors. Platelets are key regulators of thrombosis and inflammation and play an important role in the formation of atherothrombosis (Gawaz, Langer & May, 2005). Previous studies have reported the link between gut bacteria and atherosclerosis (Yoshida et al., 2018). One study found that amyloid protein was associated with atherosclerotic cardiovascular disease (Bampatsias et al., 2022). Cytokines are key regulators of the immune response and are involved in coronary atherosclerotic plaque and thrombosis (Yang et al., 2020). A subsequent enrichment analysis found that these DEGs were primarily related to lipid and atherosclerosis, the NF-kappa B signaling pathway, the B cell receptor signaling pathway, the IL-17 signaling pathway, the toll-like receptor signaling pathway, and the TNF signaling pathway. The NF-κB/ TNF signaling pathway is involved in the pathogenesis of CAD by inducing inflammation (Guo et al., 2018; Qiu et al., 2016). The IL-17/IL-10 signaling pathway is associated with the complexity of coronary atherosclerosis (Li et al., 2021). The activation of toll-like receptor signaling is involved in chronic inflammation in CAD (Rotter et al., 2019). These signaling pathways play a role in the inflammatory response, thus influencing the occurrence and development of CAD. These results suggest that DEG is enriched in inflammation and atherosclerosis in CAD.
Machine learning algorithms are powerful tools for predicting disease from large and complex datasets employing various statistical, probabilistic, and optimization methods (Uddin et al., 2019). LASSO is the only property of the absolute value of the penalized regression coefficient. The greater the penalty, the greater the shrinkage of the coefficient, and then remove the unimportant covariates. The SVM-RFE algorithm is a sequential backward selection algorithm based on the maximum interval principle of SVM (Huang et al., 2018). Its purpose is to classify data points by maximizing the margin between classes in high-dimensional space. Both algorithm can compress coefficients of variables by constructing penalty functions and by making some regression coefficients become zero, thus achieving the purpose of variable selection (Omranian et al., 2016). Through cross-validation, the SVM-REF and LASSO algorithms reduce the risk of overfitting. In this study, these two machine-learning algorithms were used to select hub genes among 73 DEGs in a metadata cohort. Seven overlapping candidate genes (HSDL2, PGLYRP1, CAMP, MCEMP1, IRAK3, DIRC2, and PFKFB3) identified by both algorithms were selected for further analysis. The expression patterns of these seven hub genes in a validation data set confirmed the consistency of DIRC2 and MCEMP1 with the metadata set, leading to their selection for subsequent analysis.
DIRC2 (disrupted in renal cancer 2), also named SLC49A4, encodes an evolutionary conserved transmembrane protein and is a novel member of the major facilitator superfamily of transporters (Bodmer et al., 2002). Functioning as an electrogenic lysosomal metabolite transporter, overexpression of DIRC2 leads to decreased pyridoxine accumulation in cells and is associated with decreased lysosome accumulation (Akino et al., 2023). This protein may be involved in responses to extracellular signals by mediating critical protein-protein interactions (Bodmer et al., 2002). However, few studies have clarified the relationship of this gene to CAD. MCEMP1 (mast cell-expressed membrane protein 1) gene, alternatively named C19OFR59, located on human chromosome 19p13.3, is a transmembrane protein expressed in mast cells, macrophages, and even the brain tissue (Strbian et al., 2006). It has been suggested that downregulation of MCEMP1 led to a decrease in interleukin and interferon, promoting apoptosis of inflammation-inhibiting cells in sepsis (Xie et al., 2020). MCEMP1 may also participate in regulating mast cell differentiation, the immune response, and the inflammatory response (Christie & Henderson, 2002). MCEMP1 loss can promote the activity of T lymphocytes and NK cells, increase the expression of immunoglobulin, inhibit the release of inflammatory factors, and reduce the apoptosis of T lymphocytes (Zhou et al., 2022). MCEMP1 has also been identified as a potential biomarker for stroke prognosis (Raman et al., 2016). Machine learning algorithms have also identified MCEMP1 as a crucial gene in aortic dissection and cardioembolic stroke (Zhang et al., 2022; Li et al., 2022). In our study, both mRNA and protein levels of DIRC2 and MCEMP1 were upregulated in ox-LDL-treated HUVECs, which was consistent with bioinformatics analysis. These results indicated that DIRC2 and MCEMP1 might play significant roles in the pathophysiology of CAD. Notably, MCEMP1 knockdown promoted cell proliferation, but inhibited apoptosis in ox-LDL-treated HUVECs. Moreover, MCEMP1 could inhibit the inflammation response in ox-LDL-treated HUVECs.
Atherosclerosis, the major cause of CAD, is characterized by hyperlipidemia and inflammation (Weber & Noels, 2011). In this study, the CIBERSORT program was utilized to assess immune cell infiltration profiles in CAD subjects and in healthy controls. The proportions of resting dendritic cells, resting mast cells, and regulatory T cells were decreased in CAD tissues compared to normal tissues. Conversely, there was increased infiltration of activated mast cells and neutrophils in CAD tissues. Dendritic cells are found in atherosclerotic lesions that cause inflammation of blood vessels (Yilmaz et al., 2009). Homeostatic Treg defect has been reported to be related to subclinical proinflammatory and atherogenic states (Hasib et al., 2016). Neutrophils are important components involved in immune inflammation, and elevated levels of neutrophil myeloperoxidase may lead to coronary atherosclerosis (Wang et al., 2016). These studies support the influence of inflammatory cells on the pathogenesis of CAD, aligning with the results of our study. DIRC2 was negatively correlated with regulatory T cells, CD8 T cells, resting dendritic cells, and CD4 memory activated T cells but positively correlated with activated NK cells and neutrophils. MCEMP1 was negatively associated with regulatory T cells, resting dendritic cells, and CD4 memory activated T cells, but positively related to macrophages M0, CD4 naive T cells, monocytes, activated mast cells, and neutrophils. These results indicate that the main mechanism of DIRC2 and MCEMP1 in CAD may be related to immune cells. However, this hypothesis needs to be tested in subsequent experiments.
There are some limitations to this study. First, due to the absence of clinical and prognostic information, the predictive value of the identified hub genes for prognosis in CAD patients was not tested. Second, this study primarily focuses on bioinformatics analysis for the correlation of DIRC2 and MCEMP1 with immune cell infiltration and signaling pathways, and the function of hub genes requires in vivo experimental investigation. Therefore, the findings of this study need to be validated with functional trials and studies with larger clinical sample sizes. Third, the in vitro experiments were only carried out in HUVECs cells; therefore, further experiments should be validated in additional cell lines. Moreover, the role of MCEMP1 in other endothelial cell functions such as migration, invasion, or angiogenesis, should be more fully understood in future studies. Fourth, the underlying mechanism by which MCEMP1 affects inflammation remains unclear. Therefore, this study will explore the mechanism on the inflammatory response by which MCEMP1 affects the expression level of inflammatory factors and its downstream signaling molecules in subsequent studies.
Conclusion
In this study, a comprehensive bioinformatics approach was employed to identify 73 DEGs, and seven hub genes were obtained from the metadata using the SVM-RFE and LASSO algorithms. The expressions of DIRC2 and MCEMP1 were validated in the validation dataset and in ox-LDL-treated HUVECs. MCEMP1 knockdown accelerated cell proliferation and suppressed cell apoptosis for ox-LDL-treated HUVECs. MCEMP1 knockdown could also inhibit the inflammation response in ox-LDL-treated HUVECs. These findings suggest that MCEMP1 serves an important role in the progression of CAD. However, the clinical relevance of MCEMP1 in larger patient cohorts and the role of MCEMP1 in other endothelial cell functions and inflammatory response need further experimental investigation.
Supplemental Information
Landscape of immune cell infiltration in CAD.
(A) Boxplot of the proportion of 22 types of immune cell infiltrates. The red in the box represents the CAD group, and the blue represents the normal group. (B) Heatmap plot of correlations among 22 immune cells in CAD. Blue and red represent positive and negative correlations, respectively. Deeper color indicates a stronger correlation. *p < 0.05; **p < 0.01; ***p < 0.001; ns, not significant. CAD, coronary artery disease.
The knockdown efficiency of MCEMP1.
The expression of MCEMP1 in HUVECs was detected by qRT-PCR (A) and Western blot (B). *p < 0.05; **p < 0.01; ***p < 0.001. HUVECs, human umbilical vein endothelial cells; qRT‐PCR, quantitative real‐time polymerase chain reaction.