
Proteomic profiling of oleamide-mediated polarization in a primary human monocyte-derived tumor-associated macrophages (TAMs) model: a functional analysis
- Published
- Accepted
- Received
- Academic Editor
- Xin Zhang
- Subject Areas
- Bioinformatics, Molecular Biology, Immunology
- Keywords
- Proteomic, Tumor-associated macrophages, Oleamide, Molecular docking
- Copyright
- © 2024 Wisitpongpun et al.
- Licence
- This is an open access article distributed under the terms of the Creative Commons Attribution License, which permits using, remixing, and building upon the work non-commercially, as long as it is properly attributed. For attribution, the original author(s), title, publication source (PeerJ) and either DOI or URL of the article must be cited.
- Cite this article
- 2024. Proteomic profiling of oleamide-mediated polarization in a primary human monocyte-derived tumor-associated macrophages (TAMs) model: a functional analysis. PeerJ 12:e18090 https://doi.org/10.7717/peerj.18090
Abstract
Background
Tumor-associated macrophages (TAMs) play a critical function in the development of tumors and are associated with protumor M2 phenotypes. Shifting TAMs towards antitumor M1 phenotypes holds promise for tumor immunotherapy. Oleamide, a primary fatty acid amide, has emerged as a potent anticancer and immunomodulatory compound. However, the regulatory effects of oleamide on TAM phenotypes remain unclear.
Methods
We used real-time quantitative reverse transcription polymerase chain reaction (qRT-PCR) and enzyme-linked immunosorbent assay (ELISA) techniques to study the influence of oleamide on primary human monocyte-derived TAM phenotypes, and we investigated the protein expression profiles based on mass spectrometry to analyze the effect of oleamide on macrophage polarization. Moreover, the advantageous binding scores between oleamide and these target candidate proteins are examined using molecular docking.
Results
Our study revealed that oleamide effectively suppressed the M2-like TAM phenotype by reducing interleukin (IL)-10 production and downregulating M2-like markers, including vascular endothelial growth factor A (VEGFA), MYC proto-oncogene, bHLH transcription factor (c-Myc), and mannose receptor C-type 1 (CD206). Moreover, the conditioned medium derived from oleamide-treated TAMs induces apoptosis of MDA-MB-231 breast cancer cells. Proteomic analysis identified 20 candidate up- and down-regulation proteins targeted by oleamide, showing modulation activity associated with the promotion of the M1-like phenotype. Furthermore, molecular docking demonstrated favorable binding scores between oleamide and these candidate proteins. Collectively, our findings suggest that oleamide exerts a potent antitumor effect by promoting the antitumor M1-like TAM phenotype. These novel insights provide valuable resources for further investigations into oleamide and macrophage polarization which inhibit the progression of breast cancer, which may provide insight into immunotherapeutic approaches for cancer.
Introduction
Macrophages are innate immune cells originating from blood monocytes that leave the circulation to differentiate in different tissues, where they contribute to both homeostasis and disease (Gordon & Plüddemann, 2017). Tumor-associated macrophages (TAMs) are one of the main tumor-infiltrating immune cell types present in the tumor microenvironment (TME) (Pan et al., 2020; Zhou et al., 2020). TAMs play a crucial role in producing immunosuppressive mediators, growth factors, cytokines and chemokines (Pan et al., 2020; Zhou et al., 2020).
TAMs also influence tumor growth, angiogenesis, and metastasis (Pan et al., 2020; Zhou et al., 2020). TAMs are the major component of immune cell infiltration in the TME and can constitute up to 50% of the tumor mass (Pan et al., 2020; Zhou et al., 2020). Two major directions of polarized TAMs include classically activated M1 (main markers—major histocompatibility complex DR (HLA-DR), cluster of differentiation (CD) 80/86, inducible nitric oxide synthase (iNOS), C–X–C motif chemokine ligand 10 (CXCL10)) and alternatively activated M2 (main markers—CD206, CD163, CD204, stabilin-1) phenotypes (Pan et al., 2020; Zhou et al., 2020). TAMs exhibit phenotypic plasticity, characterized by the ability to differentiate into functionally distinct subsets in response to specific environmental cues. This process is termed polarization (Mantovani et al., 2004). Polarization of TAMs toward M1/M2-like phenotypes can be manipulated by biomolecules that derive from the TME and cancer cells (Pan et al., 2020; Zhou et al., 2020). At the early stages of tumor formation, macrophages within the TME predominantly express pro-inflammatory M1-like TAMs, whereas tumor progression is associated with increased infiltration of anti-inflammatory M2-like TAMs (Pan et al., 2020; Zhou et al., 2020). Usually, TAMs display a tumor-promoting M2-like phenotype rather than the antitumor M1 phenotype (Lv et al., 2022; Oshi et al., 2020; Zhang et al., 2014). The M1/M2 ratio is considered a crucial prognostic marker of cancer disease. A high M1/M2 ratio appears to be correlated with favorable outcomes, whereas a low M1/M2 TAM ratio frequently implies tumor development and a poor prognosis (Lv et al., 2022; Oshi et al., 2020; Zhang et al., 2014). Therefore, finding a molecule that can target TAMs toward M1-like phenotypes and/or suppress M2-like phenotypes has become a novel strategy for treatment of solid tumors.
Oleamide is a fatty amide derived from oleic acid and serves as a lipid-signaling molecule (Fowler, 2004). Oleamide was first recognized as a sleep-inducing substance and later found to have wide-ranging effects on the central nervous system (CNS) by interacting with various neurotransmitter receptors such as gamma-aminobutyric acid (GABA), serotonin and dopamine acetylcholine (Boger, Henriksen & Cravatt, 1998; Maya-López et al., 2020; Mendelson & Basile, 2001; Verdon et al., 2000). In plant extracts, oleamide compounds purified from green algae Codium fragile suppressed lipopolysaccharide (LPS)-induced tumor necrotic factor-alpha (TNF-α), IL-1 β, and IL-6 secretion in RAW254.7 cells by inhibiting the phosphorylation of the inhibitor of kappa B (I κB)- α (Moon et al., 2018). Oleamide was also identified in extracts of the leaf of Moringa oleifera that exert anticancer effects by inducing cell apoptosis and cell-cycle arrest of MDA-MB-231 breast cancer cell line (Wisitpongpun et al., 2020). In microglia cells, a population of macrophages found in the CNS, oleamide exerts a dual activity with induction of phagocytosis and suppression of LPS-induced inflammation (Ano et al., 2015). Moreover, induced the polarization of naïve macrophages toward M1 macrophages by regulating the NLRP3-inflammasome pathway in primary human monocyte-derived macrophages (MDMs) (Wisitpongpun, Potup & Usuwanthim, 2022). The inflammasome is a cytosolic multiprotein complex that assembles in response to various stimuli, including infection and stress responses (De Zoete et al., 2014). These complexes consist of upstream nucleotide-binding oligomerization domain (NOD)-like receptors (NLRs) and the downstream effector caspase-1. Inflammasome activation leads to the production of key pro-inflammatory cytokines, IL-1 β and IL-18, as well as gasdermin D, which triggers pyroptosis, a form of programmed cell death (Swanson, Deng & Ting, 2019). NLRP3, a NOD-like receptor containing leucine-rich repeats (LRRs) and a pyrin domain, is one of the inflammasome sensors that recognizes a broad range of stimuli. Although oleamide exerts potent anticancer and immunomodulatory activity, its effect on human TAM polarization influencing cancer cells have yet to be investigated.
Here, we investigated the immunoregulatory effect of oleamide on TAM phenotypes using primary human monocytes as a model. TAM phenotypes were characterized using a combination of ELISA, qRT-PCR, and apoptosis analysis. We employed high-throughput proteomics to identify and quantify the proteins in oleamide-treated TAMs, and additionally, selected key proteins were subjected to molecular docking analysis to further elucidate their interaction with oleamide.
Materials & Methods
Cell culture
Primary human monocytes were collected from a blood buffy coat obtained from healthy donors at the Blood Bank of Naresuan University Hospital. This research protocol was ethically approved by the Naresuan University institutional review board (approval number 0172/62; approval date, May 28, 2019). This study adhered to ethical guidelines by obtaining verbal consent from all blood donors. To ensure the complete protection of participant privacy, the manuscript and associated supplemental files are devoid of any personally identifiable information. The isolated cells were cultured in the Roswell Park Memorial Institute (RPMI) 1640 (Gibco, Carlsbad, CA, USA) supplemented with 10% single donor human serum and 1% penicillin/streptomycin (Gibco). MDA-MB-231 cells, acquired from the American Type Cell Collection (ATCC) (Manassas, VA, USA), were cultured in Dulbecco’s Modified Eagle’s Medium (DMEM) (Gibco) supplemented with 10% fetal bovine serum (FBS) (Gibco) and 1% penicillin/streptomycin (Gibco). Maintenance of all cell cultures was conducted at 37 °C in a humidified environment with 5% CO2.
Harvesting of tumor-conditioned medium
To procure tumor-conditioned media, MDA-MB-231 cells were cultivated at a density of 2 × 10⁵ cells in a T-75 flask until attaining 80% confluency in complete medium. Subsequently, the medium was substituted with 0.2% FBS medium for a duration of 24 h. Following the incubation period, the resulting tumor-conditioned medium was harvested and subjected to centrifugation at 3,000 rpm for 5 min to eliminate suspended cells. The resultant supernatant was then collected, and 10% single donor human serum was supplemented to restore the medium.
Isolation of primary human monocytes
Following the protocol outlined by Menck et al. (2014) cells isolated from the blood buffy coat of healthy donors underwent a systematic procedure. Initially, the buffy coat was partitioned into two 50 ml tubes and centrifuged at 3,000 rpm for 30 min. The obtained serum was utilized for the preparation of single donor human serum, while the white blood cell (WBC) layer was transferred to a separate tube and suspended in phosphate-buffered saline- ethylenediaminetetraacetic acid (PBS-EDTA) (1 mM) to achieve a volume of 20 ml. The diluted WBCs were gently overlaid onto Ficoll-Paque solution (density 1.077 g/ml, GE Healthcare, Chicago, IL, USA) in a 1:1 ratio and centrifuged at 3,000 rpm for 30 min. Subsequently, the peripheral blood mononuclear cells (PBMCs) layer at the interface was transferred to a fresh 50 ml tube and washed once with 40 ml PBS-EDTA. Upon removal of the supernatant, the PBMC pellet was resuspended in 15 ml of PBS-EDTA. Diluted PBMCs were carefully overlaid onto 46% Percoll solution (density 1.131 g/ml; GE Healthcare) in a 1:1 ratio and centrifuged at 3,000 rpm for 30 min. The resulting monocyte layer at the interface was then transferred to a new 50 ml tube and washed 3–5 times with 40 ml PBS-EDTA to eliminate residual platelets. Subsequently, the monocytes were cultured in RPMI 1640 supplemented with 10% human serum and 1% penicillin/streptomycin for 6 days to differentiate into MDMs. The purity of MDMs from days 0–6 is illustrated in Fig. S1.
Heat-inactivated of single donor human serum
Following the protocol for human serum collection, blood buffy coats from healthy donors were processed. Initially, the buffy coat was divided between two 50 ml tubes and subjected to centrifugation at 3,000 rpm for 30 min. Subsequently, serum was transferred to a fresh 50 ml tube and incubated at 56 °C in a water bath for 30 min to inactivate the complement. Following this, the serum underwent centrifugation at 3,000 rpm for 15 min to eliminate residual fibrin and platelets. The supernatants obtained were then transferred to 15 ml tubes and stored at −20 °C until required for further use.
Tumor-associated macrophages (TAMs)
Tumor-associated macrophages (TAMs) were generated following the protocol outlined by previous study (Prapakorn Wisitpongpun, 2022). MDMs were co-cultured with MDA-MB-231 breast cancer cells within a Transwell co-culture system (0.4 µm pore size polycarbonate; SPL Life Sciences, Pocheon, Korea). MDA-MB-231 cells (6 × 10³ cells/well) were seeded in the upper chamber of the Transwell plate and incubated overnight in complete DMEM prior to co-culture. Freshly isolated human monocytes (1 × 10⁵ cells/well) were seeded to the lower chamber, and divided into four experimental groups: (1) complete medium (non-co-culture), (2) complete medium (co-culture negative control), (3) complete medium supplemented with IL-4 (50 ng/ml), IL-10 (50 ng/ml), and macrophage colony-stimulating factor (M-CSF) (50 ng/ml), and (4) a 1:1 mixture of complete medium and tumor-conditioned medium, further supplemented with IL-10 (50 ng/ml) and M-CSF (50 ng/ml). The upper chamber containing MDA-MB-231 cells was then inserted into the Transwell plate (except for the non-co-culture group), and cells were maintained for six days. The conditioned medium was replaced every three days, and cell harvesting was performed on the sixth day.
Reverse transcription-quantitative real-time PCR (RT-qPCR)
Cell pellets were harvested from untreated macrophages (control), untreated TAMs, and oleamide-treated TAMs, constituting the three experimental groups (n = 3 per group). These pellets were subsequently utilized for total RNA extraction procedures. Total RNA was isolated utilizing Trizol reagent (Invitrogen, Carlsbad, CA, USA) following the manufacturer’s protocol, with no additional DNase treatment. The purity of the total RNA extract was assessed spectrophotometrically using a Nanodrop instrument. Subsequently, cDNA synthesis was performed using the Tetro cDNA Synthesis Kit (Bioline, Memphis, TN, USA). Briefly, 5 µg of total RNA was mix with mastermix (Tetro reverse transcriptase 200 U, oligo (dT)18 primer mix, 10mM dNTP mix, and RiboSafe RNase inhibitor). The mixture was subjected to an initial incubation period at 45 °C for 30 min. This was followed by a termination step at 85 °C for 5 min, and the reaction was subsequently halted via rapid cooling on ice. The resulting cDNAs (100 ng/reaction) were subjected to amplification with various primers (referenced in Table S1 ) employing the SensiFAST™ SYBR® No-ROX Kit (Bioline). The PCR protocol involved polymerase activation at 95 °C for 2 min, followed by 40 cycles consisting of a denaturation step at 95 °C for 5 s, annealing and extension at 60 °C for 1 min, and a final extension at 72 °C for 5 min. To evaluate gene expression levels, a relative gene expression approach was employed. Briefly, the cycle threshold (Ct)-value of the target gene was compared to that of untreated control cells (MØcontrol) to determine the relative expression of the target genes. Relative differences in gene expression among groups were calculated from the quantification Ct values, initially normalized to the β-actin housekeeping gene in the same sample (ΔCt), and then expressed as fold-change over control (2−ΔΔCt). Real-time fluorescence detection was performed using a CFX96 Touch Real-Time PCR Detection System (Bio-Rad, Hercules, CA, USA). Analysis of Ct data was carried out employing the CFX Manager software (version 3.1), following established quantitative real-time PCR analysis protocols.
Apoptosis analysis
Cellular apoptosis was examined using a Muse Cell Analyzer (EMD Millipore, St. Louis, MO). MDA-MB-231 cells were cultured in 24-well plates at a density of 5 × 10⁴ cells/well. The cells were treated with conditioned media from various conditions, including untreated-TAMs (TAMs), oleamide-treated TAMs (TAMs + OLA), M0 macrophages (MØCtr), complete medium alone (control), or complete medium supplemented with 20 µg/ml oleamide (OLA only) for 24 h at 37 °C with 5% CO2. Following treatment, cells were collected into microcentrifuge tubes, resuspend with 5% FBS in complete medium up to the final volume of 100 µl, and stained with 100 of µl Muse™ Annexin V and Dead Cell reagent (cat. no. MCH100105; EMD Millipore). Cells were incubated for 20 min at room temperature in dark. Finally, stained cells were then analyzed within 10 min.
Enzyme-linked immunosorbent (ELISA) assay
For the determination of cytokine levels, a sandwich enzyme-linked immunosorbent assay (ELISA) kit (Sino Biological Inc., Beijing, China) was utilized to measure TNF-α, IL-6, IL-1 β, and IL-10 cytokines. The absorbance of the reaction was quantified at 450 nm using an EnSpire® Multimode microplate reader (PerkinElmer).
Cell viability assay
To assess cell viability, the 3-(4,5-dimethylthiazol-2-yl)-2,5-diphenyltetrazolium bromide (MTT) assay was employed, wherein cells were seeded at a density of 1 ×10⁴ cells/well in a 96-well plate containing 100 µl of complete medium. Subsequently, cells were exposed to various treatments, including untreated-TAMs (TAMs), oleamide-treated TAMs (TAMs + OLA), M0 macrophages (MØCtr), complete medium alone (control), or complete medium supplemented with 20 µg/ml oleamide (OLA only) for 24, 48, and 72 h. Additionally, to evaluate the cytotoxicity of oleamide, cells were exposed to serial concentrations of oleamide ranging from 0–240 µg/ml for 24 h. Following treatments, cells were washed with PBS and incubated with MTT salt solution for 3 h at 37 °C. The resulting formazan crystals were dissolved in 100 µl of dimethyl sulfoxide (DMSO), and absorbance was measured at 570 nm using a microplate reader.
Protein extraction and digestion for label-free proteomic analysis
This study collected whole cell lysates from three experimental groups: macrophage control, TAMs, and TAMs+OLA, from two different blood donors (AB and O) for proteomic analysis. The sample preparation was prepared using previously protocol with minor modifications (Krobthong et al., 2022). Briefly, the protein solution was concentrated using a 3 kDa molecular weight cut-off membrane and then precipitated with ice-cold acetone (1:5 v/v). Following precipitation, the protein pellet was dissolved in a solution containing 0.3% RapidGest SF (Waters Corp., Milford, MA) and 2.5 mM ammonium bicarbonate (Sigma Aldrich Co.). To facilitate trypsin digestion, 30 µg of total protein was used. Sulfhydryl bond reduction was achieved by treating the protein solution with 1 mM tris(2-carboxyethyl) phosphine hydrochloride (TECP) (Sigma Aldrich) in 2.5 mM ammonium bicarbonate at 37 °C for 2 h, followed by sulfhydryl alkylation with 5 mM indole-3-acetic acid (IAA) (Sigma Aldrich) in 2.5 mM ammonium bicarbonate at room temperature for 50 min in the dark. The solution was then purified using a Zeba Spin Desalting Column (Thermo Fisher Scientific, Waltham, MA, USA). The resulting flow-through solution was enzymatically digested using trypsin (Promega Co., Madison, WI, USA) at a ratio of 1:40 (enzyme to protein) and incubated at 37 °C for 6 h. The digested solution was prepared for liquid chromatography-tandem mass spectrometry (LC-MS/MS) analysis after being dried and reconstituted in 0.1% formic acid.
LC-MS/MS setting and data processing for label-free proteomic analysis
LC-MS/MS spectral data were acquired in positive mode using an HF-X hybrid Quadrupole-Orbitrap™ Mass Spectrometer coupled with an EASY-nLC1000 nano-LC system equipped with a nano C18 column (Thermo Fisher Scientific). The protein amount that loaded onto column was 1,000 ng (2 uL of 500 ng/uL). The mobile phase compositions were as follows: mobile phase A, 0.1% formic acid in water, and mobile phase B, 90% acetonitrile with 0.1% formic acid. LC separation was carried out utilizing a linear gradient of 3% to 60% mobile phase B over 135 min at a constant flow rate of 300 nL/min. After being cleaned with 90% mobile phase B for 10 min, the analytical column was regenerated by being re-equilibrated with 3% mobile phase B for 35 min. The peptides were subjected to data-dependent acquisition (TopN15 method) followed by higher-energy collisional dissociation with a collision energy of 29 eV. Full scan mass spectra were recorded in the m/z range of 350 to 1,200, with an automatic gain control (AGC) target of 3e6 ions and a resolution of 120 k. MS/MS scanning was started when the AGC target reached 5e4 ions, and a resolution of 15k was used. The acquired raw mass spectra (.raw file) were processed using Proteome Discoverer™ 2.4 software (Thermo Fisher Scientific) and matched against the UniProt protein database (https://www.uniprot.org/; organism: Homo sapiens; accessed on 14 January 2023) for identification. For protein identification and quantification, the following parameters were used: MS tolerance, 20 ppm; MS/MS tolerance, 0.05 Da; digestion enzyme, trypsin; fixed modification, cysteine carbamidomethylation; and variable modification, methionine oxidation. To ensure robust identification, the false discovery rate (FDR) for peptides and proteins was set at 1%. For normalization and relative abundance determination, protein intensity was normalized to the total peptide amount for each LC run using the normalization algorithm (total intensity count) of the software (Griss et al., 2020).
Gene Ontology annotation and protein–protein interaction network
The Gene Ontology (GO) is a structured and standardized information source representing biological knowledge, which is used to define and categorize genes and gene products based on three different aspects, including cellular component, molecular function, and biological process (Ashburner et al., 2000; The Gene Ontology et al., 2023). GO cellular component is classification of characterizing the functions of gene products based on their location within cellular structures. GO molecular function aspects describe the specific biochemical activities of gene products at the molecular level, including catalysis and transport. Notably, these aspects do not provide information regarding the context or temporal specificity of these activities. On the other hand, GO biological processes are defined as a series of molecular events that lead to the completion of a specific cellular process, but are not necessarily equivalent to a specific pathway. Examples of biological processes include DNA repair and signal transduction. Protein–protein interaction (PPI) network analysis was conducted using a method that involved searching for differentially expressed proteins (DEPs) in the STRING database version 11. The resulting interaction network was visualized with a high confidence score (≥ 0.7). To analyze the GO annotation and PPI, Cytoscape software version 3.9.1 was employed, with the stringApp add-on application utilized for this study.
Integration of functional enrichment analysis and KEGG pathways database
To conduct functional enrichment analysis, a list of significant differentially expressed proteins that were commonly found in both donor AB and O was selected. The interactive and collaborative HTML5 gene list enrichment analysis tool, Enrichr (https://maayanlab.cloud/Enrichr) (Chen et al., 2013; Kuleshov et al., 2016; Xie et al., 2021), was utilized to integrate information regarding GO biological processes and protein pathways based on the Kyoto Encyclopedia of Genes and Genomes (KEGG) 2021 human library (Kanehisa, 2019; Kanehisa et al., 2023; Kanehisa & Goto, 2000). Firstly, the list of Uniprot IDs protein in donor AB and O was converted to Gene IDs using the Uniprot Retrieve/ID mapping tool (https://www.uniprot.org/id-mapping). Subsequently, the resulting list of gene identifications (IDs) was submitted to Enrichr. To visualize the interaction network of GO biological process, KEGG pathway, and overlapped genes, Enrichr-KG (https://maayanlab.cloud/enrichr-kg) was employed with the following criteria: minimum libraries per gene = 1, minimum links per gene = 1, minimum links per term = 1.
Identification of the differentially expressed genes using Gene Set Enrichment Analysis
To further elucidate the differential gene expression in both TAMs and oleamide-treated TAMs, we conducted a Gene Set Enrichment Analysis (GSEA) using version 4.3.2 of the GSEA desktop application (Mootha et al., 2003; Subramanian et al., 2005). The list of Uniprot IDs was uploaded corresponding to the expressed proteins and aligned them with the Human_UniProt_IDs_MSigDB.v2023.1. Hs chip platform. Subsequently, we categorized the data into two distinct phenotypic groups: TAMs (TAMs) and TAMs treated with oleamide (OLA), each consisting of three samples. For this analysis, we employed the Molecular Signatures Database (MSD) collection of curated gene set (c2.all.v2023.1.Hs.symbols.gmt), which contained seven gene subsets; chemical and genetic perturbations (CGP), canonical pathways (CP), BioCarta subset of CP, KEGG subset of CP, pathway interaction database (PID) subset of CP, Reactome subset of CP, and WikiPathways subset of CP (Liberzon et al., 2015; Liberzon et al., 2011). Our analysis was conducted using the following parameters: 1,000 permutations, gene set sizes ranging from 15 to 500, a p-value cutoff of 0.05, and FDR correction. The other parameters were maintained default, including enrichment statistics (weighted), gene list ranking method (Signal2Noise), gene list sorting mode (real), randomization mode (no balance), collapsing mode for probe sets (max probe), and normalization mode (meandiv).
Molecular docking
To observe the potential interaction of oleamide on target molecule, protein structures that were significantly up- and down-regulated and known to be involved in macrophage function were retrieved from the Protein Data Bank (PDB) (https://www.rcsb.org/) and saved in the “PDB” format as protein receptors. These protein receptors were prepared for docking by removing all non-standard residues and water molecules, assigning charges, and modifying incomplete amino acid side chains using the Dock Prep tool (Shapovalov Maxim & Dunbrack Roland Jr, 2011) on UCSF Chimera alpha version 1.17 (Pettersen et al., 2004). The 3D structure of oleamide was retrieved from the PubChem database (https://pubchem.ncbi.nlm.nih.gov/) (PubChem CID 5283387) and optimized using the Dock Prep tool on UCSF Chimera alpha similar to the protein receptors. The molecular docking analysis was performed using AutoDock Vina software version 1.2.3 (Eberhardt et al., 2021; Trott & Olson, 2010) to assess the binding score of protein-ligand complexes. An affinity value of <−5 kcal/mol indicated a good binding interaction between the oleamide and protein targets (Gaillard, 2018). The 2D and 3D structures of the resulting protein-ligand complexes were visualized using Discovery Studio Visualizer 2021 software version 21.1.0.
Statistical analysis
GraphPad Prism 6.0 software (GraphPad Software Inc., San Diego, CA, USA) was used to perform one-way analysis of variance (ANOVA) with multiple comparison corrections (Dunnett test) for comparisons of more than two groups. All results were presented as mean ± standard error of the mean (SEM). Statistics were considered significant for p-values <0.05. For proteomic analysis, the changes in protein folding were assessed through pairwise comparisons, and statistical significance was determined using the Benjamini–Hochberg method to adjust p-values, employing ANOVA with a background-based calculation approach. The Fisher’s exact test was employed to assess the significance of the overlap between the input gene list and the gene sets within each gene set library used for the enrichment scoring method.
Results
Generation of human monocytes-derived TAMs
In exploring the optimal conditions for TAM generation, primary human MDMs were co-cultivated with human breast cancer MDA-MB-231 cells utilizing the Transwell co-culture approach. The MDMs were cultured in the lower compartment of the Transwell plate under various conditions, including solely complete medium, complete medium supplemented with IL-4, IL-10, and M-CSF, or a mixture of complete medium and tumor-conditioned medium (in a 1:1 ratio) with additional IL-4, IL-10, and M-CSF. Over a span of 6 days, MDMs were co-cultured with MDA-MB-231 cells to drive the differentiation of naïve monocytes into TAMs (as depicted in Fig. 1).
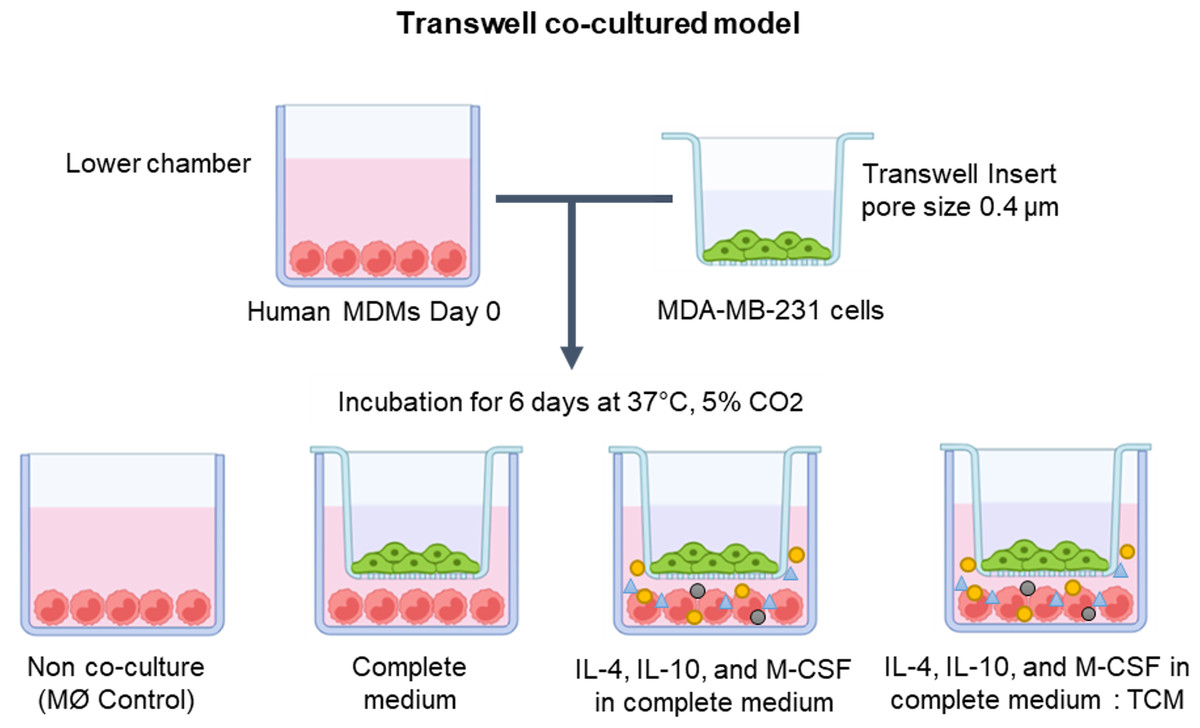
Figure 1: The protocol for generating human monocyte-derived TAMs in this study.
A co-culture system of MDMs and MDA-MB-231 cells was established using Transwell plate. The cells were maintained under standard cell culture conditions (37 °C, 5% CO2). MØmedium (representing naïve macrophages or M0), interleukin-4 (IL-4), interleukin-10 (IL-10), macrophage colony-stimulating factor (M-CSF), or tumor-conditioned medium (TCM). The figure was generated using BioRender.com (https://www.biorender.com/).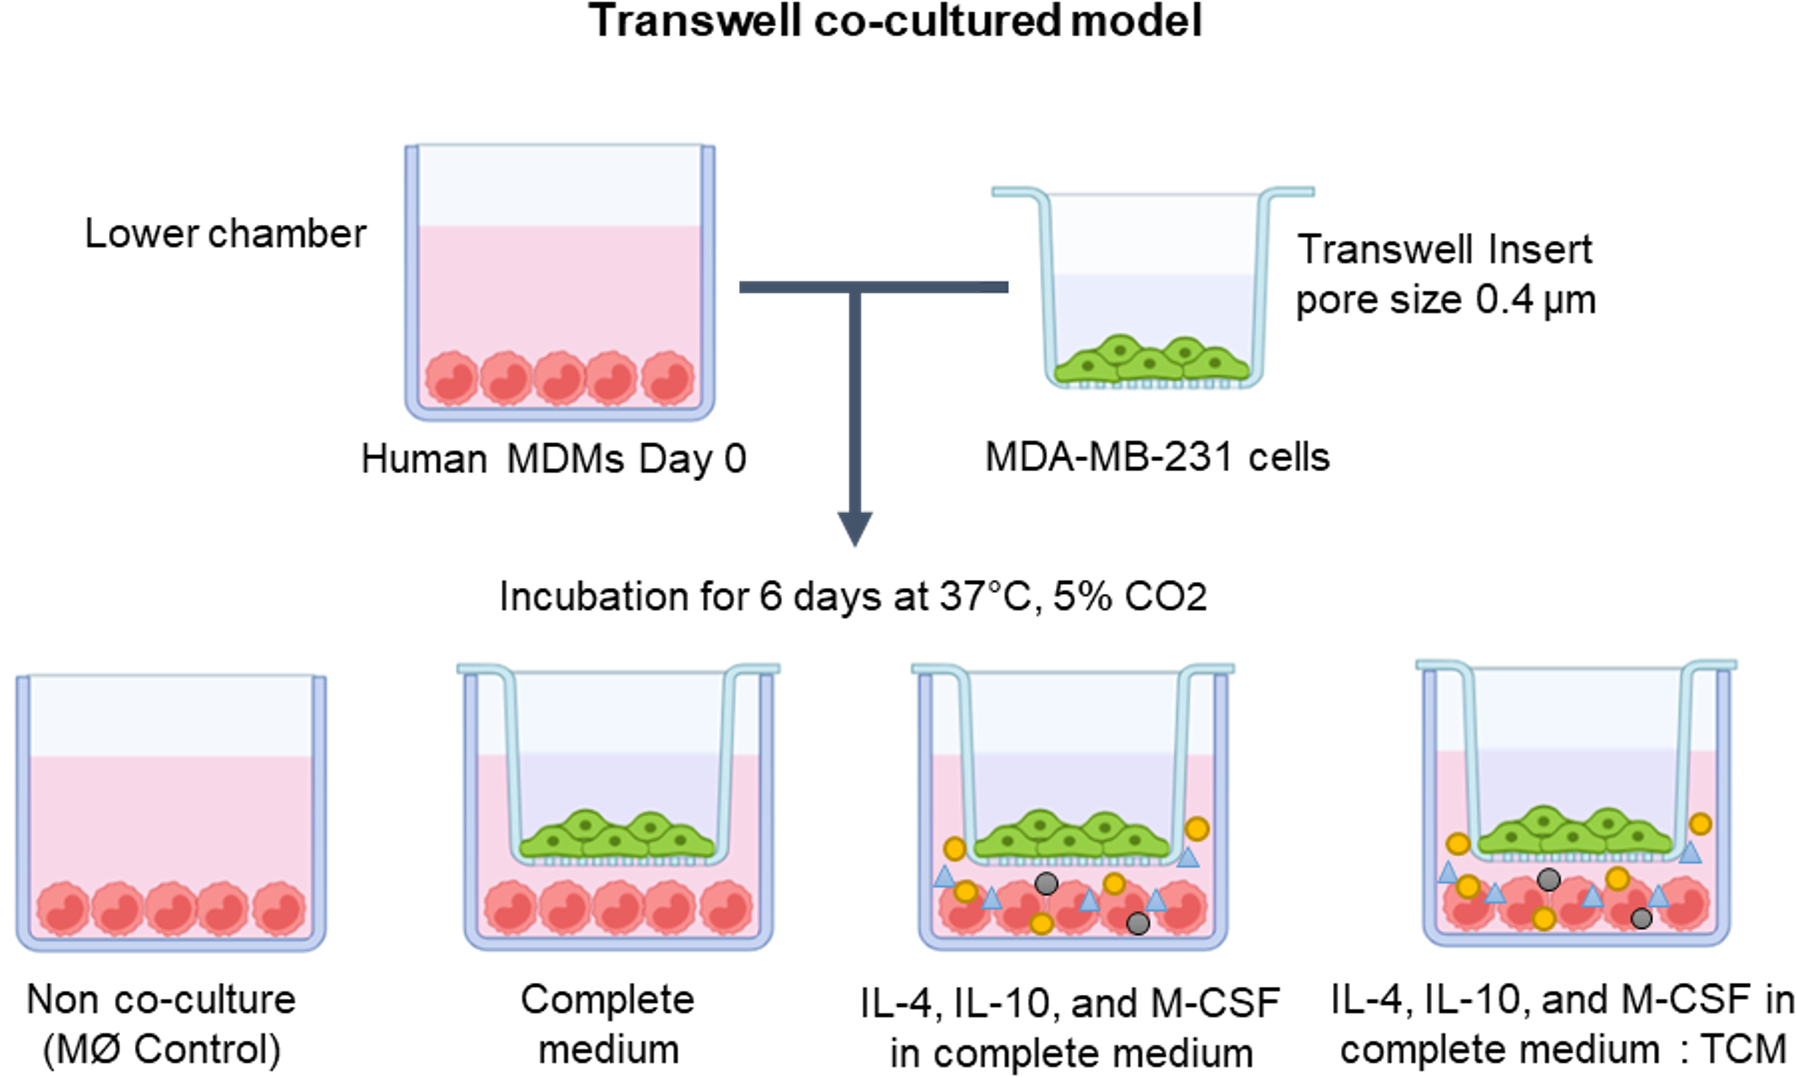
Bright-field microscopy was employed to observe the morphology of co-cultured macrophages on day 6 (Fig. 2A). Across all conditions, macrophages displayed a consistent pattern of alignment by clustering and aligning along the well. While co-cultured macrophages in complete medium only exhibited small, round, elongated shapes, those treated with cytokines or tumor-conditioned medium plus cytokines displayed greater elongation, resembling spindle-like shapes. The phenotypic characterization of TAMs was based on the expression of signature genes associated with M2-like TAM phenotypes, including c-Myc (an oncogene with pro-tumor effects), matrix metallopeptidase 9 (MMP9) (which mediates extracellular matrix degradation), VEGFA (an angiogenesis-inducing growth factor), and CD206 (a mannose receptor), along with the expression of the M1-like TAM phenotype gene HLA-DR, which is typical of antigen-presenting cells (APCs).
Figure 2: Phenotypical characterization of human monocyte-derived TAMs using Transwell co-culture.
(A) Cell morphology of monocyte-derived TAMs after 6 days of Transwell co-culture with MDA-MB-231 cells. Morphology was observed under an inverted bright-field microscope at 10X magnification. (B) Gene expression of M1/M2-like TAM phenotypes using RT-qPCR. Total RNAs were extracted from co-cultured macrophages and MØcontrol on day 6. Data represent the mean ± SEM of three independent experiments (∗p < 0.05,∗∗p < 0.01,∗∗∗p < 0.001), ns (not significant), TCM (tumor-conditioned medium), c-Myc (pro-tumor oncogene), MMP9 (matrix metallopeptidase 9), VEGFA (vascular endothelial growth factor A), CD206 (mannose receptor), HLA-DR (major histocompatibility complex class II), IL-4 (interleukin-4), IL-10 (interleukin-10), M-CSF (macrophage colony-stimulating factor).
Analysis of tumor-associated gene expression revealed that co-culturing MDMs with MDA-MB-231 cells without cytokine stimulation was adequate to induce the expression of VEGFA and MMP-9 genes but did not significantly affect c-Myc gene expression (Fig. 2B). Conversely, co-culturing MDMs in complete medium supplemented with cytokines or in a mixture of complete medium and tumor-conditioned medium with cytokines significantly upregulated the expression of all TAM genes. Notably, co-culturing MDMs in complete medium with cytokines led to greater expression of c-Myc and MMP-9 compared to the tumor-conditioned medium condition (Fig. 2B). Our data indicate that Transwell co-culture of macrophages and MDA-MB-231 cells with the addition of IL-4, IL-10, and M-CSF provides a more suitable model for in vitro generation of M2-like TAMs.
Oleamide initiated the reprogramming of M2-like TAMs towards M1-like TAM phenotypes
Recent research by Wisitpongpun, Potup & Usuwanthim (2022) highlighted oleamide’s immunomodulatory potential in promoting naïve M1 macrophage polarization and inflammasome activation. Building on this, we aimed to investigate oleamide’s effect on TAM polarization. On day 6 of co-culture, TAMs were exposed to oleamide (20 µg/ml) for 24 h. The TAM phenotypes were evaluated based on the expression of TAM-associated genes (VEGFA, c-Myc, and MMP-9), M1-like TAM genes (iNOS and HLA-DR), and M2-like TAM genes (CD206, IL-10, and CD163). Treatment with oleamide led to a significant reduction in the expression of c-Myc, VEGFA, CD206, and IL-10 genes compared to untreated TAMs, indicating suppression of M2-like TAM differentiation (Fig. 3A). Additionally, oleamide upregulated the expression of HLA-DR and slightly increased iNOS genes, associated with M1-like TAMs (Fig. 3A). Complementing these findings, ELISA analysis revealed increased levels of IL-1 β in TAMs treated with oleamide, while TNF-α and IL-6 levels did not significantly differ from untreated TAMs (Fig. 3B). Moreover, decreased IL-10 levels were observed in oleamide-treated TAMs, consistent with the downregulation of IL-10 gene expression. Overall, these results suggest that oleamide treatment diminishes protumor M2-like TAMs while preserving antitumor M1-like TAMs in a Transwell co-culture model with MDA-MB-231 cells.
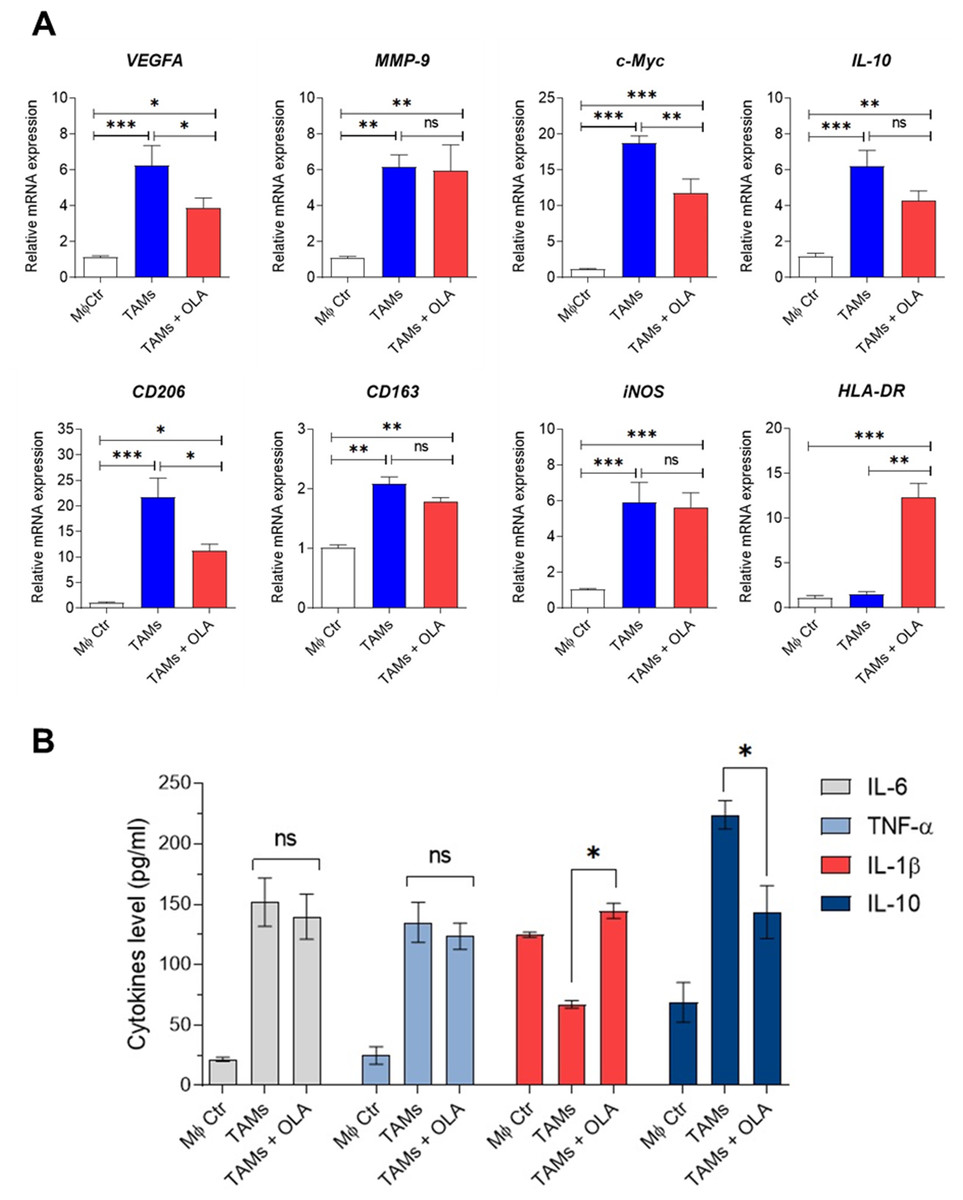
Figure 3: Effect of oleamide on human TAM polarization.
(A) Gene expression by RT-qPCR. (B) Cytokine levels as established using ELISA. Transwell generated TAMs (day 6) were incubated in the presence or absence of oleamide (20 µg/ml) for 24 h. Afterward, total RNA was extracted for analysis of M1/M2-like TAM gene expression. Cell culture supernatants were used to measure pro-and anti-xinflammatory cytokine production. The MØcontrol represented naïve macrophages or M0 macrophages. Data are represented as mean ± SEM of three independent experiments (∗p < 0.05, ∗∗p < 0.01,∗∗∗p < 0.001), ns (not significant), TAMs (tumor-associated macrophages), OLA (oleamide), c-Myc (pro-tumor oncogene), MMP9 (matrix metallopeptidase 9), VEGFA (vascular endothelial growth factor A), CD206 (mannose receptor). CD163 (hemoglobin-haptoglobin scavenger receptor), iNOS (inducible nitric oxide synthase), HLA-DR (major histocompatibility complex class II), IL-6 (interleukin-6), IL-1 β (interleukin-1 β), IL-10 (interleukin-10), TNF- α (tumor necrosis factor-alpha).
The conditioned medium obtained from TAMs treated with oleamide resulted in a reduction of cell viability and initiation of apoptosis in MDA-MB-231 cells
In our study, we observed a shift of protumor M2-like tumor-associated macrophages (TAMs) towards antitumor M1-like TAM phenotypes following treatment with oleamide. This led us to hypothesize that oleamide might exert anti-tumor effects by enhancing the cytotoxicity of M1-like TAMs against tumor cells. To investigate this hypothesis, we collected conditioned media from co-cultured TAMs with or without oleamide and evaluated their anticancer activity on MDA-MB-231 cells over 72 h using the MTT assay. We found that conditioned media from untreated-TAMs promoted cancer cell proliferation at 48 and 72 h, whereas conditioned media from oleamide-treated TAMs significantly suppressed cancer cell proliferation at 24 and 48 h (Fig. 4A). To validate these findings, we treated MDA-MB-231 cells with conditioned media for 24 h and assessed apoptosis. We observed an increase in both early and late apoptotic cells when treated with conditioned media from oleamide-treated TAMs compared to untreated controls (Fig. 4C).
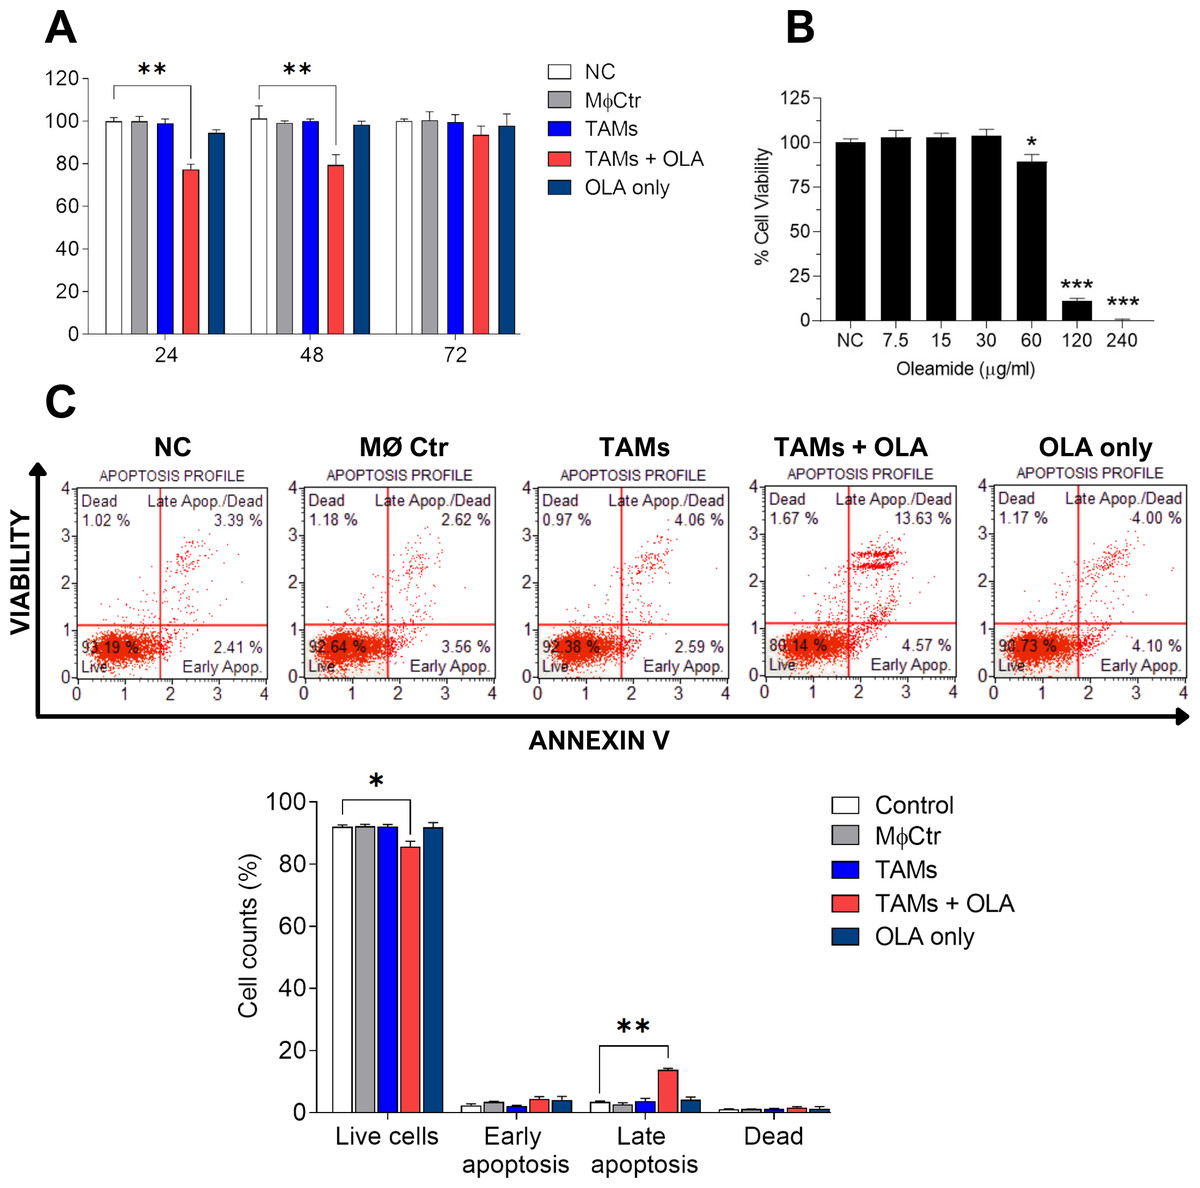
Figure 4: Effect of oleamide-treated TAM-conditioned medium on the viability and apoptosis of MDA-MB-231 cells.
(A) Viability of MDA-MB-231 cells following exposure to various conditions, including complete medium (NC), oleamide (20 µg/ml) in complete medium (OLA only), or conditioned medium obtained from untreated TAMs (TAMs), oleamide-treated TAMs (TAMs + OLA), or M0 macrophages (MØCtr). (B) Viability of MDA-MB-231 cells after exposure to varying concentrations of oleamide for 24 h. (C) Analysis of apoptosis in MDA-MB-231 cells following a 24-hour incubation period. The bar graph illustrates the percentage of cell counts as depicted in (C). The data are presented as the mean ± SEM of three independent experiments (∗p < 0.05,∗∗p < 0.01,∗∗∗p < 0.001). TAMs (tumor-associated macrophages), OLA (oleamide), and NC (negative control).
Additionally, we investigated the direct effect of oleamide on cancer cells by treating MDA-MB-231 cells with varying concentrations of oleamide for 24 h in complete medium. Oleamide exhibited a minimal increase in apoptotic cells at lower concentrations, but a more pronounced decrease in cell viability was observed at higher concentrations, with complete inhibition of cell viability at 240 µg/ml (Fig. 4B). These results suggest that oleamide’s anticancer activity may be mediated indirectly through the promotion of M1-like TAM phenotypes, enhancing their cytotoxicity against cancer cells.
Protein profiling between the TAMs and TAMs co-cultured with OLA
The proteomic analysis revealed 2,473 overlapping proteins identified in both TAMs and TAMs + OLA groups in donor AB, and 1,689 in donor O (Fig. 5). To determine statistical significance, a FDR of 0.05 was applied, with fold-changes considered significant when ≥ 2 and adjusted p-value <0.05. Among the significantly altered proteins, there were 90 upregulated proteins in donor AB and 102 upregulated proteins in donor O, while there were 176 downregulated proteins in donor AB and 147 downregulated proteins in donor O. The PPI network analysis and visualization were performed using Cytoscape software version 3.9.1 with stringApp from STRINGDB. A minimum required interaction score of ≥ 0.7 was applied to construct the network as shown in Figs. 6 and 7. The GO annotation analysis was performed to identify the most abundant up-and down-regulated proteins in both donors based on their cellular component, biological process, and molecular function. The results indicated that the organelle, protein-containing complex, and cytoplasm were the most affected cellular components. In terms of biological processes, the upregulated proteins were primarily involved in transport, whereas the downregulated proteins were mainly associated with positive regulation of biological processes and regulation of macromolecule metabolic processes. The analysis of molecular function revealed that the top three downregulated protein groups in the OLA treatment were heterocyclic compound binding, catalytic activity, and RNA binding. Table 1 presents the top 10 most up-regulated proteins identified in donor AB and O. Among the most up-regulated proteins in donor AB were Filaggrin, Perilipin-2 (Adipophilin), and Guanine nucleotide-binding protein G(I)/G(S)/G(O) subunit gamma-5, while the top three up-regulated proteins in donor O were haptoglobin (zonulin), Fibroblast growth factor receptor-like 1 (FGF receptor-like protein 1), and cyclin-dependent kinase-like 1. The top 10 most down-regulated proteins were presented in Table 2. Among the most down-regulated proteins in donor AB were matrix metalloproteinase-9 (MMP-9), HLA class I histocompatibility antigen, alpha chain F (CDA12), and interleukin-18 (IL-18), while with the donor O these were putative protein-lysine deacylase ABHD14B, protein mono-ADP-ribosyltransferase PARP14, and destrin (actin-depolymerizing factor) (ADF). The datasets generated during and/or analyzed during the current study are available in the Proteomics Identifications Database (PRIDE) repository, https://www.ebi.ac.uk/pride/archive/projects/PXD043461.
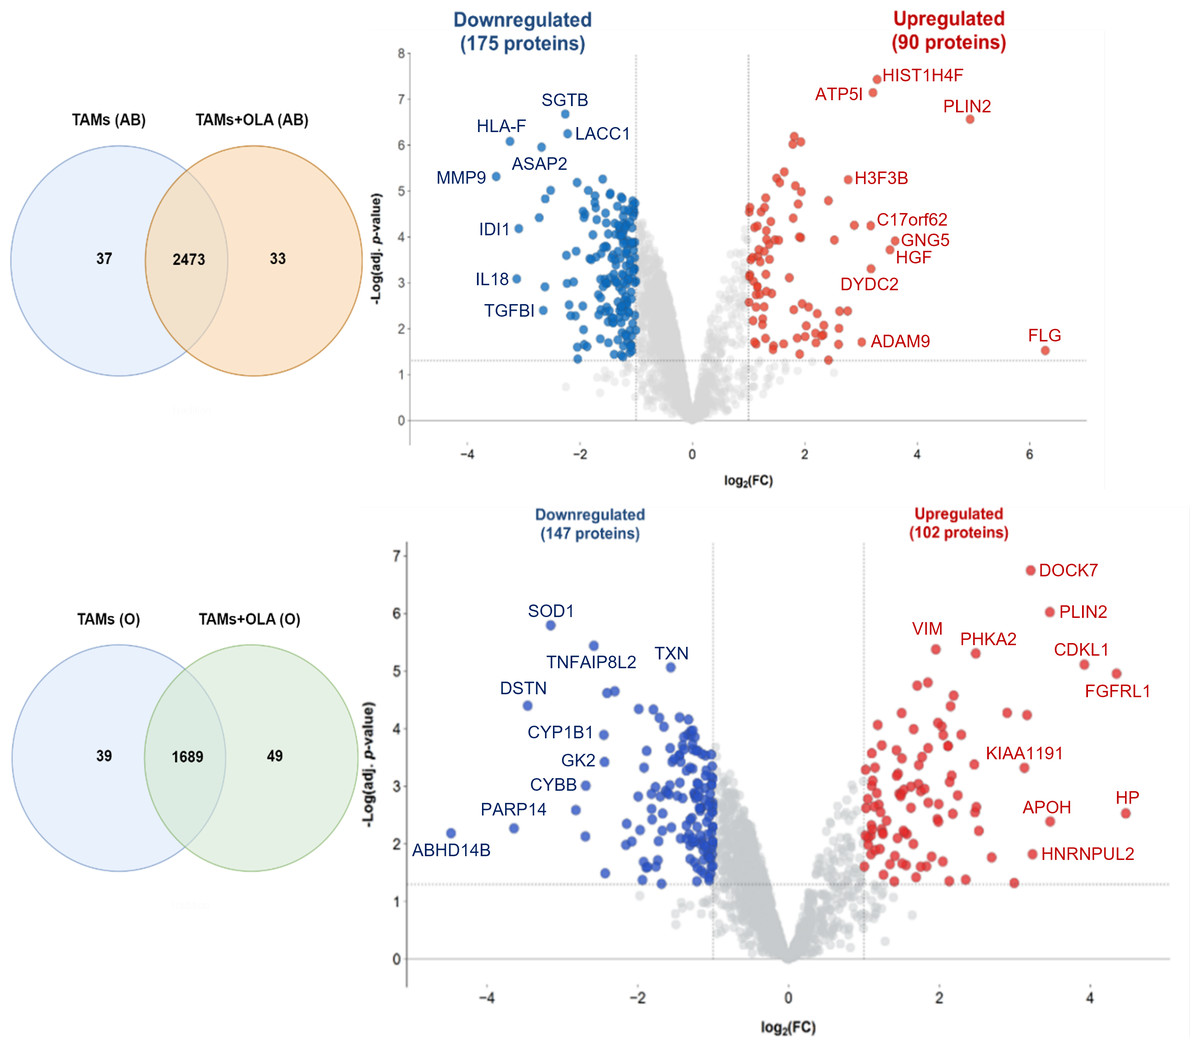
Figure 5: Venn diagrams and volcano plots of proteins identified from TAMs in two blood donors.
The Venn diagram shows the overlapping proteins identified in both upregulated (red dots) and downregulated (blue dots) groups between TAMs and TAMs+OLA treatments in two donors. Applying the fold-change cutoff of ≥ 2 and adjusted p-value < 0.05, a total of 90 upregulated proteins and 176 downregulated proteins were identified in donor AB, while 102 upregulated proteins and 147 downregulated proteins were found in donor O.
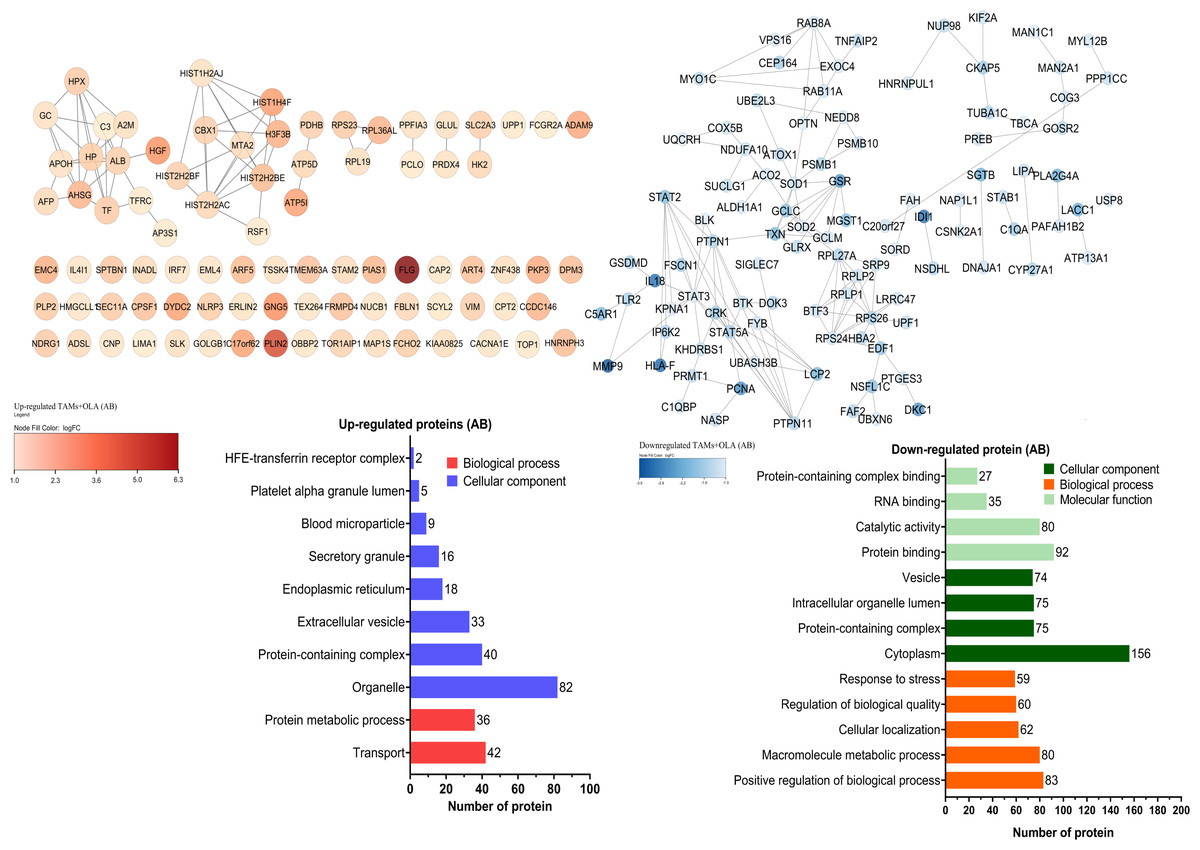
Figure 6: Protein–protein interaction networks and functional enrichmen analysis of significant proteins in donor AB.
The GO annotation of up-and down-regulated proteins in donor AB. The cellular component classification indicated that most of the affected proteins were situated in the cytoplasm, organelles, and vesicles. Furthermore, the proteins that were primarily affected by OLA treatment were those involved in positive regulation of biological processes, macromolecule metabolic processes, and transport. The results also suggested that OLA treatment significantly affected the molecular function of proteins, particularly in terms of their protein binding, catalytic activity, and RNA binding capabilities.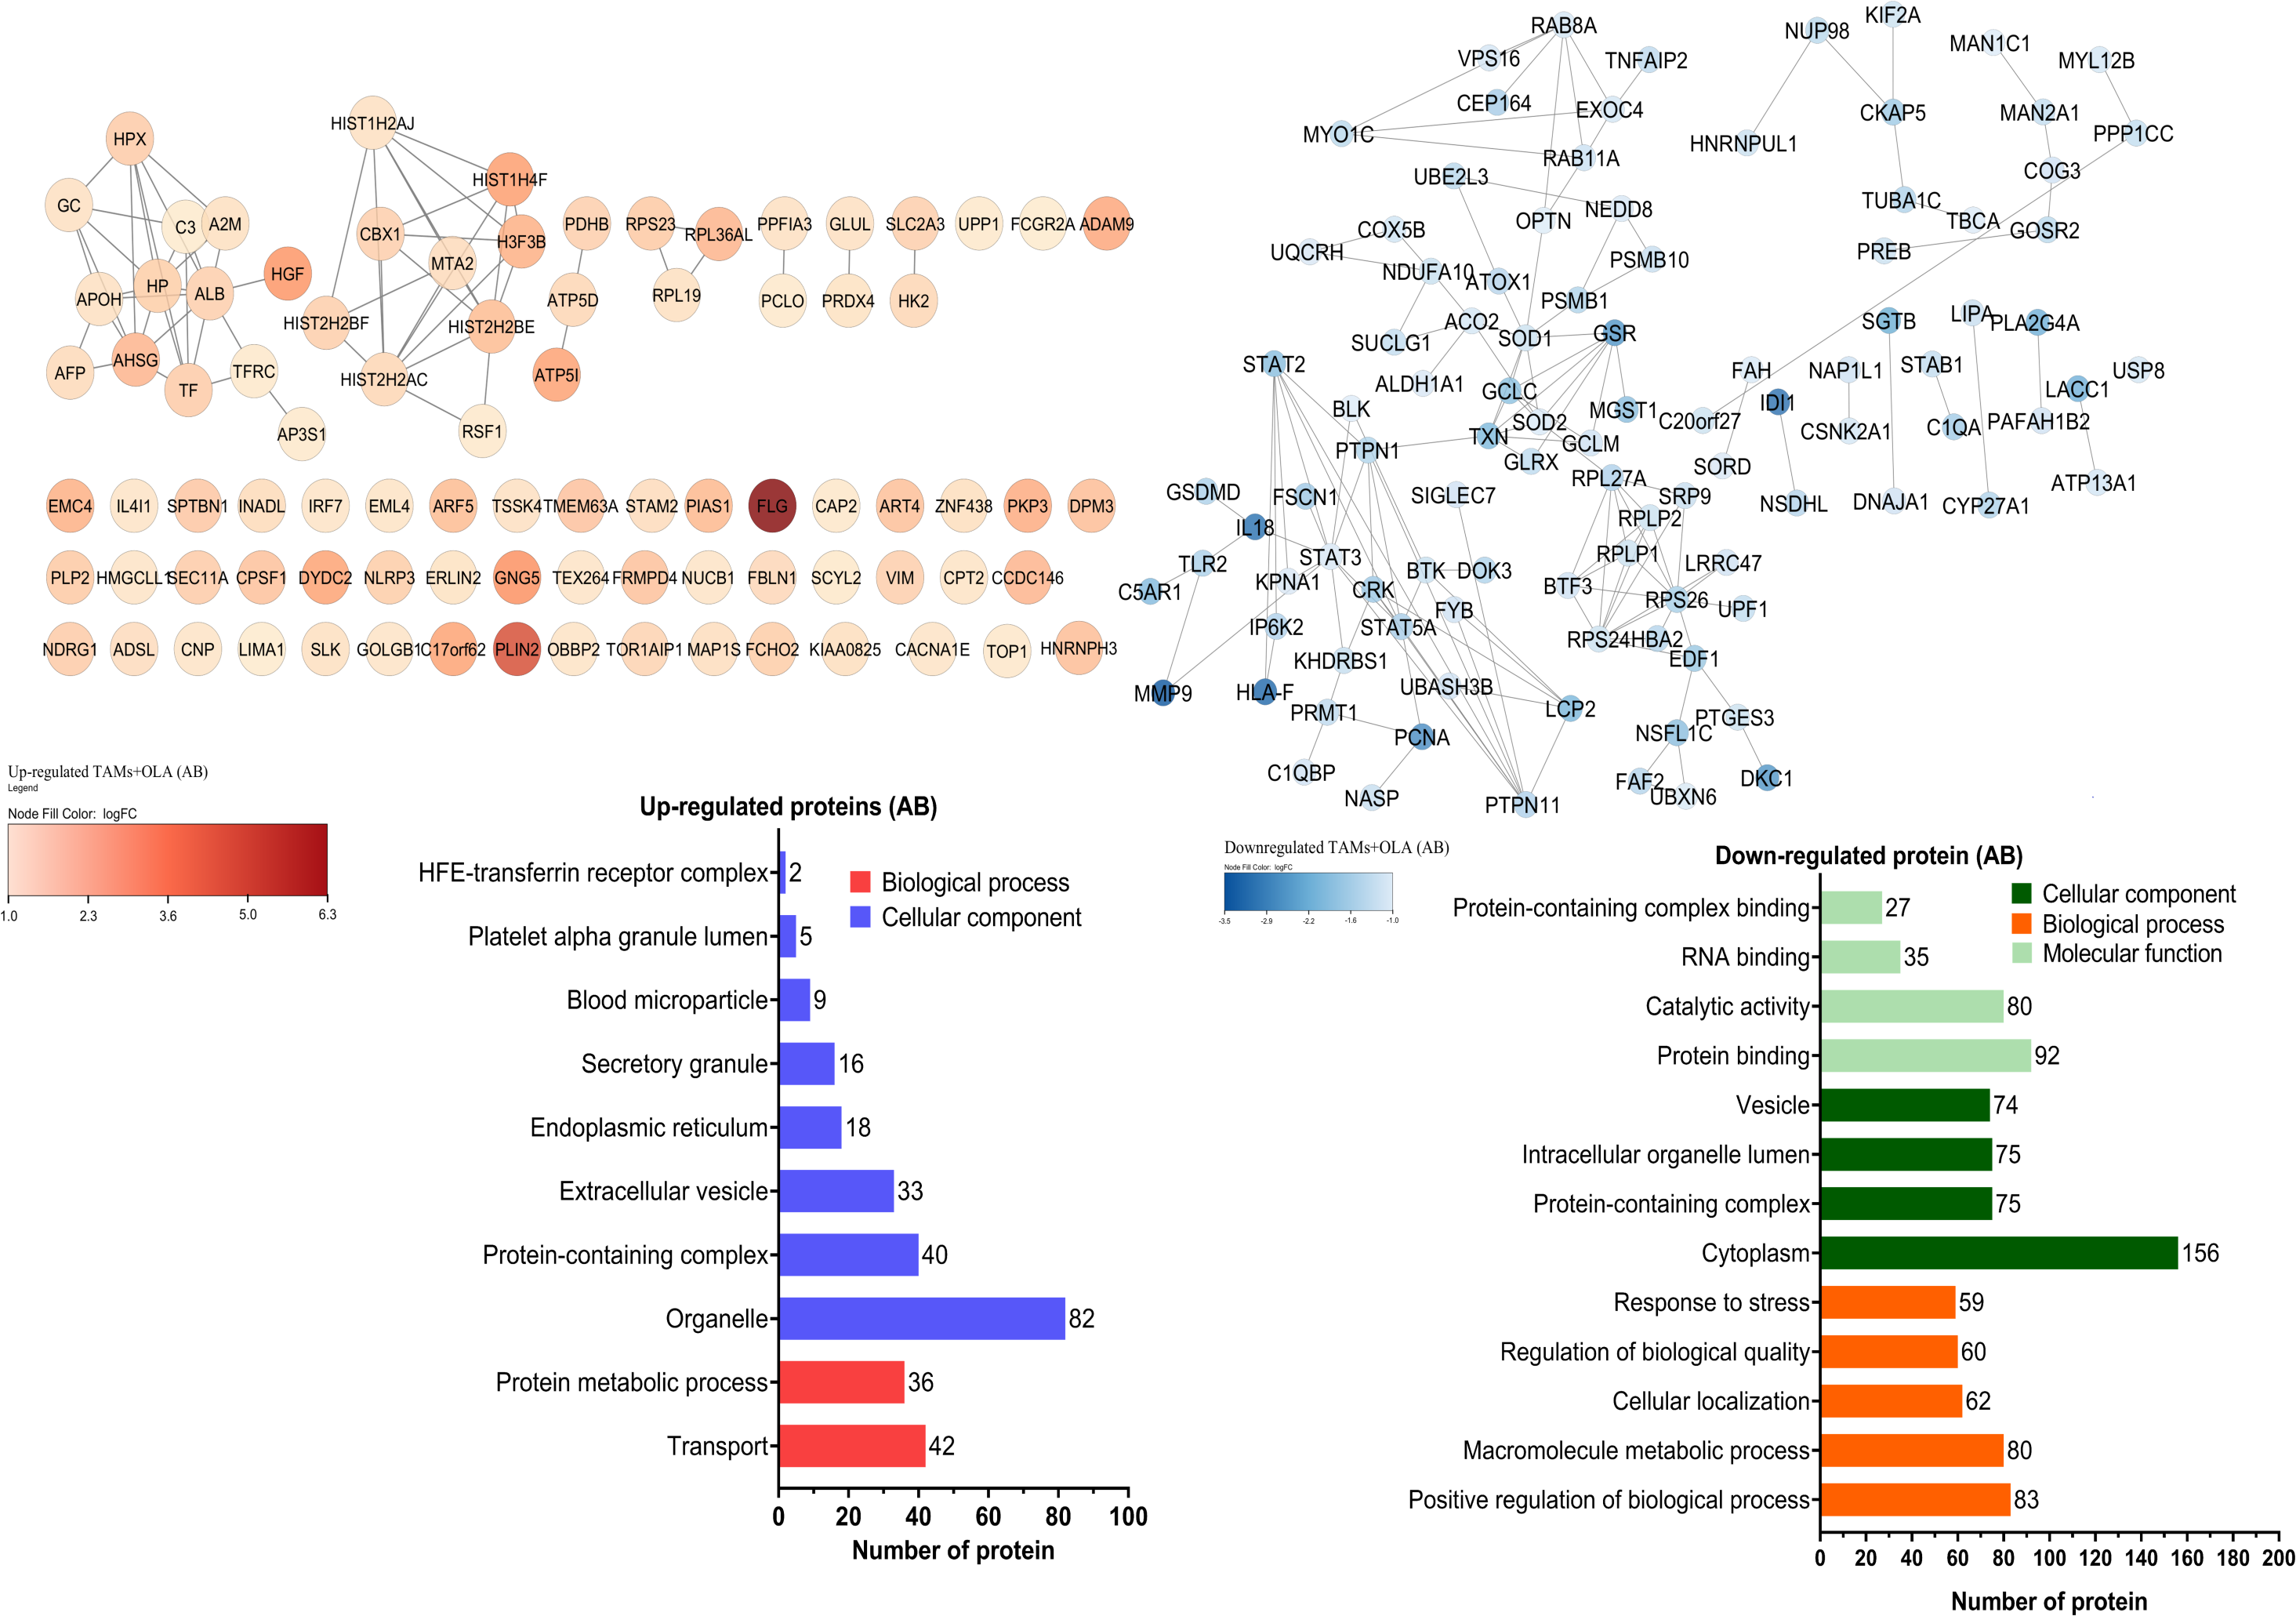
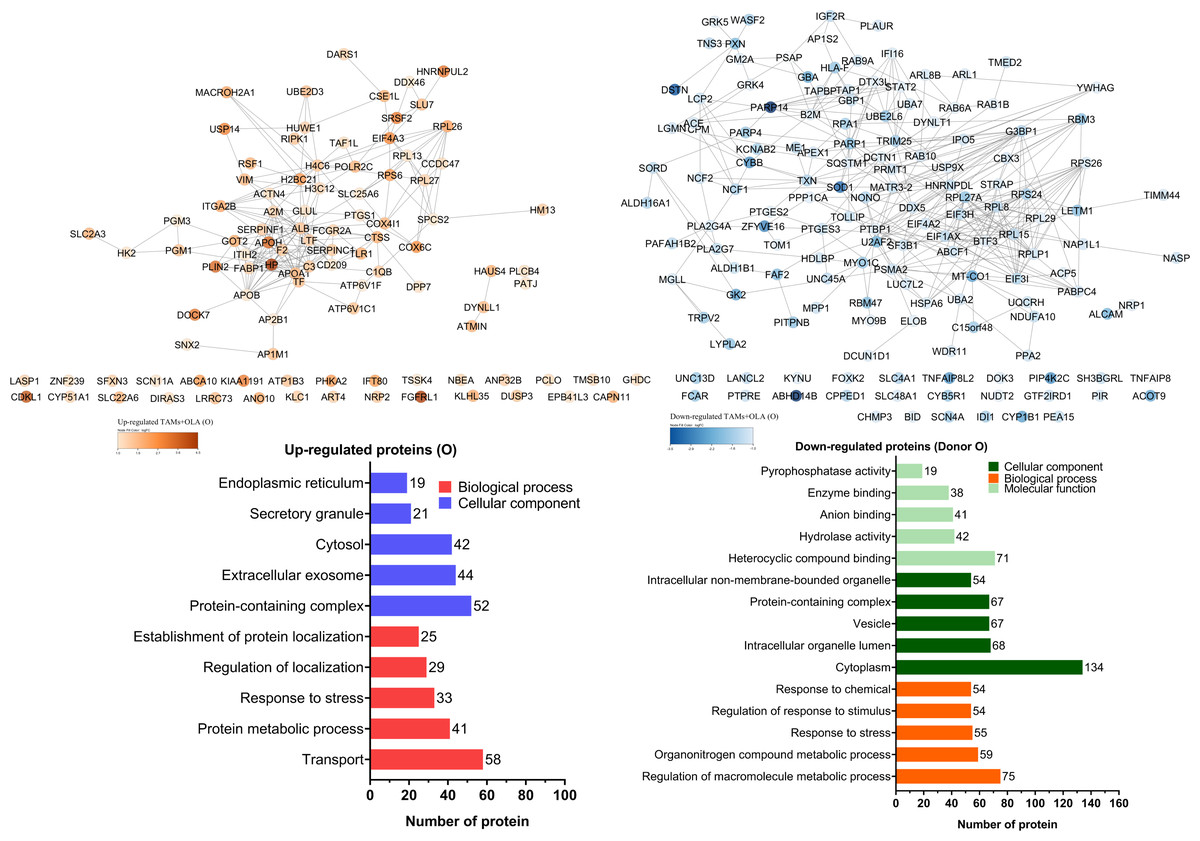
Figure 7: Protein–protein interaction networks and functional enrichmen analysis of significant proteins in (O).
GO annotation analysis was employed to examine the impact of donor O on the up- and down-regulation of proteins. The cellular component classification revealed that most affected proteins were in the cytoplasm, intracellular organelle lumen, and vesicles. Furthermore, the dominant proteins impacted by OLA treatment were involved in regulating macromolecule metabolic processes, organonitrogen compound metabolic process, and transport. OLA treatment also significantly influenced the molecular function of proteins, particularly with respect to their heterocyclic compound binding, hydrolase activity, and anion binding capabilities.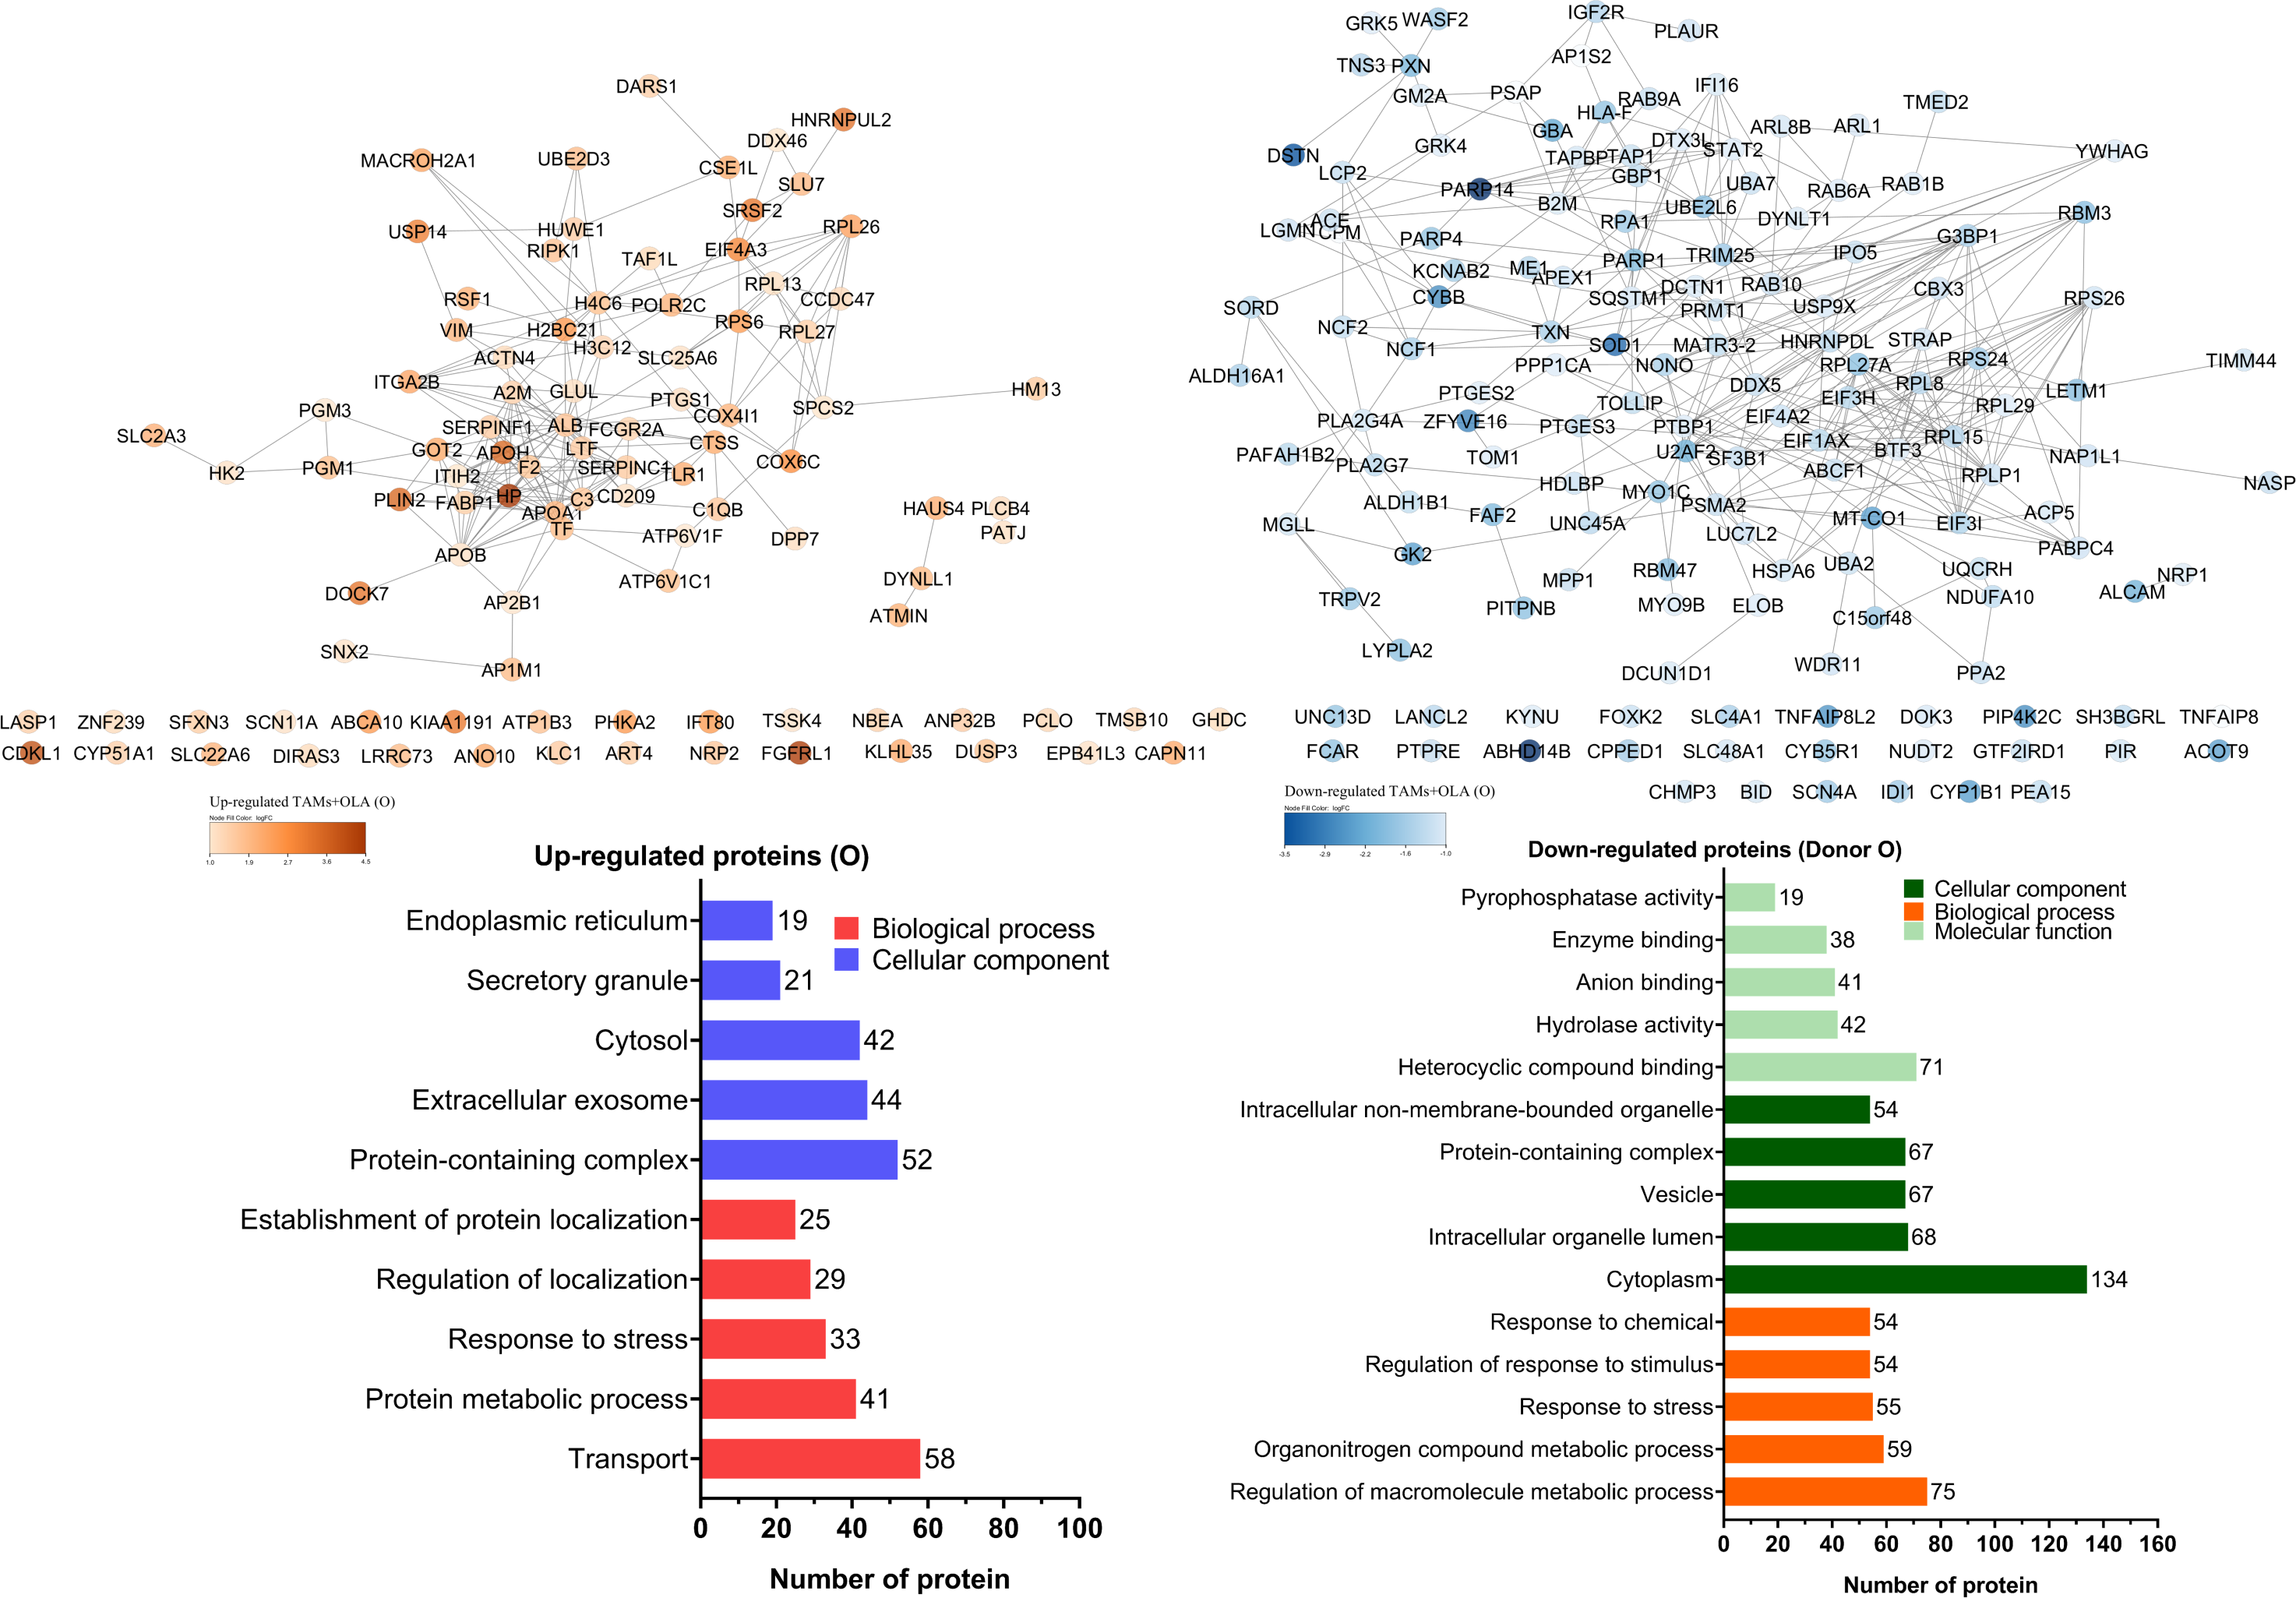
| Donor | Protein | Annotation | Log2 fold change | Adjustedp-value |
|---|---|---|---|---|
| AB | P20930 | Filaggrin | 6.276 | 0.030038586 |
| Q99541 | Perilipin-2 (Adipophilin) | 4.938 | 2.71943E−07 | |
| P63218 | Guanine nucleotide-binding protein G(I)/G(S)/G(O) subunit gamma-5 | 3.605 | 0.000122624 | |
| P14210 | Hepatocyte growth factor (Hepatopoietin-A) | 3.514 | 0.000190941 | |
| P62805 | Histone H4 | 3.285 | 3.69662E−08 | |
| P56385 | ATP synthase subunit e, mitochondrial (ATPase subunit e) | 3.211 | 7.15786E−08 | |
| Q96IM9 | DPY30 domain-containing protein 2 | 3.176 | 0.000494958 | |
| Q9BQA9 | Cytochrome b-245 chaperone 1 | 3.170 | 5.69886E−05 | |
| Q13443 | Disintegrin and metalloproteinase domain-containing protein 9 (ADAM 9) | 3.011 | 0.019705454 | |
| Q9Y446 | Plakophilin-3 | 2.879 | 5.58355E−05 | |
| O | P00738 | Haptoglobin (Zonulin) | 4.471 | 0.002942747 |
| Q8N441 | Fibroblast growth factor receptor-like 1 (FGF receptor-like protein 1) | 4.348 | 1.10425E−05 | |
| Q00532 | Cyclin-dependent kinase-like 1 | 3.921 | 7.68536E−06 | |
| P02749 | Beta-2-glycoprotein 1 (APC inhibitor) (Activated protein C-binding protein) | 3.468 | 0.004052982 | |
| Q99541 | Perilipin-2 (Adipophilin) | 3.464 | 9.4512E−07 | |
| Q1KMD3 | Heterogeneous nuclear ribonucleoprotein U-like protein 2 (Scaffold-attachment factor A2) | 3.235 | 0.015011281 | |
| Q96N67 | Dedicator of cytokinesis protein 7 | 3.209 | 1.7831E−07 | |
| Q01130 | Serine/arginine-rich splicing factor 2 (Protein PR264) | 3.161 | 5.76301E−05 | |
| Q96A73 | Putative monooxygenase p33MONOX | 3.127 | 0.000474342 | |
| P54578 | Ubiquitin carboxyl-terminal hydrolase 14 | 2.991 | 0.047368232 |
| Donor | Protein | Annotation | Log2 fold change | Adjustedp-value |
|---|---|---|---|---|
| AB | P14780 | Matrix metalloproteinase-9 (MMP-9) | −3.489 | 4.83496E−06 |
| P30511 | HLA class I histocompatibility antigen, alpha chain F (CDA12) | −3.244 | 8.27612E−07 | |
| Q14116 | Interleukin-18 (IL-18) | −3.125 | 0.000823613 | |
| Q13907 | Isopentenyl-diphosphate Delta-isomerase 1 | −3.087 | 6.59727E−05 | |
| P12004 | Proliferating cell nuclear antigen (PCNA) | −2.725 | 3.81467E−05 | |
| O43150 | Arf-GAP with SH3 domain, ANK repeat and PH domain-containing protein 2 | −2.683 | 1.10482E−06 | |
| Q15582 | Transforming growth factor-beta-induced protein ig-h3 (Beta ig-h3) | −2.653 | 0.003999883 | |
| O60832 | H/ACA ribonucleoprotein complex subunit DKC1 | −2.622 | 0.001226448 | |
| P00390 | Glutathione reductase, mitochondrial (GR) (Grase) | −2.616 | 1.4799E−05 | |
| Q9C002 | Normal mucosa of esophagus-specific gene 1 protein (Protein FOAP-11) | −2.522 | 9.67433E−06 | |
| O | Q96IU4 | Putative protein-lysine deacylase ABHD14B | −4.475 | 0.006478591 |
| Q460N5 | Protein mono-ADP-ribosyltransferase PARP14 | −3.641 | 0.005335289 | |
| P60981 | Destrin (Actin-depolymerizing factor) (ADF) | −3.459 | 3.97402E−05 | |
| P00441 | Superoxide dismutase [Cu-Zn] | −3.154 | 1.59527E−06 | |
| Q7Z3T8 | Zinc finger FYVE domain-containing protein 16 (Endofin) | −2.821 | 0.00257461 | |
| Q8TBX8 | Phosphatidylinositol 5-phosphate 4-kinase type-2 gamma | −2.694 | 0.007376605 | |
| P04839 | Cytochrome b-245 heavy chain | −2.688 | 0.00097136 | |
| Q6P589 | Tumor necrosis factor alpha-induced protein 8-like protein 2 (TIPE2) | −2.581 | 3.62855E−06 | |
| Q16678 | Cytochrome P450 1B1 | −2.449 | 0.000127442 | |
| Q14410 | Glycerol kinase 2 (GK 2) | −2.440 | 0.000376778 |
Identification and prediction of target protein responsible for macrophage polarization
To further elucidate the proteins associated with macrophage polarization, a comprehensive analysis was conducted on the proteins overlapping between donor AB and O using Enrichr-KG. The resulting proteins were clustered based on their involvement in GO biological processes, KEGG pathways, and overlapping gene terms, as illustrated in Fig. 8. Among the 21 up-regulated proteins identified, Table 3 presents the top 10 signaling pathways and overlapping genes that exhibited significant associations. These pathways include systemic lupus erythematosus, neutrophil extracellular trap formation, leishmaniasis, complement and coagulation cascades, Staphylococcus aureus infection, neomycin, kanamycin and gentamicin biosynthesis, HIF-1 signaling pathway, phagosome, tuberculosis, and nitrogen metabolism. While the 39 down-regulated proteins were identified, Table 4 presents the top 10 signaling pathways and overlapping genes that exhibited significant associations. These pathways include coronavirus disease, ribosome, oxidative phosphorylation, ether lipid metabolism, arachidonic acid metabolism, Fc epsilon RI signaling pathway, Parkinson’s disease and prion disease.
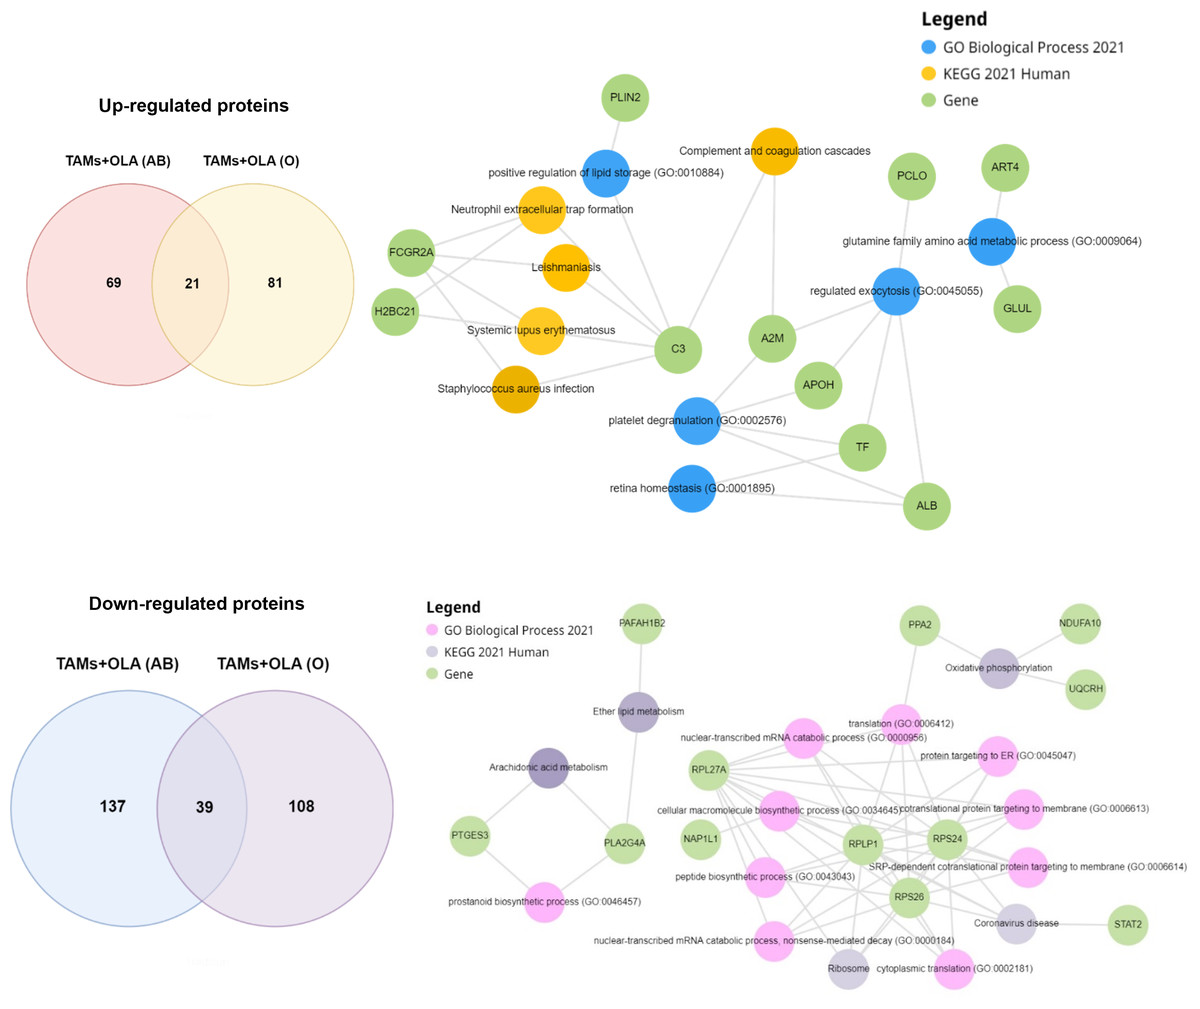
Figure 8: Functional enrichment analysis of up-and down-regulated proteins using enrichr-KG.
| Identifier | Term | p-value | q-value | Overlap gene |
|---|---|---|---|---|
| hsa05322 | Systemic lupus erythematosus | 0.0004 | 0.0187 | C3, FCGR2A, H2BC21 |
| hsa04613 | Neutrophil extracellular trap formation | 0.0010 | 0.0248 | C3, FCGR2A, H2BC21 |
| hsa05140 | Leishmaniasis | 0.0029 | 0.0421 | C3, FCGR2A |
| hsa04610 | Complement and coagulation cascades | 0.0036 | 0.0421 | C3, A2M |
| hsa05150 | Staphylococcus aureus infection | 0.0044 | 0.0421 | C3, FCGR2A |
| hsa00524 | Neomycin, kanamycin and gentamicin biosynthesis | 0.0052 | 0.0421 | HK2 |
| hsa04066 | HIF-1 signaling pathway | 0.0058 | 0.0421 | TF, HK2 |
| hsa04145 | Phagosome | 0.0110 | 0.0699 | C3, FCGR2A |
| hsa05152 | Tuberculosis | 0.015119 | 0.085672 | C3, FCGR2A |
| hsa00910 | Nitrogen metabolism | 0.017708 | 0.087929 | GLUL |
| Identifier | Term | p-value | q-value | Overlap gene |
|---|---|---|---|---|
| hsa05171 | Coronavirus disease | 0.0001 | 0.0072 | RPS26, STAT2, RPL27A, RPLP1, RPS24 |
| hsa03010 | Ribosome | 0.0002 | 0.0107 | RPS26, RPL27A, RPLP1, RPS24 |
| hsa00190 | Oxidative phosphorylation | 0.0022 | 0.0632 | PPA2, NDUFA10, UQCRH |
| hsa00565 | Ether lipid metabolism | 0.0041 | 0.0884 | PLA2G4A, PAFAH1B2 |
| hsa00590 | Arachidonic acid metabolism | 0.0063 | 0.1085 | PTGES3, PLA2G4A |
| hsa04664 | Fc epsilon RI signaling pathway | 0.0078 | 0.1115 | PLA2G4A, LCP2 |
| hsa05012 | Parkinson disease | 0.0125 | 0.1539 | NDUFA10, TXN, UQCRH |
| hsa00564 | Glycerophospholipid metabolism | 0.015653 | 0.152949 | LYPLA2, PLA2G4A |
| hsa05020 | Prion disease | 0.0160 | 0.1721 | NDUFA10, UQCRH, SOD1 |
| hsa05016 | Huntington disease | 0.021599 | 0.170731 | NDUFA10, UQCRH, SOD1 |
The differential gene set expression in both TAMs and oleamide-treated TAMs
The GSEA analysis showed that oleamide-treated TAMs were positively associated with several gene sets, such as HIF-1 transcription factor (TF) pathway and regulation of insulin-like growth factor (IGF) transport and uptake by insulin-like growth factor binding proteins (IGFBPs), as shown in Fig. 9. The expression levels of several genes (red cells) matched the expression levels of the genes ranked by Enrichr-KG in Table 3. These genes were hexokinase-2 (HK2), H2B clustered histone 21 (H2BC21), complement C3 (C3), and transferrin (TF). This showed the consistency of the outcomes from both tools for over-presentation analysis. The statistic of each gene set is show in Table 5. Other gene sets, including systemic lupus erythematosus, response to elevated platelet cytosolic ca2, transcriptional regulation by small RNAs, gene silencing by RNA, Rho GTPases activate protein kinases N (PKNs), reproduction, and HIF-1 targets and the detail of gene names in each gene set can be found in Files S2–S12.
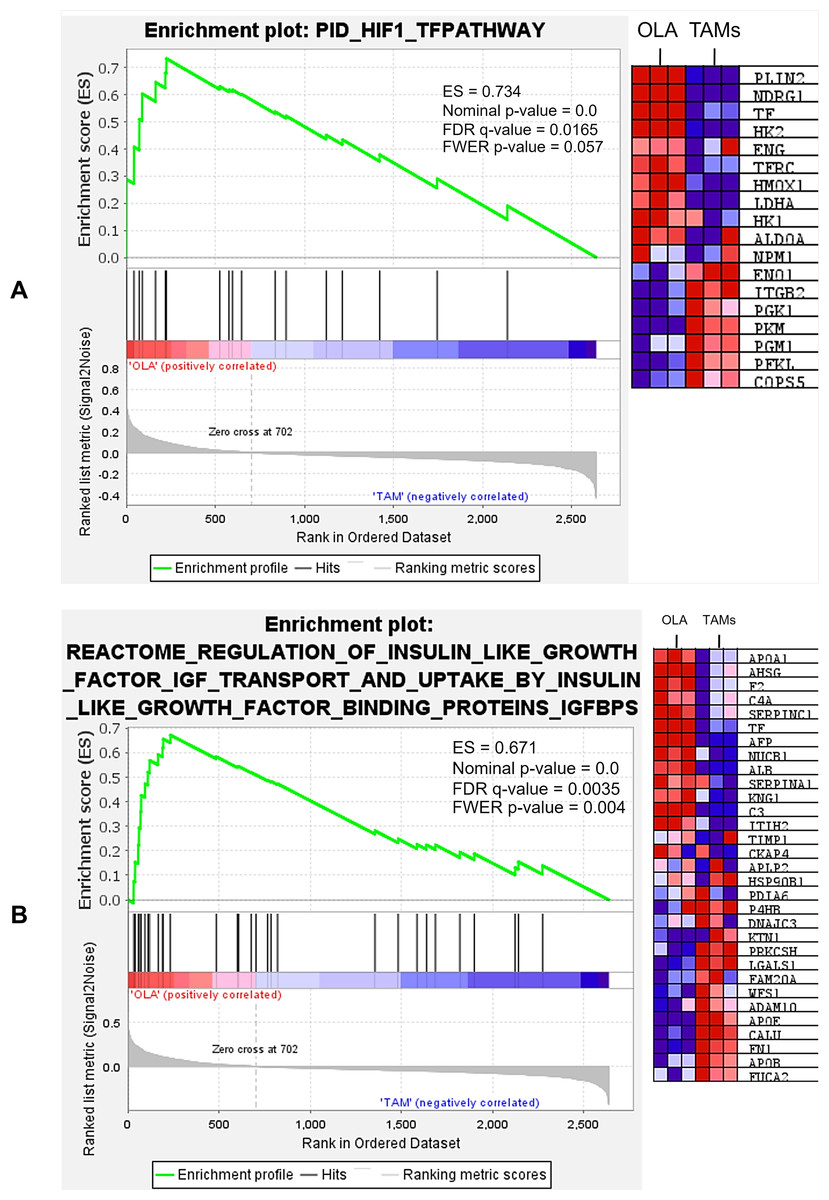
Figure 9: Representative gene sets included those involved in the HIF-1 transcription factor (TF) pathway (A), as well as the regulation of insulin-like growth factor (IGF) transport and uptake via insulin-like growth factor binding proteins (IGFBPs) (B).
The analysis demonstrated significant enrichment of differentially expressed genes (DEGs) in multiple gene sets, a complete list of enriched gene sets can be found in Files S2–S12.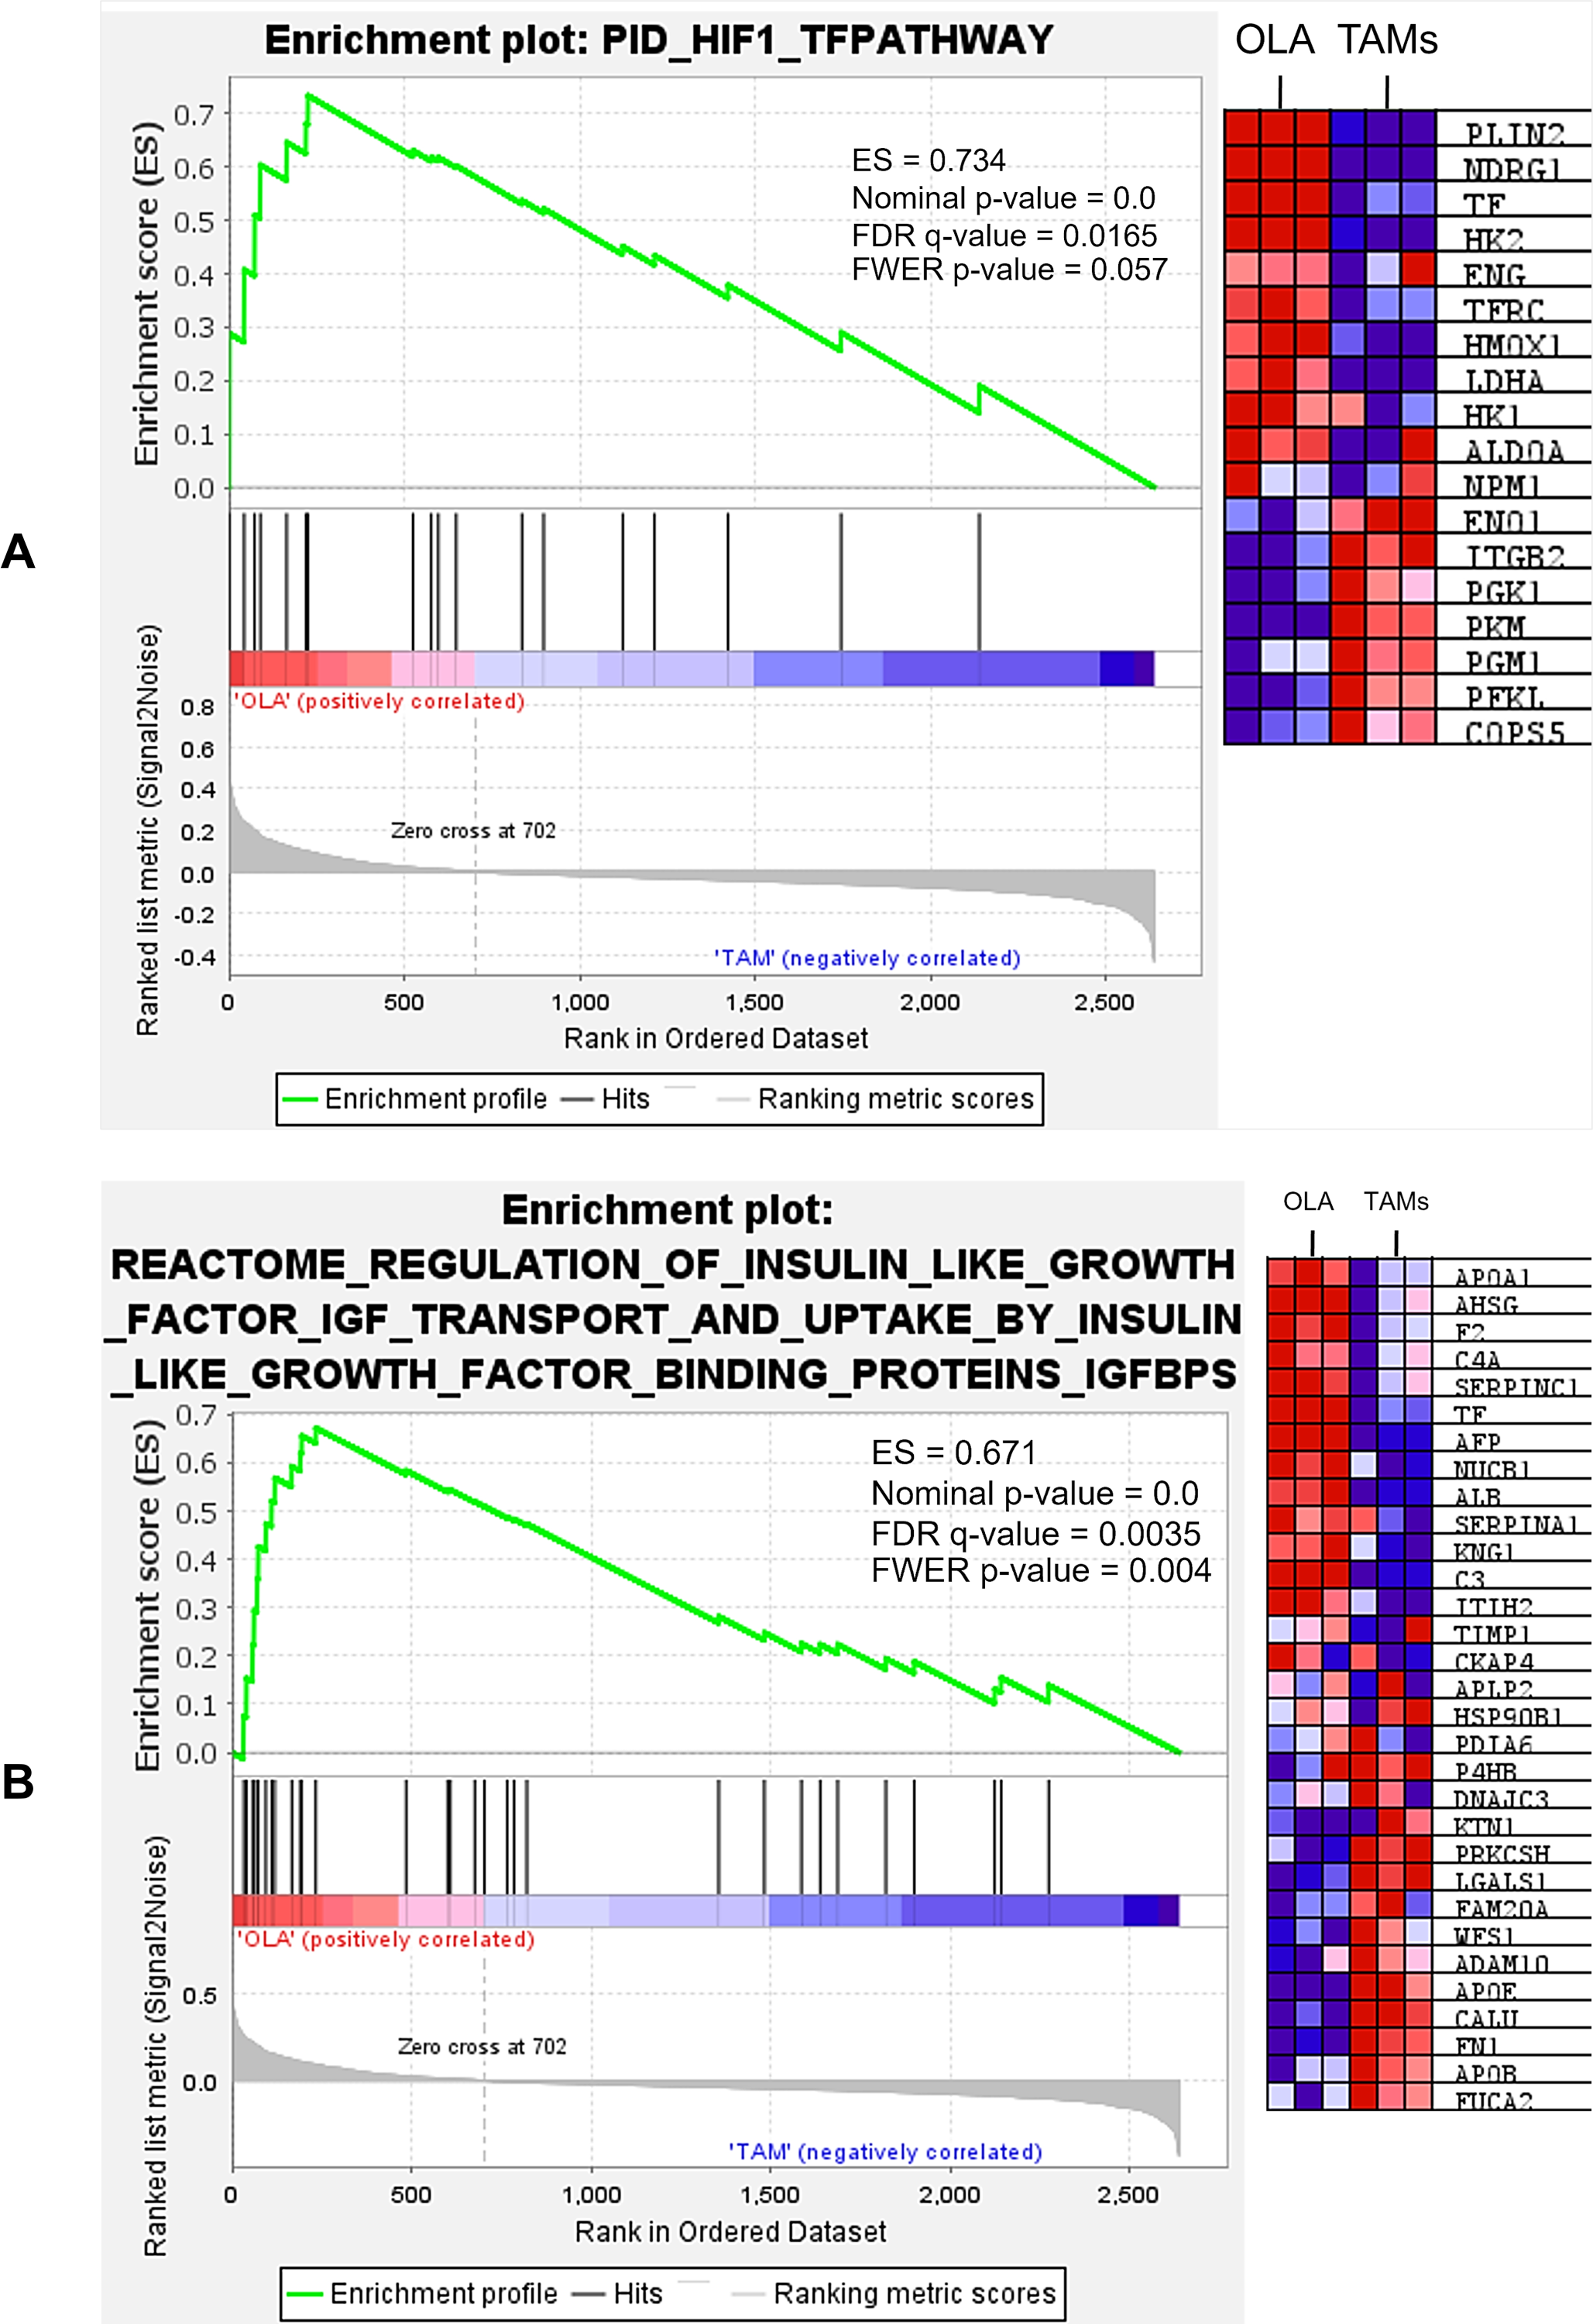
| Gene set | Enrichment score (ES) | Nominalp-value | False discovery rate (FDR) q-value | Family-wise error rate (FWER) |
|---|---|---|---|---|
| (Reactome) Regulation of insulin-like growth factor (IGF) transport and uptake by insulin-like growth factor binding proteins (IGFBPs) | 0.6716 | 0.000 | 0.0020 | 0.0020 |
| (KEGG) Systemic lupus erythematosus | 0.6334 | 0.000 | 0.0161 | 0.037 |
| (PID) HIF-1 TF pathway | 0.7341 | 0.000 | 0.0165 | 0.057 |
| (Reactome) Response to elevated platelet cytosolic Ca2 | 0.5282 | 0.000 | 0.061 | 0.244 |
| (Reactome) Transcriptional regulation by small RNAs | 0.6900 | 0.000 | 0.0644 | 0.301 |
| (Reactome) Gene silencing by RNAs | 0.6838 | 0.000 | 0.0730 | 0.394 |
| (Reactome) Rho GTPases activate PNKs | 0.6475 | 0.000 | 0.0634 | 0.398 |
| Reactome (Reproduction) | 0.6712 | 0.0030 | 0.0793 | 0.524 |
| (Semenza) HIF-1 targets | 0.6649 | 0.000 | 0.0795 | 0.568 |
| (WP) Sudden infant death syndrome (SIDs) susceptibility pathways | 0.5762 | 0.000 | 0.0739 | 0.578 |
| (Reactome) Chromatin modifying enzymes | 0.5977 | 0.0030 | 0.0951 | 0.704 |
Molecular docking analysis of selected proteins
Based on the identification of the top 10 significantly up- and down-regulated terms presented in Tables 3 and 4, candidate proteins were selected based on their functional toward M1-macrophage polarization for further investigation on binding to oleamide. Docking analysis was conducted using oleamide (PubChem CID 5283387) as the ligand, focusing on the candidate up-regulated proteins including hexokinase-2 (HK2) (PDB ID: 2NZT), as well as proteins involved in their interaction, such as solute carrier family 2 member 1 (SLC2A1) (PDB ID: 5EQG), solute carrier family 2 member 4 (SLC2A4) (PDB ID: 7WSM), transferrin receptor protein 1 (TFRC) (PDB ID: 6OKD), serine/threonine-protein kinase mTOR (MTOR) (PDB ID: 3FAP) and hypoxia-inducible factor 1-alpha (HIF1A) (PDB ID: 1H2K). Additionally, the analysis encompassed the examination of down-regulated proteins, namely prostaglandin E synthase 3 (PTGES3) (PDB ID: 1EJF), signal transducer and activator of transcription 2 (STAT2) (PDB ID: 6UX2), and nucleosome assembly protein 1 like 1 (NAP1L1) (PDB ID: 7UN6). The docking analysis between oleamide and the selected candidate proteins was visualized through 2D and 3D structures, as depicted in Fig. 10. Detailed information regarding the binding affinity was evaluated by assessing parameters such as docking score, the number of hydrogen bonds formed, and the interactions with specific amino acids. A comprehensive summary of these relevant parameters is presented in Table 6.
Figure 10: Molecular docking analysis of selected upregulated and downregulated proteins.
| No. | Protein name | Docking score | No. of hydrogen bond formed | Interacting amino acid of OLA |
|---|---|---|---|---|
| 1 | Hexokinase-2 | −4.983 | 3 | PHE67, LYS162, LEU163, LEU463, ARG470, ASP814 |
| 2 | Serine/threonine-protein kinase mTOR | −6.166 | 1 | TYR26 PHE46 GLU54 TRP59 PHE128 TYR194 |
| 3 | Solute carrier family 2-member 1 (GLUT1) | −5.833 | 3 | PHE26, THR30, ASN288, TRP388, TRP412, ASN415 |
| 4 | Solute carrier family 2 member 4 | −4.99 | 2 | THR78 ILE313 PHE438 GLN439 ALA442 |
| 5 | Hypoxia-inducible factor 1-alpha | −5.763 | 2 | TYR93 LEU101 TYR102 TYR103 LEU188 HIS199 PHE207 HIS279 ILE281 TRP296 |
| 6 | Transferrin receptor protein 1 | −5.483 | 2 | THR192 PRO193 TRP523 TRP622 |
| 7 | Prostaglandin E synthase 3 | −4.834 | 1 | PHE56 SER34 ILE53 LYS91 ALA94 LEU96 |
| 8 | Signal transducer and activator of transcription 2 | −5.379 | 2 | GLU139 GLN142 LYS234 TRP238 LEU258 TRP261 |
| 9 | Nucleosome assembly protein 1 like 1 | −7.052 | 2 | PHE95 ALA107 TYR110 GLN111 VAL201 PHE203 ILE335 PRO336 |
Discussion
Tumor-associated macrophages (TAMs) play a crucial role in tumor development and progression within the tumor microenvironment (Pan et al., 2020). Traditionally, TAMs have been associated with an immunosuppressive M2 phenotype, also known as M2-like TAMs, which is linked to more aggressive tumor behavior, including invasion, progression, and metastasis (Pan et al., 2020; Zhou et al., 2020). However, TAMs exhibit a spectrum of phenotypes, encompassing characteristics of both M2 and M1-like phenotypes (Pan et al., 2020; Zhou et al., 2020). The M1-like TAMs possess antitumor properties and can selectively identify tumor cells while triggering mechanisms to eliminate them (Pan et al., 2020; Zhou et al., 2020). Clinical evidence suggests that higher levels of M2-like TAMs are associated with tumor progression and resistance to treatment, whereas higher levels of M1-like TAMs are correlated with positive outcomes to treatment (Lv et al., 2022; Oshi et al., 2020; Zhang et al., 2014). Therefore, targeting the polarization state of TAMs by shifting the immunosuppressive M2 phenotype towards the tumoricidal M1-like TAM phenotype holds great promise for enhancing cancer therapies.
Oleamide, a fatty acid amide, is well-known for its sleep-inducing properties and involvement in CNS functions (Boger, Henriksen & Cravatt, 1998; Maya-López et al., 2020; Mendelson & Basile, 2001; Verdon et al., 2000). Recent studies have explored the anti-cancer potential of oleamide, particularly in MDA-MB-231 breast cancer cells, which are representative of triple-negative breast cancer (TNBC). TNBC is characterized by the absence of estrogen receptor, progesterone receptor, and human epidermal growth factor receptor 2 (HER2), making it less responsive to targeted therapies (Kumar & Aggarwal, 2016). Patients with TNBC often have poor prognoses, and survival rates after metastasis are lower compared to other breast cancer subtypes (Foulkes, Smith & Reis-Filho, 2010; Kumar & Aggarwal, 2016). Consequently, the MDA-MB-231 cell line is frequently used as a model for highly aggressive and invasive breast cancer. In 2020, research demonstrated that oleamide induces apoptosis and cell cycle arrest in MDA-MB-231 cells, highlighting its anti-cancer properties (Wisitpongpun et al., 2020). Furthermore, in 2022, oleamide was found to possess immunomodulatory effects, inducing the polarization of naïve primary human macrophages into M1 macrophages via the NLRP3 inflammasome pathway (Wisitpongpun, Potup & Usuwanthim, 2022). This is significant as M1 macrophages play a crucial role in bacterial clearance, inflammation induction, and anti-cancer activity, particularly in the context of M1-like tumor-associated macrophages (TAMs) (Pan et al., 2020; Zhou et al., 2020).
However, the regulatory effects of oleamide on human TAM polarization and its impact on cancer progression remain unexplored. In this study, we aimed to investigate the ability of oleamide to reprogram M2-like TAMs towards tumoricidal M1-like phenotypes using a transwell co-culture model of primary human MDMs and MDA-MB-231 cells.
We selected the MDA-MB-231 cell line for this study for several compelling reasons. Previous research has specifically demonstrated the anti-cancer effects of oleamide against MDA-MB-231 cells, making it an appropriate and relevant model for further investigation. Moreover, the MDA-MB-231 cell line is extensively utilized in the generation of TAMs by co-culturing the culture medium with THP-1 cells (Benner et al., 2019; Hollmén et al., 2015; Pe et al., 2022). These provided a reliable model for our investigation into the reprogramming potential of oleamide on TAMs.
From Transwell co-culture, we observed that low dose of oleamide treatment led to the suppression of IL-10 production and downregulation of VEGFA, c-Myc, and CD206 expressions, while inducing the expression of the HLA-DR. Additionally, proteomic analysis identified 20 candidate proteins that play pivotal roles in oleamide-mediated regulation of M1 macrophage polarization.
To establish an in vitro model for studying TAM functions, we employed a modified protocol for the generation of TAMs from peripheral blood human monocytes using a Transwell co-culture with MDA-MB-231 breast cancer cells (Fig. 1). Our findings revealed that co-culturing human monocytes with MDA-MB-231 cells in the presence of M-CSF, IL-4, and IL-10 strongly induced the expression of c-Myc, VEGFA, MMP-9, and CD206 genes. Furthermore, co-culture of monocytes and MDA-MB-231 cells in a complete medium promoted the polarization of monocytes towards M2-like TAM phenotypes, as evidenced by upregulated expression of MMP-9 and VEGFA, while c-Myc and CD206 gene expressions remained unaltered. These findings are consistent with previous studies, including the work by Hollmén et al. (2015) which demonstrated that MDA-MB-231 cells can induce the differentiation of human monocytes into M2-like macrophages, characterized by increased macrophage mannose receptor (MMR) protein expression and C-C motif chemokine ligand 2 (CCL2) secretion, using a Transwell co-culture system. However, it should be noted that TAM activation also involves T-helper 2 cytokines such as IL-4 and IL-13, as well as immunosuppressive cytokines like IL-10 and transforming growth factor beta (TGF-β), indicating the need for additional cytokines for the full differentiation of TAMs.
To generate TAM-like cells, the cultivation of monocytes in tumor-conditioned medium is a commonly employed and straightforward method. We co-cultured monocytes and MDA-MB-231 cells using a 1:1 ratio of tumor-conditioned medium to complete medium, supplemented with M-CSF, IL-4, and IL-10. Notably, co-culturing monocytes in complete medium with cytokines resulted in a more significant increase in the expression of c-Myc, VEGFA, MMP9, and CD206 genes compared to co-culturing with tumor-conditioned medium (Fig. 2B). This suggests that the addition of tumor-conditioned medium is not essential for generating TAMs using our Transwell co-culture model. Overall, our findings indicate that the Transwell co-culture approach, along with the inclusion of M-CSF, IL-4, and IL-10, is an effective strategy for in vitro TAM production.
Oleamide, also known as cis-9,10-octadecenoamide, belongs to a class of endogenous lipid signaling molecules and was initially recognized for its sleep-inducing properties (Boger, Henriksen & Cravatt, 1998). Subsequently, oleamide was identified as a neuromodulator that interacts with various neurotransmitter receptors, including those for dopamine, acetylcholine, serotonin, gamma-aminobutyric acid (GABA), and cannabinoids (Boger, Henriksen & Cravatt, 1998; Maya-López et al., 2020; Mendelson & Basile, 2001; Verdon et al., 2000). Moreover, oleamide possesses anticancer properties, inducing apoptosis in different cancer cell lines, such as MDA-MB-231 breast cancer cells, SSC-15 squamous cell carcinoma, and K-562 myelogenous leukemia cells (Wisitpongpun et al., 2020). Recent studies have also demonstrated the immunomodulatory activity of oleamide by promoting M1 macrophage polarization in primary human macrophages (Wisitpongpun, Potup & Usuwanthim, 2022). Building upon these reports, we investigated the effect of oleamide (20 µg/ml) on TAM polarization. Our study revealed that oleamide treatment induced the reprogramming of M2-like TAMs towards M1-like TAM phenotypes, as evidenced by the suppression of c-Myc, VEGFA, and CD206 gene expressions, along with the upregulation of HLA-DR, a gene associated with M1-like TAMs (Fig. 3A). This concentration was shown to be non-toxic to cancer cells (Fig. 4A). Generally, M1-like TAMs are characterized by the secretion of pro-inflammatory cytokines such as IL-6, IL-12, IL-23, and TNF-α, which contribute to pro-inflammatory activities (Zheng et al., 2017). Conversely, M2-like TAMs exhibit high expression levels of immunosuppressive molecules, including IL-10, TGF-β, and programmed death-ligand 1 (PD-L1), which are associated with cancer progression. Notably, our results demonstrated that oleamide-treated TAMs suppressed the production of IL-10 (Fig. 3B), supporting the notion that oleamide promotes M1-like TAM polarization.
M1-like TAMs exhibit anti-tumorigenic properties and employ multiple mechanisms to recognize and eliminate tumor cells. These mechanisms include direct killing through the release of mediators including tumor necrosis factor (TNF), nitric oxide (NO), and reactive oxygen species (ROS), as well as phagocytosis of cancer cells. Additionally, M1-like TAMs can induce cancer cell cytolysis via antibody-dependent cellular cytotoxicity (ADCC) and activate other immune cells such as natural killer (NK) cells and T cells (Aminin & Wang, 2021; Pan et al., 2020; Zhou et al., 2020). Intriguingly, we found that conditioned medium obtained from 20 µg/ml oleamide-treated TAMs suppressed the proliferation of MDA-MB-231 cells at 24 and 48 h (Fig. 4A). Flow cytometry analysis revealed that the conditioned medium from oleamide-treated TAMs induced apoptosis in MDA-MB-231 cells after 24 h of treatment, while these 20 µg/ml oleamide alone did not significantly impact cell apoptosis (Fig. 4B). The evidence presented here suggests that the conditioned medium collected from oleamide-treated TAMs contains mediators against MDA-MB-231 cells. However, the precise molecular mechanisms underpinning this process remain elusive.
Prior research has indicated that IL-1 β can trigger apoptosis in various cell types by upregulating the proapoptotic protein Bax and downregulating the antiapoptotic protein Bcl-2 (Chauhan et al., 2018; Wang et al., 2023). Given that our findings reveal increased IL-1 β production in oleamide-treated TAMs, it is plausible that this could contribute to the apoptosis of MDA-MB-231 cells. However, further investigations are imperative to substantiate this hypothesis. Furthermore, MDA-MB-231 cells, categorized as triple-negative breast cancer (TNBC) cells, lack expression of estrogen receptor (ER) and progesterone receptor (PR), and also lack human epidermal growth factor receptor 2 (HER2) amplification. Consequently, MDA-MB-231 cells exhibit a significantly elevated metastatic potential and aggressiveness compared to MCF-7 (ER positive) breast cancer cells (Gest et al., 2013; Shi, Ye & Long, 2017). Consequently, the observed anti-cancer activity of oleamide-treated TAMs might potentially translate to success in MCF-7 cells as well. However, this hypothesis necessitates a more comprehensive investigation for confirmation, as well as for elucidating the mechanisms underlying this phenomenon across various cancer cell types.
Our proteomic analysis conducted uncovered several significant proteins that potentially contribute to macrophage polarization. Among the up-regulated proteins were those involved in phagocytosis, a key role of M1 macrophages. Notably, complement C3 (C3) and low affinity immunoglobulin gamma Fc region receptor II-a (Fc γRIIa) were up-regulated. Complement C3 is a key protein in the innate immune system and plays a critical role in coordinating various immune responses, including pathogen clearance, tissue regeneration, and control of tumor cell progression (Ricklin et al., 2016). A correlation between the upregulation of C3 and its receptor with an increase in M1 macrophage polarization has been reported (Bohlson et al., 2014; Ghate et al., 2021; Luo et al., 2012; Ruan et al., 2015). Additionally, the upregulation of Fc γRIIa indicates an enhancement in phagocytic activity. Fc γRIIa is a member of the human Fc γRII receptor family and its activation can stimulate or regulate various effector functions of leukocytes during immune responses, such as the clearance of opsonized antigens and the production of pro-inflammatory cytokines (Anania et al., 2019). Upregulation of Fc γRIIa suggests an improved ability to perform phagocytosis, which is a fundamental function of M1 macrophages (Crowley et al., 1997; Lu et al., 2008; Strzelecka, Kwiatkowska & Sobota, 1997). Furthermore, oleamide treatment led to the upregulation of other proteins, including transferrin (TF), transferrin receptor (TFRC), hexokinase-1 (HK1), and hexokinase-2 (HK2).
Transferrin (TF), an iron-binding transport protein, has been implicated in iron metabolism during M1-macrophage polarization (Agoro et al., 2018; Cairo et al., 2011; Handa et al., 2019; Hu et al., 2019; Jung, Mertens & Brüne, 2015; Xia et al., 2021). Increased iron uptake increases the expression of M1 markers, including iNOS, IL-1β, IL-6, and TNF-α, while concurrently reducing the expression of M2 markers (Handa et al., 2019). Docking analysis indicate a favorable binding score of −5.483 kcal/mol between oleamide and transferrin receptor 1, coupled with an observed increase in transferrin expression. These observations suggest that oleamide has the potential to promote the polarization of M1-like tumor-associated macrophages (TAMs) through its effects on iron metabolism. In RAW246.7 cells, overexpression of glucose transporter 1 (GLUT1), the primary rate-limiting glucose transporter, resulted in increased production of pro-inflammatory mediators and reactive oxygen species (ROS) upon LPS stimulation (Freemerman et al., 2014). A previous study by Moon et al. (2015) demonstrated that LPS stimulation triggered upregulation of glycolysis, enhanced cell adhesion, and elevated accumulation of reactive oxygen species (ROS). This effect was mediated by mechanistic target of rapamycin kinase (mTOR)-induced upregulation of GLUT1. Furthermore, it is worth noting that glycolysis can be influenced by iron metabolism. A study utilizing murine bone marrow-derived macrophages (BMDMs) loaded with ferric ammonium citrate (FAC) demonstrated enhanced pro-inflammatory phenotypes along with an increase in both the basic and maximal extracellular acidification rate (ECAR), while the oxygen consumption rate (OCR) remained unchanged (Hu et al., 2019). Previous investigations have consistently highlighted the strong association between increased glycolysis and M1 macrophage polarization. This relationship is regulated by the hypoxia-inducible factor-1α (HIF-1α) transcription factor (Li et al., 2018; Wang et al., 2017; Woods et al., 2022). HIF-1 serves as a key transcription factor involved in metabolic adaptation under conditions of low oxygen and nutrient deprivation (Weidemann & Johnson, 2008). In our study, oleamide treatment of TAMs induced the expression of hexokinase-2 (HK2) proteins, indicating enhanced glycolytic activity. Additionally, docking analysis revealed favorable binding scores of −6.166 and −5.833 kcal/mol between oleamide and serine/threonine-protein kinase mTOR (MTOR) and glucose transporter 1 (GLUT1), respectively (Fig. 10 and Table 6). These findings suggest the potential interaction of oleamide in promoting M1-like TAMs through upregulation of the glycolytic pathway. Additional investigations are therefore warranted to elucidate the molecular mechanisms underlying the role of oleamide in promoting M1 macrophage polarization.
Among the down-regulated proteins, a notable decrease was observed in ribosomal proteins (PRs), which play an essential role in controlling cell growth and survival by regulating protein synthesis (Kang et al., 2021). Specifically, oleamide treatment reduced expression of the 40S ribosomal protein S24 (RPS24) and the 60S acidic ribosomal protein P1 (RPLP1). While the implication of ribosomal proteins in macrophage polarization is not clearly established, they are associated with diverse aspects of cellular growth, proliferation, and malignancy (De las Heras-Rubio et al., 2014; Elhamamsy et al., 2022; Kang et al., 2021; Van Riggelen, Yetil & Felsher, 2010). RPS24 is highly expressed in prostate cancer, colorectal cancer, and hepatocellular carcinoma, where it is implicated in driving tumor progression (Arthurs et al., 2017; Elhamamsy et al., 2022; Li et al., 2023; Wang et al., 2015). Furthermore, a recent study demonstrated that inhibiting RPS24 expression using small hairpin shRNA can suppress cell proliferation and migration in colon cancer (Wang et al., 2015). Similarly, RPLP1, a component of the 60S ribosomal subunit, is proposed to play a role in diseases associated with cell proliferation and survival (Alali et al., 2020; Martinez-Azorin, Remacha & Ballesta, 2008). Overexpression of RPLP1 has been observed in hepatocellular carcinoma and triple-negative breast cancer and associated with a poor prognosis (Barnes et al., 2016; He et al., 2018). Our collective findings provide evidence that oleamide may inhibit the proliferation and progression of TAMs. However, further research is necessary to substantiate this claim.
Additionally, other proteins that were down-regulated included signal transducer and activator of transcription 2 (STAT2), prostaglandin E synthase 3 (PTGES3), and nucleosome assembly protein 1-like 1 (NAP1L1). STAT2 is an essential transcription factor involved in type I interferon (IFN-α/β)-mediated anti-viral and anti-proliferative signaling (Steen & Gamero, 2013). Generally, STAT1 and STAT2 are implicated in LPS-mediated M1 polarization through the activation of TLR4 (Steen & Gamero, 2013; Tugal, Liao & Jain, 2013). In response to LPS, autocrine production of IFN- β activates the type I IFN receptor, leading to the phosphorylation of STAT1 and STAT2, and ultimately increased production of type II interferon (IFN-γ) (Ivashkiv & Donlin, 2014; Tugal, Liao & Jain, 2013). IFN-γ was the first cytokine identified to induce M1 polarization (Ivashkiv, 2018). Our results indicate that the ability of oleamide to promote the differentiation of M1-like TAMs might not be exclusively mediated by IFN-γ signaling. However, more research is necessary to confirm this statement, and the determination of IFN-γ levels could provide valuable support. Remarkably, NAP1L1 is a critical member of the nucleosome assembly protein (NAP) family and has garnered significant attention in various tumor types, including lung adenocarcinoma, glioblastoma, colorectal cancer, and breast cancer (Aydin et al., 2020; Nagashio et al., 2020; Queiroz et al., 2020; Zottel et al., 2020). Recent studies have demonstrated a correlation between NAPL1 expression and immune cells, suggesting its role in promoting hepatocellular carcinoma progression via the Wnt/β-catenin pathway (Shen et al., 2022). Activation of the Wnt/β-catenin pathway has been reported to promote macrophage M2 polarization (Yang et al., 2018). In this context, oleamide may have the potential to suppress M2-like TAMs by inhibiting NAP1L1-induced Wnt/β-catenin activation. Notably, docking analysis of NAP1L1 exhibited the most favorable binding score to oleamide, with a value of −7.052 kcal/mol among all the proteins assessed (Fig. 10 and Table 6). Therefore, NAP1L1 emerges as a promising and intriguing target of oleamide for modulating TAM polarization. Our study elucidates the molecular mechanisms by which oleamide promotes the polarization of TAMs towards the M1 phenotype, potentially leading to the inhibition of breast cancer progression. This finding highlights the novel therapeutic potential of using oleamide to modulate TAM phenotype within the tumor microenvironment, opening avenues for future in vivo and clinical investigations in combination cancer therapy.
This study has several limitations. Firstly, the characterization of monocyte-derived TAM phenotypes was based solely on gene expression profiles, which may not provide a complete and accurate representation of TAM phenotypes. Incorporating the analysis of surface marker expressions using flow cytometry would enhance the reliability of TAM phenotype characterization. Additionally, due to limited medium volume and the use of conventional ELISA, we could not measure multiple cytokines simultaneously, restricting our cytokine profile. Future studies should include additional cytokines like IL-12 and VEGFA for a more comprehensive analysis.
One significant limitation is the exclusive use of the MDA-MB-231 cell line, representative of TNBC. This choice does not encompass other breast cancer subtypes, such as ER positive, PR positive, and HER2 positive subtypes. Each subtype has distinct biological behaviors and responses to treatment, which may affect the polarization of TAMs differently. To provide a more comprehensive understanding, future studies should include co-culture experiments with a variety of breast cancer cell lines, such as MCF-7 (ER positive), T47D (PR positive), and SK-BR-3 (HER2 overexpressing) (Dai et al., 2017).
Additionally, our study utilized a simplified transwell co-culture model to investigate the interaction between oleamide, TAMs, and cancer cells. This model does not fully capture the complexity of the tumor microenvironment, which includes various cell types, extracellular matrix components, and soluble factors (Xiao, Wang & Peng, 2023). These elements can significantly influence cancer progression and macrophage polarization, potentially affecting the observed outcomes (Xiao, Wang & Peng, 2023).
The proteomic analysis was conducted using whole cell lysate proteins, which may not capture the full spectrum of secreted proteins. As a result, proteins secreted into the supernatant may have been missed, potentially limiting the comprehensive understanding of the TAM proteome. Verification of candidate proteins identified through proteomic analysis should be validated through in vitro and/or in vivo experiments. Furthermore, in-depth molecular mechanistic studies are required to elucidate how oleamide mediates TAM polarization and the mechanisms responsible for the inhibition of cell viability and induction of apoptosis in MDA-MB-231 cells by the cultured medium from oleamide-treated TAMs. However, in order to ascertain and gather complete data, the number of blood group samples possesses to be augmented.
Conclusions
This study suggested that oleamide holds promise in promoting M1-like phenotype in TAMs, indicating its potential as a therapeutic target in cancer treatment. Proteomic analysis and molecular docking revealed candidate proteins targeted by oleamide, highlighting its potential for TAM polarization. The findings provide valuable resources for further investigations into oleamide and macrophage polarization using primary human monocyte-TAM models. Future research can be expected to elucidate the mechanisms underlying the effects more fully of oleamide on TAM polarization and its potential clinical applications.