
Comprehensive analysis of macrophage-associated inflammatory genes in AMI based on bulk combined with single-cell sequencing data
- Published
- Accepted
- Received
- Academic Editor
- Brittany Lasseigne
- Subject Areas
- Biochemistry, Bioinformatics, Cardiology
- Keywords
- Acute myocardial infarction, Macrophage, Single-cell sequencing, Bioinformatics analysis, Inflammation
- Copyright
- © 2024 Kong and Jin
- Licence
- This is an open access article distributed under the terms of the Creative Commons Attribution License, which permits using, remixing, and building upon the work non-commercially, as long as it is properly attributed. For attribution, the original author(s), title, publication source (PeerJ) and either DOI or URL of the article must be cited.
- Cite this article
- 2024. Comprehensive analysis of macrophage-associated inflammatory genes in AMI based on bulk combined with single-cell sequencing data. PeerJ 12:e17981 https://doi.org/10.7717/peerj.17981
Abstract
Background
Previous studies have highlighted the crucial role of macrophages in the post-acute myocardial infarction (AMI) inflammatory response. This study specifically focused on investigating macrophage-related targets involved in the inflammatory response after AMI.
Methods
Bioinformatics methods were applied for identifying differentially expressed genes (DEGs) in datasets GSE163465, GSE236374, and GSE183272 obtained from the Gene Expression Omnibus (GEO) database. Communication analysis was conducted to analyze macrophages in AMI. Subsequent analyses encompassed functional enrichment analysis of Co-DEGs using Gene Ontology (GO) and Kyoto Encyclopaedia of Genes and Genomes (KEGG). Gene set variation analysis (GSVA) and immune infiltration analysis were carried out for screening key genes. Validation of the bioinformatics analysis results involved original and GSE114695 datasets, supported by quantitative real time polymerase chain reaction (qRT-PCR). Animal experiments confirmed the upregulation of Saa3, Acp5, and Fcgr4 genes in AMI mouse myocardial tissues.
Results
A total of 80 and 1,907 DEGs were respectively identified by analyzing scRNA-seq and bulk RNA-seq data. The overlapping Co-DEGs were found to be closely associated with inflammation-associated pathways, specifically the PI3K-Akt-mTOR pathway. Screening based on GSVA scores and macrophage-associated scores highlighted four key genes (Saa3, Ms4a4c, Acp5, and Fcgr4). Immunoinfiltration analysis revealed their close association with macrophages. Dataset validation corroborated these findings. Experimental validation focused on Saa3, Ms4a4c, Acp5, and Fcgr4, demonstrating the upregulation of their expression in cardiac macrophages in the AMI group, consistent with previous reports.
Conclusion
This study provides new perspectives on AMI treatment. In addition, Saa3, Acp5, and Fcgr4 exhibit potential as biomarkers for improving cardiac repair and slowing down the development of heart failure after AMI.
Introduction
Cardiovascular diseases (CVDs) remain the leading cause of death worldwide, with acute myocardial infarction (AMI) being the majority of such diseases (Liao et al., 2020). AMI is mostly characterized by severe and persistent retrosternal pain, and potential complications including cardiac arrhythmia and heart failure, which can lead to catastrophic consequences for human health (Wang et al., 2023).
Myocardial remodeling after AMI is closely related to myocardial fibroblasts (Burke, Burgos Villar & Small, 2021). Research suggests the active involvement of myocardial fibroblasts in the inflammatory, proliferative, and maturation phases of post-infarction cardiac remodeling with different cellular phenotypes (Venugopal et al., 2022).
The inflammatory phase is essential for the progression of myocardial infarction to the reparative and proliferative phases (Shook, Singh & Singh, 2023). There is substantial evidence indicating that following AMI, a large number of neutrophils and monocytes rapidly infiltrate into the infarcted area and release proinflammatory cytokines to induce macrophage aggregation, which contribute to the occurrence of post-infarction inflammatory response (Wang, Chen & Zhang, 2023).
Studies have shown that MI-like macrophages reduce the angiogenic capacity of endothelial cells, exacerbate myocardial injury, and inhibit cardiac healing. M2 macrophages generate proangiogenic factors to promote angiogenesis and tissue healing (Liu et al., 2020). Additionally, Li et al. (2021) found that hypoxia exacerbates myocardial infarction injury by promoting macrophage conversion to a repair phenotype. Thus, macrophages are important in the post-AMI inflammatory response, remodeling and repair processes. Identifying novel targets for regulating macrophage function presents a promising avenue for treating myocardial remodeling following AMI (Cai et al., 2023).
In this study, different analytical methods were respectively applied for analyzing the bulk RNA data and single-cell data to obtain common genes, which were subsequently validated in a mouse model. The objective was to enhance the identification of AMI-related key genes and targets in the inflammatory response by exploring the differences in the expression of macrophage-related targets in AMI mice through analysis of scRNA-seq data and bulk RNA-seq data.
Material and Methods
Data collection
Single-cell data were collected from the GSE163465 dataset in the Gene Expression Omnibus (GEO) database (https://www.ncbi.nlm.nih.gov/geo/). This dataset consists of one sample from mice in the AMI group and one sample from mice in the Sham group. Bulk data were collected from the GSE236374 and GSE183272 datasets in the GEO database. The GSE236374 dataset contains three healthy Sham samples and three samples with AMI. The GSE183272 dataset contains five samples with AMI and five healthy Sham samples. The GSE114695 dataset includes six healthy Sham samples and six samples with AMI. Healthy samples from the dataset and samples from day seven after AMI were used for this study.
Cell clustering analysis
Nineteen cell clusters were obtained after UMAP dimensionality reduction clustering of single-cell data (GSE163465) using the Seurat package (v 4.3.0.1) and cell-type annotation using the SingleR package (v 2.2.0).
Identification of AMI-associated differentially expressed genes (DEGs)
To identify AMI-associated DEGs, differential analysis was conducted on samples from the training dataset using the FindMarkers function in the Seurat software package. The established thresholds were set at p-value <0.05 and —log2FC—>0.5.
Analysis of intercellular communication
To understand the AMI network, the CellChat software package (v 1.6.1) was used to assess the strength and probability of cell–cell communication in AMI mice. Circle plots were used to show the number and strength of interactions between any two cell types within each cellular signaling pathway. Subsequently, the strength and contribution of interactions between dominant cells and other cells was further investigated.
Identification of DEGs and Co-DEGs
All the data from the GSE236374 dataset and the GSE183272 dataset were re-normalized using the sva package v3.52.0 for batch effect removal. The threshold of DEG screening was p-value <0.05 and —log2FC—>0.5. DEGs (n = 80) identified in the Sc-RNA dataset were overlapped with those (n = 1, 907) identified in the bulk-RNA dataset, forming the Co-DEG for subsequent analysis.
Gene Ontology (GO) and Kyoto Encyclopedia of Genes and Genomes (KEGG) and Wiki pathway enrichment analysis
Enrichment analysis of the Co-DEGs was performed using the DAVID database (https://david.ncifcrf.gov/) and the results obtained were visualized using the ggplot2 package (v 3.4.4), highlighting the pathways ranking in the top list. Likewise, for the top 3 Co-DEGs, all functionally enriched pathways of significantly expressed genes were determined using Wiki pathway databases.
Screening of key genes and immune infiltration analysis
The inflammatory response score for both the AMI and the Sham groups was calculated using the gene set variation analysis (GSVA) algorithm. The key genes related to inflammation-related pathway and macrophage M0 and M2 scores were selected for further analysis. The screened key genes underwent Pearson correlation analysis with genes in inflammatory response pathways to assess the extent of correlation between these key genes and genes associated with inflammation-related pathway.
Validation of the expression of the screened genes in the original datasets
The GSE163465 and GSE236374 datasets were used for gene expression validation. Differential expression of key genes in the AMI and the Sham groups was compared using rank sum test of the ggpubr package (v 0.6.0).
Dataset validation and single-gene Gene Set Enrichment Analysis (GSEA)
The GSE114695 dataset was used for gene expression validation, and GSEA of key genes was conducted using the clusterProfiler package (v 4.8.3; https://bioconductor.org/packages/release/bioc/html/clusterProfiler.html).
Construction of AMI mouse model
Twelve clean-grade SD male mice, weighing 18–22 g each, were purchased from Hangzhou Medical College Laboratory Animal Center. All mice were reared adaptively for two weeks under pathogen-free condition with 20−24 °C and free access to food and water under natural light with day and night. Mice were randomly divided into Sham group (n = 6) and AMI group (n = 6). Mice were used for constructing AMI model by ligating the left anterior descending (LAD) coronary artery (Peng et al., 2023) and anesthetized with 5% isoflurane.The mice heart was exposed by creating a transverse chest incision, and the LAD branch was ligated using a puncture needle in the interventricular groove, approximately 2–3 cm below the left auricle. The myocardium displayed a change in color, becoming white or cyanotic after ligation. Subsequently, the heart was repositioned into the chest cavity, followed by closure of the chest and suturing of the skin. The Sham group mice underwent only thoracotomy without LAD ligation. After 1 week of LAD ligation in mice, the cardiac function in the left ventricle was assessed using M-mode echocardiography. The mice were anesthetized and secured in a supine position on a wooden board. The chest was fully exposed, and the chest fur removed with hair removal cream. An ultrasound instrument was adjusted to display an M-mode echocardiogram. Left ventricular end-diastole diameter (LVEDD), left ventricular end-systolic diameter (LVESD), left ventricular fraction shortening (LVFS), and left ventricular ejection fraction (LVEF) of the mice were collected for each group, which were used to assess the level of the cardiac function of the left ventricles of the mice. At the end of treatment, the mice were euthanized by 5% inhalation of isoflurane and cervical dislocation. The heart tissues of mice were isolated and frozen. All study procedures were approved by Institutional Animal Care and Use Committee of Zhejiang Center of Laboratory Animals (NO. ZJCLA-IACUC-20010546).
Calculation of myocardial infarct area in mice by triphenyltetrazolium chloride (TTC) staining
Surviving mice were euthanized through cervical dislocation 1 week after successful AMI modeling. Following anesthesia for blood sampling from the abdominal aorta, fresh hearts were removed, thoroughly washed with saline, and then placed in a refrigerator at −20 °C for about 20 min. Afterward, the hearts were removed from the refrigerator, sliced into 2–3 mm-thick slices and placed in 2% TTC staining solution prewarmed at 37 °C. After 15 min of staining, it was observed that the infarcted area of the mouse heart appeared white, whereas the non-infarcted area was red. Image J (v 1.51 J8) was used for analysis. The percentage of the white infarcted area to the whole section area was used as an index.
Detection of related gene expression in mouse cardiac macrophages by quantitative reverse transcription polymerase chain reaction (qRT-PCR)
The method for isolating mouse macrophages involved excising the mouse hearts, washing the hearts with heated Hanks Balanced Salt Solution (HBSS) to remove blood, preparing cell suspensions through chopping, homogenizing and digesting, discarding the supernatant after centrifugation, and lysing erythrocytes with ACK lysis buffer (A10492-01; Gibco). After washing, the cells were resuspended in 2 ml HBSS and incubated with 50 ul anti-CD45 (mouse) magnetic beads (Miltenyi 130-052-301) for 30 min. Subsequently, cells were passed through the MACS magnetic column with magnets in place. The column was rinsed with buffer, and labeled cells were eluted for RNA collection (Carlson et al., 2017).
Transfection efficiency was determined using qRT-PCR (Zhang et al., 2020). RNA from mouse cardiac macrophages in both the AMI and the Sham groups were extracted using Trizol solution (15596026; Thermo Fisher Scientific, USA) and reverse transcribed into cDNA (RR037Q; Takara, Beijing, China). The expression levels of Saa3, Ms4a4c, Fcgr4, and Acp5 were detected using qPCR (CN830S, Takara) with the following reaction conditions were 95 °C for 10 min, 95 °C for 30 s, 60 °C for 30 s, and 72 °C for 1 min, for a total of 40 cycles. The expression levels of Saa3, Ms4a4c, Fcgr4, and Acp5 were calculated using the 2−ΔΔct method. GAPDH was used as the internal marker gene. The primer sequences were designed as follows (Table 1).
| Gene | Oligonucleotide sequence |
|---|---|
| mmu-Saa3-F | ACATGGAGCAGAGGACTCAAGAG |
| mmu-Saa3-R | AGCAGGTCGGAAGTGGTTGG |
| mmu-Ms4a4c-F | TGGGTTCACAGTTTCCGTTTCG |
| mmu-Ms4a4c-R | AAGCAGAGATGGACACAGCAATG |
| mmu-Fcgr4-F | TCAGGGTGCTTGAGGAAGACAG |
| mmu-Fcgr4-R | GTGGGATGAGGCTTTCGTTATGG |
| mmu-Acp5-F | AGCGACAAGAGGTTCCAGGAG |
| mmu-Acp5-R | GTTTCCAGCCAGCACATACCAG |
| mmu-GAPDH-F | ACGGCAAGTTCAACGGCACAG |
| mmu-GAPDH-R | CGACATACTCAGCACCAGCATCAC |
Statistical analysis
Statistical analysis was conducted using the R program (v 4.0.2; R Core Team, 2020). Data for different genes in the two groups were compared using t-test with GraphPad Prism (v 10.1.0) software, with P < 0.05 considered statistically significant.
Results
Analysis of scRNA-seq data
Single-cell data from the GSE163465 dataset were subjected to Uniform Manifold Approximation and Projection (UMAP) dimensionality reduction, revealing 19 different clusters in the AMI group, including B cells, basophils, and macrophages (Figs. 1A, 1B). Analysis of the percentage of each cell type in the AMI group compared to the Sham group indicated obvious differences in the percentage of different clusters between the two groups (Fig. 1C, Fig. 1D). DEG analysis on the GSE163465 dataset revealed a total of 80 DEGs between the AMI and the Sham groups, as shown in the volcano plots. (Screening criteria: threshold adjP<0.05, and —log2FC—>0.5) (Fig. 1E).
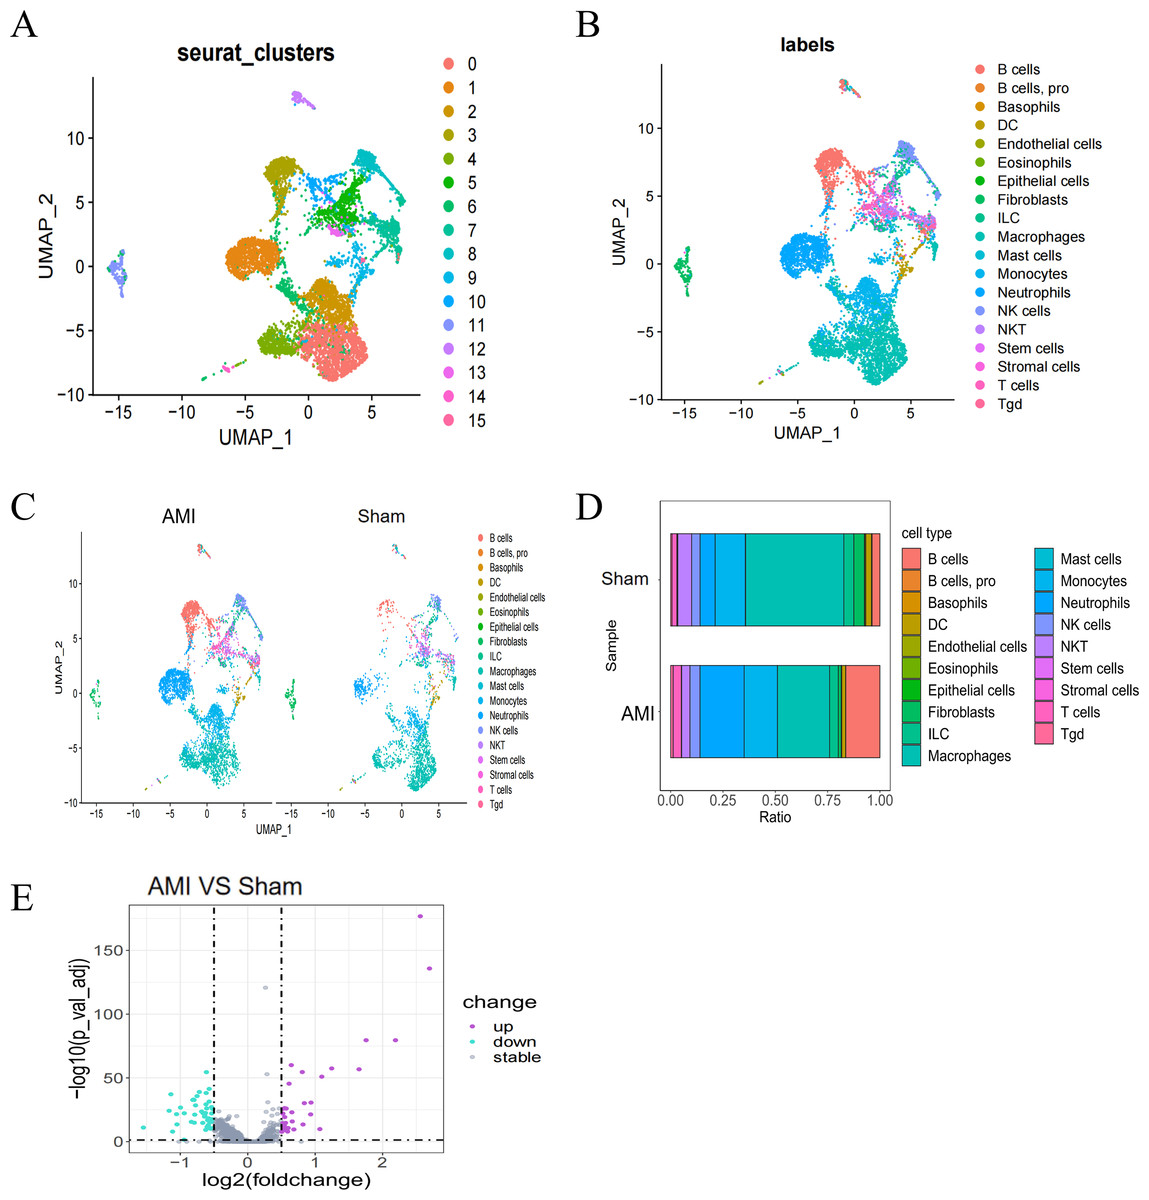
Figure 1: Single-cell cluster analysis in the AMI and the Sham groups.
(A, B) UMAP plots of cell types in the GSE163465 dataset. Each dot represents a cell nucleus colored by its cell type identity; (C) UMAP plots of cell types in the AMI and the Sham groups; (D) percentage change and contribution of each cell type in the AMI and the Sham groups; (E) volcano plot of DEGs between the AMI and the Sham groups. Purple dots indicate significantly up-regulated genes, green dots indicate significantly down-regulated genes, and gray dots represent genes with no statistical difference.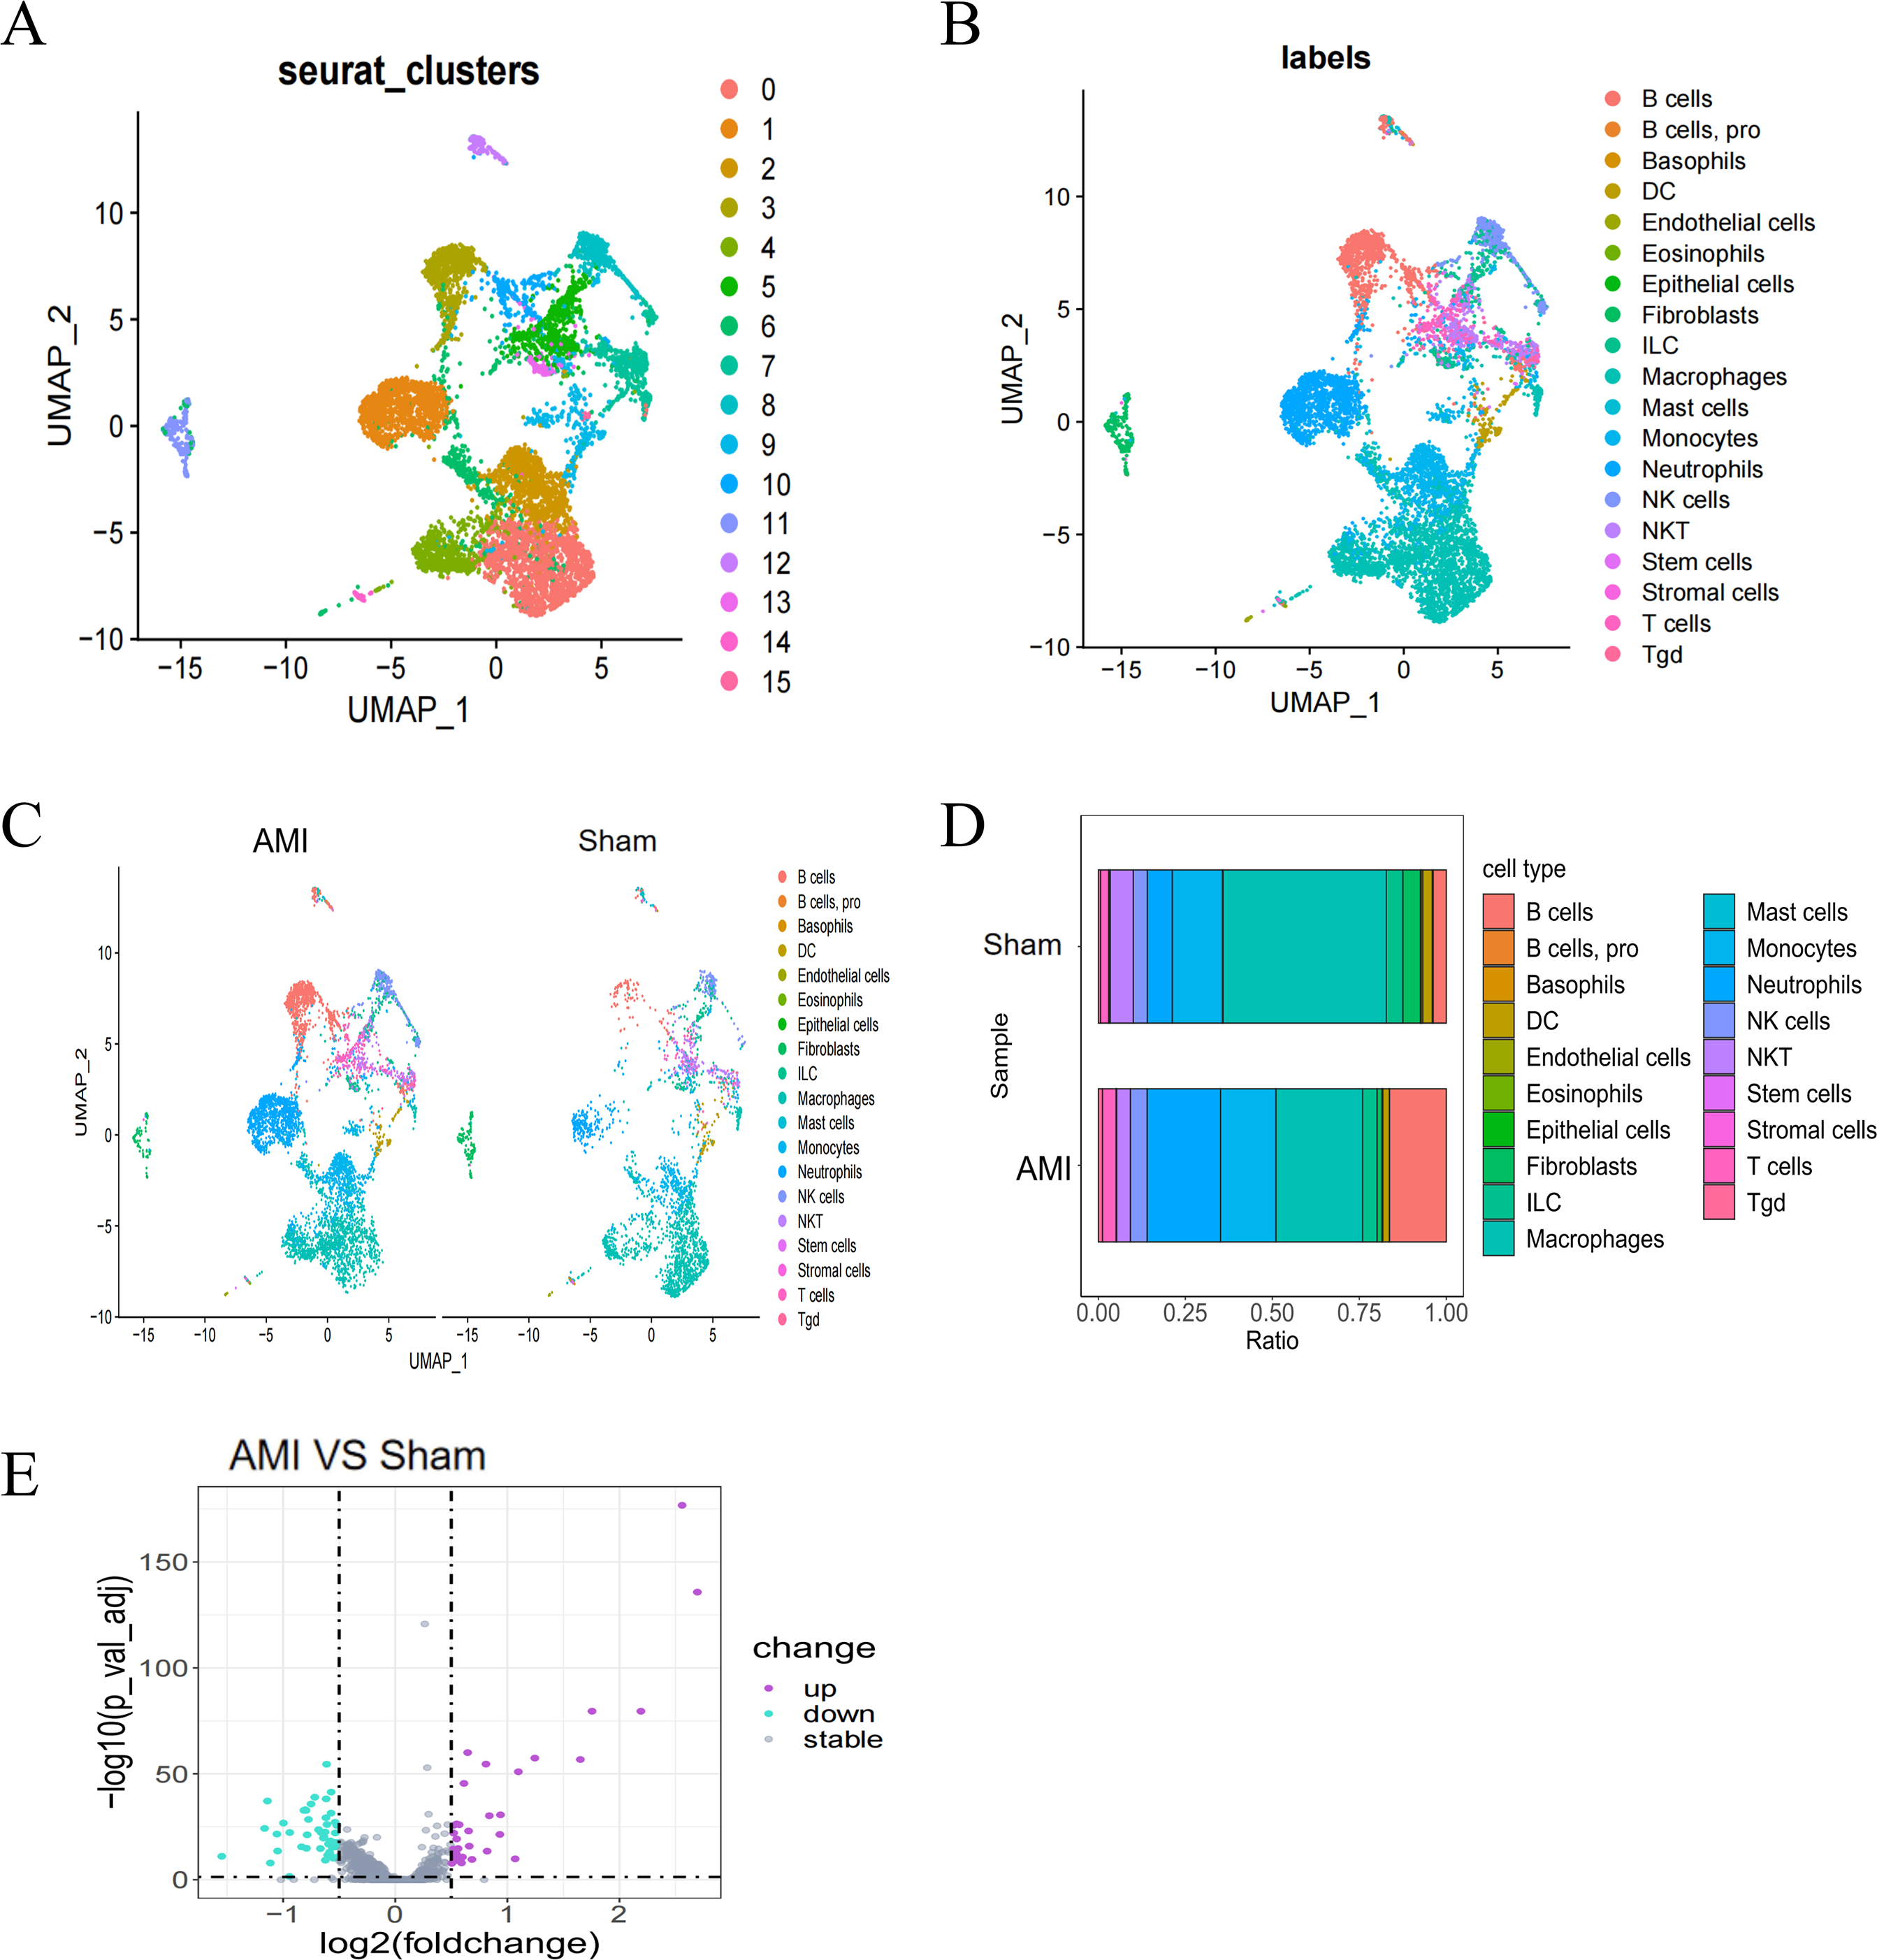
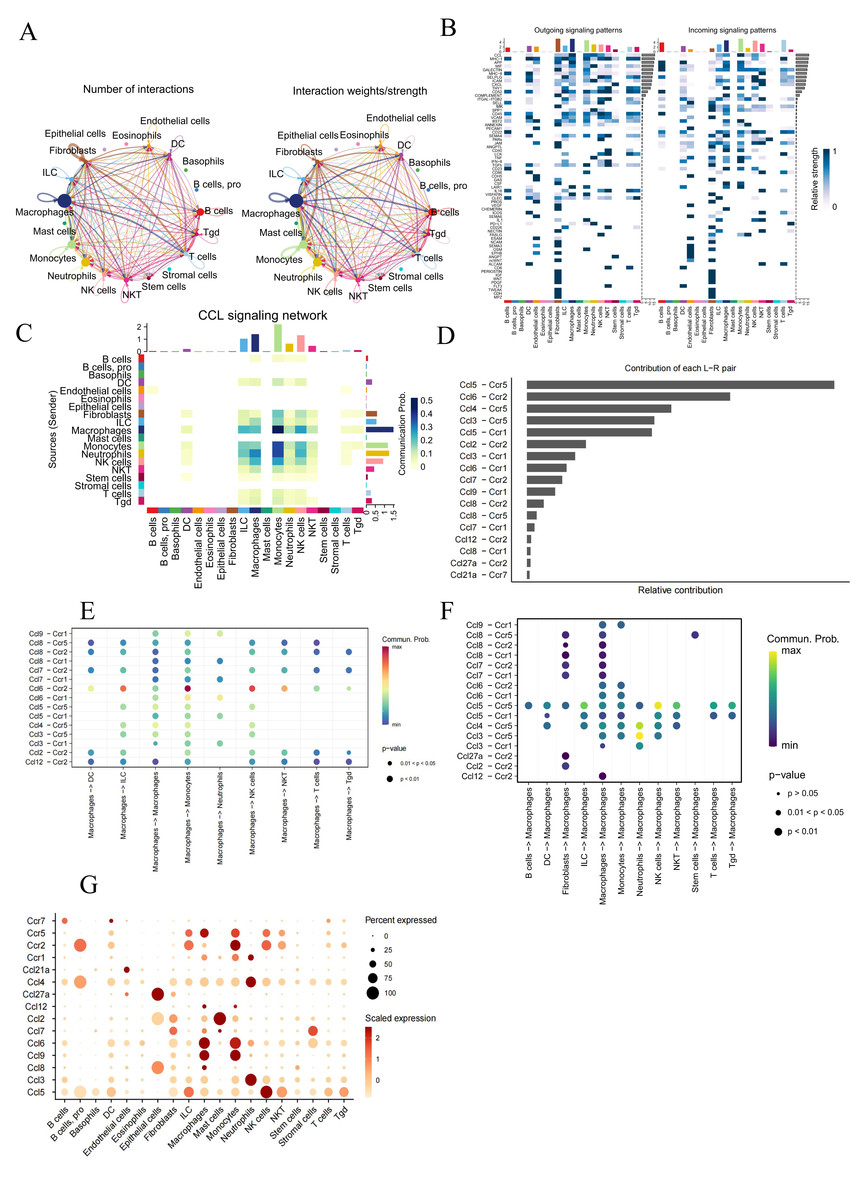
Figure 2: Analysis of intercellular communication in AMI.
(A) Number and strength of interactions across different cell types; (B) overview of efferent signaling and afferent signaling; (C) heatmap showing the differential number of interactions between different cell clusters in the CCL signaling network , with the X and Y axes representing receptor and ligand cell types, respectively. The colored bars on the top and right represent the sum of signals received and sent in each cell type, respectively; (D) relative contribution of each ligand–receptor pair to the CCL signaling network. (E, F) comparison of the probability of ligand–receptor pair-mediated communication between macrophages and other cell types; (G) Strength of association between all the cell types and chemokines.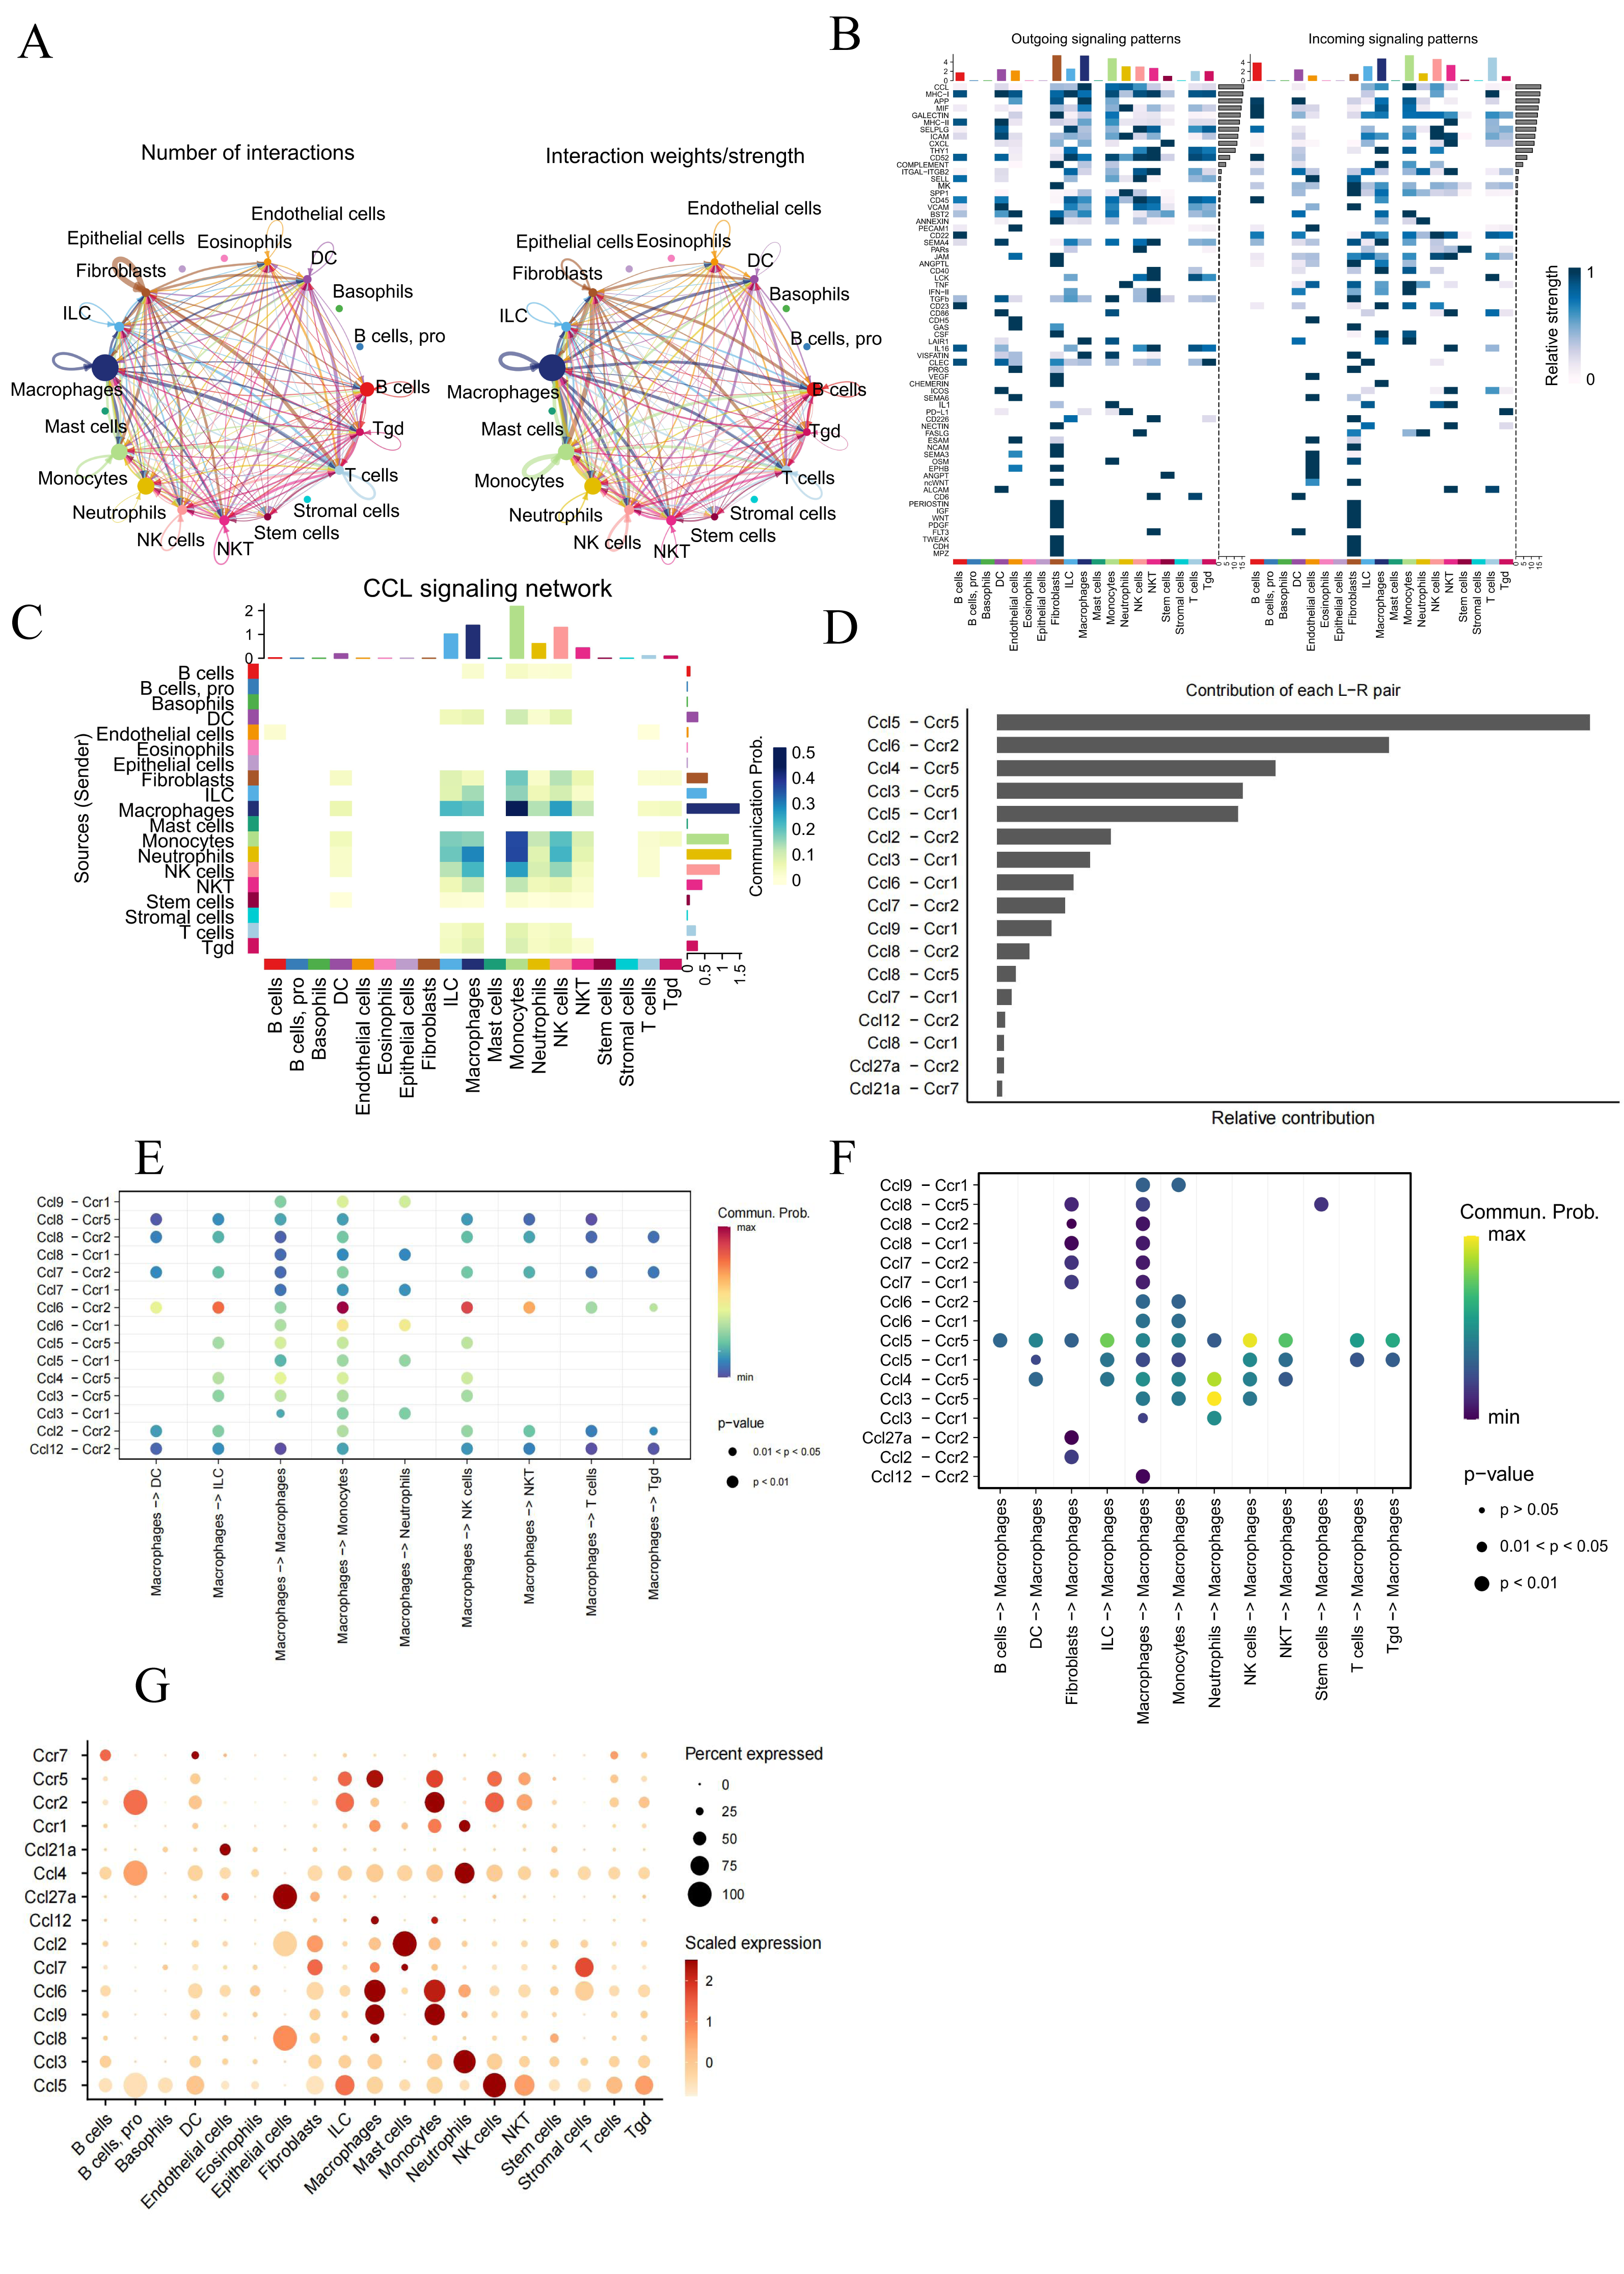
Analysis of intercellular communication in AMI
The CellChat package was used to analyze scRNA-Seq data for understanding potential intercellular communication in AMI mice from the GSE163465 dataset (Fig. 2A, Fig. 2B). Results indicated macrophages as the dominant contributors to cellular communication, closely interacting with many cells,
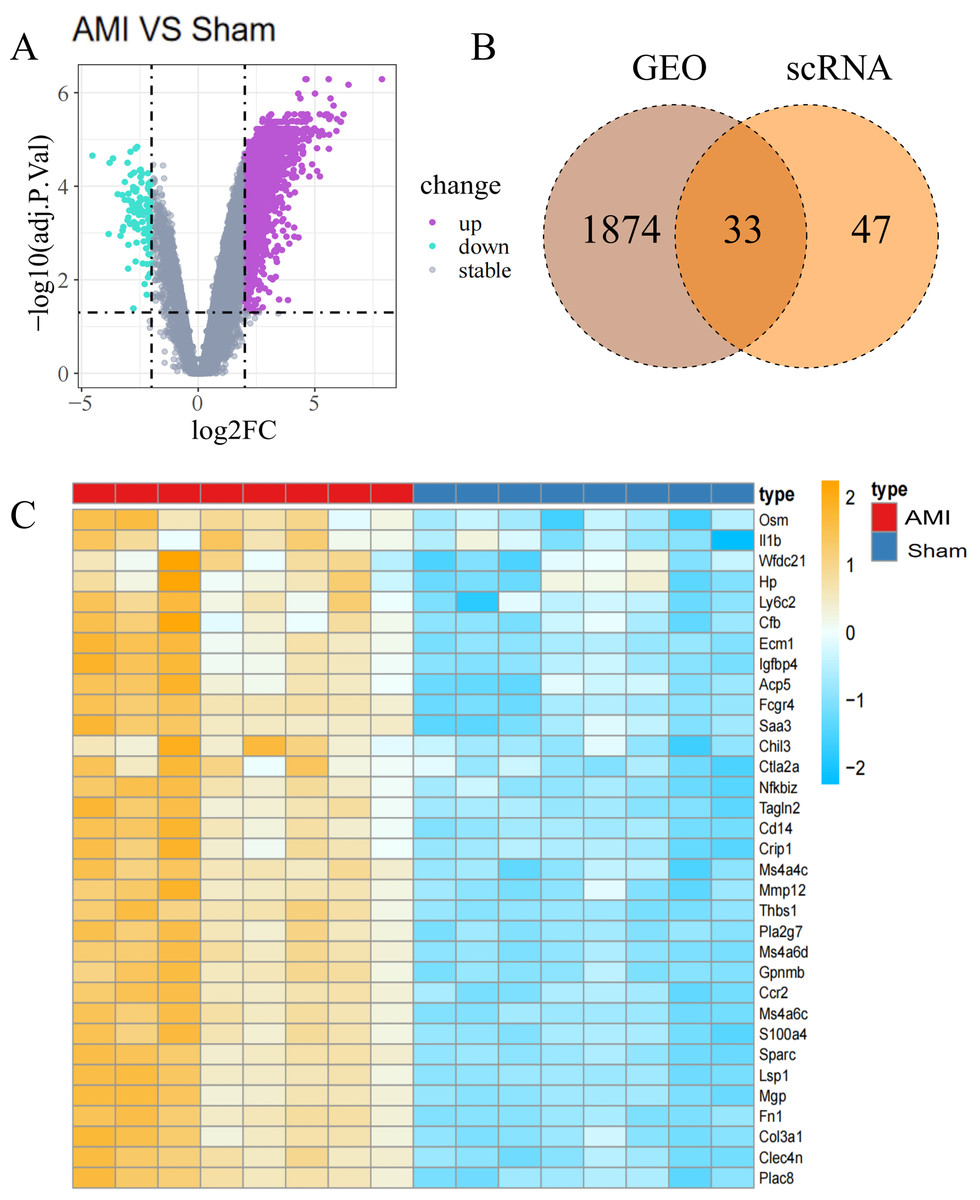
Figure 3: Identification of Co-DEGs.
(A) Volcano plot of DEGs between the AMI and the Sham groups in bulk RNA-seq data. Purple dots signify significantly up-regulated genes, green dots represent significantly down-regulated genes, and gray dots denote genes with no statistical difference; (B) Co-DEGs obtained by intersecting DEGs from bulk RNA-seq data and scRNA-seq data; (C) heatmap depicting the expression of Co-DEGs in the AMI and the Sham groups, with the yellow part representing a positive correlation and the blue part representing a negative correlation.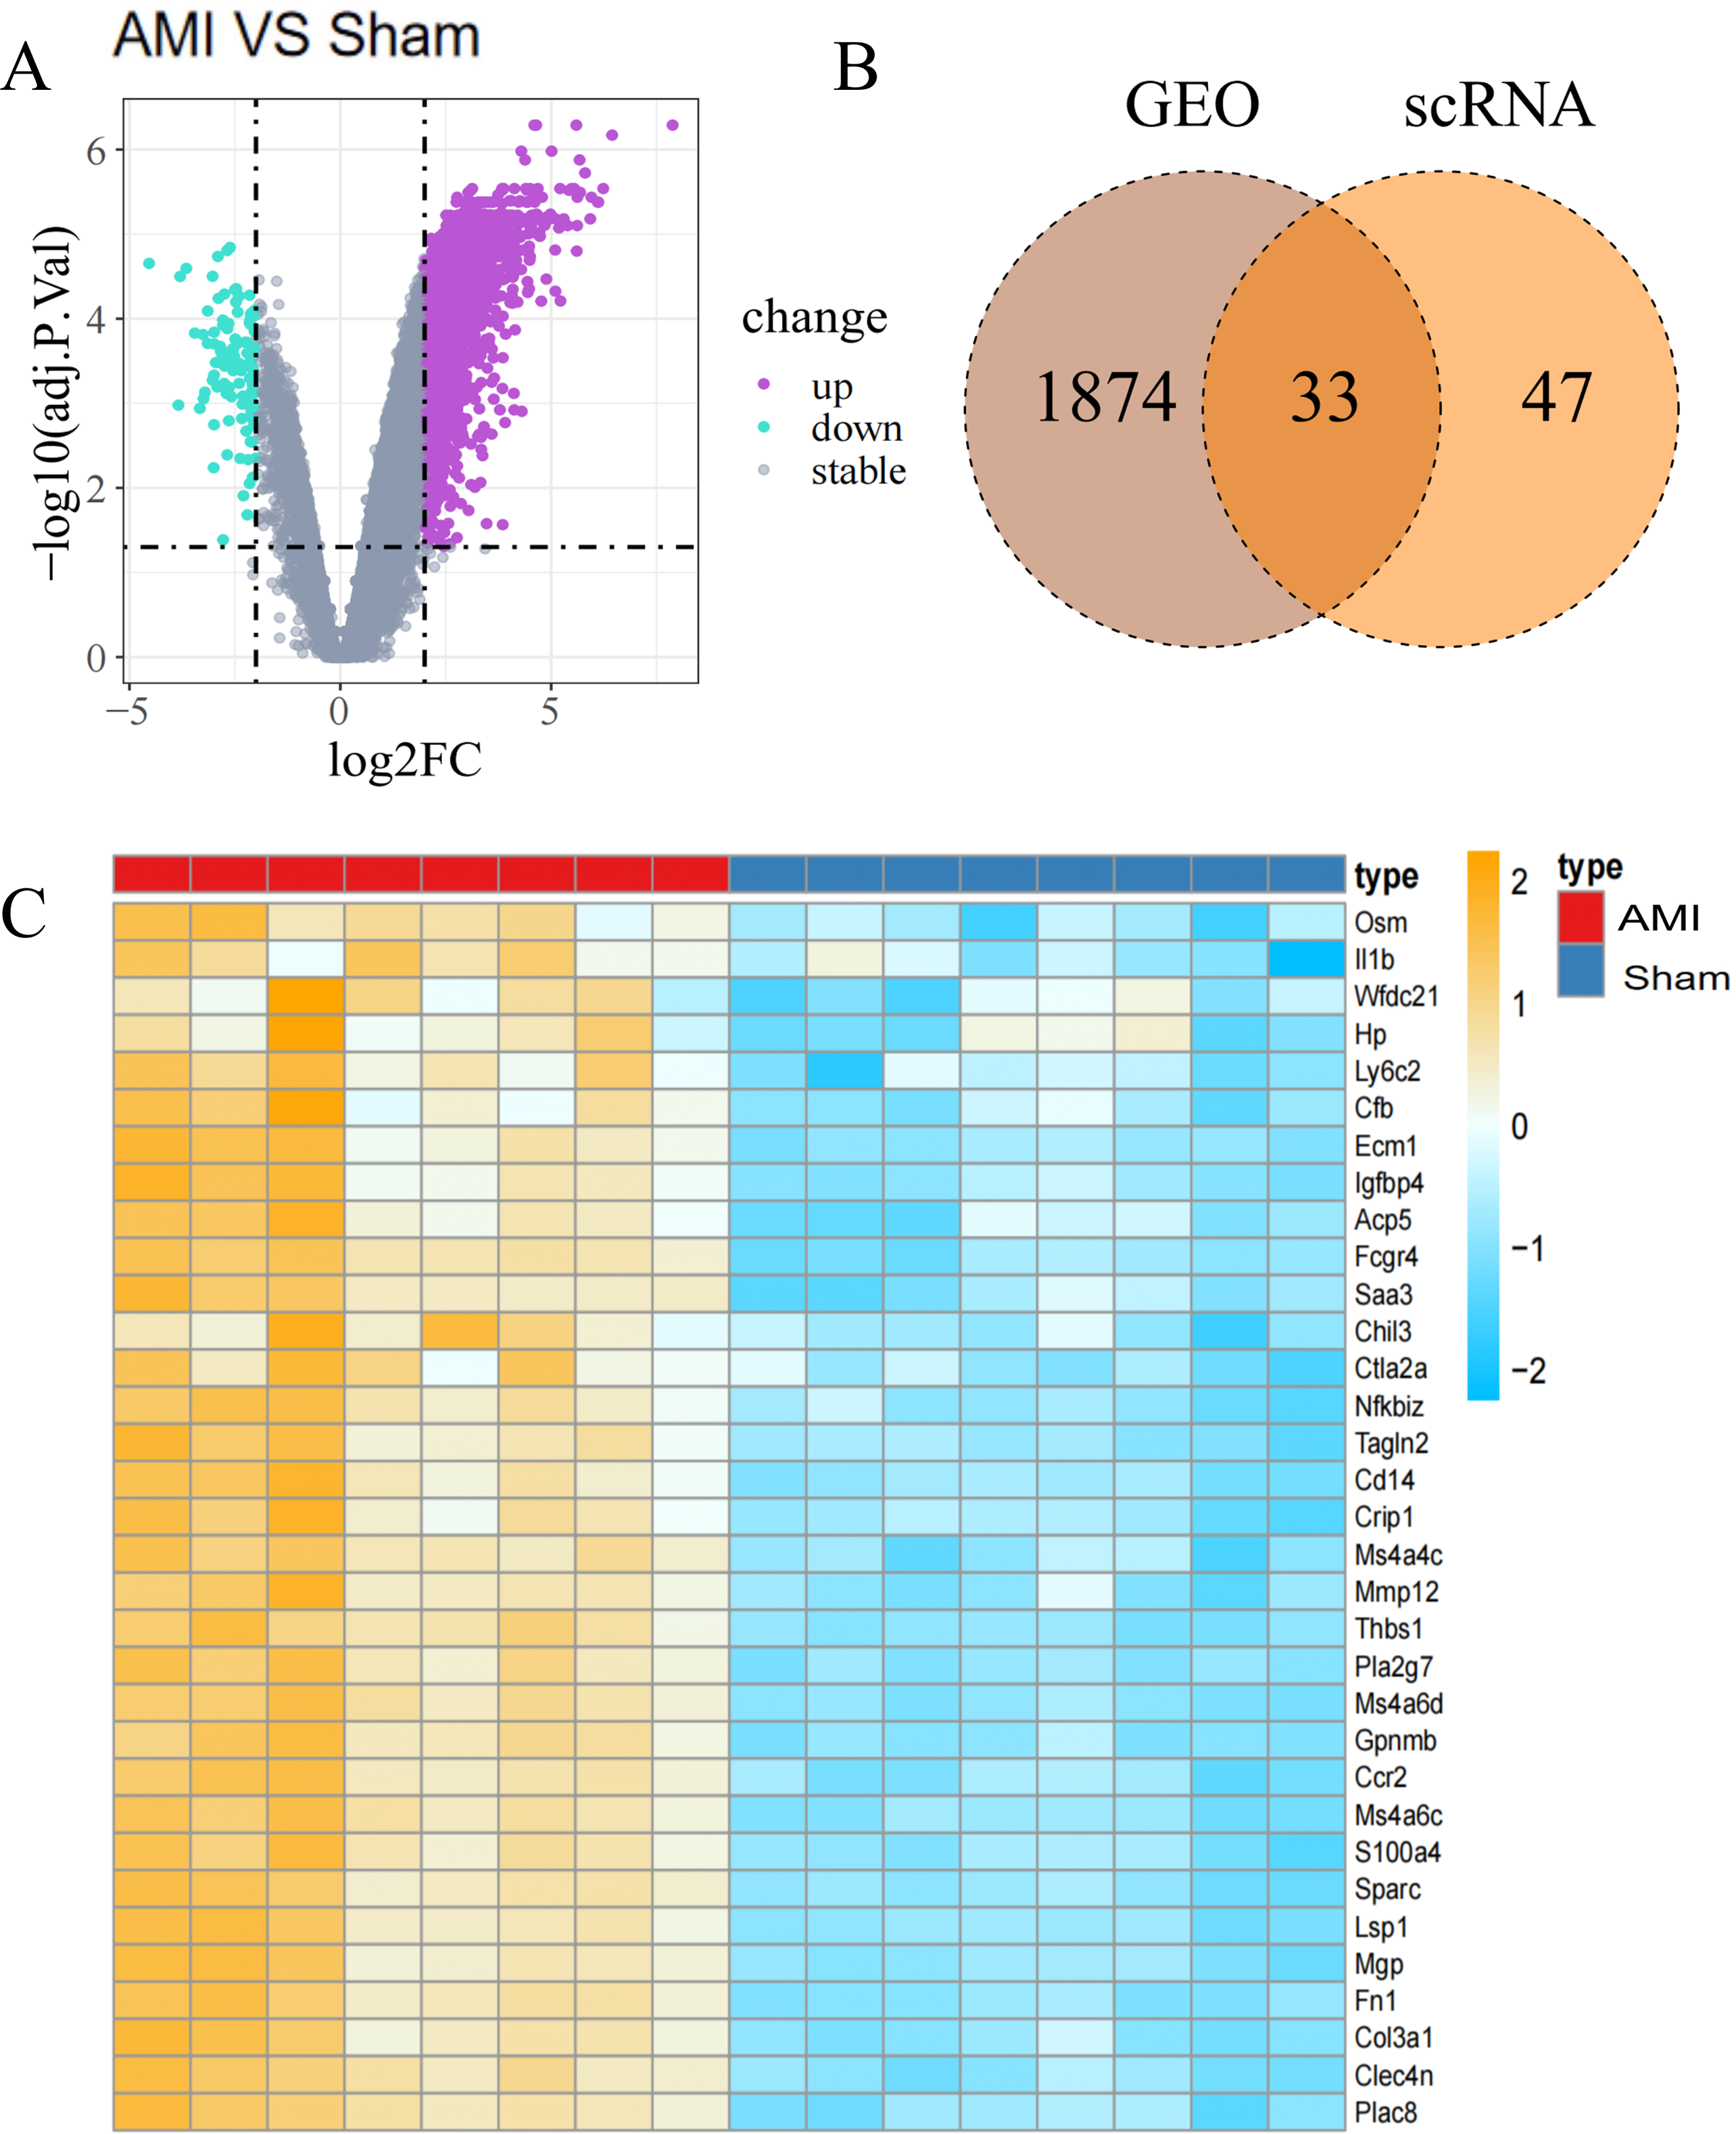
The CCL signaling pathway was shown to be closely involved in the interaction between macrophages and monocytes (Fig. 2B). Further investigation of the CCL signaling pathway was conducted with CellChat for better undrstanding cell-to-cell communications (Fig. 2C). Ccl6-Ccr2 and Ccl5-Ccr5 were identified as the main contributor of Ligand-Receptor (L −R) for the CCL signaling pathway. (Fig. 2D). In addition, analyzing the probability of communication for ligand–receptor pairs sent by macrophages to other cell types showed a substantial increase in Ccl 6-Ccr 2 from macrophages to monocytes, and in Ccl 4-Ccr 5 and Ccl 3-Ccr 5 from neutrophils to macrophages (Figs. 2E, 2F). The expression of chemokines and chemokine receptors on the major cell types was further investigated, revealing that the chemokines ccl6 and ccl9 and the chemokine receptor ccr5 can function in macrophages (Fig. 2G).
Functional enrichment analysis of intersecting Co-DEGs
In the analysis of T bulk sequencing data from the GSE236374 and GSE183272 datasets, DEGs between the AMI and the Sham groups were identified. With thresholds of p-value <0.05 and —log2FC—>0.5, a total of 1,907 DEGs were discovered, of which 33 overlapped (Fig. 3A). Venn diagrams comparing DEGs from bulk RNA-seq data and scRNA-seq data revealed 33 Co-DEGs (Fig. 3B). Heatmap visualization of the Co-DEGs demonstrated significant differences in their distribution between the AMI and the Sham groups (Fig. 3C). GO and KEGG analyses were respectively performed on the Co-DEGs. GO analysis showed their main involvement in biological processes (BPs) such as regulation of locomotion and regulation of immune system process (Fig. 4A), cellular components (CCs) including fibrinogen complex, plasma lipoprotein particles (Fig. 4B), and molecular functions (MFs) relating to extracellular matrix binding and extracellular matrix structural composition (Fig. 4C). KEGG enrichment analysis demonstrated their involvement in pathways such as amoebiasis, AGE-RAGE signaling pathway in diabetic complications, etc (Fig. 4D). Wiki pathway analysis showed predominant enrichment of the,Co-DEGs in the inflammatory response pathway, spinal cord injury, and adhesion foci: PI3K-Akt-mTOR signaling pathway (Fig. 4E).
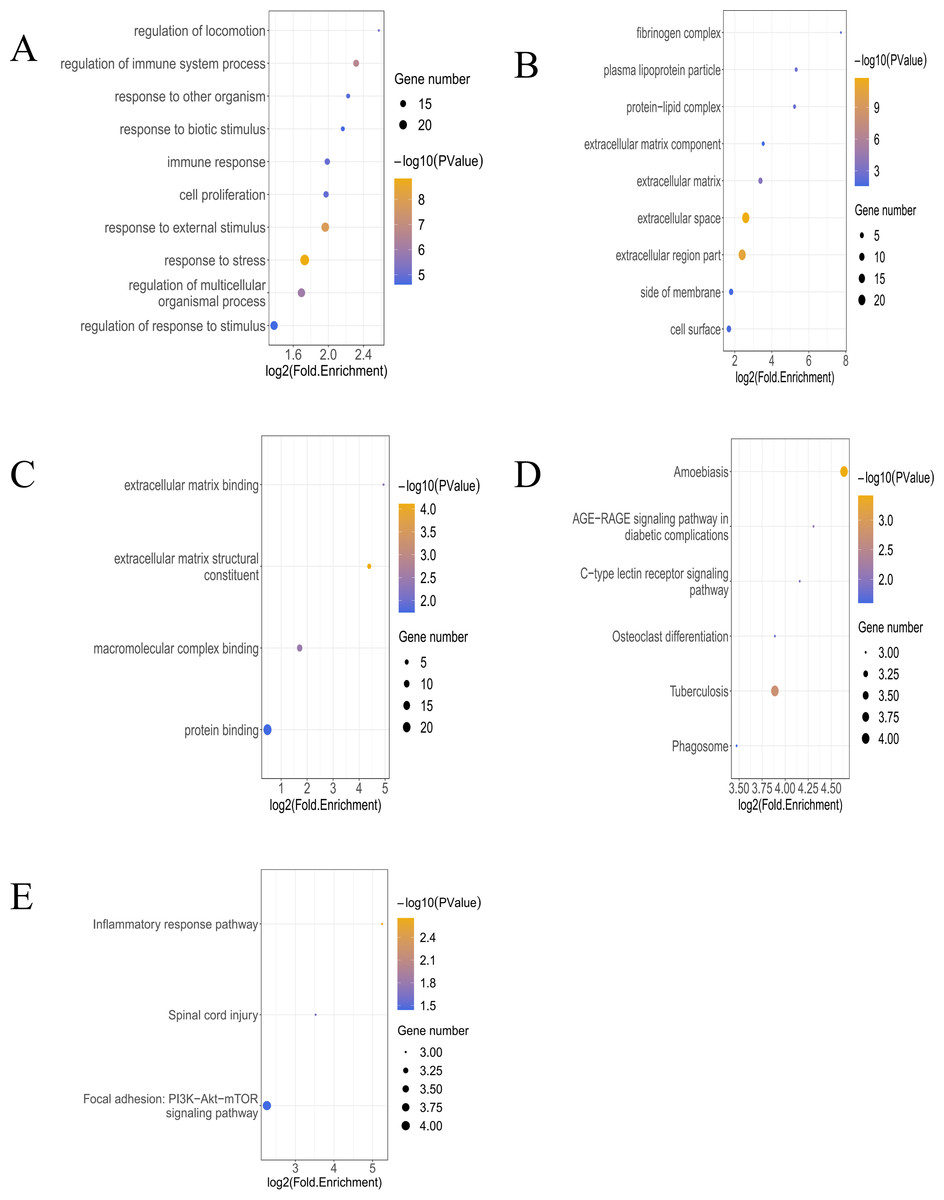
Figure 4: Functional enrichment analysis of Co-DEGs.
(A) Bubble diagram illustrating GO-BP results of Co-DEGs. (B) Bubble diagram presenting GO-CC results of Co-DEGs. (C) Bubble diagram displaying GO-MF results of Co-DEGs; GO, gene ontology; BP, biological process; CC, cellular component; MF, molecular function; (D) bubble diagram showing KEGG pathway analysis results of Co-DEGs; KEGG, kyoto encyclopedia of genes and genomes; (E) Wikipathway enrichment analysis of Co-DEGs.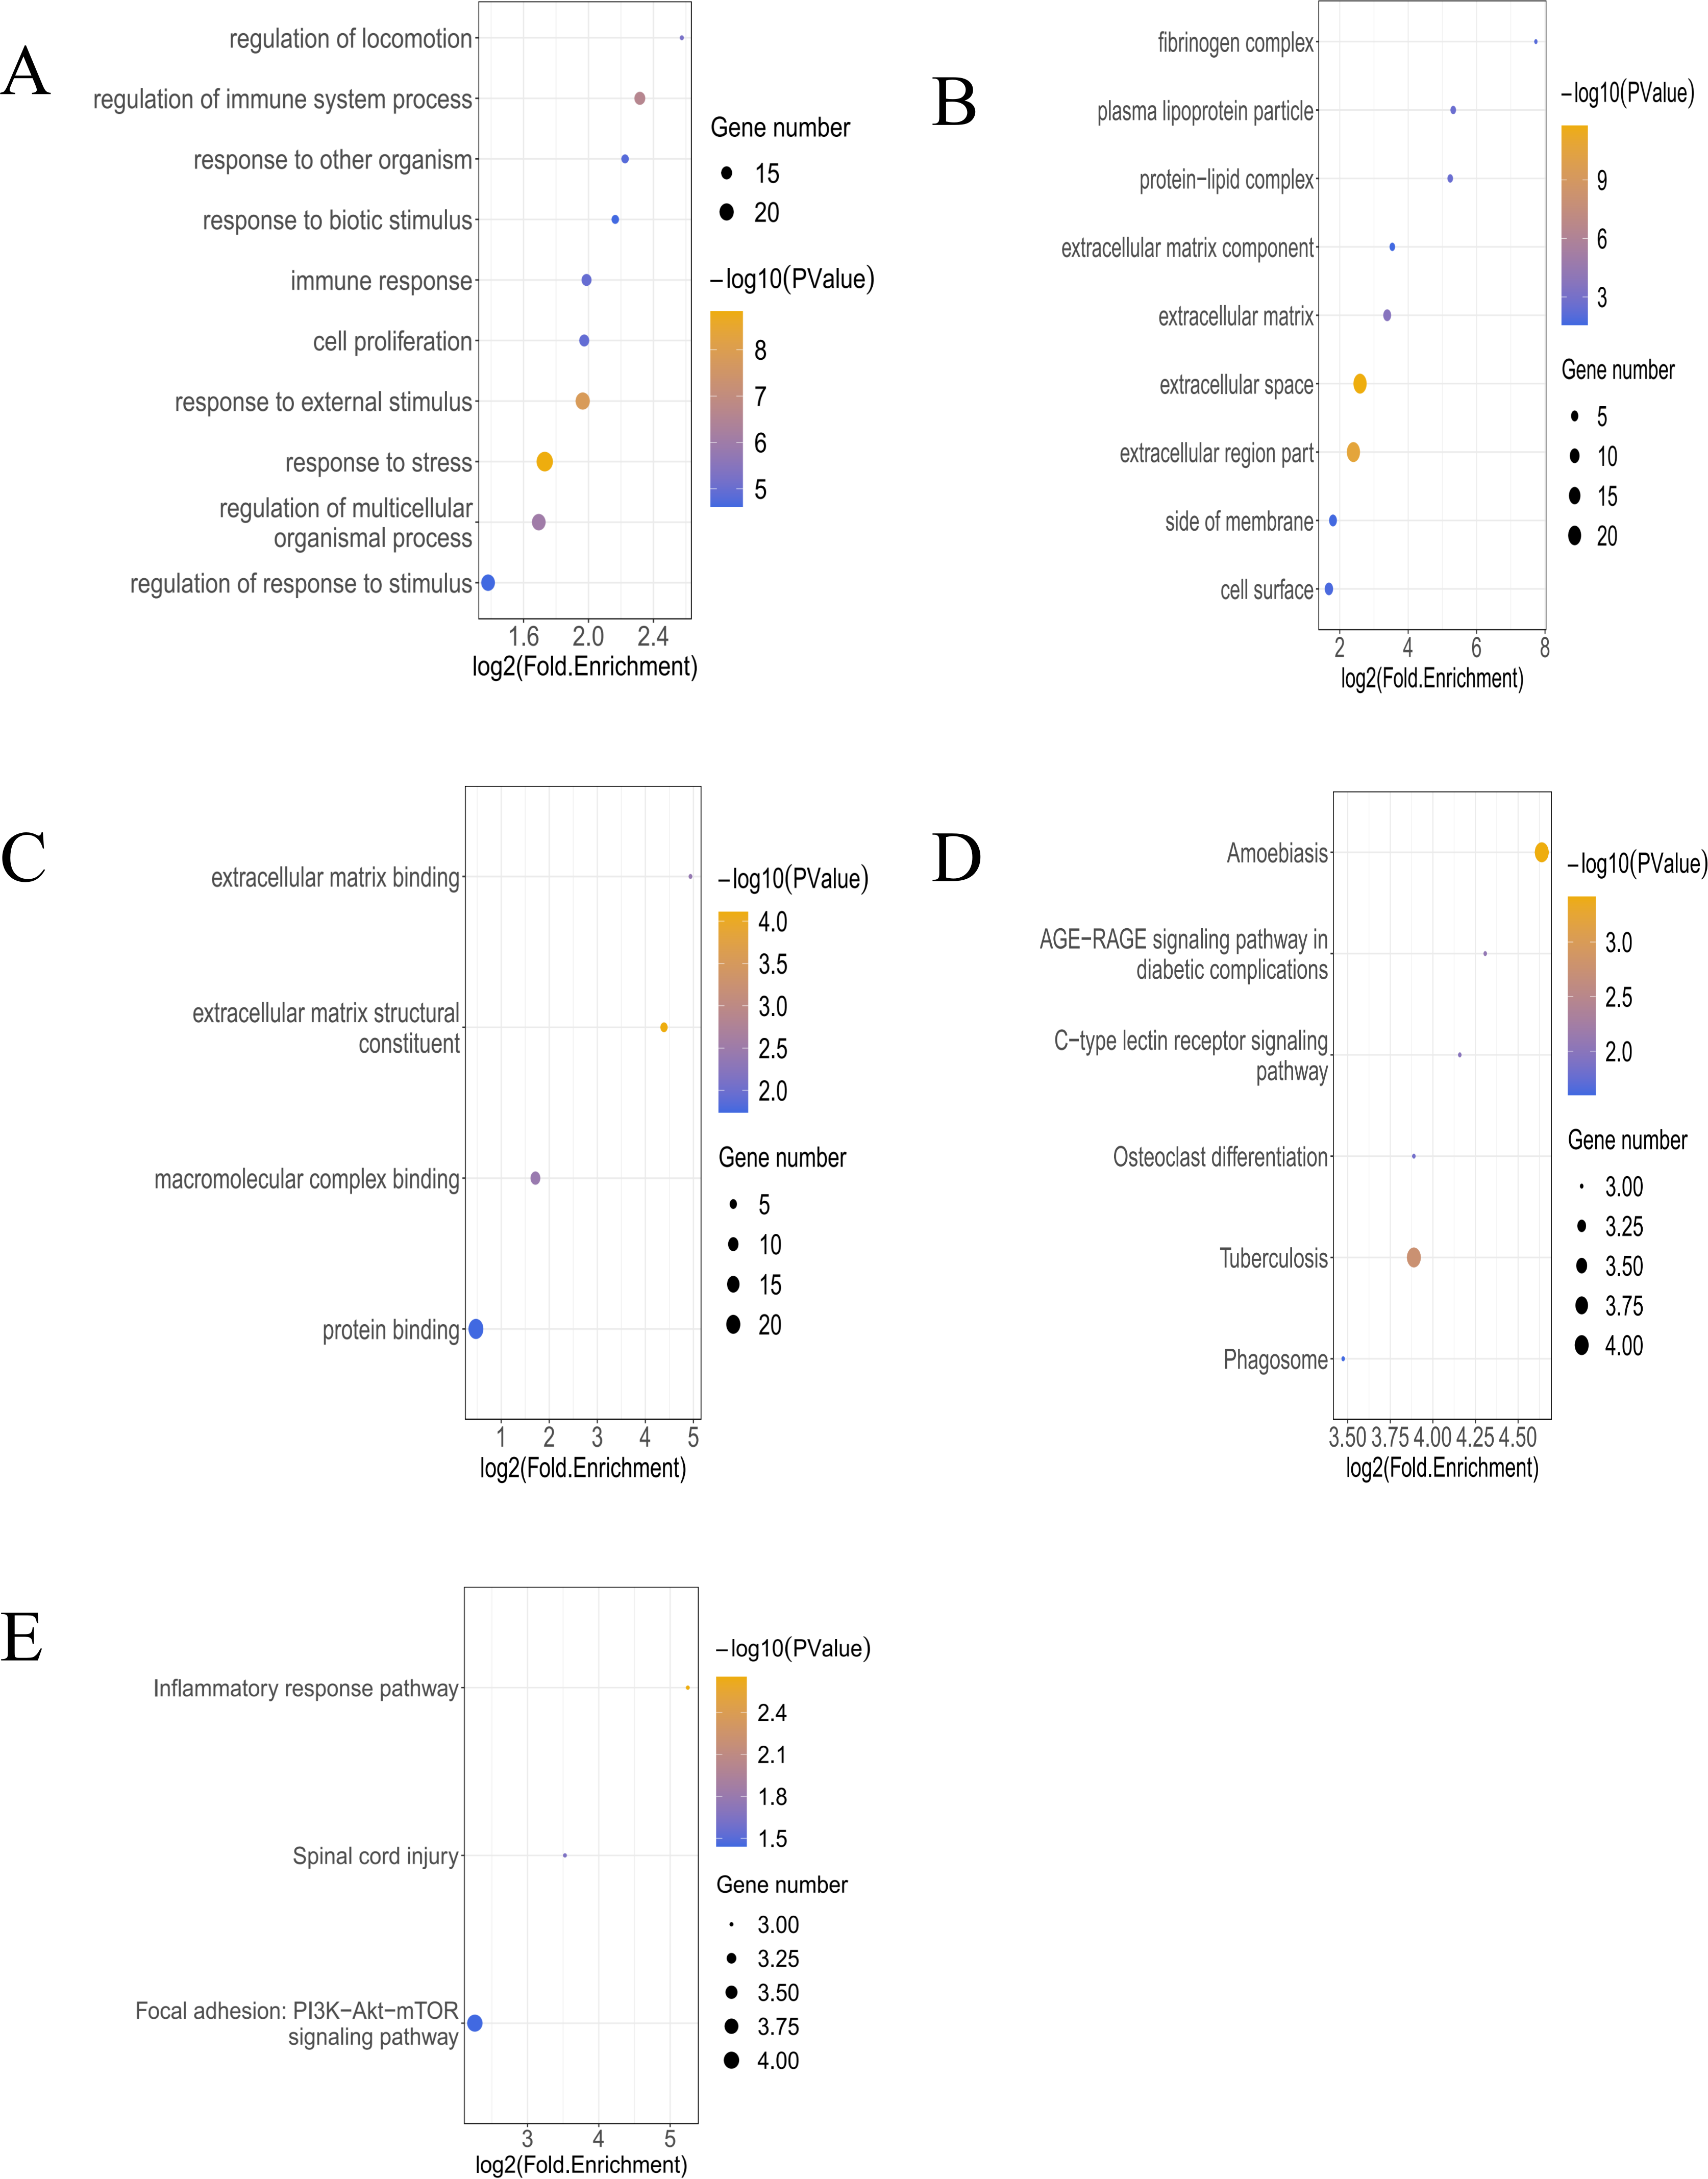
Screening for macrophage-associated key genes
Inflammatory pathway-related genes were significantly enriched in AMI compared to the Sham group (Fig. 5A). Taking the inflammation-related pathway and macrophage M0 and M2 score as conditions, Saa3, Ms4a4c, Acp5, and Fcgr4 were screened out as key genes (Fig. 5B). The relationship between these 4 genes and specific inflammatory response pathway-related genes was displayed (Fig. 5C).
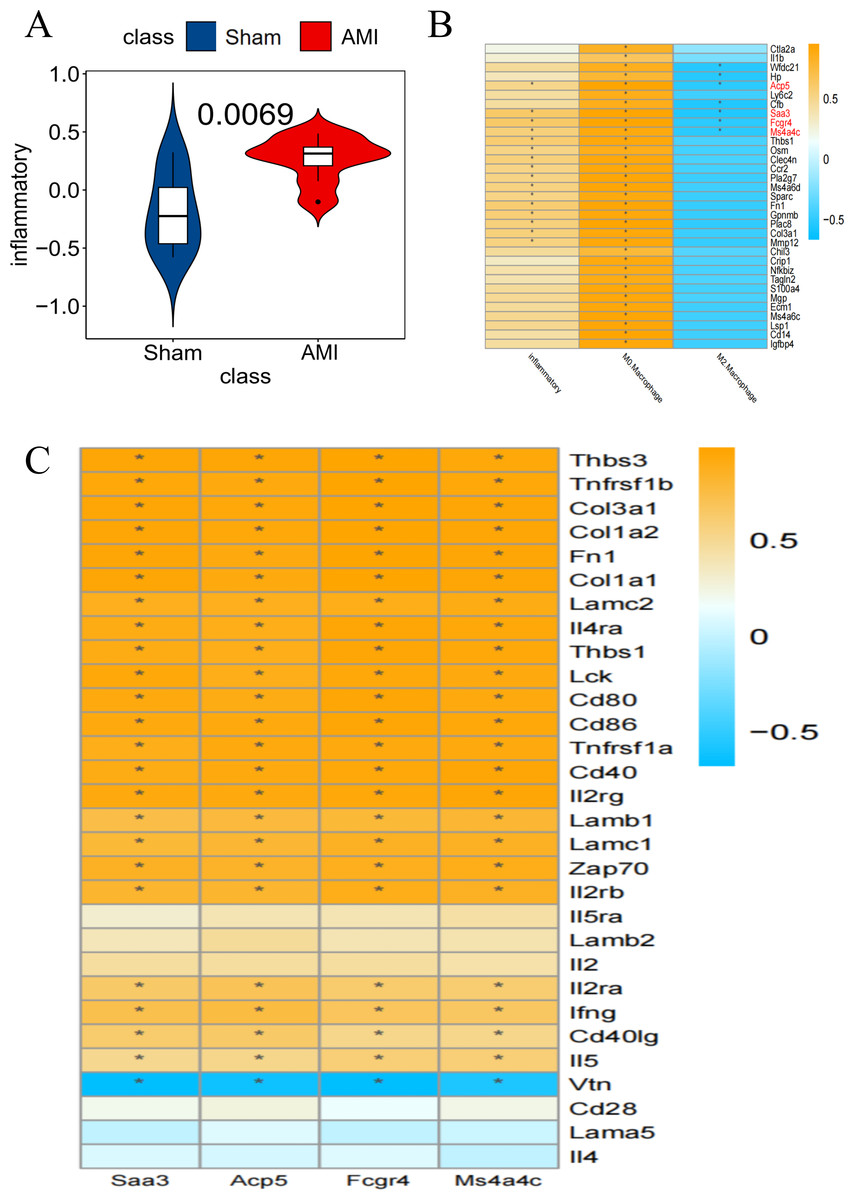
Figure 5: Screening for key genes
(A) GSVA scores of Co-DEGs and inflammation-related pathways, with the Y-axis representing the association between Co-DEGs and inflammation-related genes; (B) Co-DEGs significantly related to the specific inflammatory response pathway were selected for further analysis; (C) relationship between key genes and genes associated with specific inflammatory response pathways (*p<0.05). (B–C) The yellow part represents a positive correlation and the blue part represents a negative correlation.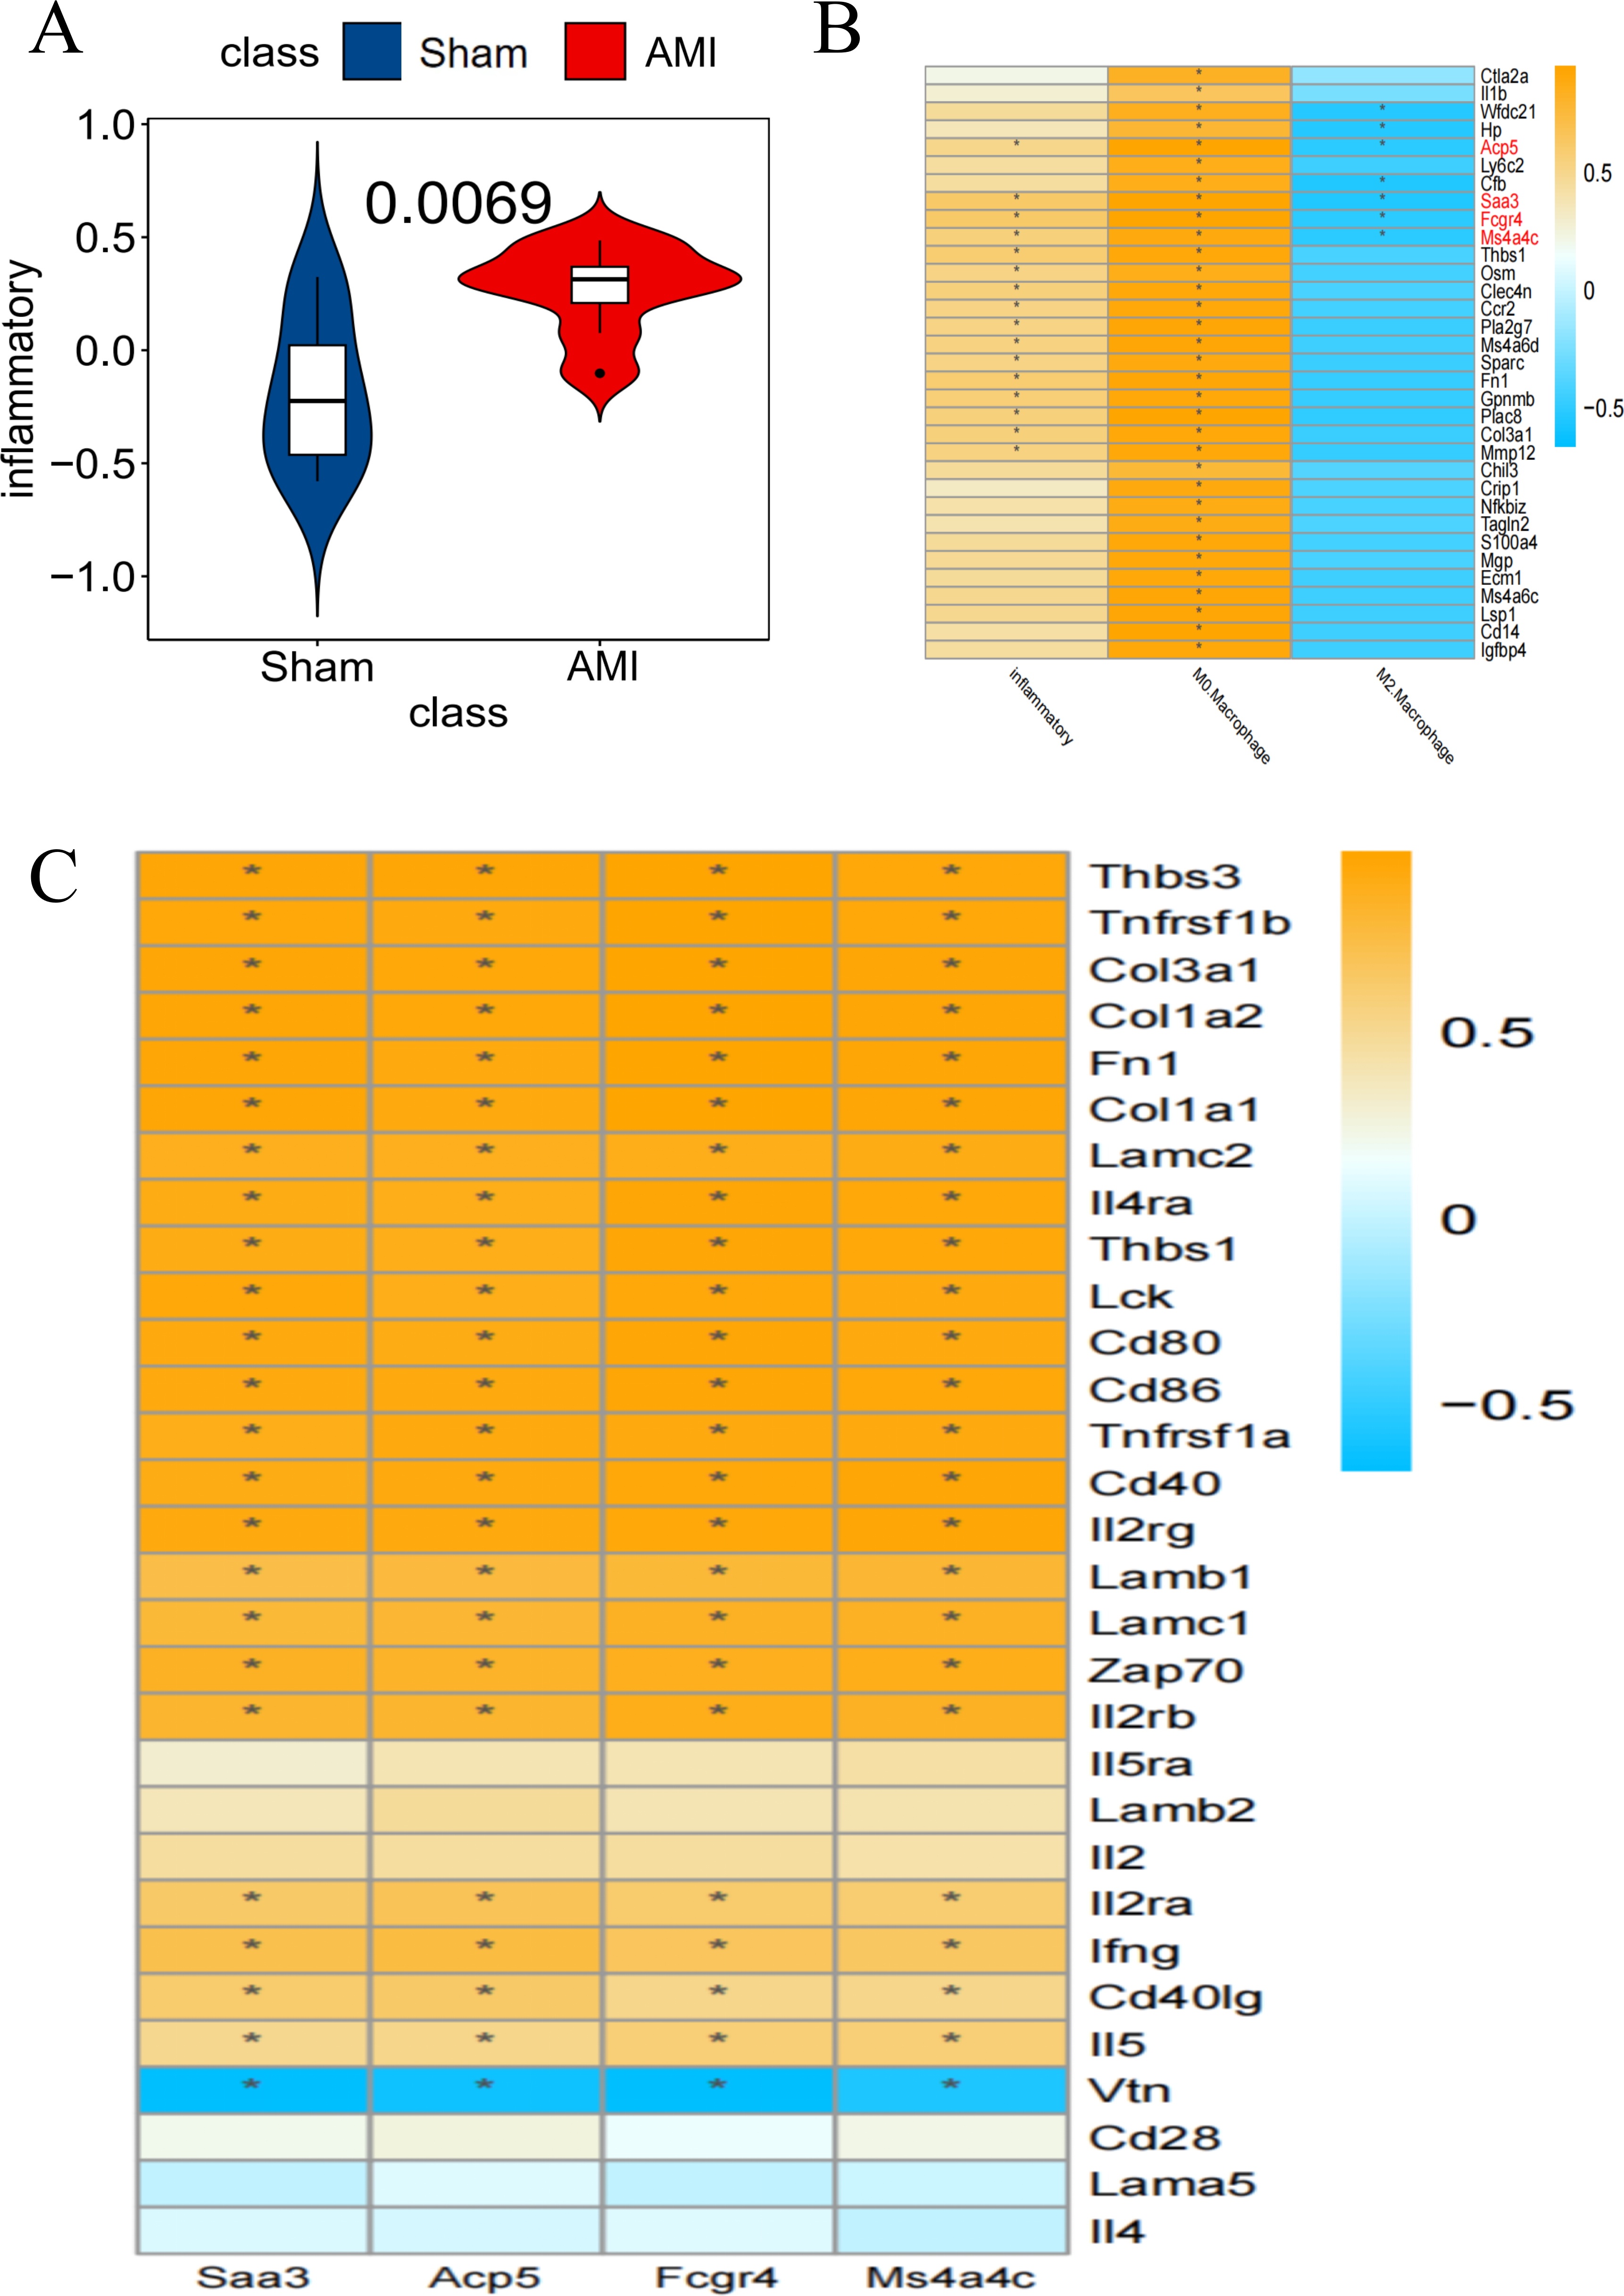
Immune cell correlation analysis of macrophage-associated key genes
Immune infiltration analysis was performed on the four identified key genes (Saa3, Fcgr4, Acp5, and Ms4a4c). All of them were all positively correlated with M0 macrophages and negatively correlated with M2 macrophages, NK cell stimulation, and others (Figs. 6A–6D).
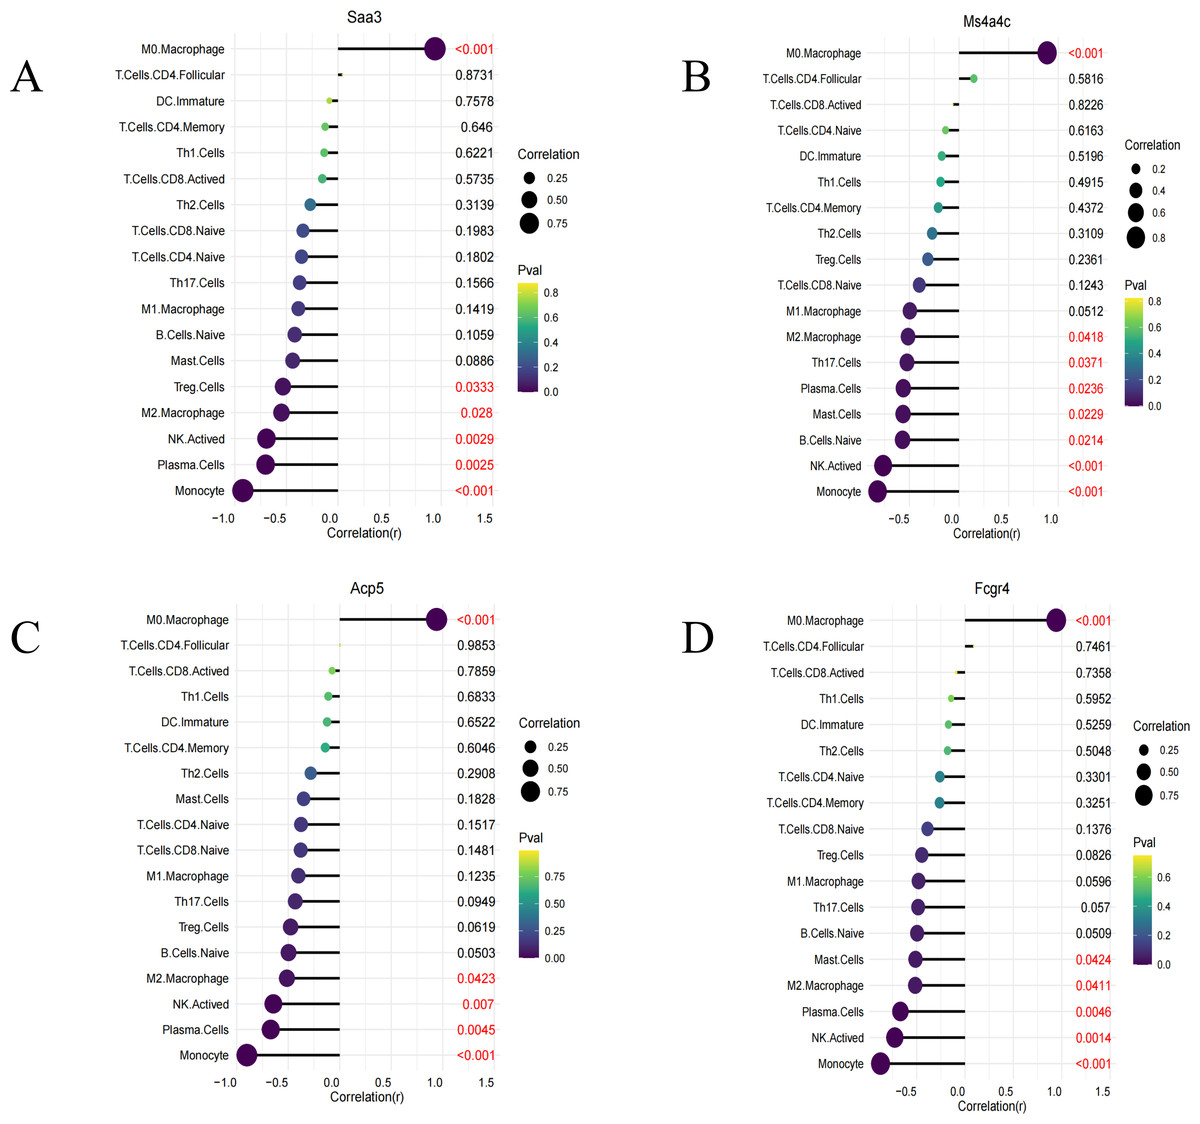
Figure 6: Immune infiltration lollipop plot.
(A) Correlation map of Saa3 with infiltrating immune cells; (B) correlation map of Ms4a4c with infiltrating immune cells; (C) correlation map of Acp5 with infiltrating immune cells; (D) correlation map of FCGR4 with infiltrating immune cells.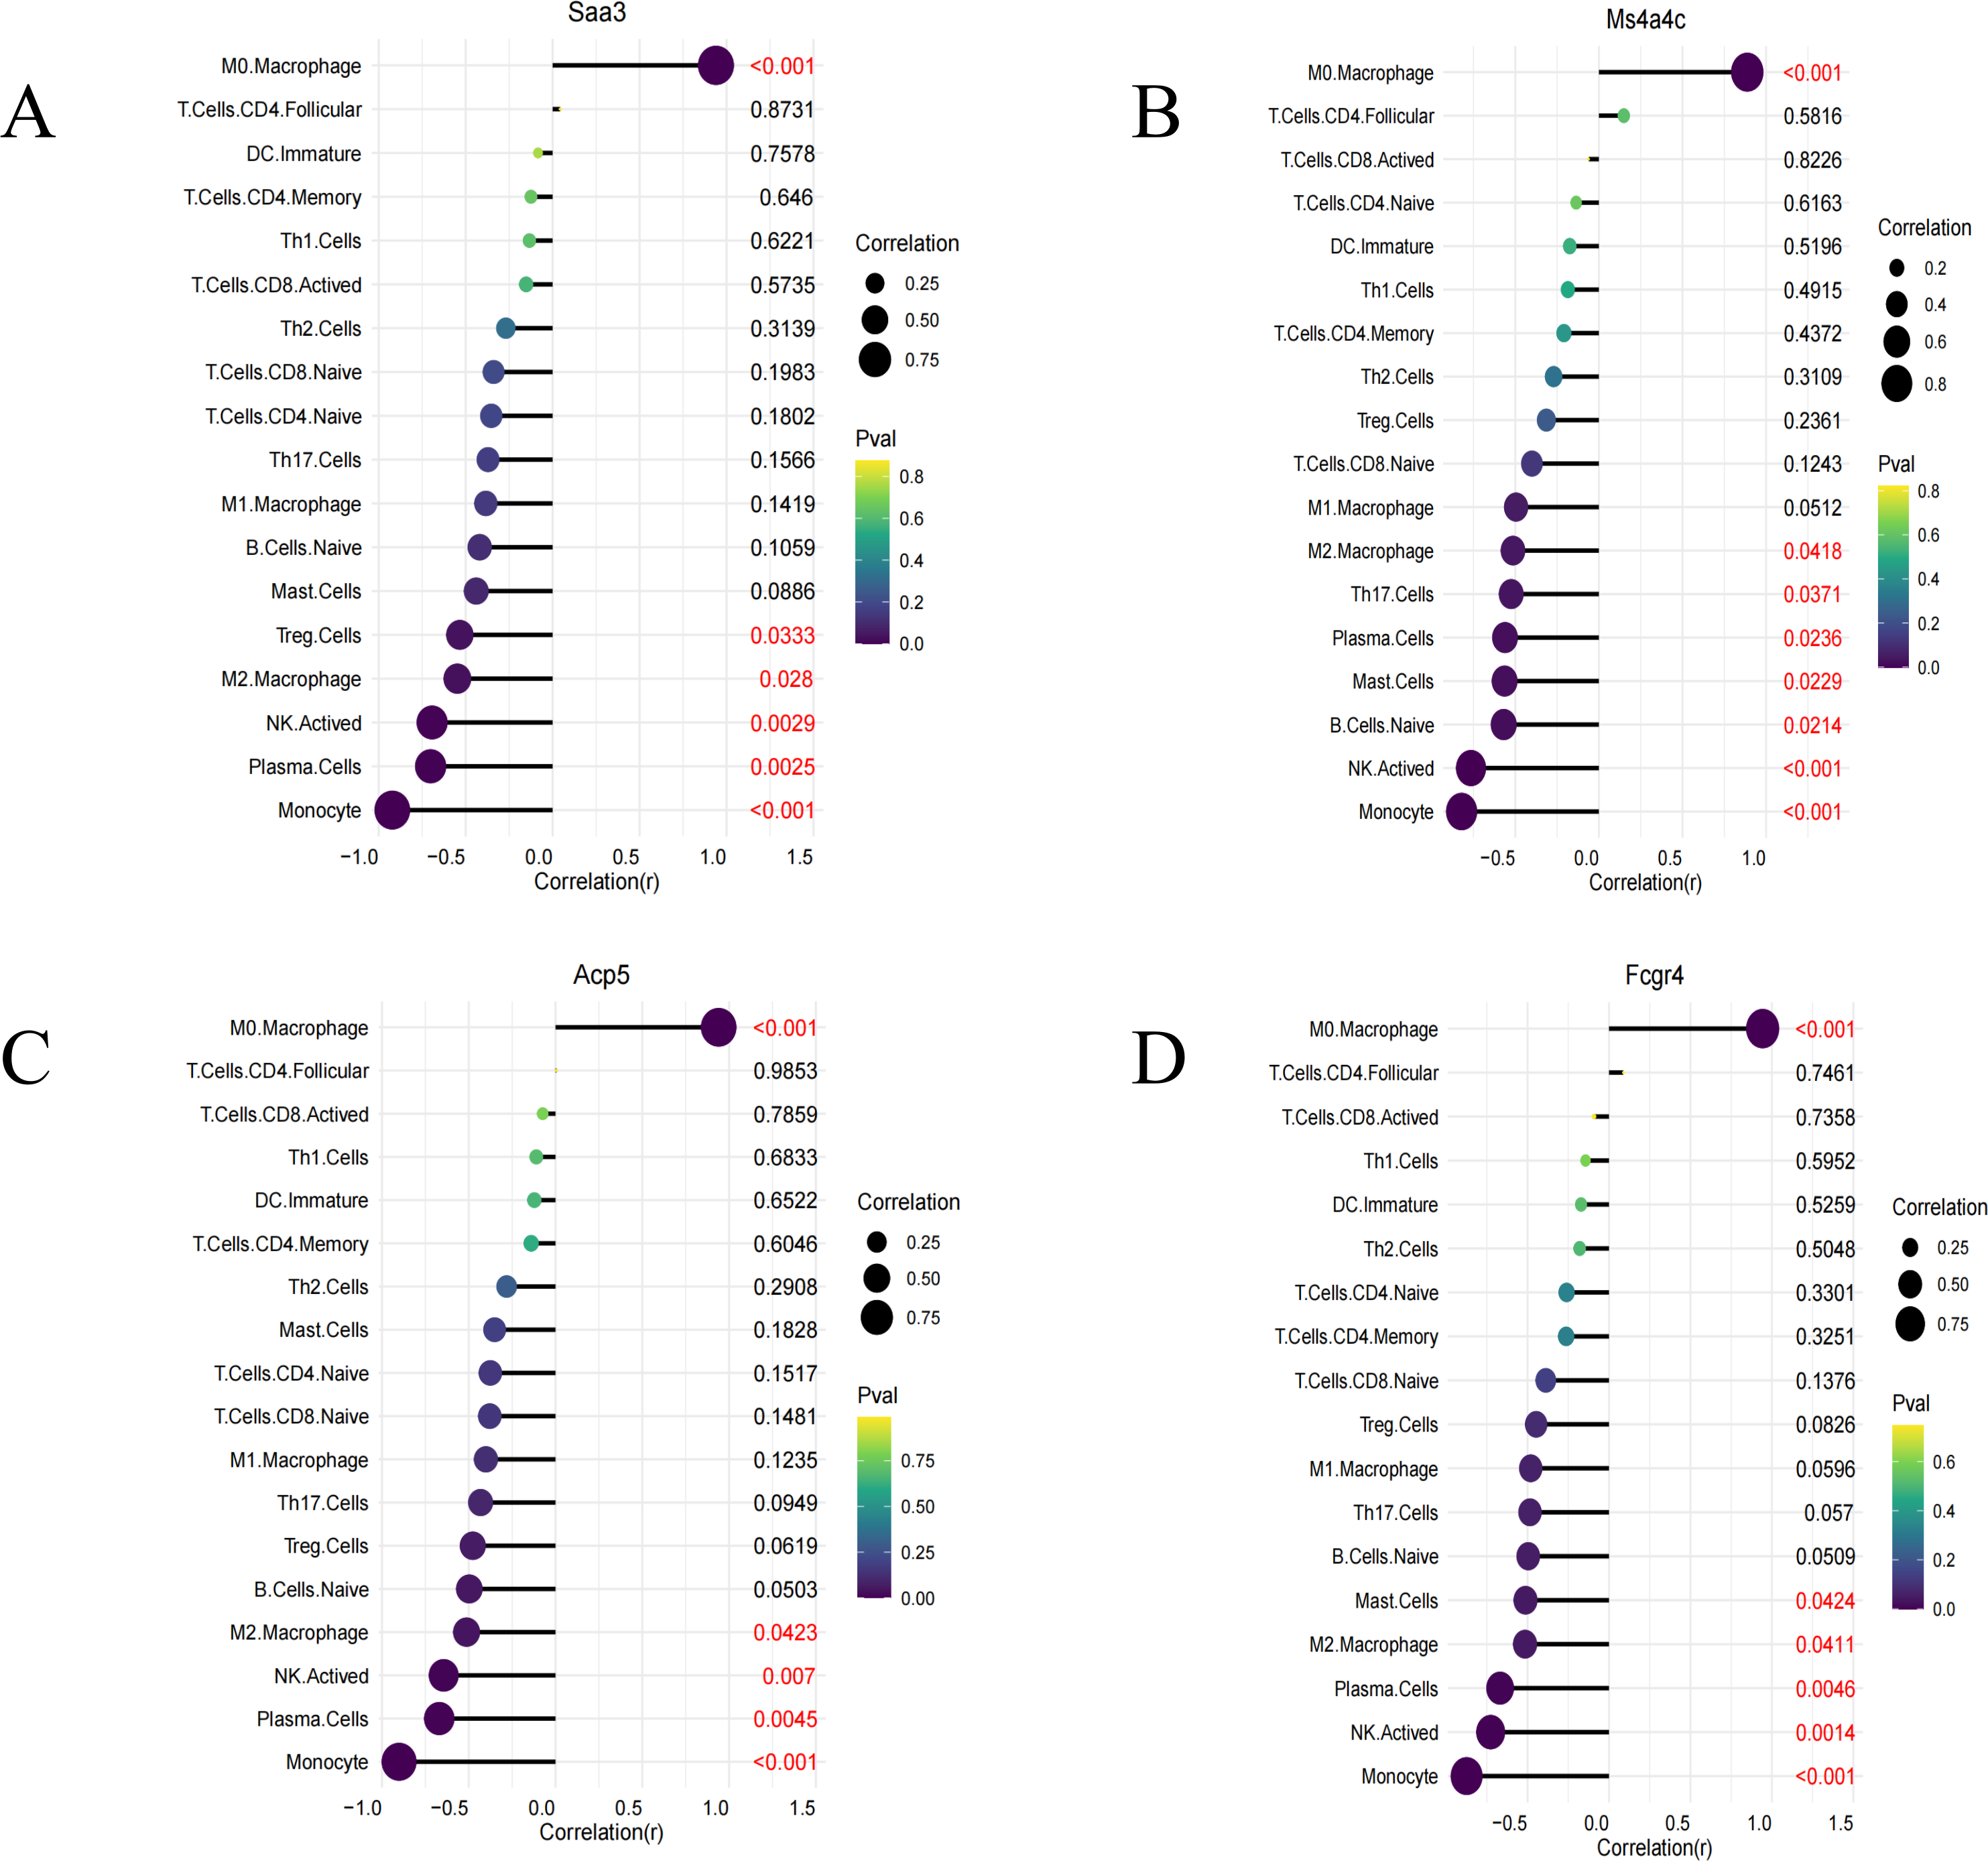
Validation of the expression of the four screened genes in different datasets
The analysis of the GSE163465 dataset revealed high expression of the key genes (Saa3, Ms4a4c, Fcgr4, and Acp5) in macrophages and monocytes in AMI (Figs. 7A–7D). Additionally, these same genes exhibited significantly high expression in AMI compared to the Sham group in the bulk RNA-seq dataset (Figs. 7E–7H). The validation results from the scRNA-seq dataset exhibited a consistent pattern with the bulk RNA-seq dataset.
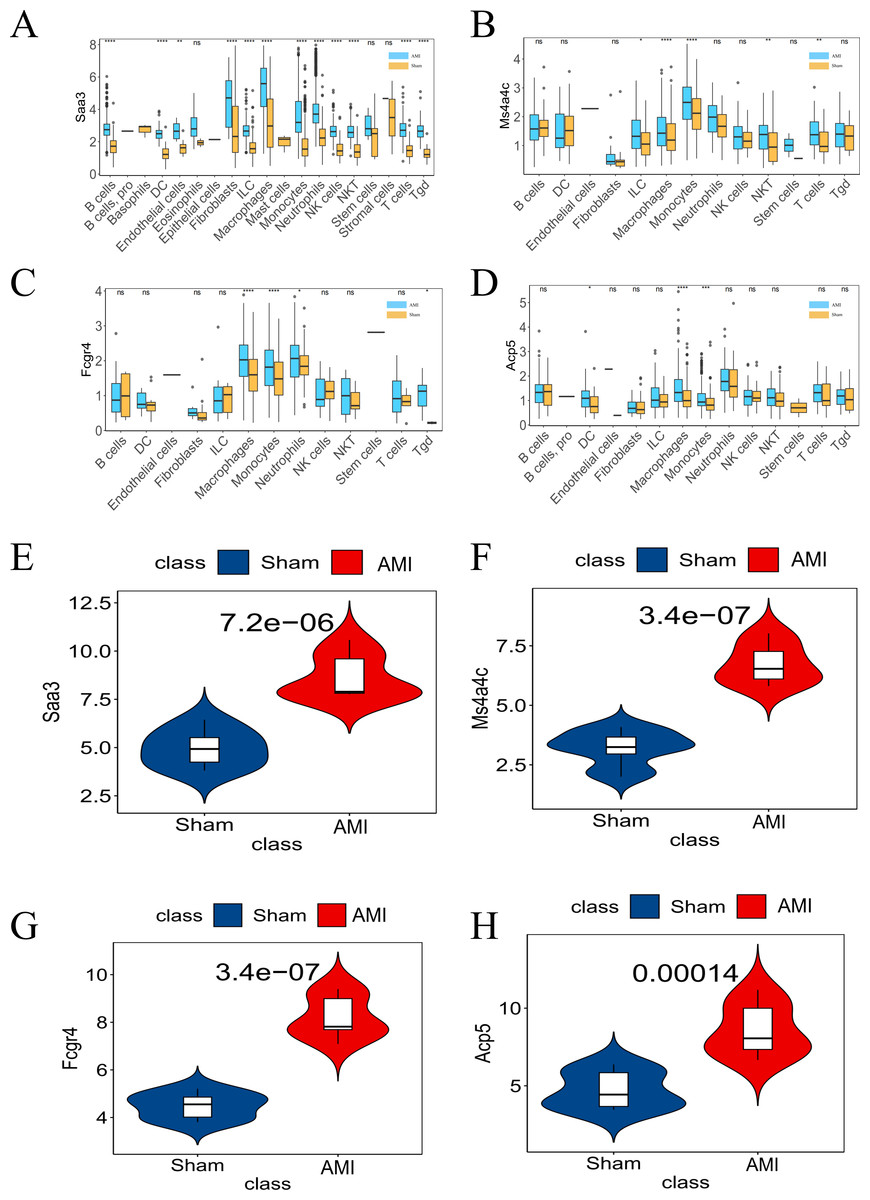
Figure 7: Differential expression of the four key genes between the AMI and the Sham groups.
(A) Saa3 expression was analyzed in the GSE163465 dataset; (B) Ms4a4c expression was analyzed in the GSE163465 dataset; (C) Fcgr4 expression was analyzed in the GSE163465 dataset; (D) Acp5 expression was analyzed in the GSE163465 dataset; (E) Saa3 expression was analyzed and validated in the GSE236374 and GSE183272 datasets; (F) Ms4a4c expression was analyzed and validated in the GSE236374 and GSE183272 datasets; (G) Fcgr4 expression was analyzed and validated in the GSE236374 and GSE183272 datasets; (H) Acp5 expression was analyzed and validated in the GSE236374 and GSE183272 datasets. The Y-axis represents the number of different key genes expressed in the cell. (*p < 0.05; **p < 0.01; ***p < 0.001; ****p < 0.0001; ns, no significance).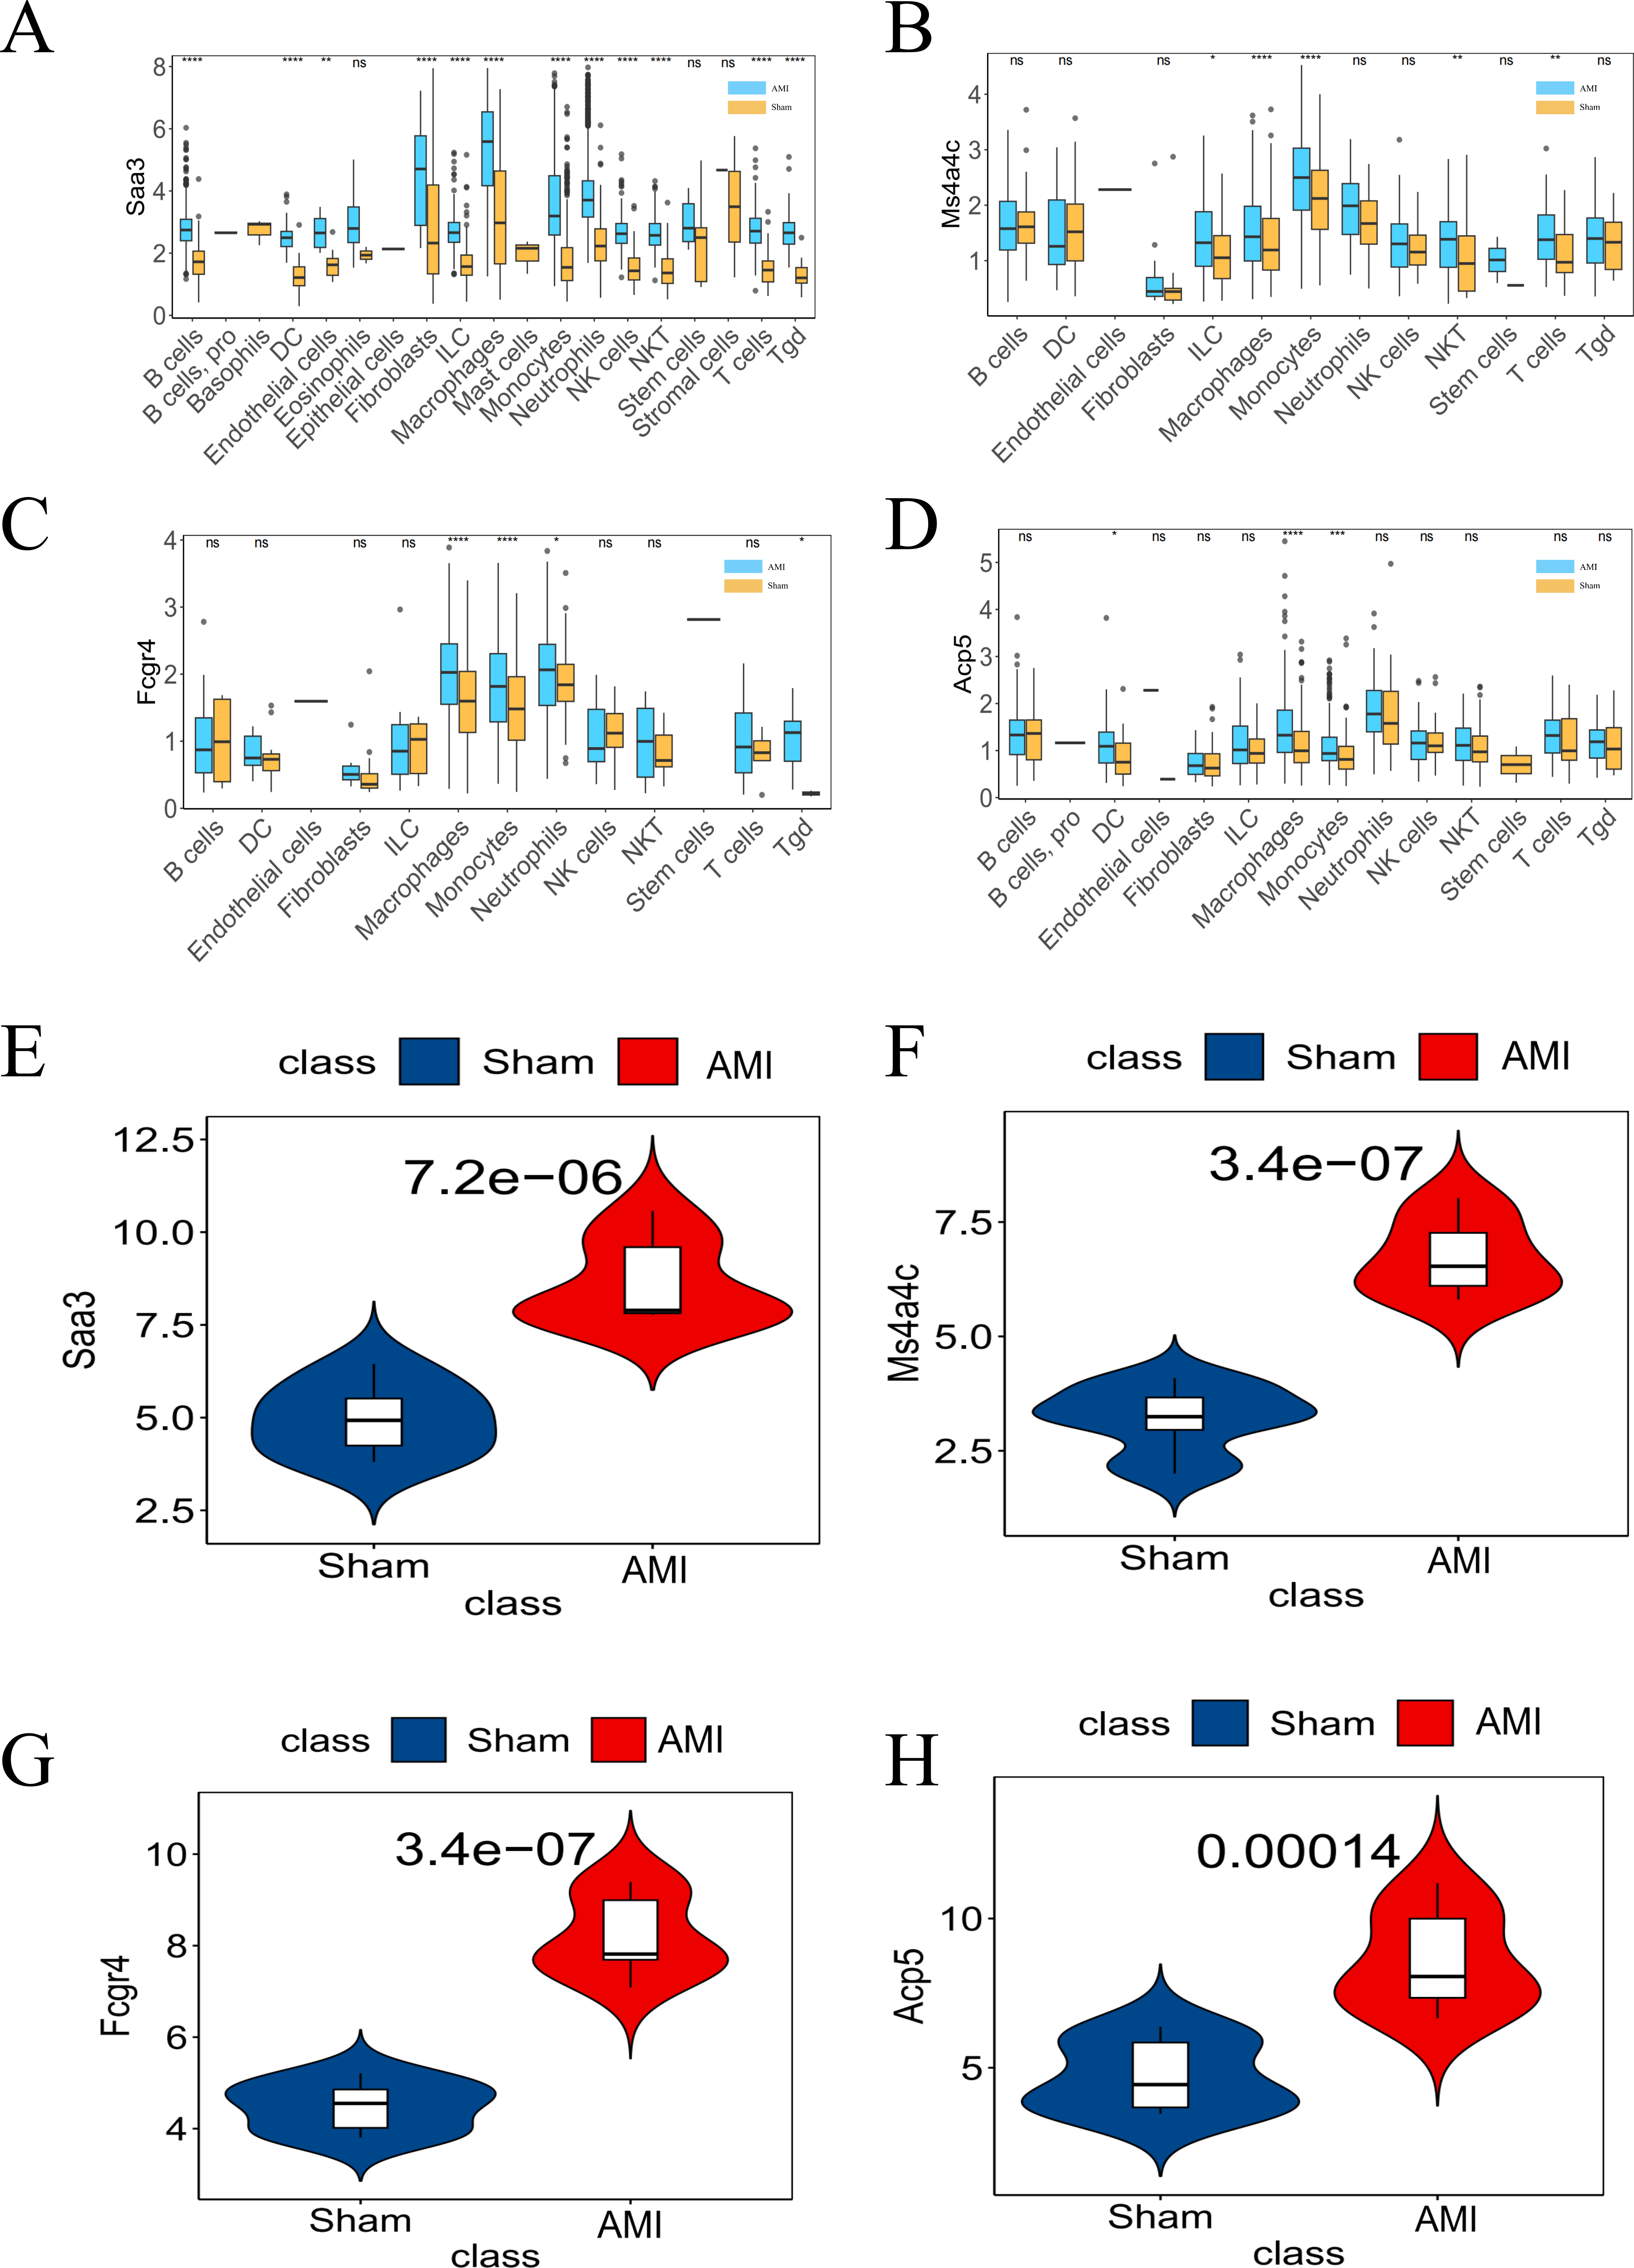
Data set validation and GSEA
Analysis results from the GSE114695 dataset demonstrated a notable increase in the expression of all the four key genes in the AMI group compared to the Sham group (Figs. 8A–8D). GSEA results revealed that Saa3 was enriched in the cytokine-cytokine receptor interaction pathway (Fig. 8E), while Ms4a4c, Acp5, and Fcgr4 were significantly enriched in the Salmonella infection pathway (Figs. 8F–8H).
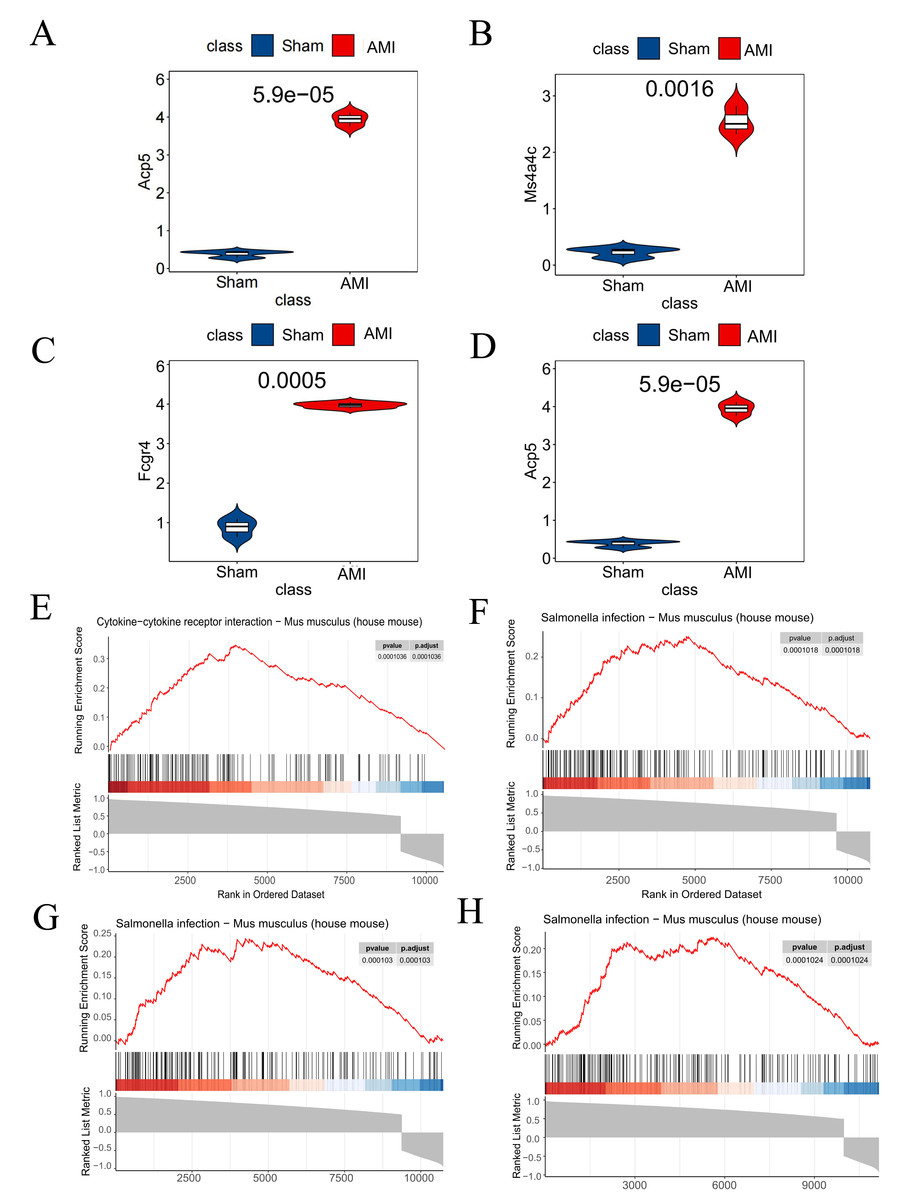
Figure 8: Dataset validation and GESA.
(A) Saa3 expression validated in the GSE114695 dataset; (B) Ms4a4c expression validated in the GSE114695 dataset; (C) Fcgr4 expression validated in the GSE114695 dataset; (D) Acp5 expression validated in the GSE114695 dataset; (E) GSEA illustrating significant enrichment pathway of Saa3; (F) GSEA illustrating significant enrichment pathway of Ms4a4c; (G) GSEA illustrating significant enrichment pathway of Fcgr4; (H) GSEA illustrating significant enrichment pathway of Acp5; (E) Serine-Cytokine receptor interaction pathway; (F–H) Salmonella infection pathway; GSEA, gene set enrichment analysis.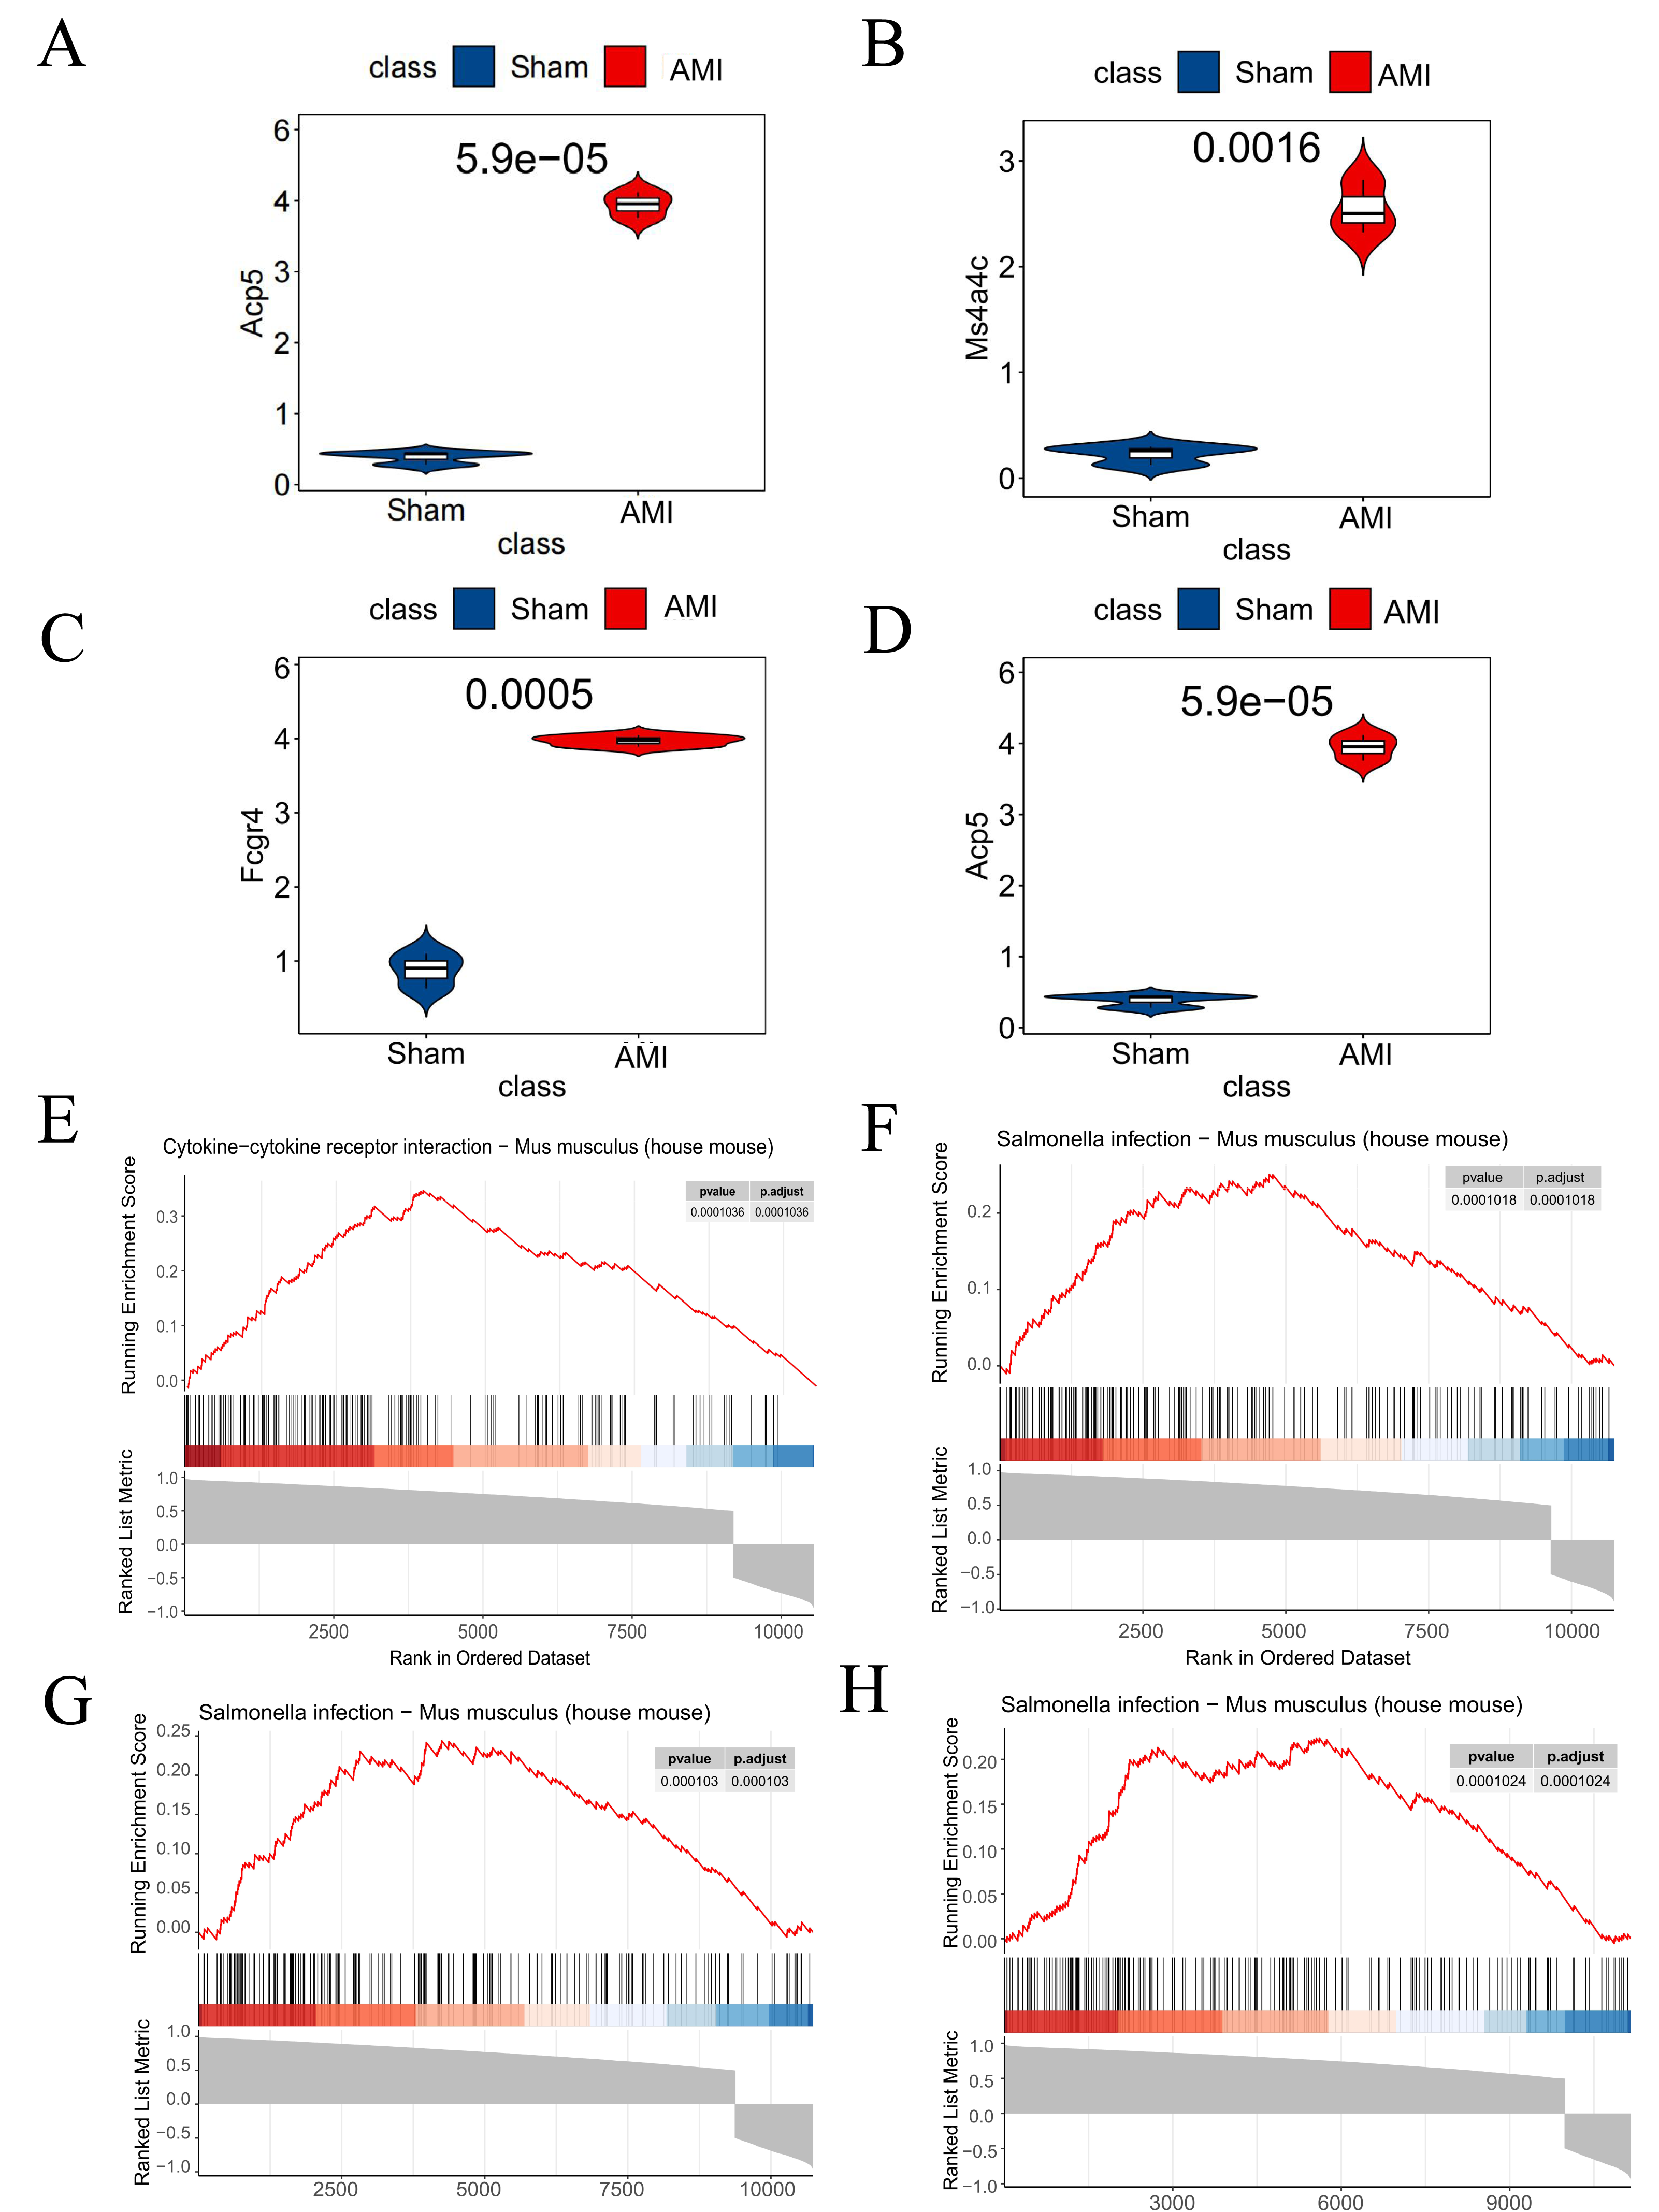
Cardiac function assessment of mice within the constructed AMI model
After 1 week of LAD coronary artery ligation in mice, the cardiac function in the left ventricle was assessed using M-mode echocardiography. Compared with the Sham group, mice in the AMI group developed cardiac systolic and diastolic dysfunction, as indicated by a significant decrease in ejection fraction (EF), fractional shortening (FS), along with an increase in LVESD (Fig. 9).
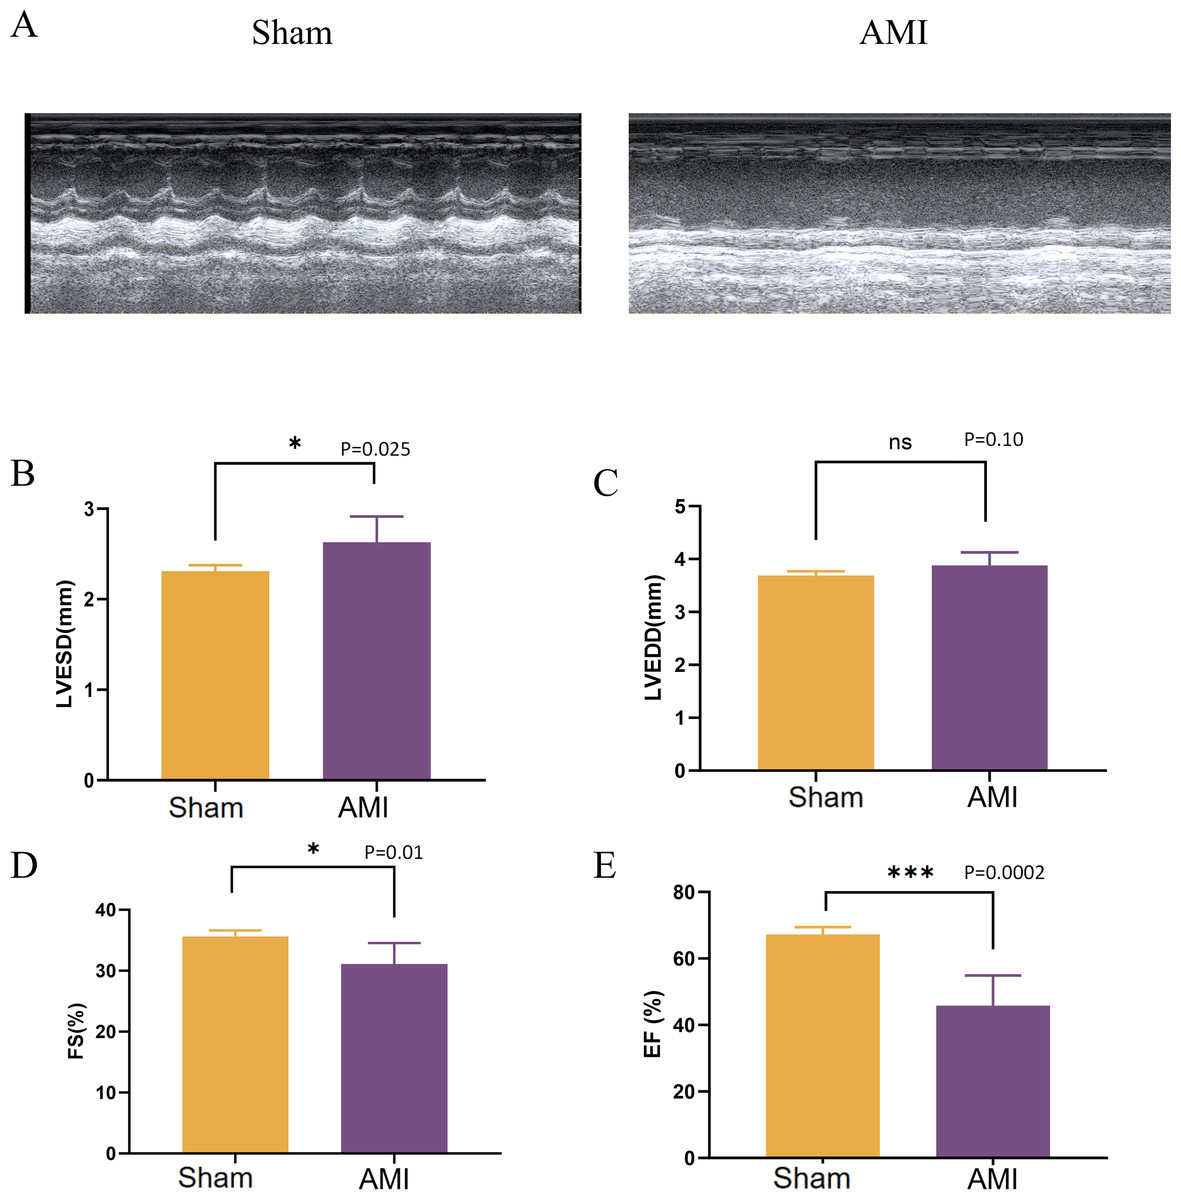
Figure 9: Evaluation of cardiac function 1 week after LAD ligation.
(A) M-mode echocardiographic images of mice in the Sham group and 1 week after LAD ligation; (B) LVESD of mice in the AMI and the Sham groups; (C) LVEDD of mice in the AMI and the Sham groups; (D) FS of mice in the AMI and the Sham groups; (E) EF of mice in the AMI and the Sham groups; LVESD, left ventricular end systolic diameter; LVEDD, left ventricular end-diastolic diameter; FS: fractional shortening; EF, ejection fraction. (*p < 0.05; **p < 0.01; ***p < 0.001; ns, no significance).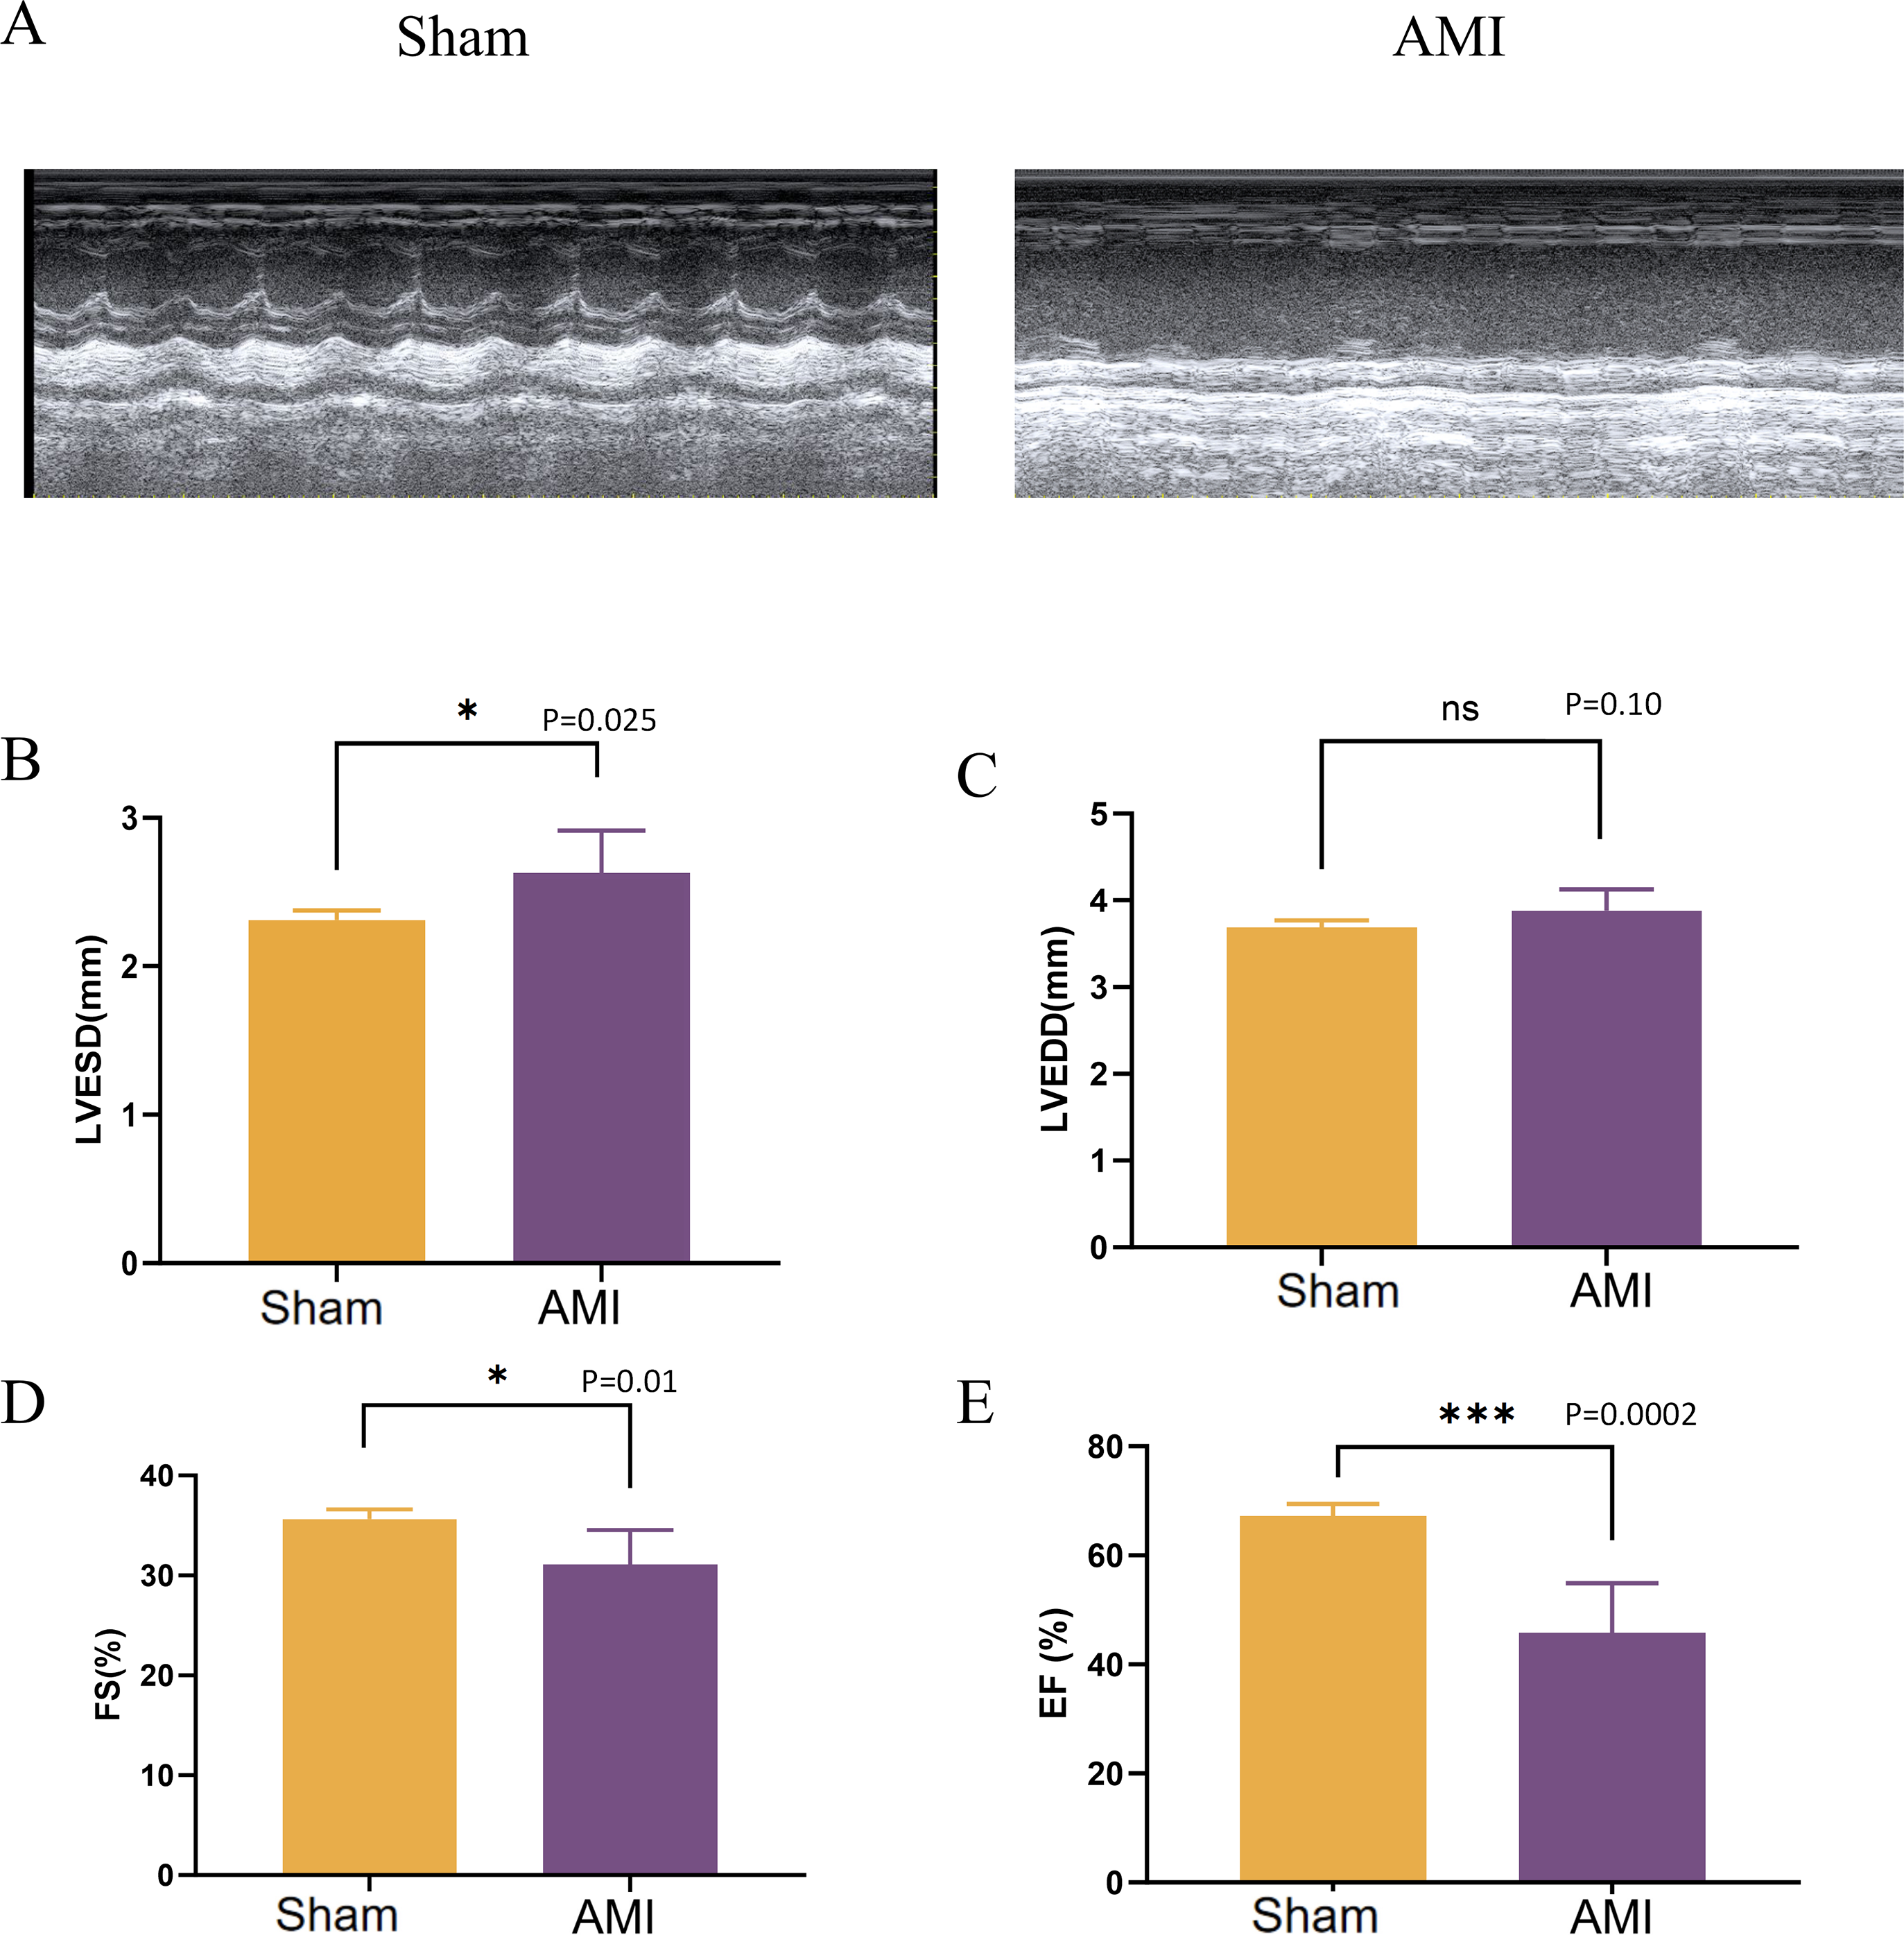
Assessment of infarct size in AMI mice
After 1 week of successful AMI modeling, the infarct area in mouse hearts was measured. The AMI group exhibited increased and much larger infarct area compared with the Sham group (Fig. 10A), confirming the successful AMI modeling.
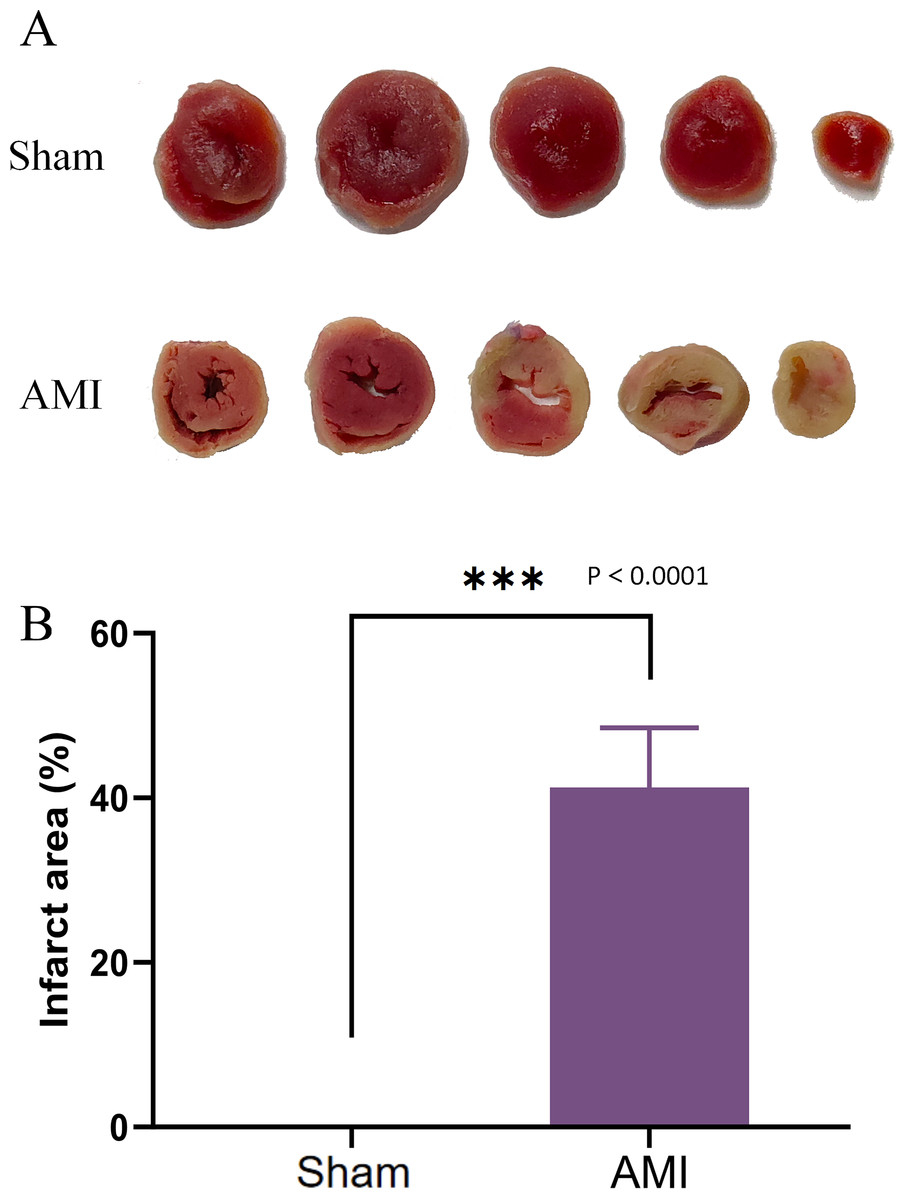
Figure 10: TTC staining of cardiac tissues.
(A) Cardiac tissues of mice in the Sham and AMI groups; (B) comparison of myocardial infarction area between the AMI and the Sham groups (***p < 0.001).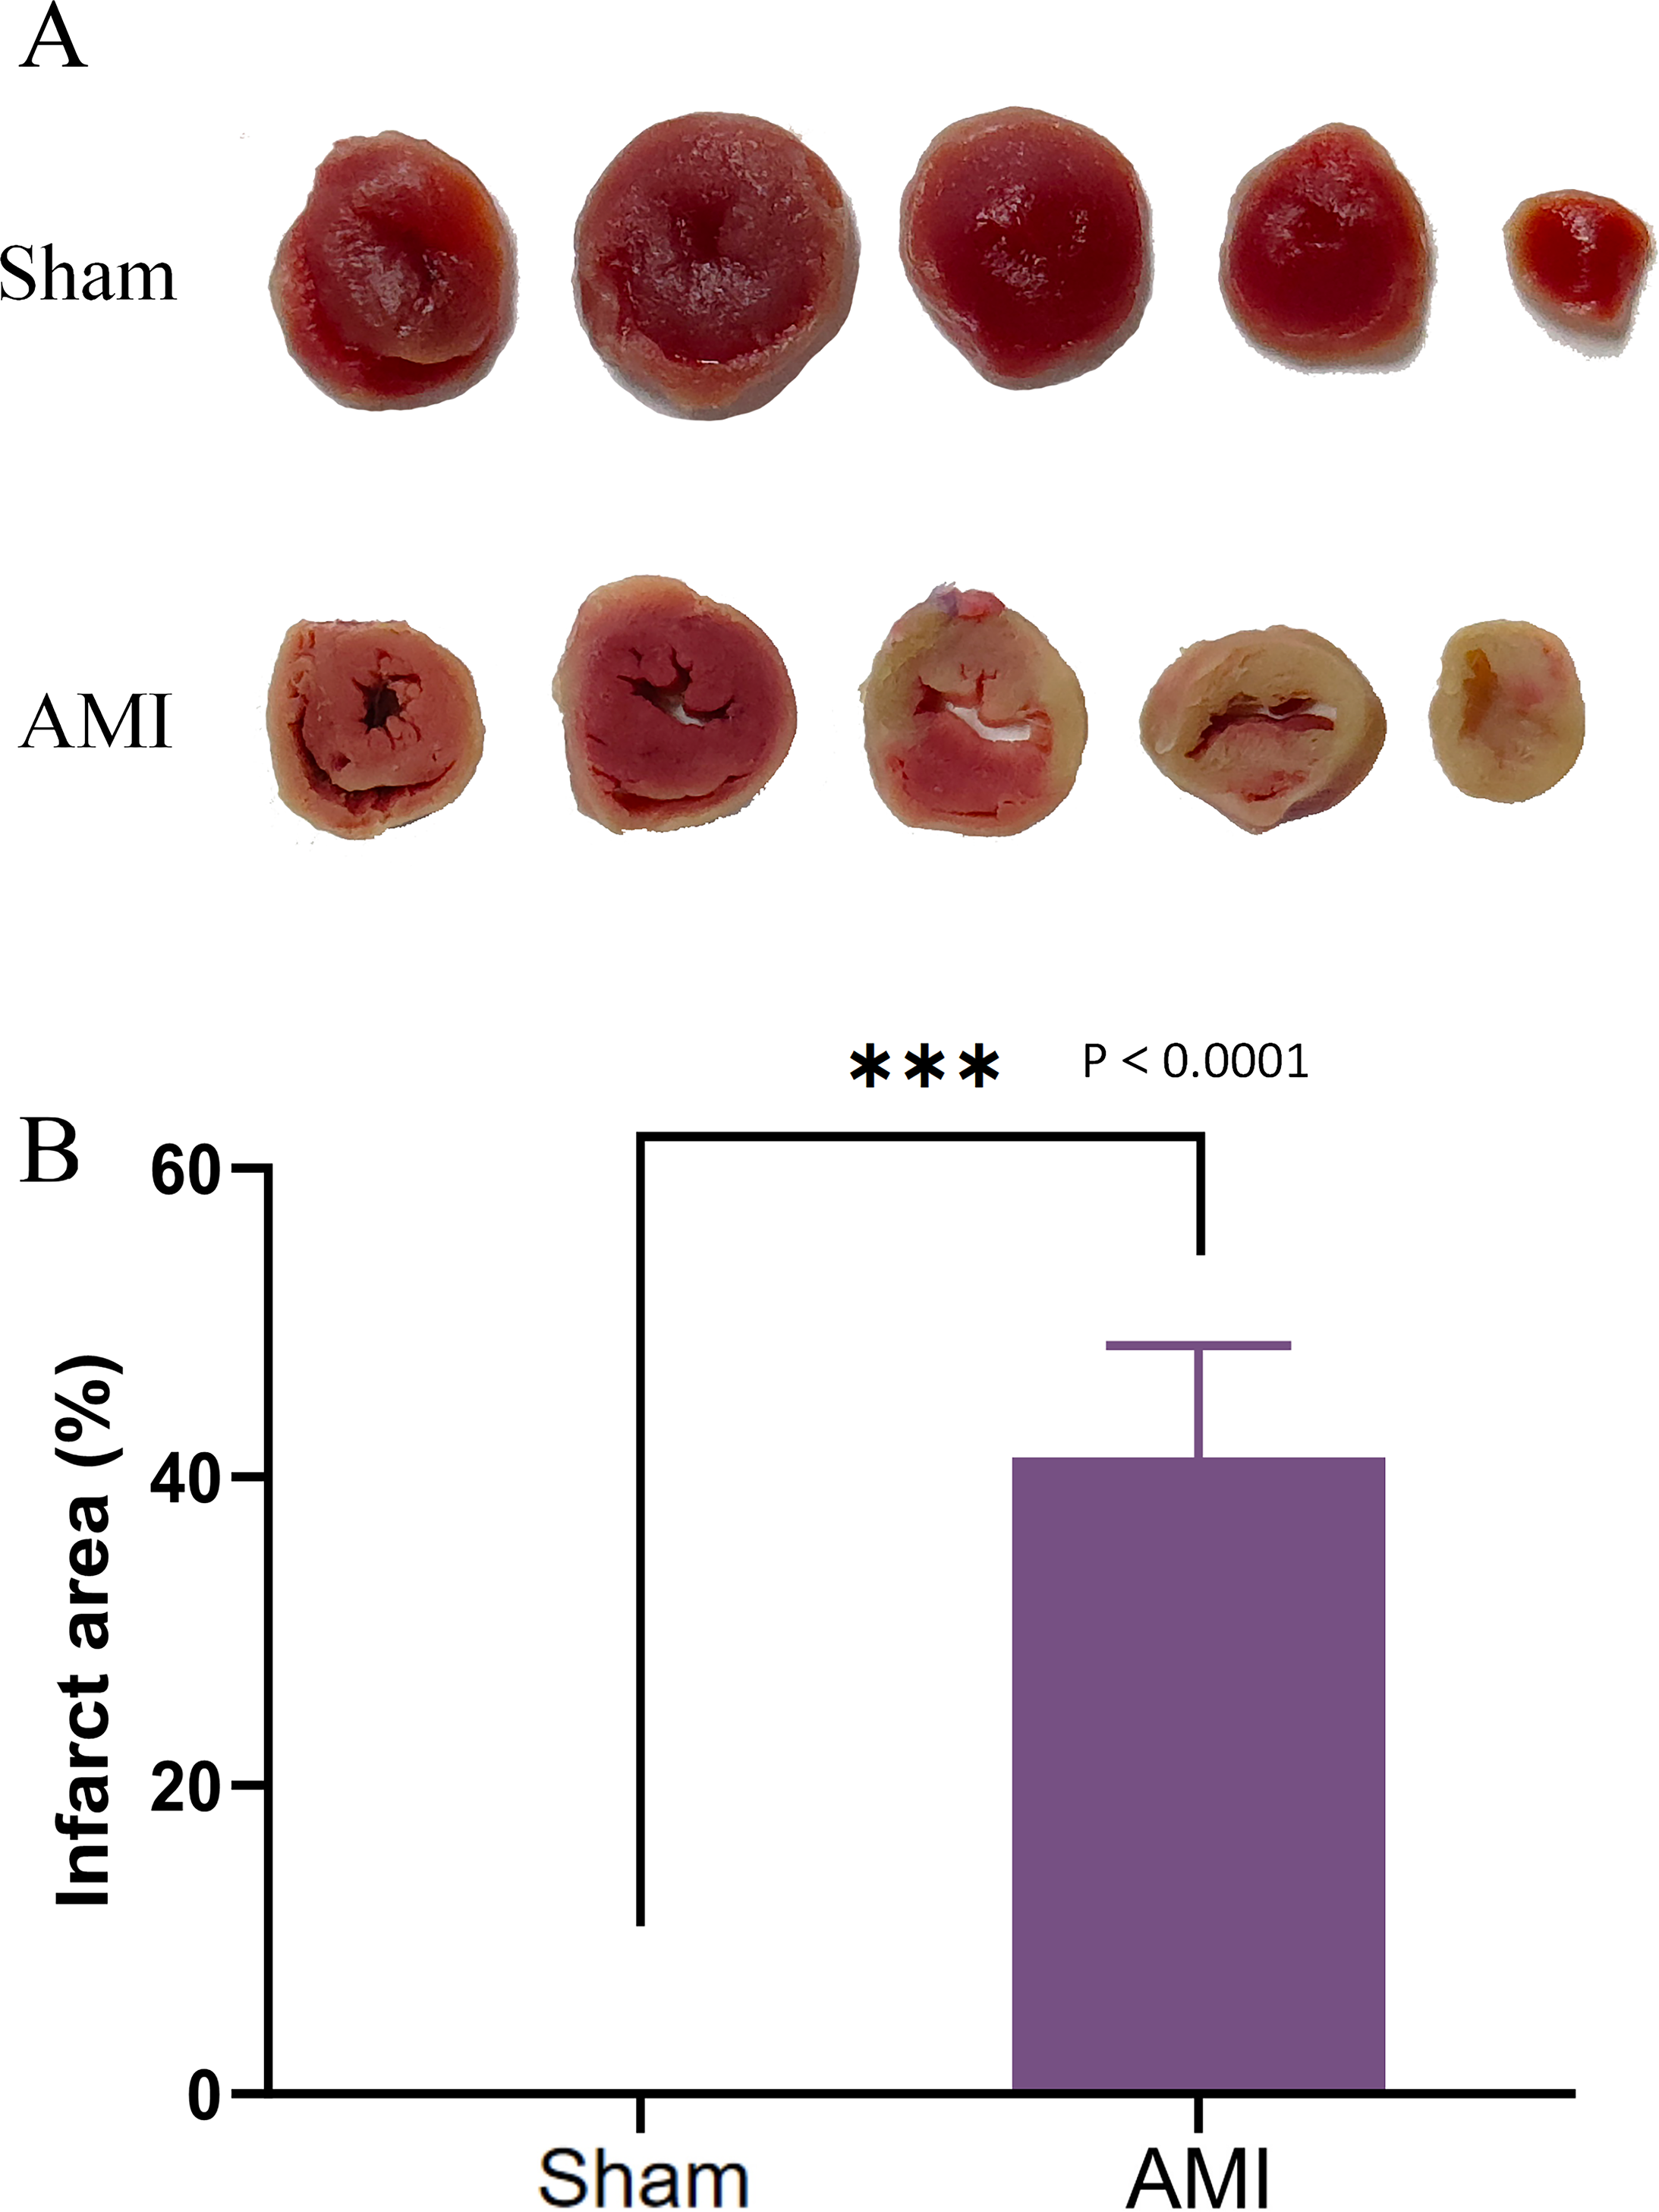
Expression validation of 4 key genes by qRT-PCR
Validation of the expression of Saa3, Ms4a4c, Fcgr4, and Acp5 was conducted using qRT-PCR. The results revealed a significant up-regulation of in cardiac macrophages in the AMI group compared to the Sham group, while no significant difference was observed in the expression of MS4A4C between the Sham and AMI groups (Figs. 11A–11D).
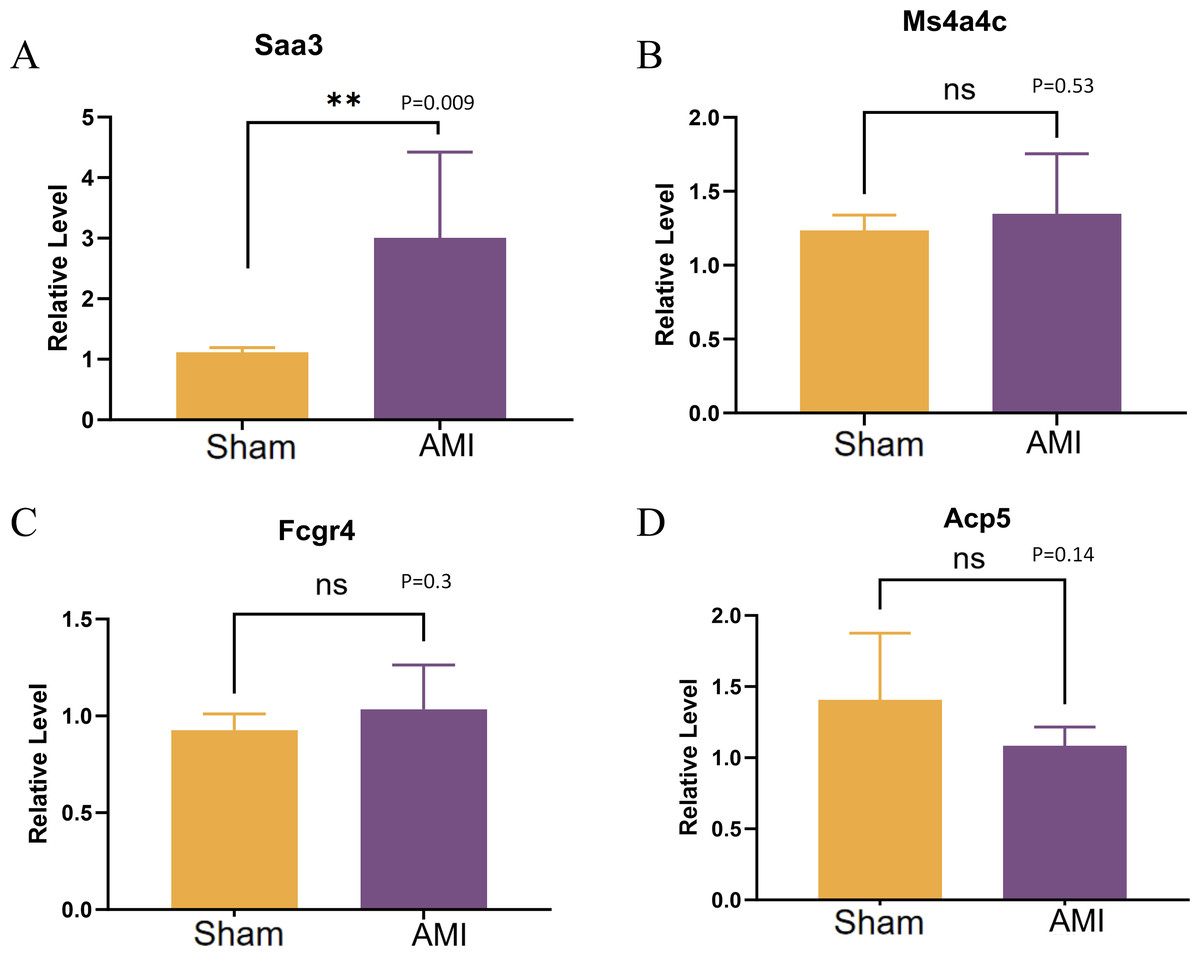
Figure 11: QRT-PCR results of key genes.
(A–D) Relative expression levels of Saa3, Ms4a4c, Fcgr4, and Acp5 were detected by qRT-PCR (**p < 0.01, ***p < 0.001; ****p < 0.0001; ns, no significance).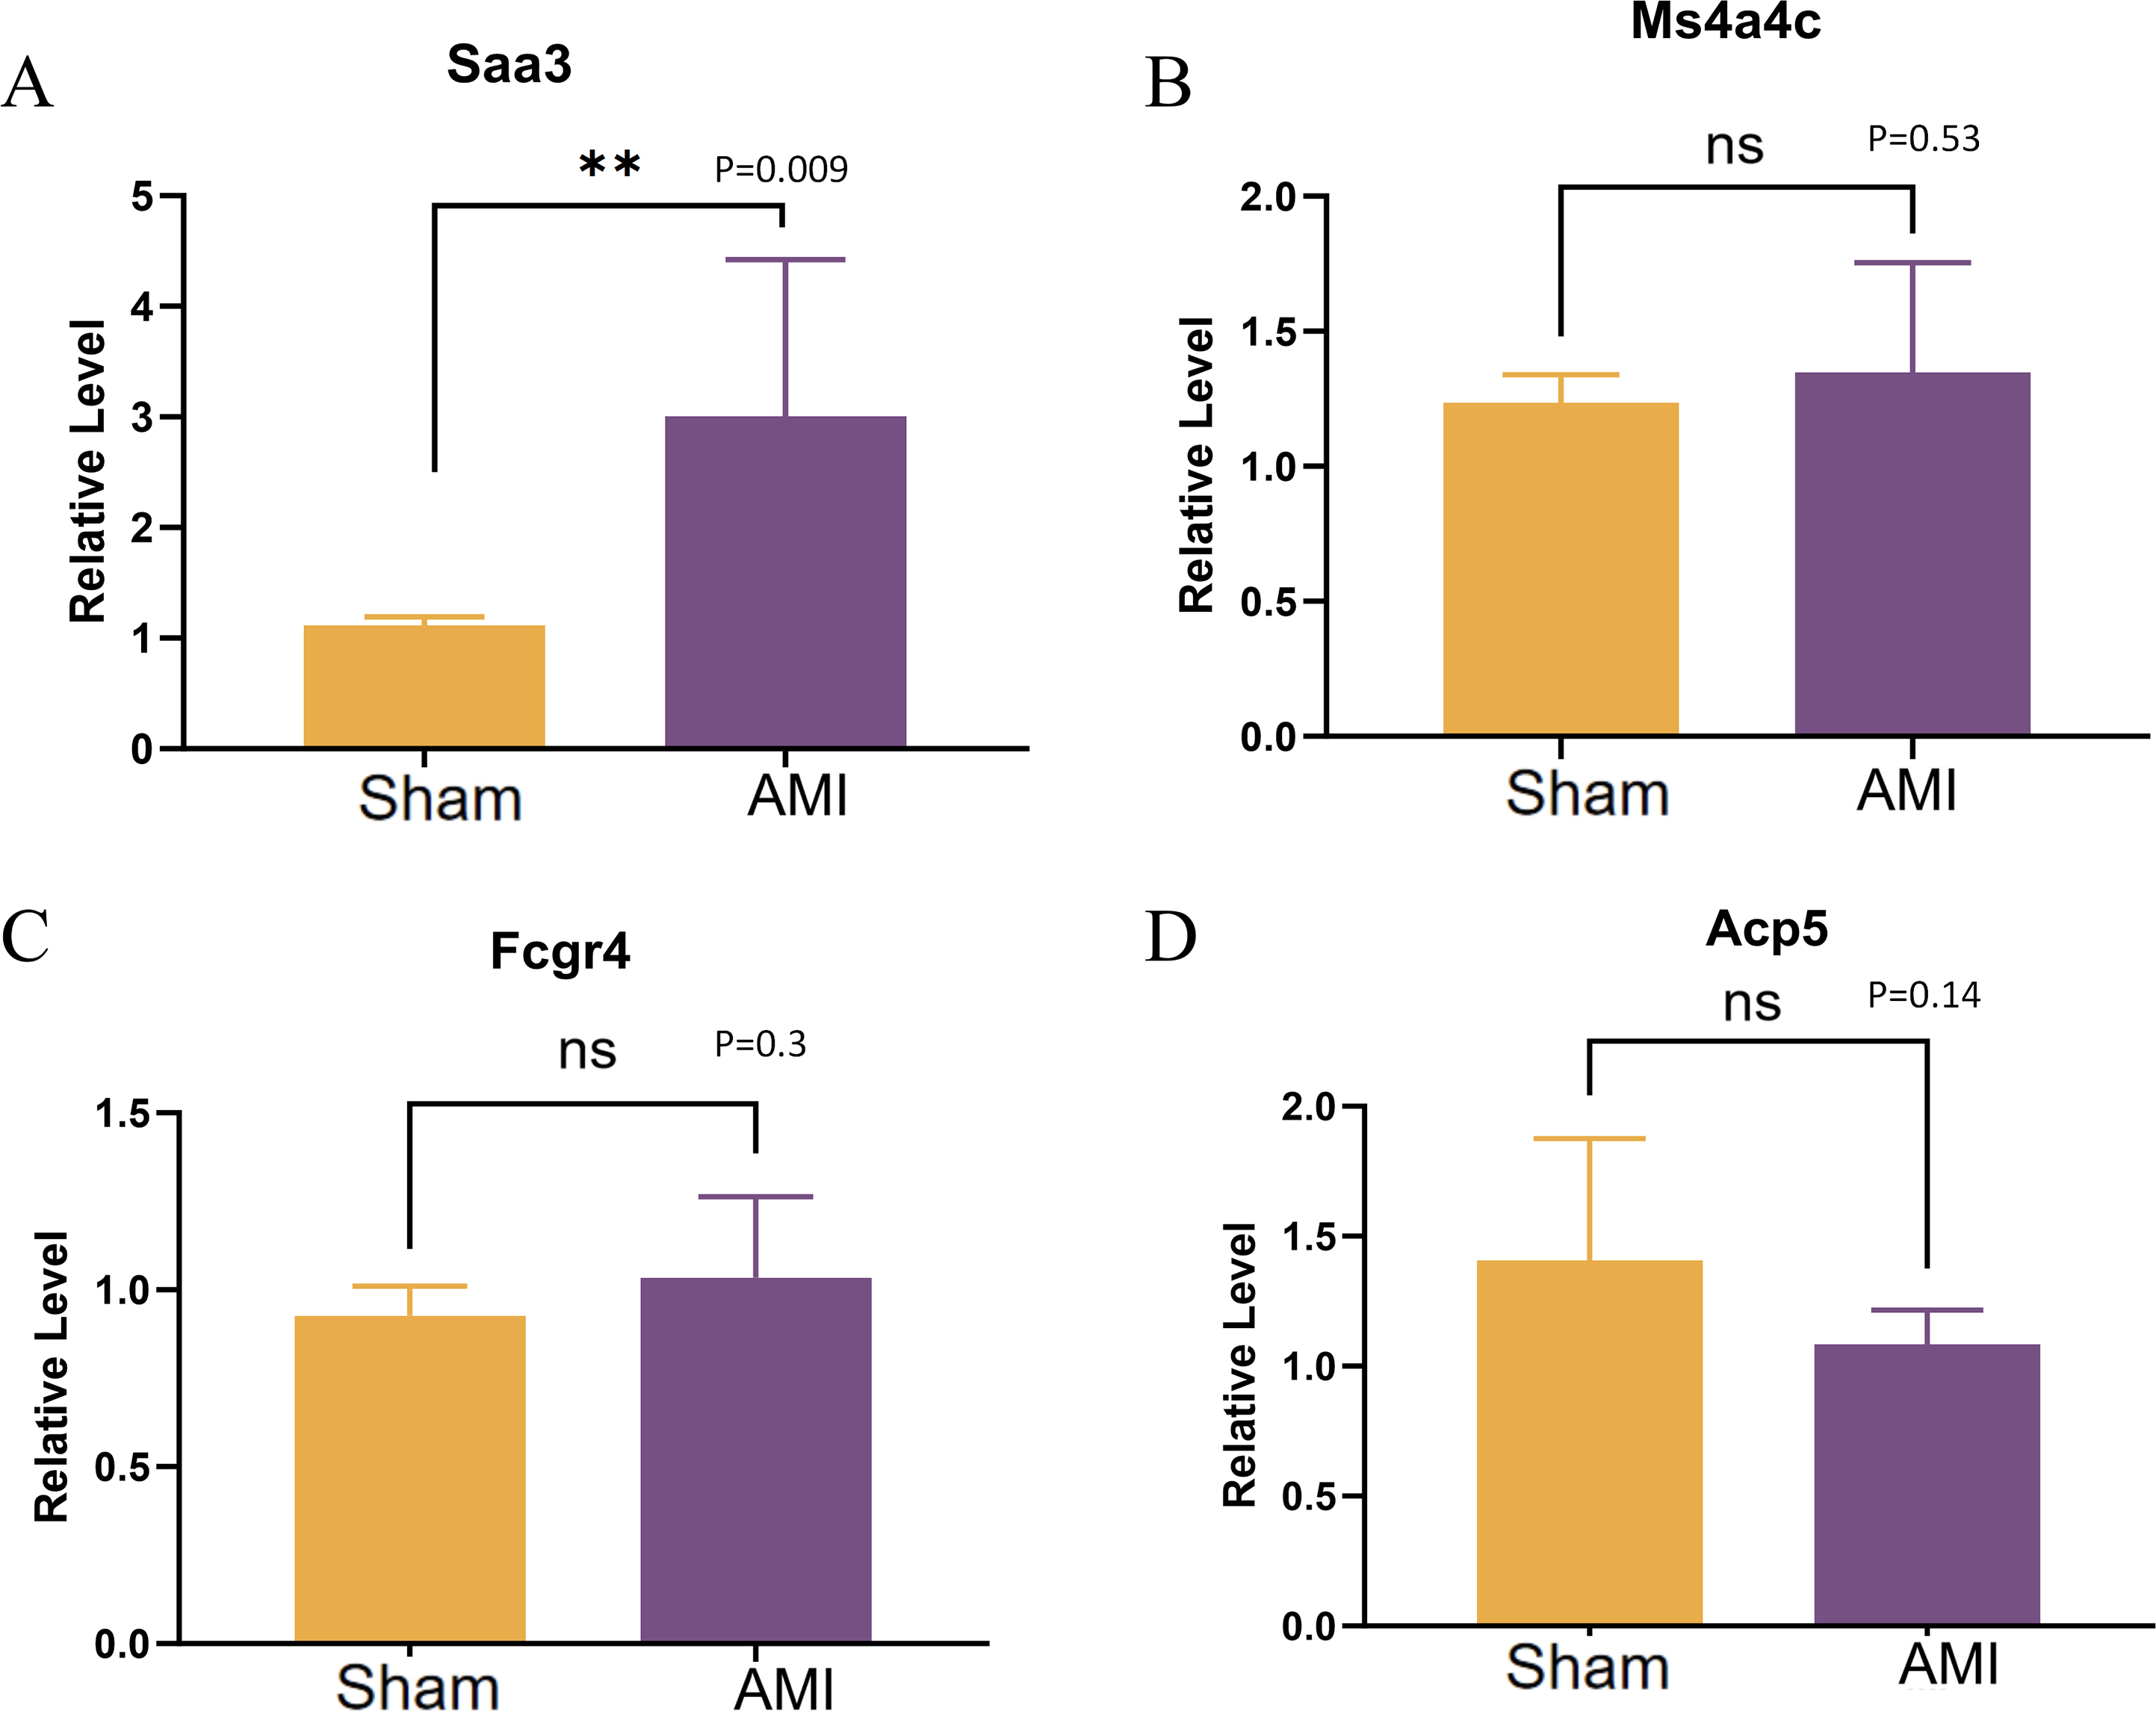
Discussion
AMI is a common cardiovascular disease characterized by partial or total obstruction of the coronary arteries, resulting in localized necrosis of a portion of the myocardium due to persistent ischemia and hypoxia (Algoet et al., 2023). AMI is the leading cause of cardiovascular disease morbidity and mortality worldwide, and has been called one of the “top killers” of human health. Excessive immune responses by M1 macrophages can lead to chronic inflammation and inflammatory diseases (Challa et al., 2024), whereas M2 macrophages are involved in tissue repair and immunomodulation (Audu et al., 2022). Following myocardial injury, macrophages are recruited to the site of injury to differentiate. The disproportionate ratio of M1/M2 macrophages causes local inflammatory responses and increased ROS production, leading to myocardial remodeling, which is a major cause of heart failure after AMI (Lee, Chang & Lin, 2017).
After AMI, there is a substantial influx of immune cells to the infarcted area, releasing activating cytokines that promote cardiac remodeling. Macrophages play an important role in this process. For instance, interleukin 34 (IL-34) has been identified to enhance CCL2 expression by activating the NF- κB pathway, thereby promoting macrophage recruitment and polarization. This exacerbates cardiac remodeling and heart failure (Zhuang et al., 2023). Therefore, it is crucial to delve deeper into the specific mechanisms of myocardial remodeling after AMI and identify macrophage-related targets involved in the post-infarction inflammatory response.
Cell clustering analysis on the GSE163465 dataset revealed significant differences in macrophages between the AMI and the Sham groups. Intercellular communication network analysis highlighted macrophages’s highest position in cellular communication, and revealed its close relation to the CCL signaling pathway.
Furthermore, WANG demonstrated that the addition of synthetic o-hyaluronic acid (o-HA) to infarcted tissues also enhanced M2 macrophage polarization through activation of chemokines Ccl2 and CXCL5 (Wang et al., 2019).
In this study, 33 Co-DEGs were identified through bioinformatics analysis. They exhibited significant differences between the AMI group and the Sham group, and were mainly enriched in the inflammatory response pathway and the PI3K-Akt-mTOR signaling pathway. The PI3K-Akt-mTOR pathway, known for its wide range of biological effects, plays an important role in mediating cell survival and proliferation (Jiang et al., 2023). Previous studies have shown that mTOR overexpression attenuates the inflammatory response in myocardial I/R injury and inhibits cardiac fibrosis (Lv et al., 2020). In addition, tanshinone IIA (tanIIA), a lipophilic component of Salvia miltiorrhiza, has demonstrated the ability to suppress inflammation and fibrosis in cardiac tissues via the PI3K/Akt/mTOR/eNOS signaling pathway (Lu et al., 2022). Gong et al. observed significant changes in p-Akt and p-mTOR in myocardial ischemia/reperfusion injury (Gong et al., 2021). The results of the above enrichment analyses suggest that the pathological mechanism of macrophage inflammatory response after infarction is closely related to inflammation mediation, which is consistent with previous studies (Wei et al., 2023).
Through GSVA, SAA3, MS4A4C, ACP5, and FCGR4 were identified as key genes highly related to the inflammatory response pathway. Experimental findings showed that mice in AMI group developed cardiac systolic and diastolic dysfunction in comparison to the Sham group. Both qRT-PCR and bioinformatics analysis of cardiac macrophages consistently revealed a substantial upregulation of Saa3, Acp5, and Fcgr4 in the AMI group compared to the Sham group.
Serum amyloid A (SAA), primarily secreted by hepatocytes, is expressed at a level of <10 mg/L in the physiological state. However, in response to inflammation and infection stimuli, Hepatocytes markedly increase SAA synthesis and secretion (Liu et al., 2023). SAA is an independent risk factor for the occurrence of AMI. The expression level of Saa3 has already been demonstrated as a marker for detecting the level of macrophage infiltration in obese adipose tissue (Sanada et al., 2016). Recent reports have shown that Saa3 also promotes atherosclerotic lipid deposition in apoE-/- mice (Thompson et al., 2018).
Tartrate-resistant acid phosphatase 5 (Acp5) is an evolutionarily conserved multifunctional phosphatase involved in skeletal development and regulation of macrophage function (Ren et al., 2018). In individuals with chronic inflammatory diseases, ACP5 has been found to function as a biomarker of systemic inflammatory load (Chen et al., 2023). ACP5 levels have also been found to correlate significantly with the severity of coronary atherosclerosis (Chen et al., 2023). Following myocardial infarction, the level of acid phosphatase (ACP) begins to rise several hours after symptom onset and lasts for 3–5 days. However, the precise mechanism underlying this phenomenon remains incompletely understood.
The Fcgr4 gene encodes the formation of fibroblast growth factor receptor 4 (FGFR4). FGFR4, also known as cluster of differentiation 334 (CD334), is an evolutionarily highly conserved tyrosine kinase. Studies indicate that fibroblast growth factor 15 (FGF15) can promote lipid oxidation and enhance glucose metabolism through FGFR4 (Huang et al., 2007). Additionally, FGF15 has been shown to inhibit hepatic inflammatory responses by activating FGFR 4 in septic mouse models (Li et al., 2022). However, the specific mechanism through which the Fcgr4 gene participates in the inflammatory response after myocardial infarction remains unclear, warranting further experimental studies for a comprehensive understanding of its role in this context.
This study presents an intriguing finding that the expression of the Saa3, Acp5, and Fcgr4 may be related to the post-AMI inflammatory response. Specifically, higher levels of Saa3, Acp5, and Fcgr4 may be observed in mice in the AMI group, suggesting that these genes may serve as potential novel targets for intervention aimed at improving AMI.
Conclusion
In conclusion, this study demonstrates the involvement of Saa3, Acp5, and Fcgr4 in the inflammatory response during AMI. Our findings indicate that targeting Saa3, Acp5, and Fcgr4 may offer a promising therapeutic approach for AMI treatment in clinical settings. Saa3, Acp5 and Fcgr4 genes may be novel targets for clinical therapy of myocardial infarction.