
Efficacy of tanshinone IIA in rat models with myocardial ischemia–reperfusion injury: a systematic mini-review and meta-analysis
- Published
- Accepted
- Received
- Academic Editor
- Vladimir Uversky
- Subject Areas
- Biochemistry, Molecular Biology, Cardiology, Hematology
- Keywords
- Myocardial ischemia-reperfusion injury, Tanshinone IIA, Superoxide dismutase, Methane dicarboxylic aldehyde, Myocardial infarction area, Systematic review, Meta-analysis
- Copyright
- © 2024 Zhang et al.
- Licence
- This is an open access article distributed under the terms of the Creative Commons Attribution License, which permits using, remixing, and building upon the work non-commercially, as long as it is properly attributed. For attribution, the original author(s), title, publication source (PeerJ) and either DOI or URL of the article must be cited.
- Cite this article
- 2024. Efficacy of tanshinone IIA in rat models with myocardial ischemia–reperfusion injury: a systematic mini-review and meta-analysis. PeerJ 12:e17885 https://doi.org/10.7717/peerj.17885
Abstract
Background
Myocardial ischemia–reperfusion injury (MIRI) refers to severe damage to the ischemic myocardium following the restoration of blood flow, and it is a major complication of reperfusion therapy for myocardial infarction. Notably, drugs such as metoprolol have been utilized to reduce ischemia–reperfusion injury. Tanshinone IIA is a major constituent extracted from Salvia miltiorrhiza Bunge. Recently, tanshinone IIA has been studied extensively in animal models for controlling MIRI. Therefore, we conducted a meta-analysis on the application of tanshinone IIA in rat models with MIRI to evaluate the therapeutic effects of tanshinone IIA.
Methods
A comprehensive search was conducted across PubMed, Web of Science, Embase, the Cochrane Library, the China National Knowledge Infrastructure database, the Wanfang database, and the Chinese Scientific Journal Database to gather studies on tanshinone IIA intervention in rat models with MIRI.We employed SYRCLE’s risk of bias tool to assess study quality. The primary outcome indicators were superoxide dismutase (SOD) and malondialdehyde (MDA). Myocardial infarction area was a secondary outcome indicator. This study was registered at PROSPERO (registration number CRD 42022344447).
Results
According to the inclusion and exclusion criteria, 15 eligible studies were selected from 295 initially identified studies. In rat models with MIRI, tanshinone IIA significantly increased SOD levels while reducing MDA levels and myocardial infarction area. Moreover, the duration of myocardial ischemia influenced the effectiveness of tanshinone IIA. However, additional high-quality research studies are needed to establish the efficacy and definitive guidelines for the use of tanshinone IIA. Animal studies demonstrated that tanshinone IIA exerted a significant therapeutic effect when the ischemia duration was less than 40 minutes. Tanshinone IIA was found to be more effective when administered via intravenous, intraperitoneal, and intragastric routes at doses above 5 mg/kg. Additionally, treatment with tanshinone IIA at all stages—prior to myocardial ischemia, after ischemia but before reperfusion, prior to ischemia and after reperfusion, and after reperfusion—showed satisfactory results.
Conclusions
Tanshinone IIA enhanced SOD activity and reduced MDA levels, thereby ameliorating oxidative stress damage during MIRI. Additionally, it reduced the myocardial infarction area, indicating its effectiveness in mitigating MIRI-induced damage in rats and demonstrating a myocardial protective effect. These findings contribute valuable insights for developing MIRI treatment strategies.
Introduction
According to the World Health Organization, ischemic heart disease remains the primary cause of death worldwide, accounting for 16% of all deaths (Wang et al., 2022). As the world’s population ages, the incidence of acute myocardial infarction rises annually (Reynolds et al., 2017). Therapies for acute myocardial infarction significantly impact the global population’s economic burdens (Pasala et al., 2022). The prompt restoration of coronary blood supply is the most effective method for preventing myocardial cell death caused by myocardial ischemic injury. This is achieved primarily through percutaneous coronary intervention, coronary artery bypass grafting operations, and thrombolytic technology (Biscaglia et al., 2022).
Myocardial ischemia–reperfusion injury (MIRI) is a secondary complication of ischemic heart disease. It occurs when blood flow is suddenly restored to the ischemic myocardium, potentially resulting in cardiac myocyte dysfunction, structural damage to cardiac cells, and cell death, all of which contribute to the deterioration of cardiac function (Evans et al., 2020; Liu et al., 2018). The cellular and molecular events involved in MIRI are complex and mediated through multiple pathways, including oxygen free radicals, energy metabolism disruption, calcium overload, autophagy, apoptosis, mitochondrial dysfunction, and microvascular injury (Chen et al., 2023; He et al., 2022). The exact mechanism of MIRI remains incompletely understood, and there is currently no comprehensive treatment available for it.
Tanshinone IIA is a lipid-soluble diterpenoid isolated from the traditional Chinese medicine Salvia miltiorrhiza Bunge (Huang et al., 2022). Owing to its anti-inflammatory, lipid-regulating, antioxidant, and anti-apoptotic effects, tanshinone IIA can prevent various cardiovascular disorders (Li, Xu & Liu, 2018). Consequently, it is commonly used in the treatment of cardiovascular diseases (Ren et al., 2019).
MIRI can impact markers such as oxidative stress and the extent of myocardial infarction. The size of the myocardial infarction area directly correlates with the severity of MIRI. During ischemia, reactive oxygen species and reactive nitrogen species, such as superoxide anions and nitric oxide, are overproduced, disrupting redox balance and leading to oxidative stress (Chen, Shi & Guo, 2021). Superoxide dismutase (SOD) and malondialdehyde (MDA) are crucial markers of oxidative stress (Tian et al., 2019).
In this study, an extensive literature review on the intervention of tanshinone IIA in MIRI rats was conducted. The therapeutic effects of tanshinone IIA were systematically evaluated in rat models with MIRI, to provide medical evidence for the clinical application of tanshinone IIA.
Materials and Methods
Protocol and registration
This article is a meta-analysis following the Reporting Items for Systematic Reviews and Meta-Analyses (PRISMA) guidelines (Page et al., 2021). The review protocol was registered with the International Prospective Register of Systematic Reviews (PROSPERO) under registration number CRD42022344447.
Search strategy
Computers were employed to search databases such as PubMed, Web of Science, Cochrane Library, Embase, the China National Knowledge Infrastructure (CNKI), the Wanfang Database, and the Chinese Scientific Journals Database (VIP). The search period extended from the inception of each database until June 10, 2024. Both subject terms and free-text words were utilized in the searches. The search phrase included three components: intervention strategy, illness, and animal species. The permitted languages were English and Chinese. Two authors (XB Zhang, and HH Jiang) separately searched English and Chinese databases for all relevant articles using the following terms: “Myocardial Reperfusion Injury”, “Injuries, Myocardial Reperfusion”, “Myocardial Reperfusion Injuries”, “Reperfusion Injuries, Myocardial”, “Myocardial Ischemic Reperfusion Injury”, “Reperfusion Injury, Myocardial”, “Injury, Myocardial Reperfusion”, “Rats”, “Rat”, “Rattus”, “Rattus norvegicus”, “Rats, Norway”, “Rats, Laboratory”, “Laboratory Rat”, “Laboratory Rats”, “Rat, Laboratory”, and “Tanshinone IIA”. The detailed search strategy is provided in Table S1.
Inclusion and exclusion criteria
The included studies met the following criteria: (1) Rat models with MIRI, specifically induced by ligation of the left anterior descending coronary artery to cause ischemia and reperfusion; (2) tanshinone IIA as an intervention, with no restrictions on dosage, route of administration, or duration of treatment; (3) randomized controlled trials; (4) SOD, methane dicarboxylic aldehyde (MDA), and myocardial infarct area as outcome measures.
The following criteria were used to exclude studies: (1) Animal species were not rats; (2) tanshinone IIA was combined with other intervention therapies; (3) studies were in the form of clinical case reports, duplicates, reviews; (4) studies were not in English or Chinese or published after June 10, 2024.
Study selection and data extraction
Two researchers (XB Zhang and LL Zhang) independently conducted the literature search, data extraction, and cross-checking. Contentious matters were discussed and resolved with the assistance of a third party (CJ Li). Duplicate material was filtered out using EndNote X9 software to begin the screening process. The second phase involved reading the titles and abstracts of the literature to eliminate unrelated works. Finally, the full texts of the remaining articles were reviewed and evaluated against the inclusion criteria to identify those that met them.
Assessment of risk of bias in individual studies
The SYRCLE’s risk of bias tool was employed to evaluate the risk of bias in experimental animal research (Sun et al., 2020). Two authors (XB Zhang, and C Chen) independently assessed the quality of the included studies using this tool, analyzing sequence generation, baseline characteristics, allocation concealment, random housing, blinding, random outcome assessments, incomplete outcome data, selective outcome reporting, and other sources of bias. Disagreements on quality assessment were resolved through discussion and consensus. A “yes” indicated a low risk of bias in the study, a “no” suggested a high risk of bias, and “unclear” meant that there were insufficient details to determine the study’s risk of bias.
Statistical analysis
The meta-analysis was conducted using RevMan 5.4 (Cochrane Collaboration, London, UK) and Stata 16.0 software (Stata Corp, College Station, TX, USA). Data were compiled based on relative risk (RR) with a 95% confidence interval (CI). For measurement data, the standard mean difference or mean difference (MD) with a 95% CI was used. Under minimal heterogeneity (p > 0.1, I2 < 50%), a fixed-effect model was used to combine statistics, while under substantial heterogeneity (p ≤ 0.1, I2 ≥ 50%), a random-effect model was employed. Meta-analysis was conducted using the random-effects model to aggregate RR. To identify the sources of heterogeneity, subgroup and sensitivity analyses were performed. Publication bias was assessed using Egger’s test and funnel plots.
Results
Study selection
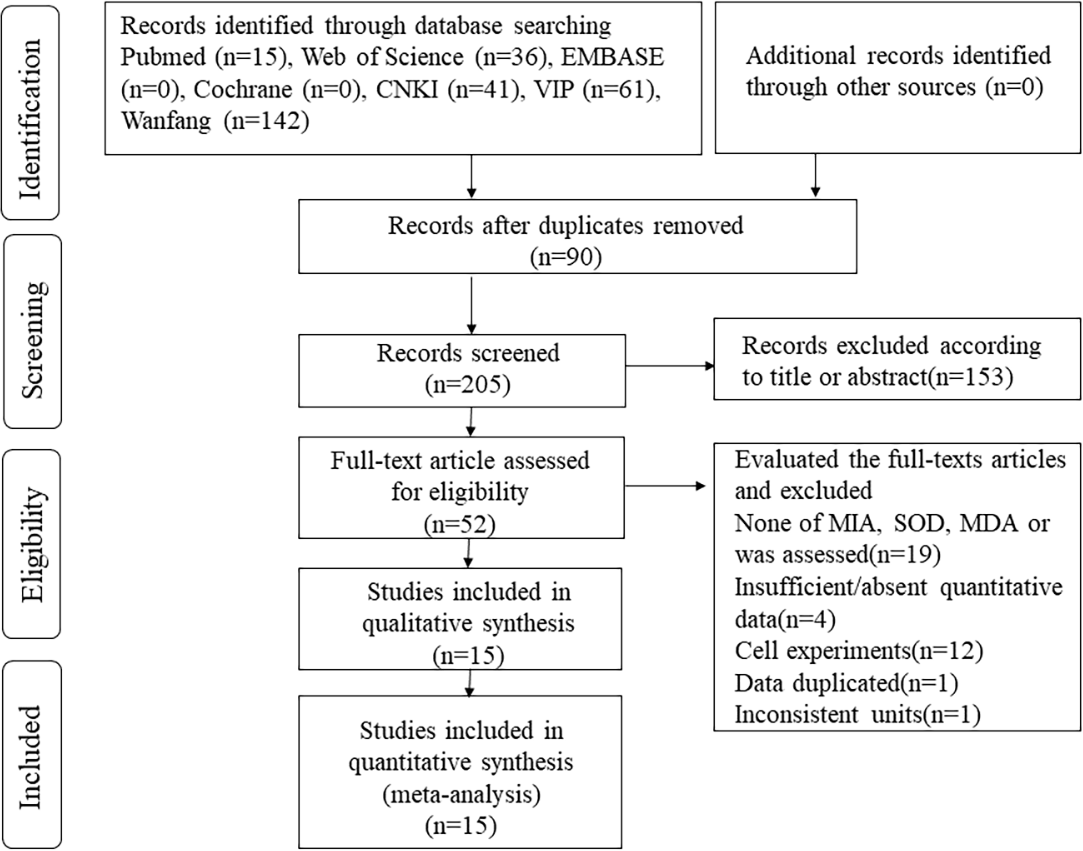
Based on the specified article search strategy, 295 articles were initially identified. Using EndNote X9 software, 90 duplicates were removed. Subsequently, after the review of titles and abstracts, 153 articles were excluded. Upon full-text review, an additional 37 articles were eliminated. Ultimately, 15 articles were included in the meta-analysis (Fig. 1).
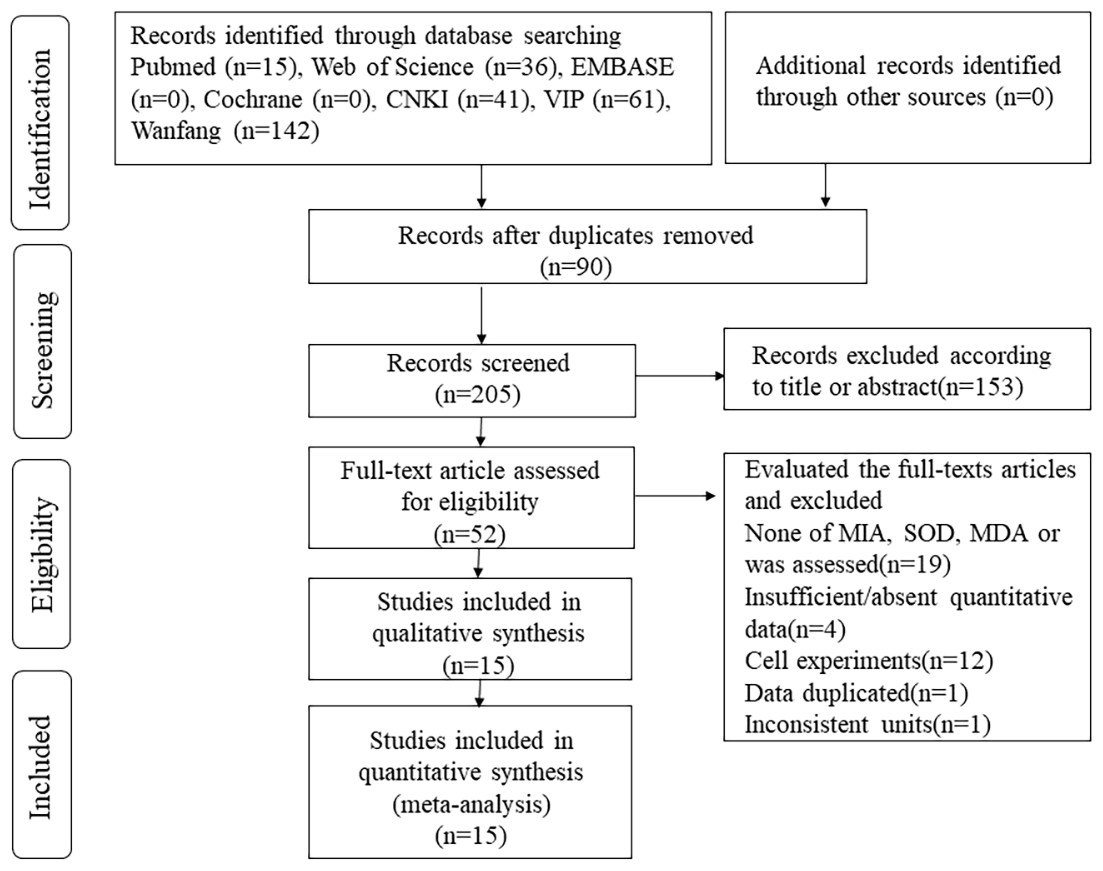
Figure 1: Flow diagram of the literature selection process.
Study characteristics
This meta-analysis included 15 articles: eight written in Chinese (Yang, 2010; Hu et al., 2015; Ma et al., 2017; Jiao, 2016; Dai et al., 2013; Ding, Wang & Huang, 2020; Tang et al., 2017; Zhang & Zhang, 2010) and seven written in English (Li et al., 2016; Yuan et al., 2014; Zhai et al., 2024; Fu et al., 2007; Wei et al., 2014; Li et al., 2022; Shen et al., 2018). All studies were from China. The meta-analysis involved 488 rats: 168 in the control group and 320 in the experimental group. In the experimental group, tanshinone IIA was administered, while the control group received normal saline, blank, or carboxymethyl cellulose sodium. The method used in the included articles to induce rat models with MIRI involved ligation and subsequent release of the left anterior descending coronary artery. SOD was assessed as an outcome measure in nine studies, MDA in eight studies, and myocardial infarct area in 10 studies. Detailed characteristics of the included articles are provided in Table 1.
| Study | Species | Sex | Age | Weight | Ischemiaduration | Reperfusionduration | Groups (n) | Dose | Route | Treatment time |
Outcome measure |
|---|---|---|---|---|---|---|---|---|---|---|---|
| Ding, Wang & Huang (2020) | SD | Male | ? | 210∼270 g | 40 min | 120 min | Control (n = 13) TSA II A-L (n = 13) TSA II A-H (n = 13) |
NS 4 ml kg−1 d−1 8 mg kg−1 d−1 16 mg kg−1 d−1 |
i.p i.p i.p |
Prior to ischemia |
MIA, SOD |
| Ma et al. (2017) | SD | Male | 8∼12 W | 180∼220 g | 30 min | 180 min | Control (n = 16) TSA II A (n = 16) |
NS 20 mg kg−1 d−1 |
i.g i.g |
Prior to ischemia | MIA |
| Tang et al. (2017) | SD | Male | 8W | 260∼280 g | 30 min | 480 min | Control (n = 10) TSA II A (n = 10) |
NS 30 mg kg−1 d−1 |
i.g i.p |
Prior to ischemia | SOD |
| Jiao (2016) | SD | Male | 7∼8 W | 250∼280 g | 30 min | 120 min | Control (n = 10) TSA II A (n = 10) |
not intervene 15 mg kg−1 d−1 |
- i.g |
Prior to ischemia | MDA, SOD |
| Li et al. (2016) | SD | Male | ? | 210∼250 g | 30 min | 120 min | Control (n = 13) TSA II A-L (n = 13) TSA II A-H (n = 13) |
not intervene 10 mg kg−1 d−1 20 mg kg−1 d−1 |
- i.v i.v |
Prior to ischemia | MIA |
| Hu et al. (2015) | Wistar | Male | 20∼32 W | 260∼300 g | 20 min | 60 min | Control (n = 10) TSA II A-L (n = 10) TSA II A-M (n = 10) TSA II A-H (n = 10) |
not intervene 10 mg kg−1 d−1 20 mg kg−1 d−1 40 mg kg−1 d−1 |
- i.p i.p i.p |
Prior to ischemia | MIA, SOD, MDA |
| Yuan et al. (2014) | SD | Male | ? | 250∼300 g | 30 min | 120 min | Control (n = 16) TSA II A-L (n = 8) TSA II A-M (n = 16) TSA II A-H (n = 8) |
not intervene 5 mg kg−1 d−1 10 mg kg−1 d−1 20 mg kg−1 d−1 |
- i.v i.v i.v |
Prior to ischemia | MIA |
| Dai et al. (2013) | SD | Male | ? | 240∼320 g | 30 min | 120 min | Control (n = 8) TSA II A-L (n = 8) |
not intervene 30 mg kg−1 d−1 |
- i.v |
Prior to ischemia | SOD |
| Zhang & Zhang (2010) | Wistar | ? | ? | ? | 30 min | 120 min | Control (n = 20) TSA II A (n = 20) |
NS 15 mg kg−1 d−1 |
i.g i.g |
Prior to ischemia | MDA |
| Yang (2010) | Wistar | Male | ? | 250∼300 g | 15 min | 30 min | Control (n = 8) TSA II A-L (n = 8) TSA II A-M (n = 8) TSA II A-H (n = 8) |
NS 5 mg kg−1 d−1 10 mg kg−1 d−1 20 mg kg−1 d−1 |
i.g i.g i.g i.g |
Prior to ischemia | MIA, MDA |
| Fu et al. (2007) | SD | Male | ? | 280∼300 g | 45 min | 120 min | Control (n = 13) TSA II A-L (n = 13) TSA II A-M (n = 13) TSA II A-H (n = 13) |
0.5% CMC-Na 15 mg kg−1 d−1 30 mg kg−1 d−1 60 mg kg−1 d−1 |
i.g i.g i.g i.g |
Prior to ischemia | SOD, MDA |
| Wei et al. (2014) | SD | Male | ? | 250∼300 g | 30 min | 24 h | Control (n = 8) TSA II A (n = 8) |
NS 8 mg kg−1 d−1 |
i.p i.p |
Before reperfusion and after reperfusion |
MIA, SOD, MDA |
| Shen et al. (2018) | SD | Male | ? | 200–210 g | 45 min | 120 min | Control (n = 7) TSA II A (n = 7) |
NS 7.912 mg kg−1 d−1 |
i.g i.g |
Prior to ischemia | MIA, SOD, MDA |
| Zhai et al. (2024) | SD | Male | 8∼9 W | 23–25 g | 30 min | 3d | Control (n = 6) TSA II A (n = 6) |
PBS 10 mg kg−1 d−1 |
i.p i.p |
Prior to ischemia and after reperfusion |
MIA, SOD, MDA |
| Li et al. (2022) | SD | Male | ? | ? | 30 min | 120 min | Control (n = 10) TSA II A (n = 10) |
0.5% CMC-Na 15 mg kg−1 d−1 15 mg kg−1 d−1 |
i.g i.g |
Prior to ischemia | MIA |
Notes:
- TSA II A
-
Tanshinone IIA
- TSA II A-L
-
Tanshinone IIA low-dose group
- TSA II A-M
-
Tanshinone IIA medium-dose group
- TSA II A-H
-
Tanshinone IIA high-dose group
- Control
-
receiving either normal saline, blank, or carboxymethylcellulose sodium group
- i.p
-
intraperitoneal injection
- i.g
-
intragastric
- i.v
-
intravenous injection
- NS
-
normal saline
- MIA
-
myocardial infarction area
- SOD
-
superoxide dismutase
- MDA
-
methane dicarboxylic aldehyde
- CMC-Na
-
Carboxymethylcellulose sodium
- ?
-
not recorded
Quality evaluation
The SYRCLE’s risk of bias tool was used to assess bias risk in 15 articles. Tang et al. (2017) detailed the randomization method, while others mentioned randomization without specifying the method. Both the experimental and control groups had similar baseline characteristics. Each study reported its findings clearly and comprehensively. None of the studies indicated any other biases, so they were all classified as “low risk”. However, none of the studies provided information on allocation concealment, random housing of animals during the experiment, blinding of caregivers or investigators, random outcome assessment, or blinding of outcome assessment, resulting in all studies being categorized as “unclear” (Fig. 2). Overall, the included articles were not of particularly high quality. There are notable flaws in the design and implementation of animal experimental methodology in these studies that need to be addressed to facilitate the translation of basic research into clinically feasible investigations.
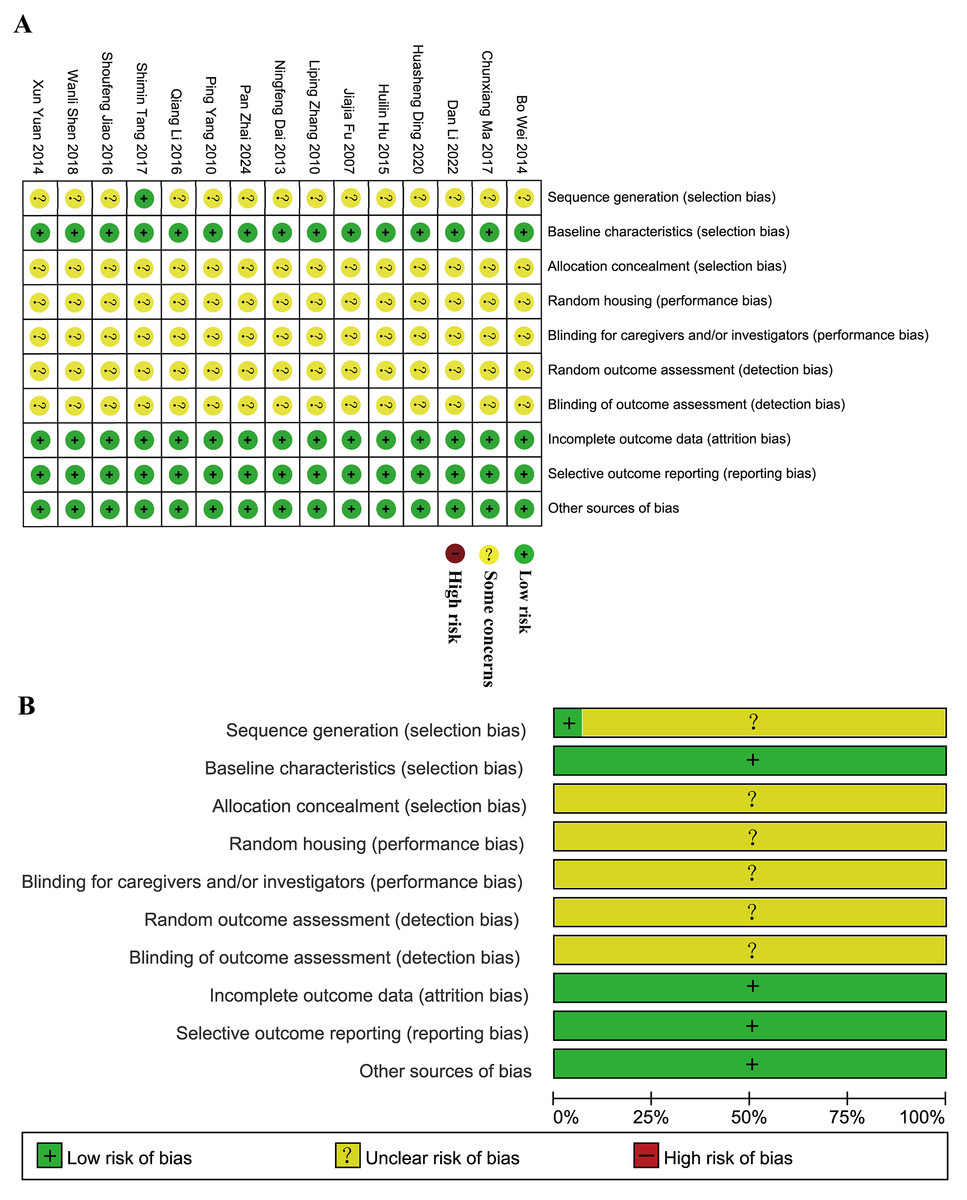
Figure 2: Evaluation of literature quality outcomes derived from SYRCLE’s Risk of Bias utilizing the Cochrane tool.
(A) Risk of bias summary: the review authors’ assessments of each risk of bias item for each included study. (B) Risk of bias graph: review authors’ judgments about each risk of bias item displayed as a percentage for all included studies.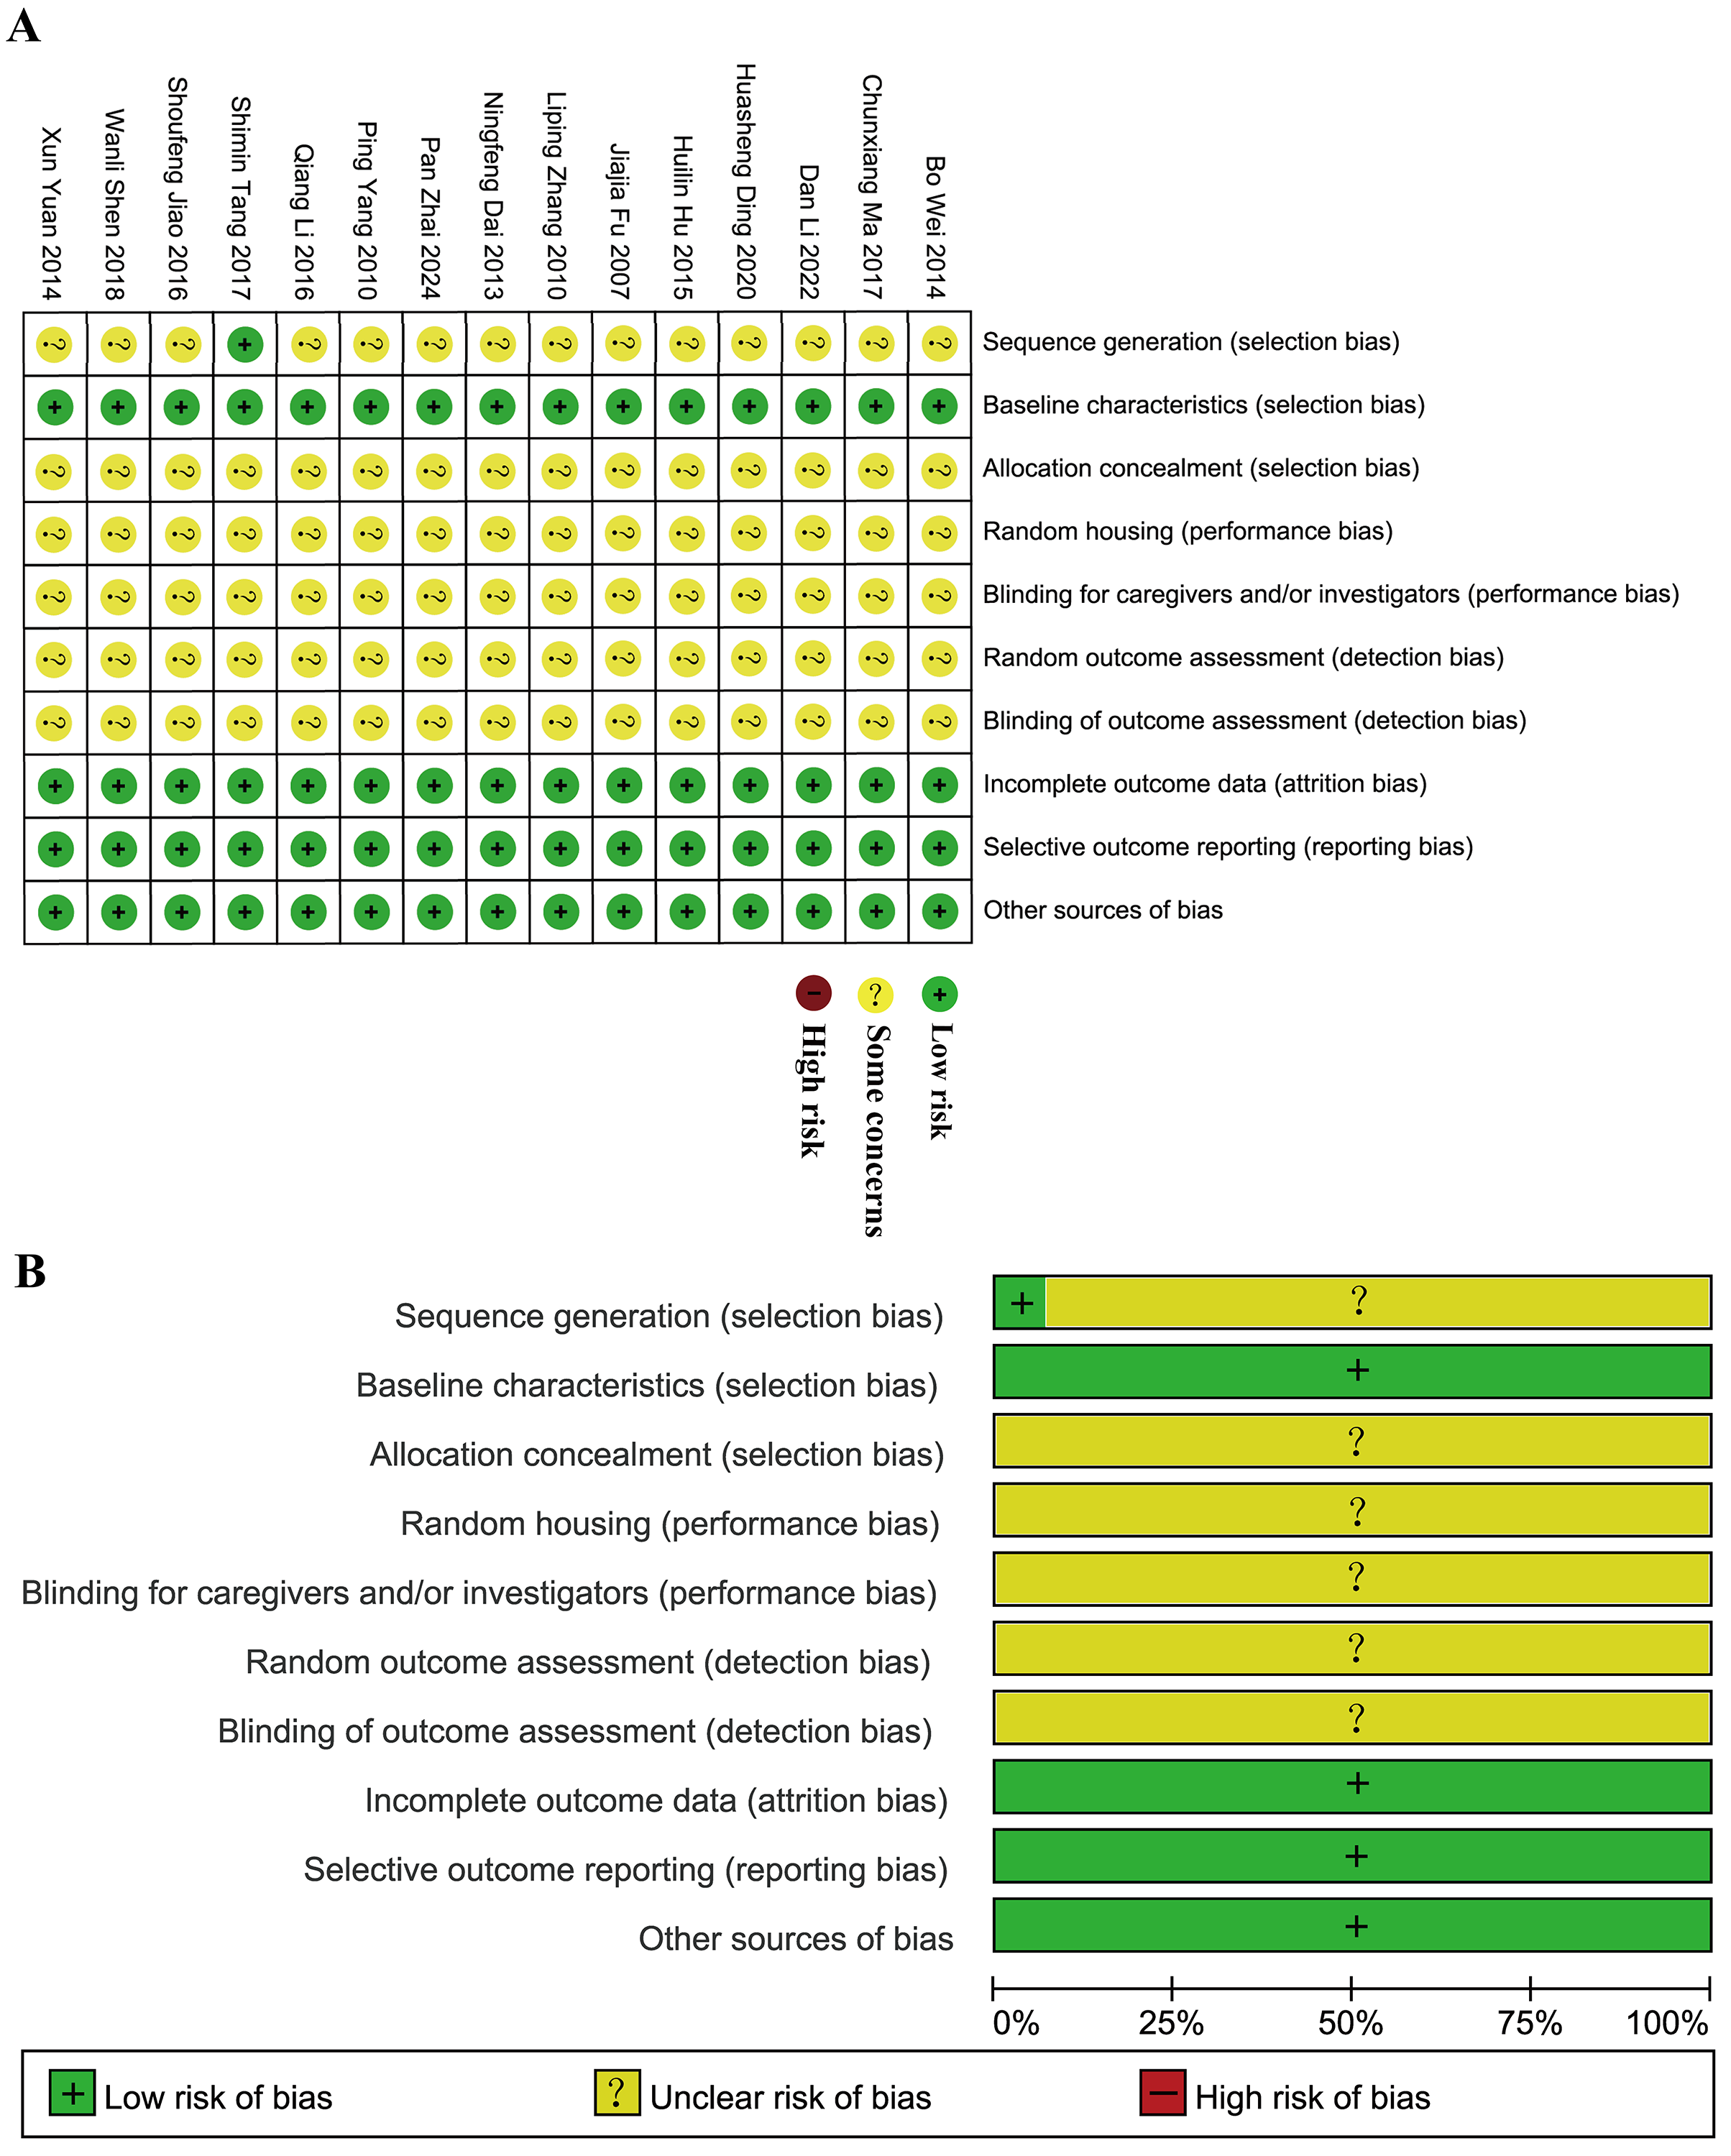
Meta-analysis of primary outcomes
Superoxide dismutase
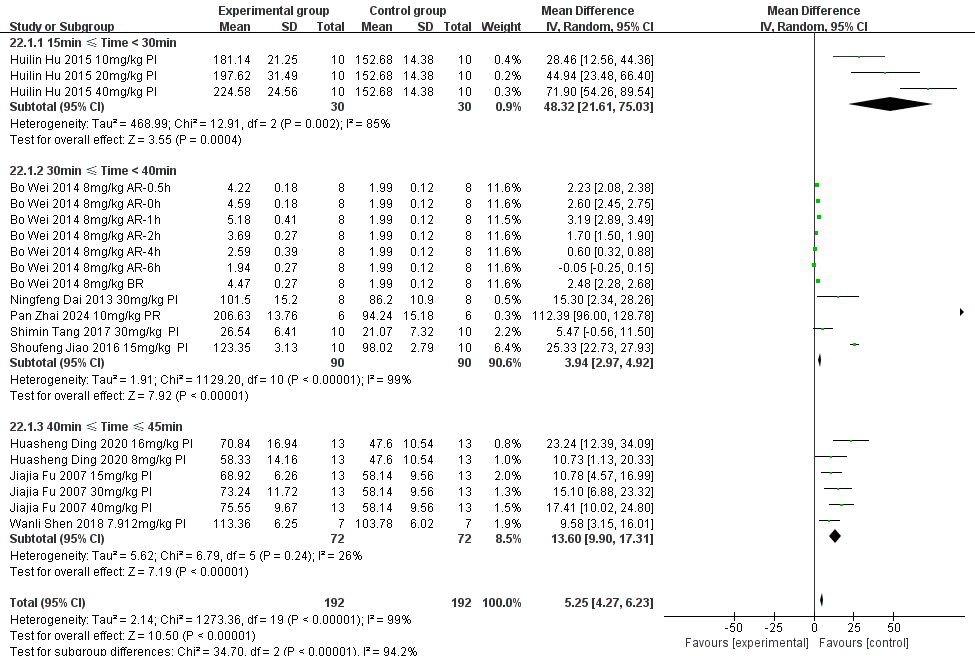
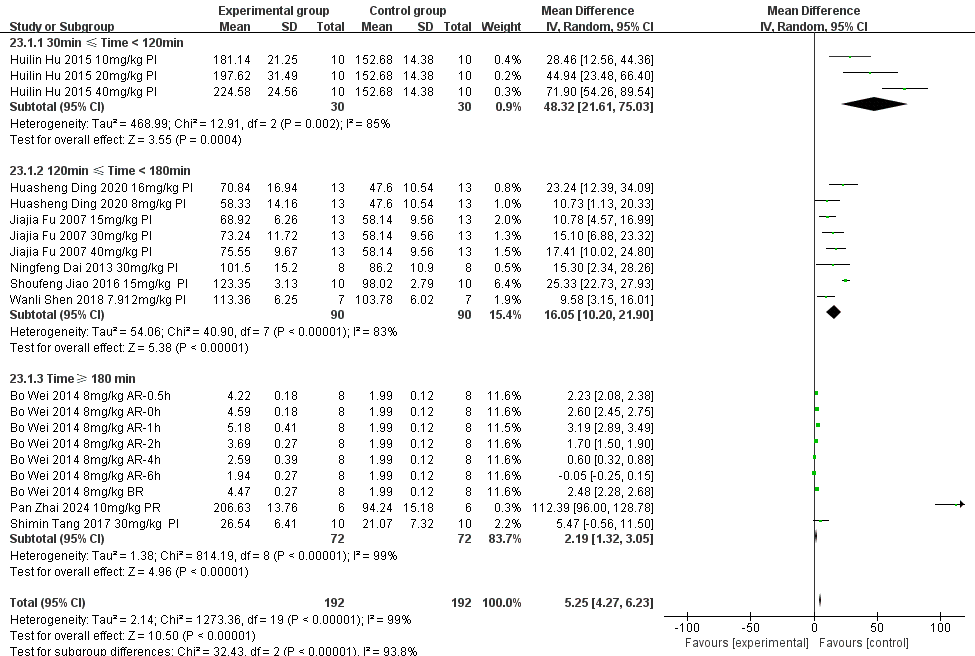
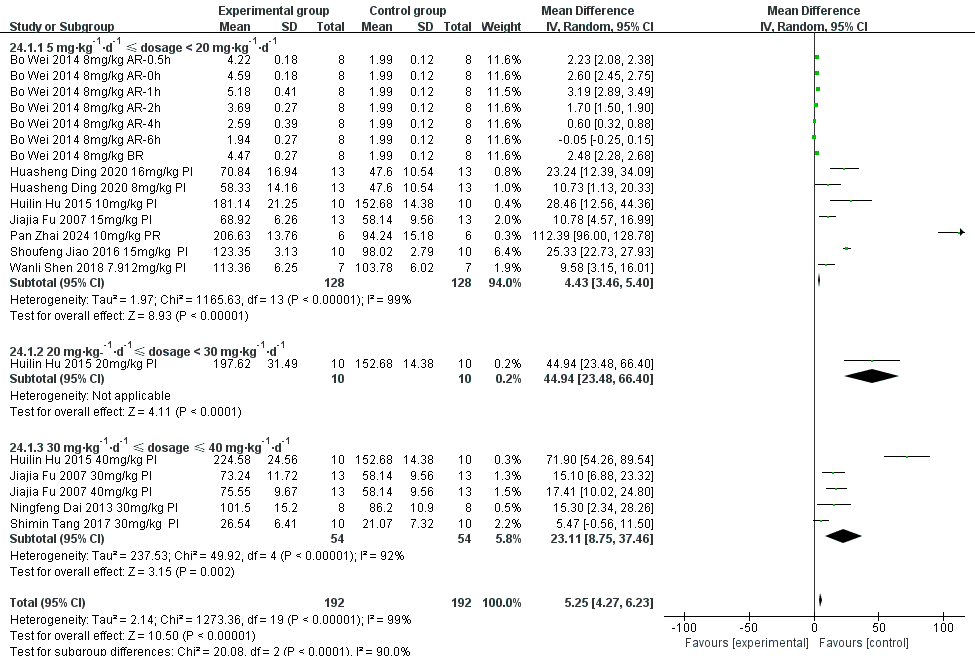
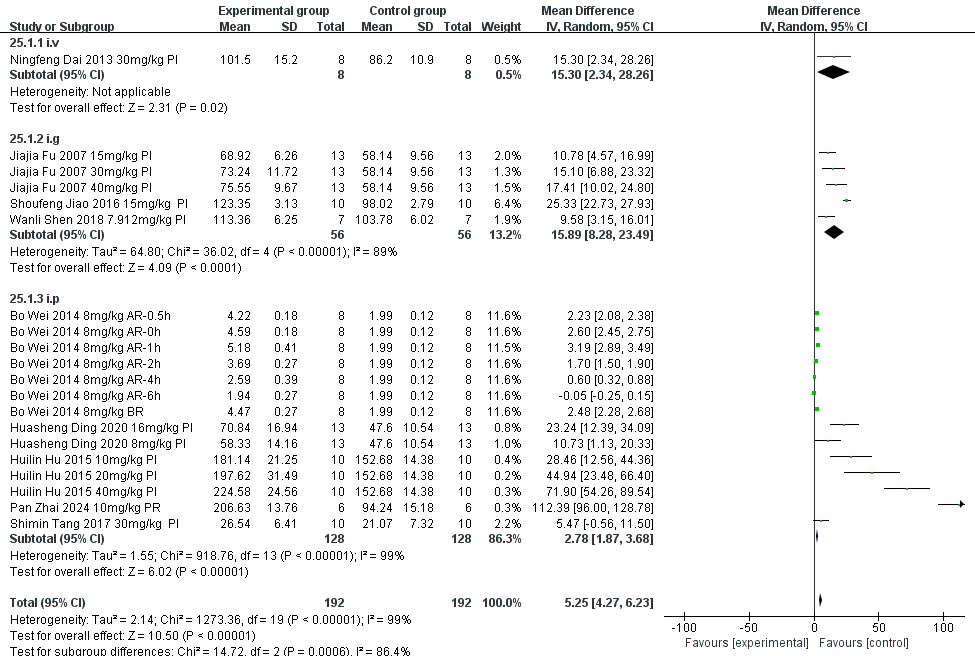
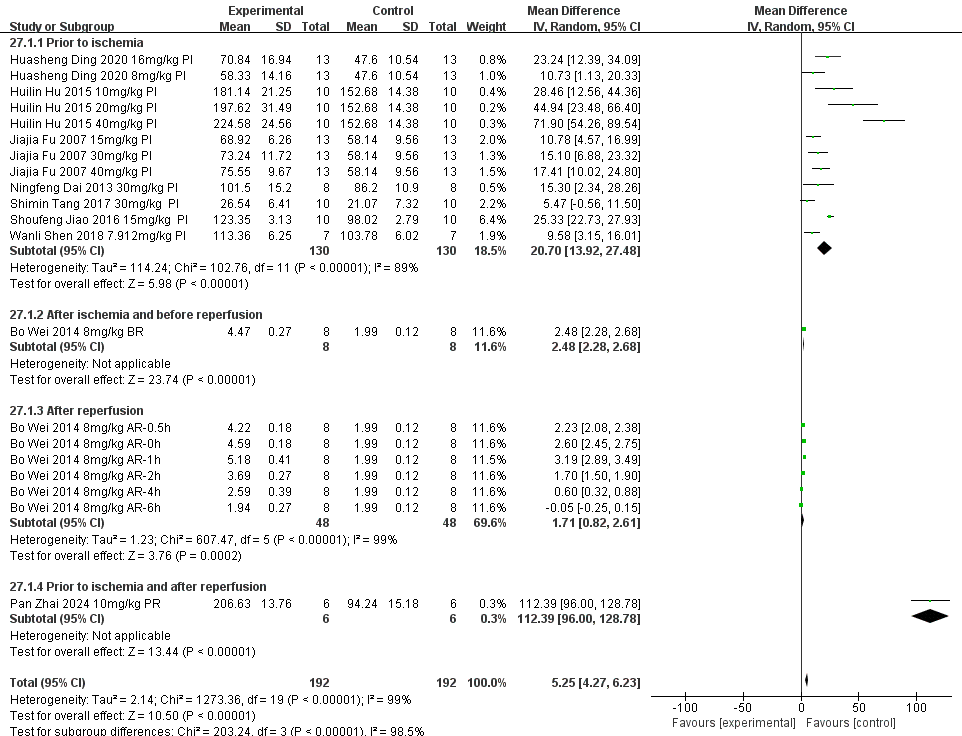
Nine of the included studies (Ding, Wang & Huang, 2020; Tang et al., 2017; Jiao, 2016; Hu et al., 2015; Dai et al., 2013; Fu et al., 2007; Wei et al., 2014; Shen et al., 2018; Zhai et al., 2024) examined the effect of tanshinone IIA on SOD levels (unit: U/mol) in rat models with MIRI (experimental group, n = 192; control group, n = 85). Owing to significant heterogeneity among the articles (p < 0.00001, I2 = 99%), we conducted subgroup analyses to explore the sources of this heterogeneity. Subgroups were categorized based on ischemia duration (15 min ≤ time < 30 min, 30 min ≤ time < 40 min, or 40 min ≤ time ≤ 45 min), reperfusion duration (30 min ≤ time < 120 min, 120 min ≤ time < 180 min, or 180 min ≤ time ≤ 480 min), dosage (5 mg kg−1 d−1 ≤ dosage < 20 mg kg−1 d−1, 20 mg kg−1 d−1 ≤ dosage < 30 mg kg−1 d−1, or 30 mg kg−1 d−1 ≤ dosage ≤ 60 mg kg−1 d−1), route of administration (i.v., i.g., or i.p.), and timing of treatment (prior to ischemia, after ischemia and before reperfusion, after reperfusion, prior to ischemia and after reperfusion). The results indicated significantly lower heterogeneity in the subgroup with an ischemic duration of 40–45 min (Table 2) (Figs. S1–S5), suggesting that this factor might be contributing to the heterogeneity. However, substantial heterogeneity persisted in the other subgroups (Table 2) (Figs. S1–S5), indicating that other factors could also be influencing the heterogeneity. SOD levels can be influenced by various factors. Differences in testing instruments and methodologies used across various studies may have been a primary contributing factor. Additionally, regional variations in the technique of left anterior descending coronary artery ligation for inducing ischemia and reperfusion during the modeling process could also be responsible. Apart from these factors, no other significant methodological differences were identified among the nine studies. Therefore, a random-effects model was utilized to combine data from the nine studies. According to this meta-analysis, the tanshinone IIA group demonstrated a significant increase in SOD levels compared with the control group (MD = 5.25, 95% CI [4.27–6.23], p < 0.00001) (Fig. 3).
| Criteria for grouping | Subgroup | n | Mean difference (MD) | I2 (%) | Z | P |
|---|---|---|---|---|---|---|
| Ischemia duration | 15 min ≤ Time < 30 min | 3 | 48.32 (21.61, 75.03) | 85 | 3.55 | 0.0004 |
| 30 min ≤ Time < 40 min | 11 | 3.94 (2.97, 4.92) | 99 | 7.92 | <0.00001 | |
| 40 min ≤ Time ≤ 45 min | 6 | 13.60 (9.90, 17.31) | 26 | 7.19 | <0.00001 | |
| Reperfusion duration | 30 min ≤ Time < 120 min | 3 | 48.32 (21.61, 75.03) | 85 | 3.55 | 0.0004 |
| 120 min ≤ Time < 180 min | 8 | 16.05 (10.20, 21.90) | 83 | 5.38 | <0.00001 | |
| Time ≥ 180 min | 9 | 2.19 (1.32, 3.05) | 99 | 4.96 | <0.00001 | |
| Dosage | 5 mg kg−1 d−1≤ Dosage < 20 mg kg−1 d−1 | 14 | 4.43 (3.46, 5.40) | 99 | 8.93 | <0.00001 |
| 20 mg kg−1 d−1≤ Dosage < 30 mg kg−1 d−1 | 1 | 44.94 (23.48, 66.40) | — | 4.11 | <0.0001 | |
| 30 mg kg−1 d−1≤ Dosage ≤ 60 mg kg−1 d−1 | 5 | 23.11 (8.75, 37.46) | 92 | 3.15 | 0.002 | |
| Route | i.v | 1 | 15.30 (2.34, 28.26) | — | 2.31 | 0.02 |
| i.g | 5 | 15.89 (8.28, 23.49) | 89 | 4.09 | <0.0001 | |
| i.p | 14 | 2.78 (1.87, 3.68) | 99 | 6.02 | <0.00001 | |
| Treatment time | Prior to ischemia After ischemia and before reperfusion After reperfusion Prior to ischemia and after reperfusion |
12 1 6 1 |
20.70 (13.92, 27.48) 2.48 (2.28, 2.68) 1.71 (0.82, 2.61) 112.39 (96.00, 128.87) |
89 — 99 — |
5.98 23.74 3.76 13.44 |
<0.00001 <0.00001 0.0002 <0.00001 |
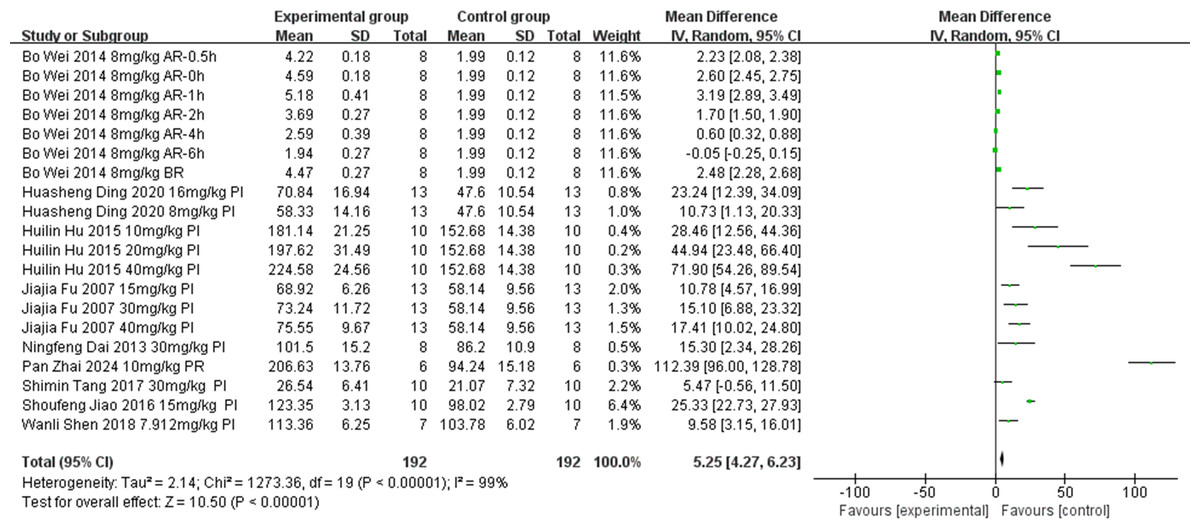
Figure 3: Forest plot of SOD.
PI, prior to ischemia; BR, after ischemia and before reperfusion; AR, after reperfusion; PR, prior to ischemia and after reperfusion.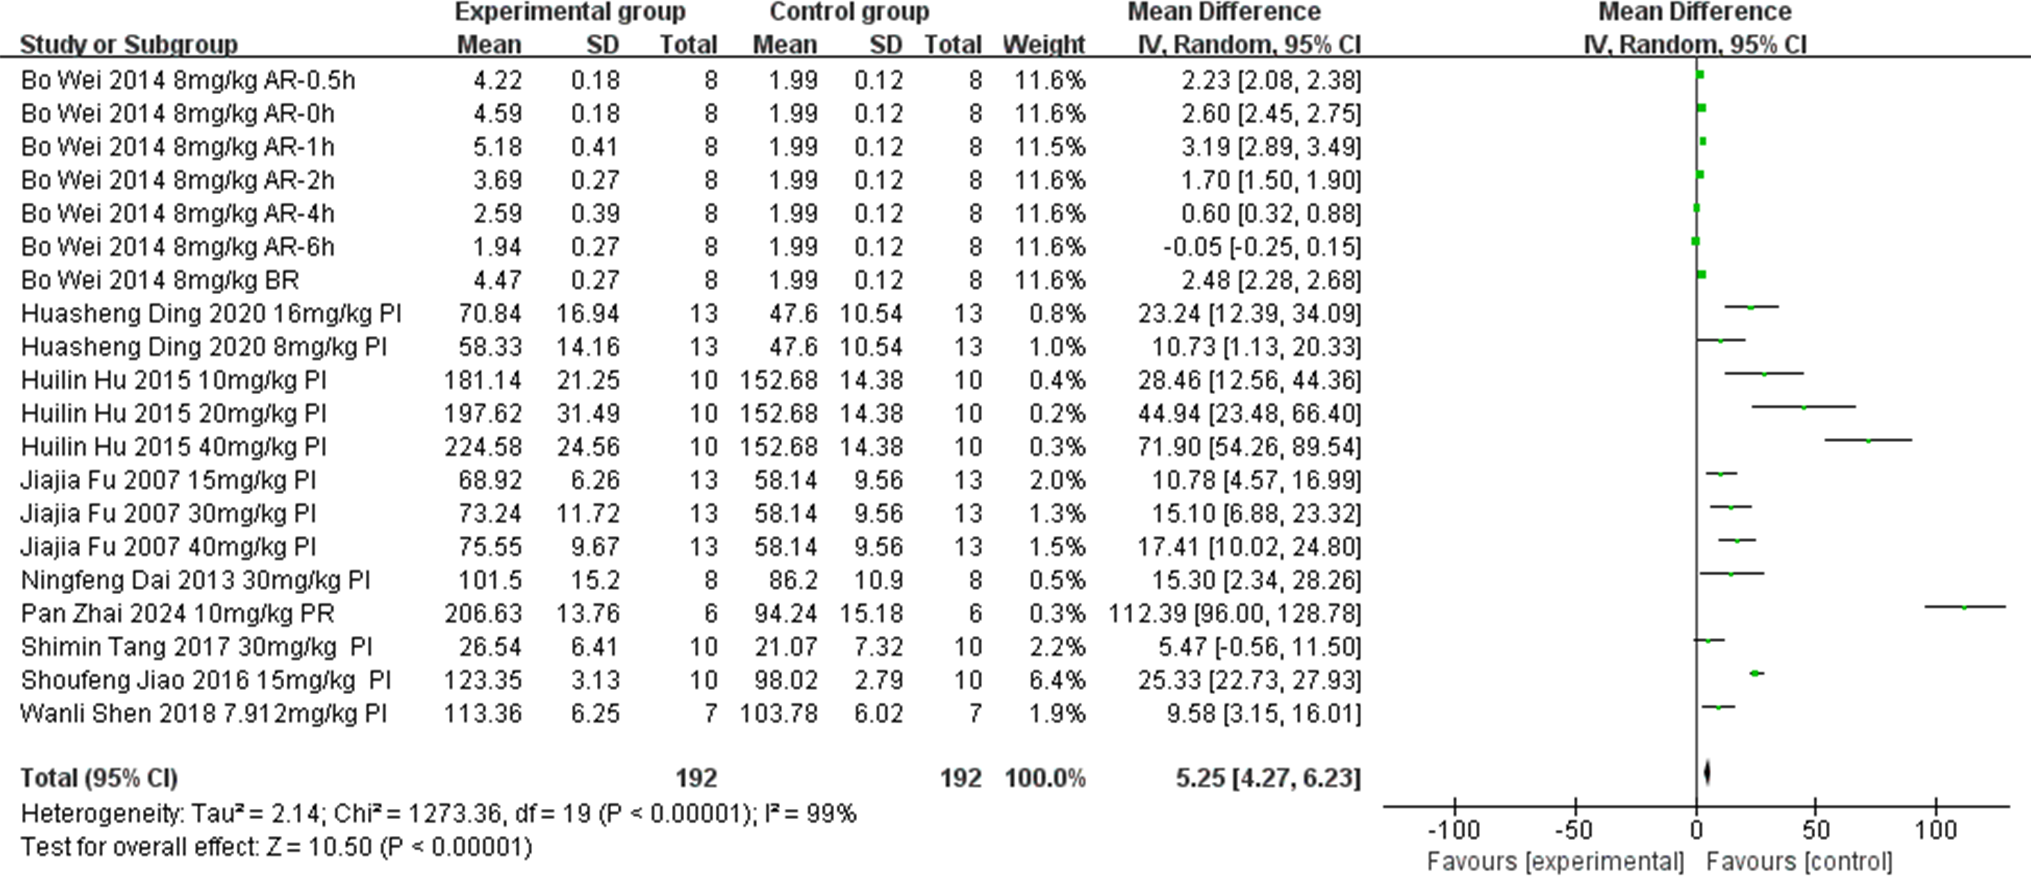
Methane dicarboxylic aldehyde
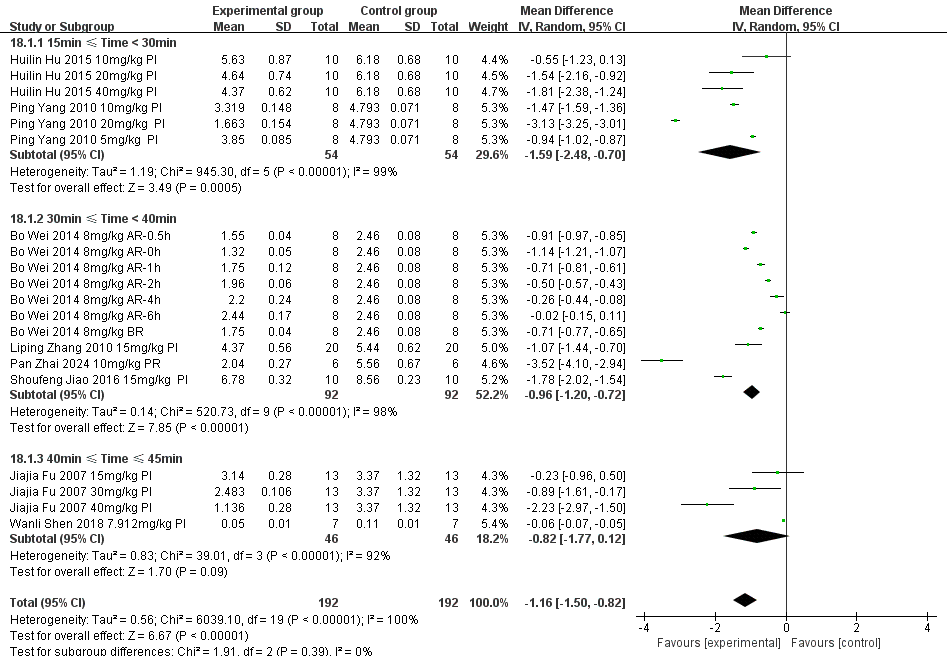
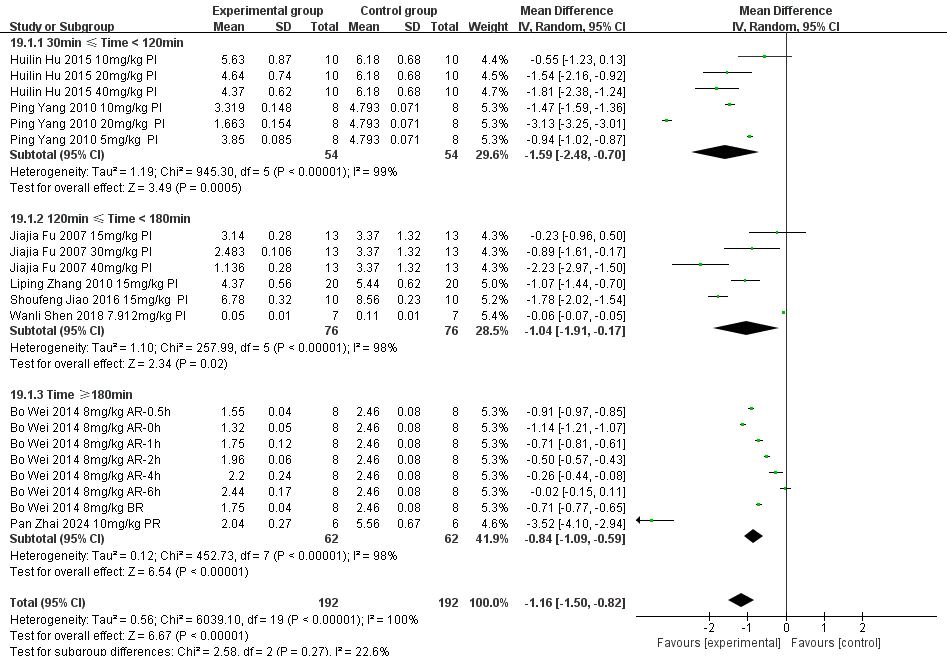
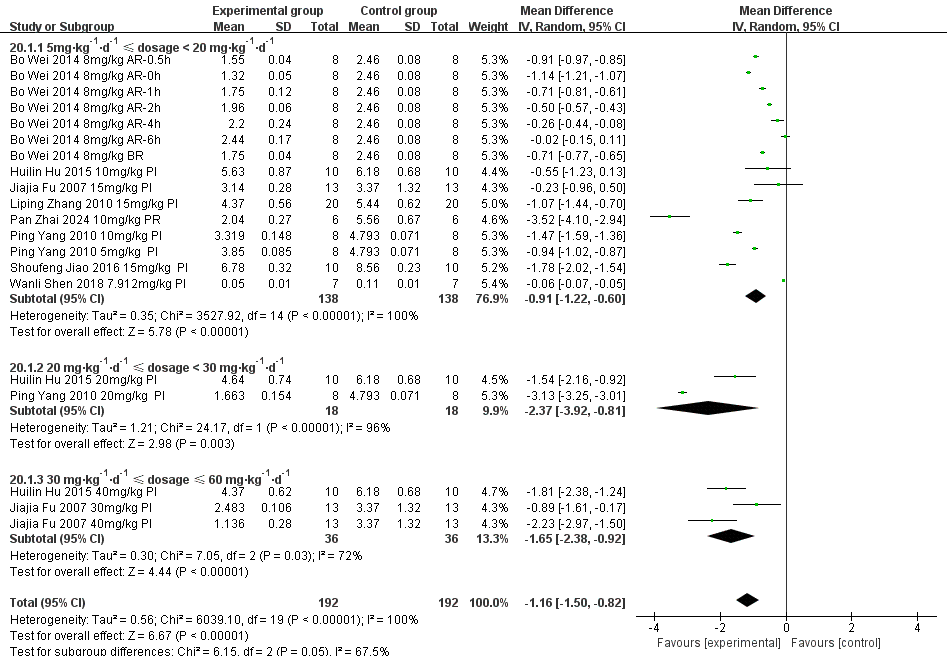
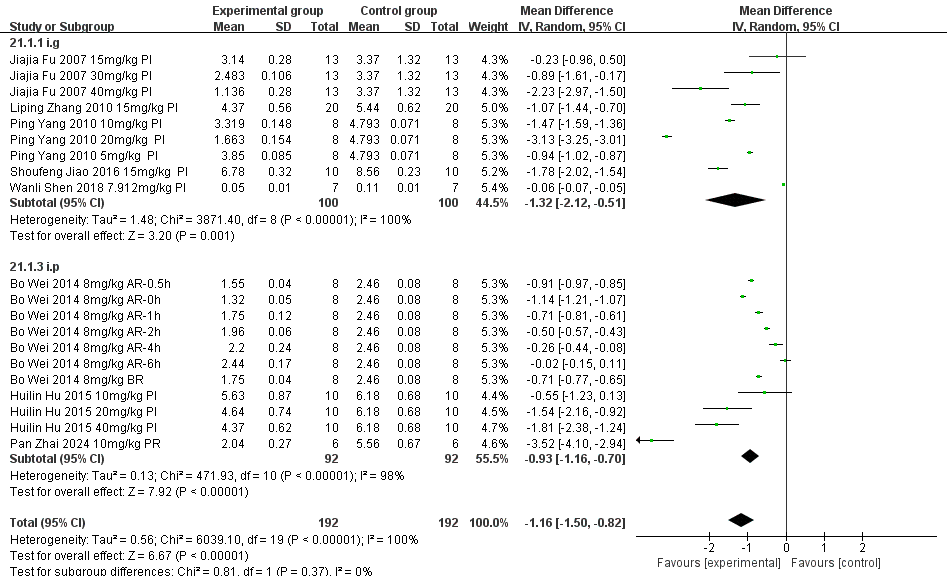
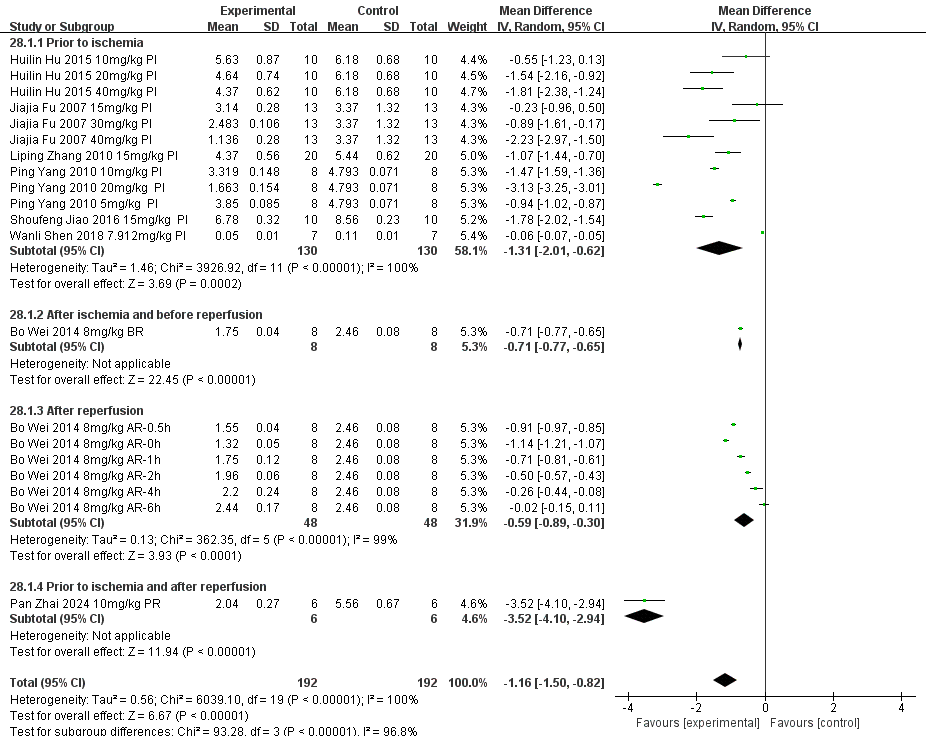
Eight studies (Jiao, 2016; Hu et al., 2015; Zhang & Zhang, 2010; Yang, 2010; Fu et al., 2007; Wei et al., 2014; Shen et al., 2018; Zhai et al., 2024) examined the effect of tanshinone IIA on MDA levels (unit: nmol/mL) following intervention in rat models with MIRI (experimental group, n = 192; control group, n = 82). Owing to significant result heterogeneity (p < 0.00001, I2 = 1.0%), a subgroup analysis was conducted to identify the sources of heterogeneity based on ischemia duration (15 min ≤ time < 30 min, 30 min ≤ time < 40 min, or 40 min ≤ time ≤ 45 min), reperfusion duration (30 min ≤ time < 120 min, 120 min ≤ time < 180 min, or 180 min ≤ time ≤ 480 min), dosage (5 mg kg−1 d−1 ≤ dosage < 20 mg kg−1 d−1, 20 mg kg−1 d−1 ≤ dosage <30 mg kg−1 d−1, or 30 mg kg−1 d−1 ≤ dosage ≤ 60 mg kg−1 d−1), route of administration (i.v., i.g., or i.p.), and treatment timing (prior to ischemia, after ischemia and before reperfusion, after reperfusion, prior to ischemia and after reperfusion). The results indicated a reduction in heterogeneity in the subgroup with dosages of 30–60 mg/kg (Table 3) (Figs. S6–S10), suggesting that dosage contributed to the observed heterogeneity. However, significant heterogeneity persisted in the other subgroups (Table 3) (Figs. S6–S10), suggesting that the heterogeneity had other causes. Variations in the test kit employed and the location of the ligated left anterior descending coronary artery among studies possibly contributed to the observed heterogeneity. We employed a random-effects model. The meta-analysis showed that the tanshinone IIA group significantly reduced MDA levels compared with the control group (MD = −1.48, 95% CI [−1.82 to −1.14], p < 0.00001) (Fig. 4).
| Criteria for grouping | Subgroup | n | Mean difference (MD) | I2 (%) | Z | P |
|---|---|---|---|---|---|---|
| Ischemia duration | 15 min ≤ Time < 30 min | 6 | −1.59 (−2.48, −0.70) | 99 | 3.49 | 0.0005 |
| 30 min ≤ Time < 40 min | 10 | −0.96 (−1.20, −0.72) | 98 | 7.85 | <0.00001 | |
| 40 min ≤ Time ≤ 45 min | 4 | −0.82 (−1.77, 0.12) | 92 | 1.70 | 0.09 | |
| Reperfusion duration | 30 min ≤ Time < 120 min | 6 | −1.59 (−2.48, −0.70) | 99 | 3.49 | 0.0005 |
| 120 min ≤ Time < 180 min | 6 | −1.04 (−1.91, −0.17) | 98 | 2.34 | 0.02 | |
| Time ≥ 180 min | 8 | −0.84 (−1.09, −0.59) | 98 | 6.54 | <0.00001 | |
| Dosage | 5 mg kg−1 d−1≤ Dosage < 20 mg kg−1 d−1 | 15 | −0.91 (−1.22, −0.60) | 100 | 5.78 | <0.00001 |
| 20 mg kg−1 d−1≤ Dosage < 30 mg kg−1 d−1 | 2 | −2.37 (−3.92, −0.81) | 96 | 2.98 | 0.003 | |
| 30 mg kg−1 d−1≤ Dosage ≤ 60 mg kg−1 d−1 | 3 | −1.65 (−2.38, −0.92) | 72 | 4.44 | <0.00001 | |
| Route | i.v | 9 | −1.32 (−2.12, −0.51) | 100 | 3.20 | 0.001 |
| i.g | 11 | −0.93 (−1.16, −0.70) | 98 | 7.92 | <0.00001 | |
| Treatment time | Prior to ischemia After ischemia and before reperfusion After reperfusio Prior to ischemia and after reperfusion |
12 1 6 1 |
−1.31 (−2.01, −0.620 −0.71 (−0.77, −0.65) −0.59 (−0.89, −0.30) −3.52 (−4.10, −2.94) |
100 — 99 — |
3.69 22.45 3.93 11.94 |
0.0002 <0.00001 <0.0001 <0.00001 |
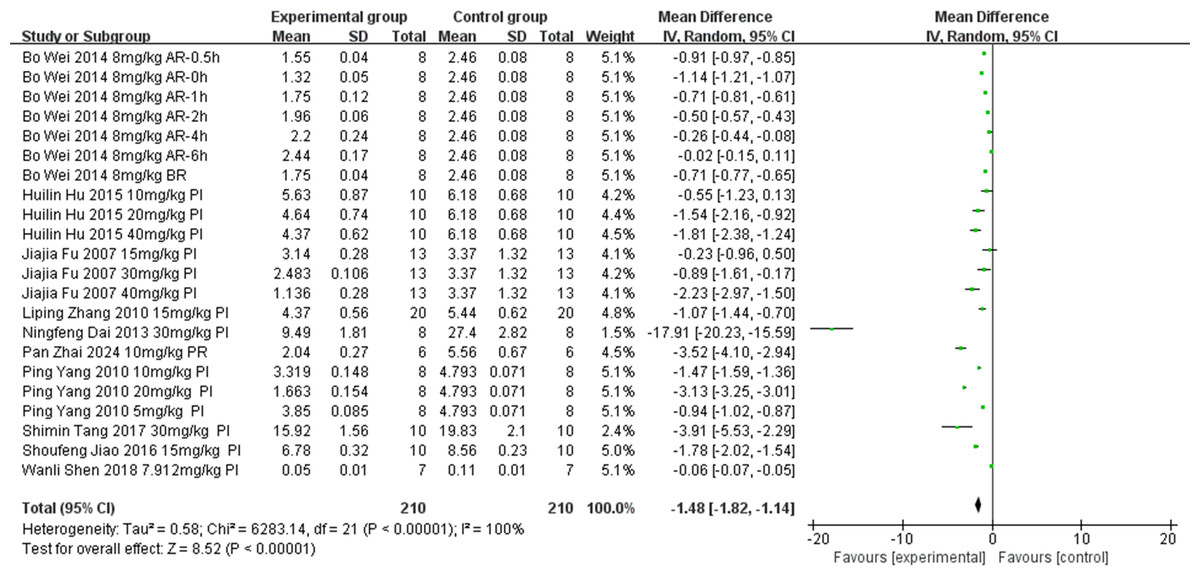
Figure 4: Forest plot of MDA.
PI, prior to ischemia; BR, after ischemia and before reperfusion; AR, after reperfusion; PR, prior to ischemia and after reperfusion.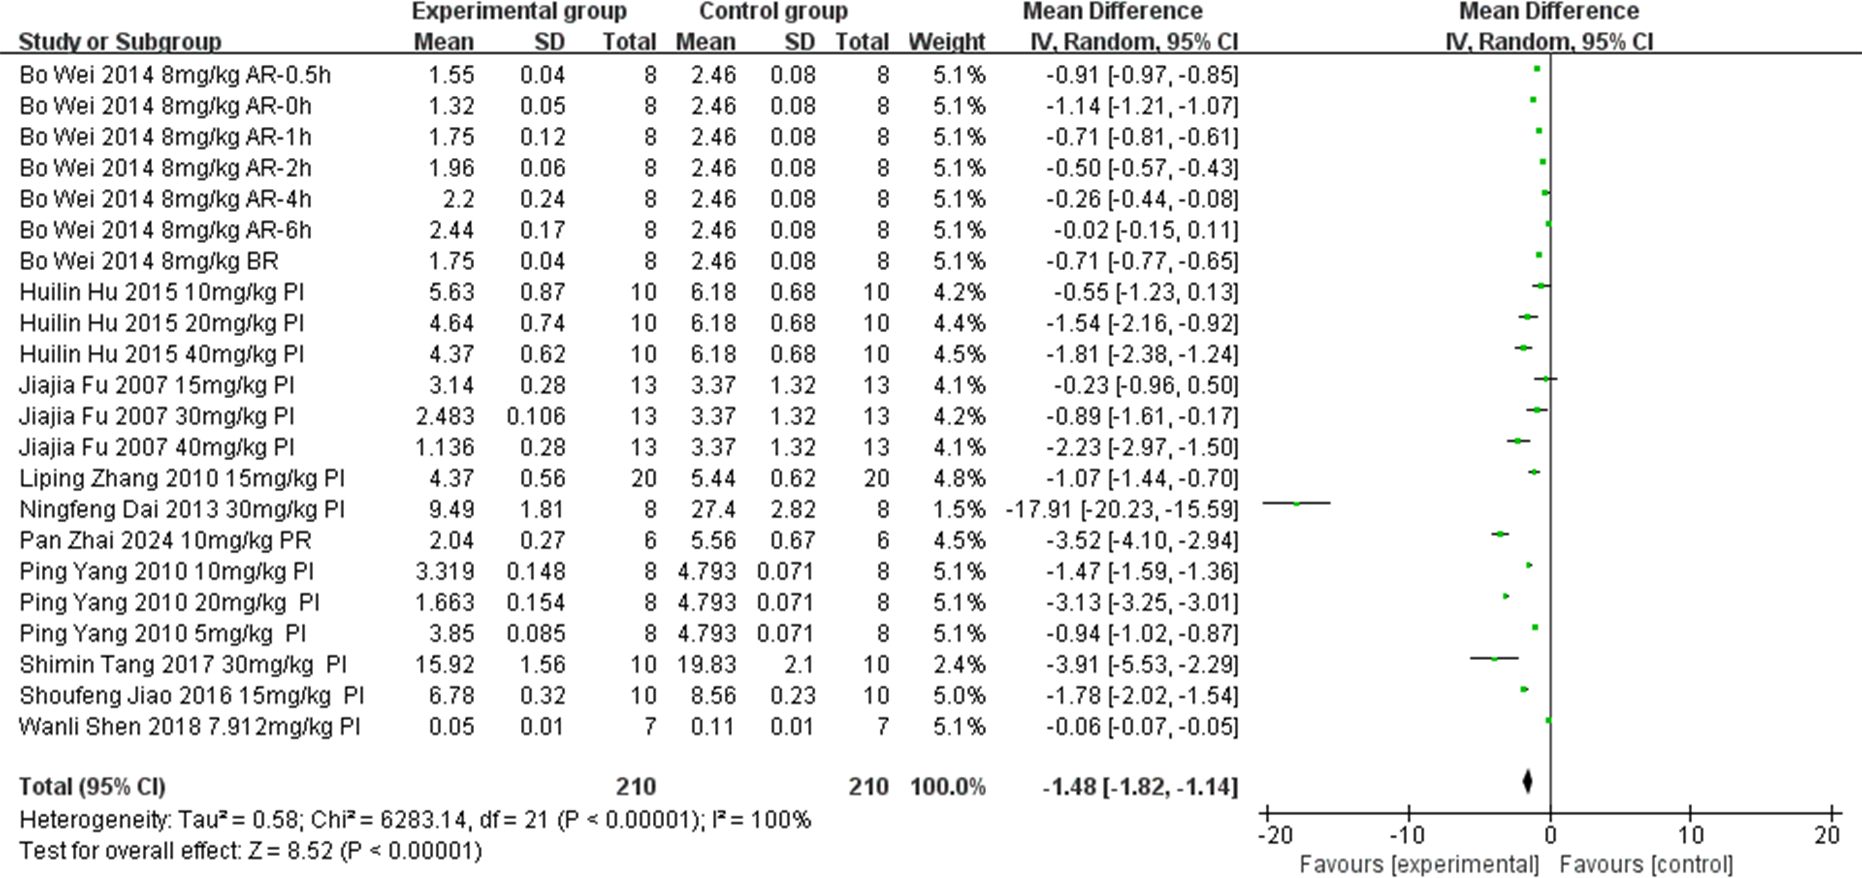
Meta-analysis of secondary outcomes
Myocardial infarction area
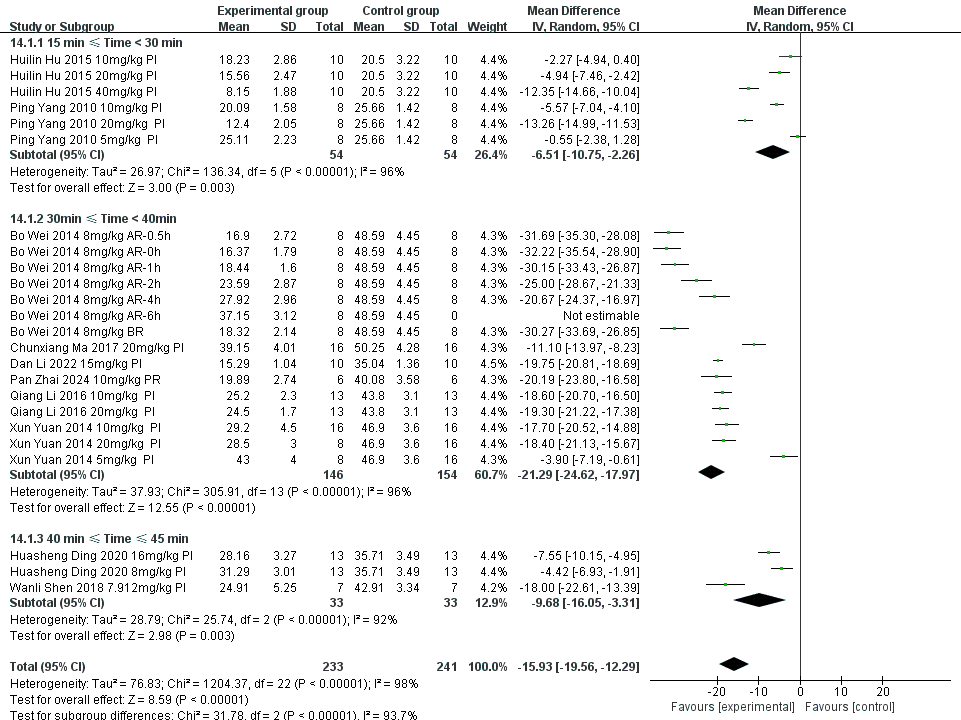
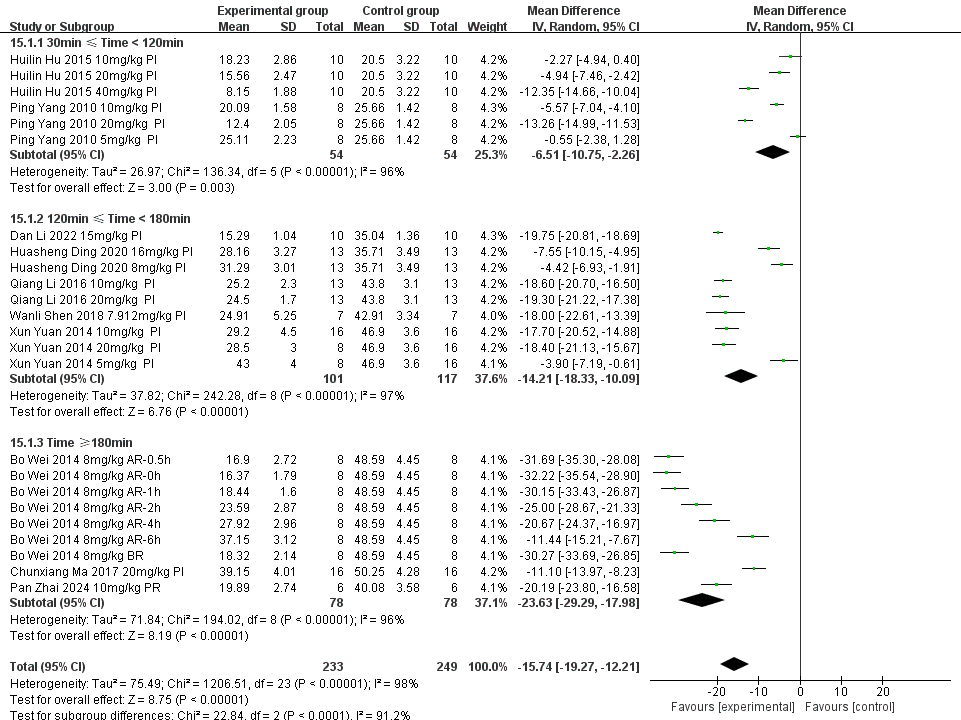
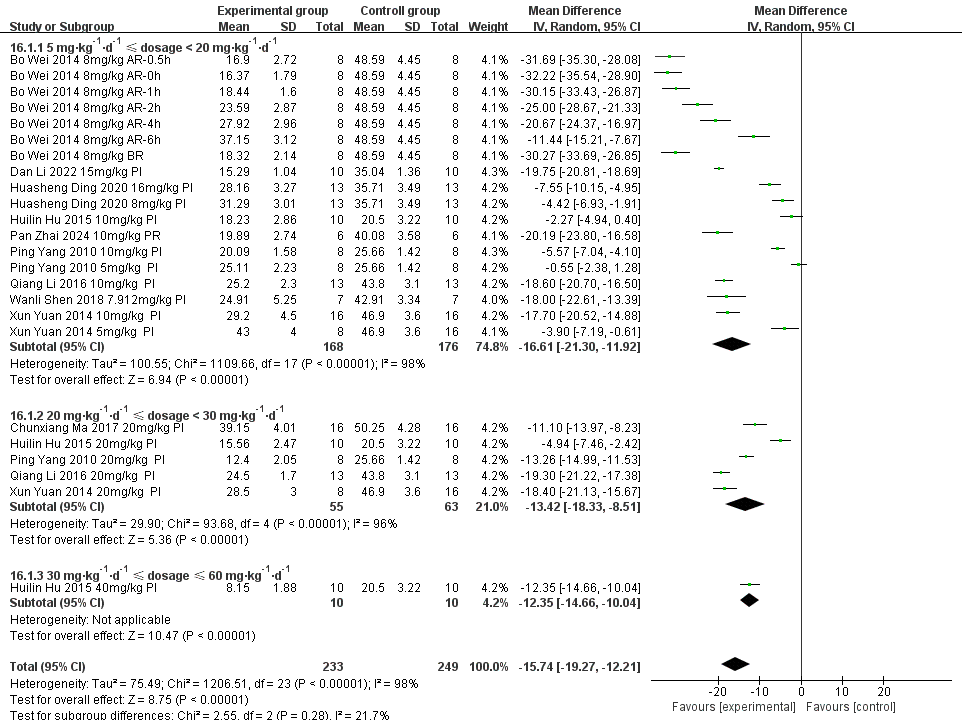
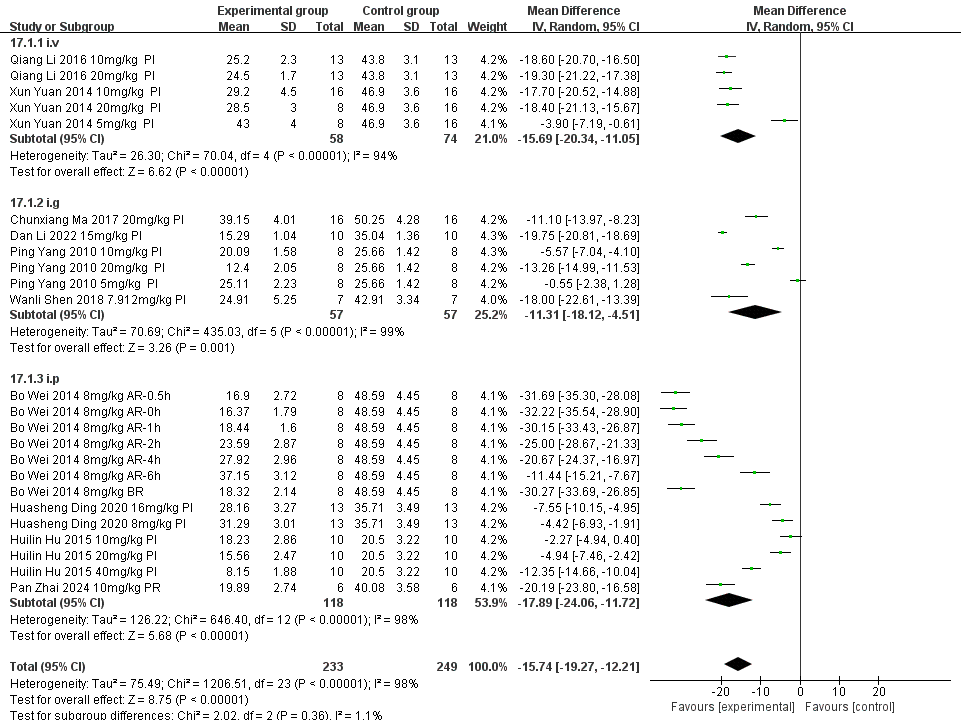
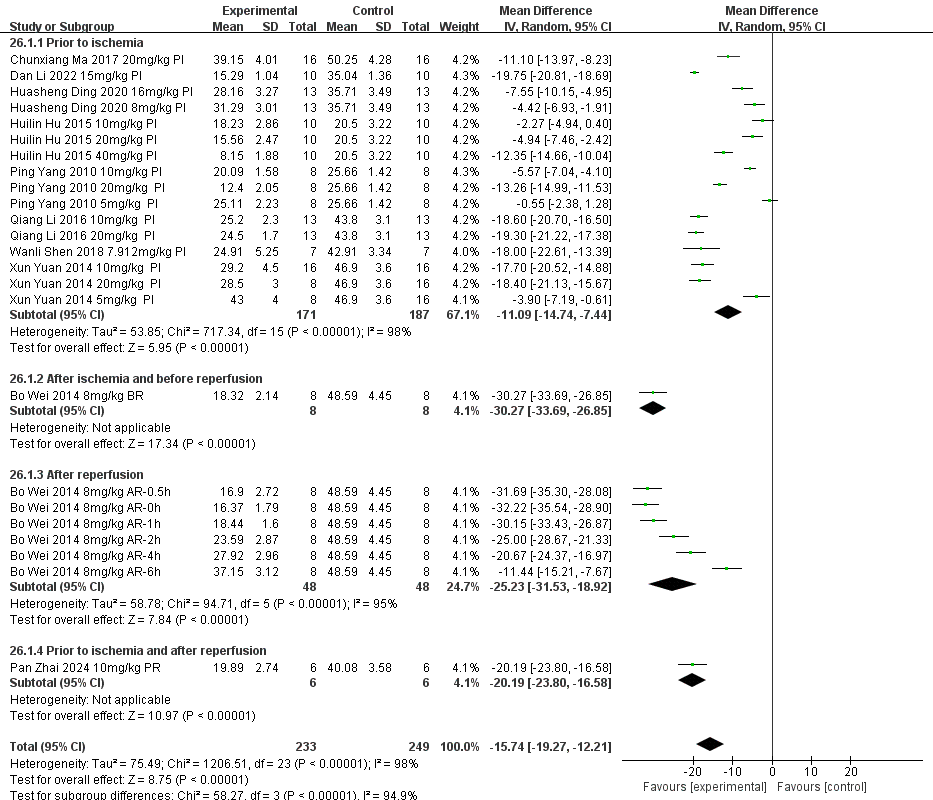
Ten of the included studies (Ding, Wang & Huang, 2020; Ma et al., 2017; Li et al., 2016; Hu et al., 2015; Yuan et al., 2014; Yang, 2010; Wei et al., 2014; Shen et al., 2018; Zhai et al., 2024; Li et al., 2022) investigated the effect of tanshinone IIA on myocardial infarction area in rat models with MIRI (experimental group, n = 249; control group, n = 107). Units: %. We conducted a subgroup analysis to identify the sources of heterogeneity based on ischemia duration (15 min ≤ time < 30 min, 30 min ≤ time < 40 min, or 40 min ≤ time ≤ 45 min), reperfusion duration (30 min ≤ time < 120 min, 120 min ≤ time < 180 min, or 180 min ≤ time ≤ 480 min), dosage (5 mg kg−1 d−1 ≤ dosage < 20 mg kg−1 d−1, 20 mg kg−1 d−1 ≤ dosage < 30 mg kg−1 d−1, or 30 mg kg−1 d−1 ≤ dosage ≤ 60 mg kg−1 d−1), route of administration (i.v., i.g., or i.p.), and treatment timing (prior to ischemia, after ischemia and before reperfusion, after reperfusion, prior to ischemia and after reperfusion), considering the significant heterogeneity in the results (p < 0.00001, I2 = 98%). The results indicated lower heterogeneity in the group with ischemia duration of 40–45 min compared with other groups (Table 4) (Figs. S9–S12), suggesting that ischemia duration was a source of heterogeneity. However, substantial heterogeneity persisted in the remaining subgroups (Table 4) (Figs. S9–S12), suggesting that additional sources of heterogeneity existed. A random-effects model was employed. The tanshinone IIA group significantly reduced myocardial infarction area compared with the control group (MD = −15.74, 95% CI [−19.27 to −12.21], p < 0.00001) (Fig. 5).
| Criteria for grouping | Subgroup | n | Mean difference (MD) | I2 (%) | Z | P |
|---|---|---|---|---|---|---|
| Ischemia duration | 15 min ≤ Time < 30 min | 6 | −6.51 (−10.75, −2.26) | 96 | 3.00 | 0.003 |
| 30 min ≤ Time < 40 min | 15 | −21.29 (−24.62, −17.97) | 96 | 12.55 | <0.00001 | |
| 40min ≤ Time ≤ 45 min | 3 | −9.68 (−16.05, −3.31) | 92 | 2.98 | 0.003 | |
| Reperfusion duration | 30 min ≤ Time < 120 min | 6 | −6.51 (−10.75, −2.26) | 96 | 3.00 | 0.003 |
| 120 min ≤ Time < 180 min | 9 | −14.21 (−18.33, −10.09) | 97 | 6.76 | <0.00001 | |
| 180 min ≤ Time ≤ 480 min | 9 | −23.63 (−29.29, −17.98) | 96 | 8.19 | <0.00001 | |
| Dosage | 5 mg kg−1 d−1≤ Dosage < 20 mg kg−1 d−1 | 18 | −16.61 (−21.30, −11.92) | 98 | 6.94 | <0.00001 |
| 20 mg kg−1 d−1≤ Dosage < 30 mg kg−1 d−1 | 5 | −13.42 (−18.33, −8.51) | 96 | 5.36 | <0.00001 | |
| 30 mg kg−1 d−1≤ Dosage ≤ 60 mg kg−1 d−1 | 1 | −12.35 (−14.66, −10.04) | — | 10.47 | <0.00001 | |
| Route | i.v | 5 | −15.69 (−20.34, −11.05) | 94 | 6.62 | <0.00001 |
| i.g | 6 | −11.31 (−18.12, −4.51) | 99 | 3.26 | 0.001 | |
| i.p | 13 | −17.89 (−24.06, −11.72) | 98 | 5.68 | <0.00001 | |
| Treatment time | Prior to ischemia After ischemia and before reperfusion After reperfusio Prior to ischemia and after reperfusion |
16 1 6 1 |
−11.09 (−14.74, −7.44) −30.27 (−33.69, −26.85) −25.23 (−31.53, −18.92) −20.19 (−23.80, −16.58) |
98 — 95 — |
5.95 17.34 7.84 10.97 |
<0.00001 <0.00001 <0.00001 <0.00001 |
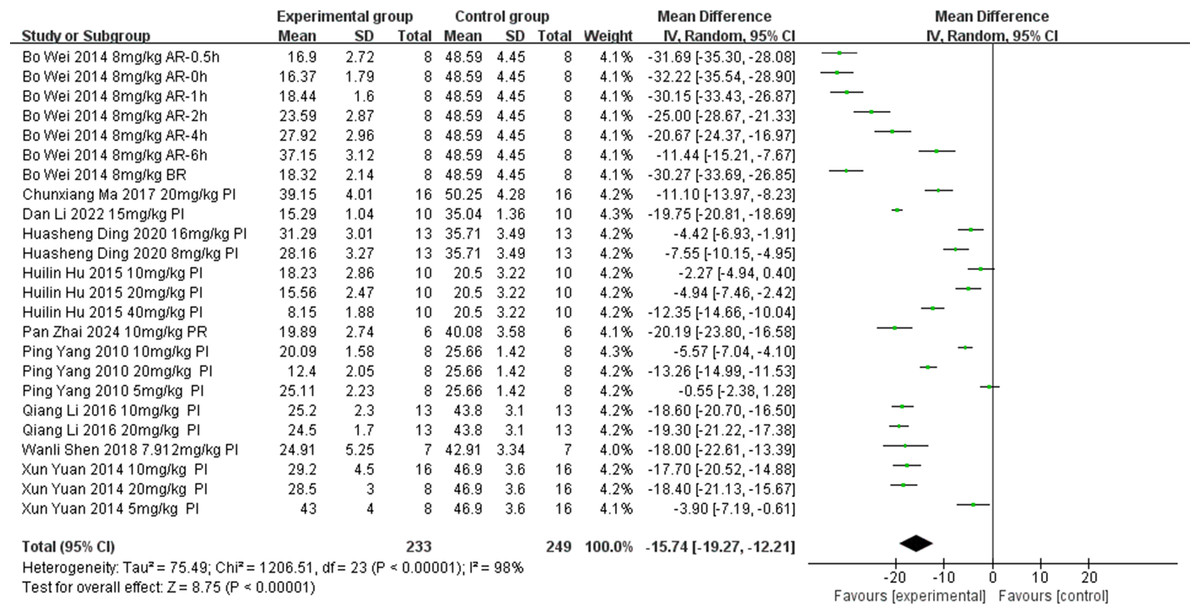
Figure 5: Forest plot of myocardial infarction area.
PI, prior to ischemia; BR, after ischemia and before reperfusion; AR, after reperfusion; PR, prior to ischemia and after reperfusion.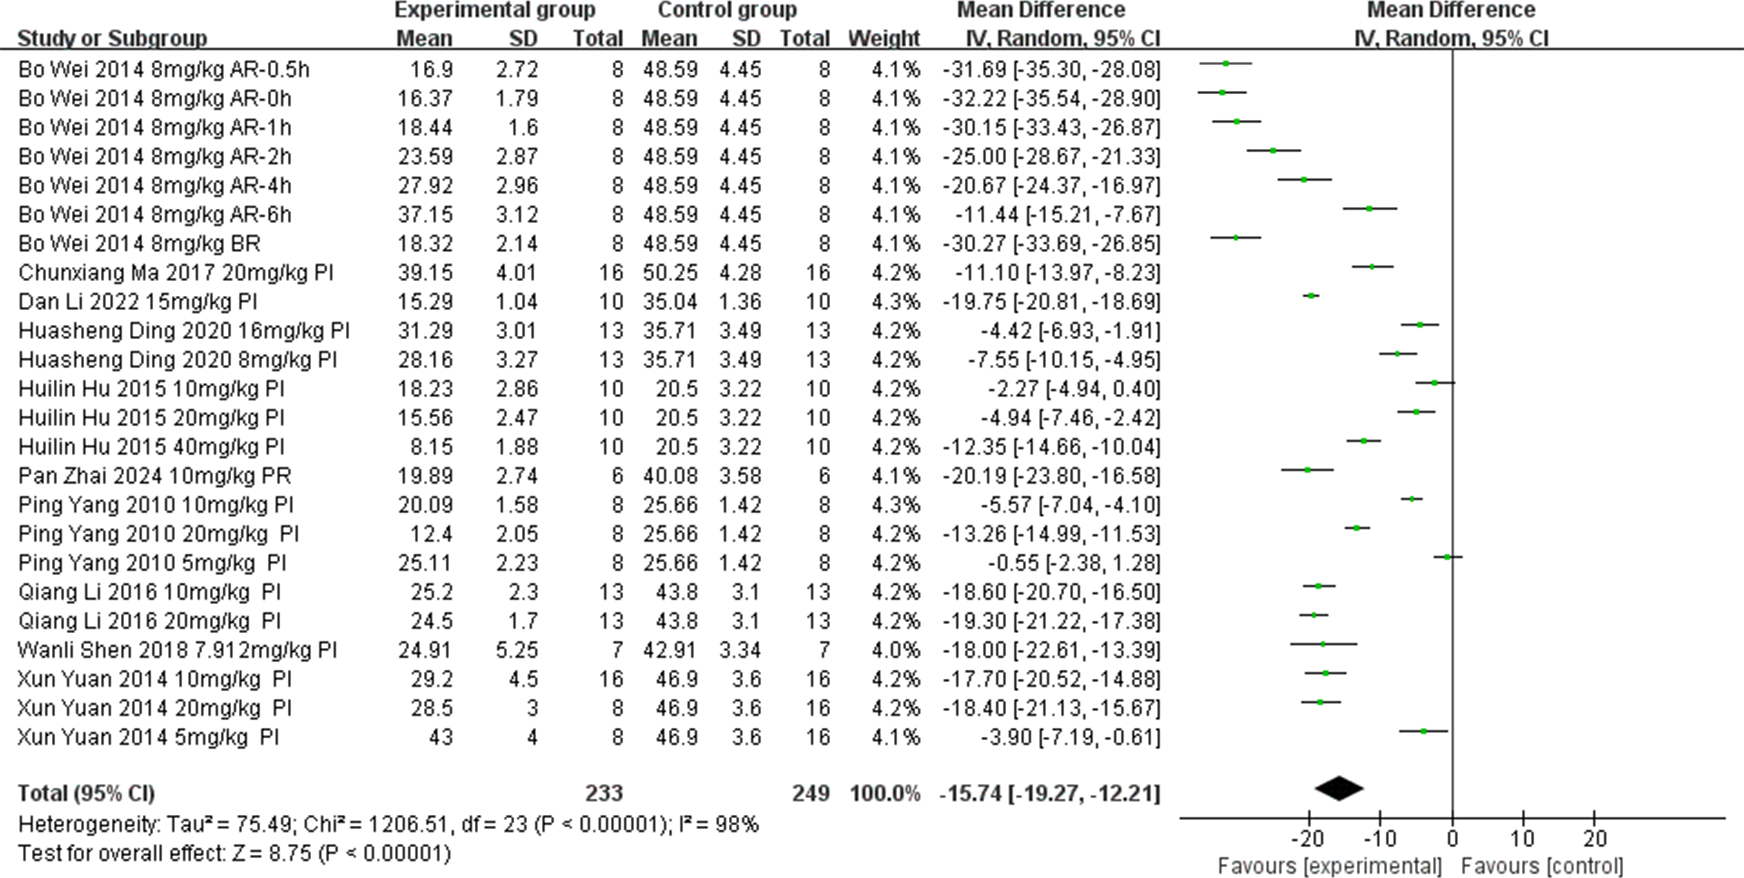
Publication bias analysis
Publication bias in the meta-analysis of SOD, MDA, and myocardial infarction area was assessed using Egger’s test and funnel plots. The results showed asymmetry in the funnel plots and Egger’s tests for each SOD, MDA, and myocardial infarction area, indicating potential publication bias. This bias could be influenced by factors such as the overall poor quality of the included articles (Fig. 6).
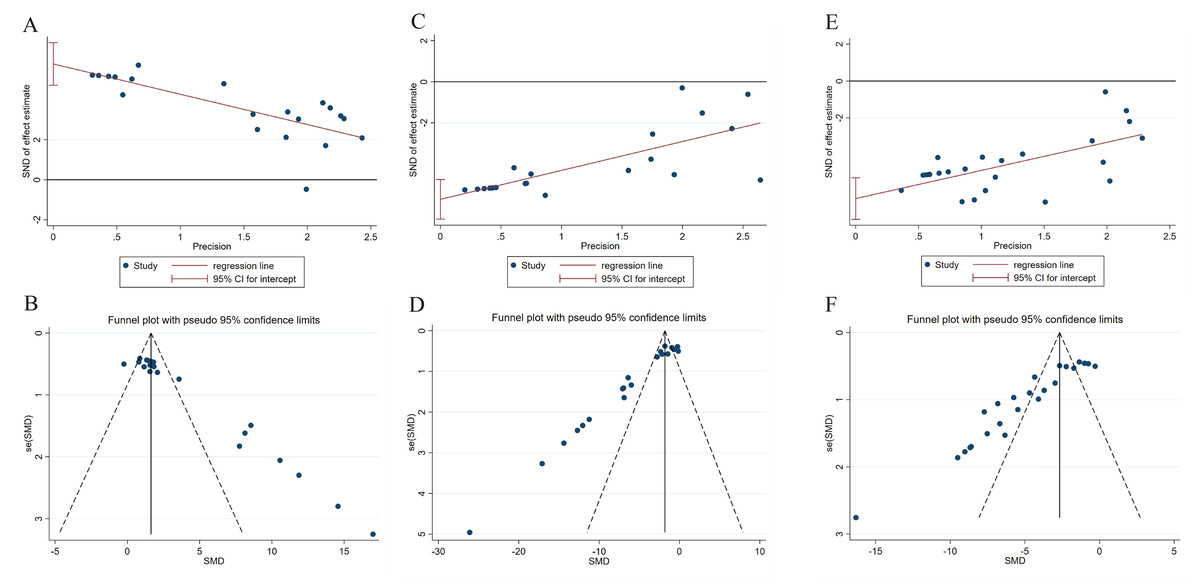
Figure 6: Egger’s tests and funnel plots for evaluating publication bias.
(A, B) Egger’s test and funnel plot for publication bias in SOD. (C, D) Egger’s test and funnel plot for publication bias in MDA. (E, F) Egger’s test and funnel plot for publication bias in myocardial infarction area.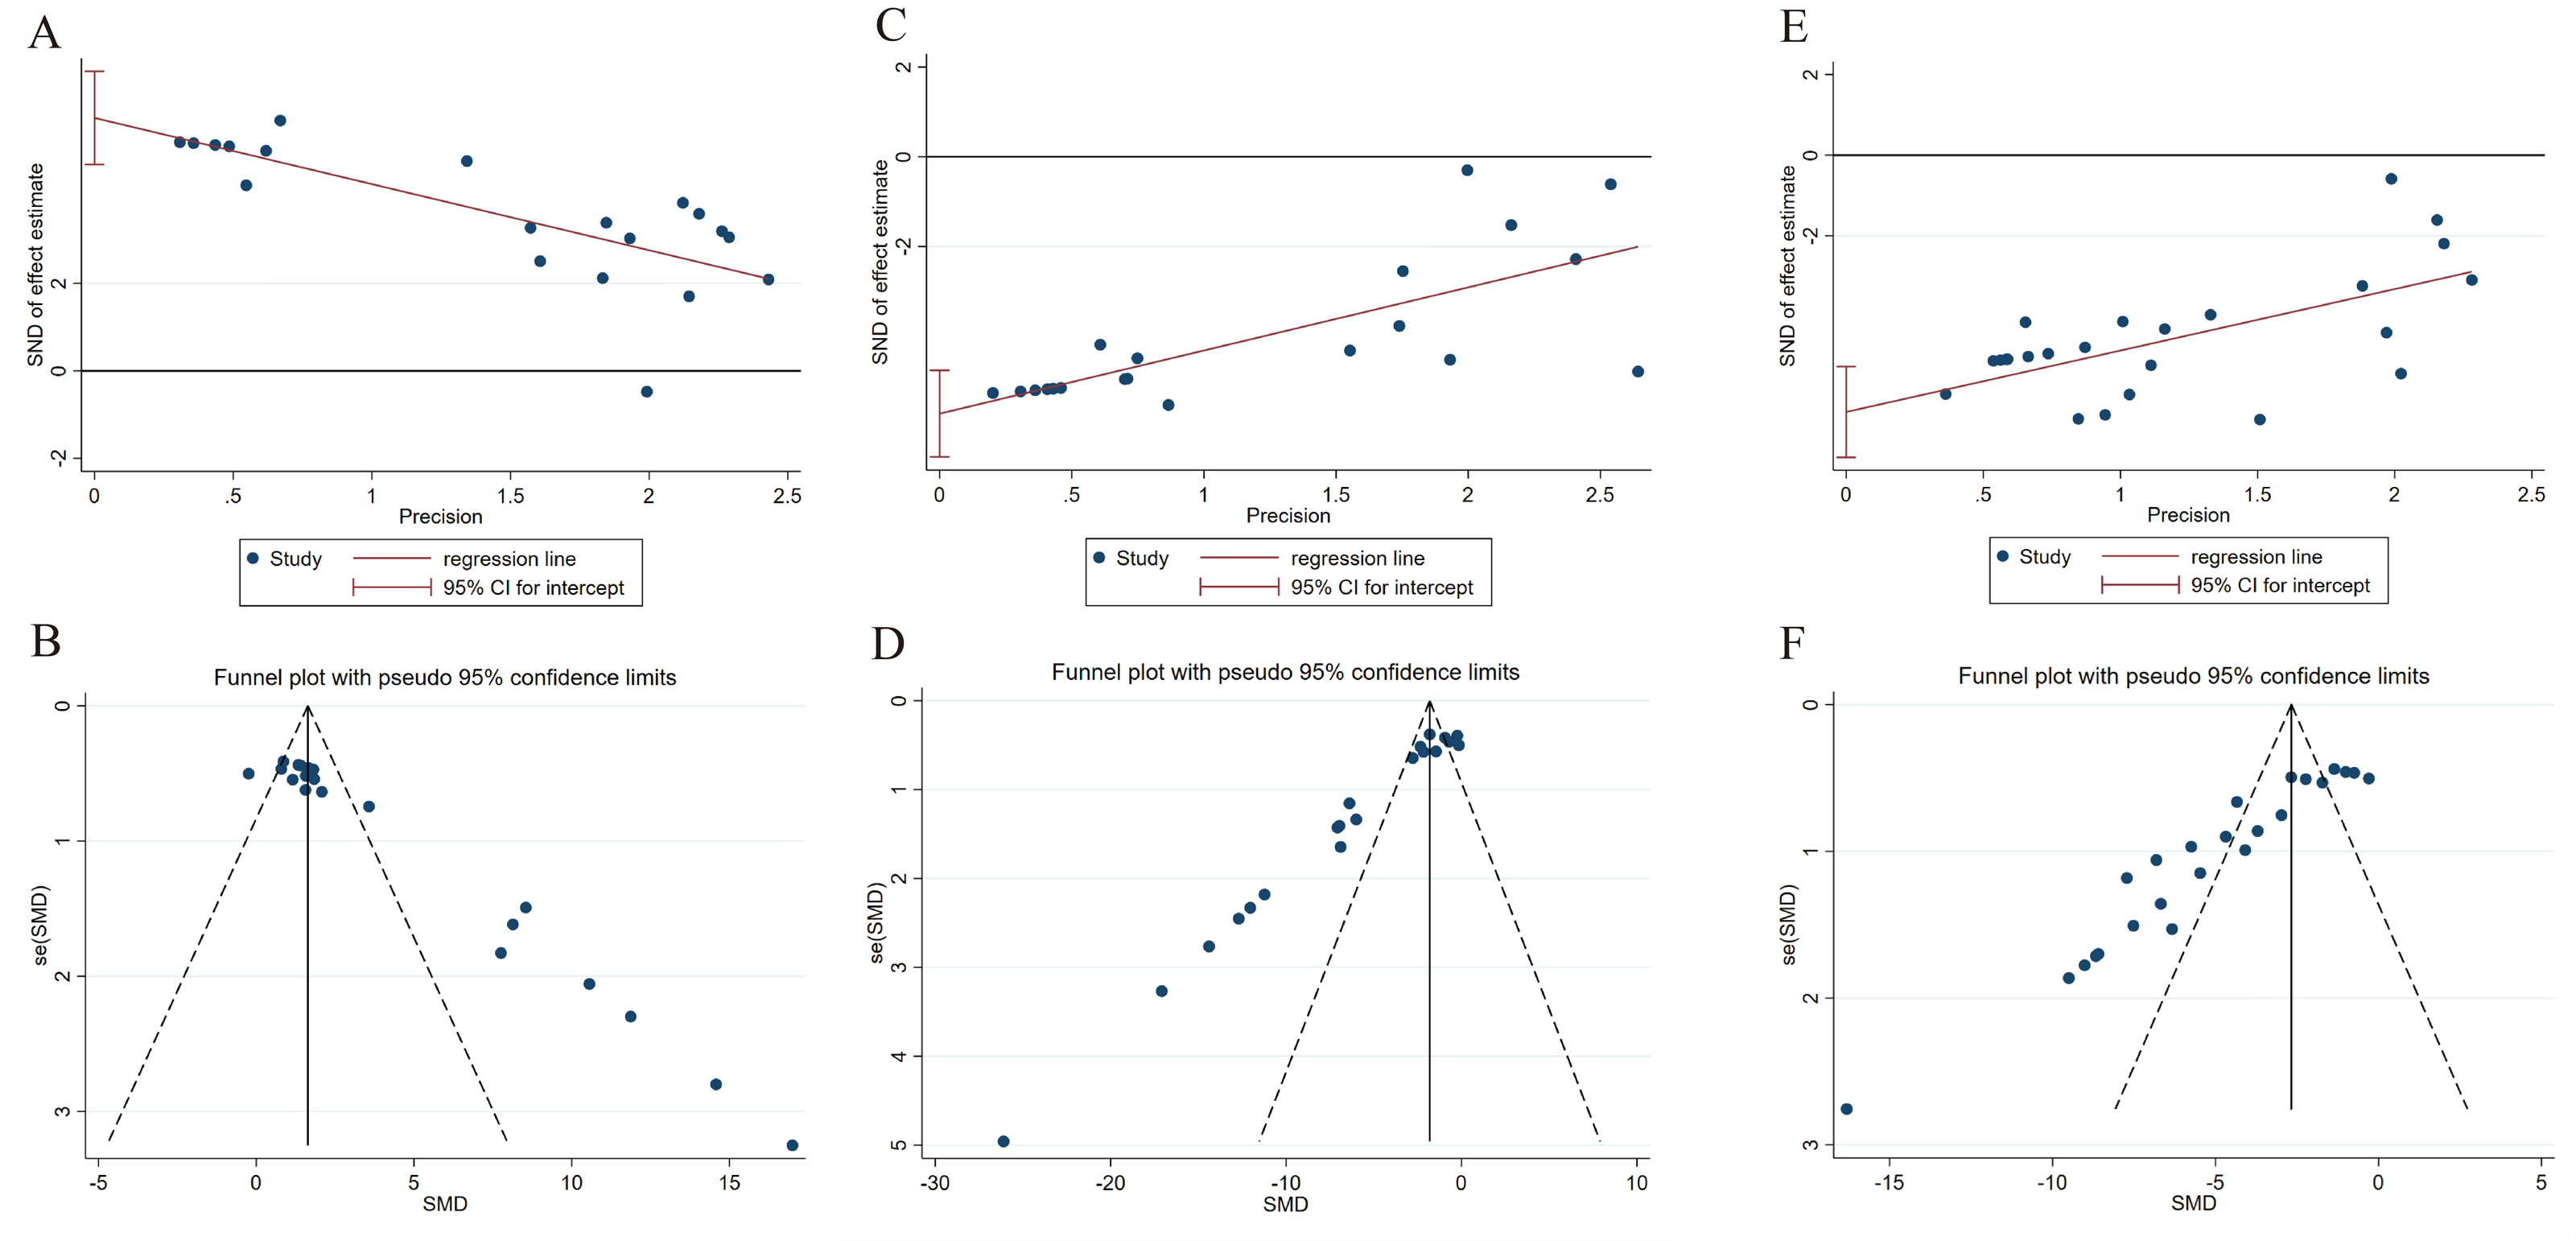
Sensitivity analysis
To assess the consistency and reliability of the meta-analysis results, sensitivity analyses were conducted for SOD, MDA, and myocardial infarction area outcomes included in this study. Each meta-analysis was systematically recalculated after the exclusion of one study at a time, and the results were combined for the remaining studies. The sensitivity analysis indicated that excluding individual studies did not significantly alter the combined effect sizes for SOD, MDA, and myocardial infarction area. This underscores the robustness of the conclusions drawn from this meta-analysis (Fig. 7).
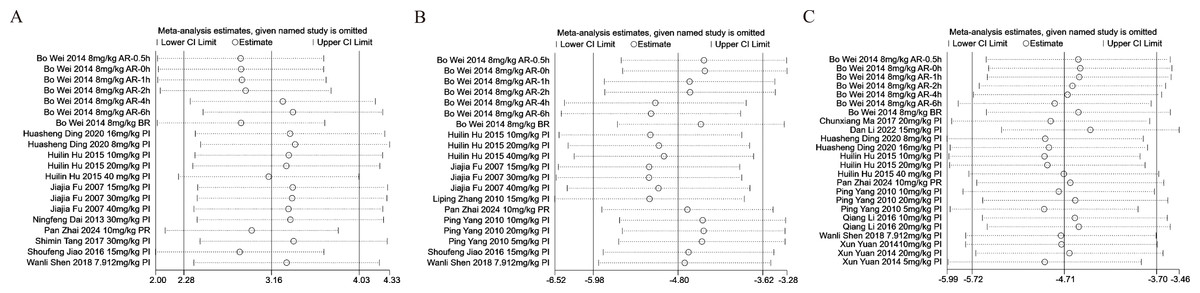
Figure 7: Sensitivity analysis chart for SOD, MDA, and myocardial infarction area.
(A) Sensitivity analysis chart for SOD. (B) Sensitivity analysis chart for MDA. (C) Sensitivity analysis chart for myocardial infarction area.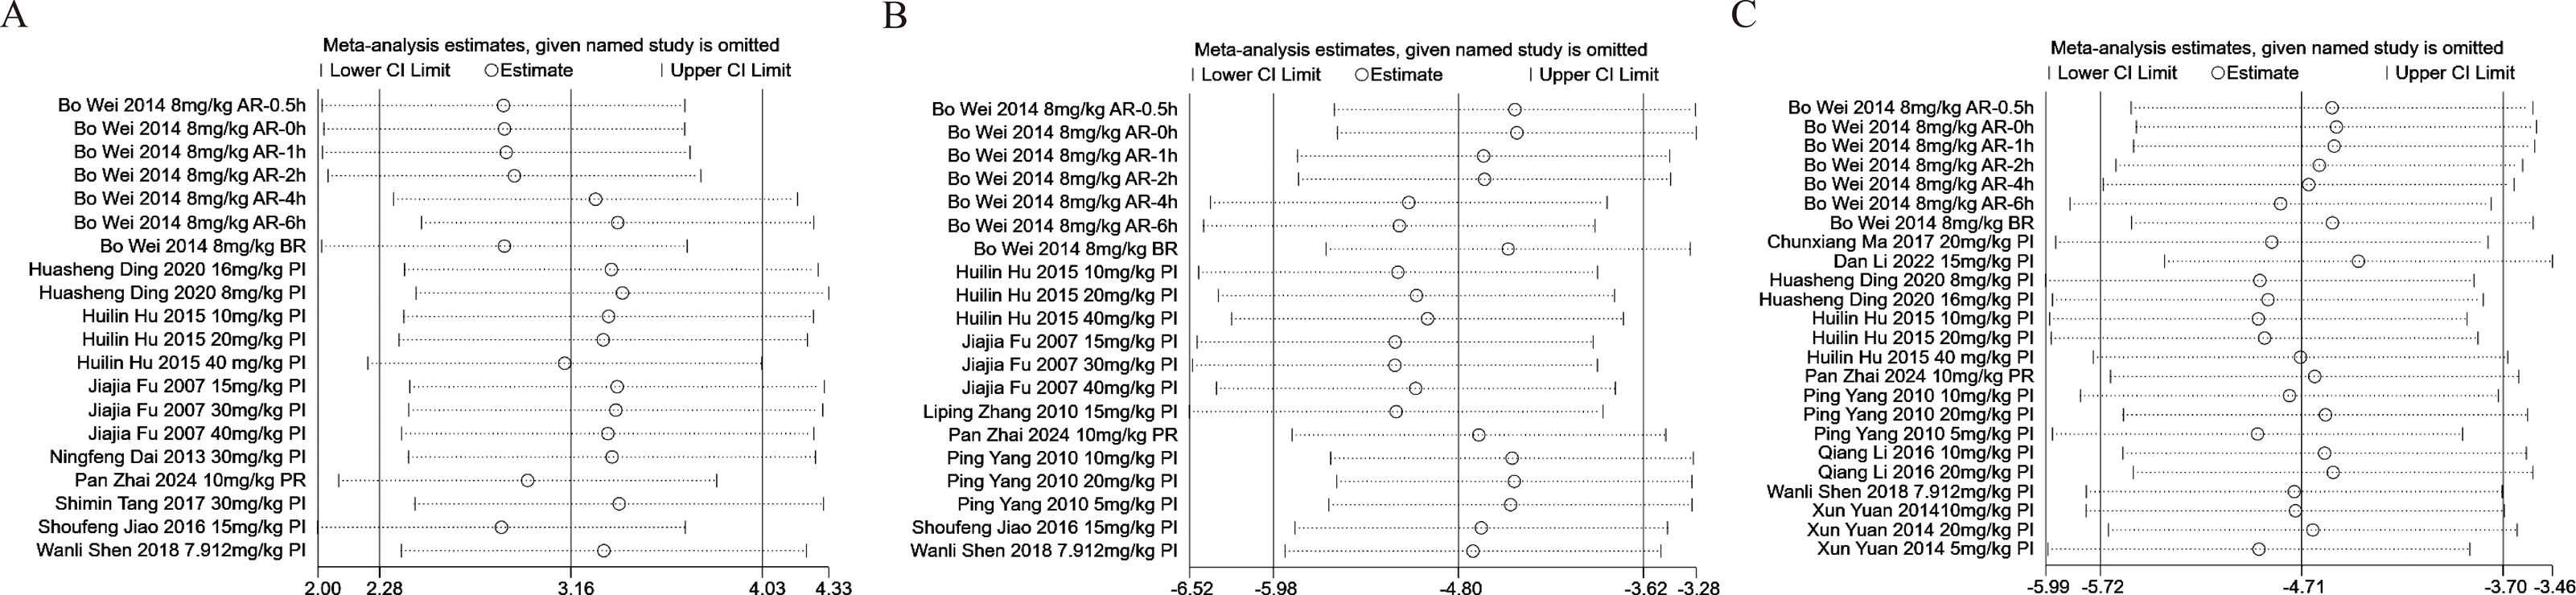
Discussion
This systematic review and meta-analysis investigated the efficacy and utility of tanshinone IIA in treating MIRI in rat studies, aiming to identify success factors and provide robust evidence for future treatments of MIRI. The left anterior descending coronary artery was consistently used as the site for ligation and release in the rat models of MIRI included in this systematic review and meta-analysis, ensuring the validity and reliability of the data input and minimizing bias. SOD serves as the primary oxygen radical scavenging enzyme in organisms, while MDA is a critical indicator of the severity of free radical injury. In MIRI, disruption of cellular oxidative stress equilibrium occurs, and both SOD and MDA levels serve as markers of this imbalance in the body (Zhang et al., 2022). The myocardial infarction area directly reflects the severity of MIRI. Therefore, we conducted a systematic review and meta-analysis to compile data on tanshinone IIA therapy in rat models of MIRI.
Oxidative stress plays a crucial role in the pathogenesis of myocardial injury. During myocardial ischemia and hypoxia, significant amounts of oxygen radicals are generated, leading to increased permeability of cardiac cell membranes and potential necrosis (Petrosillo et al., 2005). SOD neutralizes free radicals and suppresses the formation of highly reactive hydroxyl radicals (Fujii, Homma & Osaki, 2022). Elevated SOD levels enhance the body’s antioxidant capacity, thereby mitigating myocardial injury. Consequently, SOD was selected as one of the primary endpoints. The findings showed that tanshinone IIA treatment in rat models with MIRI resulted in increased serum SOD levels. Similar outcomes were observed across subgroups based on ischemia duration, reperfusion duration, dosage, route, and treatment time. Furthermore, we identified ischemia duration as a potential source of heterogeneity and noted that subgroup analysis only partially reduced this heterogeneity. This heterogeneity is attributable to factors such as measurement discrepancies between research institutions and variations in the site of ligation of the left anterior descending coronary artery during the experiments.
MDA is the end product of lipid peroxidation by oxygen radicals. MDA can induce cell membrane degeneration and alter membrane fluidity and permeability, thereby indicating the extent of oxidative damage to cardiac myocytes (Nehra et al., 2022; Tawfik, Makary & Keshawy, 2021). SOD serves as an indicator of the body’s antioxidant capacity, while MDA levels reflect the presence of free radicals. Therefore, MDA was selected as one of the primary outcomes of this study. The results demonstrated that tanshinone IIA reduced MDA levels in the serum of rat models with MIRI, with consistent findings across subgroups based on reperfusion duration, dosage, route, and treatment time. However, subgroup analysis revealed that tanshinone IIA did not significantly reduce MDA levels in the subgroup with ischemia duration between 40 and 45 min (MD = −0.82, 95% CI [−1.77–0.12], p = 0.09). These results suggest that tanshinone IIA was less effective in mitigating MIRI under conditions of longer ischemic durations. However, the subgroup comprised only four studies, necessitating further research to validate this conclusion. Despite the reduction in subgroup heterogeneity achieved through subgroup analysis, significant heterogeneity persisted in other subgroups. Differences in measurement techniques across studies and variations in the site of ligation of the left anterior descending coronary artery possibly contributed to this heterogeneity.
The myocardial infarction area serves as a direct measure of MIRI severity and visually depicts the therapeutic impact of tanshinone IIA. The results showed that tanshinone IIA reduced the myocardial infarction area in rat models with MIRI, with consistent findings across subgroups based on ischemia duration, reperfusion duration, dosage, route, and treatment time. Moreover, we identified ischemia duration as a potential source of heterogeneity. However, there remained unexplained variation, which is attributable to differences in detection equipment and methodologies used across studies.
This systematic review represents the first comprehensive examination of the effects of tanshinone IIA on rat models with MIRI. The included articles underwent rigorous filtering and inspection processes. It can be inferred that the overall quality of the included articles was not particularly high. Despite the rigorous evaluation of the tanshinone IIA intervention in rat models with MIRI, this study had several limitations: First, only articles written in Chinese and English were included. The search for grey articles and conference articles was inadequate owing to challenges in accessing these sources. Second, some results exhibited high heterogeneity, with a few included publications and outcome indicators demonstrating publication bias. Third, this article represents a meta-analysis of animal experiments, which may have been influenced by the quality of the original study design, resulting in a lower quality overall and potentially affecting the accuracy of the results. This study was limited to rat models with left anterior descending coronary artery ligation to induce ischemia and reperfusion. All studies included were conducted in China, with no representation from other geographical regions, which constitutes a limitation in the scope of the research. Fourth, the included studies lacked descriptions regarding allocation concealment, blinding of caregivers and investigators, random housing, and blinding of outcome assessment. Furthermore, this meta-analysis was limited to 15 articles, of which seven were in English and eight in Chinese, with a greater number of Chinese articles than English articles, suggesting a potential language bias. Consequently, the included studies were categorized as having uncertain risks. To enhance the validity of the study’s conclusions, larger sample sizes and higher-quality studies are necessary.
Conclusion
In this meta-analysis, 15 articles were included to provide more reliable preclinical evidence concerning SOD, MDA, and myocardial infarction area. A comprehensive analysis of tanshinone IIA use in rat models with MIRI revealed significant efficacy when the ischemia duration was less than 40 min. Tanshinone IIA demonstrated a notable therapeutic effect through intraperitoneal, intragastric, and intravenous administrations at doses exceeding 5 mg/kg. Additionally, treatment with tanshinone IIA at all stages—prior to myocardial ischemia, after ischemia but before reperfusion, prior to ischemia and after reperfusion, and after reperfusion—showed satisfactory results. Therefore, the potential translation of tanshinone IIA from laboratory research to clinical treatment for MIRI holds considerable promise.