
Prognostic role of chemokine-related genes in acute myeloid leukemia
- Published
- Accepted
- Received
- Academic Editor
- Hao Wu
- Subject Areas
- Hematology, Oncology
- Keywords
- Acute Myeloid leukemia, Chemotactic cytokines, Prognosis, Risk model
- Copyright
- © 2024 Hou et al.
- Licence
- This is an open access article distributed under the terms of the Creative Commons Attribution License, which permits using, remixing, and building upon the work non-commercially, as long as it is properly attributed. For attribution, the original author(s), title, publication source (PeerJ) and either DOI or URL of the article must be cited.
- Cite this article
- 2024. Prognostic role of chemokine-related genes in acute myeloid leukemia. PeerJ 12:e17862 https://doi.org/10.7717/peerj.17862
Abstract
Background
Chemotactic cytokines play a crucial role in the development of acute myeloid leukemia (AML). Thus, investigating the mechanisms of chemotactic cytokine-related genes (CCRGs) in AML is of paramount importance.
Methods
Using the TCGA-AML, GSE114868, and GSE12417 datasets, differential expression analysis identified differentially expressed CCRGs (DE-CCRGs). These genes were screened by overlapping differentially expressed genes (DEGs) between AML and control groups with CCRGs. Subsequently, functional enrichment analysis and the construction of a protein-protein interaction (PPI) network were conducted to explore the functions of the DE-CCRGs. Univariate Cox regression, least absolute shrinkage and selection operator (LASSO), and multivariate Cox regression analyses identified relevant prognostic genes and developed a prognostic model. Survival analysis of the prognostic gene was performed, followed by functional similarity analysis, immune analysis, enrichment analysis, and drug prediction analysis.
Results
Differential expression analysis revealed 6,743 DEGs, of which 29 DE-CCRGs were selected for this study. Functional enrichment analysis indicated that DE-CCRGs were primarily involved in chemotactic cytokine-related functions and pathways. Six prognostic genes (CXCR3, CXCR2, CXCR6, CCL20, CCL4, and CCR2) were identified and incorporated into the risk model. The model’s performance was validated using the GSE12417 dataset. Survival analysis showed significant differences in AML overall survival (OS) between prognostic gene high and low expression groups, indicating that prognostic gene might be significantly associated with patient survival. Additionally, nine different immune cells were identified between the two risk groups. Correlation analysis revealed that CCR2 had the most significant positive correlation with monocytes and the most significant negative correlation with resting mast cells. The tumor immune dysfunction and exclusion score was lower in the high-risk group.
Conclusion
CXCR3, CXCR2, CXCR6, CCL20, CCL4, and CCR2 were identified as prognostic genes correlated to AML and the tumor immune microenvironment. These findings offerred novel insights into the prevention and treatment of AML.
Introduction
Acute myeloid leukemia (AML) is a malignant clonal disease of hematopoietic stem cells, characterized by uncontrolled proliferation and impaired differentiation of immature myeloid cells in the bone marrow and peripheral blood (Arber et al., 2022; Döhner et al., 2022). Despite an unclear exact pathogenesis, genetic, environmental, and immune factors are implicated. Chemotherapy has traditionally been the primary treatment for AML. Recently, targeted therapies have significantly improved patient survival, but sustained remission durations remain limited, and relapse rates are high, resulting in a 5-year survival rate below 40% (Döhner et al., 2022; Siegel et al., 2021). Therefore, identifying new prognostic genes is crucial for monitoring AML prognosis and understanding its pathogenesis.
The bone marrow microenvironment is a dynamic network composed of growth factors, cytokines, chemokines, and stromal cells. Chemokines, also known as chemotactic cytokines, are small proteins (8–12 kDa) that primarily regulate cell survival, proliferation, and transport (Griffith, Sokol & Luster, 2014; Ozga, Chow & Luster, 2021). Certain CCL and CXCL chemokines regulate angiogenesis, local T-cell recruitment, anti-leukemia T-cell activity, and cell growth in AML, contributing to the disease’s development and progression (Ayala et al., 2009). Elevated CXCR4 expression in AML cells is associated with FLT3 mutation status and poor prognosis. The FLT3-ITD mutation enhances the CXCL12/CXCR4 signaling pathway by upregulating CXCR4 expression, thereby altering treatment outcomes and contributing to the poor prognosis of AML (Rombouts et al., 2004; Spoo et al., 2007). However, the specific roles of other chemotactic cytokines in AML remain unclear.
Therefore, this study aimed to screen chemotactic cytokine-related genes (CCRGs) in AML using a series of bioinformatics methods. The objective was to explore the potential molecular mechanisms and prognostic value of chemotactic cytokines in AML, providing novel insights into its treatment and establishing a theoretical foundation for further research.
Materials & Methods
Data source
Transcriptomic data, clinical information, and genetic mutation data from 161 AML samples in the TCGA-AML dataset were obtained from the Cancer Genome Atlas (TCGA) database (https://cancergenome.nih.gov). GSE114868 and GSE12417 data were acquired from the Gene Expression Omnibus (GEO) (http://www.ncbi.nlm.nih.gov/geo/). The GSE114868 dataset included transcriptome data of 194 AML and 20 control bone marrow mononuclear cell samples measured using the GPL17586 platform, which were used for differential gene analysis and expression validation. The testing dataset included data for 79 AML samples measured using the GPL570 platform from the GSE12417 dataset. Additionally, data for 69 chemotactic CCRGs (Table S1) were obtained from a previous report (Hu et al., 2022).
Identification and functional enrichment analysis of DEGs and DE-CCRGs
Differentially expressed genes (DEGs) between AML and control samples were identified in the GSE114868 dataset. The limma package was used for differential analysis with criteria of —log2fold change (FC)— > 0.5 and adj.P.Val < 0.05 (Shen et al., 2023). A volcano plot and a heatmap were generated to illustrate the results using the ggplot2 package (Gustavsson et al., 2022) and the ComplexHeatmap package, respectively (Gu, Eils & Schlesner, 2016). Differentially expressed CCRGs (DE-CCRGs) were identified based on overlapping DEGs and CCRGs. Gene Ontology (GO) and Kyoto Encyclopedia of Genes and Genomes (KEGG) enrichment analyses of DEGs and DE-CCRGs were performed using the clusterProfiler package (Yu et al., 2012) (GO: pvalue cutoff = 0.05, KEGG: p value cutoff = 0.2). To explore interactions between the DE-CCRGs, a protein–protein interaction (PPI) network was created using the STRING database (https://string-db.org).
Construction and validation of the risk model
First, univariate Cox analysis was performed on DE-CCRGs in the TCGA-AML dataset, using a p-value <0.2 to identify prognostic-related DE-CCRGs. Next, candidate genes were selected using the glmnet package for least absolute shrinkage and selection operator (LASSO) regression analysis (family = Cox) (Li, Lu & Yin, 2022). Finally, multivariate Cox regression analysis was conducted to identify prognostic genes based on candidate genes, using the stepwise regression function of step (direction = both). A prognostic risk model was developed based on the expression levels of the prognostic genes in the TCGA-AML dataset. The risk score in the risk model was calculated using the following formula: To evaluate the risk model’s efficacy, samples in the TCGA-AML dataset were classified into high and low-risk groups based on the median value of the risk score. Kaplan–Meier (K-M) survival analysis was performed for the two groups using the survminer package. Receiver operating characteristic (ROC) curves at 6, 12, and 18 months were generated using the survivalROC package (Heagerty, Lumley & Pepe, 2000). Additionally, the risk model was validated using the GSE12417 dataset.
Functional analysis and drug prediction of the prognostic genes
The expression of prognostic genes was analyzed between AML and control samples in the TCGA-AML dataset. Based on the optimal expression threshold, AML samples were divided into high and low expression groups, and K-M curves were plotted to visualize the relationship between prognostic gene expression and survival. To understand the functional similarity between prognostic genes, the R package GOSemSim (Yang et al., 2023) was used to calculate functional similarity scores based on GO annotation data. These scores were presented as heatmaps. To explore the functions and related proteins of prognostic genes, the GeneMANIA database was used to construct a GeneMANIA network. Additionally, the DGIdb and MSigDB databases were employed to predict drugs that interact with the prognostic genes.
Analysis of enrichment
To investigate potential action mechanisms of the prognostic genes, gene-set enrichment analysis (GSEA) of prognostic genes was performed using the TCGA-AML dataset. First, the Spearman correlation coefficient between the prognostic genes and all TCGA-AML genes was calculated using the corrplot package and sorted by correlation (Wang et al., 2022). Next, GSEA of prognostic genes was conducted using the clusterProfiler package (Yu et al., 2012) based on the c2.cp.kegg.v2023.1.Hs.symbols.gmt gene set extracted from MSigDB. To study the differences in pathways between the two risk groups, gene-set variation analysis (GSVA) was performed using the GSVA package (Ferreira et al., 2021), and differential analysis was conducted using the limma package (Wang et al., 2023).
Analysis of the immunological microenvironment and prediction of immunotherapeutic response
The CIBERSORT algorithm (p-value < 0.05) (Newman et al., 2015) was used to calculate the number of immune infiltrating cells for all samples in the TCGA-AML dataset. The differences in the abundance of 22 immune cells between the two risk groups were compared using the Wilcoxon test. Finally, Spearman correlations between prognostic genes and differential immune cells were calculated and displayed as heatmaps. To explore whether the risk model could predict the value of immunotherapy in AML, the TIDE algorithm was used to calculate the TIDE scores for the two risk groups in the TCGA-AML dataset, and the Spearman correlation between TIDE scores and risk scores was determined.
Expression validation of prognostic genes
Based on the GSE114868 dataset, the differential expression of prognostic genes in AML and control samples was compared using the Wilcoxon test. Real-time fluorescence quantitative PCR (RT-qPCR) validated these expression results. Five pairs of normal and AML samples were obtained from the Department of Hematology at the Second Hospital of Shanxi Medical University. The ethics committee of the Second Hospital of Shanxi Medical University approved the study protocol (batch number: (2023) YX No. (278)) and waived the need for informed consent. Total RNA from the 10 samples was extracted using TRIzol reagent (Ambion, Austin, TX, USA) according to the manufacturer’s protocol. cDNA was reverse-transcribed using the SureScript First-strand cDNA Synthesis kit (Servicebio, Beijing, China). The qPCR assay was performed with the CFX Connect Thermal Cycler (Bio-Rad, Hercules, CA, USA), and relative quantification of mRNAs was calculated using the 2- ΔΔCT method. The sequences of all primers are listed in Table S2.
Statistics and reproducibility
In this study, all bioinformatic analyses were performed using R software. In the experiment, the results were presented as mean ± SD for more than three biological replicates. Moreover, in bioinformatics analysis, differences between groups were compared by Wilcox test. All differences were considered significant when the p-value was less than 0.05. In addition, the D’Agostino-Pearson omnibus normality test was used to determine whether data were normally distributed. Datasets with gaussian distributions were compared using Student’s t-test (two-tailed) or one-way ANOVA followed by Tukey’s post hoc test. For comparing non-Gaussian distributions, the nonparametric Mann–Whitney U test or Kruskal–Wallis (with post hoc Dunn).
Results
DE-CCRGs are primarily involved in chemotactic cytokines-related functions and pathways
Differential expression analysis was performed to investigate gene differences in GSE114868. A total of 6,743 DEGs were identified between AML and control samples, with 3,751 upregulated and 2,992 downregulated genes (Fig. 1A). Moreover, the biological functions of DEGs were explored. GO functional analysis revealed that DEGs were associated with ribonucleoprotein complex biogenesis and other cellular functions (Fig. 1B). KEGG enrichment analysis indicated that DEGs were enriched in osteoclast differentiation, the chemokine signaling pathway, coronavirus disease-COVID-19, and other pathways (Fig. 1C). Based on the expression overlap between DEGs and CCRGs, 29 DE-CCRGs were identified (Fig. 1D). KEGG and GO enrichment analysis of DE-CCRGs highlighted their associated biological functions and signaling pathways. The results showed significant enrichment in GO-biological processes (BPs) terms related to the chemokine-mediated signaling pathway and cellular response to chemokines. In the GO-cellular component (CC) category, the genes were enriched in the external side of the plasma membrane. GO-molecular function (MF) analysis showed enrichment for cytokine-cytokine receptor activity, linked to chemotactic cytokines (Fig. 1E). KEGG pathway enrichment analysis revealed that these genes were enriched in the chemokine signaling pathway and cytokine-cytokine receptor interaction (Fig. 1F). To explore interactions among DE-CCRGs, a PPI network was constructed (Fig. 1G), revealing interactions between CXCR6 and CXCL9, CCL4L2 and CCR5, among other pairs. Finally, in order to explore the mutation of DE-CCRGs, the mutation analysis was carried out. The results showed that only CXCL16 and CCL14 underwent Missense Mutation, while CCL17 underwent Missense Mutation and Translation Start Site, suggesting that the differential expression of DE-CCRGs was due to transcriptome-level changes (Fig. 1H).

Figure 1: Identification of differentially expressed genes (DEGs) and differentially expressed chemotactic cytokines-related genes (DE-CCRGs) between normal and acute myeloid leukemia (AML) samples in the GSE114868 dataset.
(A) Volcano plot and heatmap of DEGs between the AML and normal groups in the GSE114868 dataset. (B, C) Gene Ontology (GO) and Kyoto Encyclopedia of Genes and Genomes (KEGG) analysis of DEGs in AML. (D) Venn diagram showing the intersection of DEGs and CCRGs. (E, F) GO and KEGG analyses of DE-CCRGs in AML. (G)PPI network of DE-CCRGs. (H) Mutation analysis of DE-CCRGs.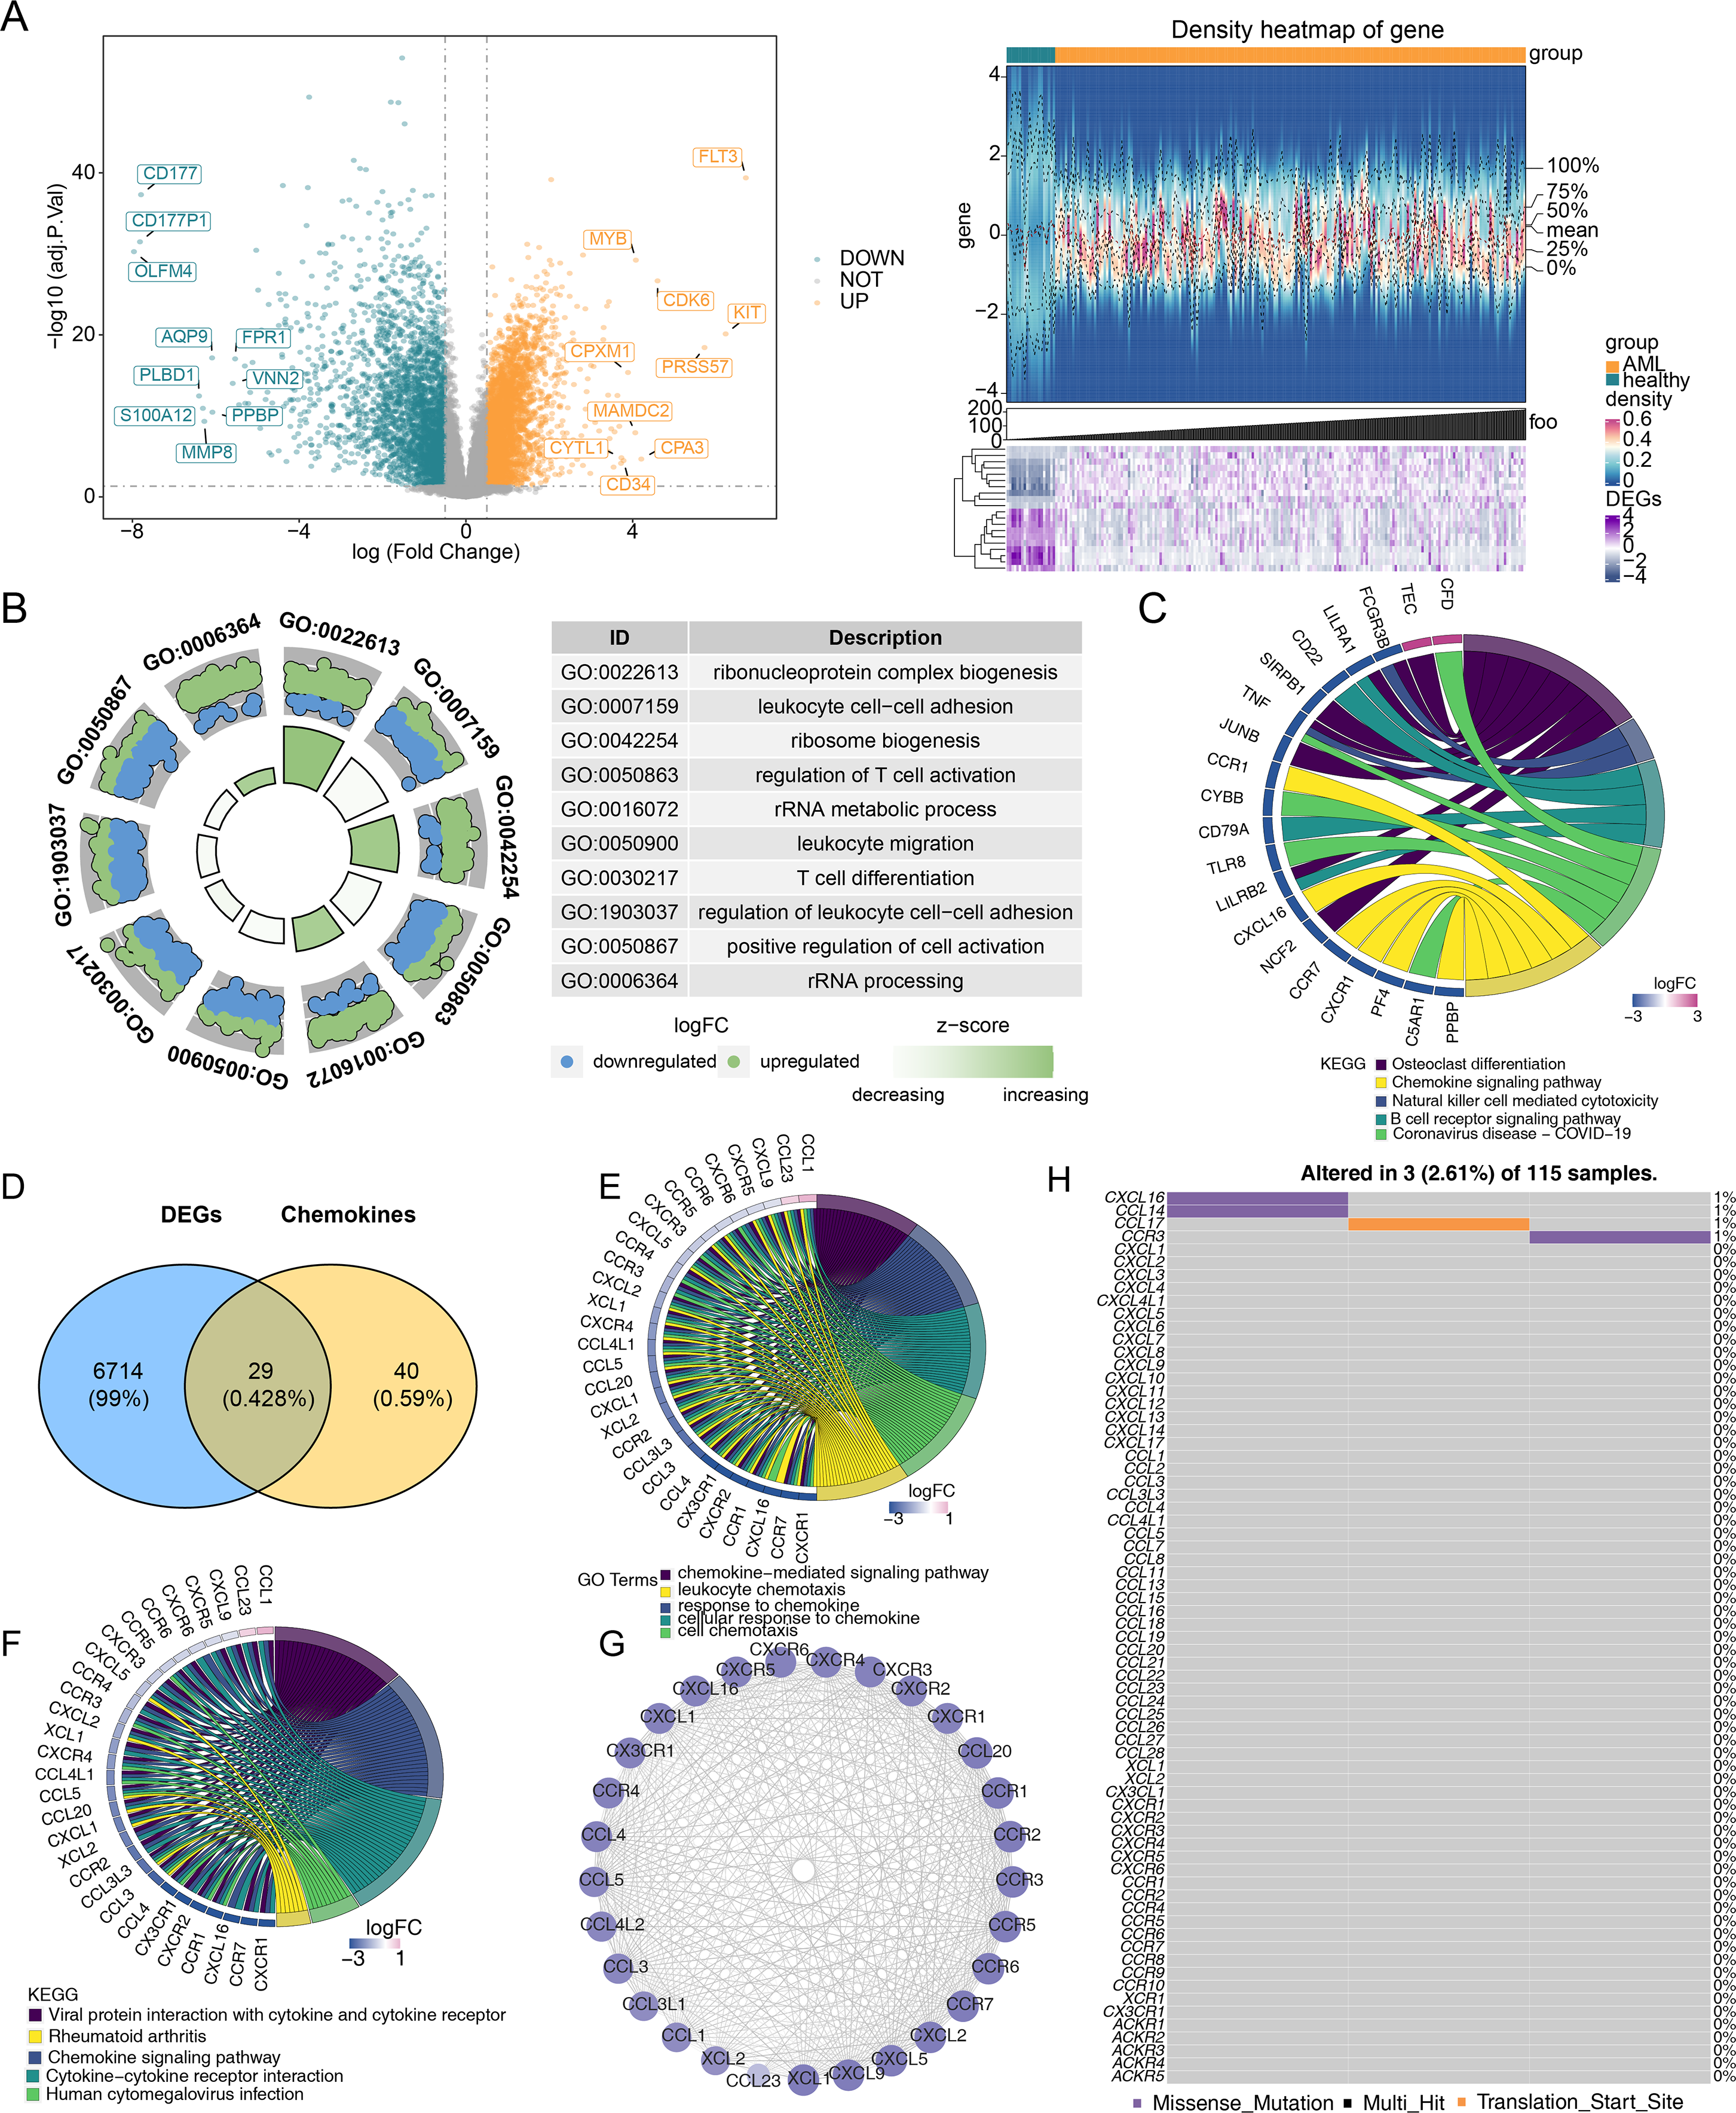
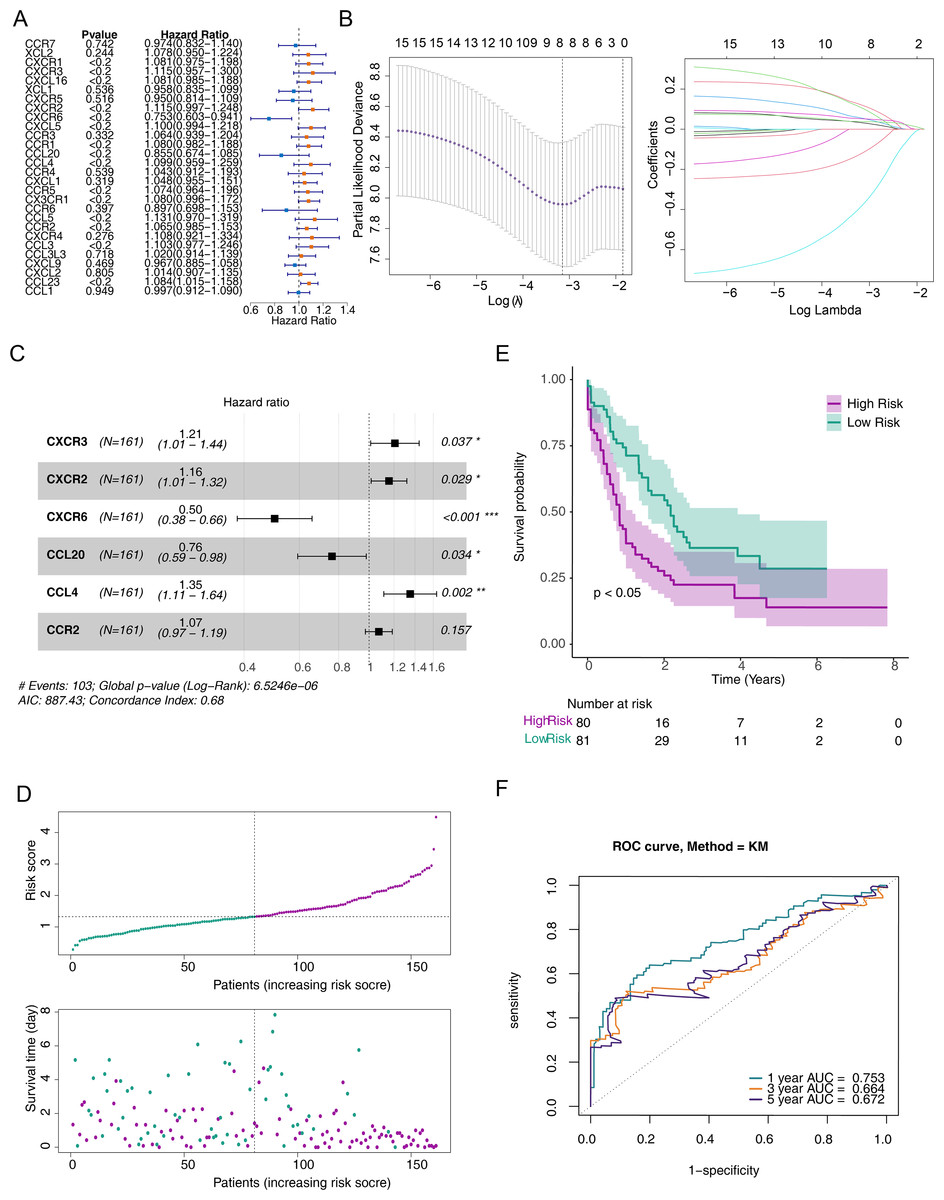
Figure 2: A risk model for outcome prediction in TCGA-AML.
(A) Forest plot for the univariate Cox regression analysis of prognosis-related genes. (B) Error plots for 10-fold cross-validation and the plot of gene coefficients in the least absolute shrinkage and selection operator (LASSO) analysis. (C) Forest plot for the multivariate Cox regression analysis of prognostic genes. (D) Distribution of the risk scores and overall survival status for each patient. (E) Kaplan–Meier curves for the overall survival of patients in the high and low-risk groups. (F) Receiver operating characteristic (ROC) curve of the 6/12/18-month overall survival in the TCGA-AML dataset.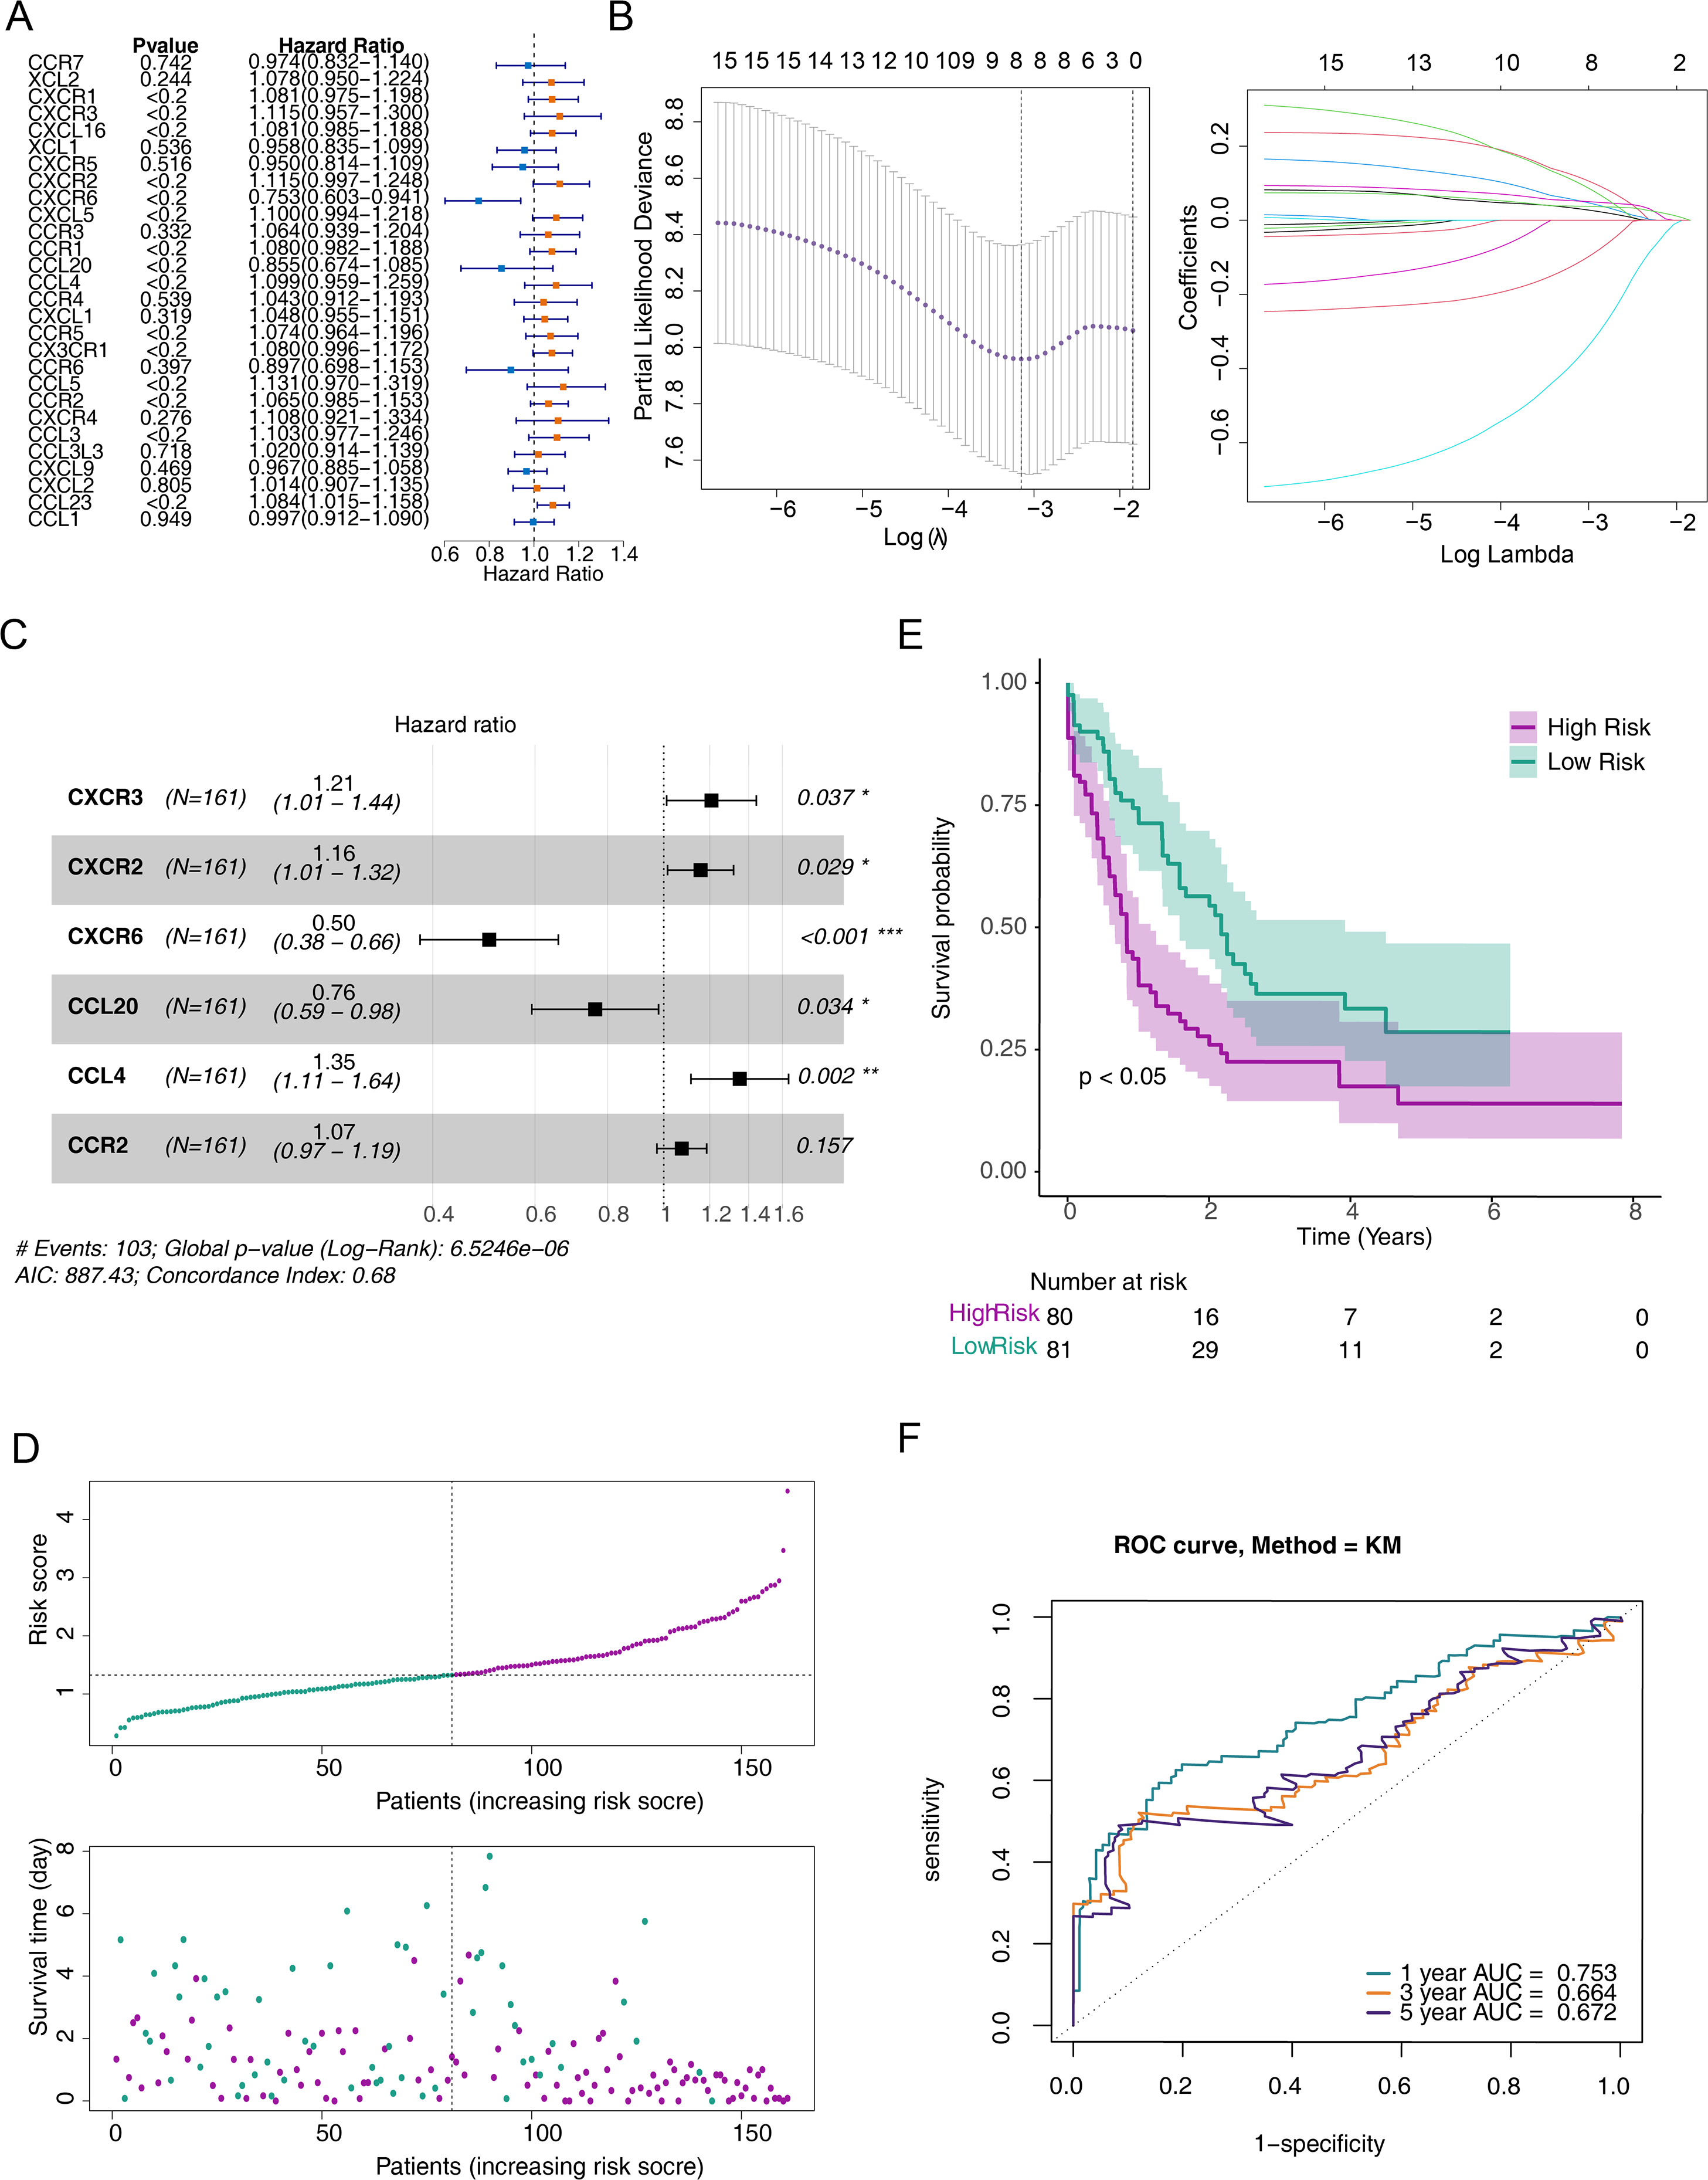
Construction and validation of a risk model for predicting the prognosis of patients with AML
To screen out prognostic related genes, univariate Cox analysis identified 15 prognostic-related DE-CCRGs from 29 DE-CCRGs (Fig. 2A). After that, the characteristic dimension was reduced by LASSO regression analysis, and eight strongly related genes were identified (Fig. 2B). Besides, in order to further narrow down the gene range, six prognostic genes (CXCR3, CXCR2, CXCR6, CCL20, CCL4, and CCR2) were identified by multivariate COX regression analysis (Fig. 2C), and a risk model was established using these six genes. Based on the median risk score, patients were divided into low-risk and high-risk groups (Fig. 2D). Kaplan–Meier (K-M) curves showed significantly lower survival in the high-risk group (Fig. 2E). The area under the curve (AUC) values were 0.719 (6 months), 0.753 (12 months), and 0.741 (18 months), indicating good performance of the risk model (Fig. 2F). In the validation of the model using the GSE12417 dataset, the risk profile plots and survival curves showed results consistent with the TCGA-AML dataset (Figs. 3A–3B). The AUC values were 0.628 (6 months), 0.592 (12 months), and 0.631 (18 months) (Fig. 3C).
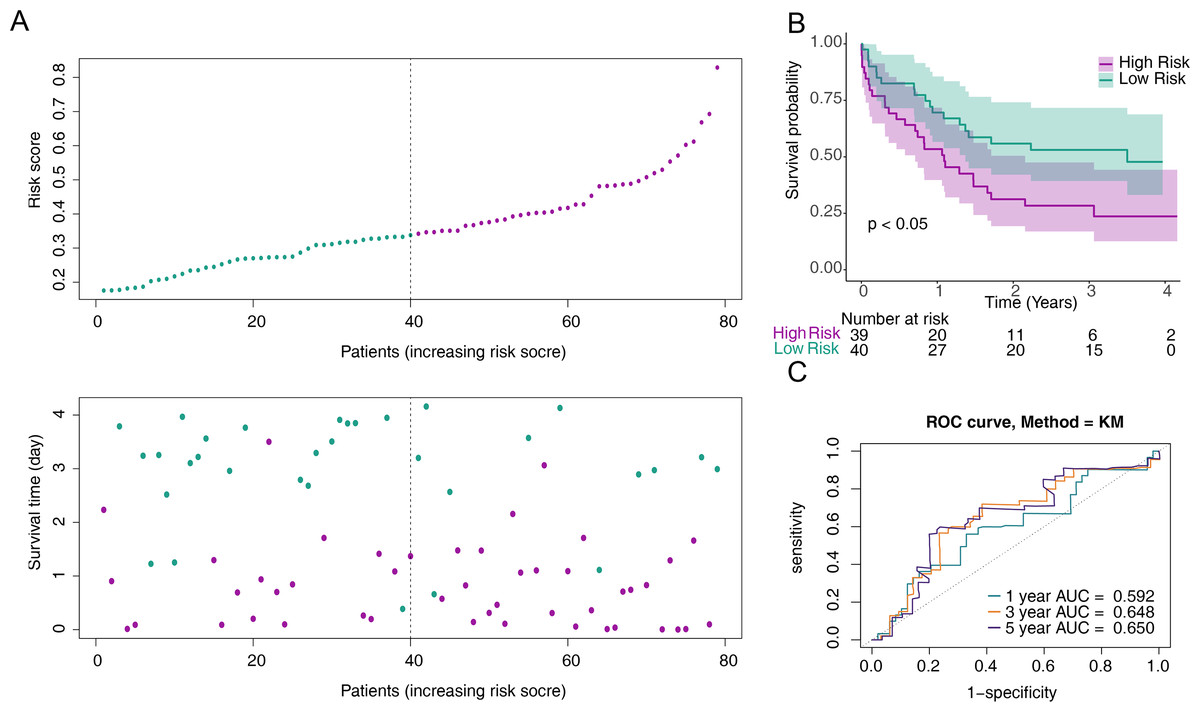
Figure 3: Validation of the risk model against the GSE12417 dataset.
(A) Distribution of the risk scores and overall survival status for each patient. (B) Kaplan–Meier curves for the overall survival of patients in the high and low-risk groups.(C) Receiver operating characteristic (ROC) curve of the 6/12/18-month overall survival in the GSE12417 dataset.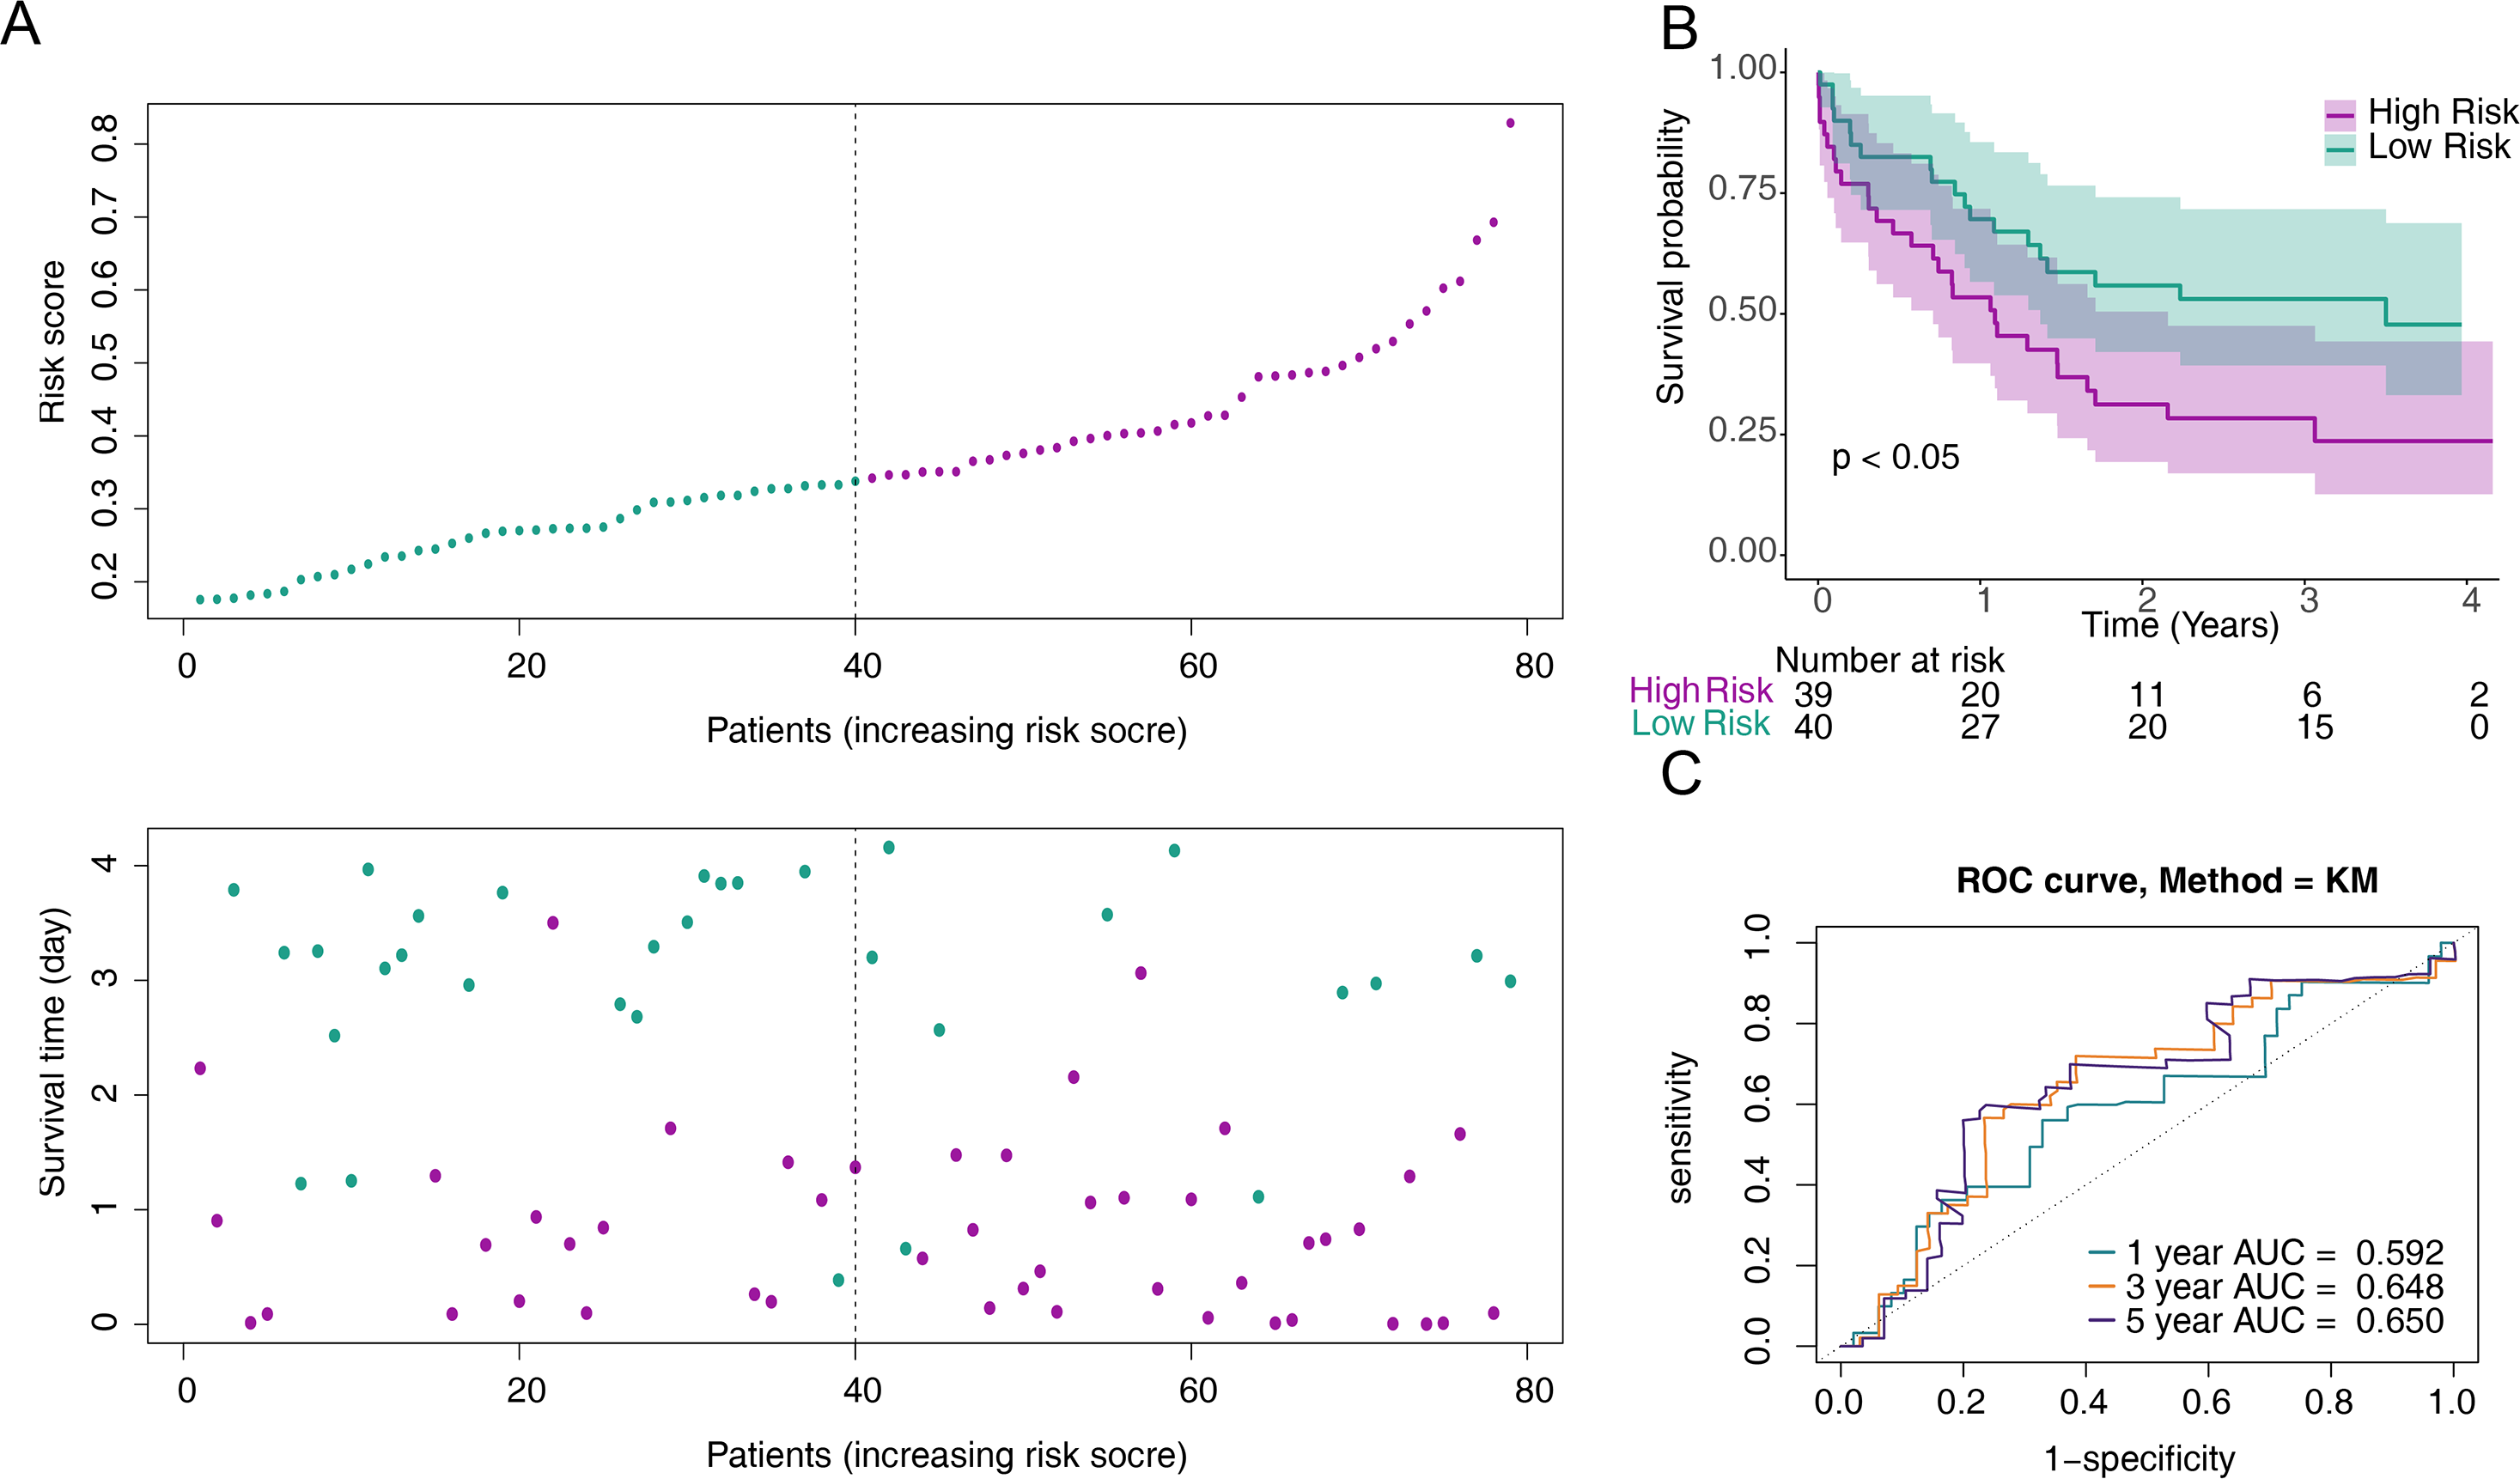
Prognostic gene expression significantly correlated with patient survival
After identifying the six prognostic genes, their association with survival was analyzed. The prognostic genes might be significantly correlated with patient survival (Fig. 4). Among high expression groups of CCL4, CCR2, CXCR2, and CXCR3, AML patients had significantly lower OS, while the opposite was true for CCL20 and CXCR6. Functional similarity of prognostic genes was then studied, the results showed the highest similarity between CCL4 and CCL20, and the lowest between CCR2 and CXCR6 (Fig. 5A). In the GeneMANIA network, 20 genes were found to be associated with the identified prognostic genes. Notably, CXCR8 was found to physically interact with CCR10, and they were involved in functions such as chemokine receptor activity and chemokine binding (Fig. 5B). Additionally, 50 drugs interacting with prognostic genes were predicted based on the DGIdb and DSigDB databases, revealing 87 interaction relationships (Fig. 5C). For example, 2,4-dinitrofluorobenzene was predicted to interact with both CCL4 and CCR2.
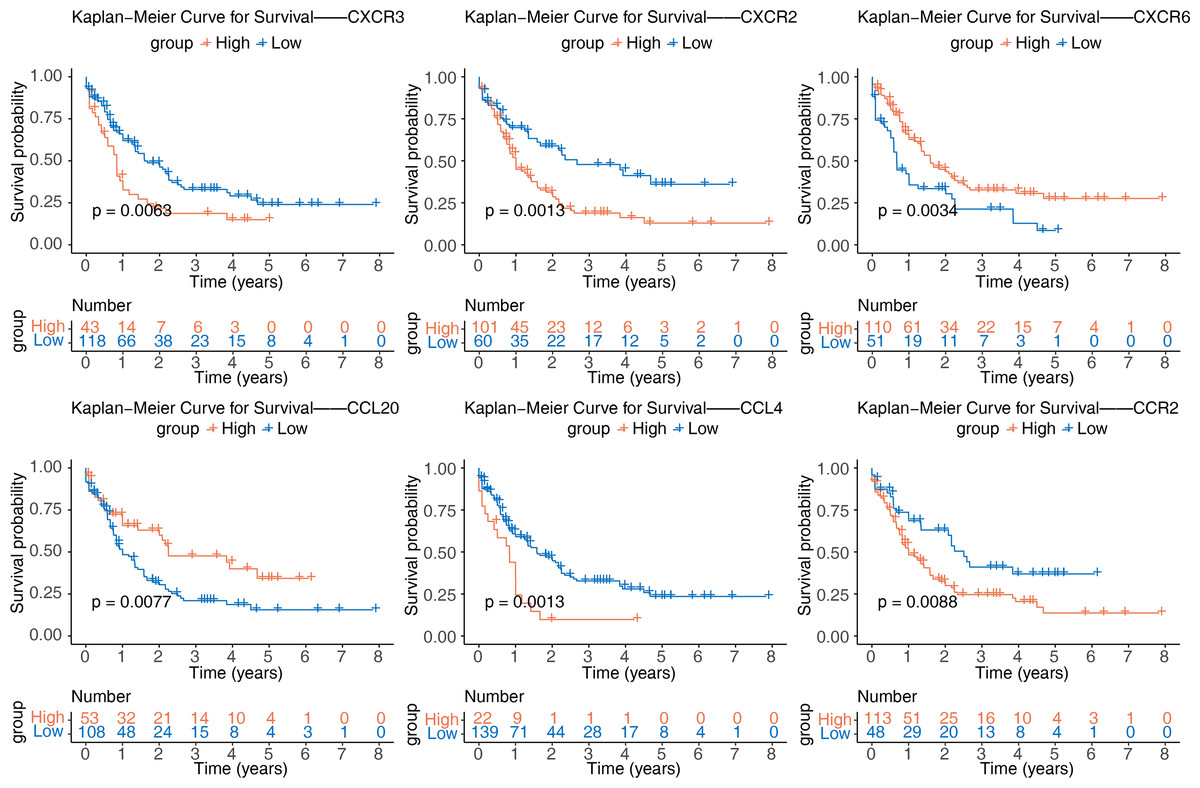
Figure 4: Kaplan–Meier curves of CCL4, CCL20, CCR2, CXCR2, CXCR3, and CXCR6 for overall survival (OS) in the TCGA-AML dataset.
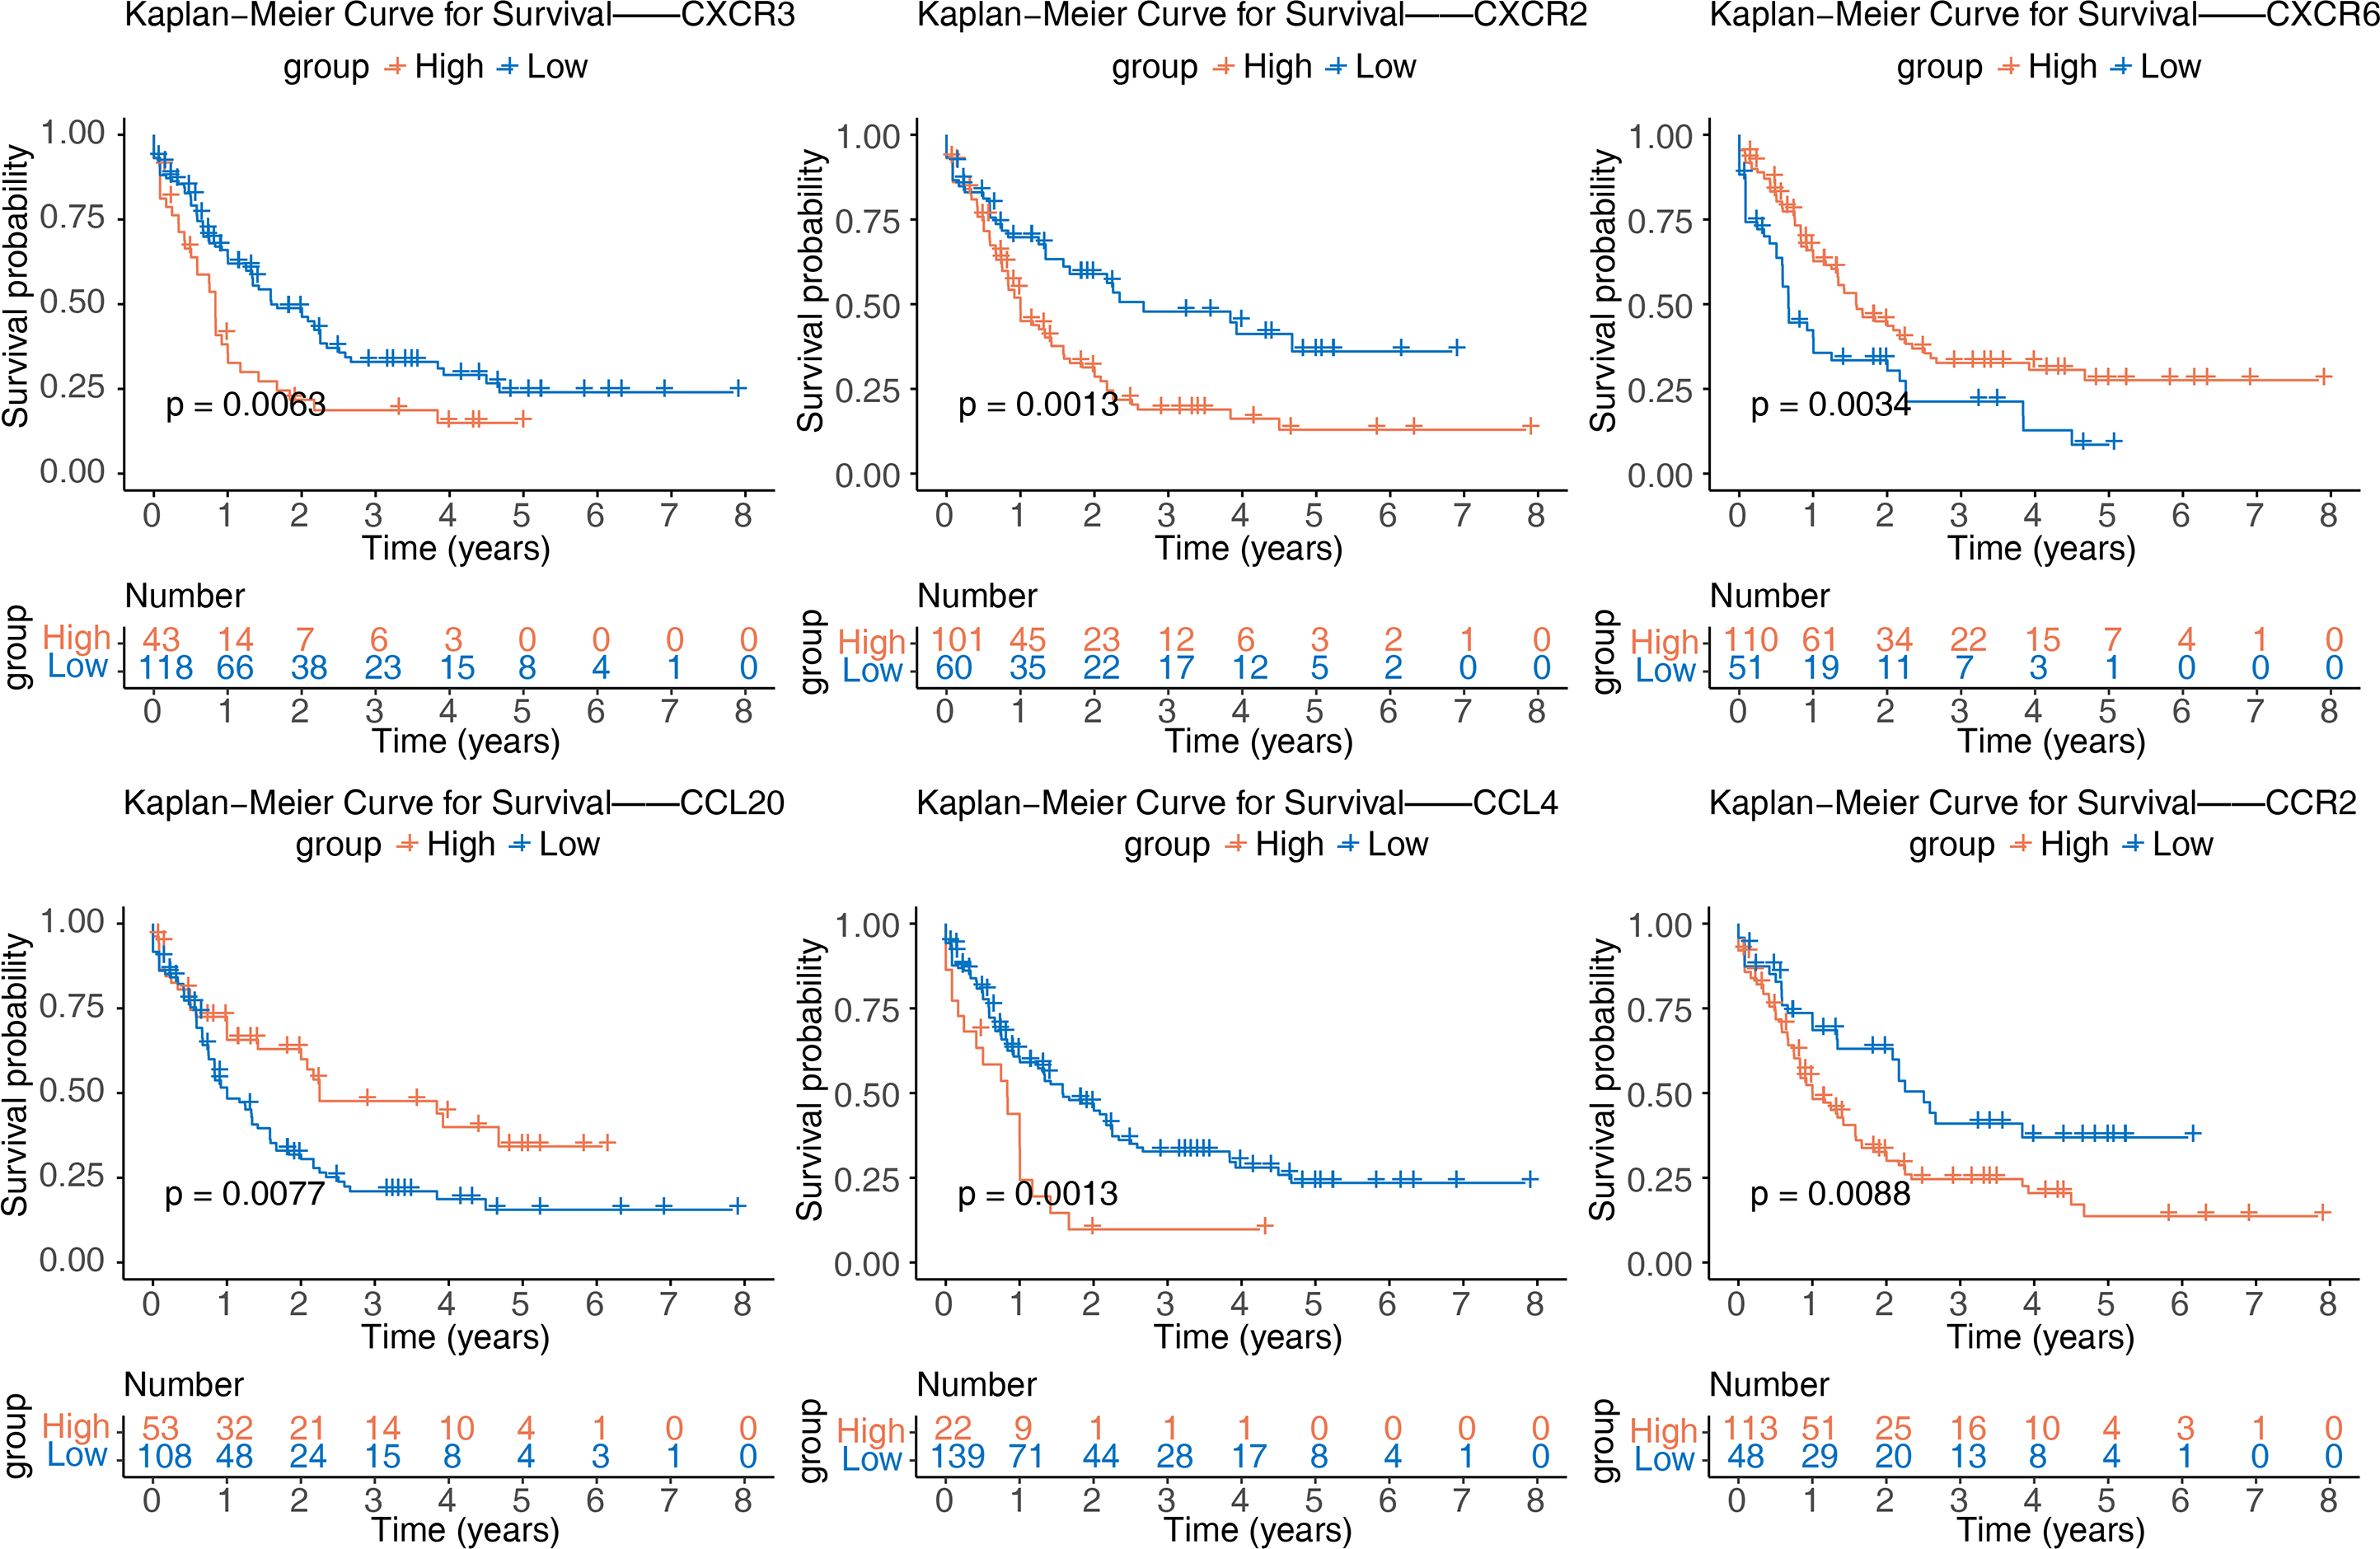
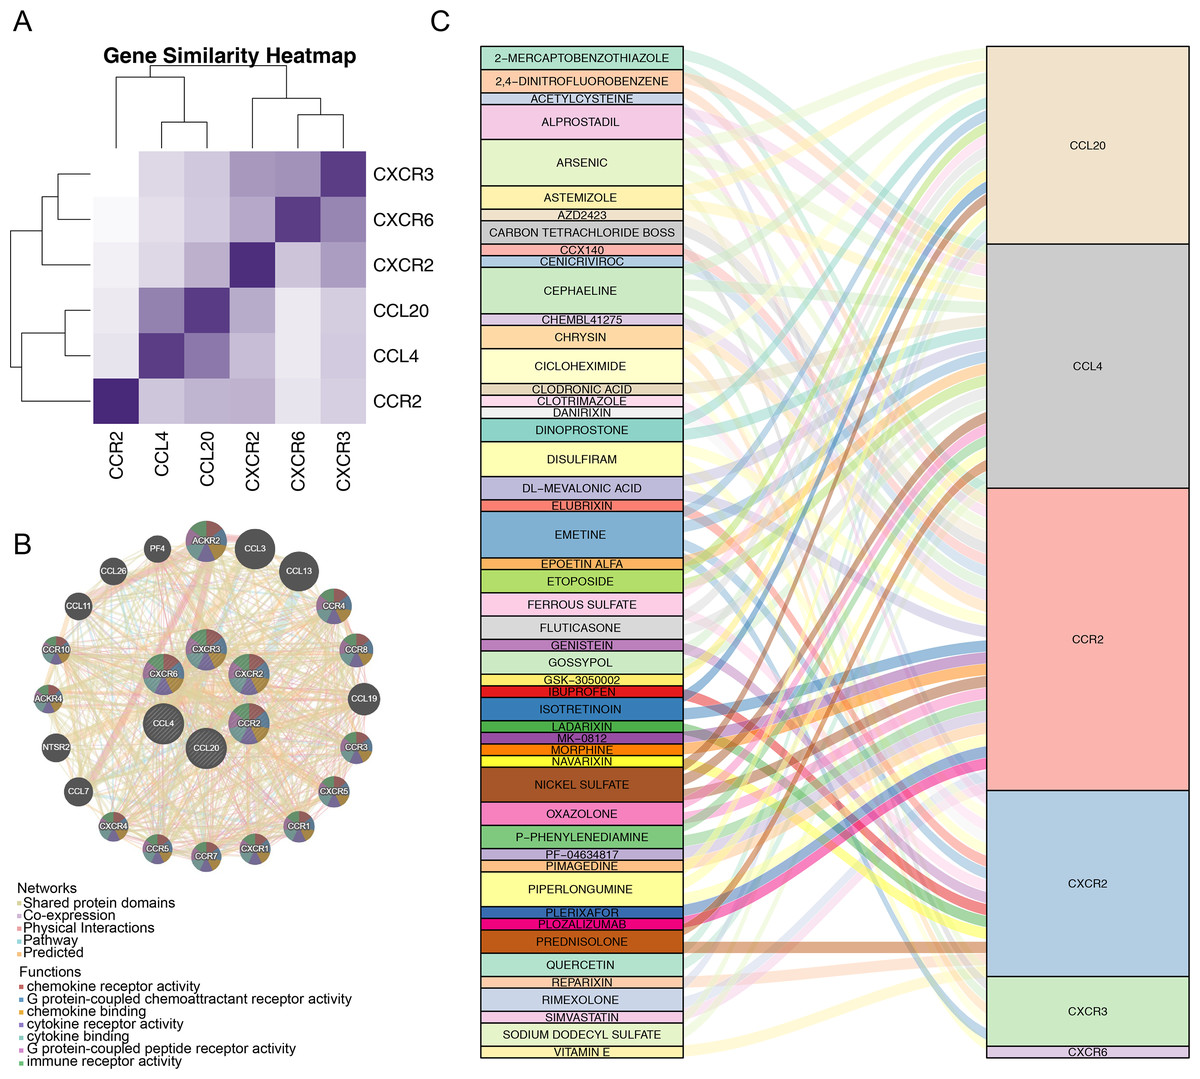
Figure 5: Correlation analysis of prognostic genes prognostic genes and drug prediction analysis.
(A) Functional similarity analysis of six prognostic genes. (B) Gene-gene interaction (GGI) network of six prognostic genes. (C) Sankey interaction diagram of prognostic genes and drugs.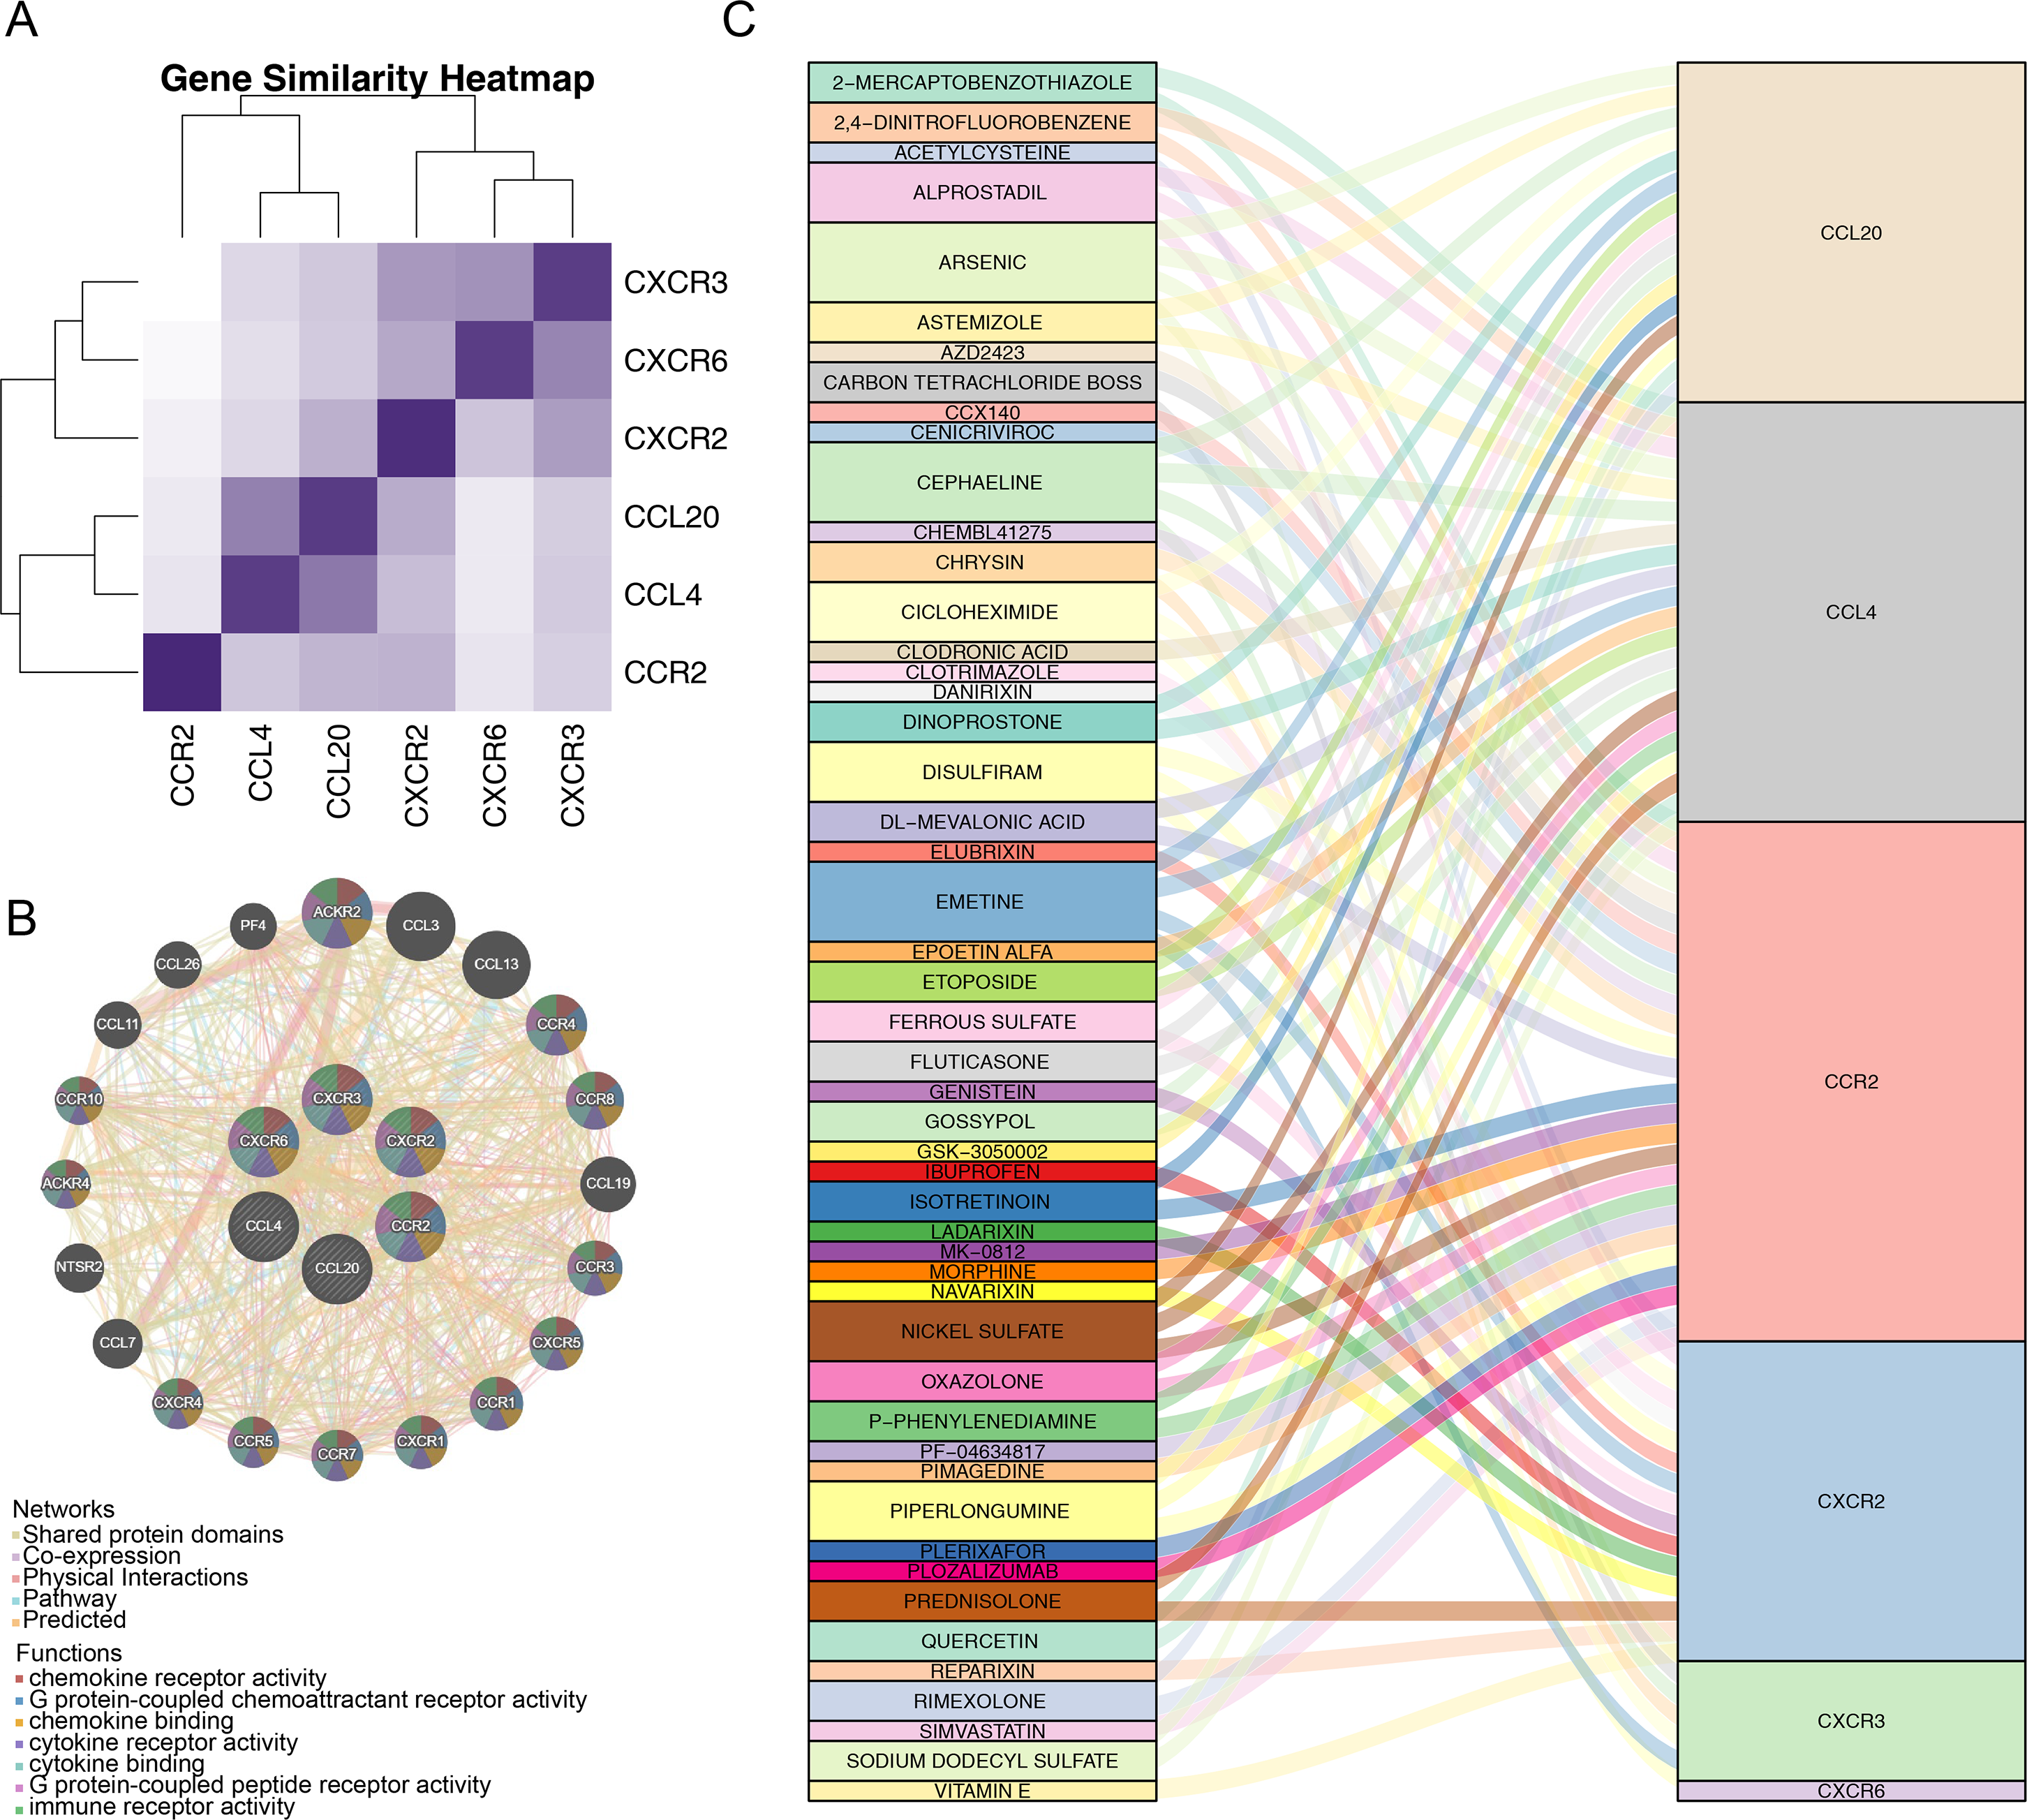
GSEA of prognostic genes and GSVA of the two risk groups
To explore the potential functions of prognostic genes in different risk groups, we performed functional enrichment analysis. GSEA revealed that CCL4, CCL20, and CXCR3 were primarily enriched in mismatch repair and DNA replication, while CXCR6, CXCR2, CCR2, and CCL20 were mainly involved in ribosome formation (Fig. 6A) (Fig. S1). GSVA, conducted to further explore the functional differences between the two risk groups, indicated significant differences in hematopoietic cell lineage, prion disease, systemic lupus erythematosus, lysosomal pathways, and other related pathways (Fig. 6B).
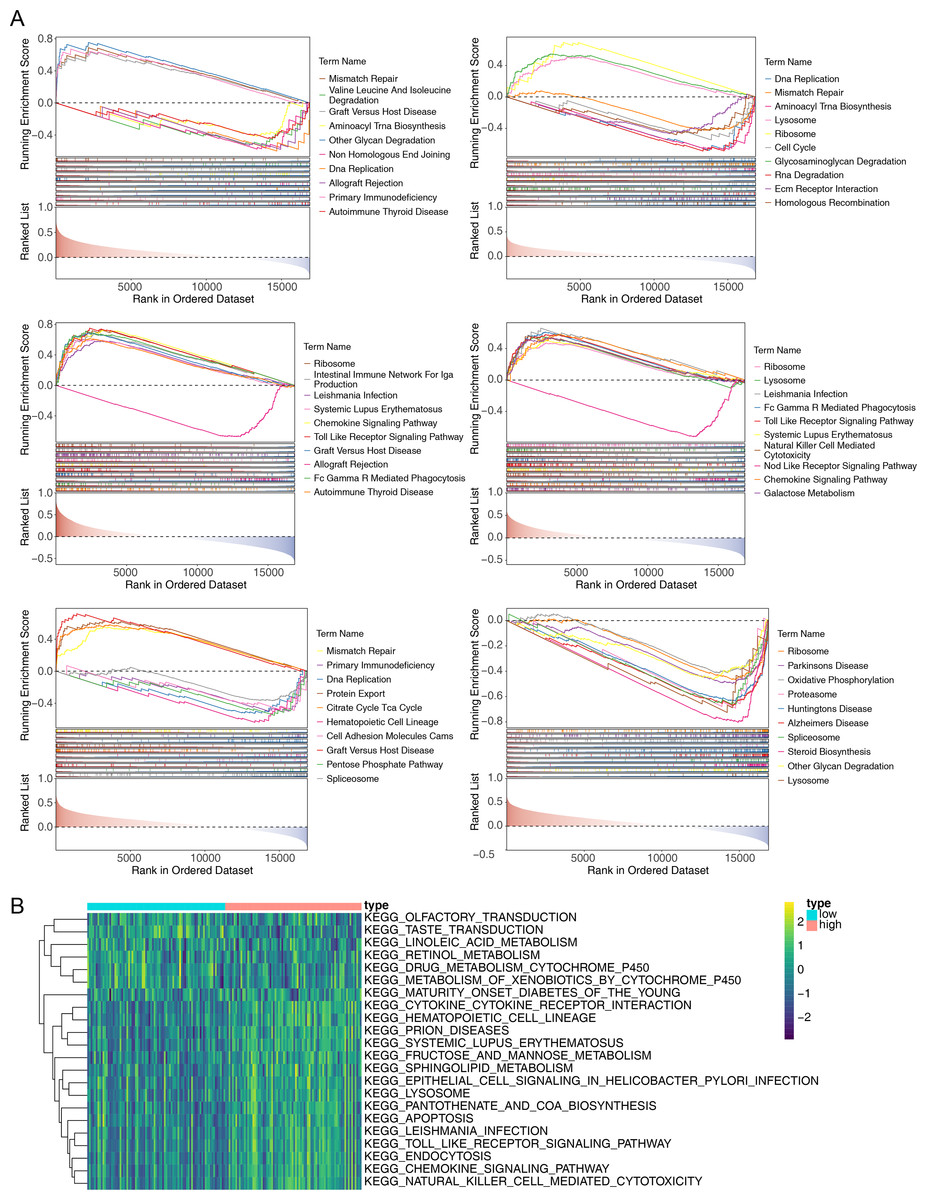
Figure 6: Gene Set Enrichment Analysis (GSEA) of prognostic genes and gene set variation analysis (GSVA) of the two AML risk groups.
(A) GSEA results revealing significant enrichment in the biological processes of CCL4, CCL20, CCR2, CXCR2, CXCR3, and CXCR6 in the TCGA-AML dataset. (B) GSVA results showing significant functional differences between the high and low-risk groups.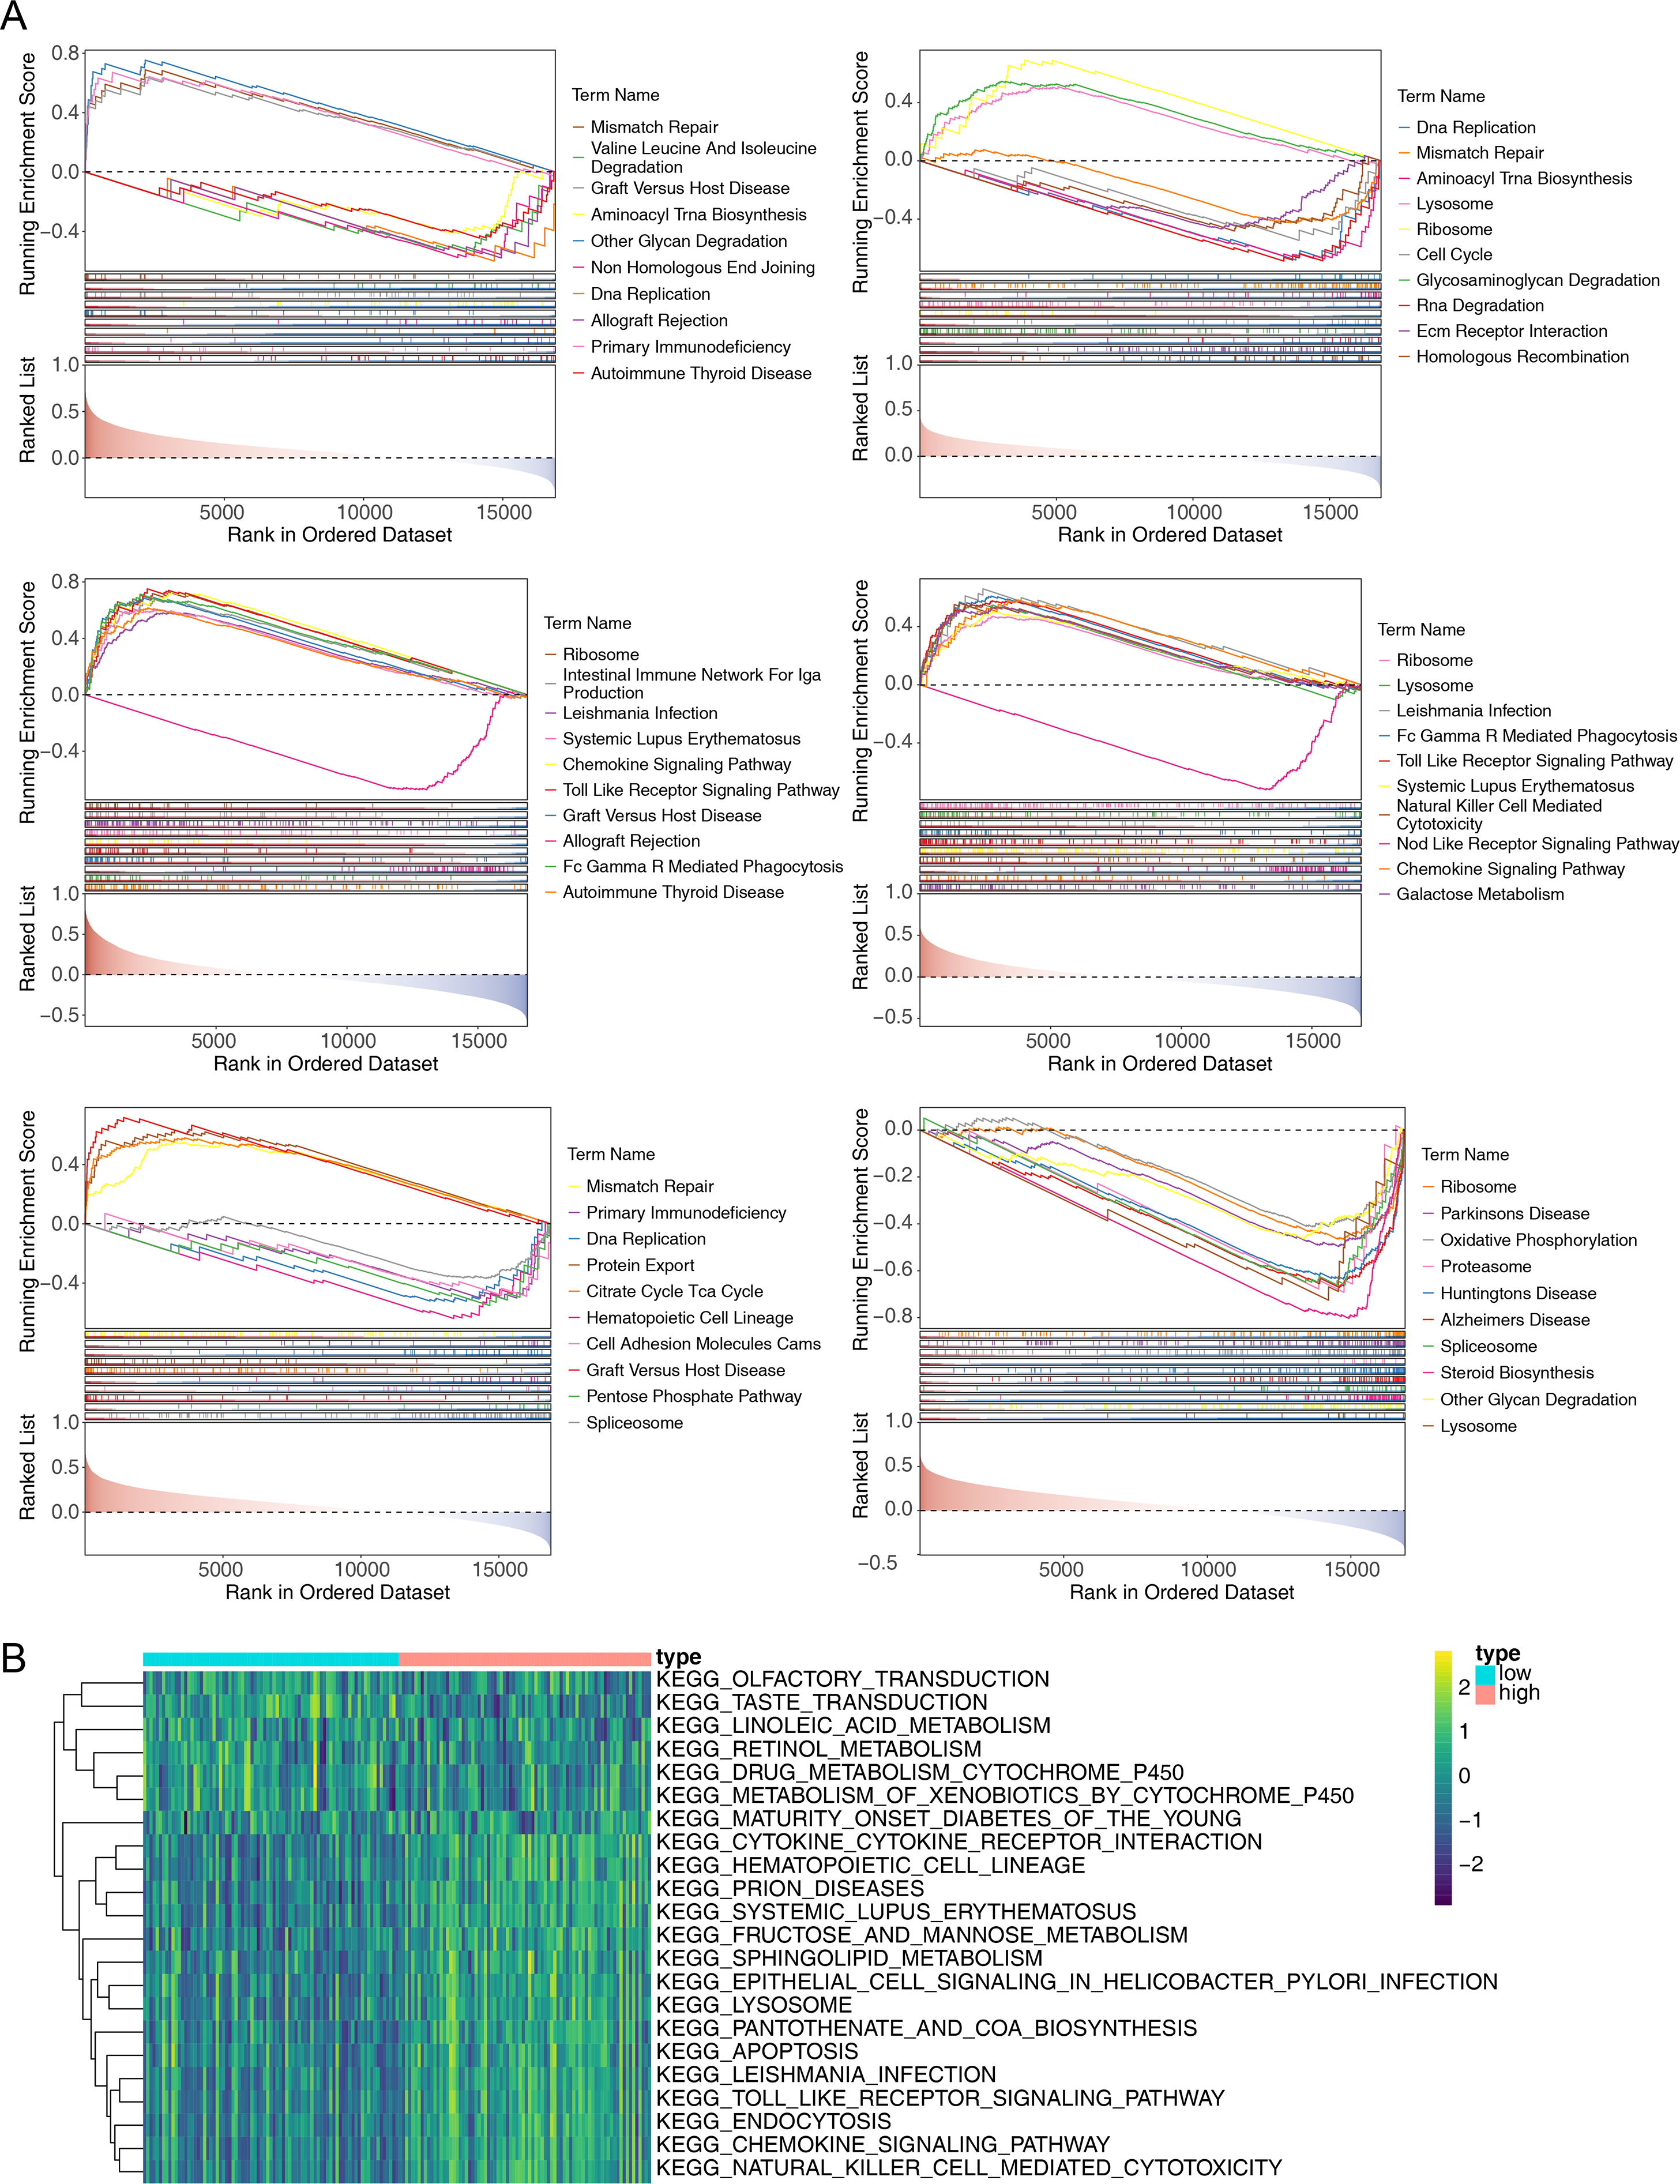
Correlation of prognostic genes with immune cells
The immune microenvironment can influence cell growth and development. Immune infiltration analysis of the TCGA-AML dataset revealed 22 types of immune cells in each sample from the two risk groups (Fig. 7A), with nine immune cells showing significant differences between the groups. The low-risk group had a significantly higher proportion of CD4 memory resting T cells and resting mast cells, while the proportion of monocytes was significantly lower (Fig. 7B). Spearman correlation analysis indicated significant correlations between differential immune cells and prognostic genes. Notably, CD4 memory resting T cells showed a negative correlation with monocytes (correlation = −0.7), and activated mast cells showed a positive correlation (correlation = 0.5) (Fig. 7C). CCR2 exhibited the strongest positive correlation with monocytes and the most negative correlation with resting mast cells (Fig. 7D). The TIDE score was lower in the high-risk group, suggesting a better response to immunotherapy compared to the low-risk group (Fig. 7E). Spearman analysis revealed a negative correlation between TIDE score and risk score (correlation = −0.18) (Fig. 7F).
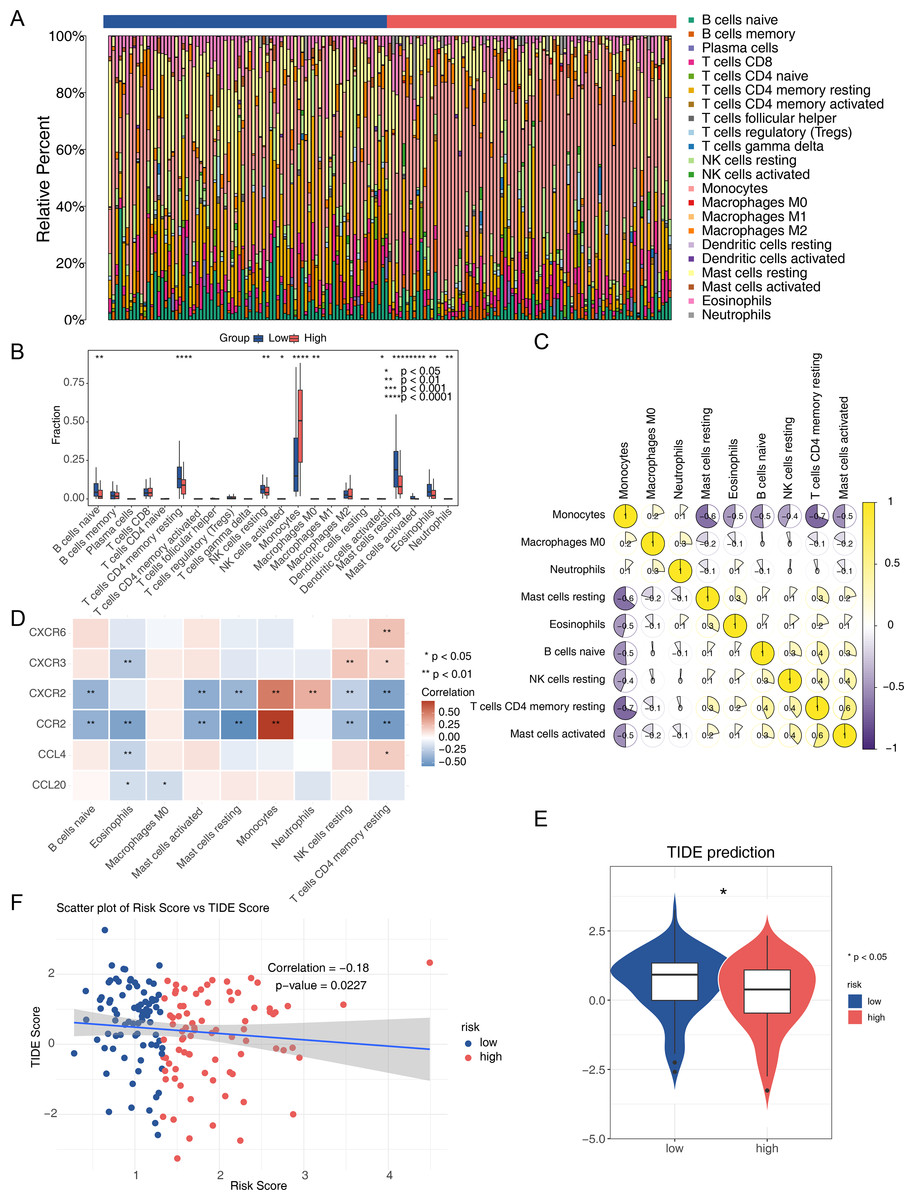
Figure 7: Analysis of the immune microenvironment in the two AML risk groups.
(A) The relative proportion of 22 tumor-infiltrating immune cells in AML samples. (B) Differences in the levels of 22 immune cells between high and low AML risk groups. ∗P < 0.05, ∗∗P < 0.01, ∗∗∗P < 0.001, ∗∗∗∗P < 0.0001. (C) Correlations among immune cells in patients with AML. (D) Correlations between the prognostic genes and differential immune cell profiles. (E) Differences in the TIDE score between high and low AML risk groups. ∗P < 0.05 (F) Correlations between the risk score and the TIDE score.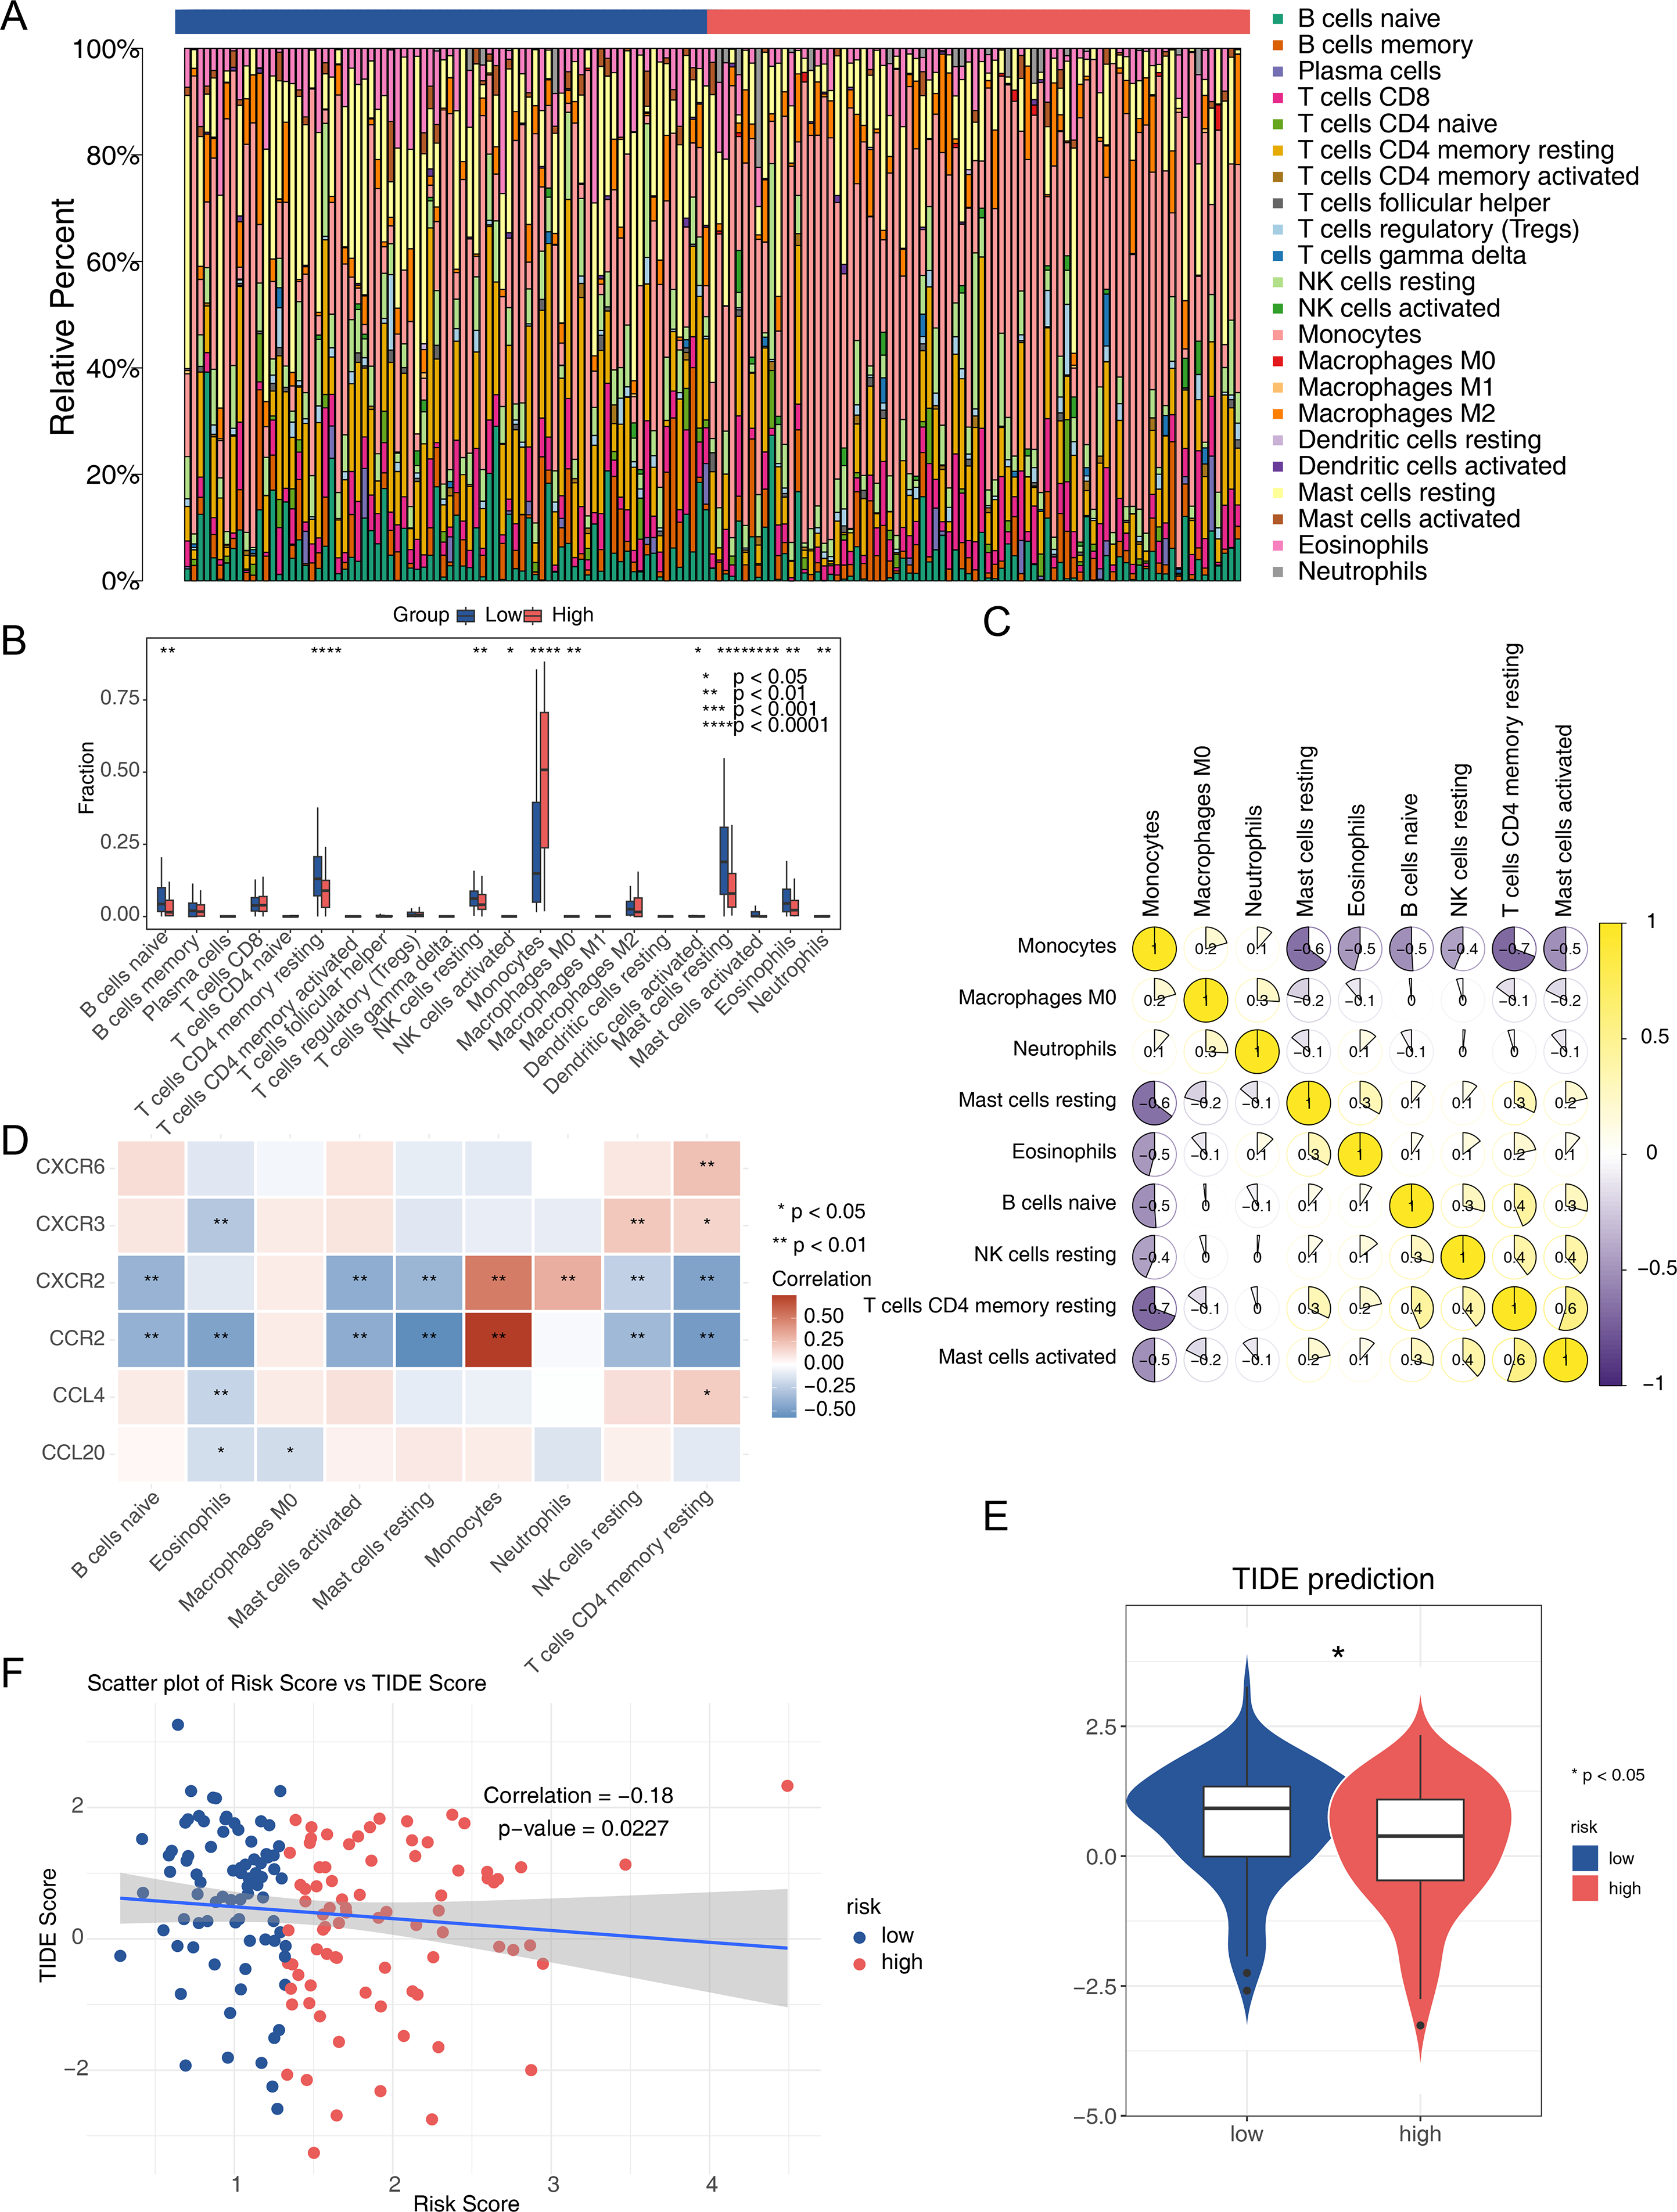
Prognostic genes that are significantly downregulated in AML
The expression of the six prognostic genes (CXCR3, CXCR2, CXCR6, CCL20, CCL4,and CCR2) was examined and compared with their expression in normal samples.In the GSE114868 dataset, the FLT3 and NPM1 genes were significantly increased in AML, the six prognostic genes were significantly downregulated in AML (Fig. 8A). While qRT-PCR results showed that except CXCR6 and CXCR2, the remaining 4 prognostic genes were significantly underexpressed in AML samples, and the expression results of these 4 genes were consistent with those in GSE114868 (Fig. 8B).
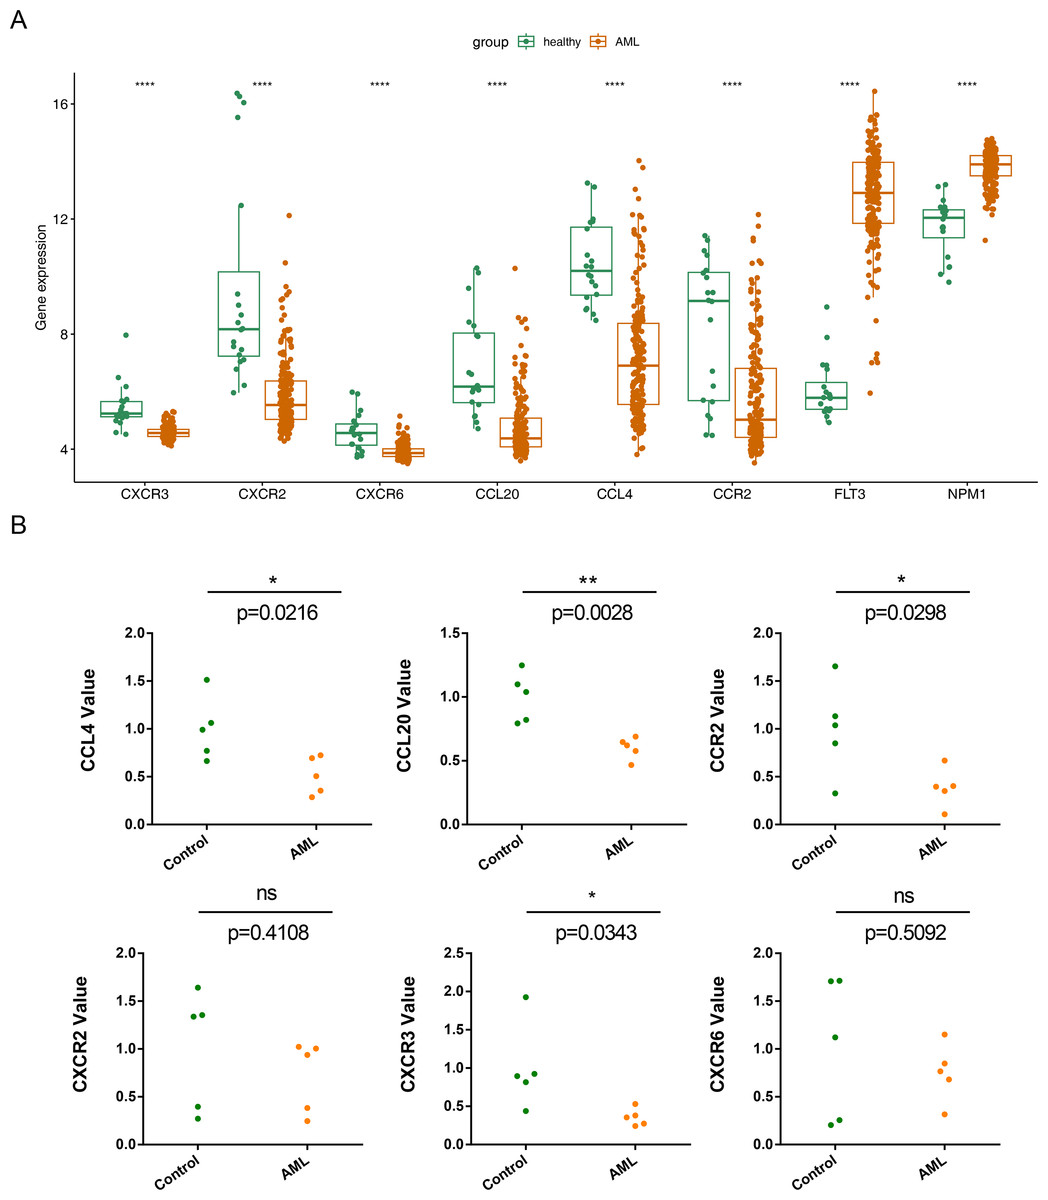
Figure 8: Relative expression of six prognostic genes in AML.
(A)Expression of six prognostic genes in the GSE114868 dataset. ∗∗∗∗P < 0.0001 Expression of the FLT3 and NPM1 genes in the GSE114868 dataset. ∗∗∗∗P < 0.0001 (a positive control) (B) Quantitative real-time PCR analysis results for the six prognostic genes. Statistical differences between the groups were calculated using Student’s t-test; ∗P < 0.05, ∗∗P < 0.01, ∗∗∗P < 0.001.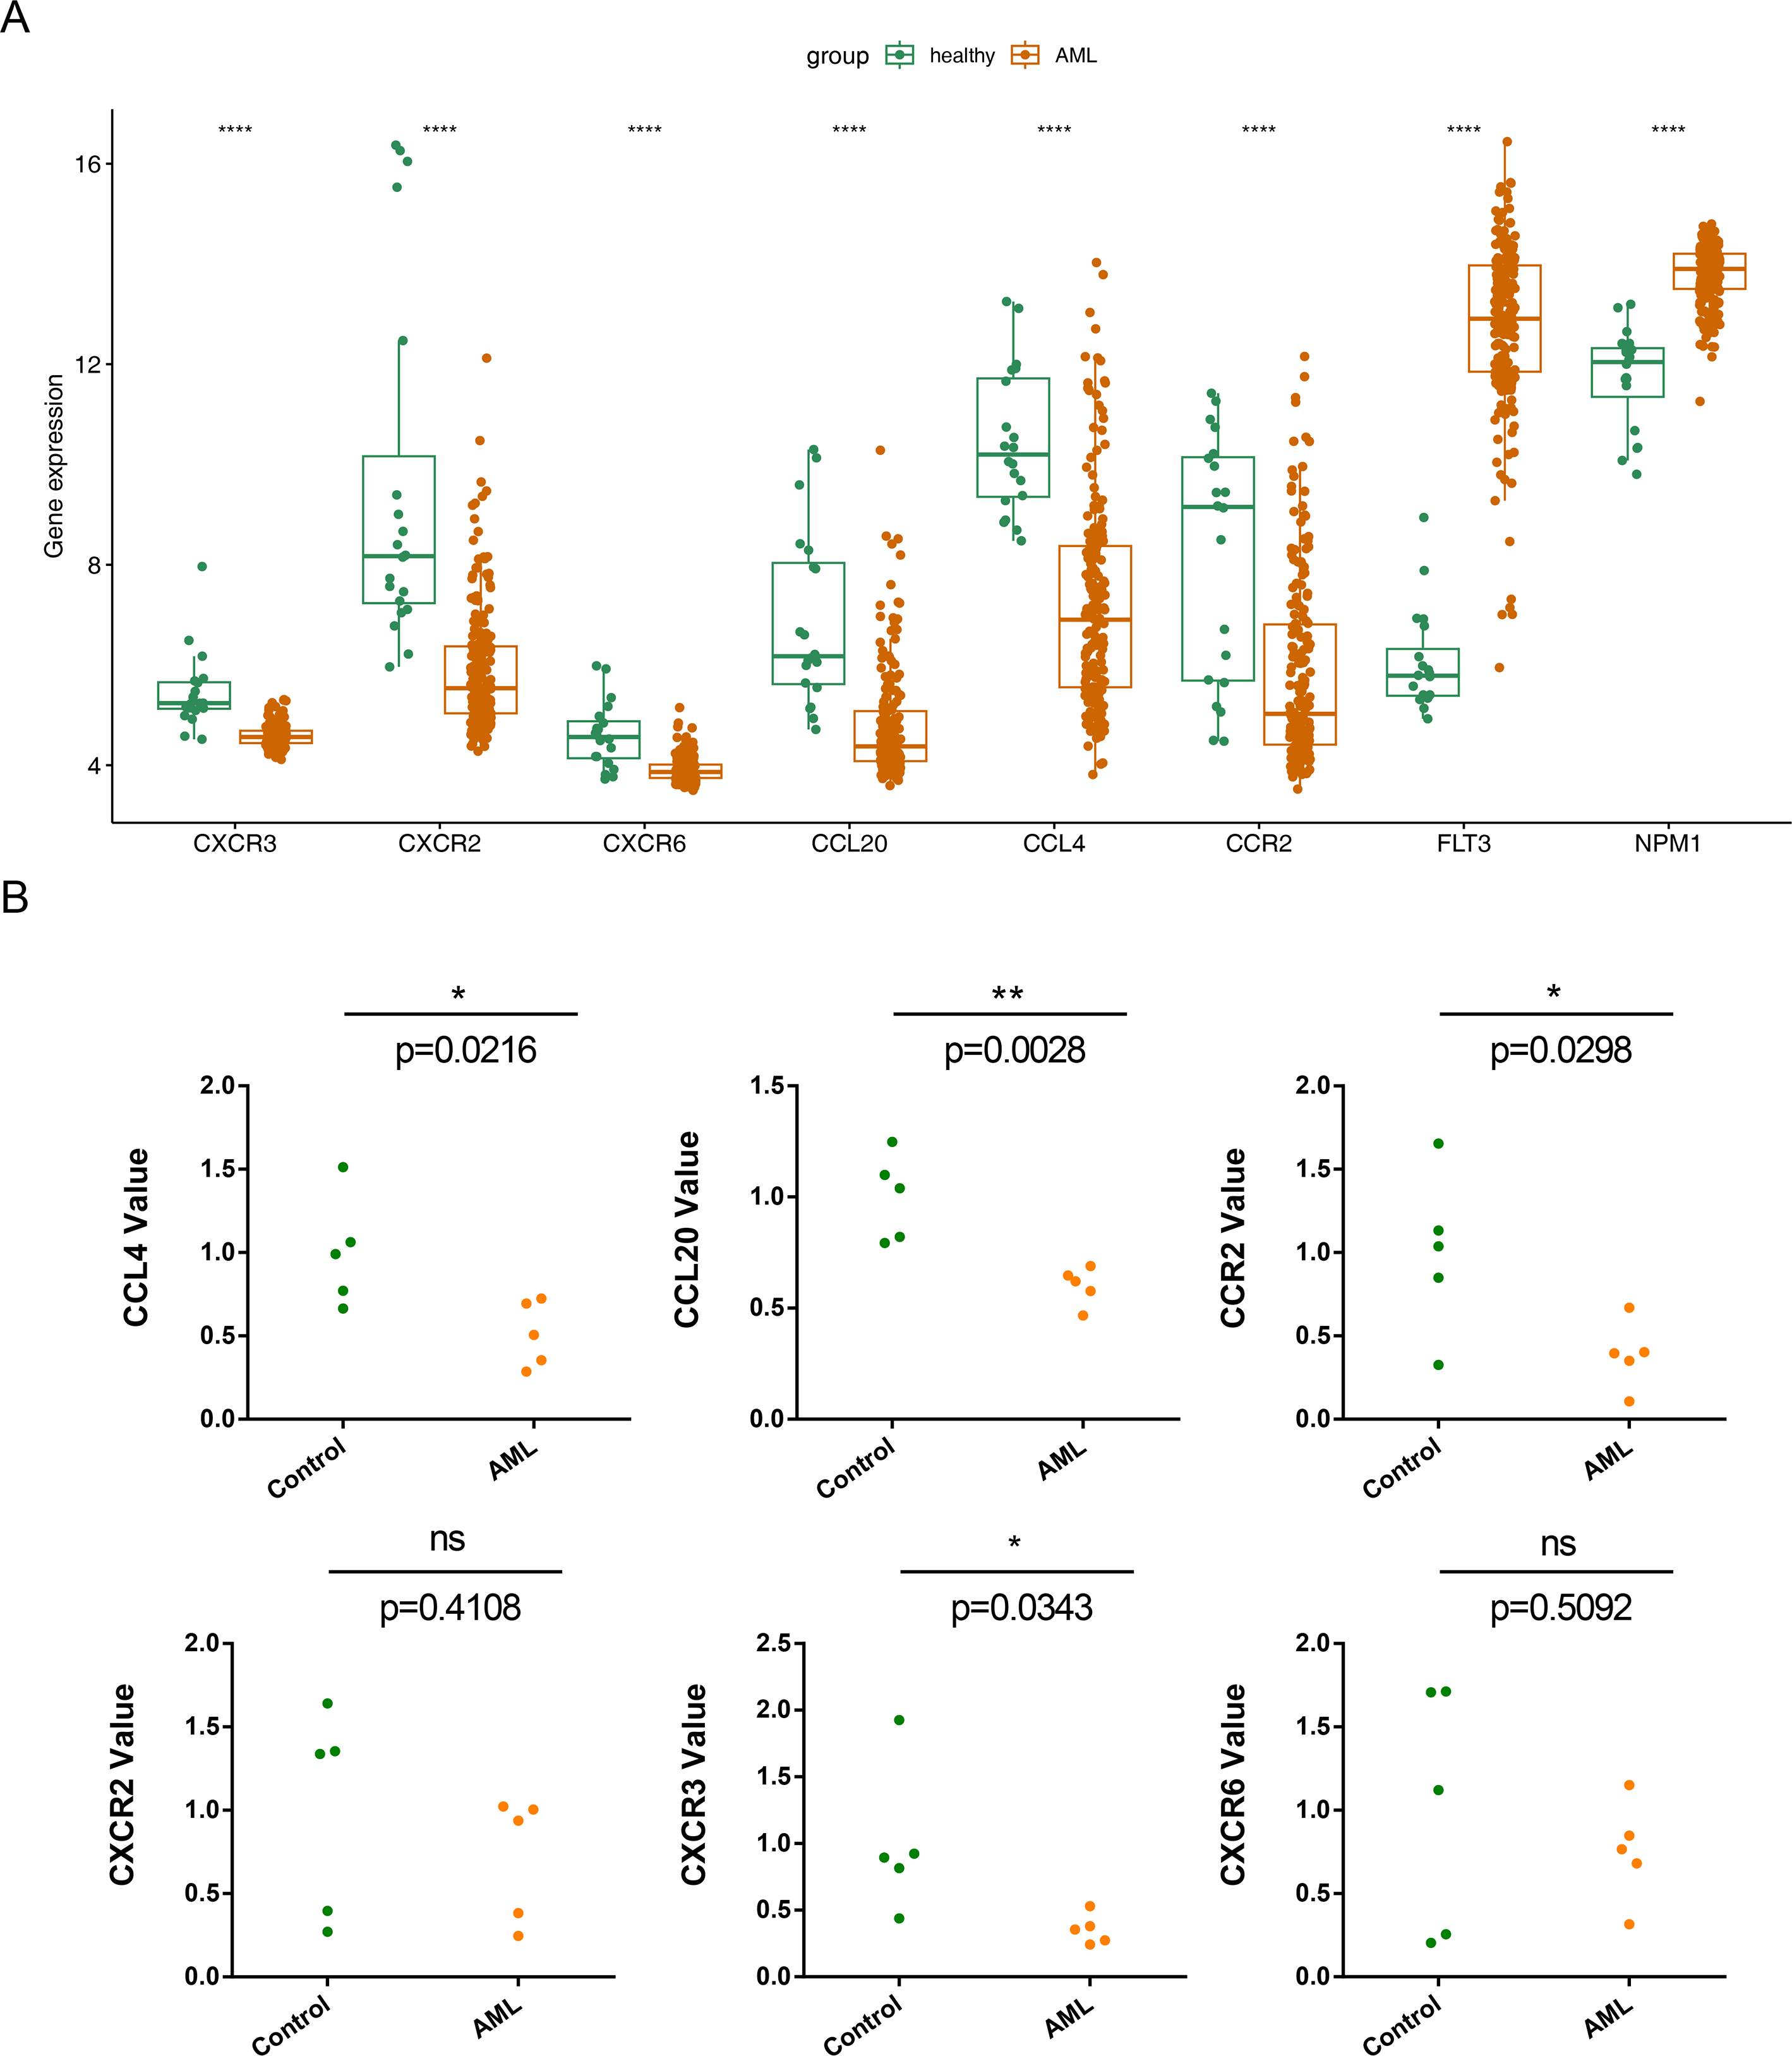
Discussion
AML is associated with high morbidity and mortality rates. The chemotactic cytokine profile plays a crucial role in intercellular communication and significantly contributes to the development, inflammatory response, and immune regulation of cancers (Ozga, Chow & Luster, 2021). Although chemotactic cytokines are implicated in the onset, development, and prognosis of AML, detailed bioinformatics studies are lacking. Therefore, it is imperative to identify chemotactic cytokines highly correlated with the survival of patients with AML and to assess their relevance to AML.
In this study, we identified six prognostic genes associated with CCRGs in AML. Analysis of the GSE114868 database revealed six CCRGs (CXCR3, CXCR2, CXCR6, CCL20, CCL4, and CCR2) that were downregulated in AML compared to normal samples. RT-qPCR validation also showed significantly decreased expression of four prognostic genes, excluding CXCR6, and CXCR2 compared to normal controls. Few studies have examined chemotactic cytokines in AML. Increased expression of CXCR2, CXCR3, and CCR2 in patients with AML has been linked to poor prognosis (Korbecki et al., 2023; Macanas-Pirard et al., 2017). The CXCL8-CXCR1/2 regulatory axis, upregulated in adult AML, is crucial for disease development and progression and is associated with poor prognosis (Liu et al., 2023). CXCR3, highly expressed in NK cells and T cells, is involved in AML development and is particularly responsible for extramedullary skin lesions (Korbecki et al., 2023; Lu et al., 2020). The CCR2/CCL2 axis plays a critical role in AML cell trafficking and proliferation (Macanas-Pirard et al., 2017). The significance of the CXCL16-CXCR6 axis in AML tumorigenesis remains unclear. CXCR6 expression in patients with AML may be associated with a better prognosis (Korbecki et al., 2023; Wang et al., 2021), consistent with our findings. High expression of CXCL16 in AML cells correlates with poor prognosis and can increase AML cell proliferation, contributing to tumor progression (Huang et al., 2019). CCL20 is highly expressed in various malignancies, including breast cancer, hepatocellular carcinoma, and pancreatic cancer. It recruits Treg and Th17 cells into the tumor microenvironment, leading to immune evasion, and recruits dendritic cells (Kleeff et al., 1999; Korbecki et al., 2020a; Rubie et al., 2010; Rubie et al., 2006; Thomas et al., 2019). Higher levels of CCL20 in high-risk patients with AML may be linked to its anti-leukemia effects and a more favorable prognosis. CCL4 recruits myeloid-derived suppressor cells in melanoma through CCR5, promoting cancer development. It also boosts VEGF-C production in cancer cells, leading to lymph vessel growth and cancer spread to lymph nodes (Blattner et al., 2018; Korbecki et al., 2020b; Luo et al., 2020; Schlecker et al., 2012). This study is the first to investigate the roles of CCL20 and CCL4 in AML. Prognostic survival analyses indicated there were significant survival differences in AML patients between the high and low expression groups of these prognostic genes. The K-M survival curve could be used to evaluate the correlation between gene expression and survival, but it cannot provide specific numerical information about gene expression amount. Therefore, more experimental studies were still needed to further explore the correlation between prognostic genes and AML survival and further explain its mechanism.
Single-gene GSEA enrichment revealed that CCL4, CCL20, and CXCR3 were enriched in mismatch repair (MMR) and DNA replication processes, while CXCR6, CXCR2, CCR2, and CCL20 may play roles in ribosomal functions. The MMR pathway suppresses tumor formation by correcting DNA replication errors that escape proofreading by DNA polymerase (Gaymes et al., 2013; Mo et al., 2023). Ribosome S6 kinases (RSK) are serine/threonine kinases that operate within the Ras/Raf/MEK/ERK signaling pathway (Youn et al., 2021). Elevated expression and phosphorylation levels of RSK have been reported in pediatric AML individuals. RSK responds to external stimuli such as growth factors, hormones, and chemokines, influencing the proliferation, survival, and mobility of AML cells (Anjum & Blenis, 2008; Romeo, Zhang & Roux, 2012; Youn et al., 2021). Additionally, DE-CCRGs may interact with each other. The PPI network constructed in this study revealed potential interactions between CXCR6 and CXCL9, as well as between CCL4L2 and CCR5. These findings suggest that chemokine network interactions, involving chemokine-ligand binding, could impact AML development and progression.
Chemokines play a crucial role in regulating the activation, recruitment, phenotype, and function of immune cells in the tumor microenvironment. Tumor-associated macrophages facilitate immune cell infiltration into tumors by interacting with chemokines and can act as immune surveillance agents to impede tumor progression, demonstrating a dual role for immune infiltrating cells (Hinshaw & Shevde, 2019; Zeng et al., 2021). CD4+/CD8+ T cells, B cells, CD8+ central memory T cells, switching memory B cells, eosinophils, fibroblasts, mast cells, NKT cells, and other immune cells are observed in patients with AML exhibiting high tumor infiltration (Zeng et al., 2021). Analysis of immune cell infiltration in AML samples from high and low-risk groups revealed significant differences in the involvement of nine immune infiltrating cells. Previous research on human AML samples indicated that CCR2 is primarily expressed in more differentiated monocytes (Cignetti et al., 2003; Korbecki et al., 2020a; Macanas-Pirard et al., 2017). NF-κB can trigger the production of CCL2 in pancreatic adenocarcinoma, promoting the recruitment of tumor CCR2+Ly6C+ monocytes and enhancing metastasis (Keklikoglou et al., 2019; Ozga, Chow & Luster, 2021). Mast cells regulate tumor progression by acting as sentinel immune cells. They release chemokines such as CXCL10, CCL3, and CCL5, which recruit CD8+ T cells and CD4+ T cells into the tumor and modulate T-cell function by secreting TNF-α (Lichterman & Reddy, 2021; Sulsenti & Jachetti, 2023). In mouse liver cancer models, activated mast cells promote the infiltration of myeloid-derived suppressor cells and their IL-17 production via the CCL2/CCR2 axis, thereby recruiting Tregs to tumor sites (Lichterman & Reddy, 2021; Sulsenti & Jachetti, 2023). The same chemokine axis can have antitumor or pro-tumor effects in the tumor microenvironment due to the complex roles of immune infiltrating cells. Tumors may decrease or suppress the function of the chemokine axis associated with an antitumor response while promoting the function of the chemokine axis that stimulates pro-tumor immune cell activation (Ozga, Chow & Luster, 2021).
A wide range of chemotherapy and targeted drugs are available for AML treatment. This study utilized the DGIdb and DSigDB databases to predict 50 drugs interacting with prognostic genes, resulting in 87 interactions. For instance, conventional chemotherapy drugs such as arsenide, etoposide, and isotretinoin may interact with chemokines like CCL20, CCR2, and CCL4. Multiple in vitro and in vivo experiments have shown that small molecules, peptides, and antibody antagonists targeting CXCR4 or CXCL12 (e.g., Plerixafor (AMD3100), BL-8040/BKT140) enhance miR-15a/16-1 expression and inhibit CXCR4. Downregulation of the Akt/Erk and BCL-2 signaling pathways can induce apoptosis of AML stem cells and inhibit AML cell growth (Peled et al., 2018). A Phase I/II study (NCT00512252) demonstrated that combining conventional chemotherapy with CXCR4 antagonists, including AMD3100 and AMD3465, enhances the clinical efficacy of conventional therapies by mediating the transport of tumor cells from the bone marrow environment (Peled et al., 2018). Several clinical trials of CXCR2 inhibitors, such as reparixin for breast cancer (phase 2) and navarixin for prostate cancer and non-small cell lung cancer (phase 2), have been conducted (Bule et al., 2021). Directly targeting chemokines or combining chemotherapy with immunotherapies could potentially enhance clinical outcomes in patients with AML. Additionally, identifying chemokines in peripheral blood may serve as predictive prognostic genes for treatment efficacy.
A prognostic risk model was constructed, identifying six prognostic genes. This model could accurately predict AML prognosis and enable precision therapy with chemokine-targeted agents, particularly in high-risk patients. However, certain limitations of this study should be acknowledged. AML is a complex and heterogeneous disease with different subtypes, and individual variations exist in disease progression. Therefore, the findings need to be validated using larger samples, more accurate diagnostic classifications, and different disease states.
Conclusion
A prognostic risk model for AML was successfully established, identifying six prognosis-related genes. Various analyses were conducted, including the examination of prognostic genes, functional similarity analysis, GSVA functional enrichment analysis for high and low AML risk groups, immune infiltration analysis, and prediction analysis of immunotherapy response and drug targeting. These six chemokines show potential as prognostic genes, offering valuable insights into the study and treatment of AML. However, this study relied on existing public datasets, where the sample size of AML and control group was not uniform. This might also bring errors to our analysis results. In addition, RT-qPCR validation was based on five pairs of AML and normal controls. Therefore, further confirmation through larger-scale experiments and clinical studies is necessary. More prospective data will be required to verify the clinical application of these identified prognostic genes.
Supplemental Information
List of human chemokines
The total list of human chemokines selected in our studies.
RT-qPCR-related primer sequences
The sequences of all primers of those six biomarkers can be found in this table.
Total map summarizing the prognostic gene signaling pathways
MIQE checklist
The checklist indicate the page/line number in the experimental report file.
Raw data
The 69 types of human chemokines ligands and receptors, selected in our studies and the RT-qPCR-related primer sequences.