
Chemical composition and egg production capacity throughout bloom development of ctenophore Mnemiopsis leidyi in the northern Adriatic Sea
- Published
- Accepted
- Received
- Academic Editor
- Antonina Dos Santos
- Subject Areas
- Ecology, Marine Biology, Zoology, Aquatic and Marine Chemistry
- Keywords
- Ctenophore, Biogeochemistry, Egg production capacity, Invasive species, Chemical composition, Marine ecology
- Copyright
- © 2024 Rečnik et al.
- Licence
- This is an open access article distributed under the terms of the Creative Commons Attribution License, which permits using, remixing, and building upon the work non-commercially, as long as it is properly attributed. For attribution, the original author(s), title, publication source (PeerJ) and either DOI or URL of the article must be cited.
- Cite this article
- 2024. Chemical composition and egg production capacity throughout bloom development of ctenophore Mnemiopsis leidyi in the northern Adriatic Sea. PeerJ 12:e17844 https://doi.org/10.7717/peerj.17844
Abstract
High abundances of gelatinous zooplankton (GZ) can significantly impact marine ecosystem by acting as both sink and source of organic matter (OM) and nutrients. The decay of GZ bloom can introduce significant amount of OM to the ocean interior, with its variability influenced by GZ life traits and environmental factors, impacting microbial communities vital to marine biogeochemical cycles. The invasive ctenophores Mnemiopsis leidyi has formed massive blooms in the northern Adriatic Sea since 2016. However, the variability in the chemical composition and egg production of blooming populations, as well as the role of environmental factors in governing this variability, remains largely unknown. Our analysis of biometry, chemical composition, and fecundity of M. leidyi sampled in the Gulf of Trieste in 2021 revealed stable carbon and nitrogen content throughout bloom development, with no significant correlation with seawater temperature, salinity, oxygen, and chlorophyll a concentration. Although the studied population exhibited homogeneity in terms of biometry and chemical composition, the number of produced eggs varied substantially, showing no clear correlation with environmental variables and being somewhat lower than previously reported for the study area and other Mediterranean areas. We observed a positive correlation between the wet weight of individuals and the percentage of hatched eggs, as well as a significant positive correlation between the percentage of hatched eggs and ambient seawater temperature. Additionally, we noted that the speed of hatching decreased with decreasing seawater temperature in autumn, corresponding to the end of M. leidyi bloom.
Introduction
The successful spread of the notorious invasive ctenophore Mnemiopsis leidyi A. Agassiz, 1865 to various ecosystems worldwide (Costello et al., 2012; Jaspers et al., 2018; Jaspers, Bezio & Hinrichsen, 2021) hinges on its life history traits, such as ecological plasticity regarding environmental conditions, self-fertilization ability, and cannibalism (Baker & Reeve, 1974; Jaspers, Møller & Kiørboe, 2015; Javidpour et al., 2020). When present in high abundances, this species can significantly impact local ecosystem by acting as nutrient sink, competing for food, and influencing interspecies predatory relationships (Oguz, Fach & Salihoglu, 2008; Shiganova et al., 2019a). However, the role of this gelatinous invasive species as source of organic matter (OM) and nutrients for affected ecosystems has received less attention (Pitt, Welsh & Condon, 2009; Dinasquet, Granhag & Riemann, 2012). The decay of ctenophore blooms can lead to a large influx of ctenophore-derived OM, disrupting the quality and quantity of the surrounding seawater OM reservoir (Fadeev et al., 2024). The dissolved fraction of gelatinous zooplankton-derived OM, rich in proteins and characterized by low C:N ratio, is rapidly degraded by opportunistic microbes, swiftly assimilated into bacterial biomass, and is thereby not lost from the system via respiration (Tinta et al., 2020). Such dynamics can have critical implications for the fate and flux of gelatinous-derived OM and for the functioning and biogeochemical state of marine ecosystems (Tinta et al., 2023; Fadeev et al., 2024). However, the composition of gelatinous-OM can vary between species and within population of the same species due to various factors such as individual organisms’ properties (e.g., biometrics, fertility, age), seasonal environmental factors, prey type and availability, and possible parasites infestation (Condon, Steinberg & Bronk, 2010). This variability can significantly influence the dynamics of surrounding systems, particularly affecting end-consumers like microbial communities, which are true drivers of marine biogeochemical cycles (Azam & Malfatti, 2007). Understanding the factors governing the chemical composition and egg production of gelatinous-OM is therefore crucial for comprehending the interaction between microbes and gelatinous-OM and accurately integrating jelly-OM into oceanic biogeochemical budgets.
Since 2016, annual blooms of M. leidyi have also been observed from summer until late autumn in the northern Adriatic (Malej et al., 2017; Pestorić et al., 2021). While some aspects of the potential impact of these bloom formations on the local ecosystem have been studied (Ciglenečki et al., 2021; Paliaga et al., 2021; Fadeev et al., 2024), there is limited data available on the chemical composition and egg production capacity of northern Adriatic M. leidyi populations (Malej et al., 2017; Fadeev et al., 2024). Our aim was to elucidate variability in biometry, chemical composition, and fecundity of the M. leidyi population throughout its annual bloom development and address our hypothesis that ambient environmental variables affect the observed potential variations. To achieve this objective, M. leidyi individuals were sampled at different locations in the Gulf of Trieste throughout their blooming season from August to October 2021, measuring wet and dry mass, carbon and nitrogen content, and conducting egg production experiments. Concurrently, a set of environmental factors was monitored, and statistical analysis was applied to infer correlations between variables.
Material and methods
Field sampling
Bi-monthly sampling of M. leidyi twice was conducted from August to October 2021 (Table 1) to encompass the period when M. leidyi specimens are most abundant in the northernmost part of the Adriatic Sea, namely the Gulf of Trieste (Fig. 1). To address the spatial heterogeneity of populations, sampling was conducted at various locations within our study area (Fig. 1). Ctenophores were collected directly from a boat or from the pier using a plastic bucket previously rinsed with ambient seawater. Subsequently, the collected ctenophores were transferred directly to the laboratory, maintaining in situ temperature and light conditions. Between 15–20 individuals were collected during each sampling survey (Table S1). We acknowledge that a larger sampling effort would provide a more robust statistical analysis; however, we had to adjust the number of samples due to operational constraints. For each sampling, we obtained data on seawater temperature, salinity, dissolved oxygen and chlorophyll a concentrations from a depth of 3 m at our reference long-term sampling station—oceanographic buoy Vida (https://www.nib.si/mbp/en/oceanographic-data-and-measurements/buoy-2) (Fig. 1, Table S1).
| Date | T(°C) | Sal | chla(ug mL−1) | O2(mg L−1) | WW (g) | DW (g) | % DW | % N | mg N ind−1 | % C | mg C ind−1 | C:N | eggs_total | % hatched eggs in 24h |
|---|---|---|---|---|---|---|---|---|---|---|---|---|---|---|
| 16.08.2021 | 23 | 35 | 0.46 | 6.4 | 21.86 | 0.81 | 3.7 | 0.36 | 2.92 | 1.39 | 11.26 | 4.5 | 177 | 54 |
| 21.57 | 0.81 | 3.75 | 0.34 | 2.75 | 1.35 | 10.94 | 4.6 | 9 | 100 | |||||
| 24.00 | 0.74 | 3.08 | 0.35 | 2.59 | 1.16 | 8.58 | 3.8 | 133 | 70 | |||||
| 19.76 | 1.53 | 4.6 | 0.42 | 6.43 | 1.58 | 24.17 | 4.4 | 0 | n.a. | |||||
| 21.16 | 1.02 | 3.76 | 0.41 | 4.18 | 1.50 | 15.30 | 4.3 | 5 | 80 | |||||
| avg ±sd | 21.7 ± 1.53 | 1.0 ± 0.32 | 3.8 ± 0.54 | 0.4 ± 0.04 | 3.7 ± 1.6 | 1.4 ± 0.16 | 14.1 ± 6.1 | 4.3 ± 0.31 | 64.8 ± 83.9 | 75.9 ± 19.4 | ||||
| 24.08.2021 | 25 | 37 | 0.56 | 6.47 | 27.75 | 1.25 | 4.50 | 0.41 | 5.13 | 1.57 | 19.63 | 4.5 | 197 | 80 |
| 36.89 | 1.53 | 4.15 | 0.44 | 6.73 | 1.69 | 25.86 | 4.5 | 32 | 94 | |||||
| 24.16 | 1.03 | 4.17 | 0.38 | 3.91 | 1.43 | 14.73 | 4.5 | 0 | n.a. | |||||
| 45.26 | 1.88 | 4.15 | 0.53 | 9.96 | 2.07 | 38.92 | 4.6 | 295 | 99 | |||||
| 31.44 | 1.11 | 3.53 | 0.41 | 4.55 | 1.43 | 15.87 | 4.1 | 0 | n.a. | |||||
| avg ±sd | 33.1 ± 8.27 | 1.4 ± 0.35 | 4.1 ± 0.35 | 0.4 ± 0.06 | 6.1 ± 2.4 | 1.6 ± 0.26 | 23.0 ± 9.9 | 4.4 ± 0.19 | 104.8 ± 134.1 | 90.9 ± 9.6 | ||||
| 06.09.2021 | 22.5 | 37 | 0.69 | 6.8 | 16.85 | 0.71 | 4.21 | 0.39 | 2.77 | 1.52 | 10.79 | 4.6 | 0 | n.a. |
| 21.84 | 1.04 | 4.76 | 0.28 | 2.91 | 1.15 | 11.96 | 4.7 | 3 | 100 | |||||
| 32.17 | 1.24 | 3.85 | 0.46 | 5.70 | 1.77 | 21.95 | 4.5 | 443 | 94 | |||||
| 29.56 | 1.21 | 4.09 | 0.43 | 5.20 | 1.53 | 18.51 | 4.2 | 130 | 22 | |||||
| 20.09 | 0.84 | 4.18 | 0.36 | 3.02 | 1.32 | 11.09 | 4.3 | 72 | 94 | |||||
| avg ±sd | 24.1 ± 6.49 | 1.0 ± 0.23 | 4.2 ± 0.33 | 0.4 ± 0.07 | 3.9 ± 1.4 | 1.5 ± 0.23 | 14.9 ± 5.1 | 4.5 ± 0.21 | 129.6 ± 183.3 | 77.4 ± 37.4 | ||||
| 21.09.2021 | 22 | 36 | 1.01 | 6.9 | 16.00 | 0.69 | 4.31 | 0.39 | 2.69 | 1.54 | 10.63 | 4.6 | 1 | 0 |
| 19.97 | 0.85 | 4.26 | 0.39 | 3.32 | 1.55 | 13.18 | 4.7 | 0 | n.a. | |||||
| 12.20 | 0.52 | 4.26 | 0.28 | 1.46 | 1.03 | 5.36 | 4.3 | 1 | 0 | |||||
| 19.72 | 0.84 | 4.26 | 0.41 | 3.44 | 1.61 | 13.52 | 4.6 | 0 | n.a. | |||||
| 14.38 | 0.62 | 4.31 | 0.46 | 2.85 | 1.7 | 10.54 | 4.4 | 0 | n.a. | |||||
| avg ±sd | 16.5 ± 3.38 | 0.7 ± 0.14 | 4.3 ± 0.03 | 0.4 ± 0.07 | 2.8 ± 0.8 | 1.5 ± 0.26 | 10.6 ± 3.3 | 4.5 ± 0.16 | 0.4 ± 0.5 | 0.0 ± 0.0 | ||||
| 04.10.2021 | 21 | 36 | 1.19 | 7 | 32.28 | 1.28 | 3.96 | 0.41 | 5.25 | 1.51 | 19.33 | 4.3 | 0 | n.a |
| 38.66 | 1.54 | 3.98 | 0.39 | 6.01 | 1.48 | 22.79 | 4.4 | 0 | n.a | |||||
| 31.66 | 1.3 | 4.11 | 0.38 | 4.94 | 1.41 | 18.33 | 4.3 | 149 | 89.26 | |||||
| 25.01 | 0.99 | 3.96 | 0.5 | 4.95 | 1.34 | 13.27 | 4.3 | 0 | n.a | |||||
| 23.4 | 0.93 | 3.97 | 0.41 | 3.81 | 1.5 | 13.95 | 4.3 | 0 | n.a | |||||
| avg ±sd | 30.2 ± 6.15 | 1.2 ± 0.25 | 4.0 ± 0.06 | 0.4 ± 0.05 | 4.9 ± 0.8 | 1.4 ± 0.07 | 17.5 ± 3.9 | 4.3 ± 0.04 | 29.8 ± 66.6 | 89.3 | ||||
| 18.10.2021 | 17 | 38 | 0.81 | 6.9 | 23.93 | 1.03 | 4.3 | 0.41 | 4.22 | 1.51 | 15.55 | 4.3 | 0 | 0 |
| 11.92 | 0.52 | 4.36 | 0.71 | 3.69 | 2.73 | 14.20 | 4.5 | 0 | 0 | |||||
| 21.81 | 0.96 | 4.4 | 0.44 | 4.22 | 1.67 | 16.03 | 4.4 | 638 | 12.7 | |||||
| 18.09 | 0.79 | 4.37 | 0.62 | 4.90 | 2.31 | 18.25 | 4.4 | 187 | 13.9 | |||||
| 19.69 | 0.85 | 4.37 | 0.46 | 3.91 | 1.81 | 15.39 | 4.5 | 7 | 42.86 | |||||
| avg ±sd | 19.1 ± 4.57 | 0.8 ± 0.20 | 4.4 ± 0.04 | 0.5 ± 0.13 | 4.2 ± 0.5 | 2.0 ± 0.50 | 15.9 ± 1.5 | 4.4 ± 0.08 | 166.4 ± 275.5 | 23.2 ± 17.1 |
Notes:
Note that average percentage of hatched eggs is calculated by considering only those individuals that produced eggs.
- T
-
temperature (°C)
- TLB
-
Chl a–chlorophyll a concentration
- WW
-
wet weight
- DW
-
dry weight
- mg N ind−1
-
mg of nitrogen per individual specimen
- mg C ind−1
-
mg of carbon per individual specimen
- C:N
-
carbon to nitrogen molar ratio
Biometry and elemental composition analysis
First, the total body length (TBL) of each collected individual (i.e., oral-aboral length including lobes) was measured and the wet mass of each ctenophore was determined using the calibrated scale Sartorius TE1502S. Subsequently, we placed each specimen into separate clean zip lock bag and stored them at −20 °C, for minimum of 24 h until further processing. For elemental composition analysis, each specimen was freeze-dried at −45 °C for 3 days (as previously Tinta et al., 2020). The dry mass of each individual was determined using the calibrated scale Sartorius CP225D (d = 0.01 mg (80 g), d = 0.1 mg (220 g)). The dry material of each specimen was then homogenized with a pre-sterilized pestle and agate mortar and stored separately in sterile 15 mL grainer tubes at −20 °C until further analysed. From each sample we weighed approximately 15–20 mg of dry homogenized matter into small capsules using a calibrated Micro scale (Mettler Toledo, Columbus, OH, USA). Elemental composition of carbon (C) and nitrogen (N) was determined after combustion at 1150 °C (Vario Micro Cube elemental analyser; Elementar, Long Island, NY, USA) with 3% accuracy. To minimize the risk of contamination and material degradation, care was taken to maintain sterile conditions throughout the process. This includes using combusted glassware, working on the ice at all intermediate steps and minimizing the number of freezing/thawing cycles to a bare minimum (as recommended (Kogovšek et al., 2014).
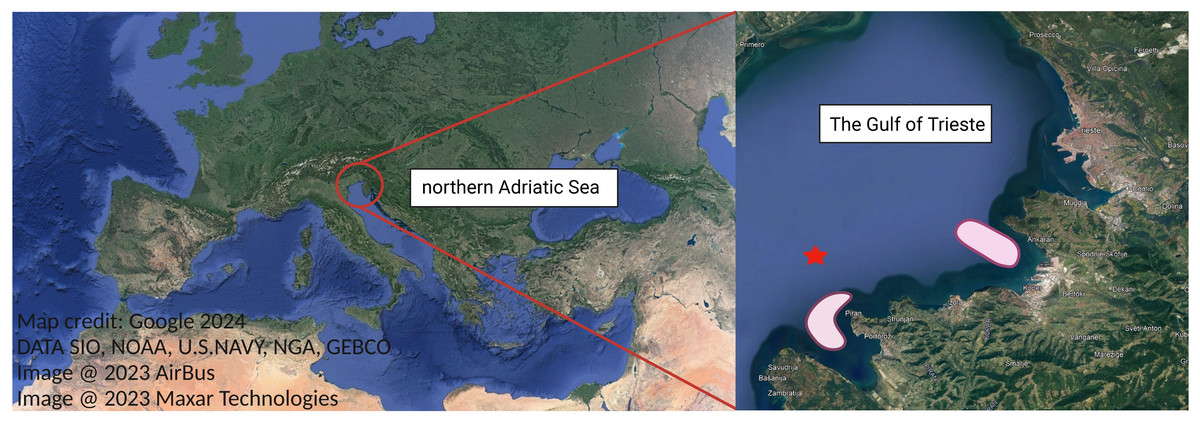
Figure 1: Study area, the Gulf of Trieste, located in the northernmost basin of the Adriatic Sea.
Ctenophore sampling areas are highlighted in light red. Oceanographic buoy Vida is marked with red star. Map credit: Google.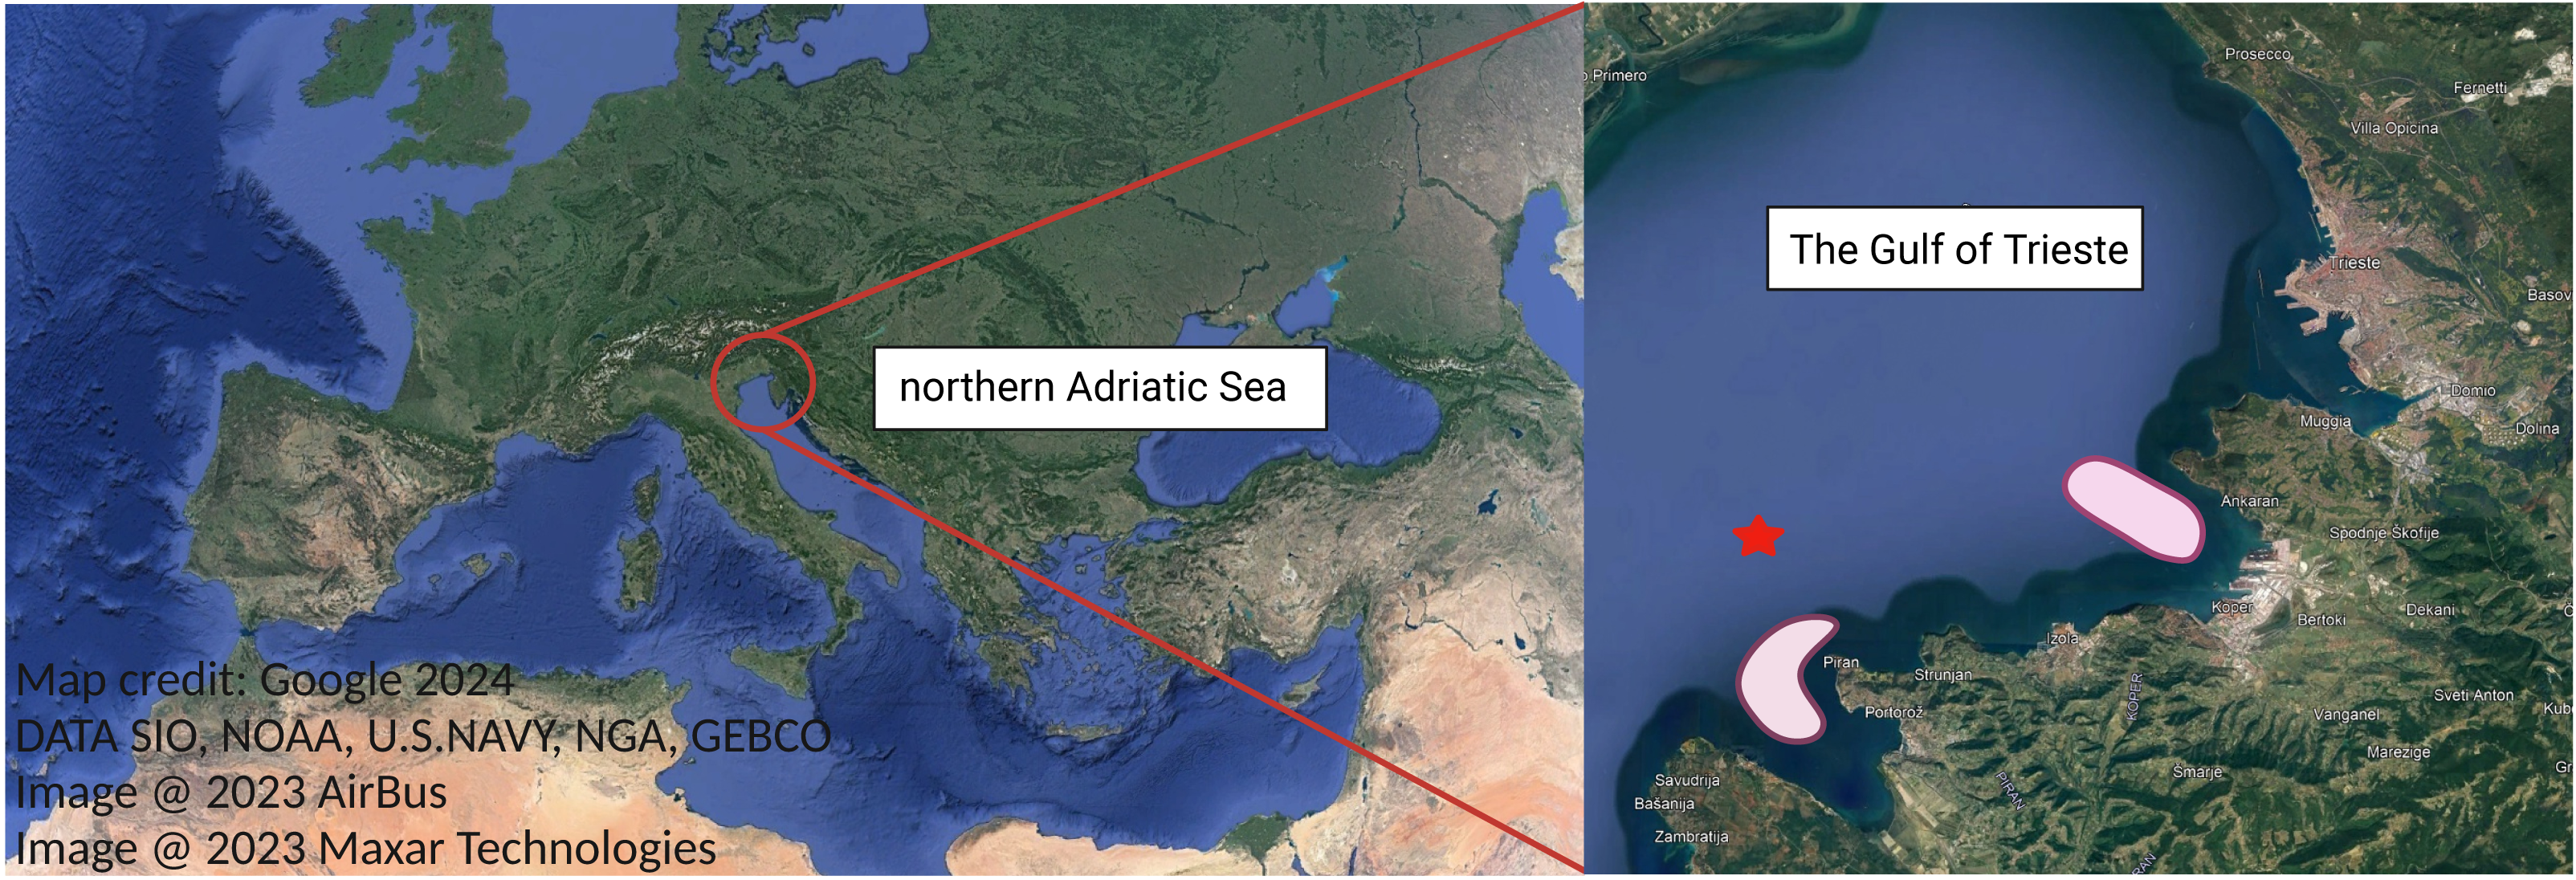
Reproduction experiment
For each sampling, a batch of five individuals, similar in size (averaging 6.9 ± 1.1 cm) and wet weight (averaging 24.1 ± 7.8 g), was selected to assess the reproduction capacity of the sampled ctenophores (Table 1, Table S2). Each of the five selected specimens was placed individually into a 1 L glass Erlenmeyer flask filled with 800 mL of pre-filtered seawater (using GF/F Whatman filters) and covered with parafilm. Afterwards an incubation period of 20 h at the in situ seawater temperature in darkness, seawater was examined for produced eggs and/or other developmental stage using an Olympus stereo microscope SZH. Initially, the volume of analysed seawater was reduced using mesh filter with pore size of 200 µm and then examined using a small container with grid-patterned bottom. All the eggs and other developmental phase in each sample were counted after 24 h and 48 h of the experiment. To determine the percentage of hatched eggs, we divided the number of hatched eggs after 24 h by the total number of eggs produced by each individual within that time frame. Once the experiment concluded, the ctenophores were sacrificed for further analysis of dry mass and elemental composition, as described above.
Statistics
All statistical analysis and visualizations were conducted using specialized packages in R (http://www.r-project.org/). The Pearson correlation coefficient and the Holm-Bonferroni p-value adjustment method was determined using R correlation package. Visualization we achieved using the ggplot2 package in R, and the figures we combined using Bio Render.
Results
Environmental parameters
The seawater temperature remained relatively stable around 22 °C throughout our sampling period, peaking at 25 °C in August and reaching a low of 17 °C by the end of October in our study (Fig. 2A). Salinity levels ranged between 36-37, dropping to a minimum of 35 in August and rising to a maximum of 38 in October (Fig. 2A). Chlorophyll concentration showed an increasing trend from 0.39 µg mL−1 in August to 1.19 µg mL−1 in the first half of October, with a slight decrease to 1 µg mL−1 observed in the second half of October (Fig. 2B). Oxygen concentration in seawater was lowest in August (4.48 mg mL−1) and highest in October (5.06 mg mL−1) (Fig. 2B).
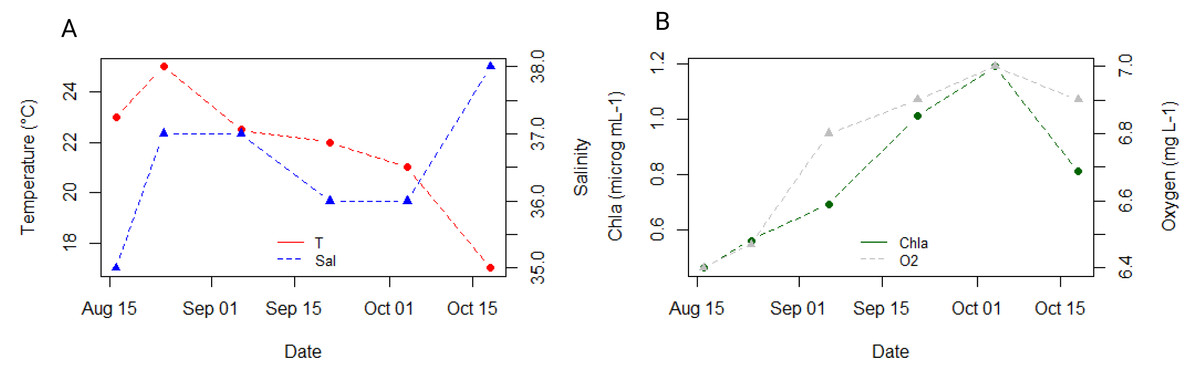
Figure 2: Dynamics of environmental parameters at 3 m depth at the reference station oceanographic buoy Vida, located in the middle of the Gulf of Trieste, throughout our sampling campaign.
(A) Ambient seawater temperature (°C, in red) and salinity (in blue); (B) Chlorophyll a (µg mL−1, in green) and oxygen (mg L−1, in grey) concentration.
Biometric parameters and elemental composition of ctenophore populations
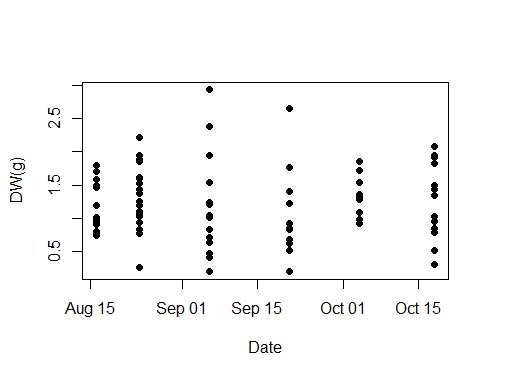
A total of 89 individuals was collected between August and October 2021. The average total body length (i.e., oral-aboral length including lobes) and width of individuals were 6.6 ± 1.1 cm and 4.2 ± 0.6 cm, respectively (Table S2). The average wet weight (WW) was 30.8 ± 13.6 g (Fig. 3A), while the average dry weight (DW) was 1.3 ± 0.6 g (Fig. S1), representing approximately 4.1 ± 0.2% of wet weight (Fig. 3B). Both minimum and maximum wet and dry weights (i.e., min WW = 4.96 g and max WW = 70.2 g; min DW = 0.2 g and max DW = 2.93 g) were observed within the population collected in the first half of September, which exhibited the greatest size heterogeneity overall (Table S1). To test our hypothesis that environmental variables affect the biometric properties of ctenophore populations, we calculated the Pearson correlation coefficient and found a significant correlation between salinity and the percentage of dry weight (r = 0.40, p < 0.001**, Holm-Bonferroni adjustment), while no other environmental variable showed significant correlations (Fig. 3C, Table S3).
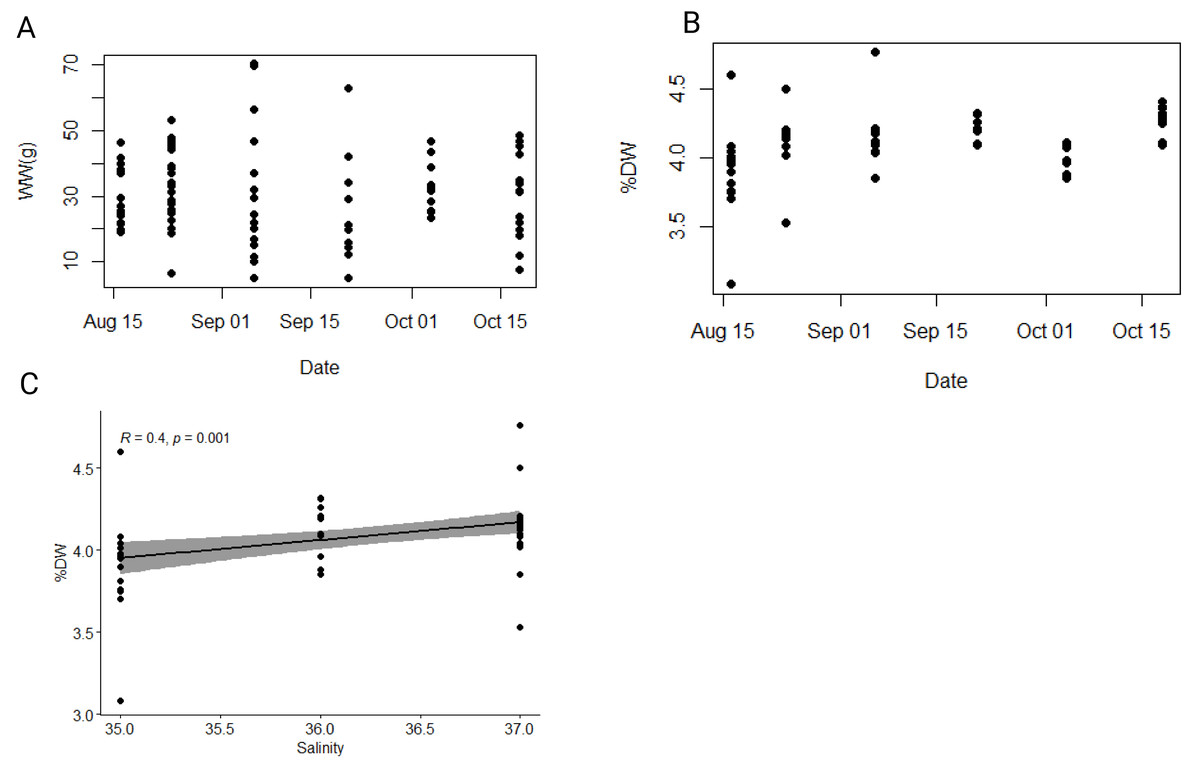
Figure 3: Dynamics of wet and dry weight of studied ctenophore population.
Dynamics of (A) wet weight (WW in g), (B) percentage of dry weight (% DW) and (C) relationship between percentage of dry weight (% DW) and salinity in the ctenophore population collected between August and October 2021 in the Gulf of Trieste, northern Adriatic Sea.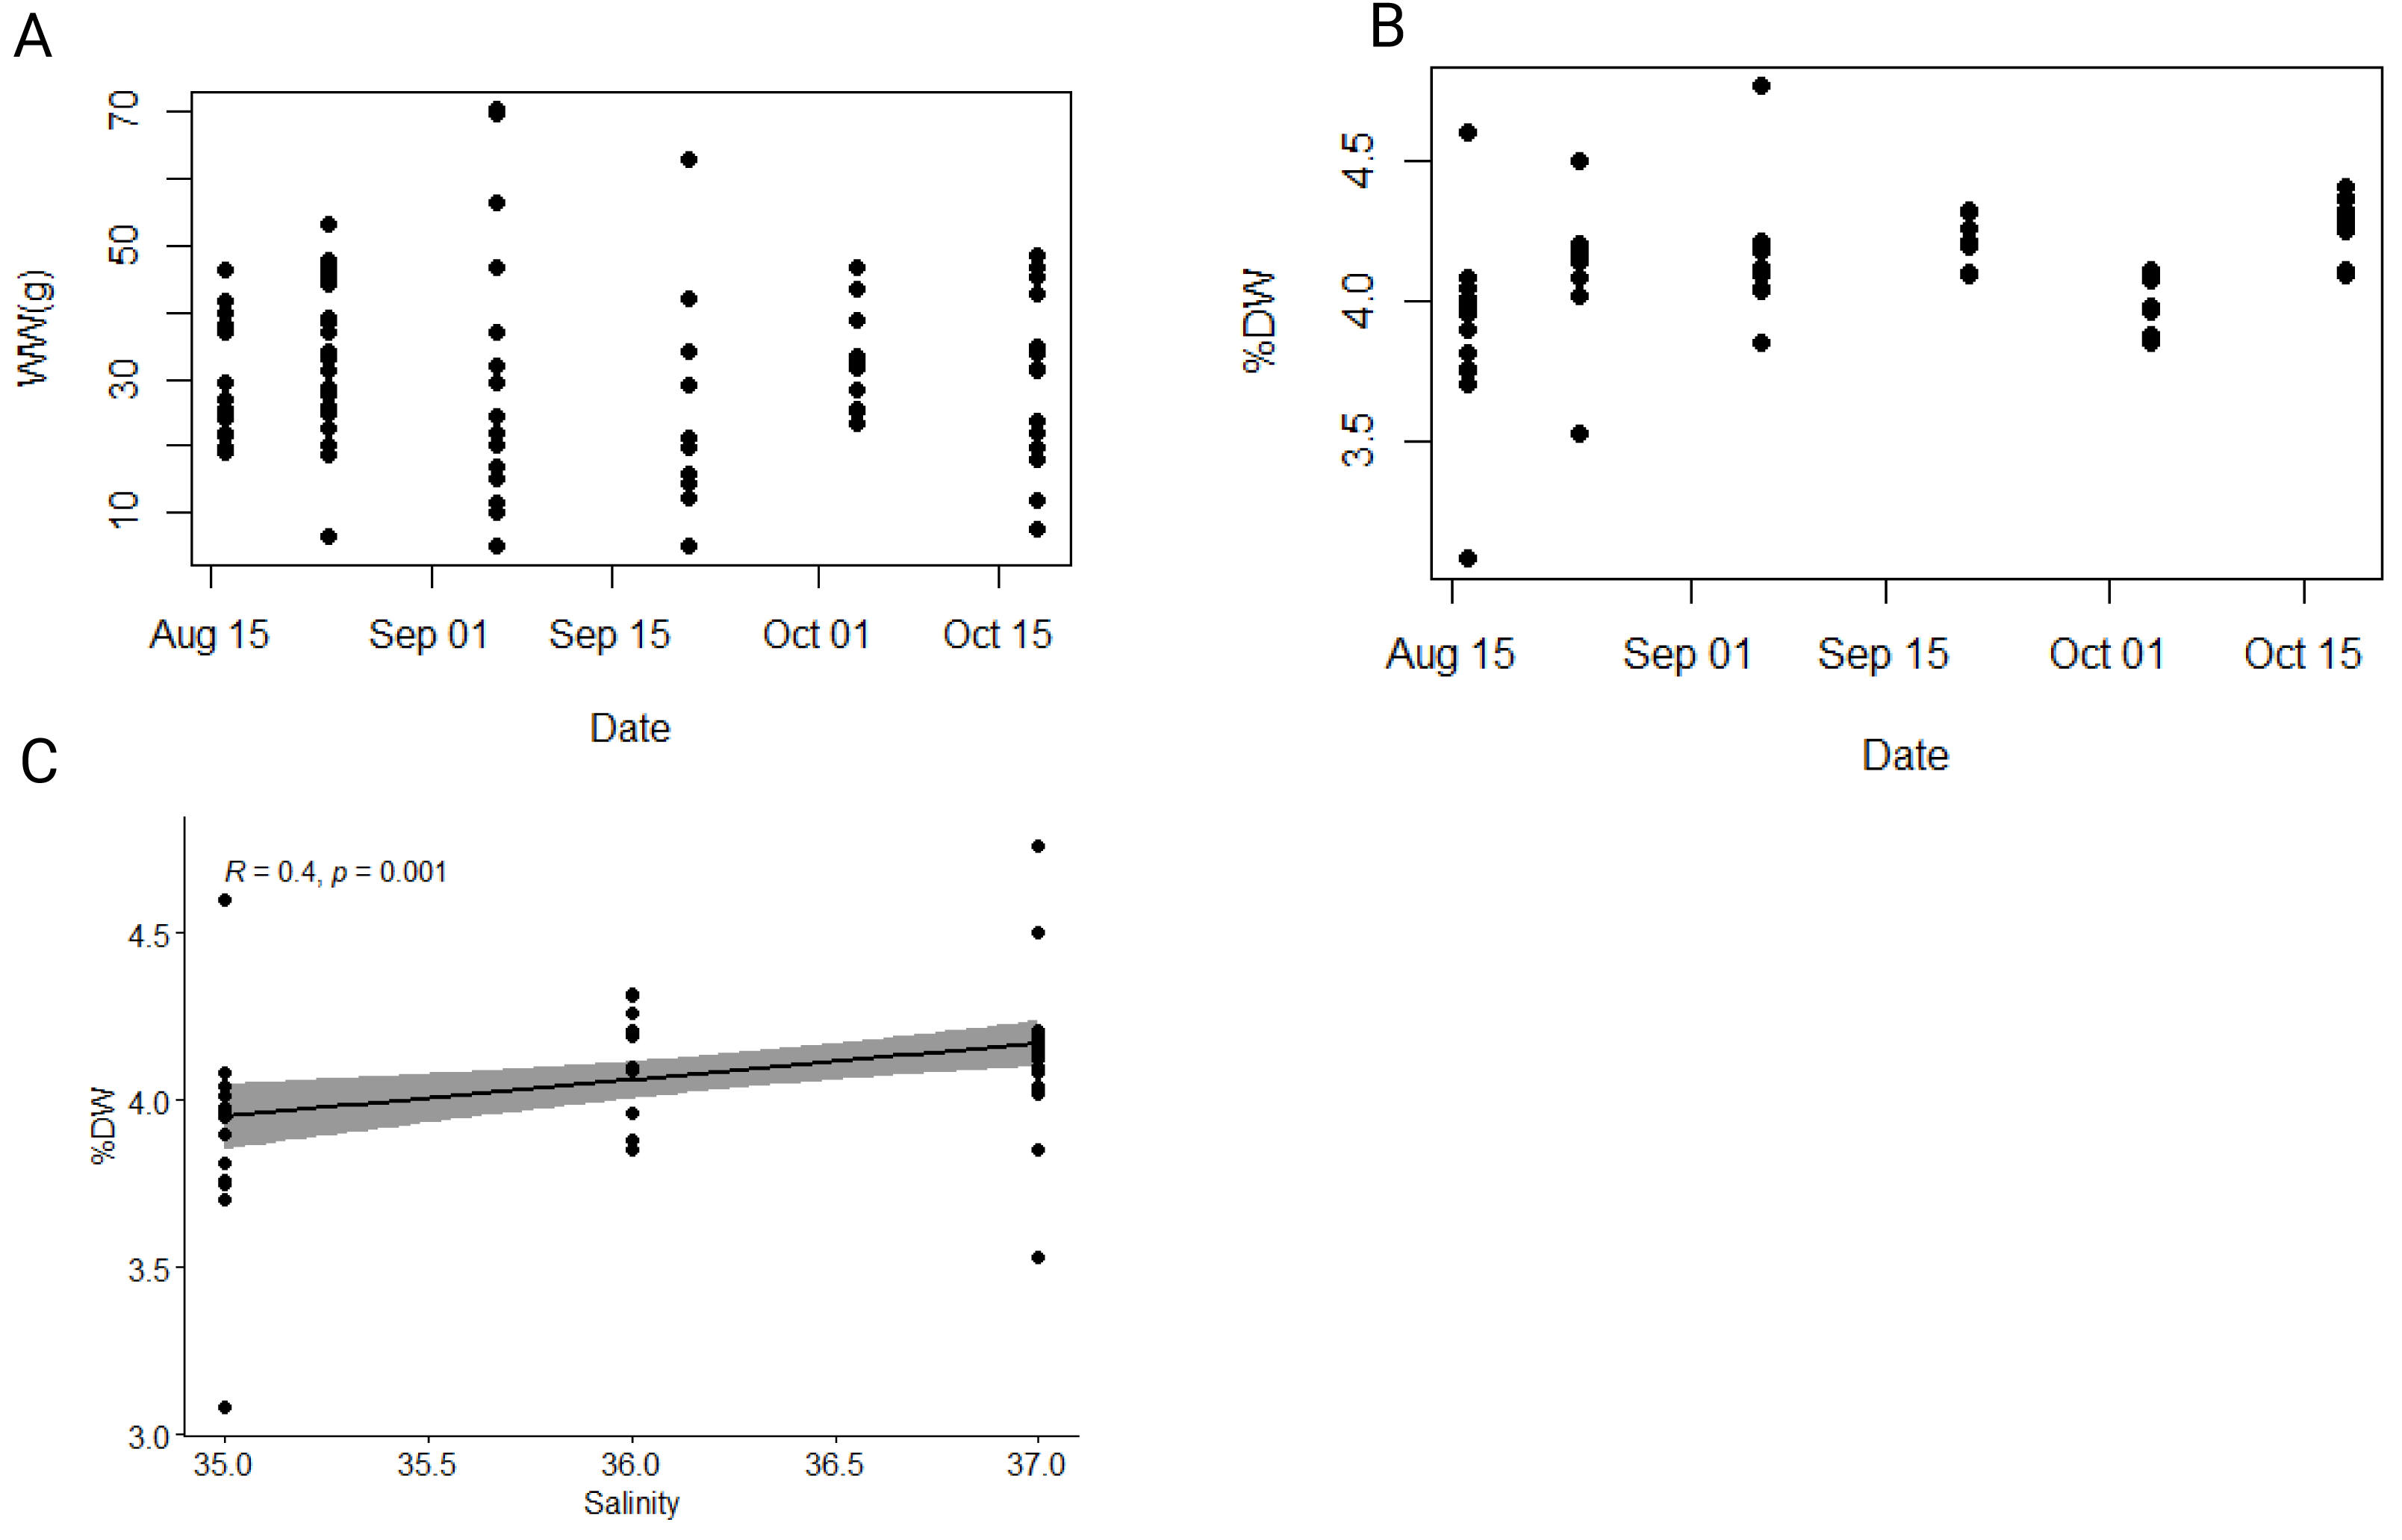
The average carbon and nitrogen percentage in the dry mass of all individuals of the studied ctenophore population were 1.59 ± 0.29% and 0.42 ± 0.08%, respectively (Table S1). The minimum carbon and nitrogen percentage in the dry mass were recorded for the population collected in the second half of September, measuring at 1.03% and 0.28%, respectively (Table S1), while the maximum percentages were observed for the population in the second half of October, measuring at 2.73% and 0.71%, respectively (Table S1). However, neither carbon nor nitrogen content exhibited a significant trend throughout the study period or a significant correlation with environmental variables in our dataset (Fig. 4A, Table S3). The carbon-to-nitrogen (C:N) molar ratio remained relatively constant throughout the study period, averaging at 4.46 ± 0.19:1, with the minimum ratio measured in the first half of August (3.81:1) and the maximum in the first half of September (4.95:1) (Table S1, Fig. 4). No significant correlation was found between C:N ratio and environmental variables in our dataset (Table S3).
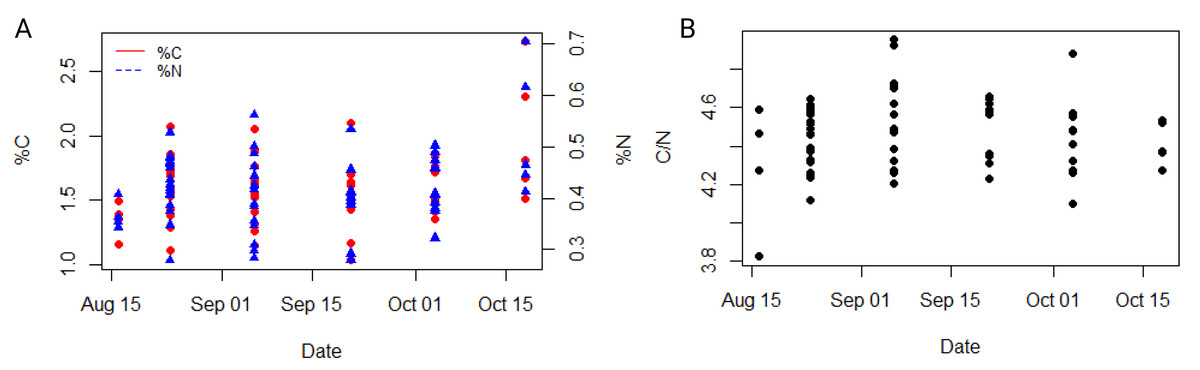
Figure 4: Dynamic of carbon and nitrogen content of studied ctenophore population.
The percentage of carbon and nitrogen (A) and the carbon to nitrogen molar ratio (B) in the ctenophore population collected between August and October 2021 in the Gulf of Trieste, northern Adriatic Sea.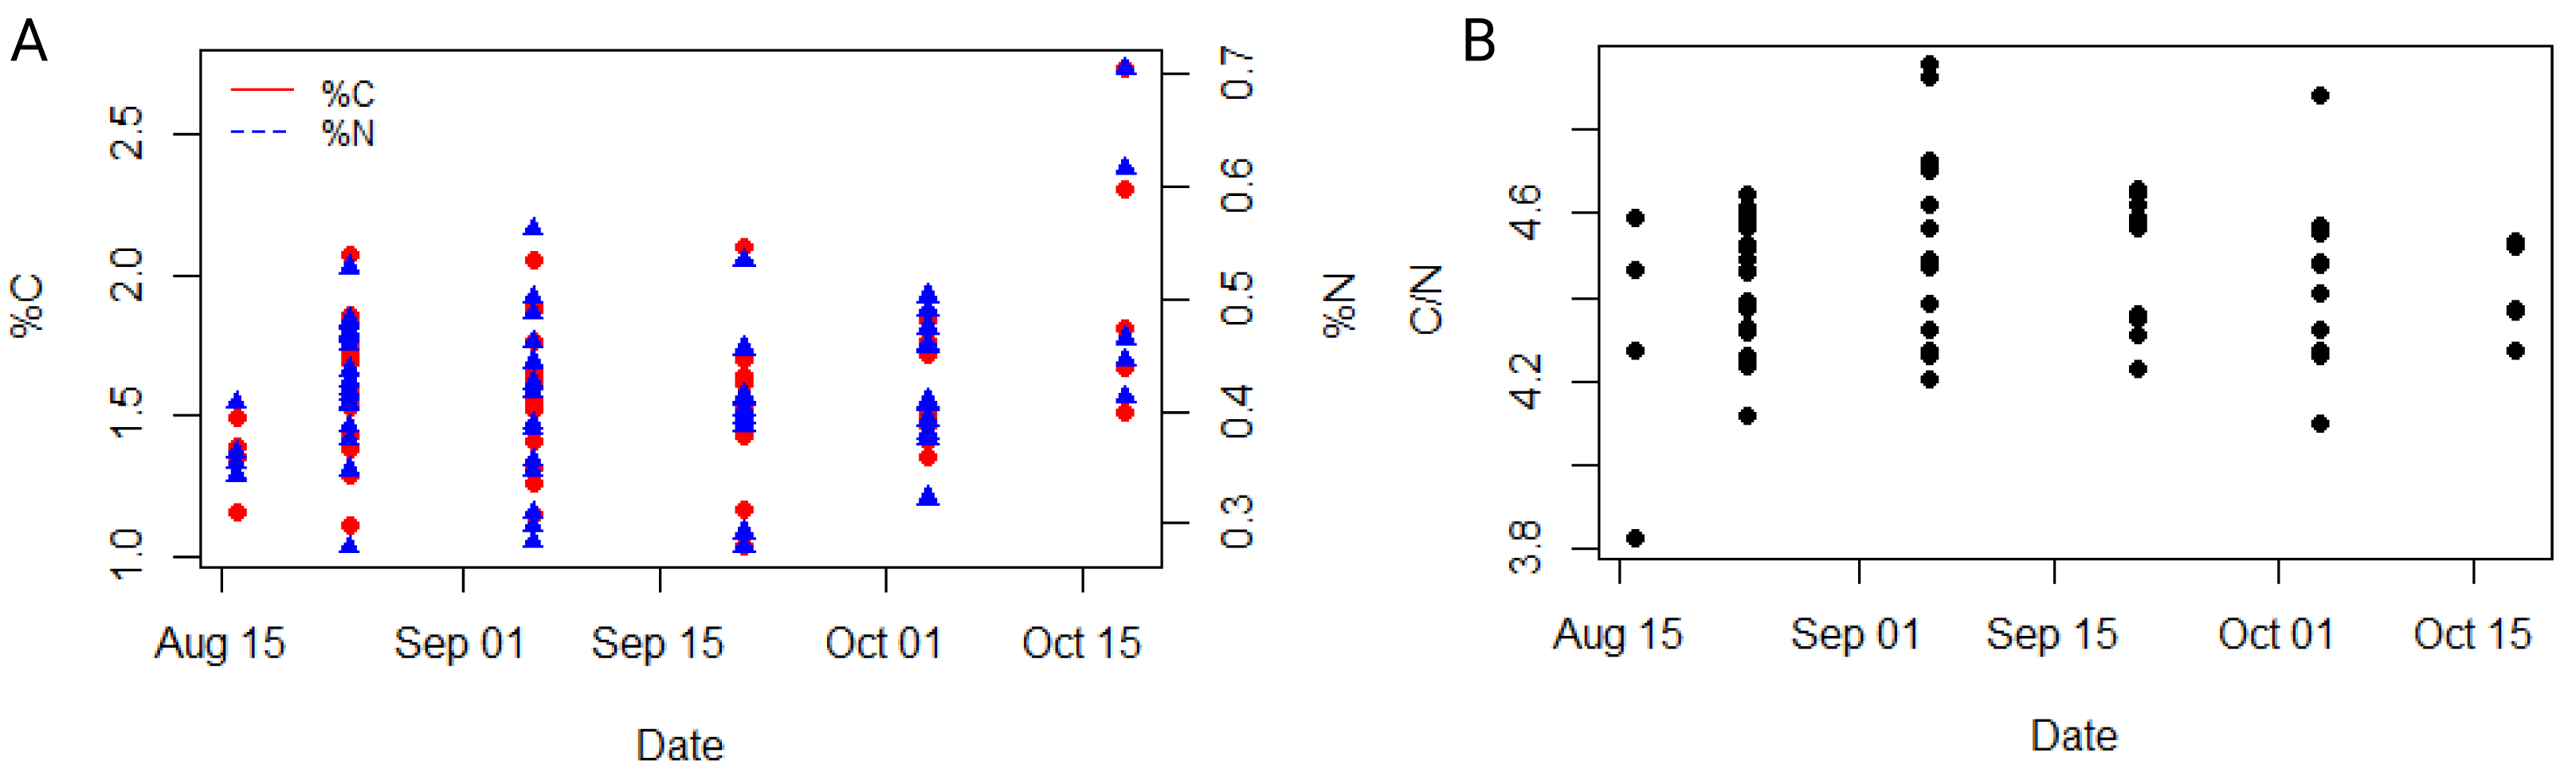
Egg production
The average wet mass (24.1 ± 7.8 g), dry mass percentage of WW (4.1 ± 0.3%), carbon (1.57 ± 0.33%) and nitrogen (0.42 ± 0.09%) content, and C:N ratio (4.4 ± 0.2:1) of individuals selected for egg production experiment fell within the range of values measured for the total collected population in our study (Table 1, Tables S1, S2). Slightly over half (57%) of individuals produced eggs in our study, with an average of 165 eggs per individual (Table 1). The percentage of individuals that did not produce any eggs was highest within the population collected in the second half of September and in the first half of October (Table 1). There was significant variability in the total number of eggs produced by individuals across the entire dataset and within specific experiments (Table 1, Fig. 5A). The largest number of eggs produced (638) was recorded in the second half of October, while the lowest (3) was recorded in the first half of September. However, no significant correlation between the total number of eggs produced and/or chemical characteristics of individuals or environmental variables was found (Table S4).
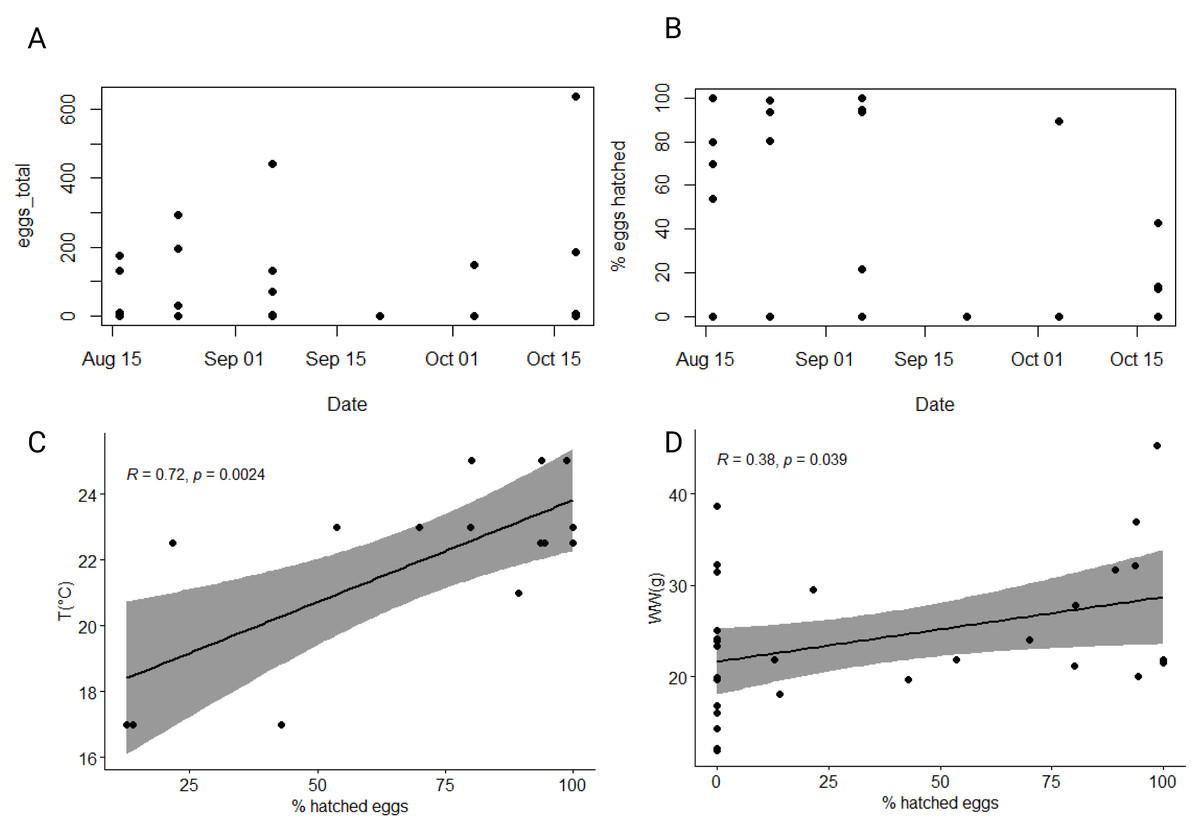
Figure 5: Dynamic of produced and hatched eggs of studied ctenophore population.
Total number of eggs produced (A) and percentage of hatched eggs (B) by ctenophores collected from August until October 2021 in the northern Adriatic Sea. Correlation between percentage of hatched eggs and (C) ambient seawater temperature and (D) wet weight of individuals. All individuals, also those that did not produce any eggs are considered.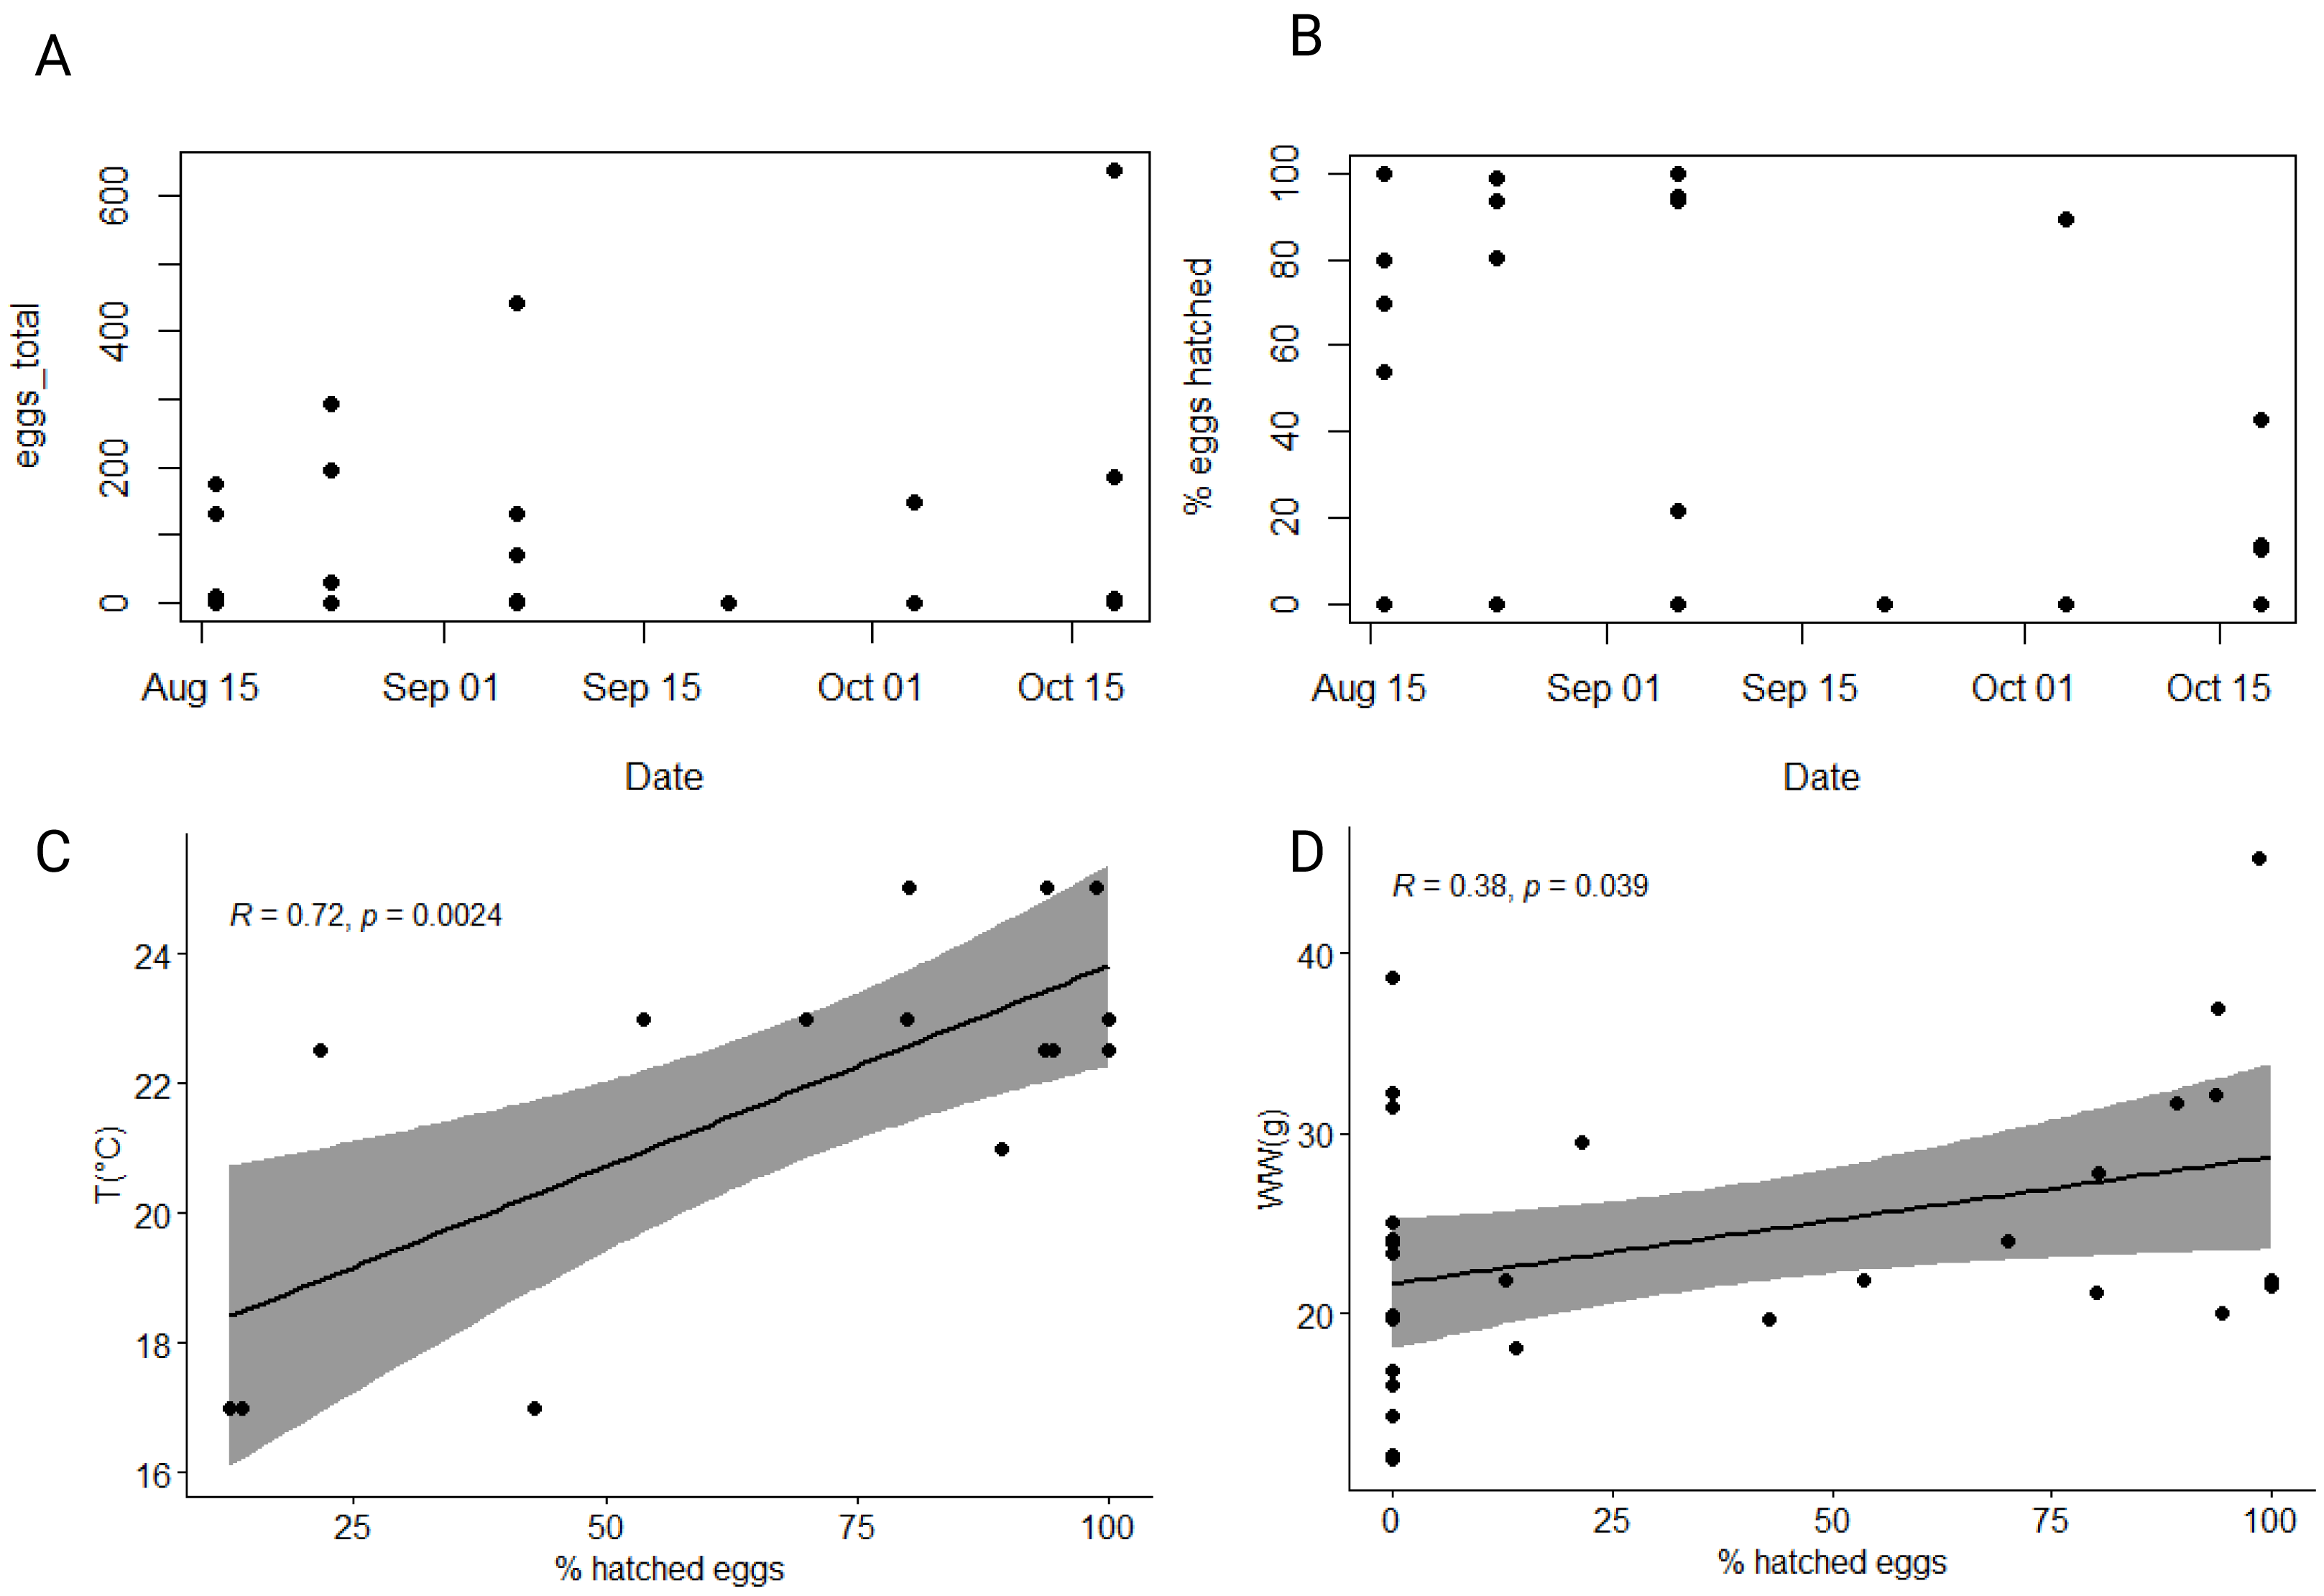
In our 48-hour fecundity experiment, most eggs had developed into cydippid larva stage by the end of the first 24 h. The average percentage of hatched eggs per experiment was calculated by considering only those individuals that produced eggs. The overall average percentage of hatched eggs across the entire dataset was 67% ± 32%, with a minimum of 13% observed in the second half of October and a maximum of 100% observed in the first half of August and the first half of September (Fig. 5B). Significant correlation between percentage of hatched eggs and ambient seawater temperature was found (r = 0.36, p < 0.05*), which became even more significant when considering only individuals that produced eggs (r = 0.72, p < 0.01**) (Fig. 5C, Table S4). Additionally, there was a significant positive correlation between the percentage of hatched eggs and the wet weight of ctenophores (r = 0.38, p < 0.05*) (Fig. 5D, Table S4). Note that while these correlations were significant, they were not confirmed using Holm-Bonferroni method. However, no significant correlation between the percentage of hatched eggs and the chemical characteristics of individuals or environmental variables was found (Table S4).
Discussion
Mnemiopsis leidyi populations begin to increase in late July, peaking between September and October with periodic large blooms, while individuals are rarely observed during the colder part of the year (Malej et al., 2017; Budiša et al., 2021). During this period physical, chemical, and biological factors in the surrounding seawater changed (Fig. 2); however, no significant temporal trends were observed in wet weight, dry weight, carbon and nitrogen content, or carbon-to-nitrogen molar ratio in the sampled population (Figs. 3, 4). The carbon-to-nitrogen ratio remained relatively constant, averaging at 4.5:1, consistent with previous reports (Pitt, Welsh & Condon, 2009; Lucas et al., 2011) and showed no correlation with environmental variables (Table S3, Fig. 4). Based on our current data, we reject our hypothesis that changes in environmental variables are reflected in the carbon-to-nitrogen ratio of ctenophore biomass; however, more experiments are needed to conclude definitively that environmental variables have no effect on the chemical composition of ctenophores biomass. Nevertheless, a significant correlation between salinity and percentage of dry weight was found (r = 0.40, p < 0.001**, Holm-Bonferroni adjustment) (Fig. 3C, Table S3). The percentage of dry mass increased progressively during our sampling campaign, likely due to an increase of ambient seawater salinity, resulting in higher salt content in jellyfish due to osmoregulation (Hirst & Lucas, 1998). Additionally, the maximum percentage of carbon and nitrogen in the dry mass was measured for the population collected in the second half of October (Table S1), coinciding with the recorded peak of chlorophyll a concentration. A higher concentration of chlorophyll a in ambient seawater implies a more productive system and could be indicative of higher zooplankton prey abundance. Moreover, the annual pattern of zooplankton biomass in our study area typically exhibits a bimodal distribution with a peak in spring and secondary peak in autumn (Mozetič et al., 2012).
The number of eggs produced varied greatly among individuals in our fecundity experiments, with approximately half of them not producing any eggs despite being homogenous in biometric properties. The percentage of non-egg-producing individuals was higher in autumn compared to summer, but no correlation with environmental variables was found, necessitating further experiments and additional analysis to explain this observation. The average number of eggs produced was 165 ± 179, which is lower than previously reported for the northern Adriatic Sea (4,320 ± 3,980 eggs, (Malej et al., 2017) or other areas in the Mediterranean Sea, where the reproductive output of freshly collected animals from the natural environment was assessed (Table 2). For instance, it has been noted that laboratory-reared animals never achieved the maximum daily egg production observed in animals collected from their natural environment (Baker & Reeve, 1974). Egg production variability has been observed across different invaded and native areas (Shiganova et al., 2019b); in the northern Europe (e.g., 3,000 eggs ind−1 day−1; (Javidpour et al., 2009); maximum rates of 11,232 eggs ind−1 day−1, (Jaspers, Costello & Colin, 2015) or in the southern Europe (e.g., 12,000 eggs ind−1 day−1, (Zaika & Revkov, 1994). A study in the Black, Azov and Caspian Seas (Shiganova, 2020) found that the number of eggs laid per individual per day was related to salinity and temperature. The egg production of M. leidyi also varied greatly in the native areas, e.g., with 0 to 9,910 eggs ind−1 day−1 (Baker & Reeve, 1974) and a maximum of up to 14,233 eggs ind−1 day−1 (Kremer, 1976).
| Native areas | T (°C) | TBL (cm) | No. eggs | % ind. eggs | % hatching |
|---|---|---|---|---|---|
| Narragansett Bay (Costello et al., 2006) | 6–25 | 0–3,300 | 59 | n.d. | |
| Narragansett Bay (Kremer, 1976) | 11–29 | 0–14,000 | |||
| Biscayne Bay (Baker & Reeve, 1974) | 21–31 | 3.8–8.5 | 0–9,990 | 90 | n.d. |
| Biscayne Bay (Stanlaw, Reeve & Walter, 1981) | 21 | up to 10,000 | most individuals | most eggs | |
| Mediterranean Sea | |||||
| Aegean Sea (Shiganova et al., 2004) | 21–25 | 1.7–3.4 | 0–448 | 75 | 82 |
| Northern Adriatic (Malej et al., 2017) | 20–22 | 5.4–11.5 | 136–13,512 | 100 | n.d. |
| Northern Adriatic (Kogovšek et al., 2018) | 20 | 4.1–9.8 | 0–1,400 | 65 | n.d. |
| This study | 17–25 | 5–7 | 0–638 | 57 | 12–100 |
Notes:
- T
-
temperature
- TLB
-
total body length
- No. eggs
-
number of eggs produced by individual in 24 h
- % ind. eggs
-
percentage of individuals that produced eggs
- % hatching
-
percentage of hatched eggs after 24 h
Some hypothesize that the transition towards oligotrophy (Mozetič et al., 2012) in the northern Adriatic may negatively impact ctenophores fecundity (Ciglenečki et al., 2021). However, the lower reproductive performance observed in our study compared to measurements in the initial year of M. leidyi colonization in the Northern Adriatic Sea (Malej et al., 2017) could be contributed to a decline in invasive opportunistic traits since the invasion. Nonetheless, Jaspers and her colleagues (Jaspers et al., 2018) observed no such effect and explained the persistence of invasive traits in Mnemiopsis through multiple reinvasions and a large variation in reproductive traits in the (native) source population.
The observed variability can be due to varying size of individuals selected in those studies, as eggs produced generally increases with size (Sasson & Ryan, 2016). In our study, individuals of specific size were deliberately selected to minimize the effect of body size. This allowed us to investigate how changing environmental conditions affect ctenophore reproductive potential, but no significant correlations were found between egg production, biometric/chemical characteristics, or environmental variables. There was significant correlation between the percentage of hatched eggs and ambient seawater temperature, as well as wet weight of ctenophores (Figs. 5C, 5D). However, no significant correlation was found between the percentage of hatched eggs and individual chemical characteristics or other environmental variables. Thus, our hypothesis that changing environmental variables and biometric/chemical characteristics affect ctenophore reproduction is only partly supported. The positive correlation between wet weight and the percentage of hatched eggs aligns with the general trend of increased egg viability with individual size (Sasson & Ryan, 2016). In our study, the percentage of hatched eggs exceeded 80% at around 25 °C but dropped significantly in late October when the seawater temperature decreased. It is possible that lower temperatures slowed embryo development, consistent with findings in other studies showing increased development speed with temperature up to an optimum of around 25 °C (Sullivan & Gifford, 2004; Gambill, Møller & Peck, 2015).
Conclusions and Future Perspectives
Our analysis of the chemical composition of the northern Adriatic M. leidyi population revealed stable carbon and nitrogen content throughout its bloom development, with no significant correlation observed with seawater temperature, salinity, oxygen, or chlorophyll a concentration. However, maximum carbon and nitrogen content coincided with a shift towards a more productive system, possibly due to higher prey abundance. It is important to note that our study focused only on the blooming period of M. leidyi in the northern Adriatic. The number of eggs produced per individual was lower than previously reported for the same area and other invaded Mediterranean Sea basins and exhibited high variability despite the homogeneity of the studied population. This suggests the need to consider a broader range of environmental factors influencing ctenophore fecundity. We observed a positive correlation between the percentage of hatched eggs and seawater temperature, as well as between the wet weight of individuals and the percentage of hatched eggs. Further examination at the individual molecular compound level is needed to understand how ctenophores contribute to the ambient dissolved organic matter pool, which in turn shapes the structure and function of microbial communities and drives biogeochemical cycles in the marine food web.
Supplemental Information
Wet and dry weight and carbon and nitrogen content of studied ctenophore population
Wet Weight (WW), Dry Weight (DW), percentage of DW, percentage of carbon and nitrogen and carbon to nitrogen molar ration of all collected individuals from August until October 2021 in our study together with environmental parameters of ambient seawater during time of sampling (temperature -T, salinity, Chl a and Oxygen concentration).
Biometry of ctenophore population selected for egg production experiments
Wet Weight (WW), Dry Weight (DW), percentage of DW, total body length (tbl) and total body width (bw) of individual selected for egg production experiments.
Statistical analysis of selected environmental variables and biometric characteristics of ctenophores
Pearson correlation coefficient for the entire set of selected environmental variables (temperature, salinity, oxygen, and chlorophyll a concentration) and all biometric characteristics of ctenophores (wet weight, dry weight, percentage of dry weight, percentage of carbon, percentage of nitrogen and carbon to nitrogen molar ratio) using R correlation package.
Statistical analysis of selected environmental variables, biometric characteristics and egg production and hatching of studied ctenophore population
Pearson correlation coefficient for the entire set of selected environmental variables (temperature, salinity, oxygen, and chlorophyll a concentration) and all biometric characteristics of ctenophores selected for egg production experiment (wet weight, dry weight, percentage of dry weight, percentage of carbon, percentage of nitrogen and carbon to nitrogen molar ratio, total number of eggs produced, total number of eggs hatched, percentage of hatched eggs) using R correlation package.