
Machine learning and bioinformatics analysis of diagnostic biomarkers associated with the occurrence and development of lung adenocarcinoma
- Published
- Accepted
- Received
- Academic Editor
- Praveen Korla
- Subject Areas
- Bioinformatics, Molecular Biology, Oncology, Respiratory Medicine, Data Mining and Machine Learning
- Keywords
- Lung adenocarcinoma, Gene, Machine learning, Bioinformatics analysis
- Copyright
- © 2024 Li et al.
- Licence
- This is an open access article distributed under the terms of the Creative Commons Attribution License, which permits using, remixing, and building upon the work non-commercially, as long as it is properly attributed. For attribution, the original author(s), title, publication source (PeerJ) and either DOI or URL of the article must be cited.
- Cite this article
- 2024. Machine learning and bioinformatics analysis of diagnostic biomarkers associated with the occurrence and development of lung adenocarcinoma. PeerJ 12:e17746 https://doi.org/10.7717/peerj.17746
Abstract
Objective
Lung adenocarcinoma poses a major global health challenge and is a leading cause of cancer-related deaths worldwide. This study is a review of three molecular biomarkers screened by machine learning that are not only important in the occurrence and progression of lung adenocarcinoma but also have the potential to serve as biomarkers for clinical diagnosis, prognosis evaluation and treatment guidance.
Methods
Differentially expressed genes (DEGs) were identified using comprehensive GSE1987 and GSE18842 gene expression databases. A comprehensive bioinformatics analysis of these DEGs was conducted to explore enriched functions and pathways, relative expression levels, and interaction networks. Random Forest and LASSO regression analysis techniques were used to identify the three most significant target genes. The TCGA database and quantitative polymerase chain reaction (qPCR) experiments were used to verify the expression levels and receiver operating characteristic (ROC) curves of these three target genes. Furthermore, immune invasiveness, pan-cancer, and mRNA-miRNA interaction network analyses were performed.
Results
Eighty-nine genes showed increased expression and 190 genes showed decreased expression. Notably, the upregulated DEGs were predominantly associated with organelle fission and nuclear division, whereas the downregulated DEGs were mainly associated with genitourinary system development and cell-substrate adhesion. The construction of the DEG protein-protein interaction network revealed 32 and 19 hub genes with the highest moderate values among the upregulated and downregulated genes, respectively. Using random forest and LASSO regression analyses, the hub genes were employed to identify three most significant target genes.TCGA database and qPCR experiments were used to verify the expression levels and ROC curves of these three target genes, and immunoinvasive analysis, pan-cancer analysis and mRNA-miRNA interaction network analysis were performed.
Conclusion
Three target genes identified by machine learning: BUB1B, CENPF, and PLK1 play key roles in LUAD development of lung adenocarcinoma.
Introduction
Lung cancer remains the primary cause of cancer-related deaths globally, and lung adenocarcinoma, the most prevalent type, constitutes 40% of deaths (Cao et al., 2021), with a continuous increase for over 50 years, indicating a significant upward trend since the 1970s (Zheng et al., 2016). In 2020, China had the largest number of lung cancer cases and mortality (37.0% and 39.8%, respectively), followed by the United States (10.3% of cases and 7.7% of mortality) and Japan (6.3% of cases and 4.6% of mortality) (Li et al., 2023b; He et al., 2024).
Amid the ongoing progress in molecular biology and immunology, tumor markers are playing an increasingly pivotal role in tumor screening, diagnosis, prognosis, and evaluation of efficacy and follow-up. Various tumor markers such as embryonic antigens, glycoprotein antigens, keratin antigens, and enzyme antigens have been extensively reported; however, a substantial number await clinical verification (Song et al., 2022; Cho et al., 2016). These include IFNGR1, TNFRSF19L, GHR, SLAMF8, FR-beta, and integrin alpha 5 (Wu et al., 2019; Dotta et al., 2020). The advent of medical informatics has introduced novel avenues for resolving clinical challenges and providing innovative methods for tumor diagnosis and treatment (Rojas-Rodriguez, Schmidt & Canisius, 2024).
The Gene Expression Comprehensive Database (GEO), a publicly accessible repository, archives and distributes microarrays, enabling bioinformatics analysis at specific gene levels across various cancer types (Wang et al., 2022a). Although widely used for mining differentially expressed genes (DEGs), detecting relevant molecular signals and potential associations, and studying gene regulatory networks, the use of GEO database is challenging due to the high cost of individual experiments and limitations in tissue samples. To address these issues, we employed a comprehensive analysis of different datasets and bioinformatics methods to thoroughly identify DEGs across different cancer types (Barrett et al., 2013).
High-throughput sequencing has emerged as a valuable method for scrutinizing changes in gene expression associated with illnesses and for identifying potential disease-related genes, thus facilitating the discovery of new diagnostic and therapeutic approaches (Bacchelli & Williams, 2016). Machine learning algorithms, whether supervised or unsupervised, exhibit significant promise for analyzing complex relationships within high-dimensional data (Uddin et al., 2019; Choi et al., 2020). Moreover, machine learning is beneficial for assessing high-dimensional transcriptome data and identifying genes of biological significance (Handelman et al., 2018; Greener et al., 2022).
In recent years, machine learning (ML)-based artificial intelligence (AI) has been developed for the medical-industrial convergence. AI can help model and predict medical information (Gao et al., 2023). A growing number of studies have combined radiology, pathology, genomics, and proteomics data to predict the expression levels of programmed death-ligand 1 (PD-L1), tumor mutation burden (TMB), and tumor microenvironment (TME) in cancer patients, and to predict the likelihood of immunotherapy benefits and side effects (Wang et al., 2024; Wei et al., 2023).
We downloaded raw data (GSE1987 and GSE18842) from the GEO database and used the GEO2R online tool for DEG screening. Subsequent steps included functional enrichment and protein-protein interaction (PPI) network analyses, leading to the identification of hub genes. Then we used random forest and lasso regression analyses and selected three significantly expressed target genes. Survival and Receiver Operating Characteristic (ROC) curve analyses revealed that these three genes are biomarkers associated with lung cancer and offer new insights into clinical diagnosis. Simultaneously, we analyzed the relevant immune expression of the three target genes, demonstrating their interaction with various immune cells in lung adenocarcinoma.
First, unlike previous studies, this study used two independent datasets (GSE1987 and GSE18842), which increased the reliability and universality of the results. Second, we not only performed routine bioinformatics analysis but also introduced machine learning techniques, such as random forest and LASSO regression analyses, to precisely identify key target genes (BUB1B, CENPF, and PLK1). Clinical validation of these genes was performed using the TCGA database and quantitative polymerase chain reaction (qPCR) experiments, making the results convincing.
Furthermore, we performed extensive immune cell infiltration and pan-cancer analyses to explore the potential roles of these genes in various cancer types. Thus, the broad applicability of these genes is not limited to lung adenocarcinoma.
The application of these comprehensive analyses and techniques makes this study significantly innovative in identifying multiple potential markers and therapeutic targets and provides new ideas and a basis for future clinical applications.
Methods
Data sources
The GEO database was queried for data related to “lung cancer” and two datasets, GSE1987 and GSE18842, were identified (Barrett et al., 2013). The details of each dataset are as follows:
GSE1987 dataset:
Platform: GPL91 ([HG_U95A] Affymetrix Human Genome U95A Array)
Specimens: 27 lung cancer specimens 9 non-lung cancer specimens
GSE18842 dataset:
Platform: GPL570 ([HG-U133_Plus_2] Affymetrix Human Genome U133 Plus 2.0 Array)
Specimens: 46 lung cancer specimens 45 non-lung cancer specimens
These datasets provide valuable information for the analysis of gene expression in lung and non-lung cancer specimens, offering a comprehensive resource for further investigation.
Data processing of DEGs
DEGs, a web application based on R, which was gained from GEO through GEO2R, was used to extract GEO data (Greener et al., 2022). In this study, the screening of DEGs was conducted using R software (version 4.2.1; R Core Team, 2022) with criteria set at P < 0.05 and log2FC ≥ 1. Subsequently, heat maps were generated using the R package “ggplot2” (version 3.3.6), and Venn plots were created with VENNY (version 2.1) to visually represent the identified DEGs.
KEGG and GO enrichment analysis of DEGs
To elucidate the functional significance of the overlapping DEGs, we conducted Gene Ontology (GO) annotation and Kyoto Encyclopedia of Genes and Genomes (KEGG) pathway analyses. Analyses were performed using the Database for Annotation, Visualization, and Integrated Discovery (DAVID) tools (version 6.7) (Dennis Jr et al., 2003). GO functional annotations were used to categorize and identify genes as well as their protein and RNA products based on their biological characteristics (Wang et al., 2022a). KEGG was used to explore the potential pathways associated with signal transduction of these overlapping DEGs (Ashburner et al., 2000). In our study, statistical significance was determined using a corrected P <0.05.
PPI networks of DEGs
In our study, a PPI network was established using the STRING database and was visualized using Cytoscape (version 3.7.2). Concurrently, noteworthy core gene modules were extracted from PPI network complexes using MCODE (degree threshold ≥ 2, node score threshold ≥ 0.2, K-core ≥ 2, max depth = 100) (Kanehisa et al., 2017; Yu et al., 2012). This approach enabled the identification of multiple connecting pathways in which tandem genes act as bridges that link these pathways..
Machine learning algorithms
We used Random Forest (Bindea et al., 2009; Tai et al., 2019; Wang, Yang & Luo, 2016) and LASSO regression analyses (Ishwaran & Kogalur, 2010; Cheung-Lee & Link, 2019; Fernández-Delgado et al., 2019) (Least Absolute Shrinkage and Selection Operator) to identify key biomarkers. These two algorithms were chosen because random forests have good performance and robustness in handling high-dimensional data, which can capture complex nonlinear relationships, whereas LASSO regression is suitable for feature selection and sparse modeling of high-dimensional data, which helps reduce redundant variables and improve the interpretive and predictive performances of models.
In addition, we describe the statistical methods used to assess the significance of the identified biomarkers, including the specific test methods and multiple hypothesis testing corrections. For example, in the significance analysis, we used Student’s t-test and Wilcoxon rank-sum test to compare differences in gene expression and used False Discovery Rate (FDR) correction to control for the false positive rate caused by multiple testing.
Lung adenocarcinoma data validation from the TCGA database
We obtained and organized data from TCGA-LUAD (lung adenocarcinoma) project, sourced from TCGA database (https://portal.gdc.cancer.gov). Subsequently, we analyzed the expression levels, survival curves, and receiver operating characteristic (ROC) curves of the target genes in lung adenocarcinoma. This analysis was performed using R language software (version 4.2.1; R Core Team, 2022). ROC analysis of the data was performed using the pROC package (1.18.0) and the results were visualized using ggplot2 (3.3.6). Expression Data Acquisition: Download and collate RNAseq data from the TCGA-LUAD project Spliced Transcripts Alignment to a Reference (STAR) processes from the TCGA database and extract data in transcripts per million (TPM) format as well as clinical data.
qPCR
In this study, quantitative polymerase chain reaction (qPCR) was used to validate the expression levels of BUB1B, CENPF, and PLK1 in lung cancer. We recruited a cohort of nine lung cancer patients admitted to our hospital from January 1, 2024 to January 31, 2024. Concurrently, nine healthy individuals undergoing routine health examinations during the same period were included as the control group. The inclusion criteria for lung cancer patients were as follows: (1) age ≤ 90 years; (2) no history of radiotherapy or chemotherapy; (3) no fever or infection within 3 months before blood collection; (4) no history of blood transfusion.
The qPCR assay was configured as recommended by the “MIQE guidelines.” Three genes were selected for validation of the RNA-seq results. The qPCR primers were designed using Primer3 online software (https://bioinfo.ut.ee/primer3-0.4.0/) and synthesized by Sangon Biotech Co., Ltd (Shanghai, China). For cDNA synthesis, 1µg of total RNA was reverse transcribed using the PrimeScript RT Kit (Takara Bio™ Inc., San Jose, CA, USA) following the manufacturer’s protocol. Quantitative RT-PCR was performed on a CFX96 real-time PCR system (Bio-Rad Laboratories Inc., Hercules, CA, USA) using TB Green Premix Ex Taq II (Takara Bio Inc.). Consumables used included RNase-free tips and eight strips of PCR tubes from Axygen® Brand Products (Corning Incorporated, Corning, NY, USA). Quantification was performed in triplicates using a 25 μL reaction mixture. Each reaction mixture consisted of 12.5 μL TB Green Premix Ex Taq II, 1 μL of each primer (10 μM), 8.5 μL RNase-free water, and 2 μL of 1:5 dilution of cDNA. PCR amplification conditions consisted of initial denaturation at 95 °C for 30 s, followed by 40 cycles of denaturation at 95 °C for 5 s, and annealing at 60 °C for 30 s. After cooling to 65 °C for 5 s, the melting curves at the end of each PCR were obtained by gradually increasing the temperature to 95 °C (with an increment rate of 0.5 °C/s). The same amplification analysis was performed for all samples, therefore, run-to-run calibration was not required. The data obtained were analyzed by Bio-Rad CFX Manager software (version 3.0), which generated the raw quantitative cycle (Cq) values for each reaction using the 2-ΔΔCT method. Further details of qPCR can be found in the MIQE checklist. The primer pairs were used in the following order:
BUB1B: forward primer, 5′-CTGGAGGGAGATGAATGGGAACTG-3′, and reverse primer, 5′-CCGTTTCTGCTGCTGAAGAGTATTG-3′.
CENPF: forward primer, 5′-AGCAAGCCAGACTCTTCCACAAG-3′, and reverse primer, 5′-GCTGCCATGAGAACACAGATGATG-3′.
PLK1: forward primer, 5′-TCAGCAAGTGGGTGGACTATTCG-3′, and reverse primer, 5′-TTGTAGAGGATGAGGCGTGTTGAG-3′.
Infiltration analysis of immune cells
The CIBERSORT algorithm was applied to the GSE18842 dataset, and significant associations between the target gene and various immune cells were identified through correlation analysis. All analyses and visualizations were performed in R software (4.2.1; R Core Team, 2022). Based on 22 immune cells accessible on the CIBERSORTx website (https://cibersortx.stanford.edu/), the gene expression profile of the signature matrix was examined using the CIBERSORT.R (script) analysis core algorithm (Steen et al., 2020). Expression Data Acquisition: RNAseq data was downloaded from the TCGA-LUAD project STAR processes from the TCGA database and extracted in TPM format as well as clinical data format.
Pan-cancer analysis and miRNA analysis of BUB1B, CENPF, and PLK1
In this study, we used R software (version 4.2.1; R Core Team, 2022) and the R packages ggplot2 (3.3.6), stats (4.2.1), and car (3.1-0) to analyze the expression of BUB1B, CENPF, and PLK1 mRNA using the TCGA database (Lin et al., 2021). Data processing method: log2(value+1). Additionally, we analyzed the miRNAs corresponding to these three target genes. MiRNAs were retrieved from three databases: TargetScan (McGeary et al., 2019), StarBase (Wang et al., 2022b), and miRwalk (Kawakami et al., 2024). Venn diagrams and protein-protein interaction (PPI) networks were constructed for further analysis.
Population
The research protocol was approved by the Medical Ethics Committee of the Medical Research and Clinical Trial Ethics Committee of Huzhou First People’s Hospital (Approval Number: 2023KYLL014). All patients participating in the study provided the emotional consent and informed consent.
Results
Identification of differentially expressed genes
Gene expression data were processed and normalized using the criteria log FC >1 and P <0.05. Subsequently, DEGs were identified in the two datasets using the GEO2R online tool. A total of 279 DEGs were identified, comprising 89 upregulated and 190 downregulated genes in lung cancer specimens compared to the corresponding non-cancer specimens (Fig. 1). Table 1 provides a list of overlapping upregulated (log2FC >1, adjusted P <0.05) and downregulated (log2FC <-1, adjusted P <0.05) DEGs.
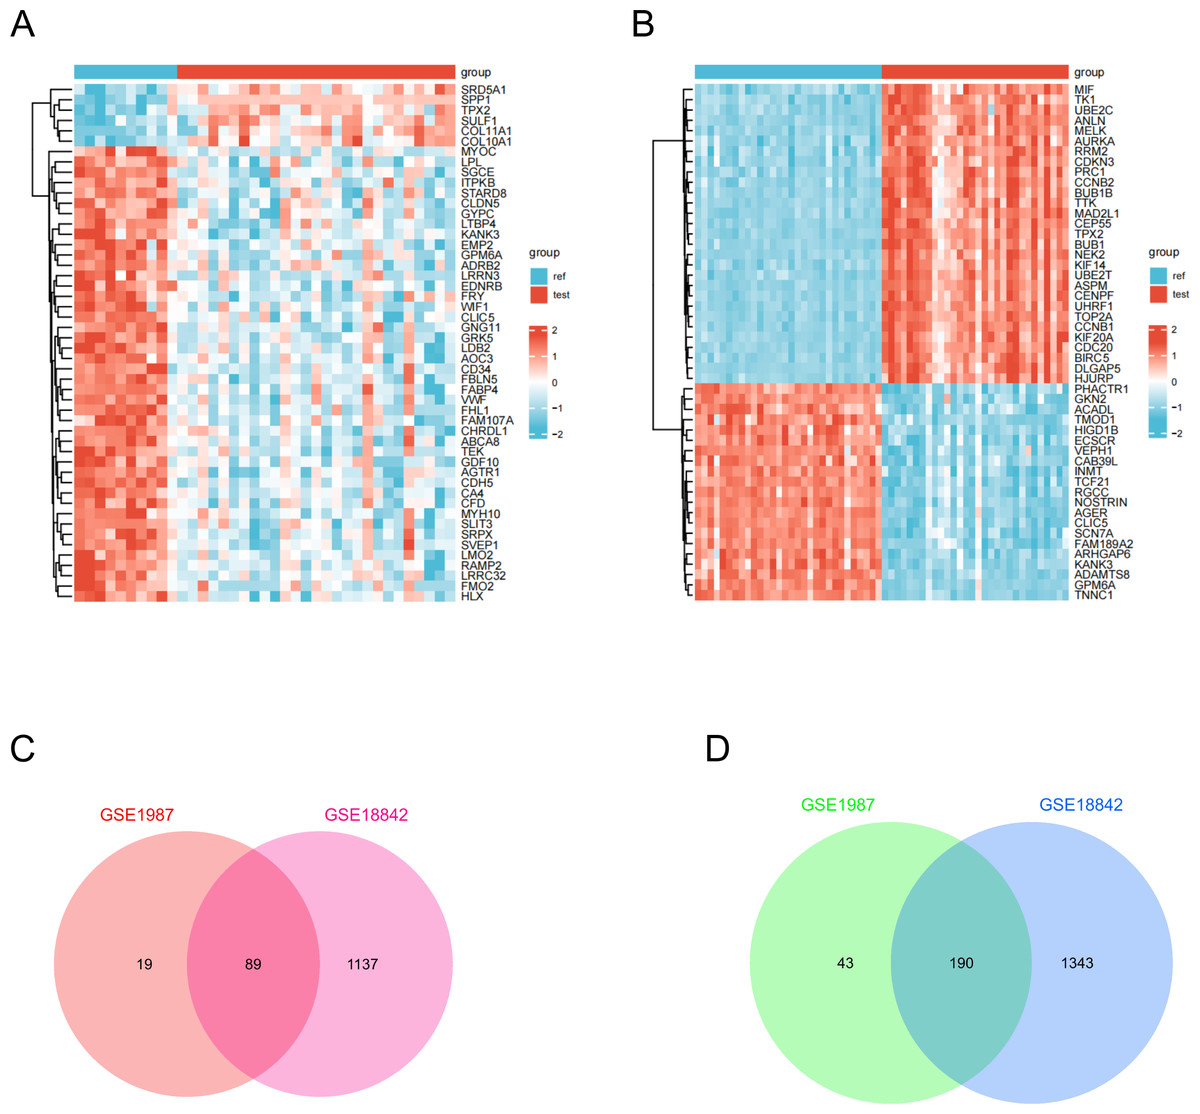
Figure 1: Identification of DEGs in two GEO datasets.
(A) The DEGs heatmap describes the different expressions between lung cancer specimens and normal lung specimens in the dataset GSE1987. (B) DEGs heatmap illustrating variable expression between lung cancer specimens and normal lung specimens in dataset GSE18842. (C) Venn diagram highlighting 89 overlapping up-regulated DEGs in the GSE1987 and GSE18842 datasets. (D) Venn diagram showing 190 overlapping down-regulated DEGs in GSE1987 and GSE18842 datasets.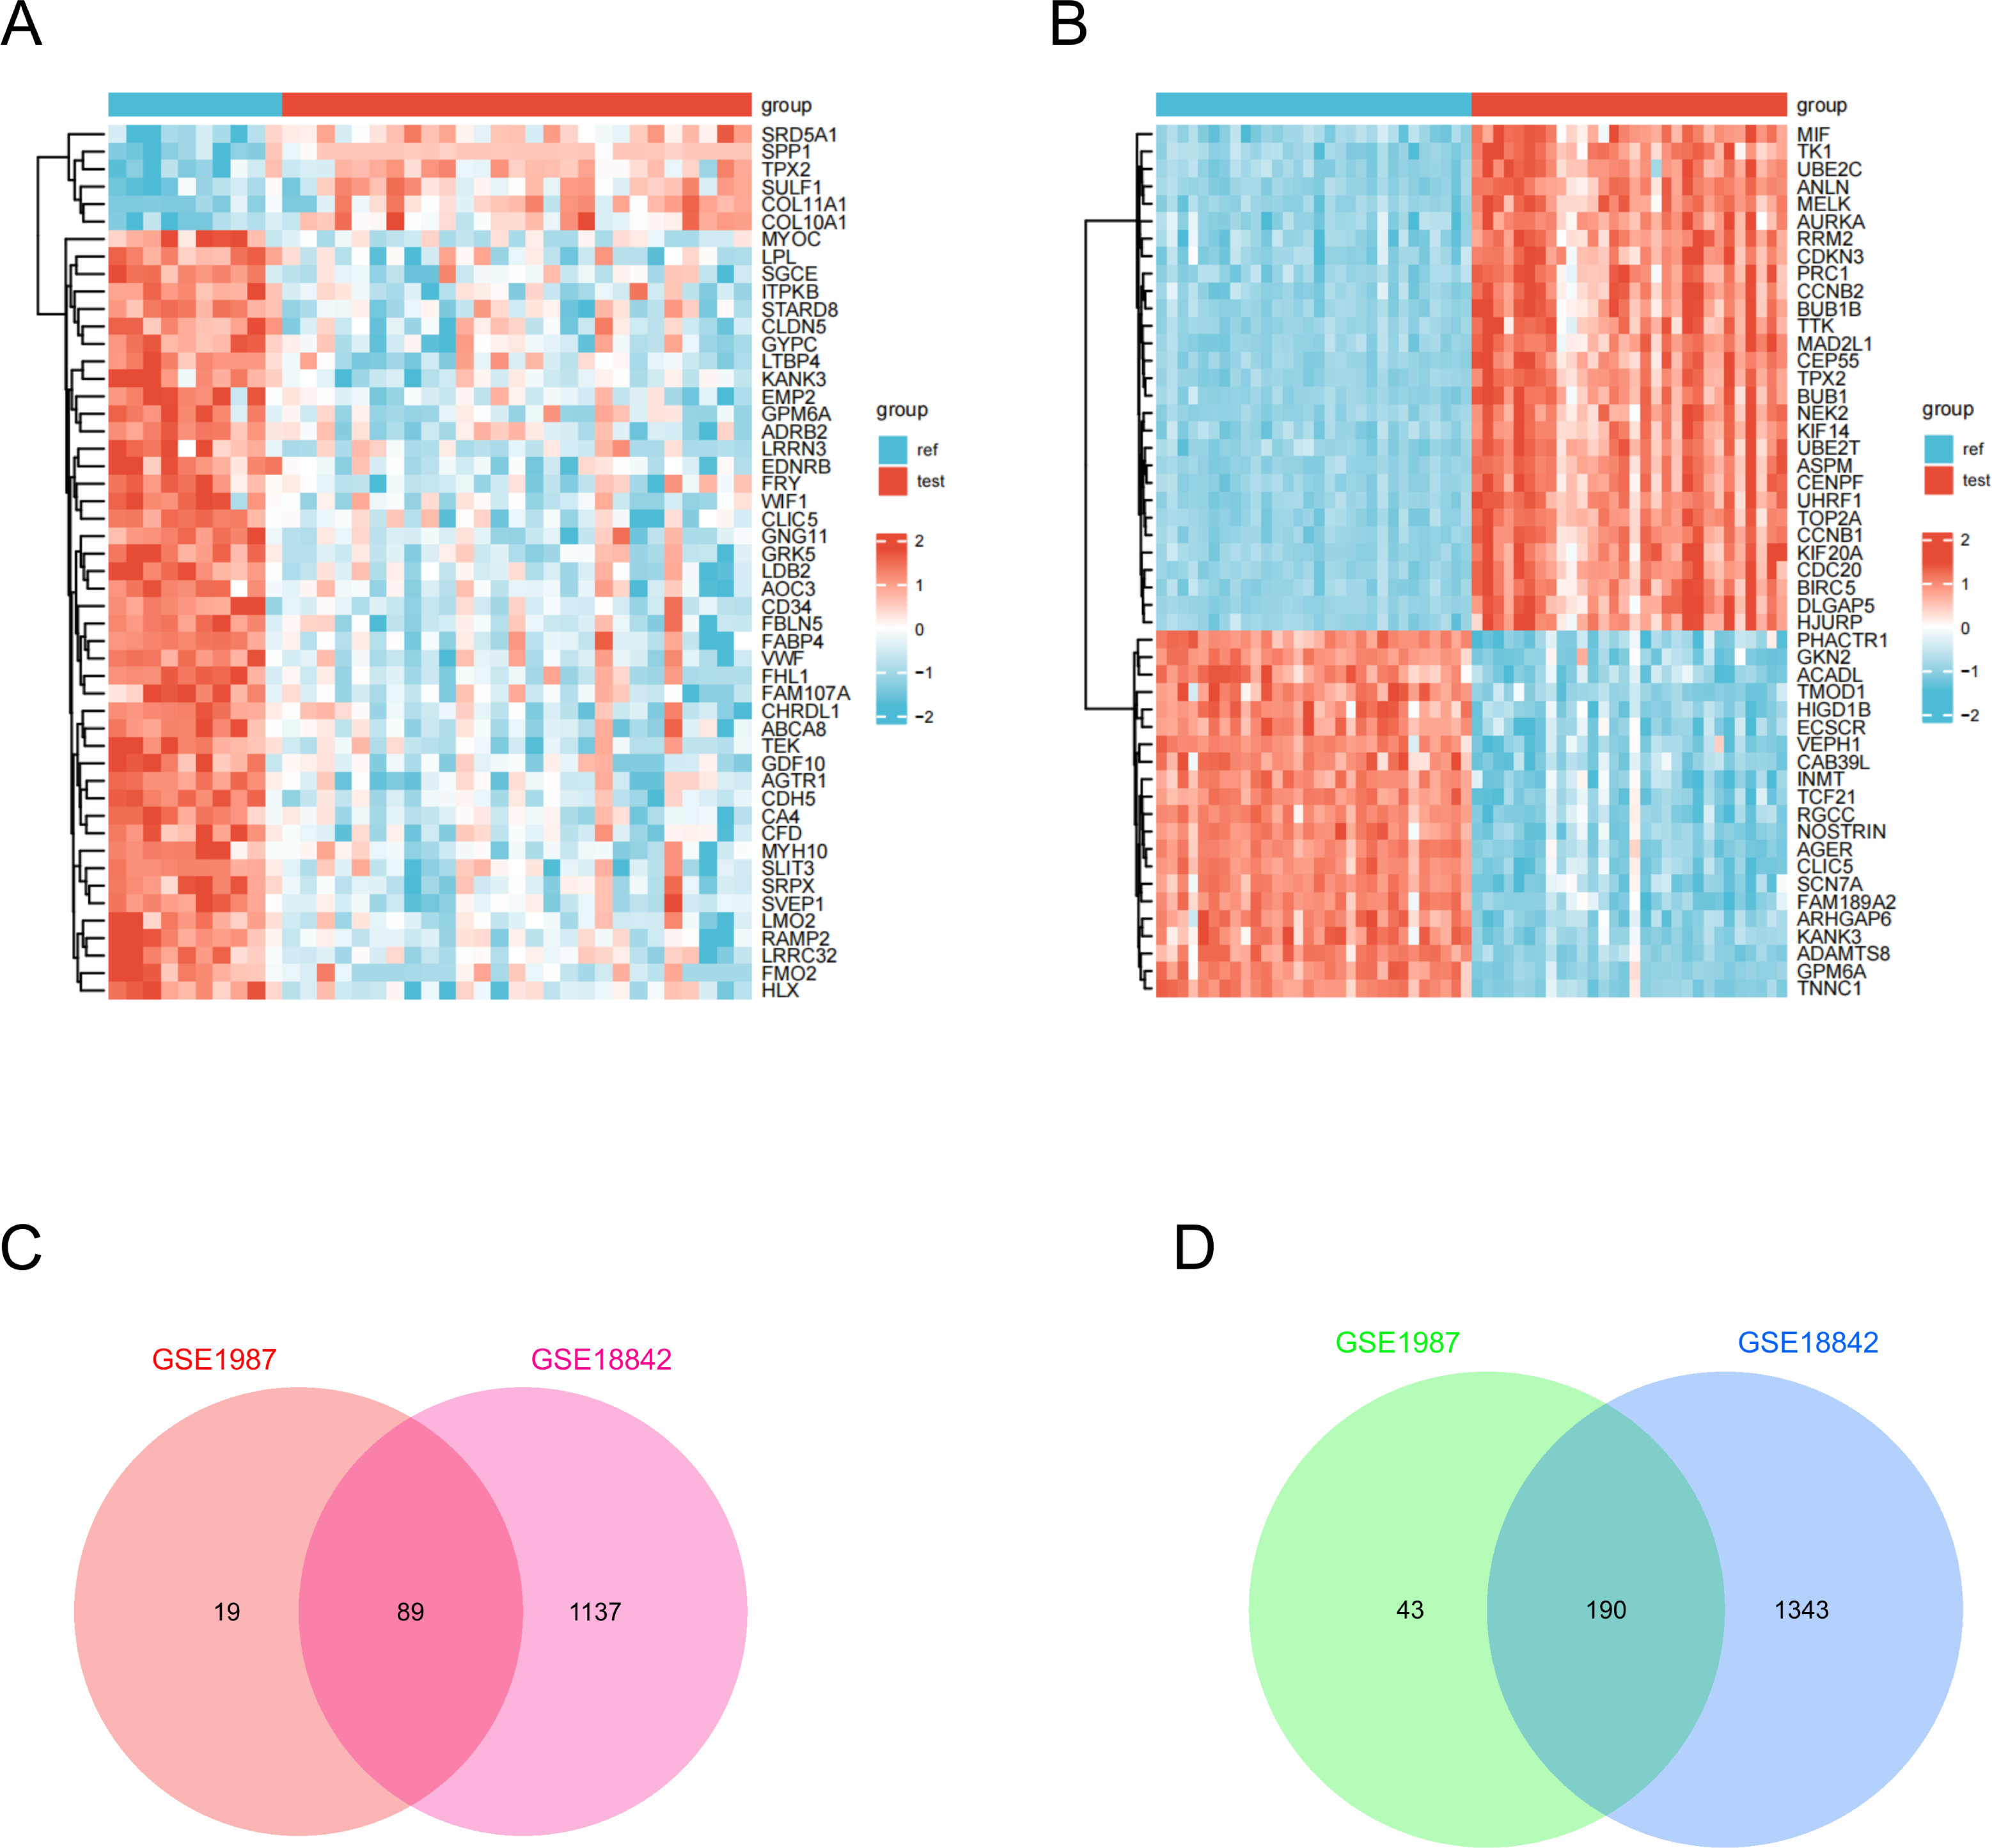
| DEGS | Gene name |
|---|---|
| UP | COL11A1-TFAP2A-MMP12-SPP1-UBE2C-SERPINB5-DSP-TPX2-IGF2BP3-SULF1-S100A2-GINS1-HIST1H2AE-COL17A1-CCNB2-KIAA0101-HIST1H2BD-SRD5A1-EZH2-ALDH3B2-CCNE1-MMP11-CDKN3-CDK1-CENPF-COL10A1-PTTG1-SLC9A3R1-CD24-KIF2C-CA12-LAD1-CCNB1-ZWINT-ADAMDEC1-FOXM1-APOBEC3B-CYP24A1-MELK-FAP-SCG5-CDC20-KIF11-PMAIP1-LRRC15-PPAP2C-IVL-THBS2-TTK-PLOD2-BUB1B-NFE2L3-SORD-PLK1-SPAG5-GCLC-POSTN-DTYMK-CKS1B-ATP2A2-CKS2-AIM2-SLC5A3-IRF6-TK1-STIL-KIF14-UMPS-PAICS-ST14-TOP2A-PYCR1-FUT3-FEN1-CDC6-KNTC1-PCNA-ESPL1-USP46-KIFC1-NCAPH-CPOX-NPM3-TMF1-KIF2A-BDH1-TFAP2C-SLC35A2-GGCT |
| DOWN | FABP4-WIF1-GDF10-CLDN5-AGER-C7-FHL1-ZBTB16-MFAP4-DES-CLIC5-ADIRF-PTX3-VWF-GPX3-TNNC1-ADH1B-AGTR1-TCF21-CHRDL1-SGCA-FMO2-IGFBP6-ABCA8-NRGN-LDB2-CDH5-FCN1-TTN-AQP1-TEK-LRRN3-RAMP2-PPBP-PTPRB-STARD8-EDNRB-CA4-ABLIM3-GPM6A-CA3-AQP4-LPL-TENC1-FCN3-C8B-ACKR1-BMP5-CBFA2T3-AOC3-GPM6B-DLC1-GPD1-CFD-CAV1-TGFBR3-SYNM-SRPX-TMOD1-AOX1-FAM107A-GNG11-CSF3-SELP-LMO7-MMRN1-CD93-NR4A3-ANXA3-RECK-ADARB1-ACADL-GPR116-FXYD1-OLFML1-KIAA1462-EMP2-FBLN5-SELE-ADAMTSL3-FEZ1-SEPT4-ENG-RASGRF1-ID4-SVEP1-ITGA9-GJA4-LDLR-MYRF-SMAD6-VNN2-BCHE-LILRB2-WISP2-COX7A1-SLC6A4-SPOCK2-NEDD9-ADRB2-CLC-HOXA5-C14orf132-TGFBR2-ACE-MYH10-SCEL-GATA2-TIE1-LRRC32-CDO1-FOXF1-SLIT2-CD34-GPC3-STX11-SPARCL1-PECAM1-DPYSL2-FBLN1-TBX2-BMX-LMO2-ANGPT1-ABCA6-ITM2A-SGCE-LTBP4-ALOX5AP-DST-KLF9-KAL1-FAM189A2-TAL1-MAOB-GYPC-MS4A2-AGTR2-ABLIM1-F8-MAL-GRK5-CAV2-S1PR1-THBD-EFEMP1-CH25H-G0S2-KDR-MYH11-FLI1-HLF-P2RY14-VSIG4-MMP19-MME-SOCS2-TMEM47-KANK3-CALCRL-RAMP3-HBEGF-KIAA0040-RASSF2-NOTCH4-KLF4-RGS2-PRKCZ-HEG1-WFS1-PROS1-GMFG-PPP1R15A-IL3RA-CA2-PLCE1-FRY-CREM-CDKN1C-CRIP2-FSTL3-TACC1-PODXL-MACF1-PMP22-CBX7-FERMT2-TYRP1-ICAM2-RPS6KA2 |
GSEA enrichment analysis, KEGG and GO enrichment analyses of DEGs
To gain a deeper understanding of the overlapping DEGs between the two datasets, we conducted functional analysis. Gene set enrichment analysis (GSEA) revealed that these DEGs were significantly associated with the cell cycle and mitosis. The GO and KEGG analyses highlighted the following insights:
For upregulated genes:
Biological processes (BPs):
Organelle fission
Nuclear division
Nuclear chromosome separation
Sister chromatid isolation
Cellular components (CCs):
Spindles
Chromosomal regions
Spindle poles
Cyclin-dependent protein kinase holase complexes
Molecular function (MF):
Microtubule binding
Microtubule motor activity
Cyclin-dependent protein serine/threonine kinase regulatory activity
Cyclin-dependent protein serine/threonine kinase activator activity
KEGG pathways:
Cell cycle
Egg cell meiosis
Human T-cell leukemia virus 1 infection
p53 signaling pathway
Cellular senescence
For downregulated genes:
Biological processes (BPs):
Genitourinary development
Cell-substrate adhesion
Renal phylogenesis
Angiogenesis
Cellular components (CCs):
Membrane microdomains
Membrane rafts
The outer side of the plasma membrane
The cellular cortex
Molecular function (MF):
Integrin-binding
Transmembrane receptor protein kinase activity
Transforming growth factor receptor binding
Type I transforming growth factor receptor binding
KEGG pathways:
Complement and coagulation cascades
AGE–RAGE signaling pathway in diabetic complications
Malaria
Tyrosine metabolism
Renin-angiotensin system
These findings underscore the diverse functional roles and pathways associated with the DEGs identified in lung cancer specimens (Fig. 2).
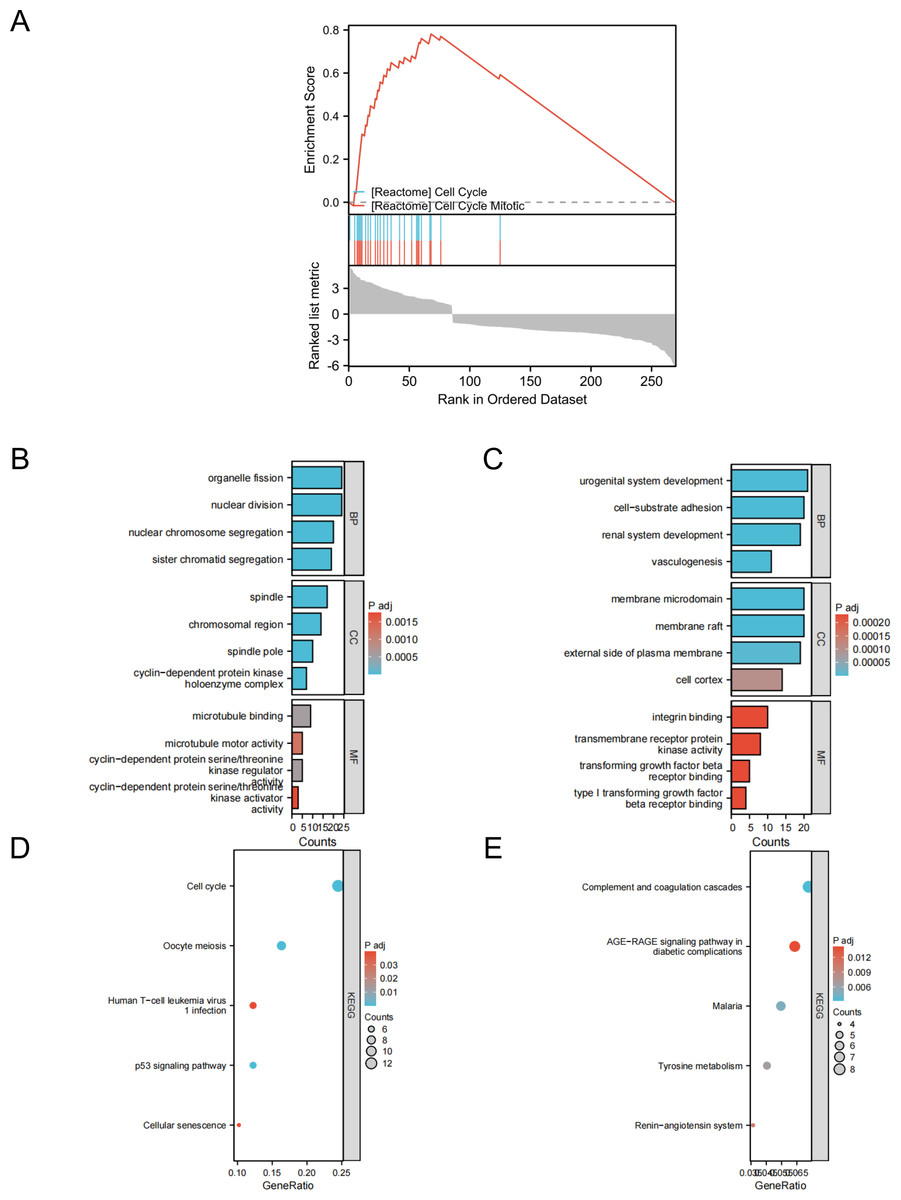
Figure 2: GSEA, GO/KEGG analysis of DEGs.
(A) GASE enrichment analysis; (B) GO analysis of upregulated genes; (C) GO analysis of downregulated genes; (D) KEGG analysis of upregulated genes; (E) KEGG analysis of downregulated genes.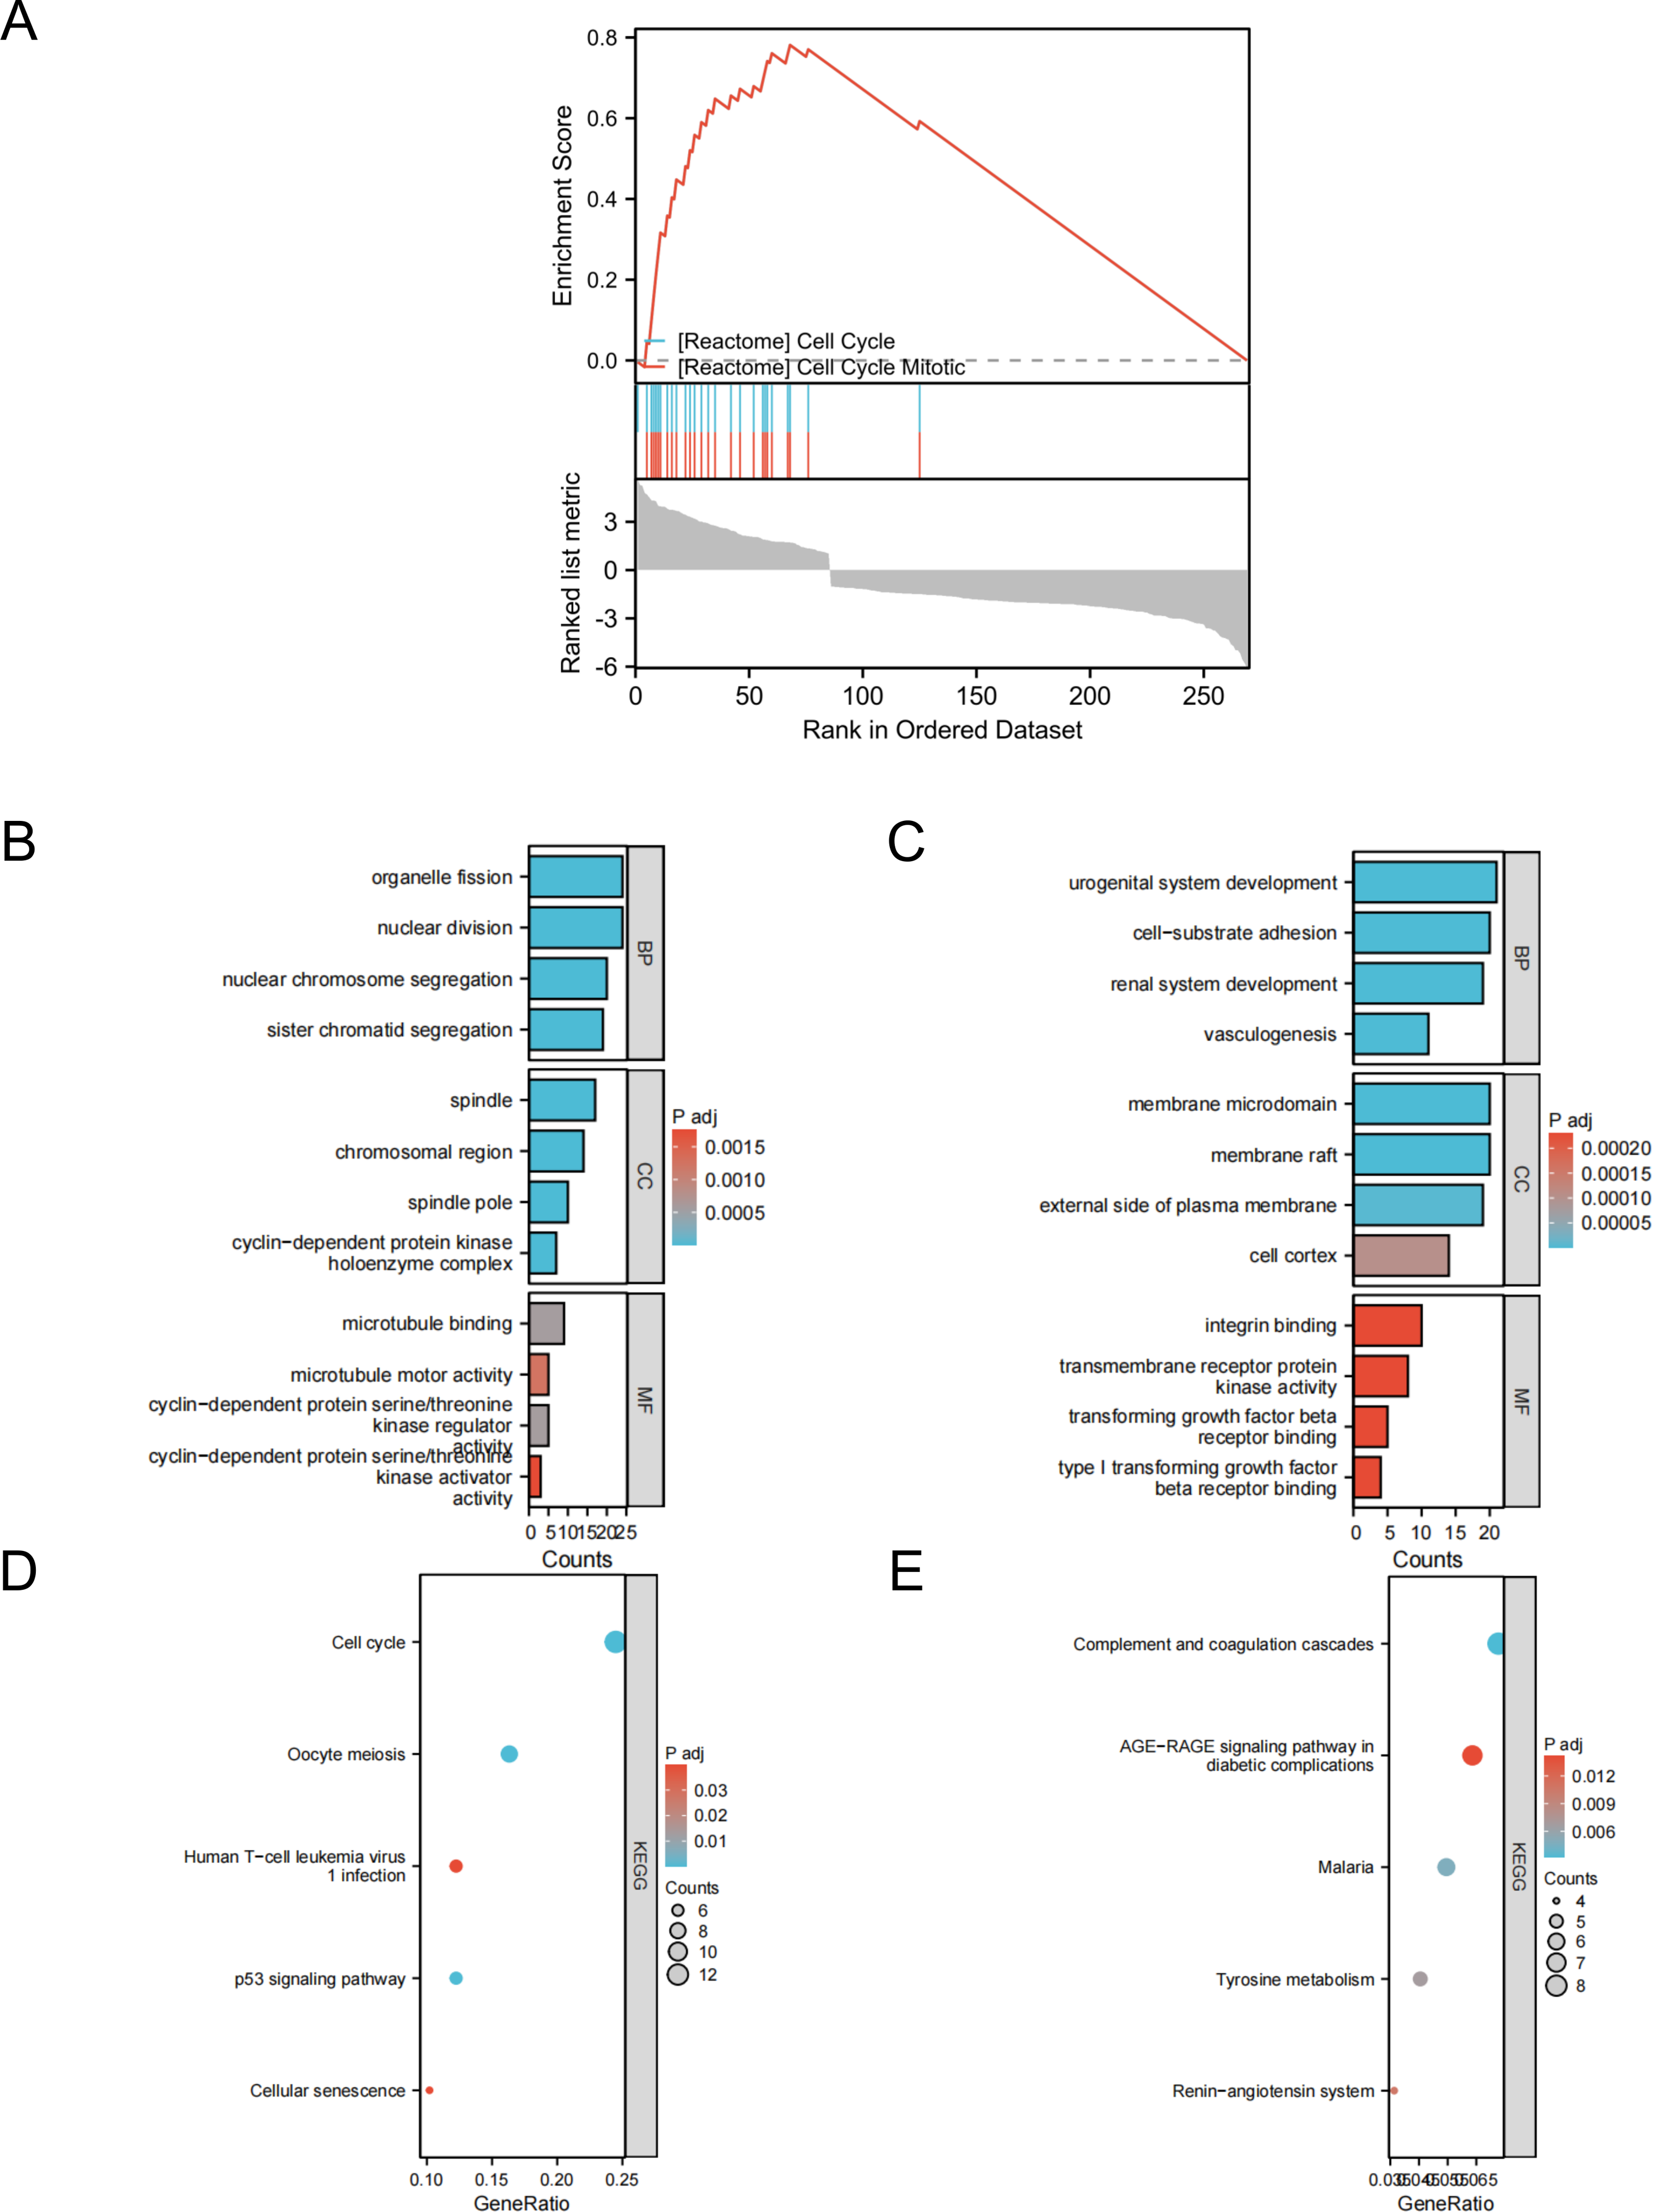
Construction of PPI networks and identification of hub genes
In this step, the STRING database was used to construct a PPI network for the DEGs (Fig. 3). Subsequently, the MCODE plugin was used to identify hub genes within the network. The analysis revealed 32 hub genes with the highest moderate values among upregulated genes and 19 hub genes with the highest moderate values among downregulated genes. These hub genes represent crucial nodes within the network, signifying their potential significance in lung cancer (Fig. 4).
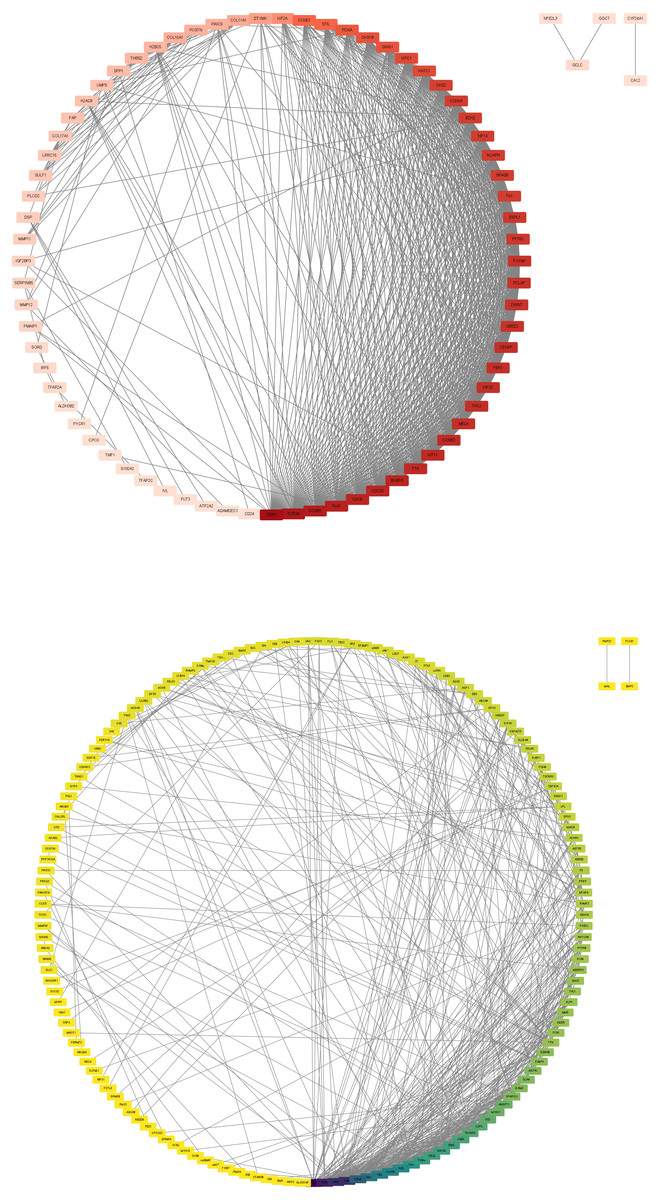
Figure 3: DEG PPI network.
(A) Up-regulated gene PPI network diagram. The darker the red, the higher the degree of upregulation. (B) Down-regulated gene PPI network diagram. The darker the blue, the higher the degree of downregulation.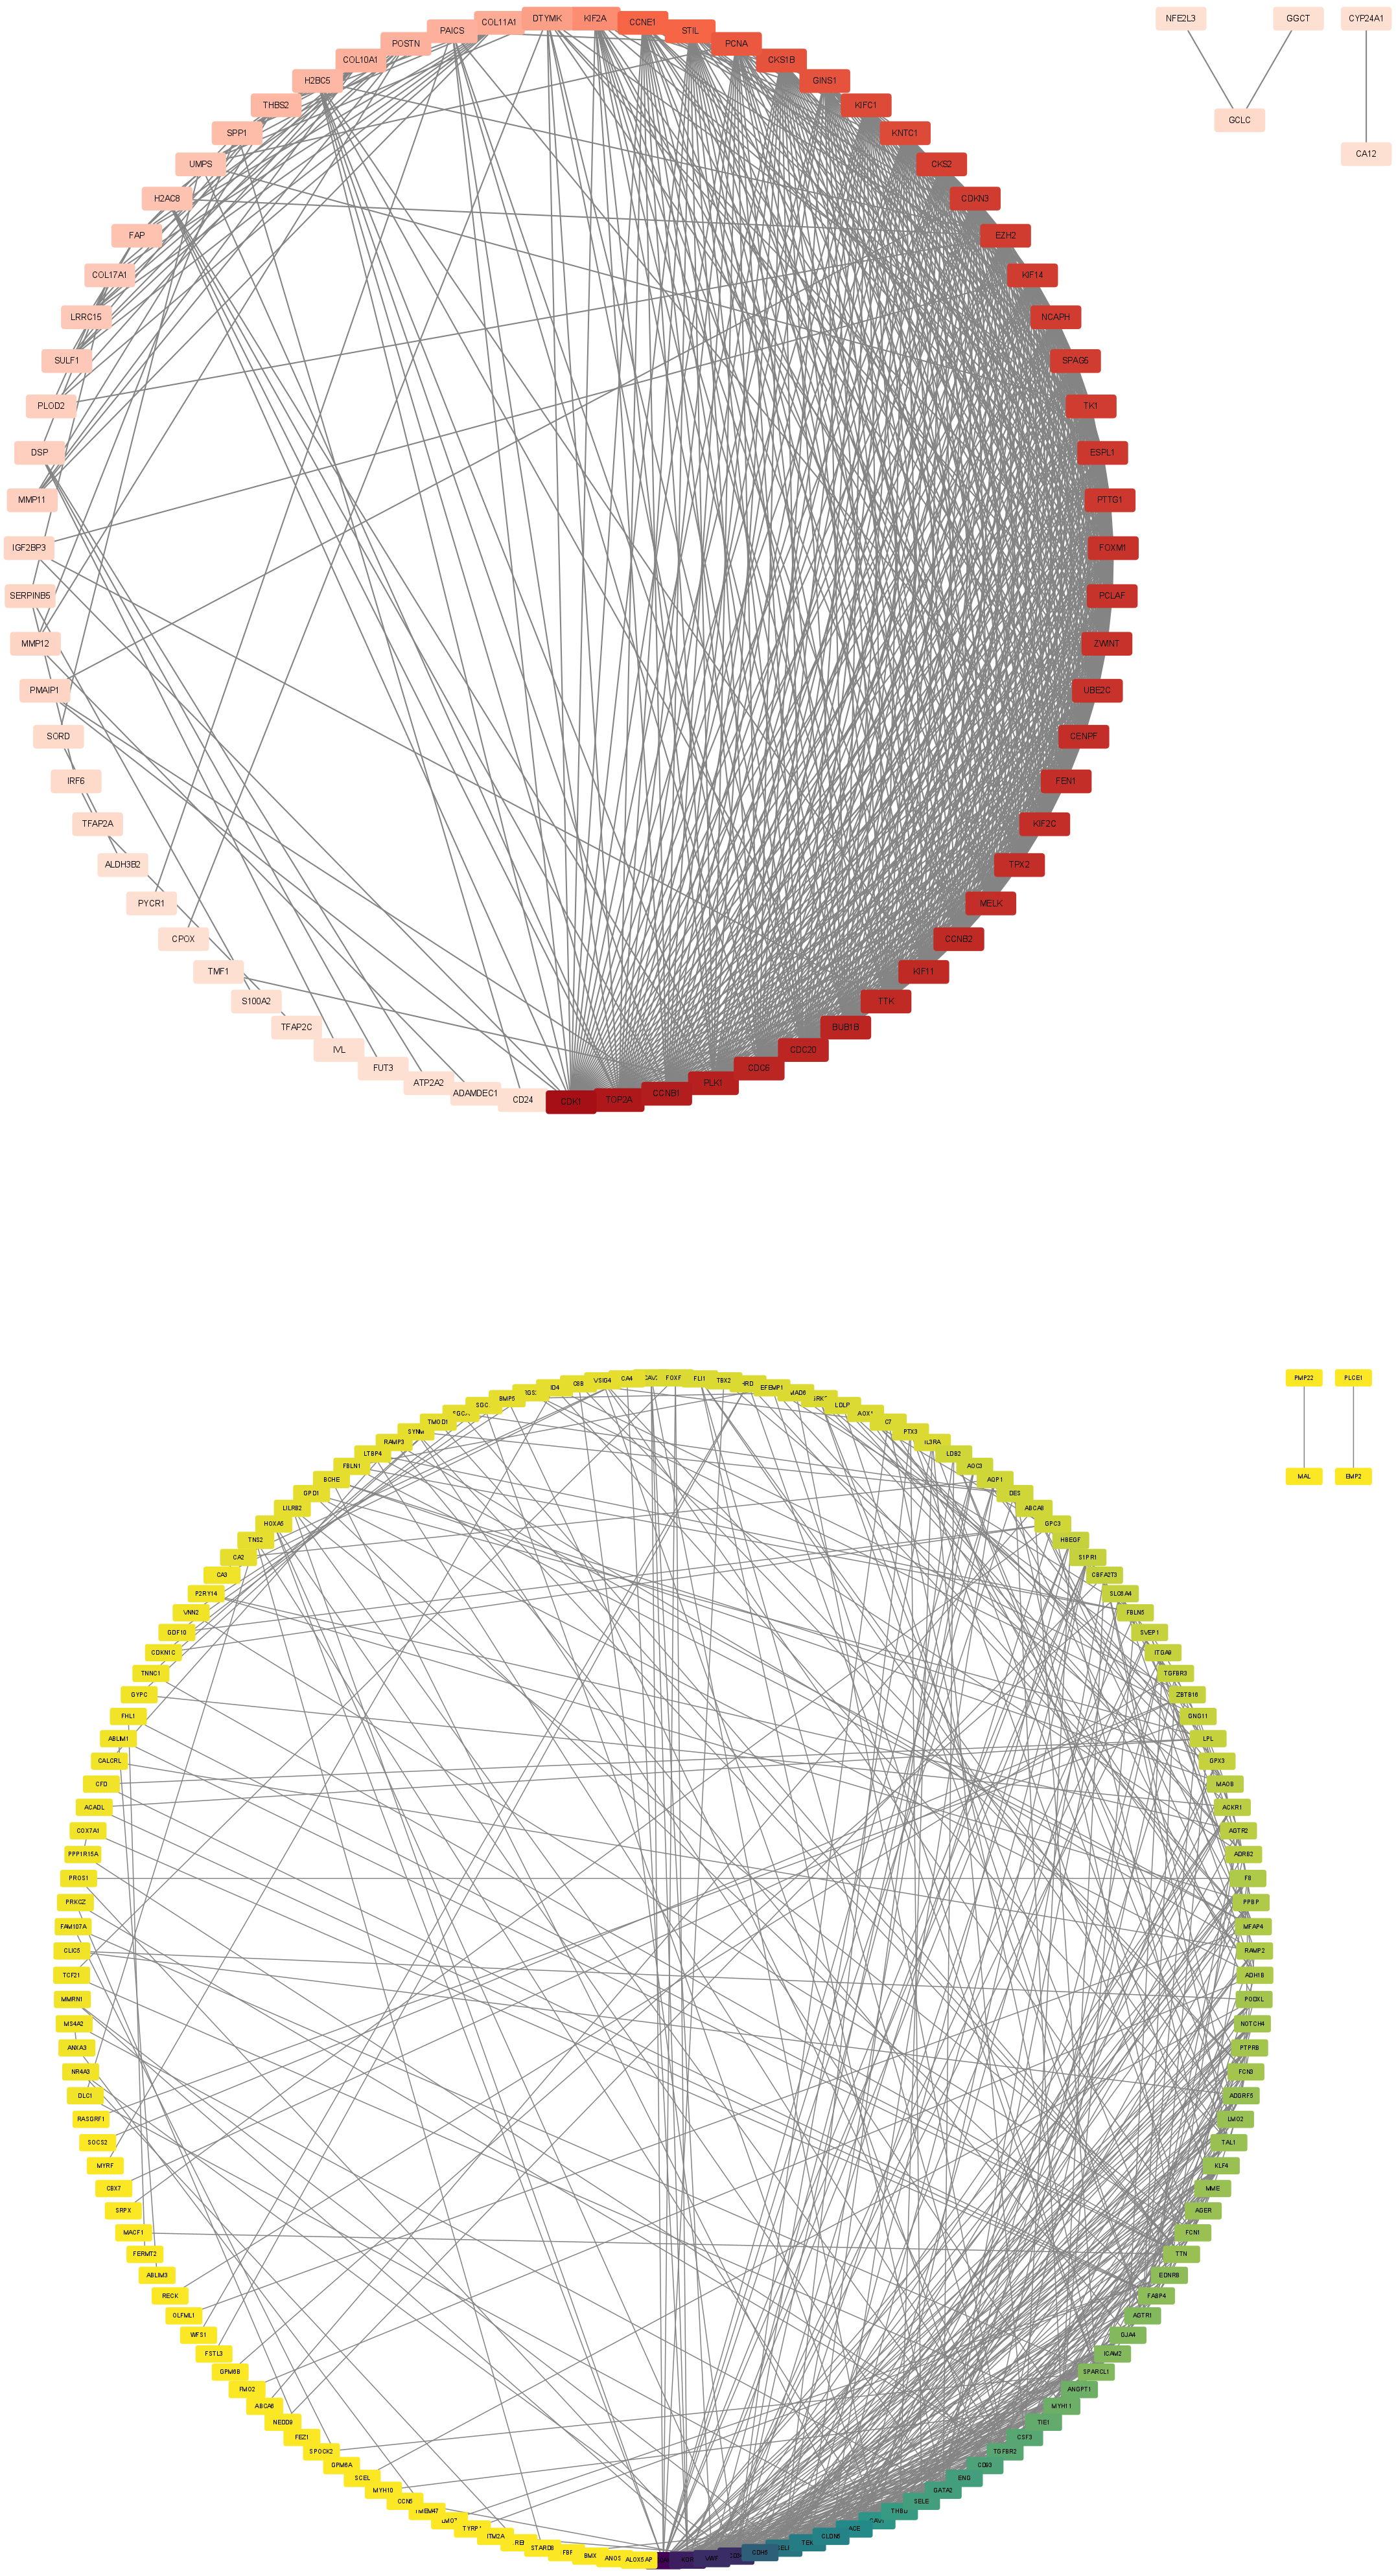
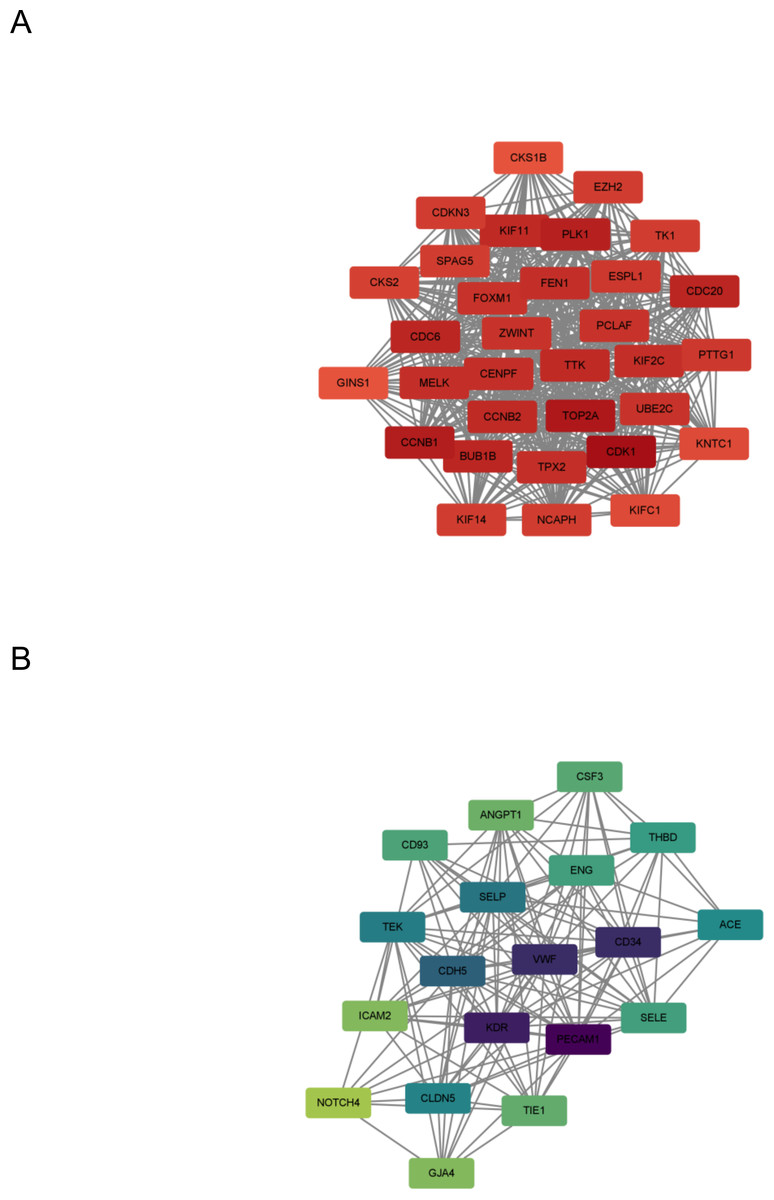
Figure 4: DEG hub gene network.
(A) Up-regulate gene hub gene network diagram. The darker the red, the higher the degree of upregulation. (B) Down-regulated gene hub gene network diagram. The darker the blue, the higher the degree of downregulation.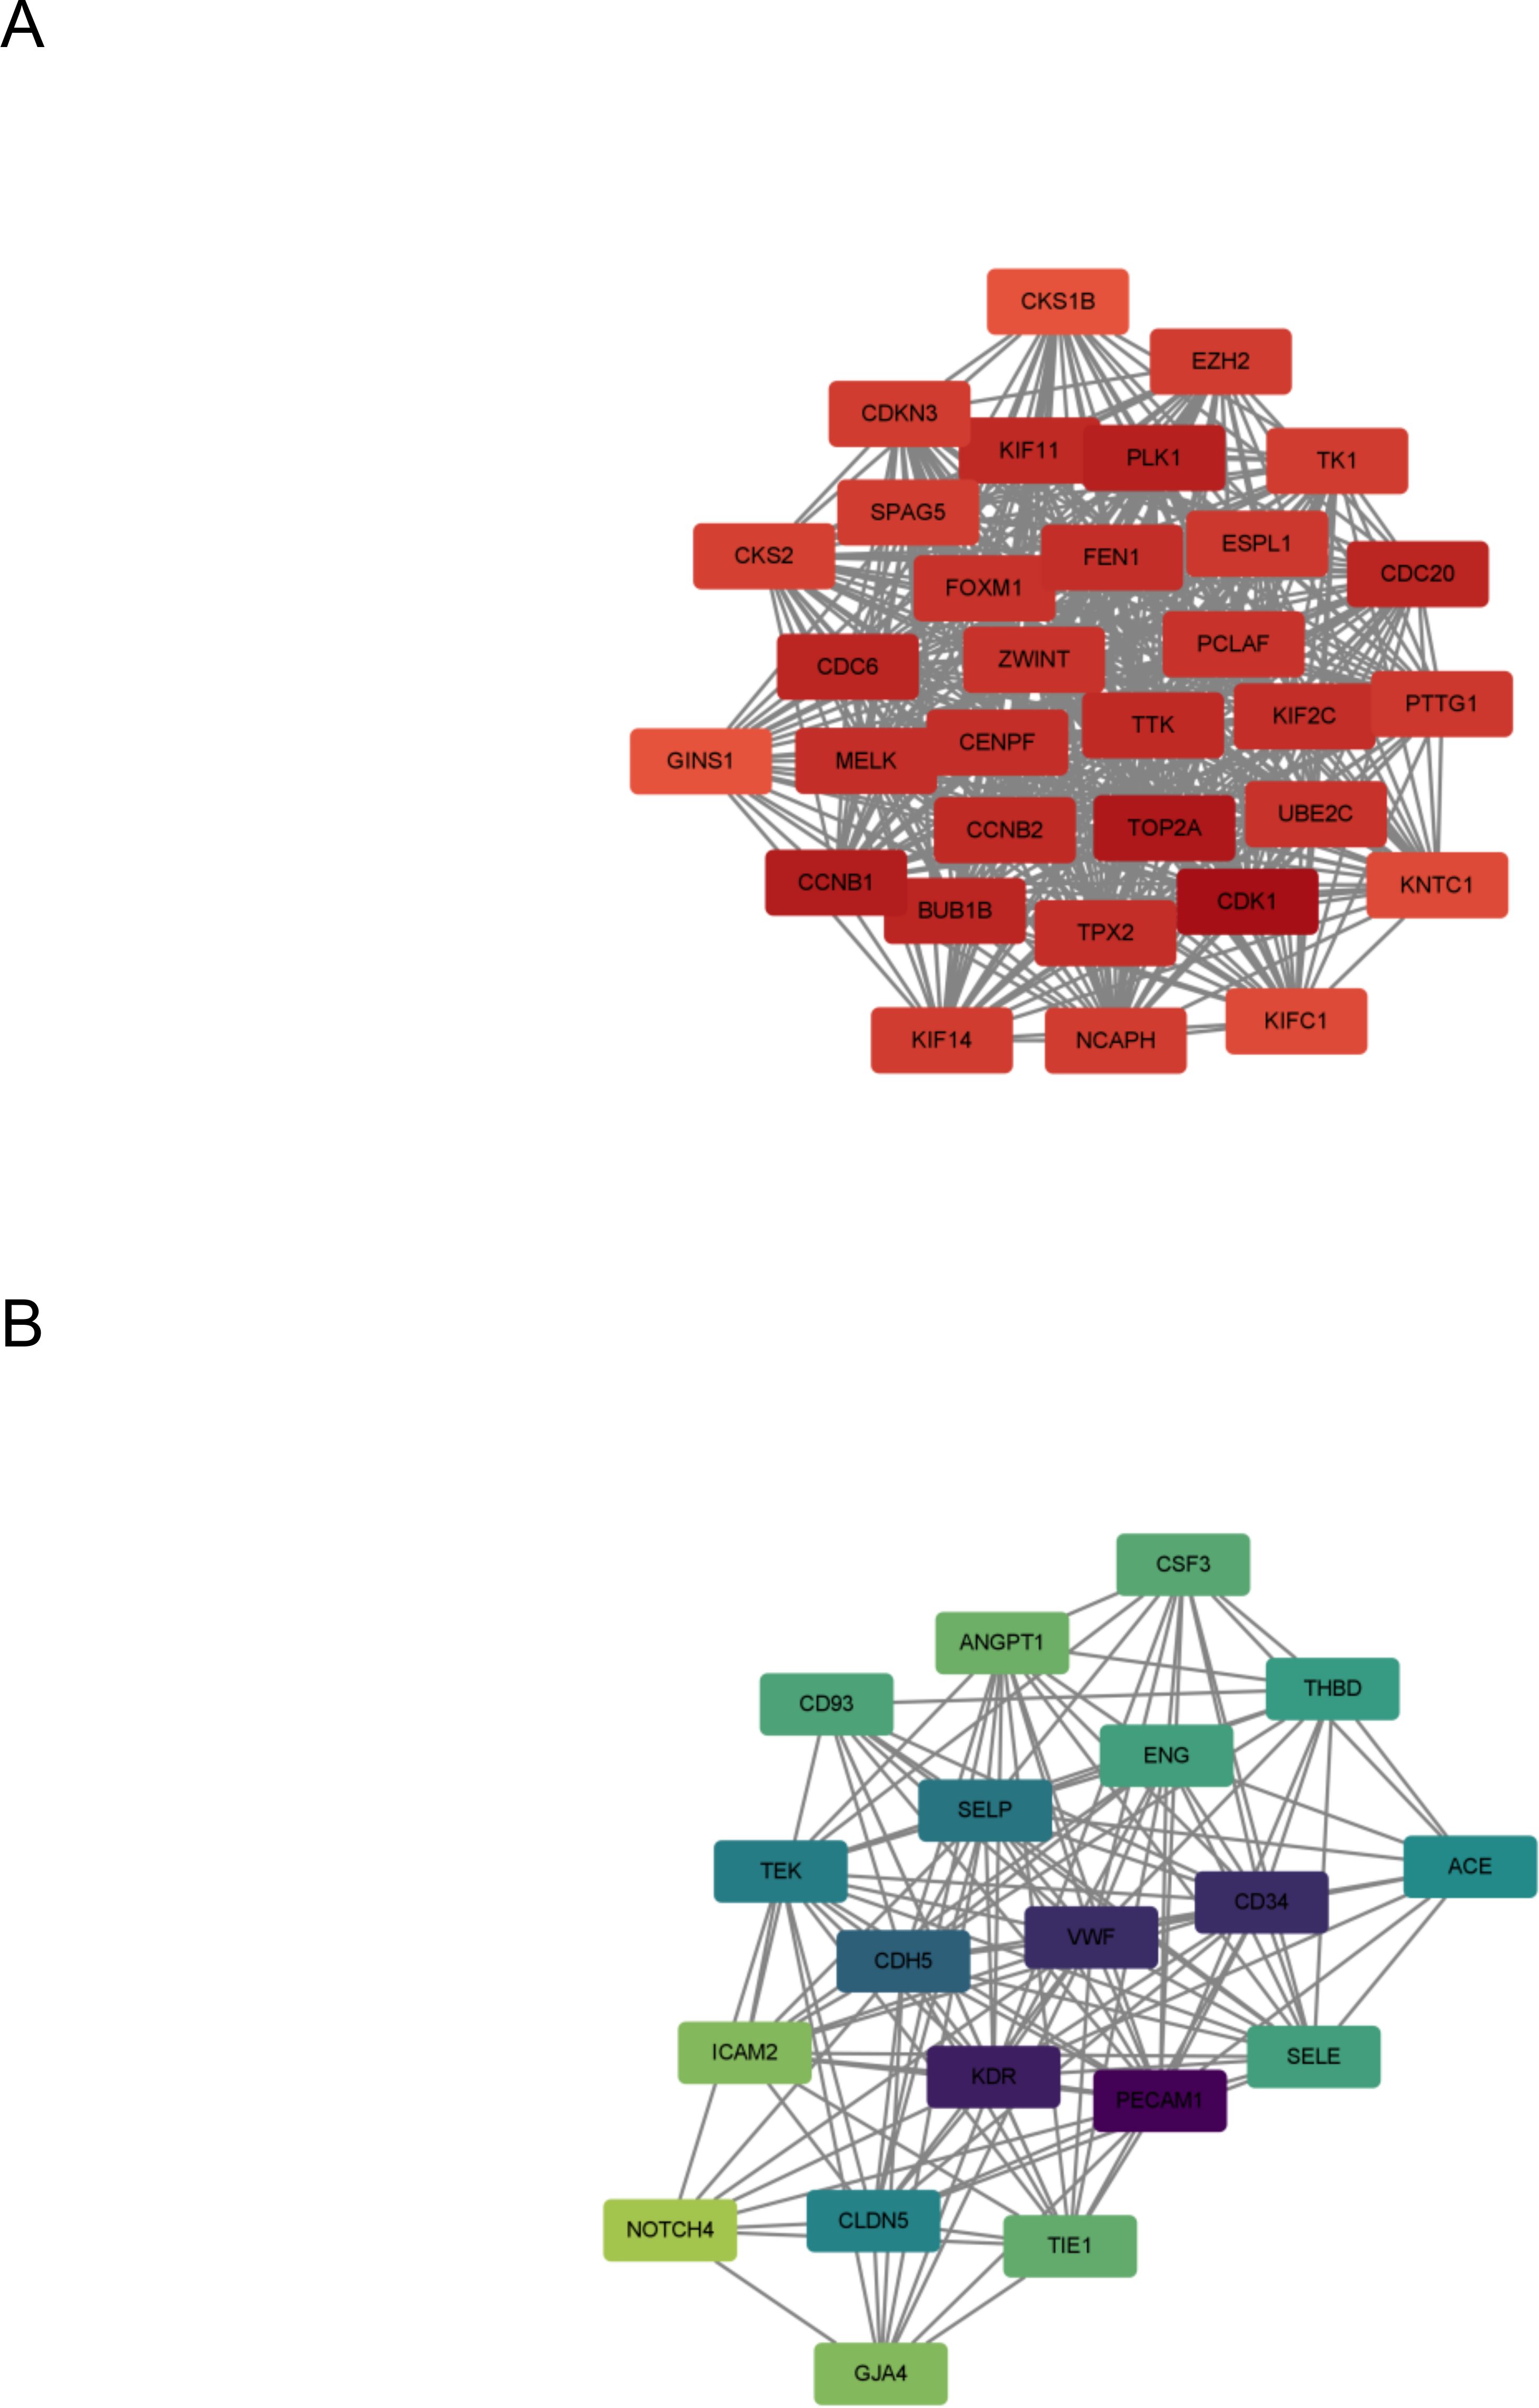
Machine learning algorithms pick the target gene
Hub genes were identified using a two-step process employing random forest and LASSO regression analyses. In the random forest analysis, the top seven characteristic variables with the highest importance among all hub genes were BUB1B, TEK, CDC6, TOP2A, KIF14, CENPF, PLK1. Notably, among all characteristic variables, BUB1B emerged as the most important contributing gene.
LASSO regression analysis identified the best characteristic genes among all hub genes, including: BUB1B, FOXM1, CENPF, KNTC1, PLK1, ZWINT, CD93, and SELE. The intersection of these analyses revealed that the target genes were BUB1B, CENPF, and PLK1. These genes are pivotal candidates with significant roles in the context of the studied biological systems, particularly in lung cancer (Fig. 5).
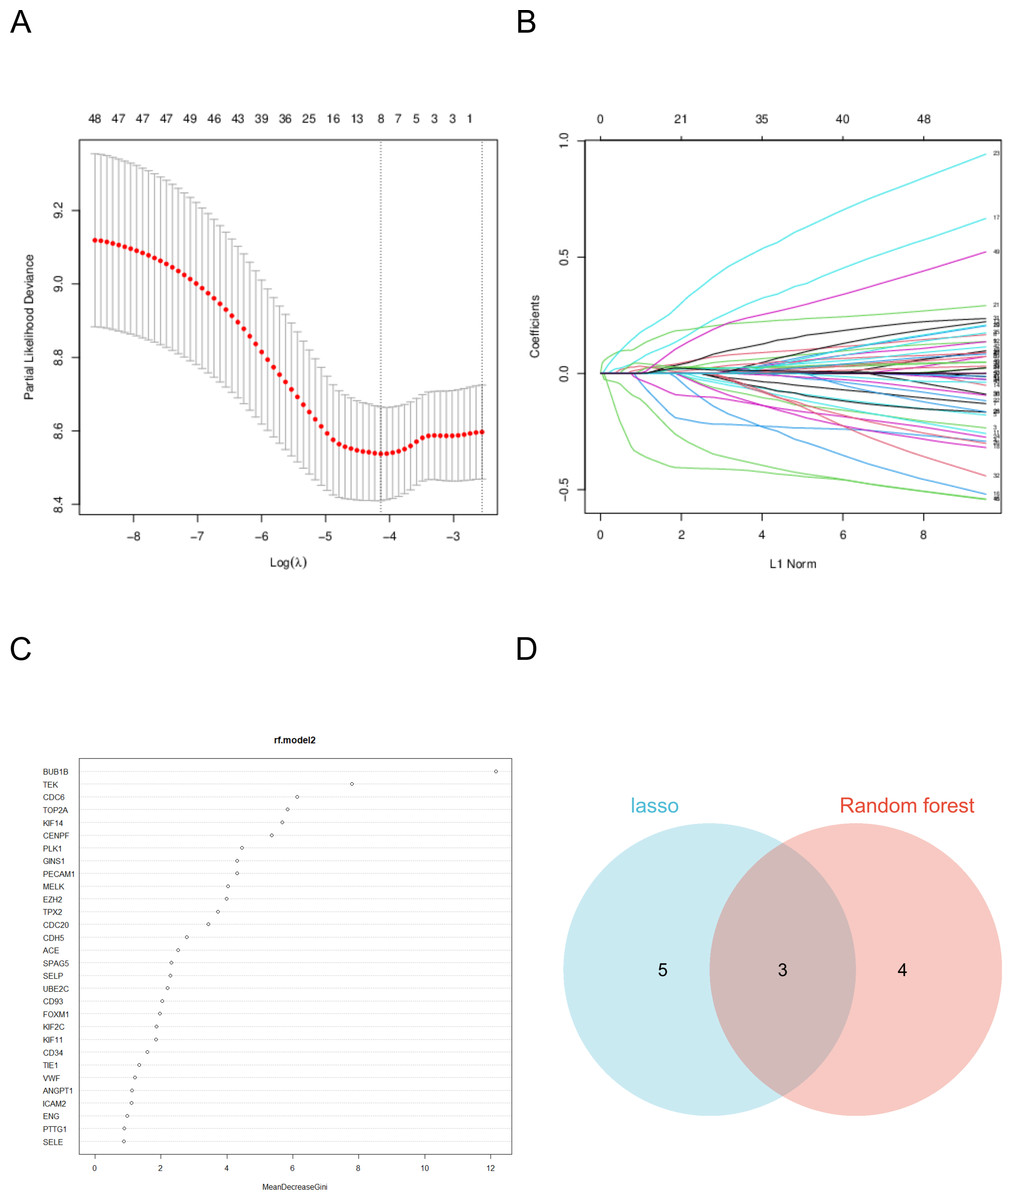
Figure 5: Machine learning algorithm selects the target gene.
(A) The coefficient of LASSO analysis varies with λ parameters. (B) LASSO analyzes the trend of λ corresponding to the number of variables. (C) Ranking of important features in random forest model. (D) The two analyses intersected.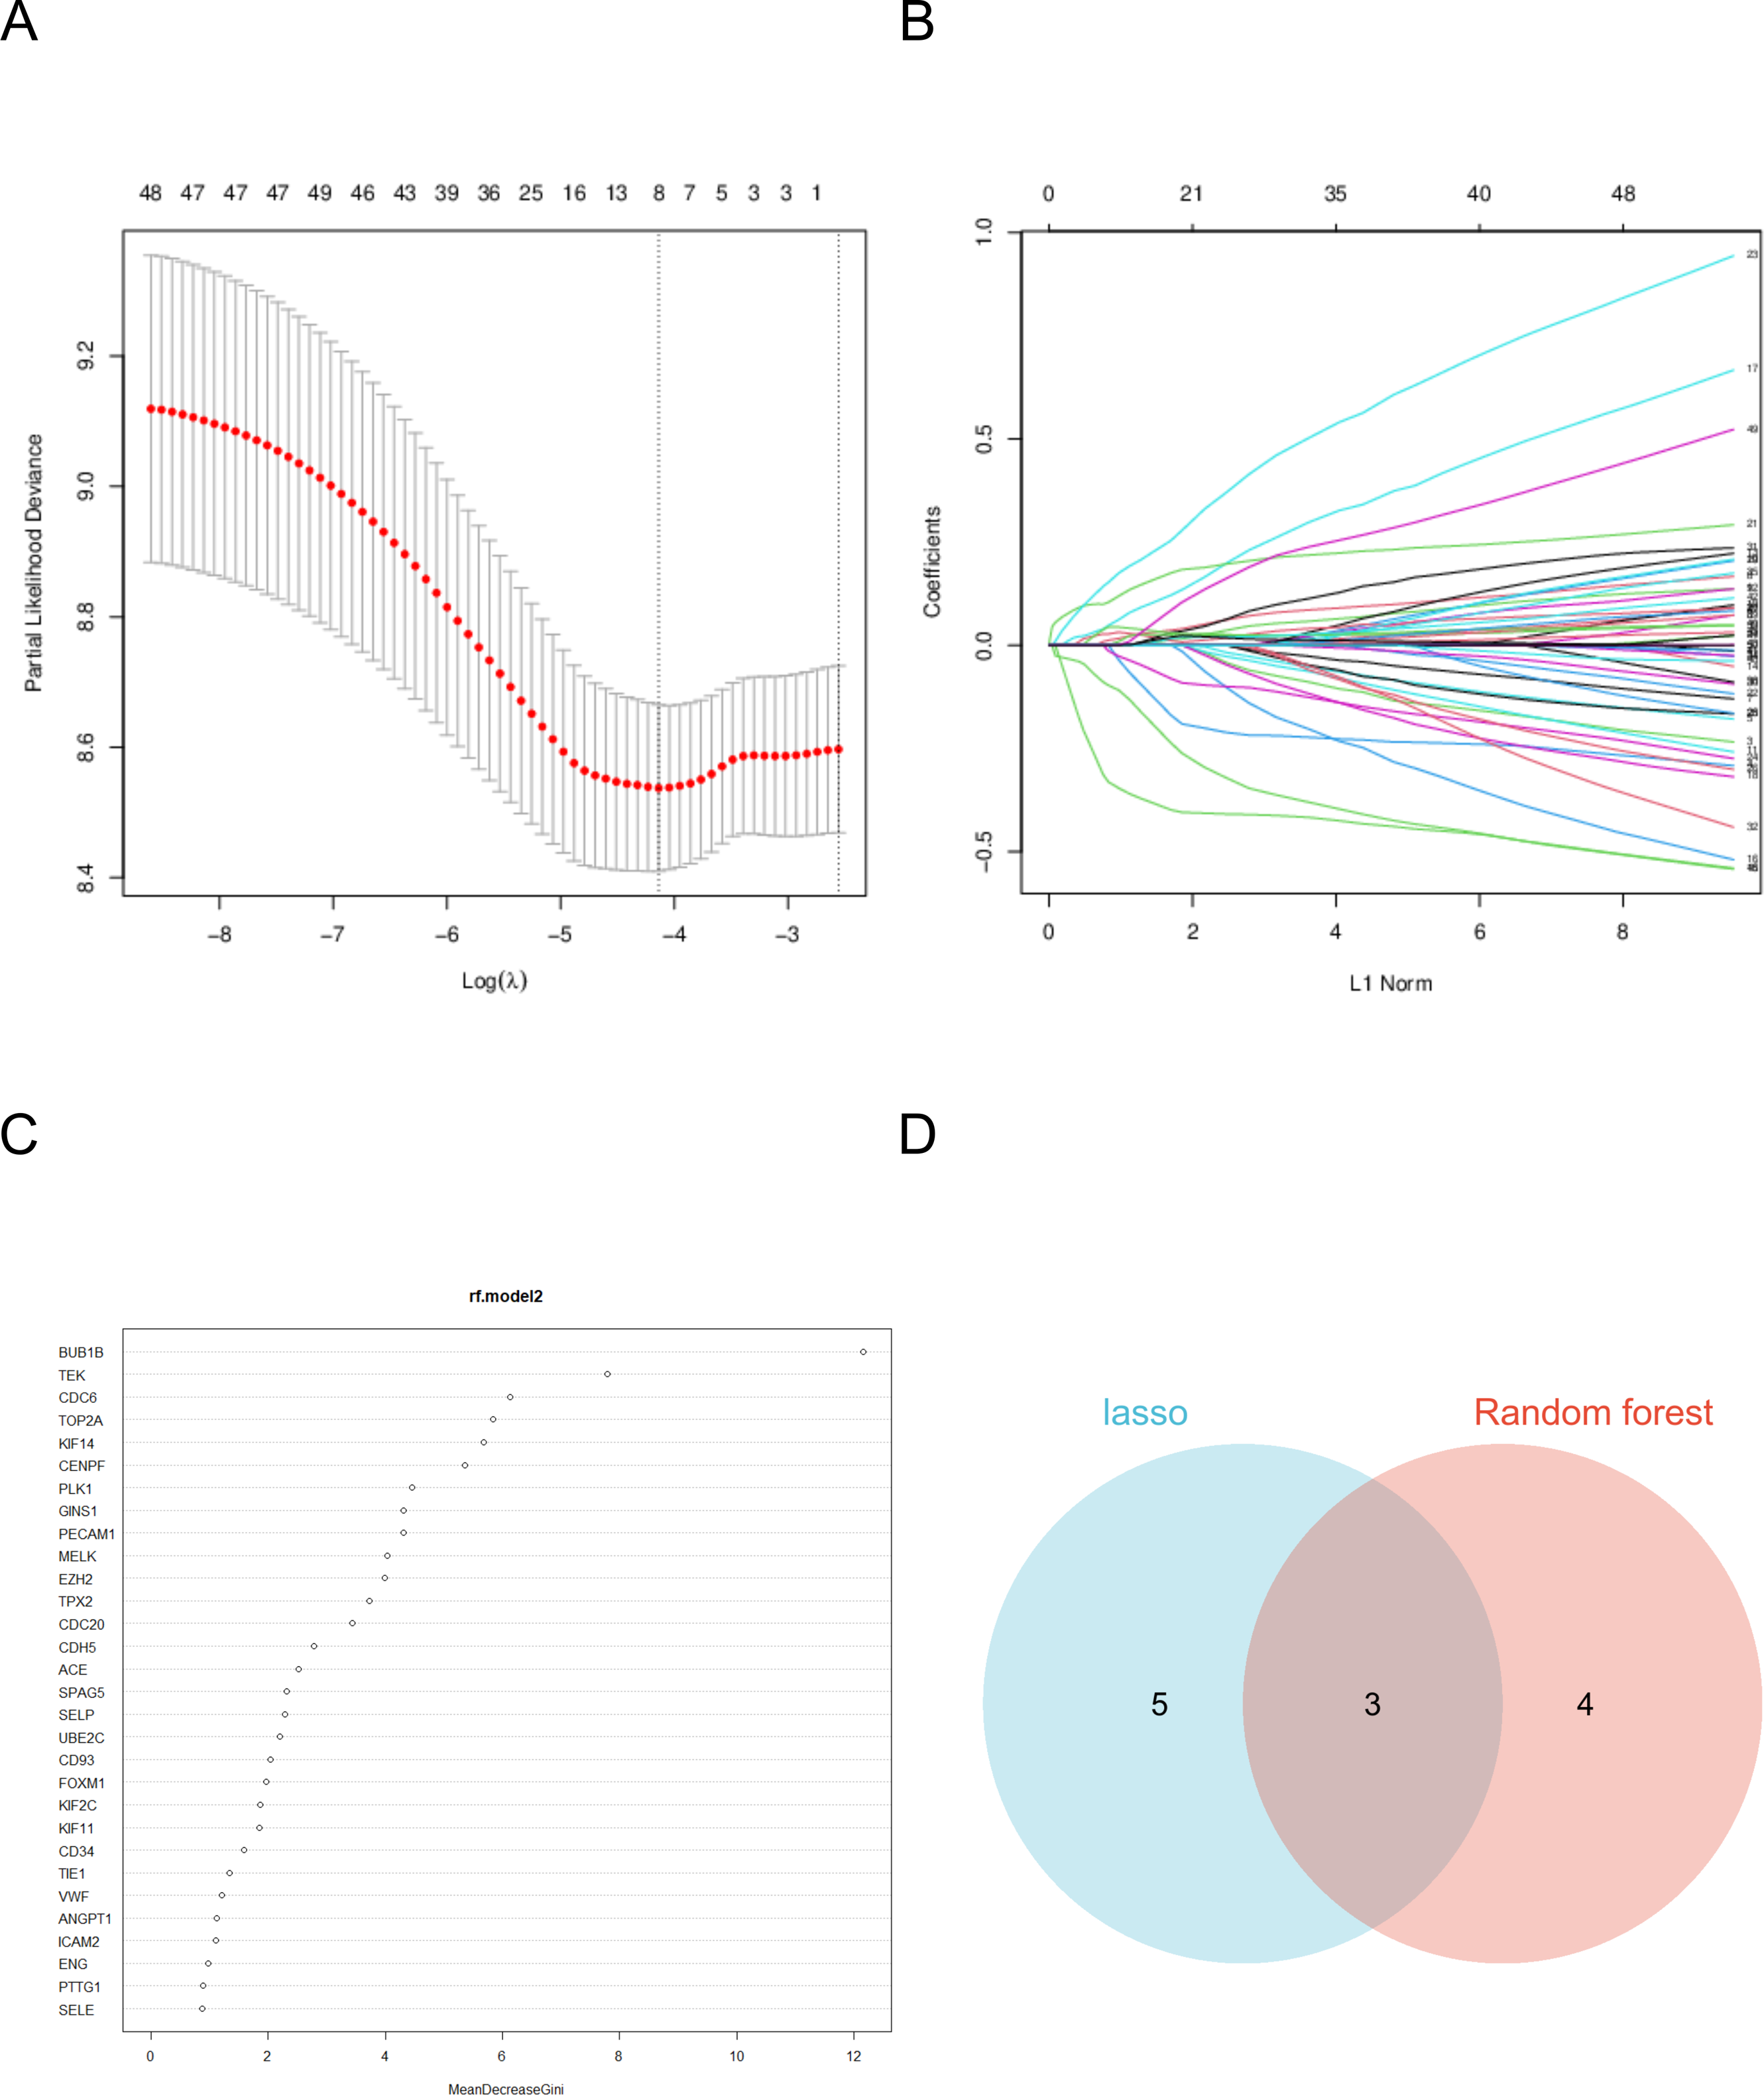
As a cell cycle checkpoint kinase, BUB1B plays a key role in maintaining chromosomal stability, and its abnormal expression may cause chromosomal instability, which in turn drives tumorigenesis and progression (Yu et al., 2024). The protein encoded by CENPF plays an important role in chromosome division, and its overexpression is associated with increased aggressiveness and poor prognosis in various cancers (Pinto et al., 2023; Shukuya et al., 2016). PLK1 is an important cell cycle regulator and its overexpression in tumor cells is often closely associated with rapid proliferation and tumor malignancy (Shukuya et al., 2016).
TCGA and qPCR experiments were used to verify the three target genes
In this study, we retrieved and organized RNA-seq data from TCGA-LUAD (lung adenocarcinoma) project using spliced transcript alignment to a reference (STAR) pipeline available in the TCGA database (https://portal.gdc.cancer.gov). Data were extracted in Transcripts Per Million (TPM) format. Subsequently, we used R language software (version 4.2.1; R Core Team, 2022) to analyze the expression levels, survival curves, and ROC curves of the three target genes:BUB1B, CENPF and PLK1 in lung adenocarcinoma. Additionally, whole blood samples were collected from patients with lung cancer and from individuals undergoing normal physical examinations at our hospital for qPCR experimental verification. This comprehensive analysis offers insights into the expression patterns and potential diagnostic and prognostic values of these genes in lung adenocarcinomas (Figs. 6 and 7).
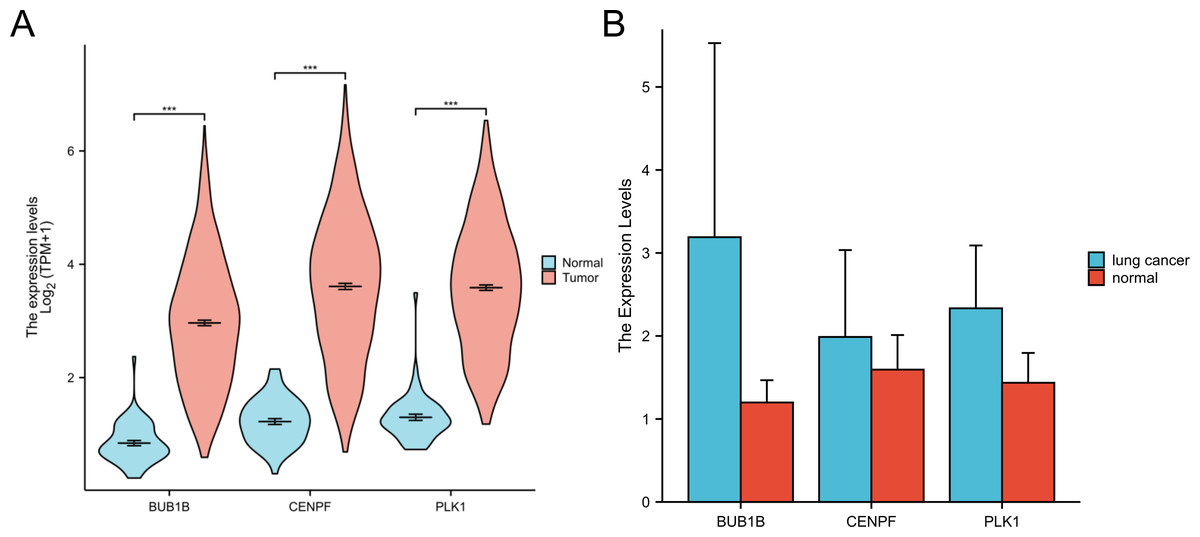
Figure 6: Expression of three target genes BUB1B, CENPF and PLK1 in lung adenocarcinoma.
(A) The TCGA database were used to verify the three target genes; (B) qPCR experiments were used to verify the three target genes.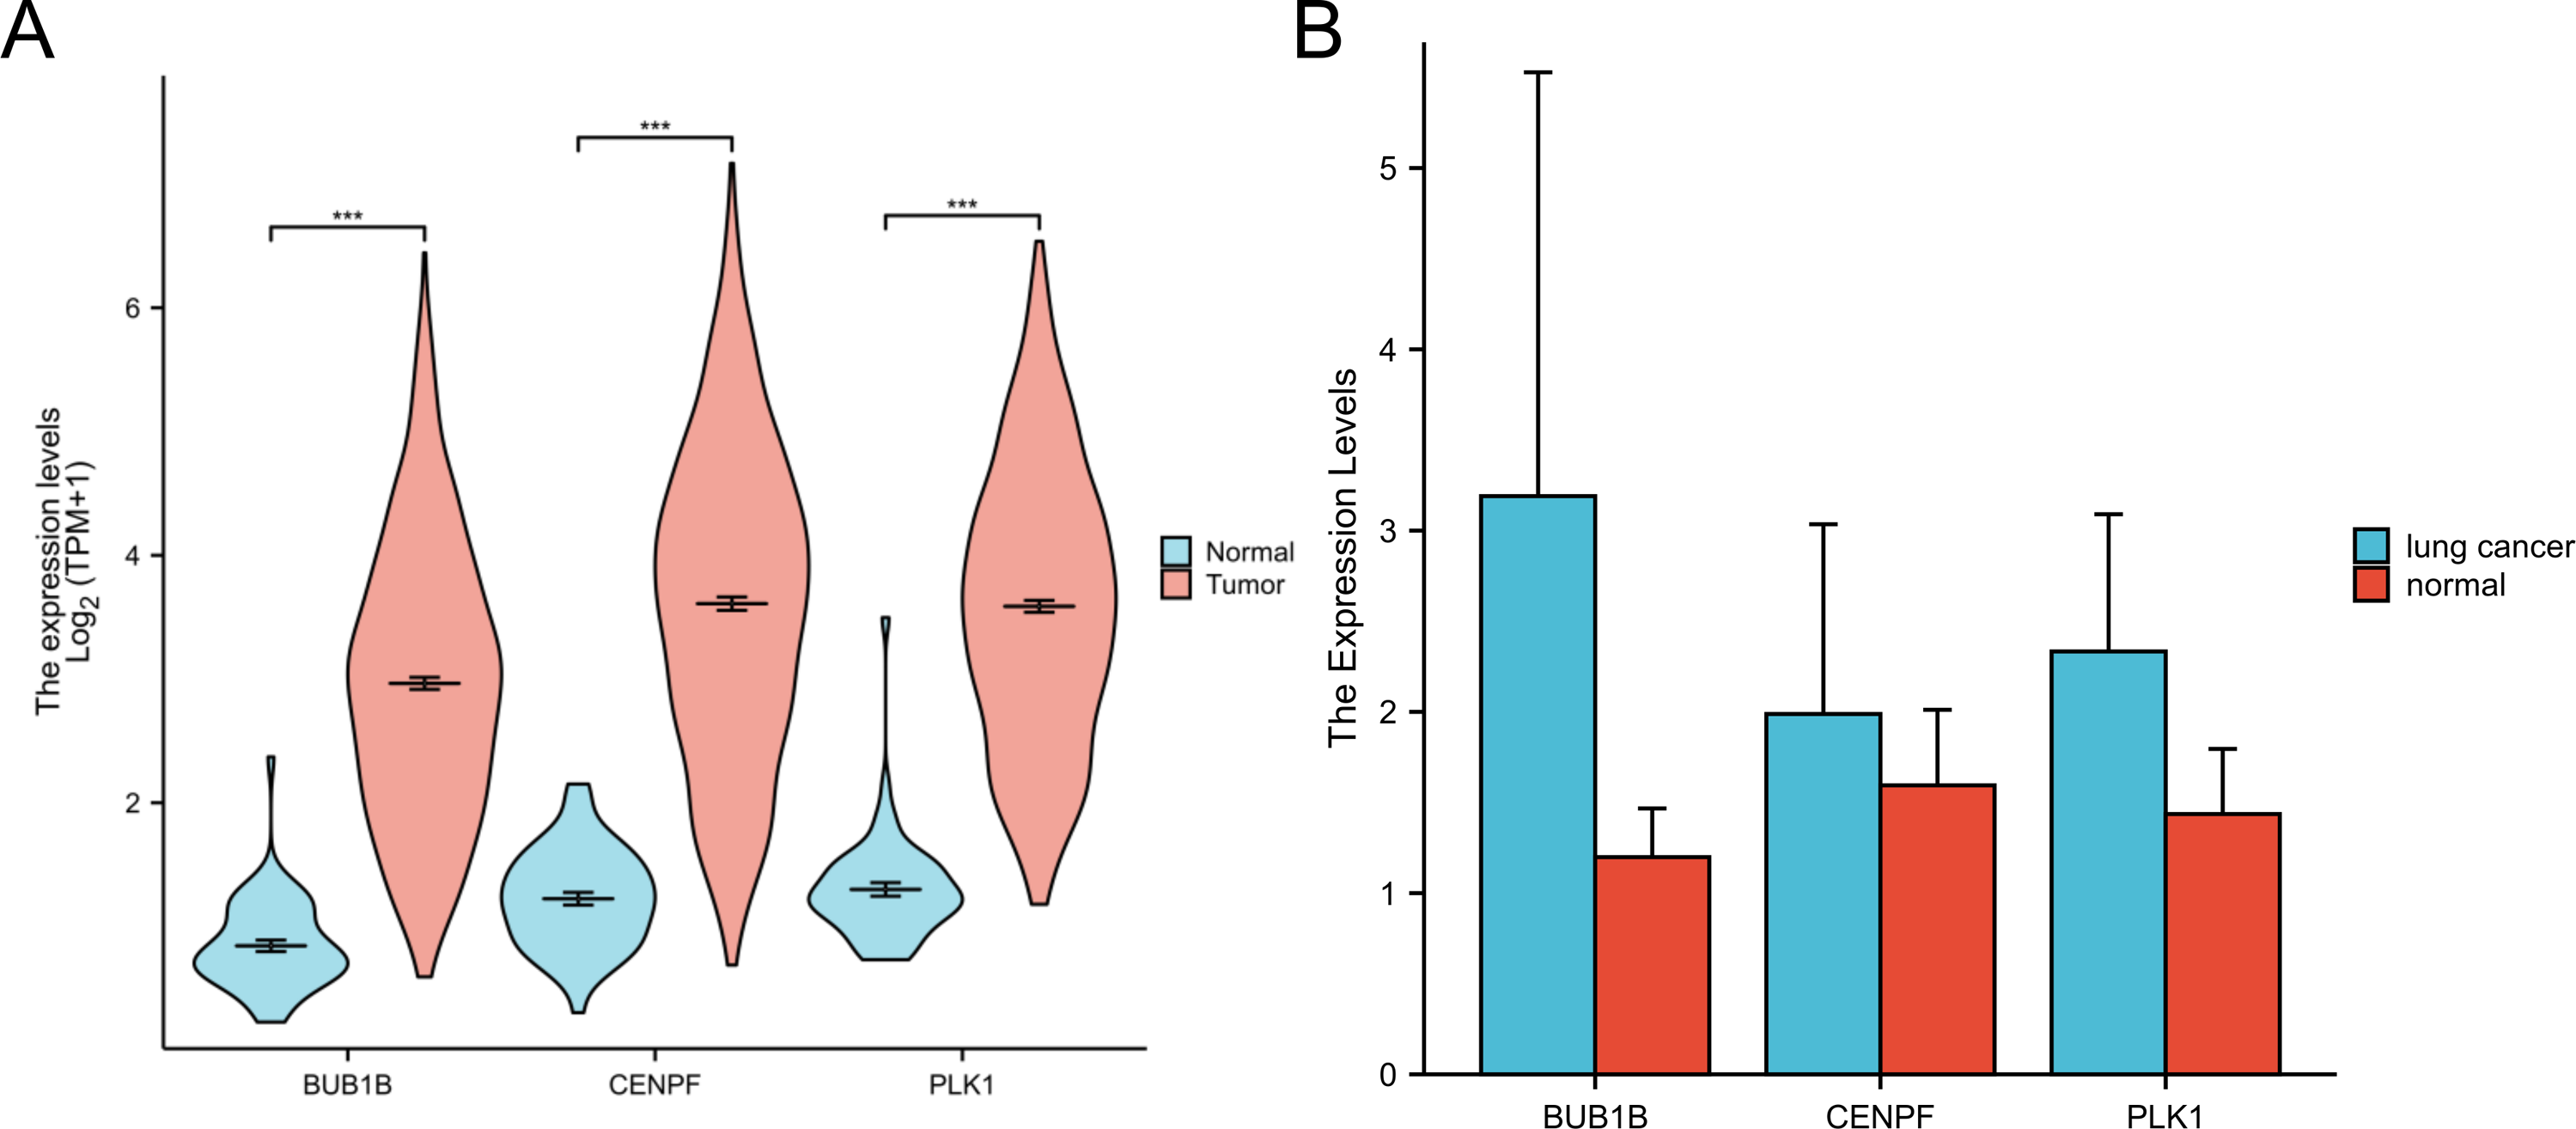
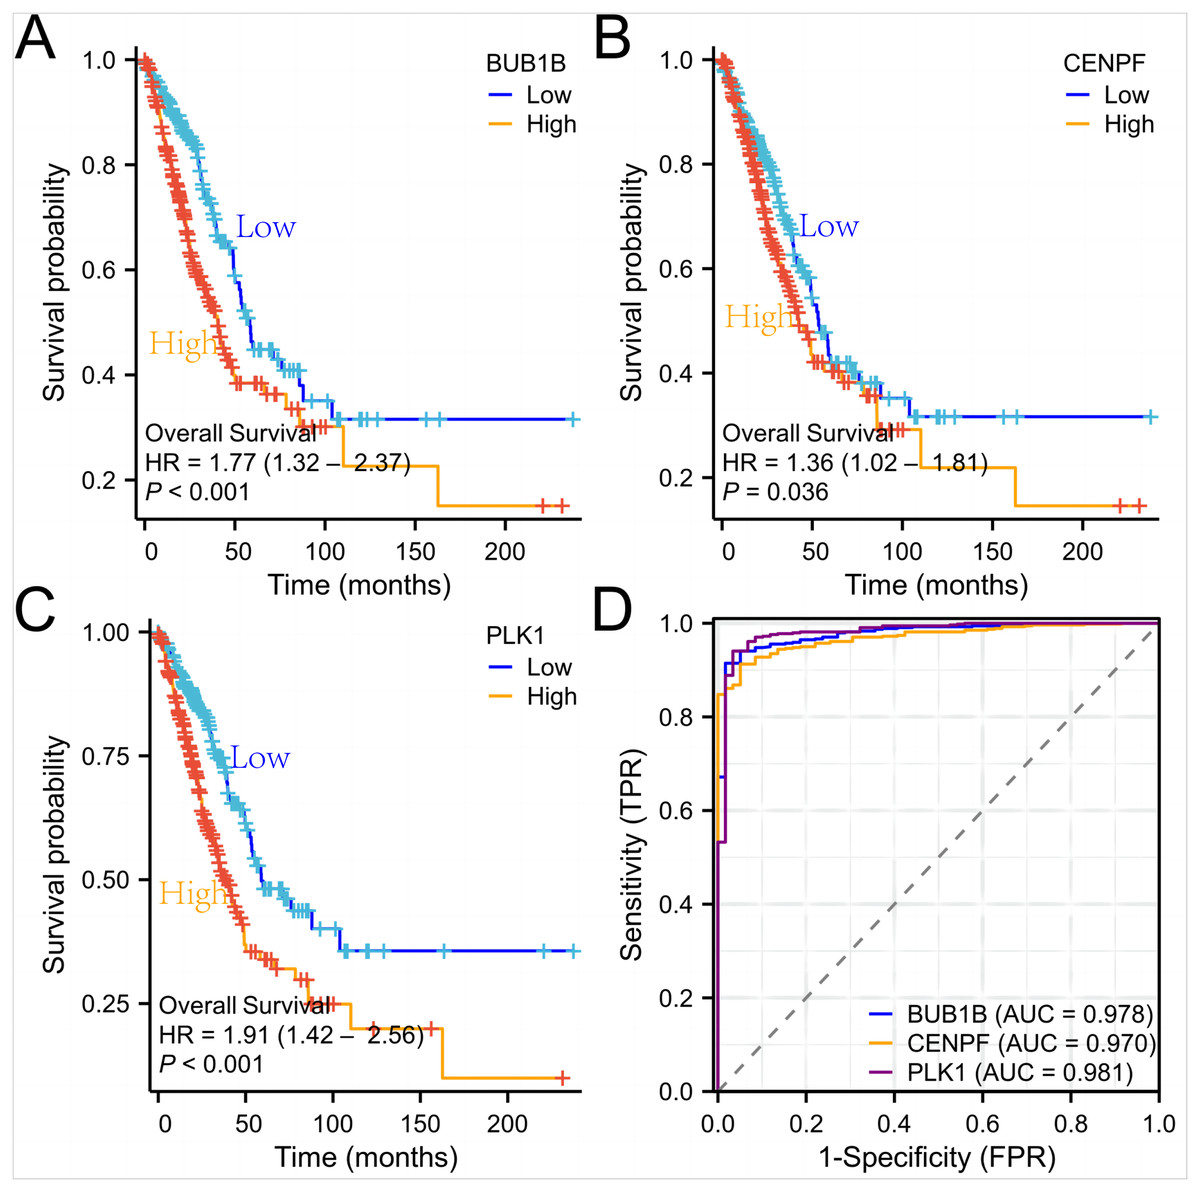
Figure 7: Survival curves and ROC curves of the three target genes.
(A, B, C) Survival curves of the three genes in lung adenocarcinoma; (D) ROC curves of the three genes in lung adenocarcinoma.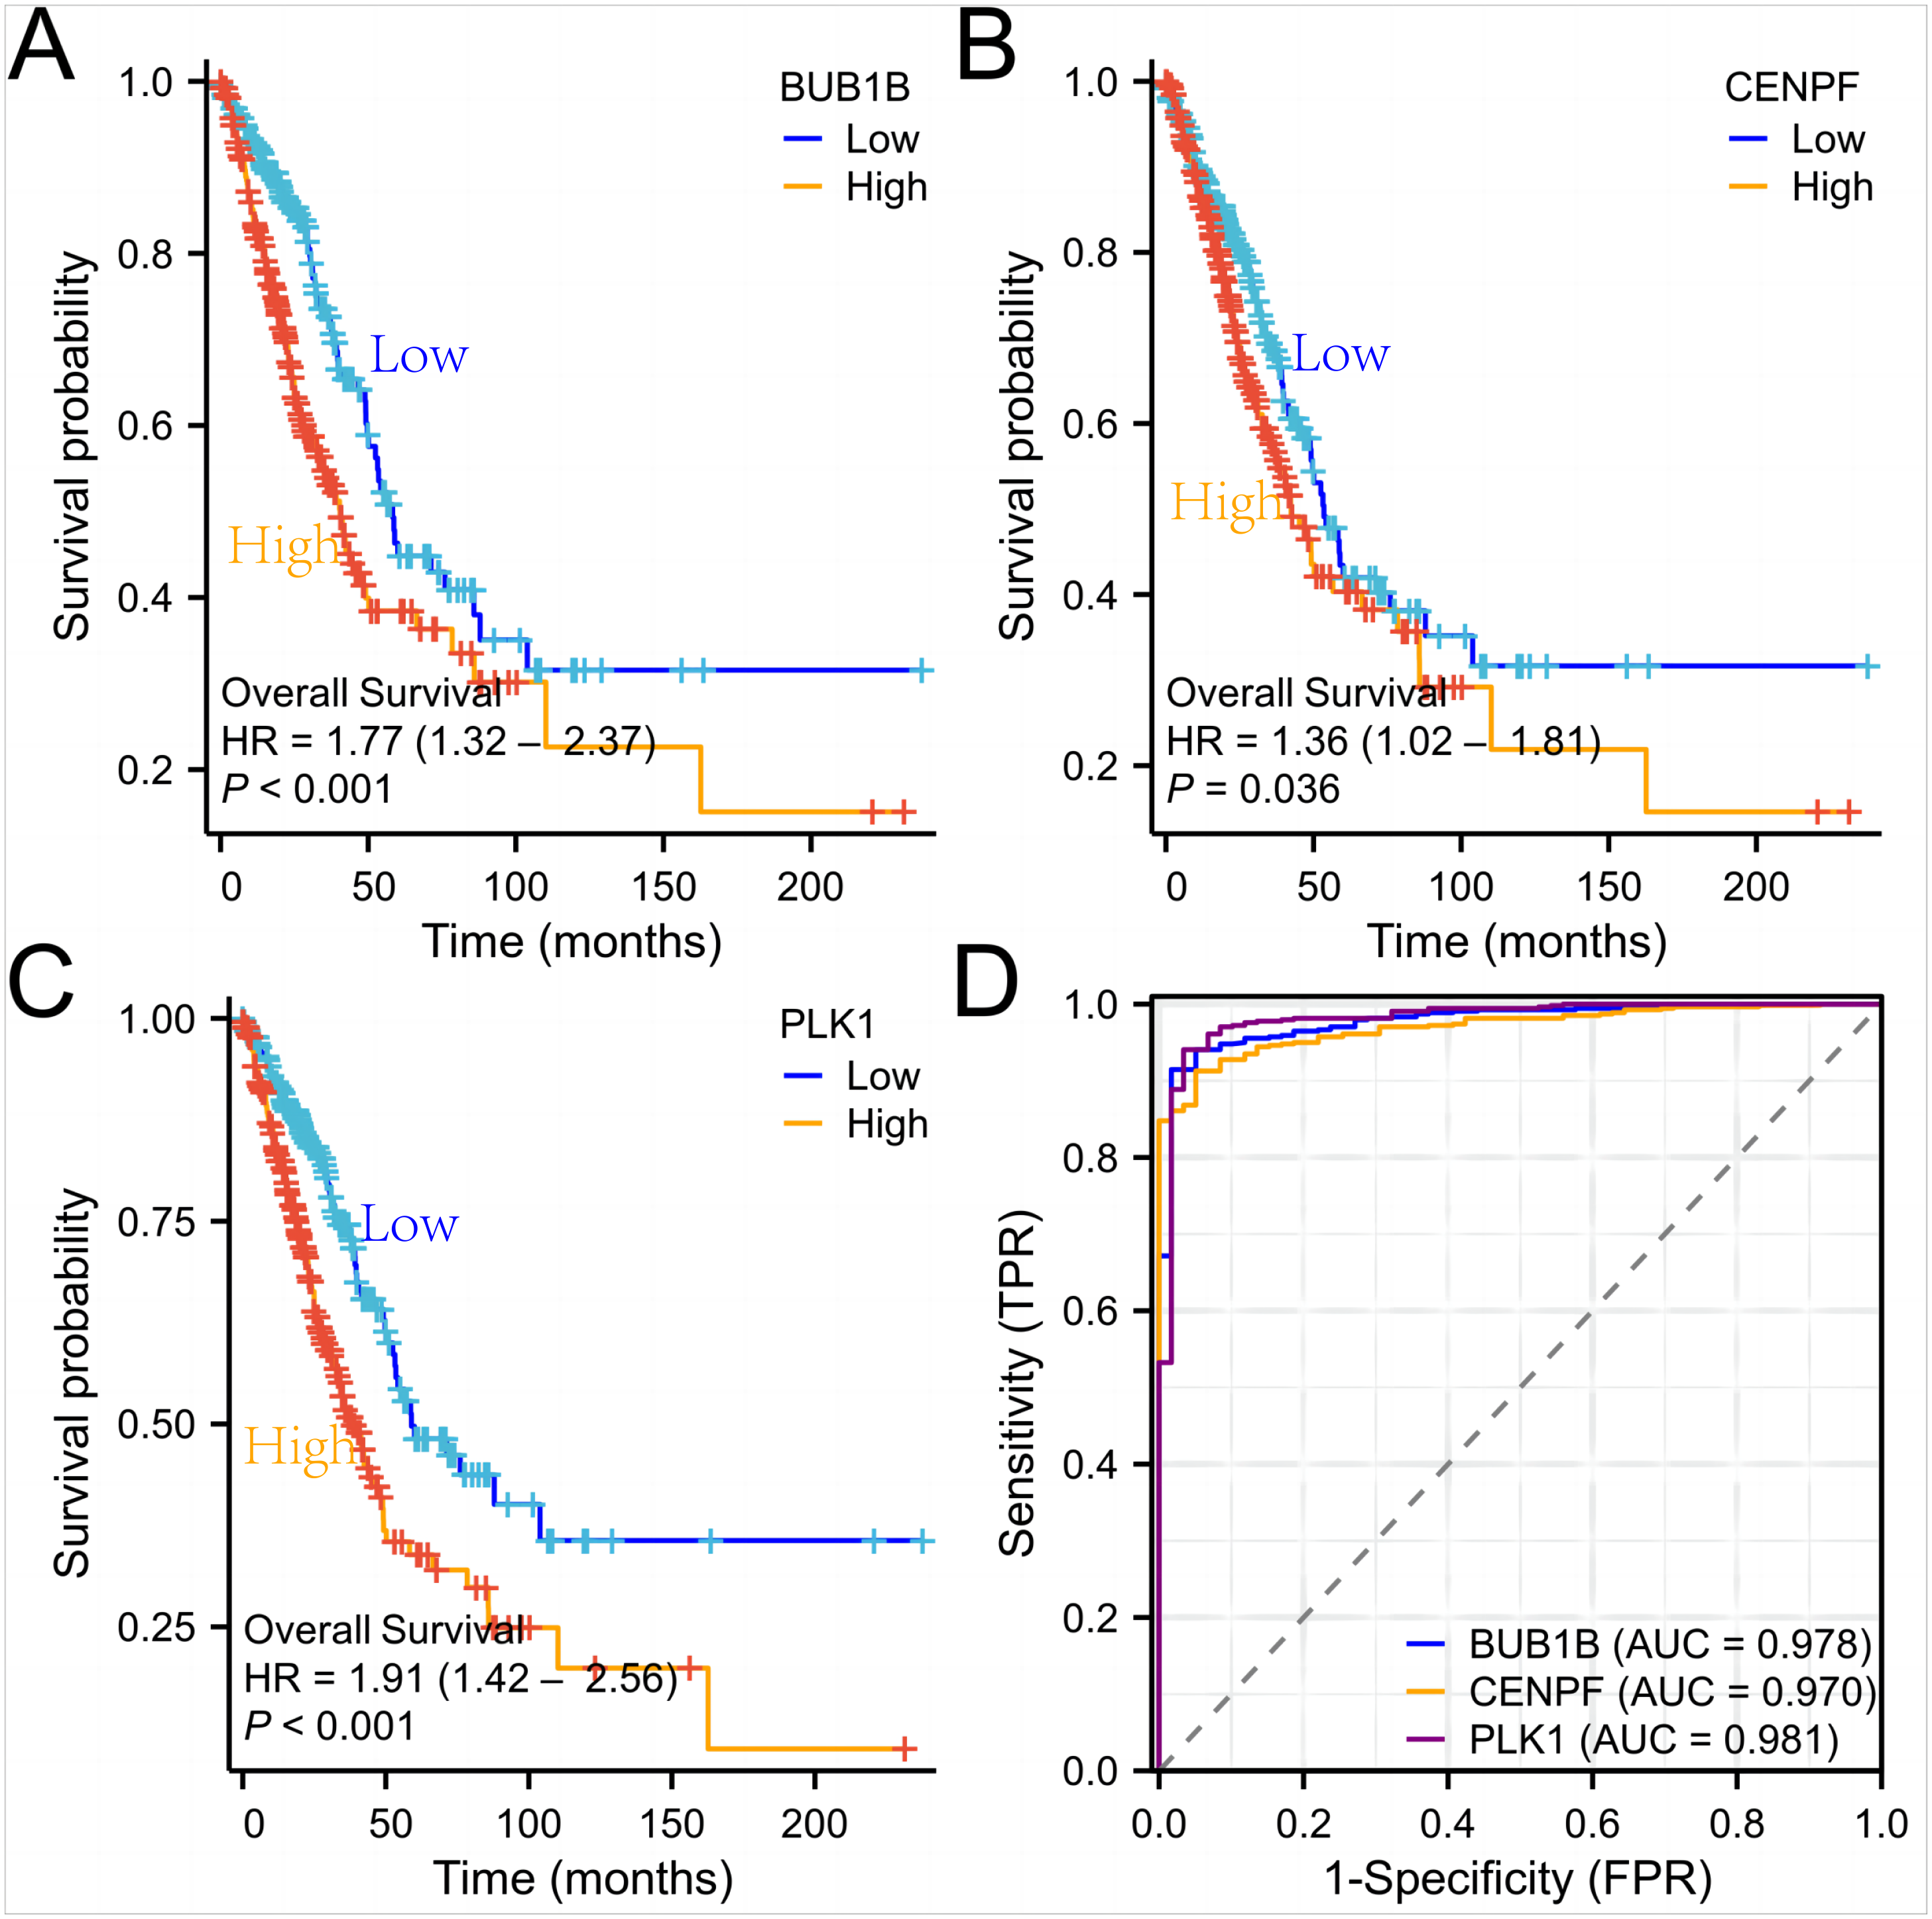
Infiltration analysis of immune cells
The CIBERSORT algorithm was applied to the GSE18842 dataset, and correlation analysis identified significant associations between BUB1B, CENPF, PLK1 and various immune cells. This suggests a potential connection between these target genes and immune cell composition within the lung adenocarcinoma microenvironment. The correlation analysis provides valuable insights into the interplay between these genes and the immune system in the context of lung adenocarcinoma (Fig. 8).
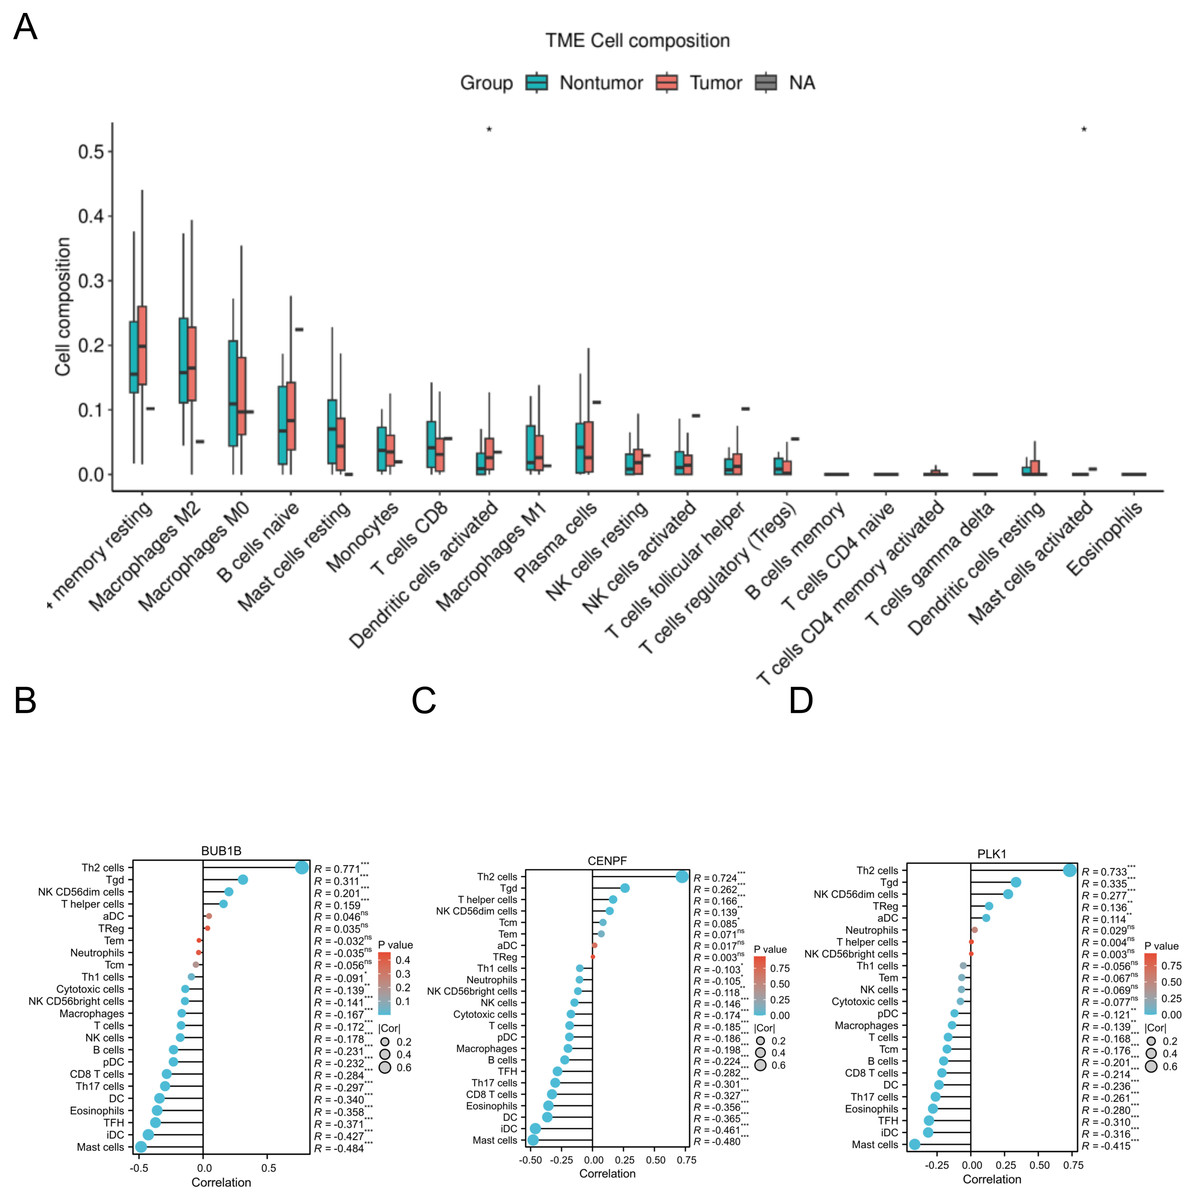
Figure 8: Immune-related infiltration analysis of the three target genes.
(A) The expression of each immune cell under the CIBERSORT algorithm in GSE18842; (B, C, D) correlations between BUB1B, CENPF, PLK1 and a variety of immune cells.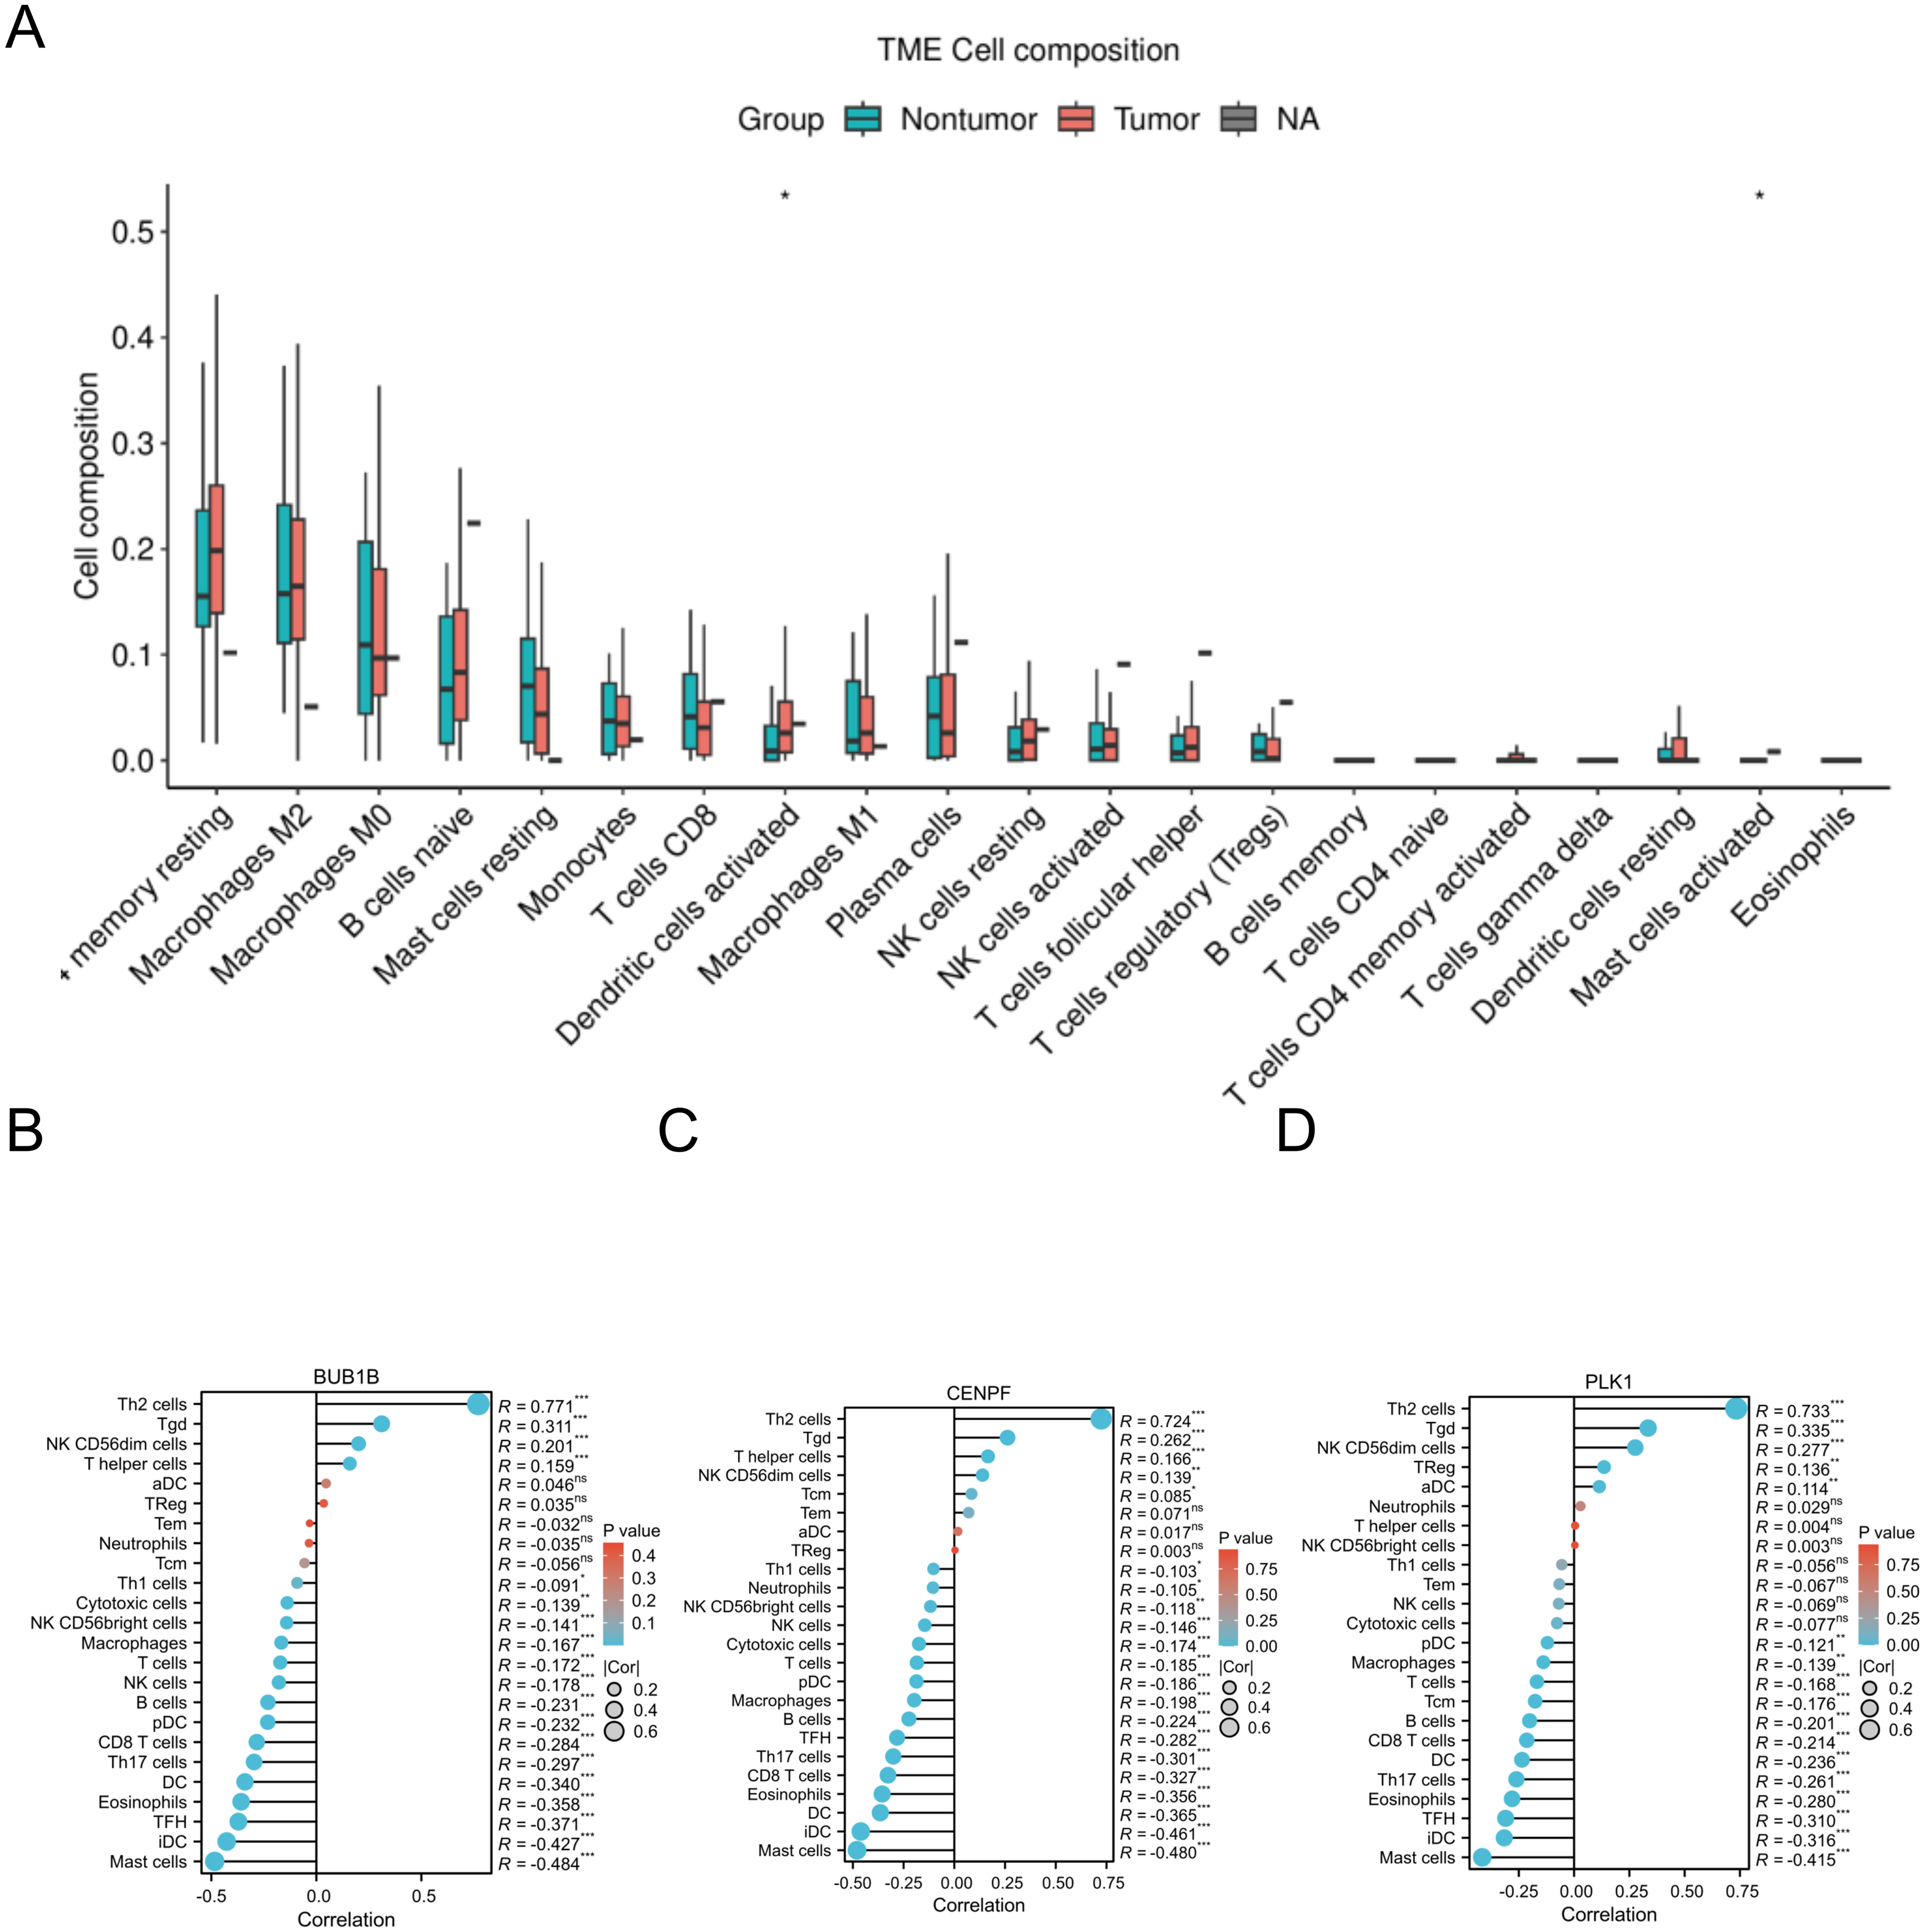
Pan-cancer analysis of BUB1B, CENPF, and PLK1
In this study, we conducted a pan-cancer analysis of BUB1B, CENPF, and PLK1 across various cancer types using TCGA database. The analysis was performed using R software (version 4.2.1; R Core Team, 2022) and ggplot2 package. Our findings revealed significant underexpression of BUB1B, CENPF, and PLK1 in 16 cancer types: BLCA, BRCA, CESC, CHOL, COAD, ESCA, GBM, HNSC, KIRC, KIRP, LIHC, LUAD, LUSC, PRAD, READ, and UCEC. These observations suggested that BUB1B, CENPF, and PLK1 may serve as potential tumor-promoting genes in cancers with high expression levels (Fig. 9).
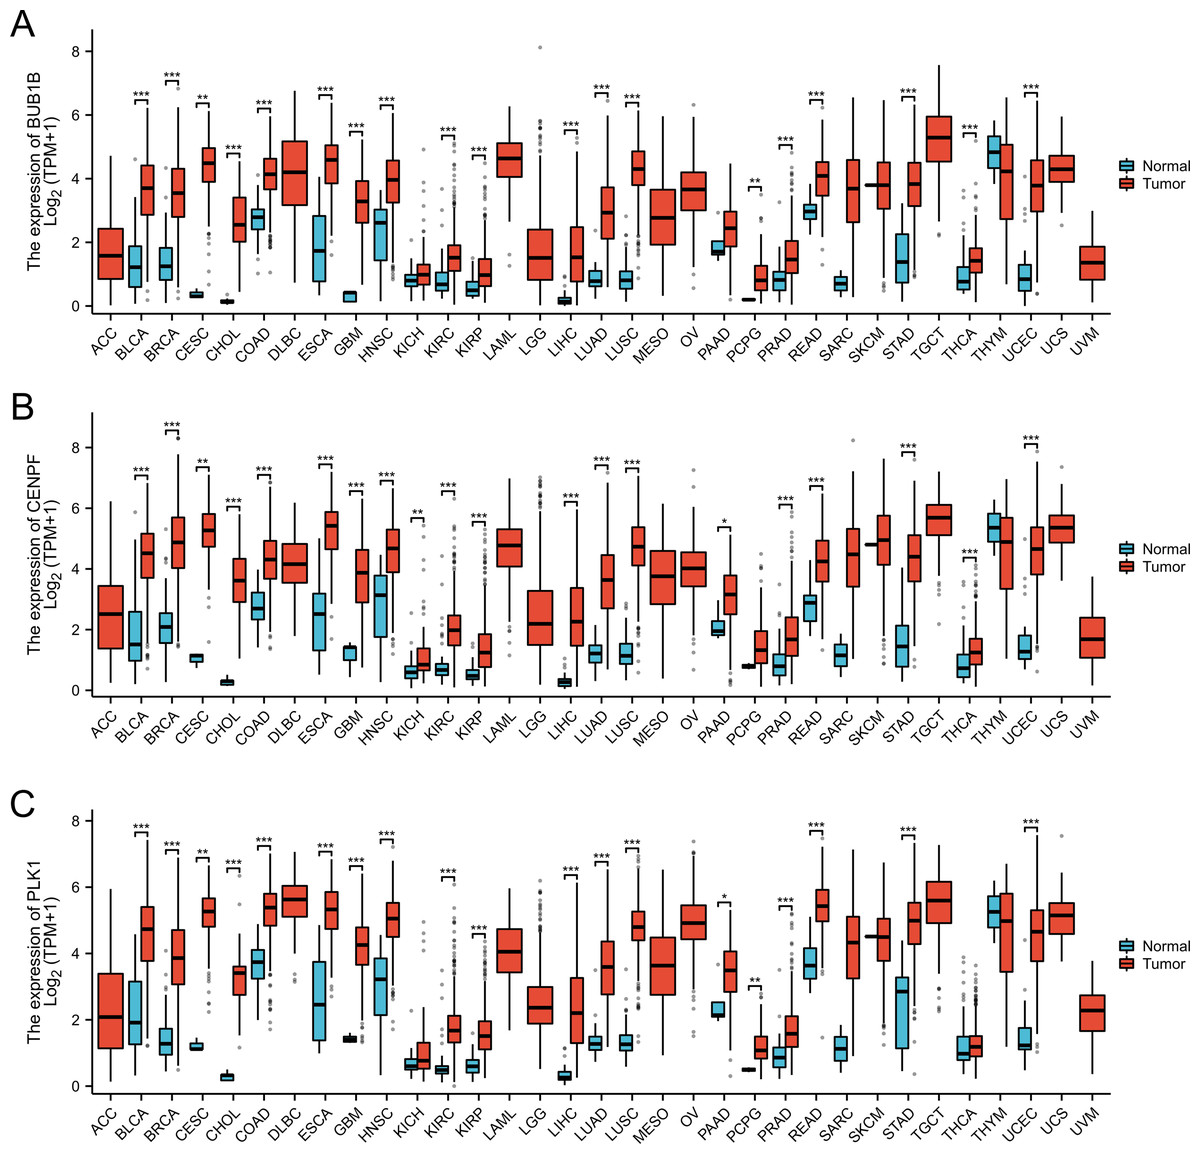
Figure 9: Pan-cancer analysis for the BUB1B, CENPF, and PLK1.
(A) Pan-cancer analysis for the BUB1B; (B) pan-cancer analysis for the CENPF; (C) pan-cancer analysis for the PLK1.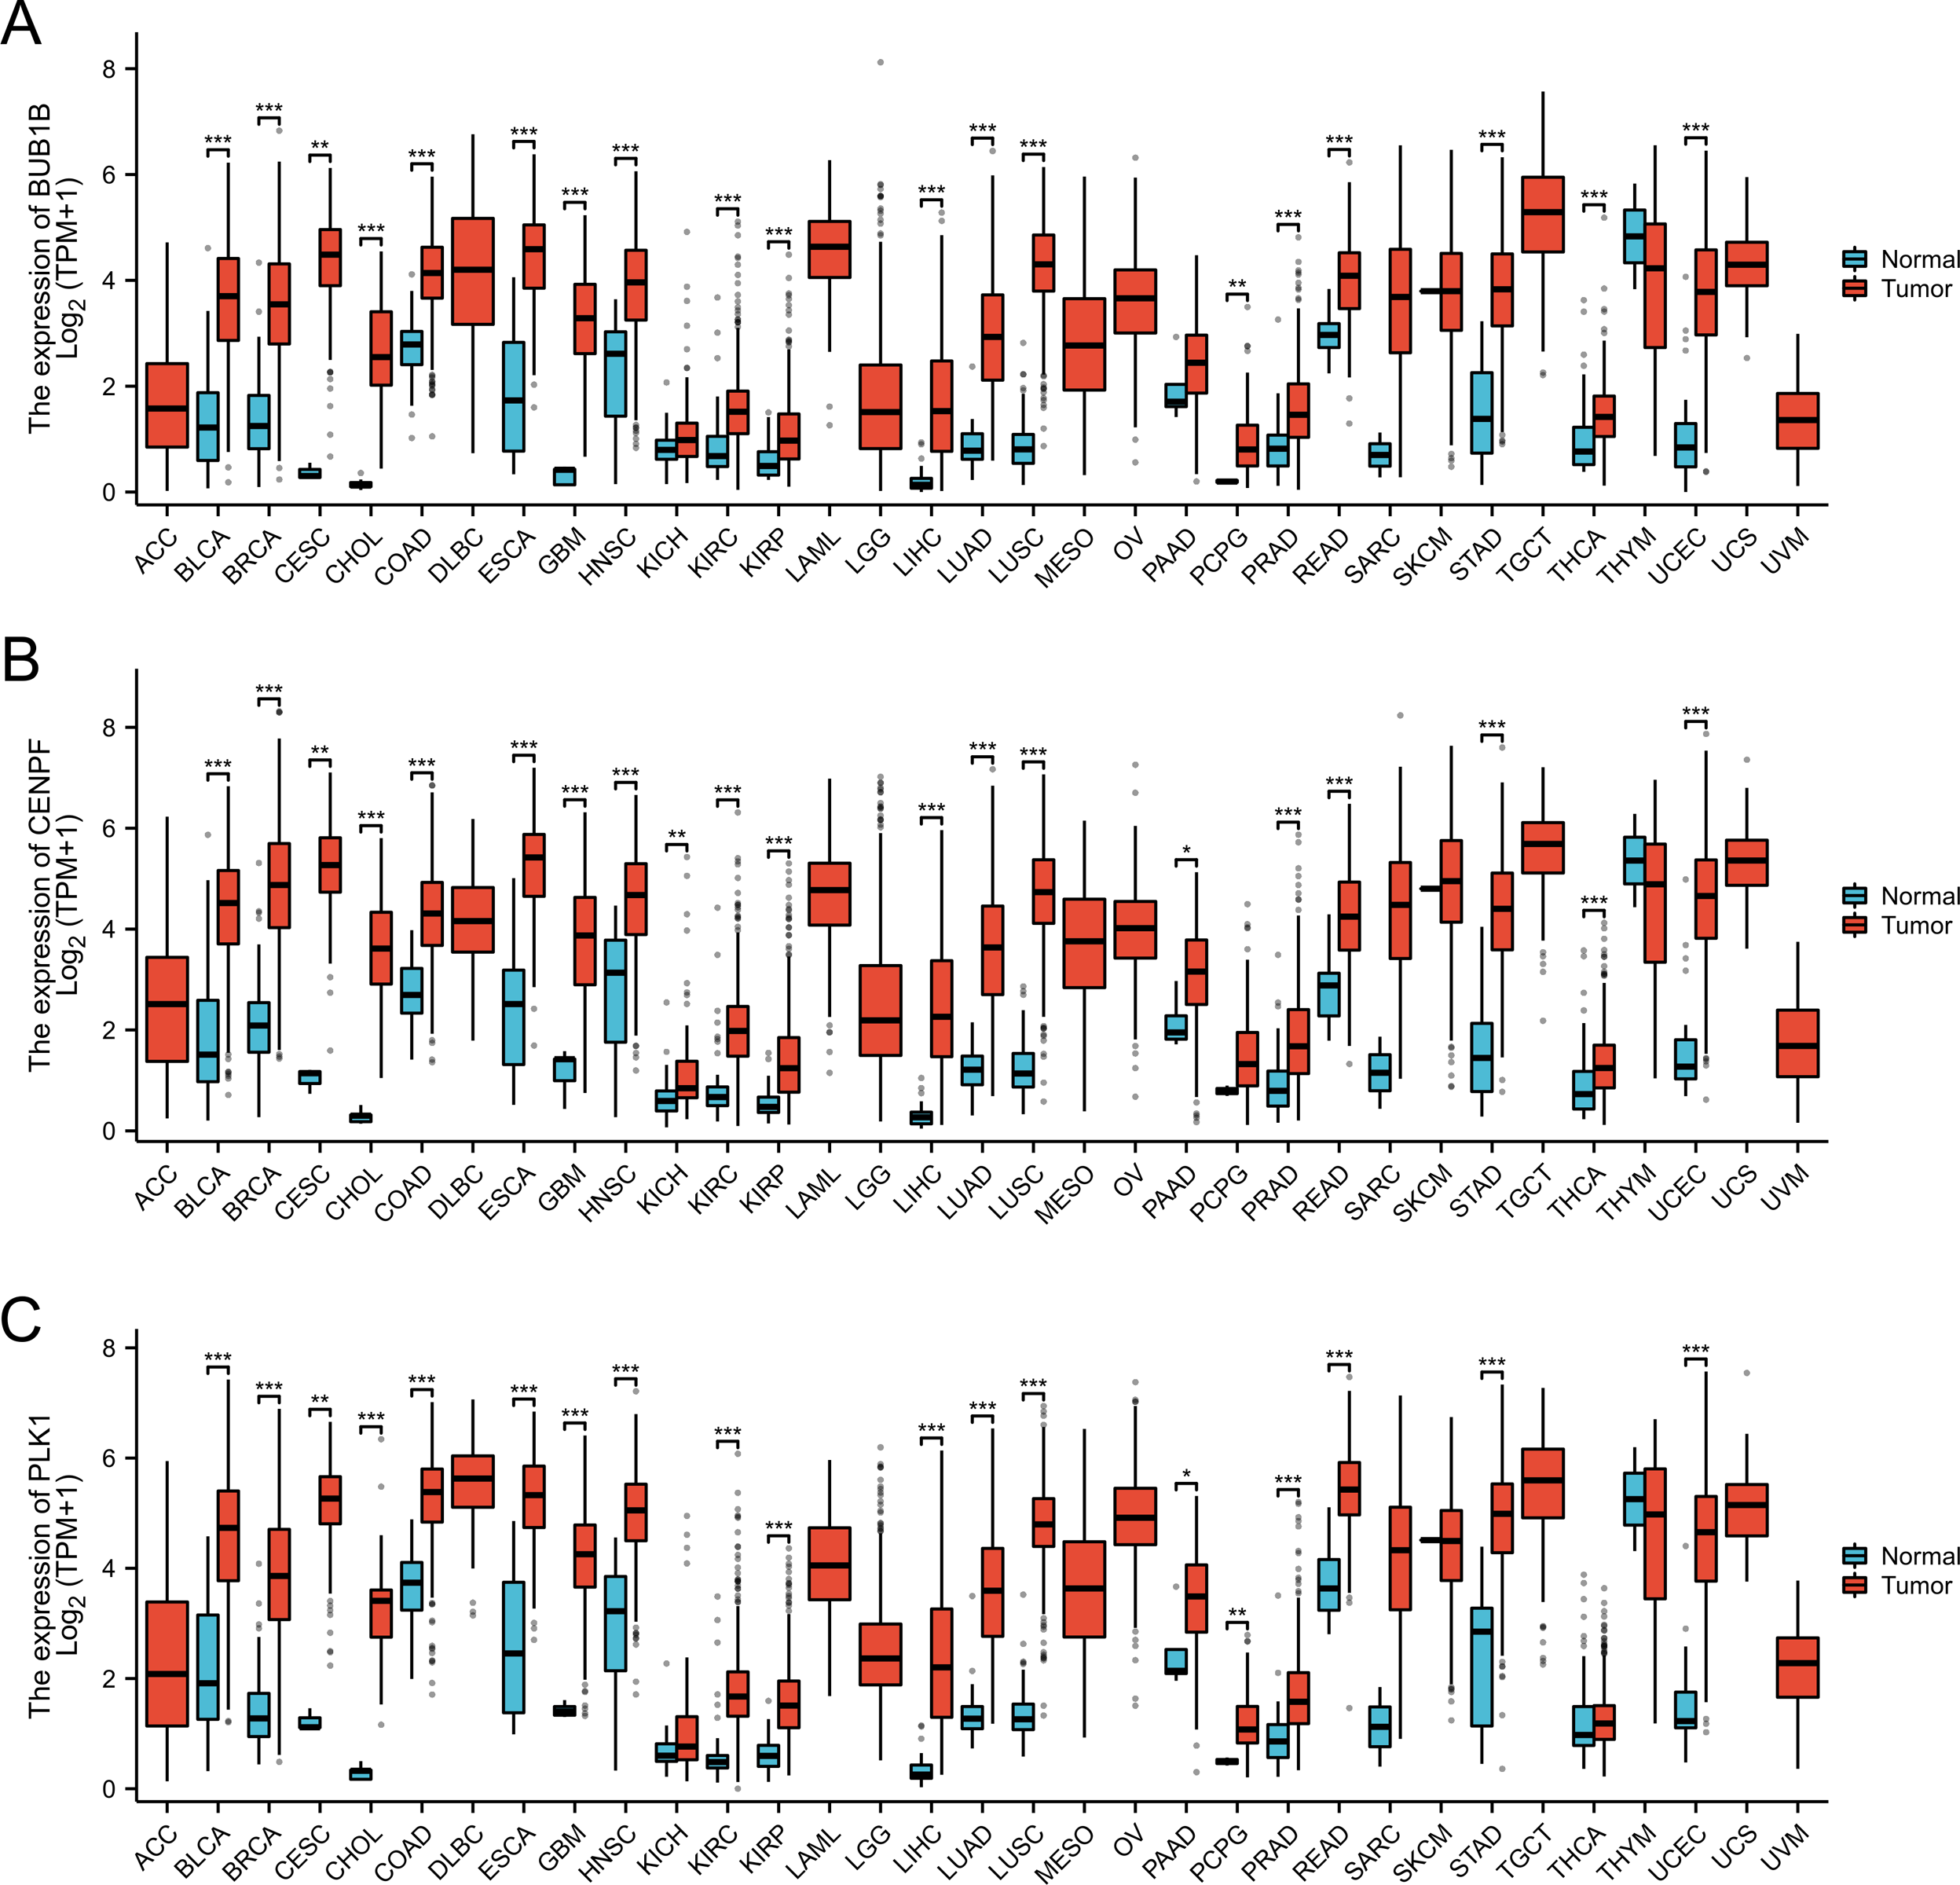
miRNA analysis of BUB1B, CENPF, and PLK1
In this study, we comprehensively investigated the microRNA (miRNA) regulatory networks associated with BUB1B, CENPF, and PLK1. Using three extensive miRNA databases—TargetScan (McGeary et al., 2019), starBase (Wang et al., 2022b), and miRwalk (Kawakami et al., 2024)—we identified potential miRNAs that regulate BUB1B, CENPF, and PLK1. The intersection of these databases is depicted in a Venn diagram, revealing common miRNAs targeting BUB1B, CENPF, and PLK1. Furthermore, to elucidate the intricate relationships among BUB1B, CENPF, and PLK1, their regulatory miRNAs, and their associated protein interactions, we constructed a protein-protein interaction (PPI) network using Cytoscape. This network visualization facilitates the understanding of the complex regulatory mechanisms influencing the expression of BUB1B, CENPF, and PLK1 and their potential impact on cellular processes. This analysis not only underscores the intricate interplay between miRNAs and BUB1B, CENPF, and PLK1 but also sets the stage for further investigation into the role of these miRNAs in modulating gene expression across various physiological and pathological contexts (Fig. 10).
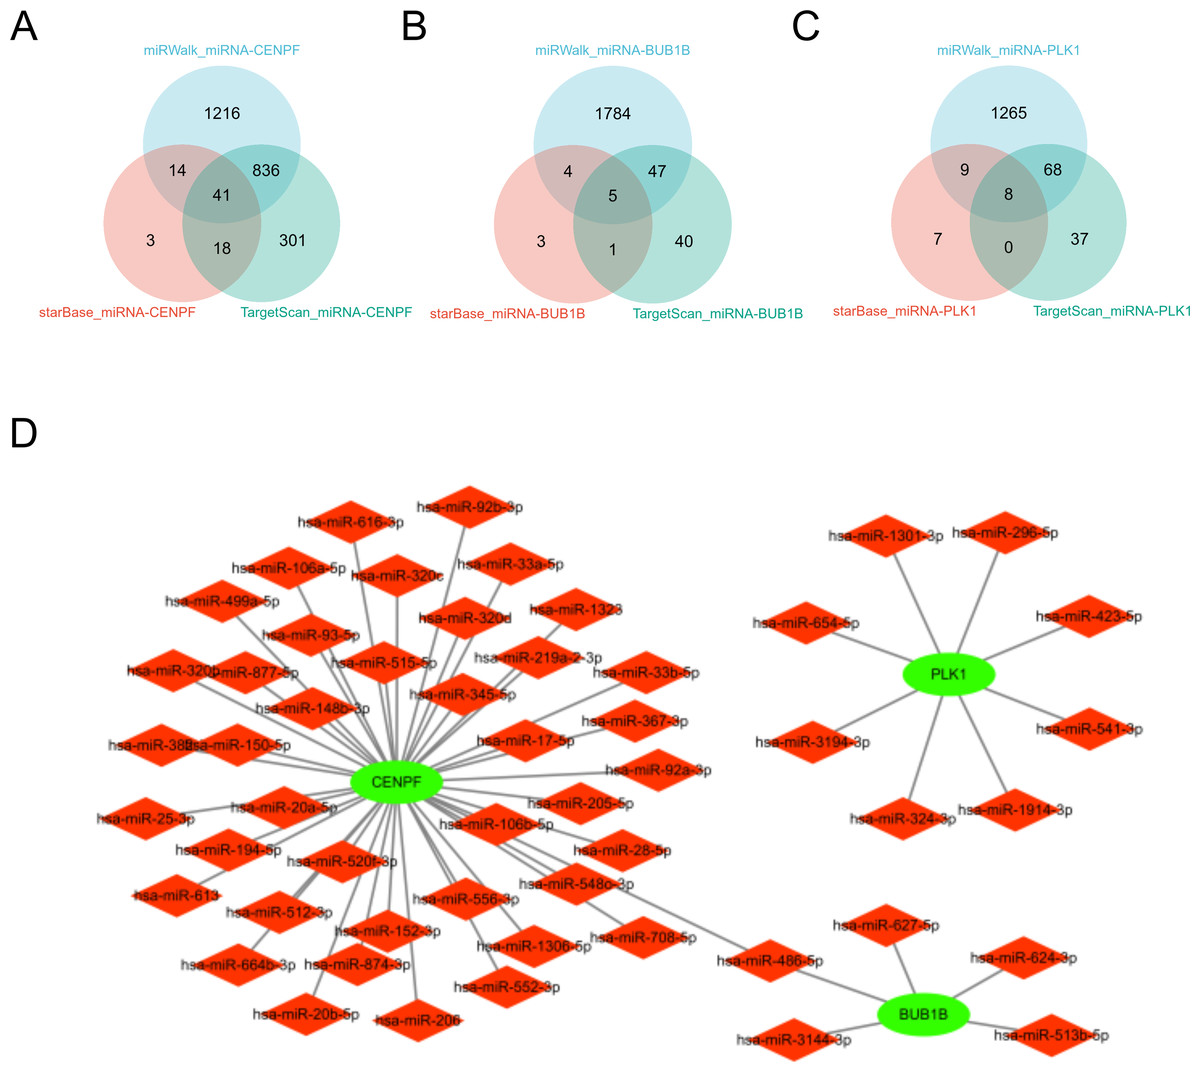
Figure 10: miRNA analysis of BUB1B, CENPF, and PLK1.
(A, B, C) The three miRNA databases correspond to the miRNA Venn diagram of BUB1B, CENPF, and PLK1D: PPI network diagram.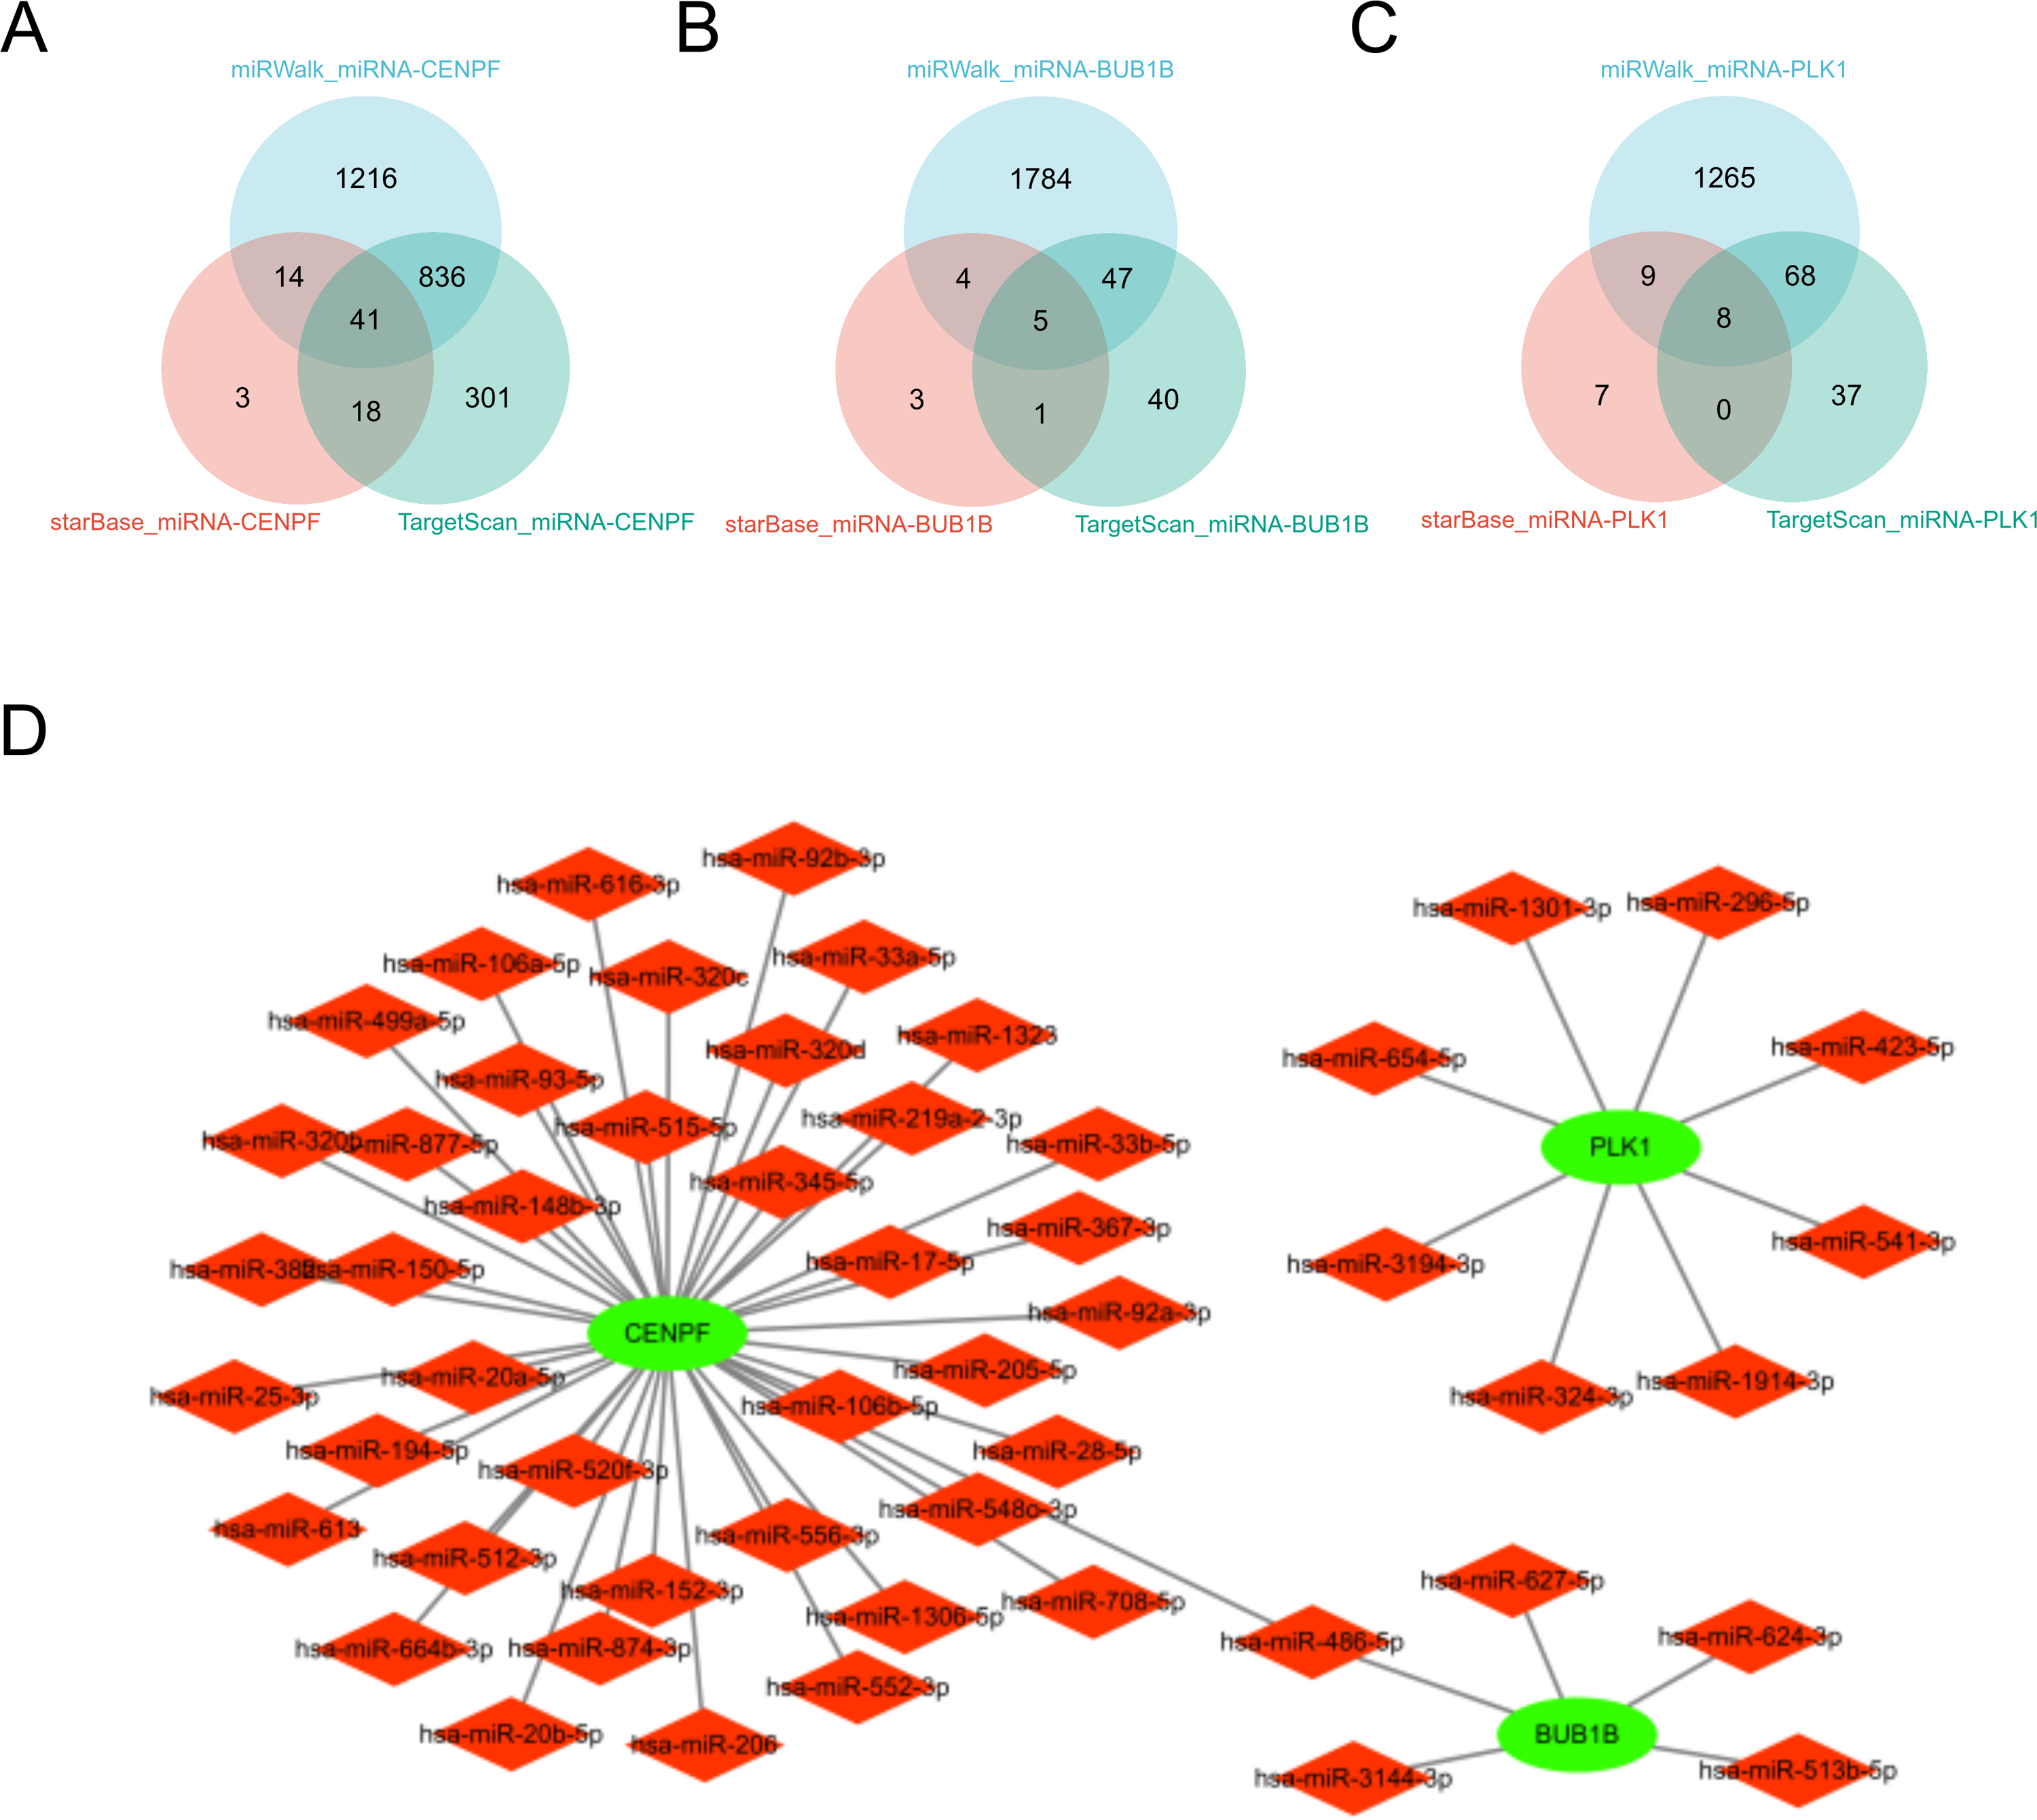
Discussion
Lung adenocarcinoma is a global health challenge with high morbidity and mortality and is one of the leading causes of cancer-related deaths worldwide, although significant progress has been made over the years in the ability to diagnose and treat lung cancer, the underlying problem of poor prognosis remains unresolved (Kunimasa et al., 2020). Targeting the protein pathways involved and subsequently improving patient survival has become a key focus of ongoing research efforts to address the complexities of lung adenocarcinoma (Shu, Jiang & Zhao, 2023).
In this study, we employed the R package “ggplot2” (version 3.5.0) to generate heatmaps for the GSE1987 and GSE18842 datasets from the GEO database. Subsequently, a Venn plot was used to identify overlapping genes between the two datasets, leading to the identification and confirmation of 279 DEGs, involving 89 upregulated and 190 downregulated genes.
To gain a deeper understanding of the shared DEGs, we conducted taxonomic, functional, and pathway enrichment analyses using the DAVID software. Enrichment analysis of the upregulated genes revealed heightened involvement in processes such as organelle fission, nuclear division, nuclear chromosome separation, and sister chromatid isolation. In terms of cellular components (CCs), these genes were prominently associated with spindles, chromosomal regions, spindle poles, and cyclin-dependent protein kinase holoenzyme complexes. The molecular functions (MF) of the common DEGs were primarily linked to microtubule binding, microtubule motor activity, cyclin-dependent protein serine/threonine kinase regulatory activity, and cyclin-dependent protein serine/threonine kinase activator activity. KEGG analysis indicated a significant role for these upregulated DEGs in pathways such as cell cycle, oocyte meiosis, human T-cell leukemia virus 1 infection, p53 signaling, and cellular senescence. For the downregulated genes, enrichment analysis highlighted their involvement in biological processes such as genitourinary development, cell-substrate adhesion, renal morphogenesis, and angiogenesis. The CCs associated with these genes include membrane microdomains, membrane rafts, the outer side of the plasma membrane, and the cellular cortex. In the MF, common DEGs exhibited functions related to integrin binding, transmembrane receptor protein kinase activity, transforming growth factor receptor binding, and type I transforming growth factor receptor binding. KEGG analysis revealed their vital roles in pathways such as supplementation and coagulation cascade, AGE-RAGE signaling in diabetic complications, malaria, tyrosine metabolism, and the renin-angiotensin system. These comprehensive analyses provided valuable insights into the biological processes and pathways associated with the identified DEGs, shedding light on the potential mechanisms involved in lung adenocarcinoma development and progression.
In our continued exploration, we utilized the STRING database to construct a PPI network for the DEGs, which revealed 32 hub genes among upregulated genes and 19 hub genes among downregulated genes. Importantly, all these genes played a role in the top five KEGG pathways with the smallest P values. This network analysis provides a deeper understanding of the interactions and relationships between these hub genes, and offers insights into the potential regulatory mechanisms and pathways implicated in lung adenocarcinoma.
Several previous studies have successfully identified a variety of new cancer biomarkers, such as lung adenocarcinoma, pancreatic cancer, and thyroid cancer, through machine learning algorithms, demonstrating their powerful capabilities (Chi et al., 2023; Li et al., 2023a; Li, Wang & Ding, 2023). Therefore, in this study, we systematically identified three key genes of lung adenocarcinoma, BUB1B, CENPF and PLK1, for the first time, through a combination of random forest and LASSO regression analyses, and explored their potential roles in lung adenocarcinoma and their association with clinical features in detail. Random forest helps screen the genes that contribute the most to disease classification by constructing multiple decision trees. LASSO regression identifies key genes by selecting the most predictive features and adding a penalty term to the model. Using these two approaches, we found that BUB1B, CENPF, and PLK1 are important genes in lung adenocarcinoma. BUB1B, as a cell cycle checkpoint kinase, plays a key role in maintaining chromosomal stability, its abnormal expression may lead to chromosomal instability, and then promote cell proliferation and tumor progression (Yu et al., 2024); CENPF has an important contribution to microtubule formation during chromosome division, and its overexpression leads to abnormal division and increased tumor cell aggressiveness (Pinto et al., 2023; Shukuya et al., 2016). PLK1, a cell cycle regulator, plays an important role in mitosis, and its overexpression is often related to rapid tumor proliferation and poor prognosis, and is supported by specific mechanisms (Shukuya et al., 2016).
Previous studies have shown that BUB1B expression is increased in multiple cancers and is associated with poor prognosis. Our study not only confirms this, but also further demonstrates the role of BUB1B as a key gene in lung adenocarcinoma by random forest and LASSO regression analysis (Nguyen et al., 2022; Chen, Cai & Wang, 2022). CENPF is overexpressed in lung adenocarcinoma and other cancer types. We not only verified the high expression status of CENPF in lung adenocarcinoma but also explored its relationship with cell division and tumor invasiveness, expanding the understanding of its specific mechanism of action (Huang et al., 2022; Mao et al., 2024). Moreover, with previous studies indicating the important role of PLK1 in cell cycle regulation and rapid tumor proliferation, we confirmed the critical position of PLK1 in lung adenocarcinoma using a systematic bioinformatics approach and found that its high expression was associated with poor prognosis, further supporting its value as a potential therapeutic target (Shukuya et al., 2016; Huang et al., 2022).
Subsequently, we used lung adenocarcinoma data from the (TCGA) database to verify the expression levels, survival curves, and ROC curves of these three target genes. At the same time, we also performed qPCR experiments on whole blood of lung cancer patients to detect the expression of three target genes, and the results conclusively proved their high diagnostic value in lung adenocarcinoma. We used t-test and Wilcoxon rank-sum test to compare gene expression differences and a false discovery rate (FDR) correction to control the false positive rate for multiple tests. The results showed that BUB1B, CENPF, and PLK1 showed significantly higher expression in lung adenocarcinoma samples, with P-values of 1.2e−6, 2.3e−5, and 4.1e−4, respectively, and these results were validated in multiple datasets. Furthermore, we evaluated the association between high expression of these genes and patient survival and showed that high expression of all three genes was significantly associated with worse overall survival. The results of these statistical tests indicated that the key genes identified play an important role in lung adenocarcinoma development.
One study showed that ZBTB16 is associated with various systemic tumors and that its overexpression significantly reduces malignant progression and EMT activity in PC cells, which can be eliminated by the exogenous expression of miR-6792-3p (Mao et al., 2024). In this study, we conducted immune infiltration analysis of these three target genes and uncovered significant correlations with various immune cells. This finding suggests a potential link between these genes and the immune response in the context of lung adenocarcinoma, providing valuable insights into their roles in the tumor microenvironment and their potential implications for immunotherapy. as well as pan-cancer analysis and analysis of the mRNA-miRNA interaction network of the three target genes. This comprehensive analysis provides clear insights into the expression levels of BUB1B, CENPF, and PLK1 across different cancer types, along with the corresponding miRNAs associated with each cancer.
However, it is important to acknowledge the limitations of this study. The sample size was relatively small, and the data were mainly derived from public databases and lacked independent experimental validation. Furthermore, our analysis was mainly based on gene expression data and has not yet been combined with the validation of protein levels. Although this study identified key target genes for lung adenocarcinoma through advanced bioinformatics and machine learning techniques, these methods have several limitations. First, the model is prone to overfitting problems, performing well on training data but poor generalization on new data. Second, the model is highly dependent on feature selection and parameter tuning, and incorrect selection significantly affects performance. Moreover, data quality and sample size also have a significant impact on the model effect, with small sample sizes leading to high variance and unreliable prediction results. The “black box” nature of the machine learning model makes its internal mechanisms difficult to interpret, and despite its high accuracy, understanding its biological significance still requires further experimental validation. Therefore, these findings require more biological experiments to confirm their clinical utility. When using machine learning techniques for genetic testing, we must carefully combine them with traditional biological methods to ensure the accuracy and reliability of the research conclusions.
In the future, we need to continue to research directions:
(1) further validate the specific functions and mechanisms of action of BUB1B, CENPF and PLK1 to better understand their roles in lung adenocarcinoma;
(2) conduct larger studies are needed to validate the expression patterns of these genes in different patient populations and their association with clinical features, and to confirm their feasibility as diagnostic and prognostic markers.
(3) explore the development of specific therapeutics for these genes and evaluate their efficacy and safety in animal models and clinical trials;
(4) Comprehensive analysis based on a variety of data to discover more relevant key genes and propose a more comprehensive treatment strategy.
(5) Future studies should be extended to larger sample sizes to validate the role of these key genes using multicenter, multi-ethnic data. Further in vitro and in vivo experiments should be performed to validate the functions of these genes and their potential for clinical treatment.
Despite these constraints, bioinformatics and machine learning analyses have revealed novel mechanisms and pivotal genes that may contribute to the development of lung adenocarcinoma. Further research is warranted to comprehensively elucidate the regulatory roles of these genes and to ascertain their potential as clinical biomarkers and therapeutic targets. This knowledge could provide valuable insights for the precise diagnosis and development of targeted treatment strategies for lung adenocarcinoma.
Conclusion
The key genes identified by our machine learning algorithms, BUB1B, CENPF, and PLK1, are not only important in the occurrence and progression of lung adenocarcinoma but also are potential biomarkers for clinical diagnosis, prognostic evaluation, and therapeutic guidance. First, in terms of clinical diagnosis, high expression of these genes can be used as early detection markers for lung adenocarcinoma, facilitating early detection and diagnosis of disease through gene expression detection. Second, in terms of prognosis assessment, high expression of BUB1B, CENPF, and PLK1 is significantly associated with poor overall survival and thus can be used as a prognostic assessment tool to help physicians predict the outcome of patients’ prognosis and develop personalized treatment options. Finally, in terms of therapeutic guidance, the expression levels of these genes may be associated with specific therapeutic responses and, thus, can serve as potential therapeutic targets. Targeted therapy of BUB1B, CENPF, and PLK1 may improve therapeutic efficacy, especially in patients with poor response to conventional treatment.