
The usefulness of peri-trigger female reproductive hormones (delta-FRH) in predicting oocyte maturation in normal ovarian reserve patients who received in vitro fertilization-embryo transfer: a retrospective study
- Published
- Accepted
- Received
- Academic Editor
- Xin Zhang
- Subject Areas
- Gynecology and Obstetrics, Translational Medicine
- Keywords
- Oocyte maturity, Female reproductive hormone, In vitro fertilization-embryo transfer, Biomarker, Peri-trigger management
- Copyright
- © 2024 He et al.
- Licence
- This is an open access article distributed under the terms of the Creative Commons Attribution License, which permits using, remixing, and building upon the work non-commercially, as long as it is properly attributed. For attribution, the original author(s), title, publication source (PeerJ) and either DOI or URL of the article must be cited.
- Cite this article
- 2024. The usefulness of peri-trigger female reproductive hormones (delta-FRH) in predicting oocyte maturation in normal ovarian reserve patients who received in vitro fertilization-embryo transfer: a retrospective study. PeerJ 12:e17706 https://doi.org/10.7717/peerj.17706
Abstract
Objectives
To evaluate the efficacy of peri-trigger female reproductive hormones (FRHs) in the prediction of oocyte maturation in normal ovarian reserve patients during the in vitro fertilization-embryo transfer (IVF-ET) procedure.
Materials and Methods
A hospital database was used to extract data on IVF-ET cases from January 2020 to September 2021. The levels of female reproductive hormones, including estradiol (E2), luteinizing hormone (LH), progesterone (P), and follicle-stimulating hormone (FSH), were initially evaluated at baseline, the day of the trigger, the day after the trigger, and the day of oocyte retrieval. The relative change in E2, LH, P, FSH between time point 1 (the day of trigger and baseline) and time point 2 (the day after the trigger and day on the trigger) was defined as E2_RoV1/2, LH_RoV1/2, P_RoV1/2, and FSH_RoV1/2, respectively. Univariable and multivariable regression were performed to screen the peri-trigger FRHs for the prediction of oocyte maturation.
Results
A total of 118 patients were enrolled in our study. Univariable analysis revealed significant associations between E2_RoV1 and the rate of MII oocytes in the GnRH-agonist protocol group (p < 0.05), but not in the GnRH-antagonist protocol group. Conversely, P_RoV2 emerged as a potential predictor for the rate of MII oocytes in both protocol groups (p < 0.05). Multivariable analysis confirmed the significance of P_RoV2 in predicting oocyte maturation rate in both groups (p < 0.05), while the association of E2_RoV1 was not significant in either group. However, within the subgroup of high P_RoV2 in the GnRH-agonist protocol group, association was not observed to be significant. The C-index was 0.83 (95% CI [0.73–0.92]) for the GnRH-agonist protocol group and 0.77 (95% CI [0.63–0.90]) for the GnRH-antagonist protocol group. The ROC curve analysis further supported the satisfactory performance of the models, with area under the curve (AUC) values of 0.79 for the GnRH-agonist protocol group and 0.81 for the GnRH-antagonist protocol group.
Conclusions
P_RoV2 showed significant predictive value for oocyte maturation in both GnRH-agonist and GnRH-antagonist protocol groups, which enhances the understanding of evaluating oocyte maturation and inform individualized treatment protocols in controlled ovarian hyperstimulation during IVF-ET for normal ovarian reserve patients.
Introduction
In vitro fertilization and embryo transfer (IVF-ET) is a widely used assisted reproductive technology, but its success can be impacted at various steps, with one critical factor being the yield and quality of mature oocytes retrieved (Cagli et al., 2022; Yin et al., 2022). Failure to retrieve oocytes occurs in approximately 1–2% of IVF cycles and can result from issues such as empty follicles, technical difficulties, premature ovulation, or incorrect trigger administration (Huang et al., 2021; Lin et al., 2019; Pontesilli et al., 2021). Even when oocytes are retrieved, their maturity directly influences IVF-ET outcomes. Therefore, accurately predicting and optimizing oocyte maturation is essential for improving IVF success rates. The ability to reliably predict oocyte maturity would allow clinicians to better select the optimal trigger timing following controlled ovarian hyperstimulation (COH) (Gleicher et al., 2022; Yoshikawa et al., 1992). Previous studies have explored potential predictors of oocyte maturity and ovarian response, including anti-Müllerian hormone (AMH) levels, antral follicle counts (AFC), baseline female reproductive hormone (FRH) levels, ovarian sensitivity indices, follicular sensitivity indices, and oocyte indices (Capper et al., 2022; Laqqan & Yassin, 2022; Nisar Omar Hafizi et al., 2022). The follicular output rate (FORT) has shown utility in predicting metaphase II (MII) oocyte yield after ovarian stimulation (Gallot et al., 2012). However, existing prediction models based on these markers have limitations in their accuracy, applicability, and ease of clinical use.
A key knowledge gap is that most prior studies evaluated FRH levels at single timepoints, failing to account for the dynamic fluctuations in hormone levels throughout ovarian stimulation. As FRH levels change dynamically, particularly around the ovulation trigger, evaluating longitudinal FRH trends rather than single timepoints could improve prediction of oocyte maturity while reducing inter-patient heterogeneity. Specifically, changes in FRH levels in the peri-trigger period immediately before and after the ovulation trigger may directly impact final oocyte maturation but have not been well-studied.
Therefore, this study aimed to evaluate the efficacy of monitoring peri-trigger FRH trends in predicting oocyte maturation in normal ovarian reserve patients undergoing IVF-ET. By identifying optimal longitudinal FRH patterns associated with higher metaphase II (MII) oocyte yields, we aimed to provide a practical tool to guide trigger timing and improve oocyte maturity for better IVF outcomes. Accounting for dynamic hormone fluctuations addresses a key limitation of prior single timepoint studies and could enhance the clinical utility of FRH monitoring for optimizing oocyte retrievals.
Materials & Methods
Patient selection
This study was conducted after receiving approval from the Institution’s Ethics Committee of Zigong Hospital of Women and Children Health Care (Ethics number: 2021IECA01). The data of IVF/ET or ICSI cycles from January 2020 to September 2021 in the institutional database for reproductive medicine were retrospectively extracted and analyzed. The inclusion criteria were as follows: (1) age <35 years; (2) spontaneous menstrual cycle (21–35 days in duration); (3) bilateral antral follicle counts 7 ≤ AFC ≤ 14 on menstrual cycle Day 2 or Day 3, a basal serum follicle-stimulating hormone (FSH) concentration ≤10 mIU/ml; and (4) anti-Mullerian hormone 1 < AMH < 4. The exclusion criteria were as follows: (1) patients with abnormal ovarian function or polycystic ovary syndrome (PCOS) or decreased ovarian reservation (DOR); (2) patients with incomplete information. All patients in this study signed informed consent forms.
Ovarian stimulation methods
In this retrospective cohort, the patients were received ovarian stimulation by long GnRH-agonist or GnRH-antagonist protocol (Lambalk et al., 2017). All protocols were triggered as follows: when at least two follicles reached 18 mm or three follicles reached 17 mm in diameter, 5,000–10,000 U of hCG (Chorionic Gonadotrophin, Qingdao Guanlong, China) in GnRH-agonist protocols or 0.1–0.2 mg of Triptorelin and 2,000–10,000 U of hCG in GnRH-antagonist protocols was administered for final oocyte maturation following the number of growing follicles and serum estradiol level on the trigger day.
Peri-trigger FRHs detection
The levels of estradiol (E2), luteinizing hormone (LH), progesterone (P), and FSH were evaluated at baseline (fasting blood at 8 a.m.), the day of the trigger (12 h before trigger), the day after trigger (12 h after trigger), and the day of oocyte retrieval (36 h after trigger). All serum samples were detected by the chemiluminescence method (LIAISON® XL, DiaSorin Ltd., Saluggia, Italy).
The relative changes of peri-trigger FRHs were primarily defined as delta-FRHs. Between the trigger day and baseline, E2, LH, P, and FSH were calculated as E2_RoV1, LH_RoV1, P_RoV1, and FSH_RoV1, respectively. Similarly, the relative changes of E2, LH, P, and FSH were calculated as E2_RoV2, LH_RoV2, P_RoV2, and FSH_RoV2, respectively, between the day after trigger and the trigger day. Since it might not help to change the strategy for the treatment of patients by the level of FRHs in the oocytes retrieval, we have not analyzed the relative changes of FRHs between oocytes retrieval and the other time points. The relative changes of LH were included in the univariable analysis for LH_RoV1 in both protocol groups. However, LH_RoV2 was only assessed in the GnRH-agonist group, as LH levels would be significantly influenced by the GnRH-agonists used for triggering. The formula for calculating peri-trigger FRHs is presented below. (1) (2)
* Time 1 = Baseline, Time 2 = Trigger day, Time 3 = Trigger day +1
To optimize the clinical relevance and applicability of our findings, delta-FRHs were stratified as categorical variables in the analysis. Due to the absence of established clinical standards for classifying longitudinal FRH changes during COH, we categorized delta-FRHs based on the data distribution and clinical judgment.
Initially, delta-FRHs were classified into “low”, “intermediate”, and “high” subgroups using the criteria in Table 1. This categorization allows for assessing potential non-linear relationships between delta-FRH levels and oocyte maturation. The “low” category represents minimal change in FRH levels from baseline to trigger day or trigger day to post-trigger (≤1.5-fold change). The “high” category captures substantial increases (≥5-fold change), while “intermediate” encompasses moderate 1.5 to 5-fold changes.
| delta-FRH | Variation (folds of change) | |
|---|---|---|
| E2_RoV1 | Low | <30.00 |
| Intermediate | 30.00∼60.00 | |
| High | ≥60.00 | |
| E2_RoV2 | Low | <0.00 |
| Intermediate | 0.00∼0.15 | |
| High | ≥0.15 | |
| P_RoV1 | Low | <0.00 |
| Intermediate | 0.00∼1.00 | |
| High | ≥1.00 | |
| P_RoV2 | Low | <5.00 |
| Intermediate | 5.00∼10.00 | |
| High | ≥10.00 | |
| LH_RoV1 | Low | <-0.50 |
| Intermediate | −0.50∼0.00 | |
| High | ≥0.00 | |
| LH_RoV2 | Low | <0.00 |
| Intermediate | 0.00∼10.00 | |
| High | ≥10.00 | |
| FSH_RoV1 | Low | <0.00 |
| Intermediate | 0.00∼1.00 | |
| High | ≥1.00 | |
| FSH_RoV2 | Low | <0.00 |
| Intermediate | 0.00∼1.00 | |
| High | ≥1.00 |
Notes:
- FRH
-
female reproductive hormones
- E2_RoV1
-
estradiol level between the trigger day and baseline
- P_RoV1
-
progesterone level between the trigger day and baseline
- LH_RoV1
-
luteinizing hormone level between the trigger day and baseline
- FSH_RoV1
-
follicle-stimulating hormone level between the trigger day and baseline
- E2_RoV1
-
estradiol level the day after trigger and the trigger day
- P_RoV1
-
progesterone level the day after trigger and the trigger day
- LH_RoV1
-
luteinizing hormone level the day after trigger and the trigger day
- FSH_RoV1
-
follicle-stimulating hormone level the day after trigger and the trigger day
While this categorization approach is empirical, it enables evaluation of delta-FRHs as predictors in a clinically interpretable manner. However, a limitation is that the cutoffs for low/intermediate/high categories were data-driven rather than based on established clinical thresholds, which do not currently exist for longitudinal FRH monitoring. Further research is needed to validate optimal delta-FRH categories and advance their clinical implementation. Nevertheless, this approach explores the potential utility of evaluating dynamic hormone fluctuations rather than static levels.
Oocyte retrieval
Oocytes were retrieved under the ultrasound-guided transvaginal method 36 h after hCG administration. Morphological characteristics of the cumulus mass were considered to grade the oocytes quality. Oocyte maturity was represented by metaphase II (MII) oocytes following the consensus reported by Yang et al. (2022). All procedures were performed by two senior reproductive endocrinologists.
Statistical analysis
The primary outcome was measured by the rate of MII oocytes, calculated as the ratio of the number of MII oocytes to the total number of retrieved oocytes. Based on a predefined threshold of 70% MII oocytes rate, the outcome was categorized into two groups: a high MII rate group (HMRG) and a low MII rate group (LMRG). The basic characteristics of the patients were presented as mean and standard deviation for continuous variables and as percentages for categorical variables. To compare the data between the HMRG and LMRG, two-independent t-tests were performed. Univariable logistic regression analysis was conducted to assess the potential predictive value of delta-FRHs and demographic parameters. The indicators showing a potential association with the outcome were included in the multivariable regression analysis using the backward stepwise method. The predictive ability and reliability of the logistic regression results were evaluated using the C-index. All analyses were conducted with a significant cutoff value of p < 0.05 under the two-tailed test. ROC curves were explored to evaluate the predictive value of delta-FRHs with the cutoff value of the rate of MII oocytes being 70%. The overall performance of the data was assessed by the area under the curve (AUC) and visualized by ROC curve. SPSS (version 26.0, IBM, Armonk, NY) and R software (version 4.2.3, R Core Team, R Foundation for Statistical Computing) were used to analyze the data.
Results
Basic characteristics of included patients
A total of 118 cases were included in the final analysis after applying the exclusion criteria (Fig. 1). Patient characteristics are shown in Table 2. Most received a GnRH agonist protocol (66.1%). The mean age was 32.2 ± 4.3 years and mean AFC was 10.2 ± 2.2. The overall rate of metaphase II (MII) oocytes was 84.3% ± 21.6%. In the GnRH-agonist group, HMRG had higher estradiol levels at trigger, post-trigger, and oocyte retrieval compared to LMRG.

Figure 1: Flow chart of the patients included in the study.
PCOS, polycystic ovary syndrome; DOR, decreased ovarian reservation.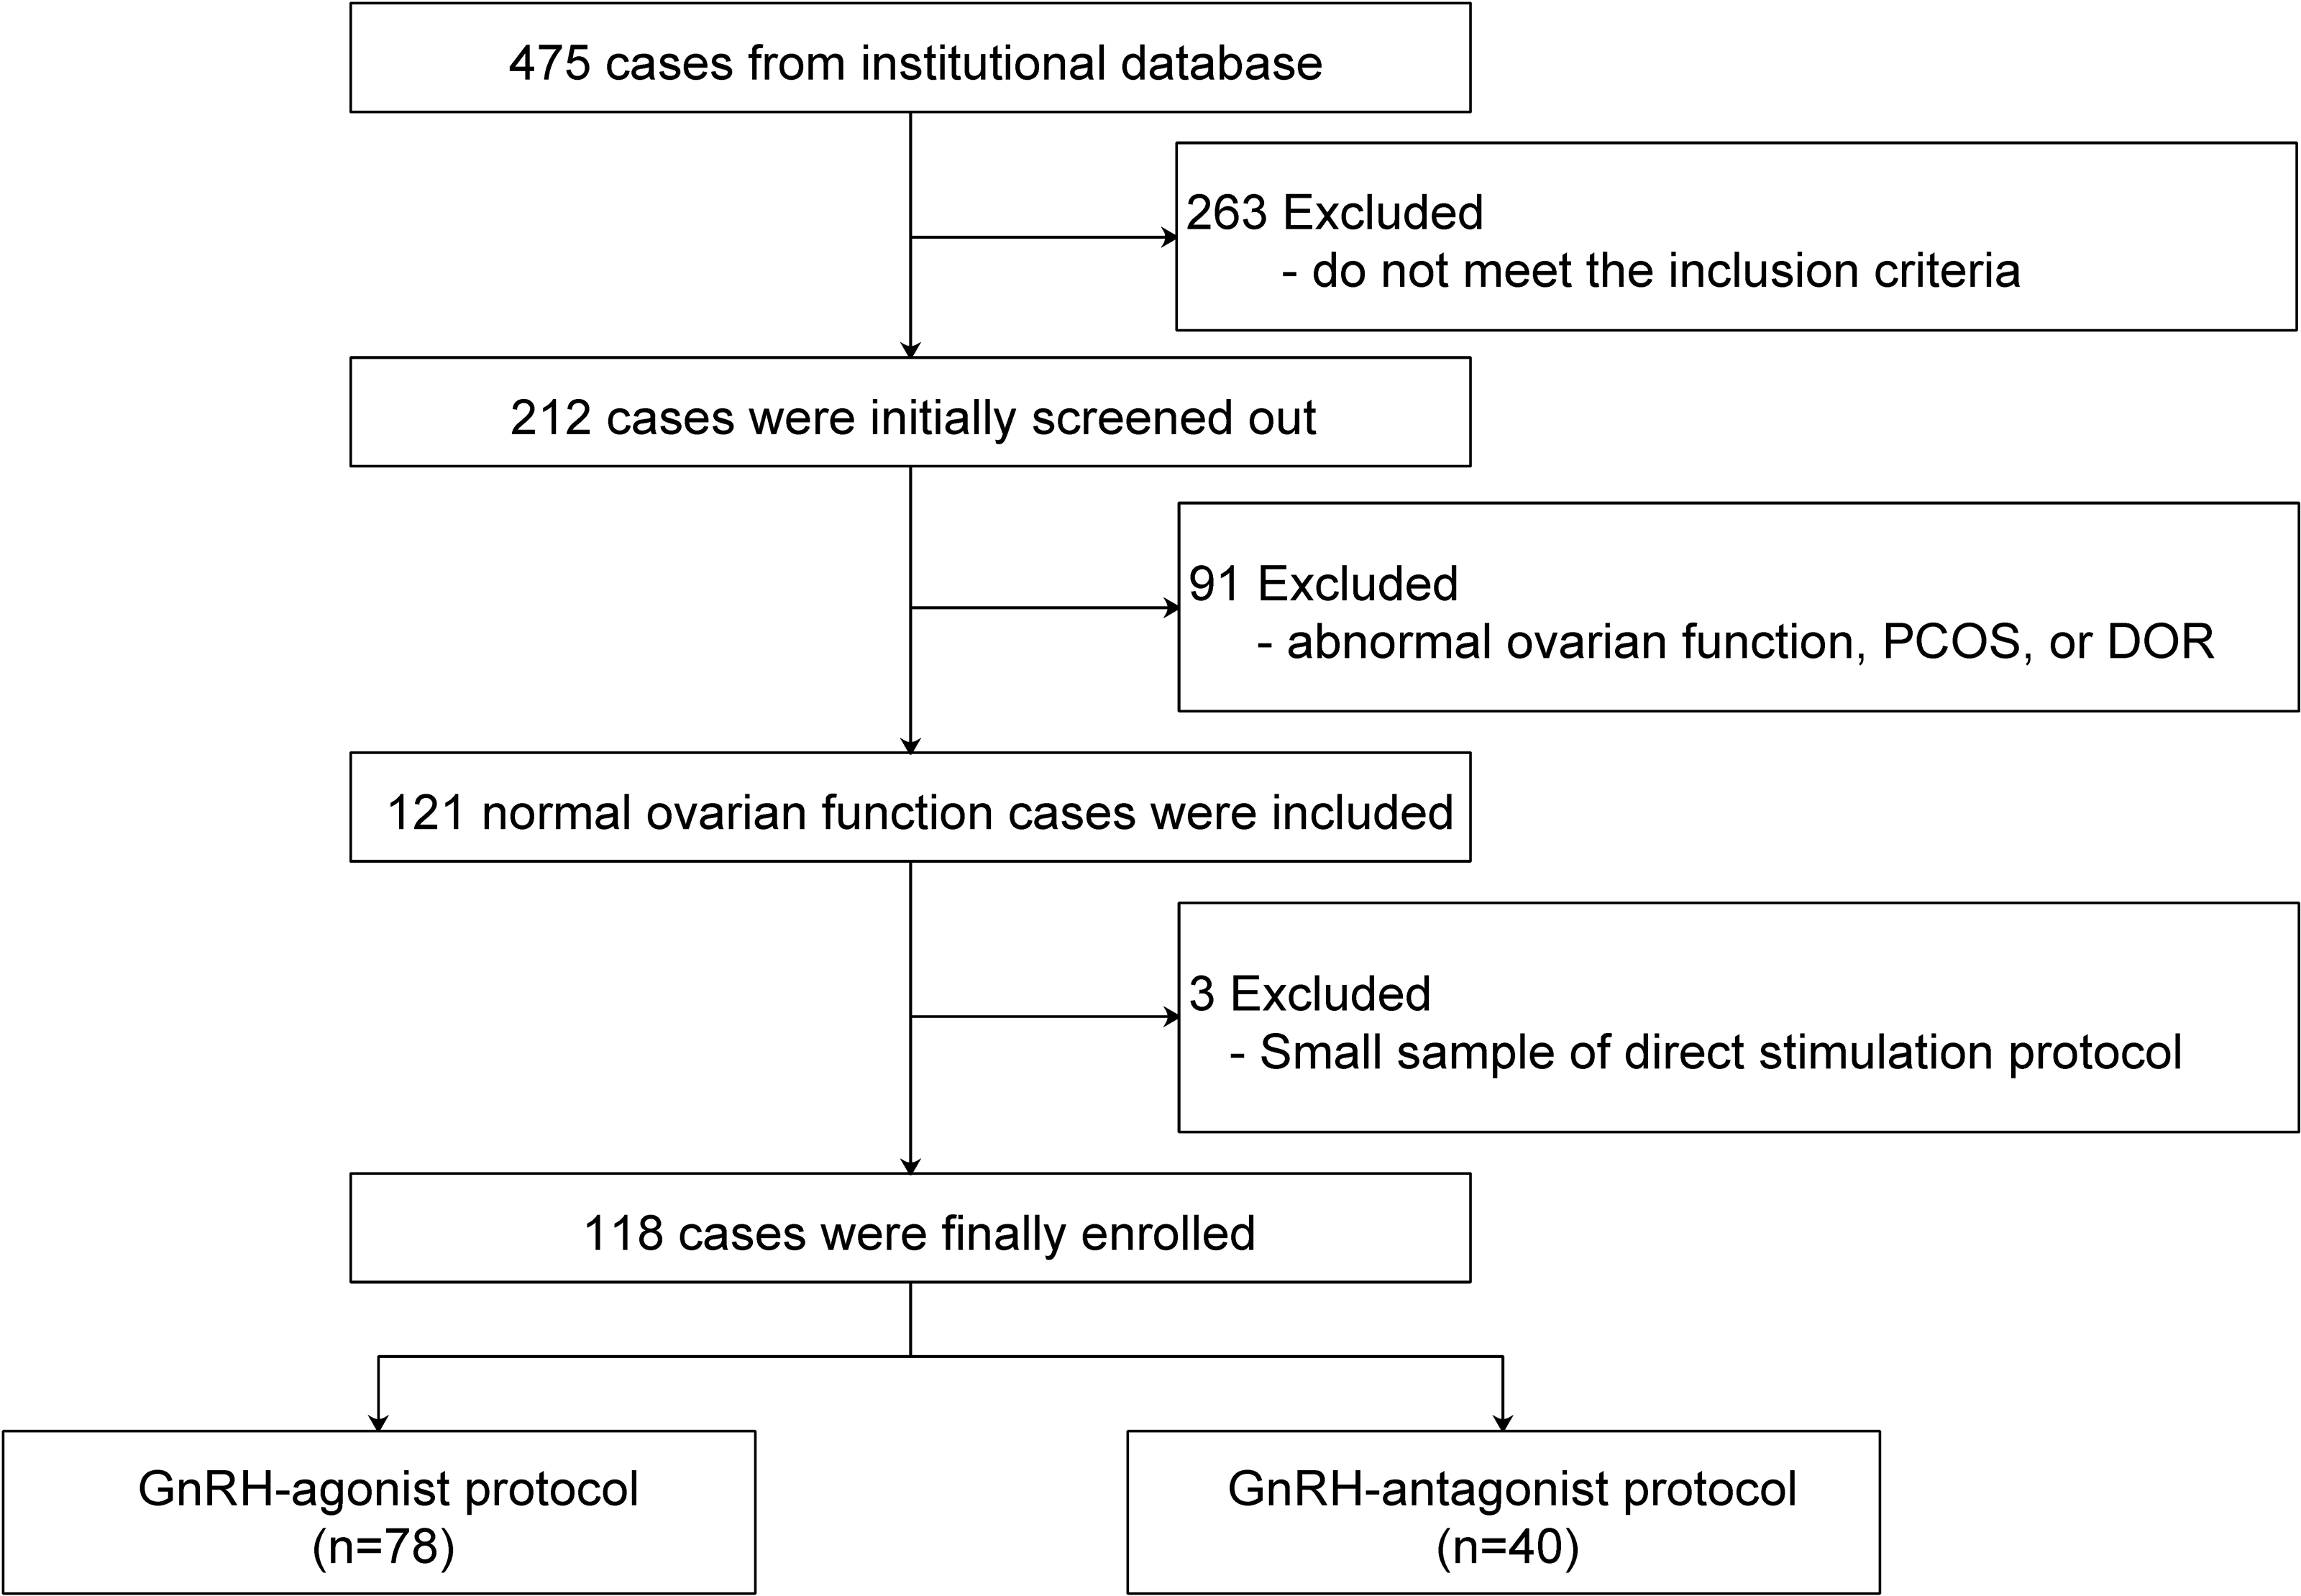
| Indicator |
GnRH-agonist protocol n (%) = 78 (66.10) |
GnRH-antagonist protocol n (%) = 40 (33.90) |
|||||
|---|---|---|---|---|---|---|---|
|
LMRG 44 (56.41) |
HMRG 34 (43.59) |
Total 78 (100.00) |
LMRG 21 (52.50) |
HMRG 19 (47.50) |
Total 40 (100.00) |
||
| Age, years | 32.55 ± 4.54 | 31.68 ± 4.15 | 32.17 ± 4.36 | 32.76 ± 4.58 | 32.32 ± 3.73 | 32.55 ± 4.15 | |
| Body mass index, kg/m2 | 20.87 ± 2.7 | 21.34 ± 2.77 | 21.07 ± 2.73 | 20.86 ± 2.28 | 22.09 ± 2.6 | 21.44 ± 2.49 | |
| Antral follicle count | 9.82 ± 1.87 | 10.59 ± 1.97* | 10.15 ± 1.94 | 9.9 ± 2.21 | 11 ± 2.75 | 10.43 ± 2.51 | |
| Baseline of AMH, ng/ml | 2.06 ± 0.74 | 2.48 ± 0.71 | 2.24 ± 0.75 | 2.43 ± 0.71 | 2.48 ± 0.79 | 2.45 ± 0.74 | |
| Number of gestation history | 0.14 ± 0.35 | 0.21 ± 0.48 | 0.17 ± 0.41 | 0.1 ± 0.3 | 0.16 ± 0.37 | 0.13 ± 0.33 | |
| Number of abortion history | 0.55 ± 0.76 | 0.56 ± 0.99 | 0.55 ± 0.86 | 0.9 ± 0.83 | 1.05 ± 1.39 | 0.98 ± 1.12 | |
| Number of productions | 0.93 ± 1.21 | 1.03 ± 1.14 | 0.97 ± 1.17 | 1.05 ± 0.97 | 1.53 ± 1.78 | 1.28 ± 1.41 | |
| Total Gn dose, IU | 2,945.46 ± 990.19 | 2,565.81 ± 697.11 | 2,779.97 ± 889.78 | 1,845.24 ± 542.51 | 2,107.89 ± 507.53 | 1,970 ± 536.16 | |
| Total Gn days, days | 11.36 ± 2.62 | 11.12 ± 1.32 | 11.26 ± 2.15 | 8.86 ± 1.65 | 9.63 ± 0.76 | 9.23 ± 1.35 | |
| Trigger to oocytes retrieval, hours | 35.89 ± 0.65 | 36.09 ± 0.51 | 35.97 ± 0.60 | 34.95 ± 5.29 | 36.00 ± 0.94 | 35.45 ± 3.88 | |
| Estradiol, pg/ml | Baseline | 57.48 ± 35.98 | 58.07 ± 35.4 | 57.74 ± 35.5 | 53.42 ± 21.32 | 40.72 ± 16.01 | 47.39 ± 19.81 |
| Trigger | 1,778.71 ± 982.61 | 3,037.62 ± 1,683.65* | 2,327.46 ± 1,465.88 | 1,951.14 ± 1,043.02 | 2,698.26 ± 1,000.65 | 2,306.03 ± 1,078.33 | |
| Post-trigger | 1,797.74 ± 1,029.84 | 3,394.71 ± 2,144.36* | 2,551.86 ± 1,826.06 | 2,163.9 ± 1,254.78 | 2,897.42 ± 1,146.9 | 2,512.33 ± 1,245.85 | |
| Oocyte retrieval | 759.43 ± 470.75 | 1,248.59 ± 783.59* | 984.6 ± 675.02 | 1,074.47 ± 673.43 | 1,049 ± 511.97 | 1,063.24 ± 598.94 | |
| P, ng/ml | Baseline | 2.48 ± 6.83 | 0.74 ± 0.46 | 1.72 ± 5.19 | 0.78 ± 0.4 | 0.6 ± 0.19 | 0.69 ± 0.33 |
| Trigger | 0.81 ± 0.42 | 1.03 ± 0.53 | 0.91 ± 0.48 | 0.85 ± 0.4 | 1.03 ± 0.36 | 0.94 ± 0.39 | |
| Post-trigger | 4.44 ± 2.13 | 9.11 ± 5.28* | 6.61 ± 4.55 | 4.72 ± 2.94 | 7.83 ± 2.27* | 6.2 ± 3.04 | |
| Oocyte retrieval | 7.55 ± 4.18 | 14.57 ± 6.87* | 10.83 ± 6.58 | 7.56 ± 4.99 | 11.62 ± 4.17* | 9.35 ± 5.01 | |
| FSH, mIU/ml | Baseline | 7.12 ± 1.81 | 7.16 ± 1.46 | 7.13 ± 1.66 | 7.09 ± 1.83 | 7.35 ± 1.79 | 7.21 ± 1.79 |
| Trigger | 14.44 ± 4.72 | 13.86 ± 4.51 | 14.19 ± 4.59 | 10.46 ± 2.19 | 12.11 ± 2.59 | 11.17 ± 2.45 | |
| Post-trigger | 12.94 ± 7.73 | 10.55 ± 3.86 | 11.75 ± 6.17 | 22.46 ± 10.96 | 20.04 ± 7.68 | 21.22 ± 9.35 | |
| Oocyte retrieval | 8.39 ± 3.08 | 6.77 ± 2.55 | 7.52 ± 2.89 | 8.29 ± 2.09 | 7.94 ± 2.51 | 8.11 ± 2.28 | |
| LH, mIU/ml | Baseline | 2.66 ± 0.98 | 3.99 ± 6.28 | 3.25 ± 4.25 | 3.09 ± 1.58 | 3.34 ± 1.46 | 3.21 ± 1.51 |
| Trigger | 1.43 ± 2.4 | 1.08 ± 0.47 | 1.28 ± 1.82 | 2.01 ± 1.13 | 1.81 ± 0.78 | 1.92 ± 0.97 | |
| Post-trigger | 1.97 ± 4.32 | 0.74 ± 0.33 | 1.39 ± 3.19 | 38.33 ± 27.33 | 28.94 ± 18.48 | 33.87 ± 23.73 | |
| Oocyte retrieval | 0.48 ± 0.61 | 0.34 ± 0.15 | 0.42 ± 0.46 | 3.13 ± 1.99 | 1.82 ± 1.06* | 2.56 ± 1.76 | |
Notes:
Data are presented as mean ± standard deviation (SD). The p-values indicate statistical significance (*p < 0.05) when comparing the LMRG and HMRG within each protocol group; LMRG, Low MII oocytes rate group; HMRG, High MII oocytes rate group; n (%), Number and percentage of patients in each group.
Potential predictors of oocyte maturation
In univariable analysis (Table 3), for the GnRH-agonist group, higher E2_RoV1 and P_RoV2 levels were associated with increased MII oocyte rates compared to low levels (Intermediate E2_RoV1: OR = 1.04 (95% CI [1.01–1.08]), p = 0.02; High E2_RoV1: OR = 5.07 [1.57–18.15], p = 0.01; Intermediate P_RoV2: OR = 1.44 [1.21–1.81], p < 0.01; High P_RoV2: OR = 7.21 [2.43–23.67], p < 0.01). In the GnRH-antagonist group, only higher P_RoV2 levels were potential predictors of higher MII rates (Intermediate P_RoV2: OR = 1.43 [1.09–2.05], p = 0.02; High P_RoV2: OR = 5.20 [1.38–22.27], p = 0.02).
| Indicator | GnRH-agonist | GnRH-antagonist | |||||||
|---|---|---|---|---|---|---|---|---|---|
| β | SE | OR (95% CI) | p value | β | SE | OR (95% CI) | p value | ||
| Age, years | −0.05 | 0.05 | 0.95 (0.86–1.06) | 0.38 | −0.03 | 0.08 | 0.97 (0.83–1.13) | 0.73 | |
| Body mass index, kg/m2 | 0.06 | 0.08 | 1.07 (0.90–1.27) | 0.45 | 0.22 | 0.14 | 1.24 (0.95–1.66) | 0.12 | |
| Number of gestation history | 0.42 | 0.56 | 1.52 (0.50–4.87) | 0.46 | 0.58 | 0.97 | 1.78 (0.26–14.82) | 0.55 | |
| Number of abortion history | 0.02 | 0.27 | 1.02 (0.59–1.72) | 0.95 | 0.12 | 0.29 | 1.13 (0.64–2.06) | 0.67 | |
| Number of production | 0.07 | 0.20 | 1.07 (0.73–1.59) | 0.71 | 0.26 | 0.25 | 1.30 (0.82–2.24) | 0.30 | |
| Antral follicle count | 0.21 | 0.12 | 1.24 (0.98–1.59) | 0.08 | 0.18 | 0.13 | 1.20 (0.93–1.58) | 0.17 | |
| Baseline of AMH, ng/ml | 0.31 | 0.21 | 1.37 (0.93–2.20) | 0.14 | 0.09 | 0.44 | 1.10 (0.46–2.63) | 0.83 | |
| E2_RoV1 | Low | Ref. | Ref. | Ref. | Ref. | Ref. | Ref. | Ref. | Ref. |
| Intermediate | 0.04 | 0.02 | 1.04 (1.01–1.08) | 0.02 | 0.39 | 0.88 | 1.48 (0.27–9.18) | 0.65 | |
| High | 1.62 | 0.62 | 5.07 (1.57–18.15) | 0.01 | 0.68 | 0.47 | 1.97 (0.84–5.61) | 0.15 | |
| E2_RoV2 | Low | Ref. | Ref. | Ref. | Ref. | Ref. | Ref. | Ref. | Ref. |
| Intermediate | −0.10 | 0.56 | 0.91 (0.30–2.75) | 0.87 | 1.39 | 0.82 | 4.00 (0.84–22.08) | 0.09 | |
| High | 0.45 | 0.56 | 1.58 (0.53–4.81) | 0.42 | 0.22 | 0.84 | 1.25 (0.24–6.78) | 0.79 | |
| P_RoV1 | Low | Ref. | Ref. | Ref. | Ref. | Ref. | Ref. | Ref. | Ref. |
| Intermediate | 0.68 | 0.47 | 1.97 (0.84–5.61) | 0.15 | 1.79 | 0.90 | 6.00 (1.19–46.18) | 0.05 | |
| High | 0.22 | 0.70 | 1.25 (0.31–4.99) | 0.75 | 2.01 | 1.07 | 7.50 (1.04–77.74) | 0.06 | |
| P_RoV2 | Low | Ref. | Ref. | Ref. | Ref. | Ref. | Ref. | Ref. | Ref. |
| Intermediate | 0.36 | 0.10 | 1.44 (1.20–1.81) | <0.01 | 0.36 | 0.16 | 1.43 (1.09–2.05) | 0.02 | |
| High | 1.97 | 0.58 | 7.20 (2.43–23.67) | <0.01 | 1.65 | 0.70 | 5.20 (1.38–22.27) | 0.02 | |
| FSH_RoV1 | Low | Ref. | Ref. | Ref. | Ref. | Ref. | Ref. | Ref. | Ref. |
| Intermediate | 0.23 | 0.52 | 1.26 (0.45–3.54) | 0.66 | −0.22 | 0.65 | 0.80 (0.22–2.88) | 0.73 | |
| High | −0.15 | 0.60 | 0.86 (0.26–2.77) | 0.81 | 0.00 | 1.48 | 1.00 (0.04–27.71) | 0.99 | |
| FSH_RoV2 | Low | Ref. | Ref. | Ref. | Ref. | Ref. | Ref. | Ref. | Ref. |
| Intermediate | −1.04 | 1.20 | 0.35 (0.02–3.06) | 0.39 | 0.78 | 1.14 | 2.19 (0.24–22.39) | 0.49 | |
| High | 0.53 | 0.66 | 1.69 (0.47–6.59) | 0.43 | 0.88 | 0.71 | 2.40 (0.61–10.28) | 0.22 | |
| LH_RoV1 | Low | Ref. | Ref. | Ref. | Ref. | Ref. | Ref. | Ref. | Ref. |
| Intermediate | −0.64 | 0.49 | 0.53 (0.2–1.36) | 0.19 | 0.56 | 0.79 | 1.75 (0.37–8.72) | 0.48 | |
| High | 0.00 | 1.44 | 1.00 (0.04–26.32) | 0.99 | −1.57 | 1.27 | 0.21(0.01- 2.01) | 0.22 | |
| LH_RoV2 | Low | Ref. | Ref. | Ref. | Ref. | NA | NA | NA | NA |
| Intermediate | −0.92 | 0.59 | 0.40 (0.12–1.20) | 0.12 | NA | NA | NA | NA | |
| High | 1.28 | 0.92 | 3.60 (0.66–28.5) | 0.16 | NA | NA | NA | NA | |
Notes:
- NA
-
not available
- SE
-
standard error
- OR
-
odds ratio
- CI
-
confidence interval
- Ref
-
reference
Independent predictors of oocyte maturation
In multivariable analysis (Table 4), higher P_RoV2 remained a significant independent predictor of increased MII rates in both protocol groups after adjusting for confounders. Intermediate P_RoV2 had an adjusted OR of 9.46 (95% CI [2.88–36.06], p < 0.01) in the agonist group and 14.67 (3.05–93.87, p < 0.01) in the antagonist group for higher MII rates versus low P_RoV2. High P_RoV2 was also associated with higher odds of increased MII rates in the antagonist group (OR = 8.00 [1.16–75.78]; p = 0.04). Nevertheless, E2_RoV1, associated with MII rates in univariable agonist analysis, did not remain significant in multivariable models.
| Indicator | GnRH-agonist | GnRH-antagonist | |||||||
|---|---|---|---|---|---|---|---|---|---|
| β | SE | OR (95% CI) | p value | β | SE | OR (95% CI) | p value | ||
| Constant | −2.24 | 0.65 | 0.11 (0.03–0.34) | <0.01 | −1.39 | 0.56 | 0.25 (0.07–0.68) | 0.01 | |
| P_RoV2 | Low | Ref. | Ref. | Ref. | Ref. | Ref. | Ref. | Ref. | Ref. |
| Intermediate | 2.25 | 0.64 | 9.46 (2.88–36.06) | <0.01 | 2.69 | 0.86 | 14.67 (3.05–93.87) | <0.01 | |
| High | 1.29 | 0.73 | 3.62 (0.88–16.03) | 0.07 | 2.08 | 1.03 | 8.00 (1.16–75.78) | 0.04 | |
| E2_RoV1 | Low | Ref. | Ref. | Ref. | Ref. | NA | NA | NA | NA |
| Intermediate | 0.75 | 0.68 | 2.12 (0.56–8.49) | 0.27 | NA | NA | NA | NA | |
| High | 1.34 | 0.70 | 3.82 (0.99–16.06) | 0.05 | NA | NA | NA | NA | |
Notes:
- NA
-
not available
- SE
-
standard error
- OR
-
odds ratio
- CI
-
confidence interval
- Ref
-
reference
The validation of multivariable regression models
C-indices confirmed acceptable predictive ability in both the agonist (0.83, 95% CI [0.73–0.92]) and antagonist (0.77, 0.63–0.90) groups. ROC analyses (Fig. 2) yielded AUCs of 0.79 and 0.81 respectively, further validating the overall predictive performance.
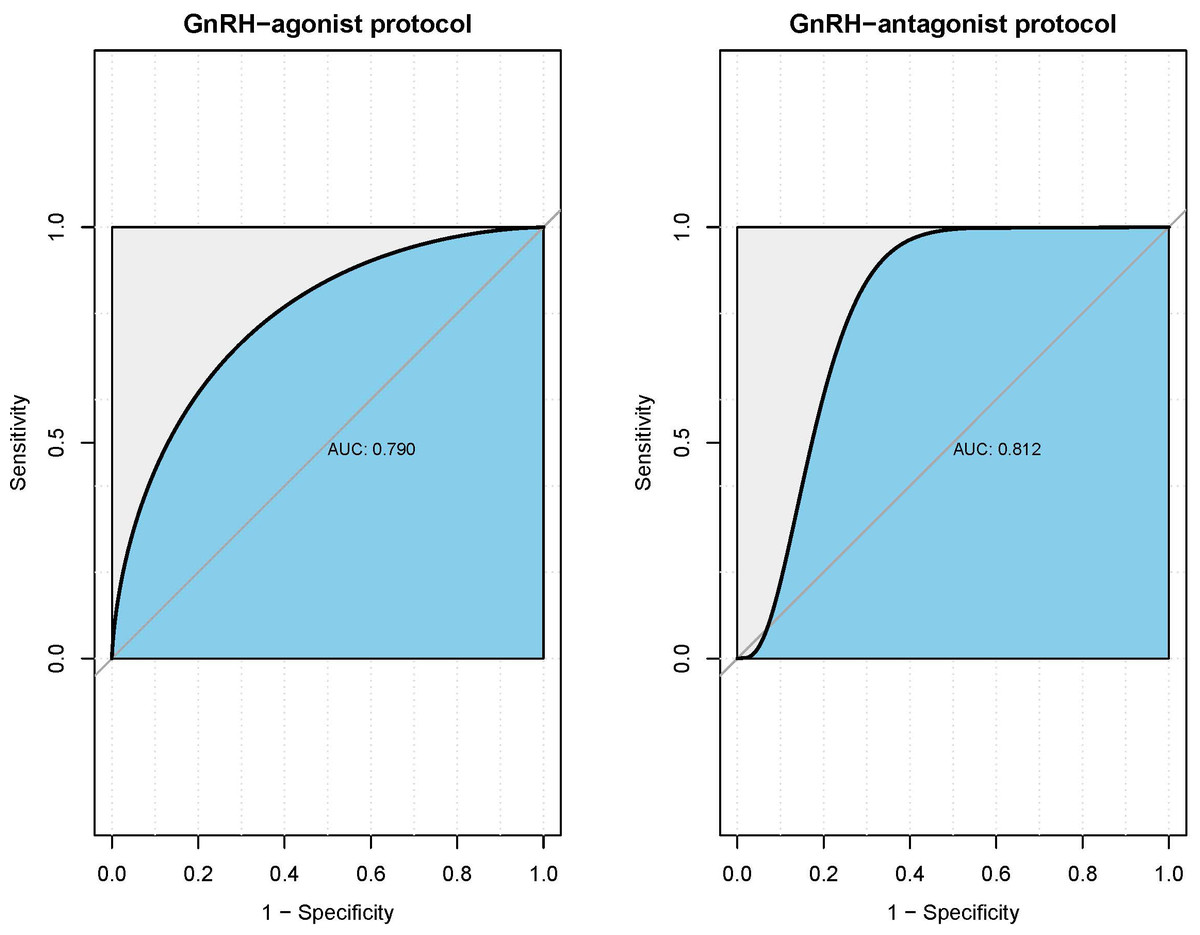
Figure 2: ROC curves for the verification of models both in GnRH-agonist protocol group and GnRH-antagonist protocol group.
The ROC curves illustrate the predictive performance of the multivariable regression models in the GnRH-agonist protocol (left) and GnRH-antagonist protocol (right) groups. The AUC values were 0.790 for the agonist protocol and 0.812 for the antagonist protocol, indicating good predictive ability. The shaded blue areas represent the AUC, with higher values indicating better model performance. The diagonal grey line represents the line of no discrimination, where an AUC of 0.5 would indicate a model with no predictive ability.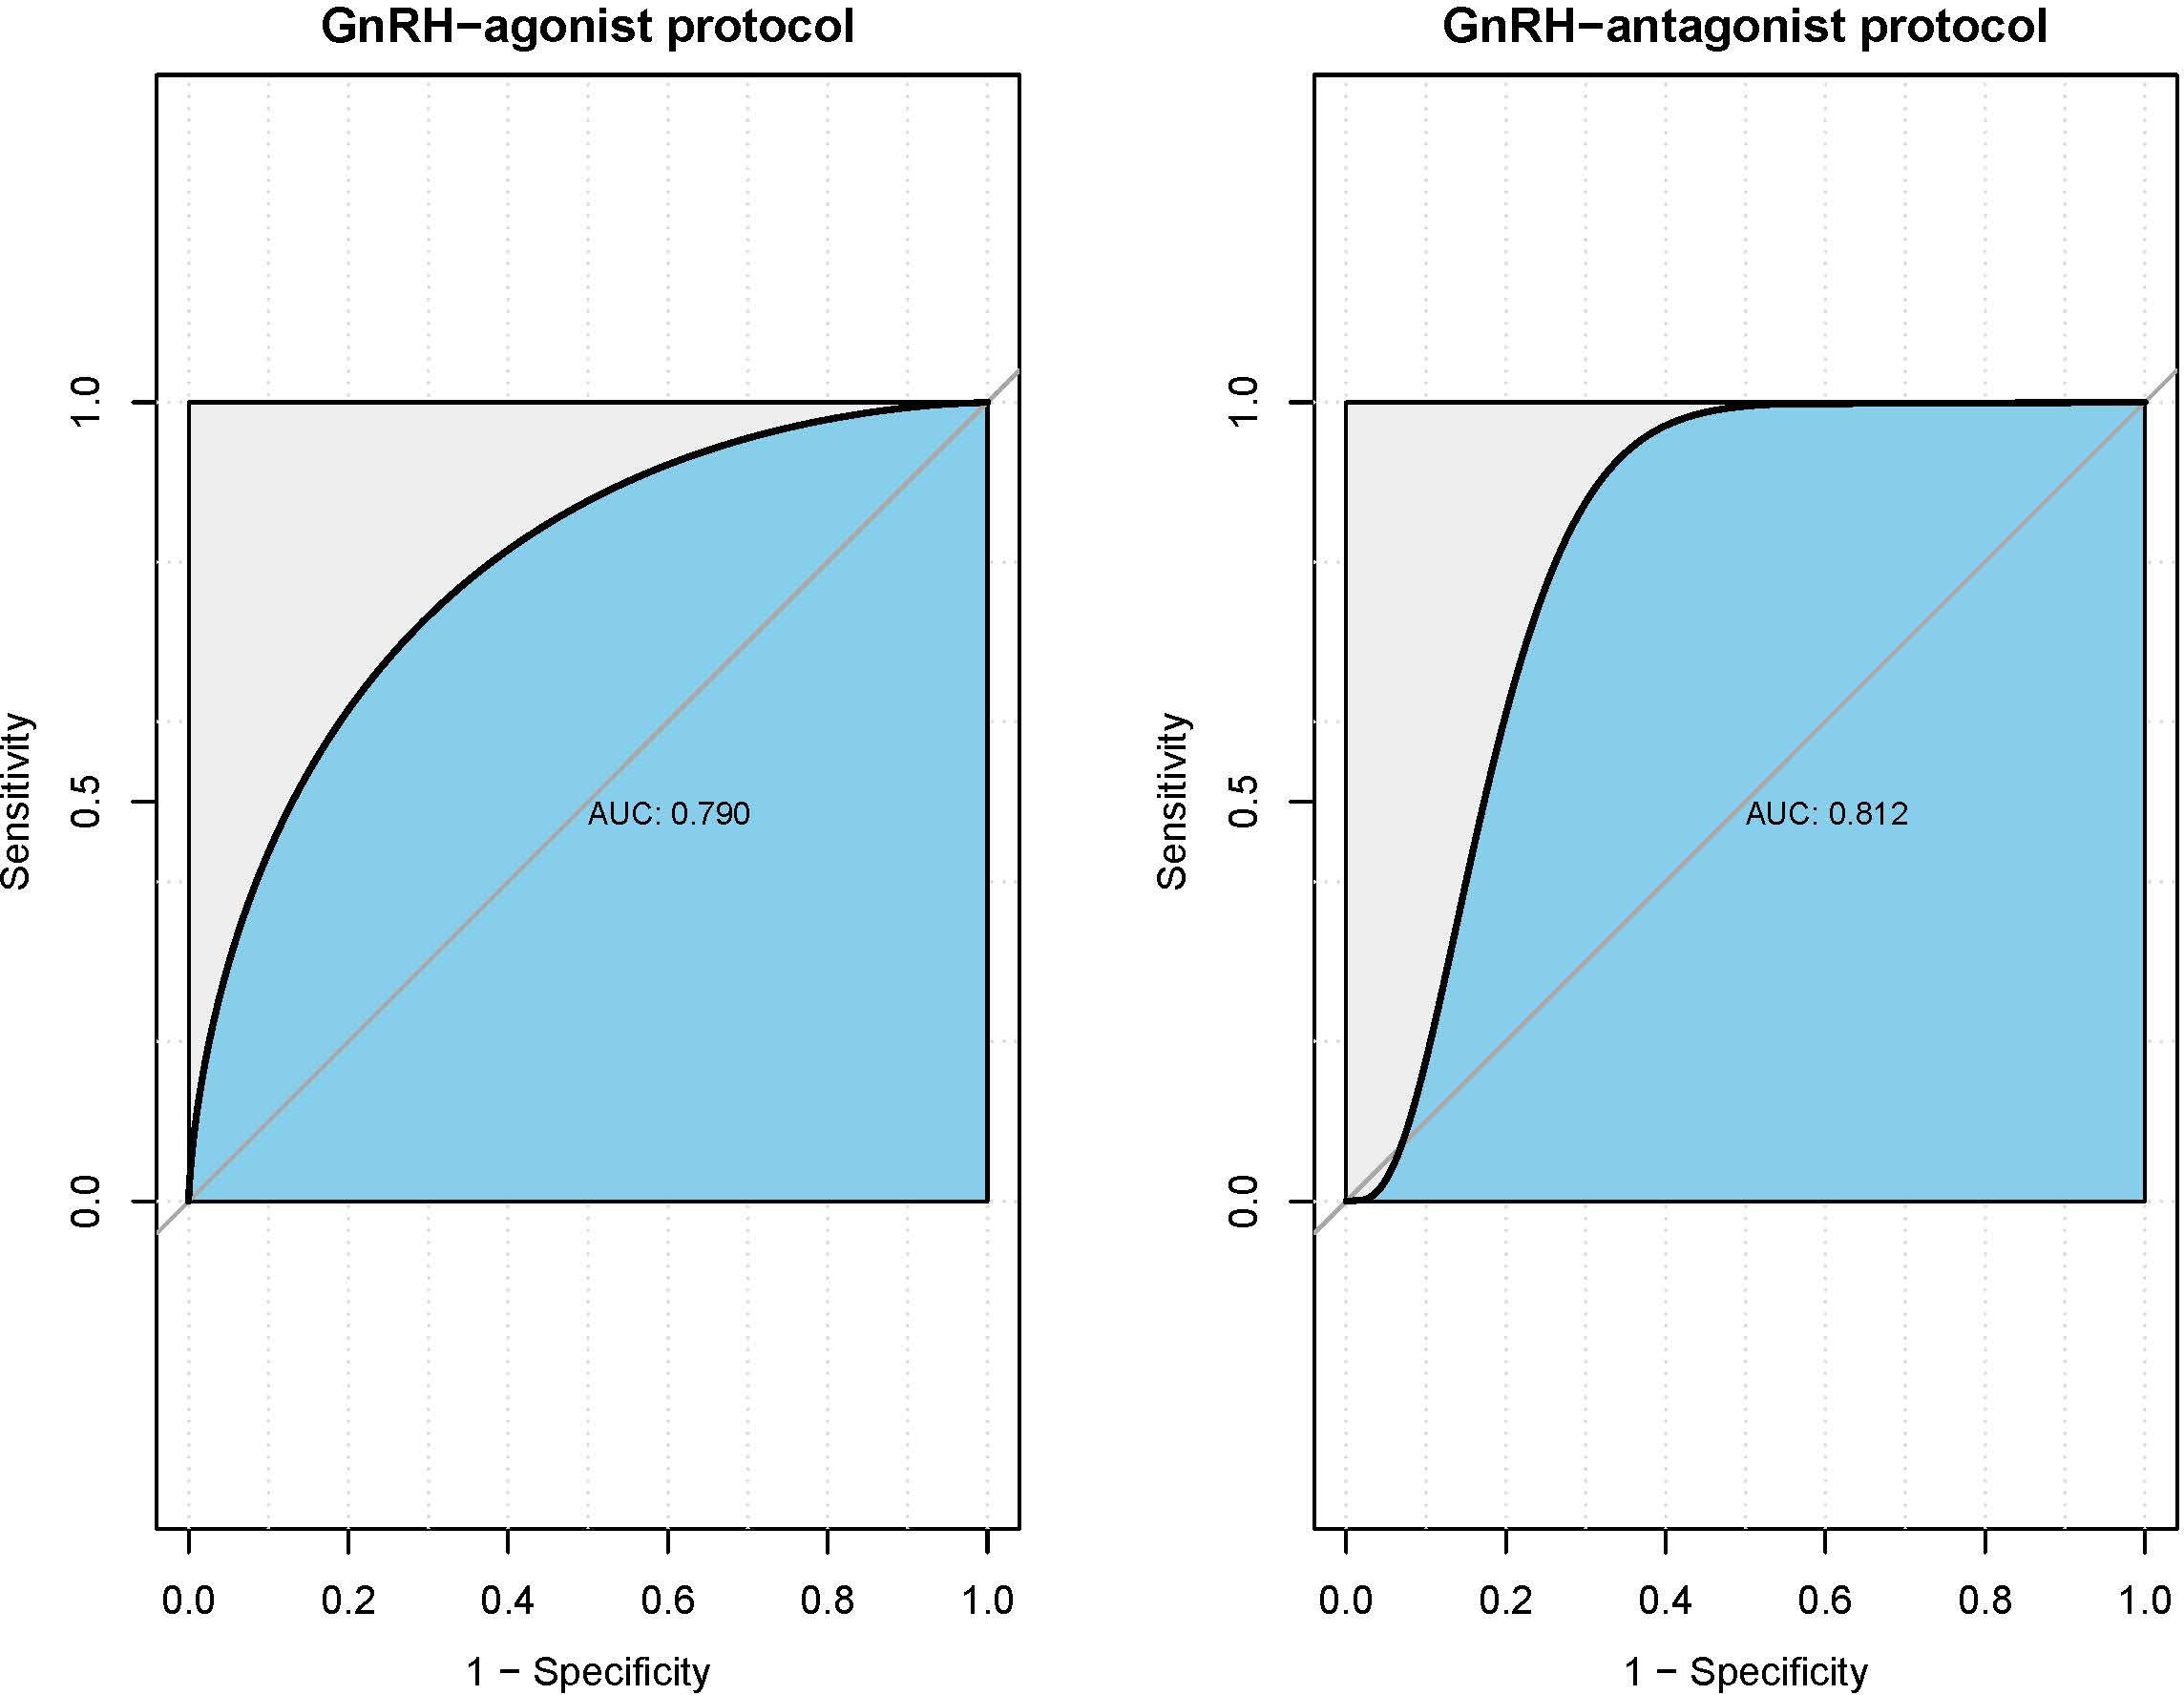
Discussion
IVF-ET has emerged as a highly effective approach for treating infertility, experiencing rapid advancements in recent decades (Ashkenazi et al., 2000; Capper et al., 2022; Fisch et al., 1990). Optimizing protocols to obtain a larger number of viable and mature oocytes is crucial for achieving positive pregnancy outcomes (Ganer Herman et al., 2022; Kummer et al., 2013; O’Brien, Wingfield & O’Shea, 2019). Consequently, it has become increasingly critical for reproductive endocrinologists to tailor individualized treatment protocols based on patients’ specific characteristics. The attainment of high-quality mature oocytes during the COH procedure plays a pivotal role in the improvement of pregnancy outcomes (Burks et al., 2015; Sarais et al., 2016). Therefore, identifying potential indicators to evaluate oocyte maturation has become a necessary pursuit.
In this study, we demonstrated the potential predictive patterns of integrated delta-FRHs levels on the rate of MII oocytes in patients undergoing ovarian stimulation protocols. Univariable analysis revealed a significant association between E2_RoV1 and MII oocyte rate in the GnRH-agonist protocol group, aligning with previous findings that suggest estradiol levels may reflect follicular development and oocyte quality (Lv et al., 2020; Revelli et al., 2009). However, this association was not significant in the GnRH-antagonist group, potentially due to differences in the mechanisms of action between the protocols (Copperman & Benadiva, 2013; Kumar & Sharma, 2014). Notably, P_RoV2 showed consistent significance in predicting MII oocyte rate in both protocol groups. Multivariable analysis confirmed the predictive ability of P_RoV2 in oocyte maturation rate in both groups, while E2_RoV1 did not exhibit a significant association. The calculated C-indices and AUC values validated the reliability and predictive power of the multivariable regression models.
Our findings suggest that when P_RoV2 exceeds a 5-fold change, it may serve as an indicator for an ideal rate of mature MII oocytes if oocyte retrieval is performed at the planned time point. This implies that higher P_RoV2 could potentially be associated with improved oocyte maturation and developmental competence in normal ovarian reserve patients, consistent with previous studies demonstrating the importance of progesterone levels in follicular development and oocyte quality (Kalakota et al., 2022; Lonergan, 2011; Long et al., 2021). Several studies have reported that elevated progesterone levels on the day of hCG administration are associated with higher numbers of mature oocytes retrieved and improved embryo quality (Baldini et al., 2018; Long et al., 2021). The proposed mechanisms involve progesterone’s role in facilitating nuclear and cytoplasmic maturation of oocytes, as well as promoting cumulus cell expansion and oocyte detachment from the follicle wall (Kalakota et al., 2022). Conversely, our results indicate that when the fold change in P_RoV2 is less than 5, clinicians may need to consider adjusting their strategies for oocyte retrieval, which may involve prolonging the time point of oocyte retrieval, to allow for a greater likelihood of achieving a desirable rate of MII oocytes. This is supported by evidence that premature progesterone elevation can have detrimental effects on endometrial receptivity and implantation potential (Lawrenz, Melado & Fatemi, 2018). Delaying oocyte retrieval may allow for further progesterone rise and improved oocyte maturation. However, the optimal progesterone threshold and timing adjustments require further investigation, as excessive delays could compromise oocyte quality (Cortes-Vazquez et al., 2022).
The observed correlation between P_RoV2 and the rate of MII oocytes highlights the potential utility of P_RoV2 as a predictive marker in optimizing the success of assisted reproductive techniques. By considering the fold change in P_RoV2, clinicians can make informed decisions regarding the timing of oocyte retrieval and tailor their protocols accordingly. However, it is important to note that individual patient characteristics, such as ovarian reserve and response to ovarian stimulation, may influence the relationship between P_RoV2 and oocyte maturation (Jirge et al., 2022). Further research is needed to investigate these potential confounding factors and validate the clinical applicability of P_RoV2 as a predictive biomarker.
Previous studies have explored various indicators to predict ovarian responsiveness and oocyte maturation, including AMH, AFC, basal FRH, ovarian sensitivity, follicular sensitivity, and oocyte index (Capper et al., 2022; Laqqan & Yassin, 2022; Molka et al., 2022; Nisar Omar Hafizi et al., 2022). The follicular output rate (FORT) is one of the potential indicators for the prediction of MII oocytes after ovarian stimulation (Gallot et al., 2012; Zhang et al., 2013). Rodriguez-Fuentes et al. (2022) obtained the ideal effect for the prediction of the number of mature oocytes by the volume-based follicular output rate (FORT-V). However, these machine-based estimation models may have limited clinical applicability. Pors et al. (2022) reported that oocyte nuclei could also be enlarged during oocyte maturation and found a positive correlation between oocyte diameter and MII oocytes. Additionally, Cortes-Vazquez et al. (2022) established an algorithm based on baseline serum FRH levels, including luteinizing and estradiol, to predict ovarian response in IVF/ICSI cycles. Nevertheless, there are potential limitations among these indicators for predicting oocyte maturation, as there were significant fluctuations at each time point in different patients, even at the same time for a single hormone in one patient. However, FRH levels persistently vary longitudinally during the COH procedure. Therefore, it is possible to reduce the heterogeneity caused by each time point for FRH once considering the magnitude of longitudinal FRH variation.
To mitigate potential biases associated with single time point measurements and address limitations in previous studies, we implemented a method of delta-FRHs method, which involved calculating the rate of female hormonal changes based on measurements taken at different interval time within the same patient. This approach effectively addressed the potential bias arising from significant heterogeneity in baseline indicators. Furthermore, we evaluated the final predictive indicators using C-indices and ROC curves, achieving favorable results. Additionally, the predictive ability of delta-FRHs suggests that an integrated profile or model may be more informative than evaluating a single hormone at single time. Several prediction models have combined AMH, antral follicle count, age, and other markers (Jeve, 2013; Liu et al., 2023), reflecting the multifactorial determinants of ovarian response. Our findings also indicate that longitudinal trends in estradiol also should be further evaluated in GnRH-agonist protocol to optimize oocyte retrieval timing specifically, even though it is not significant in our present cohort.
There are several limitations to the current study. The retrospective nature introduces potential bias and the inability to control for confounding variables as effectively as in a prospective study design. We aimed to minimize bias by enrolling women with normal ovarian reserve using strict inclusion/exclusion criteria, but unmeasured confounders may still influence the findings. Furthermore, the limited sample size, especially for less frequent delta-FRH categories such as high P_RoV2 category in the agonist group, reduces statistical power for subgroup analyses and introduces uncertainty around the effect estimates and reduces the generalizability of findings to these smaller subpopulations. While the overall sample of 118 cases is reasonable, a larger prospective study is needed to validate the results with greater precision and generalizability. Increasing the sample size would provide more stable estimates of odds ratios and tighter confidence intervals for assessing delta-FRH predictors. It is well known that FRHs and outcomes can be influenced by different stimulation protocols, as well as the dosage and duration of treatment, such as the use of gonadotropin-releasing hormone agonists and hCG for triggering (He et al., 2022). However, we found equivalent results in the baseline comparisons of the total dose and duration of gonadotropin and hMG administration between the high and low MII oocyte rate groups, which helps minimize potential heterogeneity among basic characteristics to some extent. Additionally, while we adjusted for known potential confounders, the possibility of residual confounding from unmeasured variables cannot be ruled out. Factors such as lifestyle, environmental exposures, body mass index, cause of infertility, and details of medications used during ovarian stimulation, or genetic determinants of ovarian response may influence both FRH dynamics and oocyte maturation, thereby affecting the observed associations.
Our study demonstrated the potential predictive value of E2_RoV1 and P_RoV2 in the rate of MII oocytes. However, it is important to recognize that patients with abnormal ovarian function or those who underwent direct stimulation were not included in our study cohort. The specific characteristics and responses of these patient groups may differ, and as a result, the predictors and predictive models for oocyte maturation could not be applicable to patients who underwent direct stimulation or those with abnormal ovarian function. Additionally, it is important to note that while our study demonstrates significant associations between peri-trigger delta-FRH levels and oocyte maturation rates, the observational nature of the study does not allow for causal inferences. Prospective interventional studies are needed to determine whether modifying trigger timing based on P_RoV2 thresholds can directly improve oocyte maturation and IVF outcomes. Moreover, the post-trigger level of LH might be influenced by the triggering protocol, including gonadotrophin releasing hormone analogue (GnRH-a), while there was no significant influence on the FRHs at baseline or the day of the trigger. We have not considered the LH level as a potential predictor in this study based on this reason and lack of significant association in the univariable analysis. Another limitation could be technical problems during oocyte retrieval, as a mature oocyte may not be retrievable due to technical difficulties. To minimize the difference between cases, we only enrolled cases where oocyte retrieval procedures were performed by two senior reproductive endocrinologists.
Conclusions
Our study underscores the potential predictive significance of integrated delta-FRH levels, specifically highlighting P_RoV2, in assessing the rate of MII oocytes among patients undergoing ovarian stimulation. This contributes to a deeper understanding of oocyte maturation dynamics and offers valuable insights for tailoring individualized treatment protocols in COH during IVF-ET for patients with normal ovarian reserve. Additional prospective research is required to confirm the predictive efficacy. Our findings suggest that integrating longitudinal changes in FRH levels could enhance the precision of oocyte retrieval timing and optimize personalized treatment strategies.
Supplemental Information
Raw data
The original data which enrolled into the whole analysis of this study.