
Integrative analysis of the transcriptome and metabolome provides insights into polysaccharide accumulation in Polygonatum odoratum (Mill.) Druce rhizome
- Published
- Accepted
- Received
- Academic Editor
- Sushil Kumar
- Subject Areas
- Agricultural Science, Biochemistry, Molecular Biology, Plant Science
- Keywords
- Polygonatum Odoratum (Mill.) Druce, Polysaccharide accumulation, Transcriptome, Metabolome
- Copyright
- © 2024 Pan et al.
- Licence
- This is an open access article distributed under the terms of the Creative Commons Attribution License, which permits unrestricted use, distribution, reproduction and adaptation in any medium and for any purpose provided that it is properly attributed. For attribution, the original author(s), title, publication source (PeerJ) and either DOI or URL of the article must be cited.
- Cite this article
- 2024. Integrative analysis of the transcriptome and metabolome provides insights into polysaccharide accumulation in Polygonatum odoratum (Mill.) Druce rhizome. PeerJ 12:e17699 https://doi.org/10.7717/peerj.17699
Abstract
Background
Polygonatum odoratum (Mill.) Druce is a traditional Chinese herb that is widely cultivated in China. Polysaccharides are the major bioactive components in rhizome of P. odoratum and have many important biological functions.
Methods
To better understand the regulatory mechanisms of polysaccharide accumulation in P. odoratum rhizomes, the rhizomes of two P. odoratum cultivars ‘Y10’ and ‘Y11’ with distinct differences in polysaccharide content were used for transcriptome and metabolome analyses, and the differentially expressed genes (DEGs) and differentially accumulated metabolites (DAMs) were identified.
Results
A total of 14,194 differentially expressed genes (DEGs) were identified, of which 6,689 DEGs were down-regulated in ‘Y10’ compared with those in ‘Y11’. KEGG enrichment analysis of the down-regulated DEGs revealed a significant enrichment of ‘starch and sucrose metabolism’, and ‘amino sugar and nucleotide sugar metabolism’. Meanwhile, 80 differentially accumulated metabolites (DAMs) were detected, of which 52 were significantly up-regulated in ‘Y11’ compared to those in ‘Y10’. The up-regulated DAMs were significantly enriched in ‘tropane, piperidine and pyridine alkaloid biosynthesis’, ‘pentose phosphate pathway’ and ‘ABC transporters’. The integrated metabolomic and transcriptomic analysis have revealed that four DAMs, glucose, beta-D-fructose 6-phosphate, maltose and 3-beta-D-galactosyl-sn-glycerol were significantly enriched for polysaccharide accumulation, which may be regulated by 17 DEGs, including UTP-glucose-1-phosphate uridylyltransferase (UGP2), hexokinase (HK), sucrose synthase (SUS), and UDP-glucose 6-dehydrogenase (UGDH). Furthermore, 8 DEGs (sacA, HK, scrK, GPI) were identified as candidate genes for the accumulation of glucose and beta-D-fructose 6-phosphate in the proposed polysaccharide biosynthetic pathways, and these two metabolites were significantly associated with the expression levels of 13 transcription factors including C3H, FAR1, bHLH and ERF. This study provided comprehensive information on polysaccharide accumulation and laid the foundation for elucidating the molecular mechanisms of medicinal quality formation in P. odoratum rhizomes.
Introduction
Polygonatum odoratum (Mill.) Druce (P. odoratum), a traditional Chinese medicine, is a perennial herbaceous plant that is widely distributed in East Asia and Europe (Zhao et al., 2018). In China, P. odoratum is a traditional and bulk Chinese herbal medicine, and the medicinal part of the plant is the rhizome, which has been extensively used to treat certain diseases, such as heart disease, diabetes, and tuberculosis (Yu, 1993). The physiological function of P. odoratum is mainly due to its rhizome, which is rich in various bioactive substances, including polysaccharides, flavonoids, dipeptides, and mineral elements (Chen et al., 2014). Among these active components, high contents of polysaccharides are the markers of the medicinal quality of P. odoratum and exert its pharmacological activity (Jiang et al., 2013).
Polysaccharides, defined as polymer carbohydrates comprising at least ten monosaccharides linked by glycosidic bonds (Zeng et al., 2019), play crucial roles in various physiological processes. In P. odoratum, they form a heteropolysaccharide composed of mannose, galactose, glucose, arabinose, and galacturonic acid, imparting diverse pharmacological properties such as blood glucose reduction, immune regulation, anti-tumor activity, antioxidant effects, anti-fatigue properties, and delayed skin aging (Deng et al., 2012; Zhao et al., 2019a; Zhao et al., 2019b). Studies have discovered that polysaccharides biosynthesis in plants includes three main steps (Zhang et al., 2020; Chen et al., 2022). During the first step, sucrose undergoes a series of transformations to produce uridine diphosphate (UDP)-glucose, guanosine diphosphate (GDP)-mannose, and guanosine diphosphate-fucose (Richez et al., 2007; Decker et al., 2012). The second step is the conversion of UDP-glucose to its nucleotide-diphospho (NDP) monosaccharide (Yin et al., 2011; Li et al., 2022). Finally, different glycosyltransferases (GTs) remove monosaccharides from the sugar nucleotides. The donor binds to the growing polysaccharide polymer, and these repeating units are then polymerized and exported to form plant polysaccharides (Lairson et al., 2008; Pauly et al., 2013). Previous studies have revealed that polysaccharides biosynthesis requires continuous enzymatic reactions related to certain enzymes, including invertase (INV/sacA), hexokinase (HK), GT, and fructokinase (scrK) (Kadokawa, 2011). Sucrose is converted into glucose (Glc) and fructose (Fru) by INV/sacA. HK and scrK convert Glc and Fru into glucose 6-phosphate (Glc-6P) and fructose 6-phosphate (Fru-6P), respectively. Subsequently, they are used to synthesize UDP-glucose (UDP-Glc) and guanosine diphosphomanose (GDP-Man). Finally, UDP-Glc and GDP-Man are synthesised via GT reactions (Kadokawa, 2011).
The genes involved in polysaccharides biosynthesis have been extensively studied in cereal crops, including rice, corn, and wheat (Huang et al., 2021; Li, Tan & Zhang, 2021). A series of key enzymes, such as ADP-glucose pyrophosphorylase (AGPase), granule-bound starch synthase (GBSS), soluble starch synthase (SS), starch branching enzyme (SBE), debranching enzyme (DBE), disproportionating enzyme (DPE), and starch/a-glucan phosphorylase (PHO), have been shown to participate in the synthesis of starch in cereal crops (Li et al., 2021). Certain genes that encode key enzymes have been characterized as significant genes involved in starch biosynthesis. For example, AGPS and AGPL, which encode AGPases, are responsible for synthesising ADP glucose (ADPG), the major substrate for starch synthesis in rice (Prathap & Tyagi, 2020). OsGBP, which encodes a protein that targets starch, is involved in the starch synthesis pathway through its interaction with granule-bound starch synthase I (GBSSI) in rice (Wang et al., 2020). In Chinese herbs, DoCSLA6 and DoGMT are critical for mannan polysaccharides in Dendrobium officinale, and DoCSLA6 overexpression can enhance their content in A. thaliana (He et al., 2017; Yu et al., 2018). Although candidate genes possible related to polysaccharide synthesis in P. odoratum were studied based on comparative transcriptomic analysis of different tissues, no studies have applied multi-omics approaches to explore the pathway, crucial metabolism and key genes governing polysaccharides accumulation in the P. odoratum rhizome, and its mechanism in rhizome remains unknown.
Transcriptomic and metabolomic analyses have emerged as efficient methods for exploring complex biochemical pathways and identifying key genes and metabolites involved in the biosynthesis of bioactive compounds in plants (Park et al., 2021; Yu et al., 2022; Wang et al., 2023a; Wang et al., 2023b). Previous studies have identified the key genes associated with the bioactive metabolite synthesis pathways of plants, such as Dendrobium officinale, Cryptomeria fortunei, Cordyceps militaris, and Tetrastigma hemsleyanum, using transcriptome and metabolome analyses (Yuan et al., 2022; (Zhang et al., 2022; Wang et al., 2023a; Wang et al., 2023b; Hang et al., 2023). Through the transcriptome and metabolome analyses, nine genes (HCT, CHS, CHI, F3H, F3’H, F3’5’H, FLS, DFR, and LAR) have been identified as the key genes for flavonoid biosynthesis in Cryptomeria fortunei (Zhang et al., 2022). In Dendrobium officinale, transcriptome and metabolome profiling have revealed that three key FLS genes regulate flavonoid accumulation (Yuan et al., 2022). These findings have indicated that a transcriptome analysis combined with a metabolome analysis may be an effective method for identifying key genes involved in the biosynthesis of bioactive substances. However, such comprehensive studies identified the key gene networks controlling polysaccharides accumulation in P. odoratum. are lacking.
The rhizome is the main component for medicinal use in P. odoratum because it possesses many medicinal properties, mainly composed of polysaccharides. Thus, in this study, the rhizomes of two varieties of P. odoratum with different polysaccharide contents were used for transcriptome and metabolome analyses. We further focused on the possible key genes and crucial metabolites for polysaccharide accumulation by integrating multi-omics studies. Our findings could provide theoretical support for analysis of polysaccharide accumulation and elucidating the mechanisms underlying medicinal quality formation.
Materials and Methods
Plant materials
Three P. odoratum plants from 11 cultivars were collected from Wangcheng Base (Institute of Chinese Medicine Resources; Hunan Academy of Chinese Medicine) on August 18, 2022. All the cultivars were identified by Associate Professor Gen. Pan at the Institute of Chinese Medicine Resources; Hunan Academy of Chinese Medicine. After washing with sterile distilled water, the rhizomes were immediately frozen in liquid nitrogen and stored at −80 °C for RNA sequencing (three biological samples for two cultivars), metabolomic analysis (six biological samples for two cultivars) and total RNA extraction.
Extraction and determination
Eleven rhizomes of different P. odoratum cultivars were dried at 80 °C to a constant weight and then ground into powder to determine polysaccharides. The total polysaccharides content were detected using the phenol-sulfuric acid method described by the (Chinese Pharmacopoeia Commission, 2020). Determining polysaccharides content from each cultivar included three biological and three technical replicates.
Total RNA extraction, cDNA library construction, sequencing, and analyses
The total RNA from five tissues (rhizomes, stems, leaves, roots, and leaves) of P. odoratum and rhizomes of four genotypes (‘Y3’, ‘Y6’, ‘Y10’ and ‘Y11’) was extracted using an EASYspin Plus Plant RNA Kit (Aidlab Biotechnologies Co., Ltd., Beijing, China). The quality and quantity of the total RNA were assessed on agarose gels and determined using a NanoDrop 2000 instrument (Thermo Fisher Scientific, Waltham, MA, USA), and then 1 µg of total RNA of the rhizome of two cultivars was prepared for cDNA synthesis using an NEBNext® Ultra™ II RNA Library Prep Kit (New England Biolabs Inc., Ipswich, MA, USA) according to the protocol. The quantity and purity of the library were checked using a Qubit 2.0 Fluorometer (Life Technologies, CA, USA) and a Bioanalyzer 2100 system (Agilent Technologies, Santa Clara, CA, USA). Finally, the RNA sequencing was performed using an Illumina NovaSeq 6000 platform (Illumina) by Shanghai OE Biotech Co., Ltd. (Shanghai, China).
After processing and filtering the raw data using Trimmomatic to remove reads containing poly-N and low-quality reads, clean data were obtained. The fragments per kilobase of the exon model per million mapped fragments (FPKM) value for each unigene was calculated using Cufflinks. The differentially expressed genes (DEGs) with P < 0.05 and foldchange (FC)>2 or <0.5 were identified using DESeq. The Gene Ontology (GO) enrichment and Kyoto Encyclopedia of Genes and Genomes (KEGG) pathway enrichment analyses were performed using all the DEGs.
Identification of transcription factors (TF)
The open reading frames (ORFs) of the unigenes were examined and were then aligned to the protein domain of the transcription factor using hmmsearch (http://hmmer.org). The unigenes were annotated using the PlantTFDB (Plant transcription factor database). By comparison with Pfam23.0, the unigenes encoding the transcription factors were further identified.
Rhizome metabolites liquid chromatography-mass spectrometry analysis of rhizome metabolites
The metabolites were extracted from the rhizomes of the two P. odoratum cultivars (approximately 60 mg) using methanol. After extraction, the metabolites were measured using a Dionex Ultimate 3000 RS UHPLC system coupled with a Q-Exactive quadrupole-Orbitrap mass spectrometer (MS) (Thermo Fisher Scientific, Bremen, Germany) at Shanghai Lu-Ming Biotech Co., Ltd. (Shanghai, China).
Untargeted metabolomics data
The obtained GC/MS raw data were analysed using Progenesis QI software (Waters Corporation, Milford, United States) based on four databases: the public databases Human Metabolome Database (HMDB), Lipidmaps (v2.3), and METLIN and a self-built database (Luming Biotech Co., Ltd., Shanghai, China). The differentially accumulated metabolites (DAMs) were identified using the parameters VIP > 1 and p < 0.05. All the DAMs were used for the KEGG pathway enrichment analyses.
Real-time quantitative reverse transcription PCR (RT-qPCR) analysis
The rhizomes of ‘Y11’ and ‘Y10’ were used to validate the RNA-seq data, and five different tissues, including the root, leaf, rhizome, stem, and flower, were collected from ‘Y11’ and used to tissue-specific expression patterns analysis. The reverse transcriptions were performed according to the instructions of the Evo M-MLV RT Premix for qPCR Kit (Accurate, Changsha, China), and the SYBR® Green Premix Pro Taq HS qPCR Kit (Accurate, Changsha, China) was used for the real-time quantitative reverse transcription PCR (qRT-PCR). The actin gene was used as an housekeeping gene as previously reported (Zhang et al., 2020). The primers used for the qRT-PCR analysis are listed in Table S2. The experiment was repeated with at least two biological replicates. The data analysis was performed using the 2−ΔΔCt method.
Statistical analysis
One-way analysis of variance (ANOVA) was performend using IBM SPSS Statistics version 20 software (SPSS Inc., Chicago, IL). Values were mean values and SD of at least two independent experiments with three replicates for each. The correlation coefficients between the content of DAMs and the gene expression levels of DEGs were analysed using Pearson’s correlation coefficient and Student’s t-test.
Results
Determination of rhizome polysaccharide content in eleven P. odoratum cultivars
Eleven P. odoratum cultivars were used to select the two cultivars with the most distinct total polysaccharide contents for the transcriptome and metabolic analyses. As shown in Fig. S1, the polysaccharides contents of the 11 materials ranged from 1.39% to 6.87%. Among these, the polysaccharide content of the ‘Y10’ rhizome was the lowest, whereas that of the Y11 rhizome was the highest (Fig. 1A). In addition, the two materials had significant differences in the rhizome shape and colour (Fig. 1B). Thus, these two cultivars were used for further study.
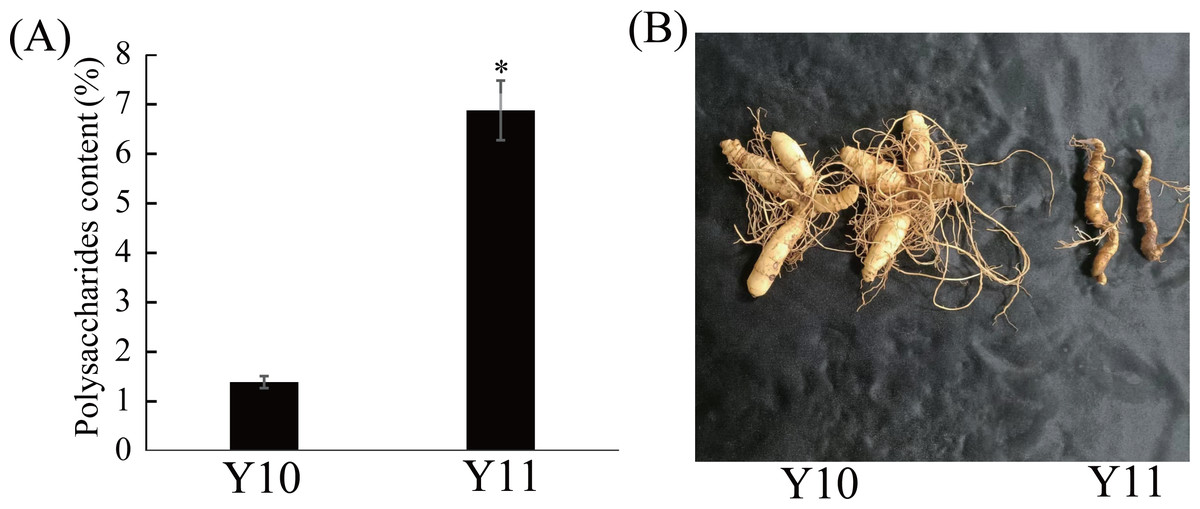
Figure 1: Polysaccharides content (A) and representative images (B) of rhizome in two P. odoratum cultivars ‘Y10’ and ‘Y11’.
All date are means (±SD), n = 3. Significant differences were determined using one-way ANOVA: * P < 0.05.
Differentially expressed genes (DEGs) analysis
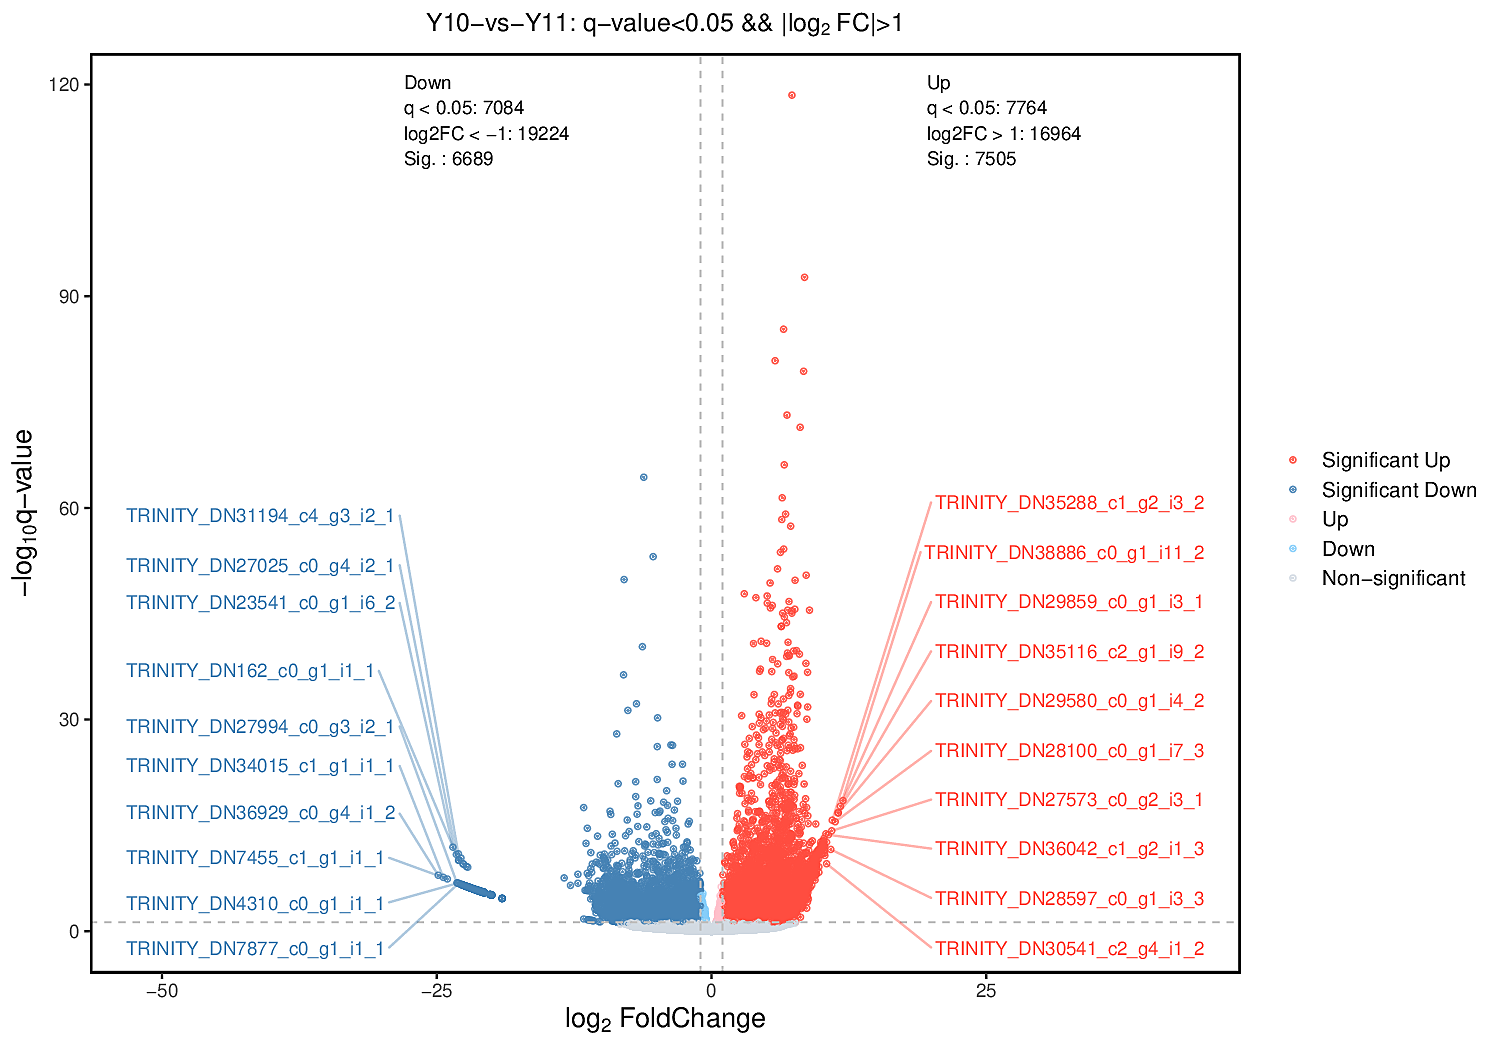
To analyse the differences in the transcriptome profiles associated with polysaccharide accumulation, the ‘Y10’ and ‘Y11’ rhizomes were used for an RNA-seq analysis. A total of 43 clean bases were obtained, and the clean reads varied from 46.51M to 50.44M, with an average Q30-value of 92.96 and GC content of 47.8 (Table S1). After de novo assembly and removing redundant transcripts, the transcriptome contained 71,432 unigenes. Comparing the gene expressions of ‘Y10’ with those in ‘Y11’, a total of 14,194 DEGs were obtained, of which 7,505 genes were upregulated and 6,689 genes were downregulated (Fig. S2). As described in the bubble diagram of the KEGG enrichment results, the top 20 pathway classifications of up-regulated DEGs were enriched in 14 metabolism pathways, which were mainly related to ‘terpenoid backbone biosynthesis’, “alanine, aspartate and glutamate metabolism’ and ‘glycine, serine and threonine metabolism’ (Fig. 2A). Meanwhile, the enrichments of all the downregulated DEGs were associated with 15 metabolism pathways, ‘starch and sucrose metabolism’ was the most abundant, followed by ‘amino sugar and nucleotide sugar metabolism’. Next, a total of 15 pathways classifications were screened from the DEGs related to carbohydrate metabolism. Most of them are most likely involved in polysaccharide accumulation, such as ‘glycolysis/gluconeogenesis’, ‘starch and sucrose metabolism’, ‘fructose and mannose metabolism’, ‘amino sugar and nucleotide sugar metabolism’ and ‘pentose and glucuronate interconversions’. Furthermore, in these pathways related to carbohydrate metabolism, the number of down-regulated DEGs was higher than that of up-regulated DEGs, with the exception of the ‘Citrate cycle (TCA cycle)’ pathway (Fig. 2B).
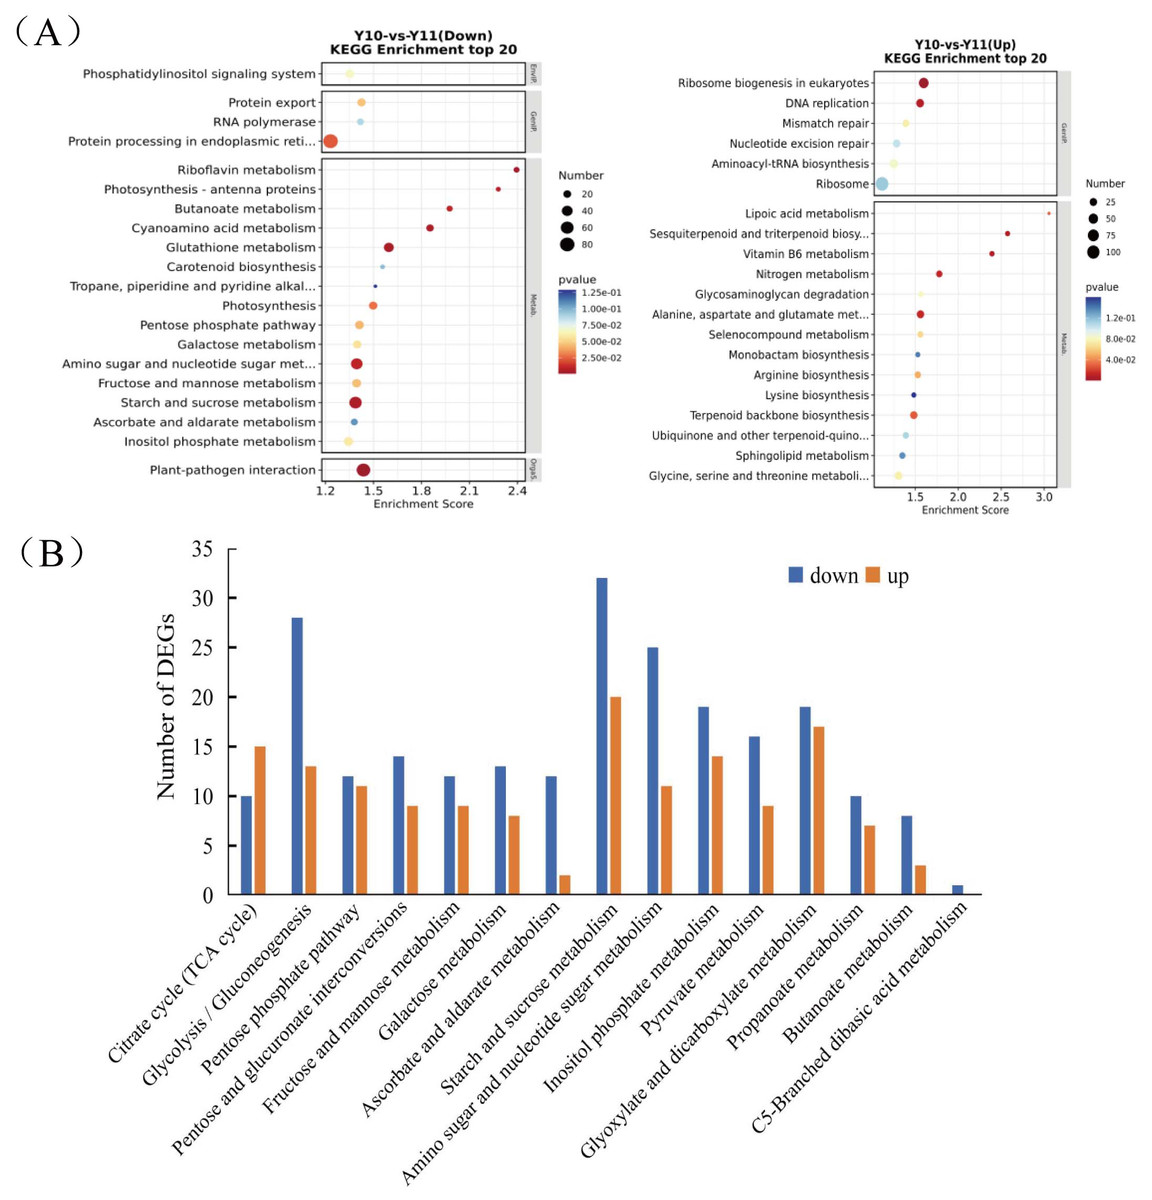
Figure 2: Functional enrichment analysis of differentially expressed genes (DEGs) by Kyoto Encyclopedia of Genes and Genomes (KEGG) pathway-based enrichment analysis.
(A) The top 20 pathway classifications selected by KEGG pathway-based enrichment analysis based on the DEGs between ‘Y11’ and ‘Y10’. (B) The number of up-regulated or down-regulated DEGs related to the 15 pathway classifications for carbohydrate metabolism in the ‘Y10’ vs ‘Y11’ group.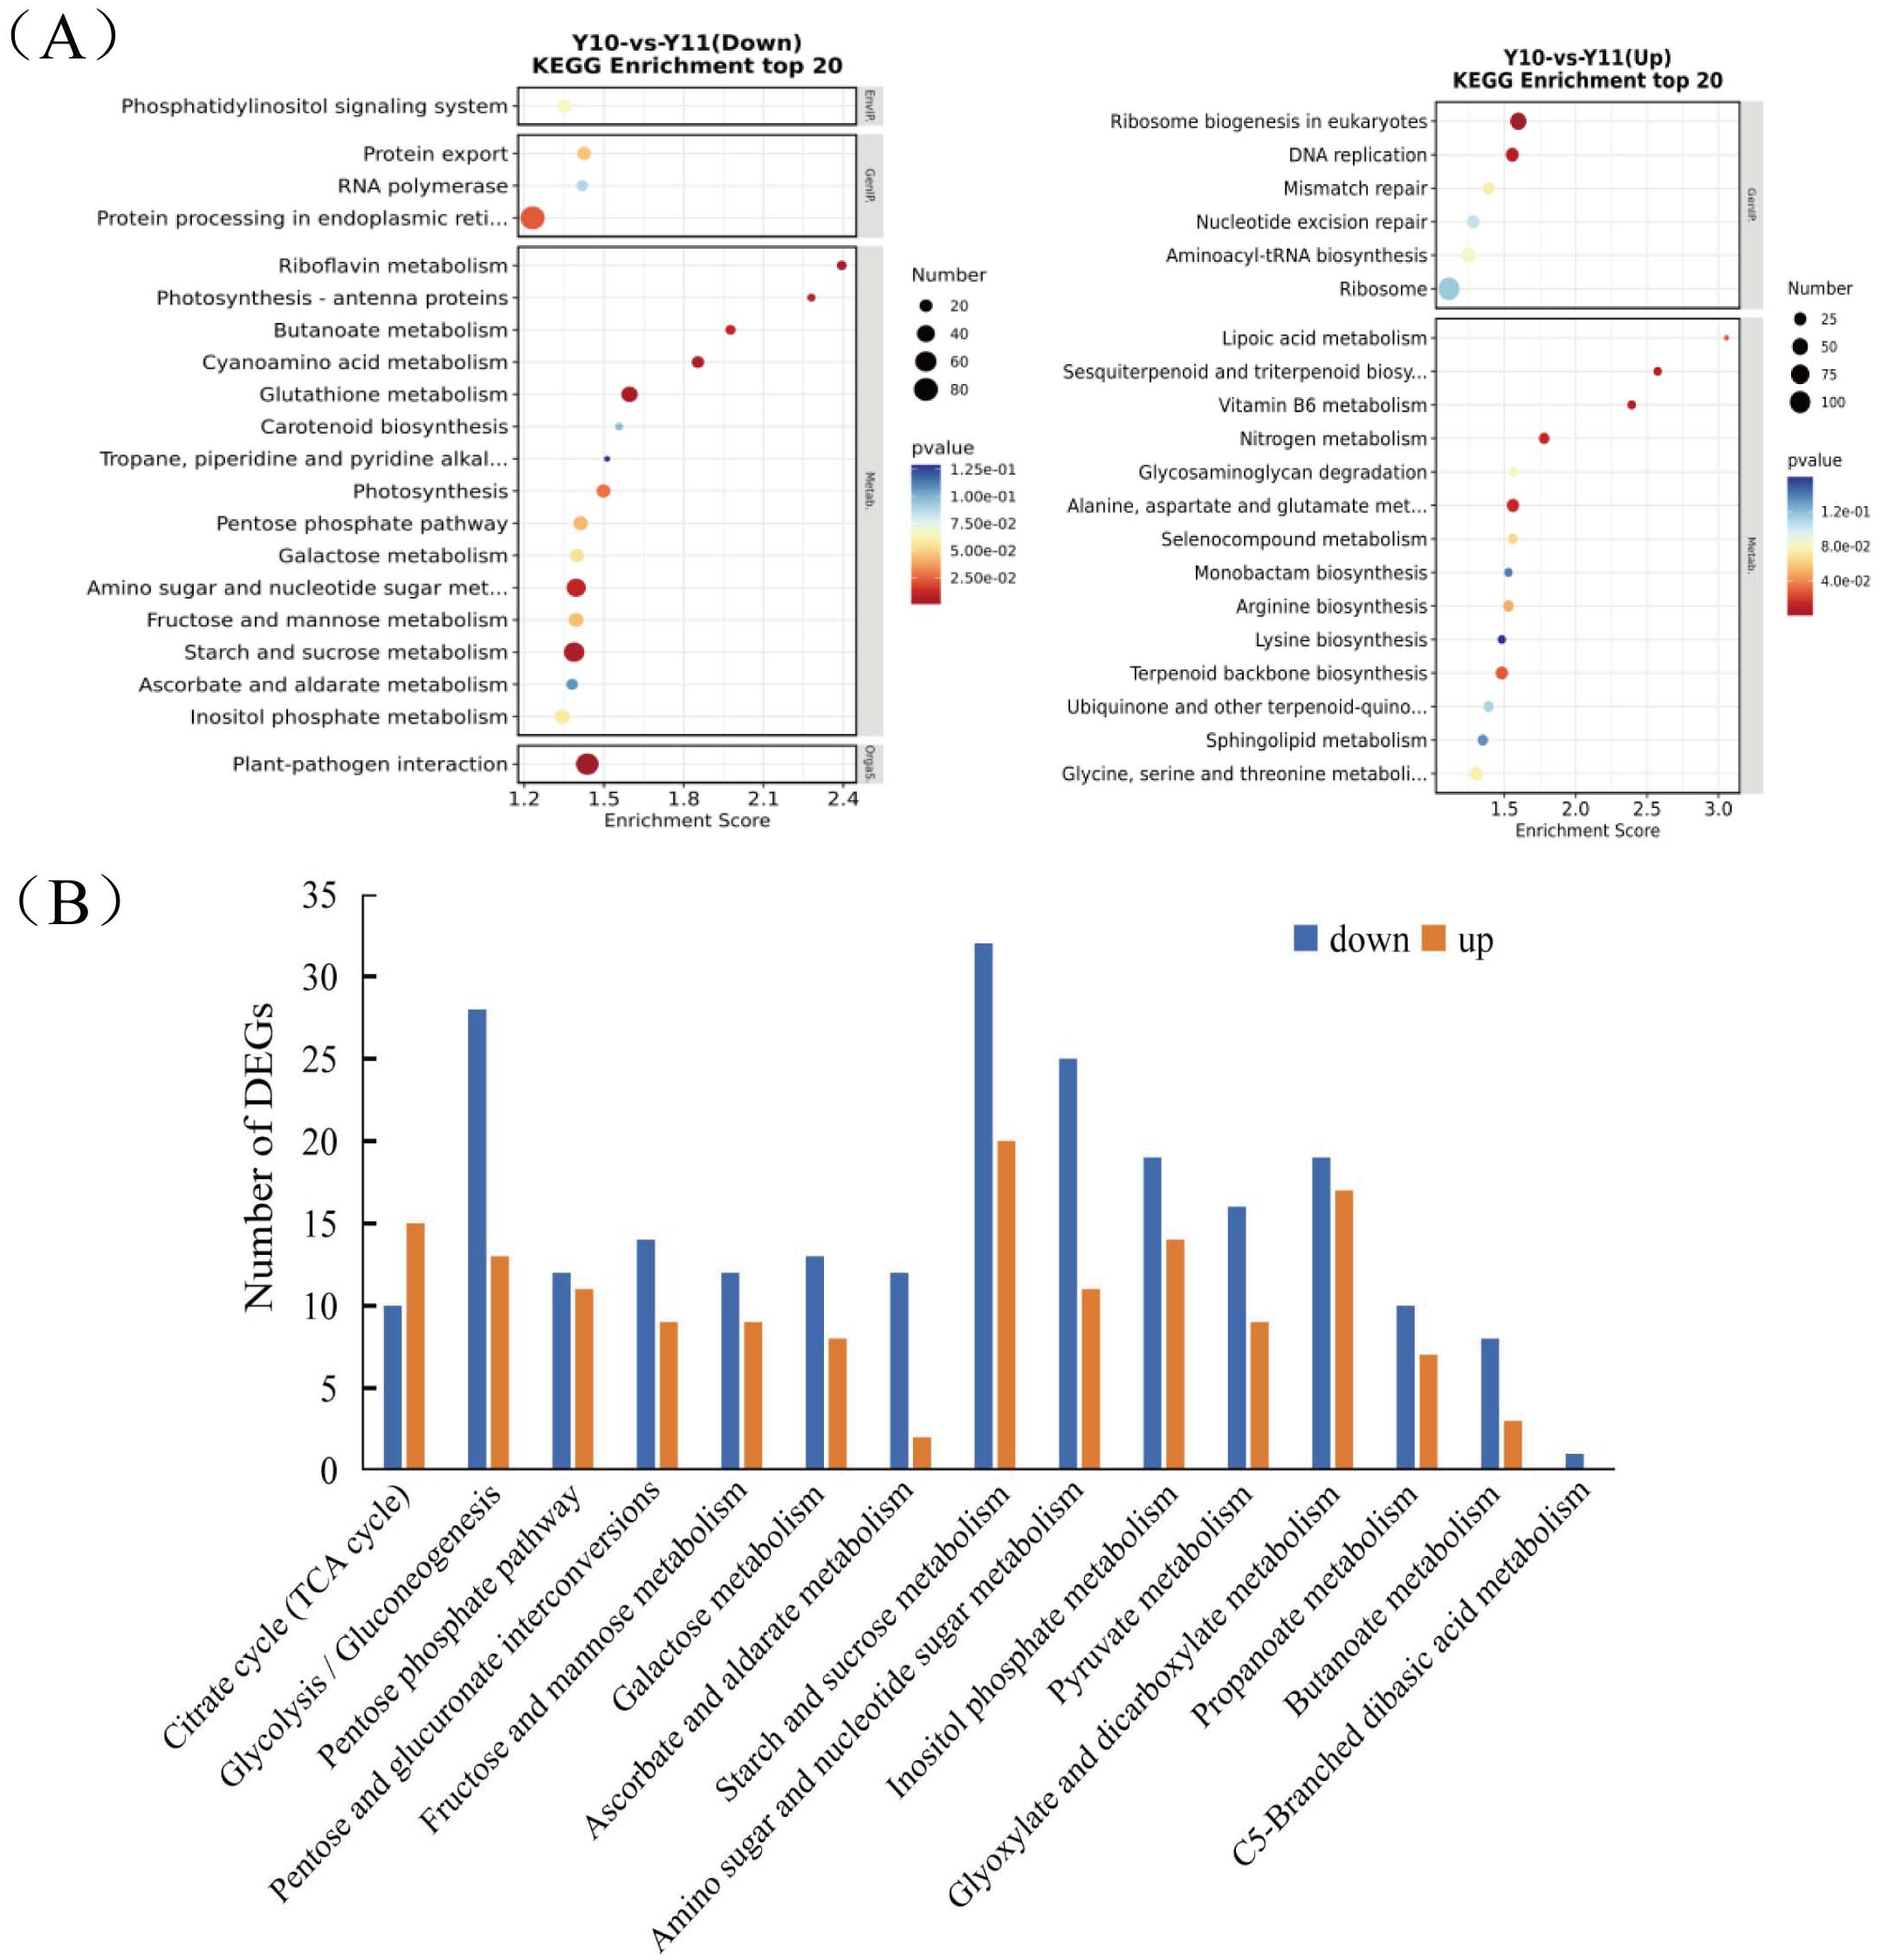
Metabolite profiles of rhizomes in ‘Y11’ and ‘Y10’
To broadly evaluate the metabolite profile differences between ‘Y11’ and ‘Y10’, untargeted metabolomics of the rhizome were performed using UHPLC-QTOF-MS. A total of 312 metabolites with known structures were identified, of which 80 were differentially accumulated metabolites (DAMs) in ‘Y10’ compared to those in ‘Y11’. Of the these DAMs, 52 were downregulated, whereas 28 DAMs were upregulated in ‘Y10’ compared to those in ‘Y11’ (Fig. 3). The KEGG enrichment analysis results indicated that the most abundant downregulated DAMs were enriched in ‘tropane, piperidine and pyridine alkaloid biosynthesis’, followed by ‘ABC transporters’ and ‘pentose phosphate pathway’ (Fig. 4A). In addition, the up-regulated DAMs enrichment of ‘Y10’ vs ‘Y11’ was most significant in ‘ABC transporters’, ‘nitrogen metabolism’ and ‘alanine, aspartate and glutamate metabolism’. Of these, the pathways closely associated with carbohydrate metabolism including ‘the pentose phosphate pathway’, ‘glycolysis/gluconeogenesis’, ‘starch and sucrose metabolism’, ‘galactose metabolism’, ‘amino sugar and nucleotide sugar metabolism’, and ‘fructose and mannose metabolism’ (Fig. 4A). Meanwhile, 12 DAMs, including seven down-regulated and five up-regulated DAMs, were enriched in 11 pathways associated with carbohydrate metabolism (Figs. 4B, 4C).
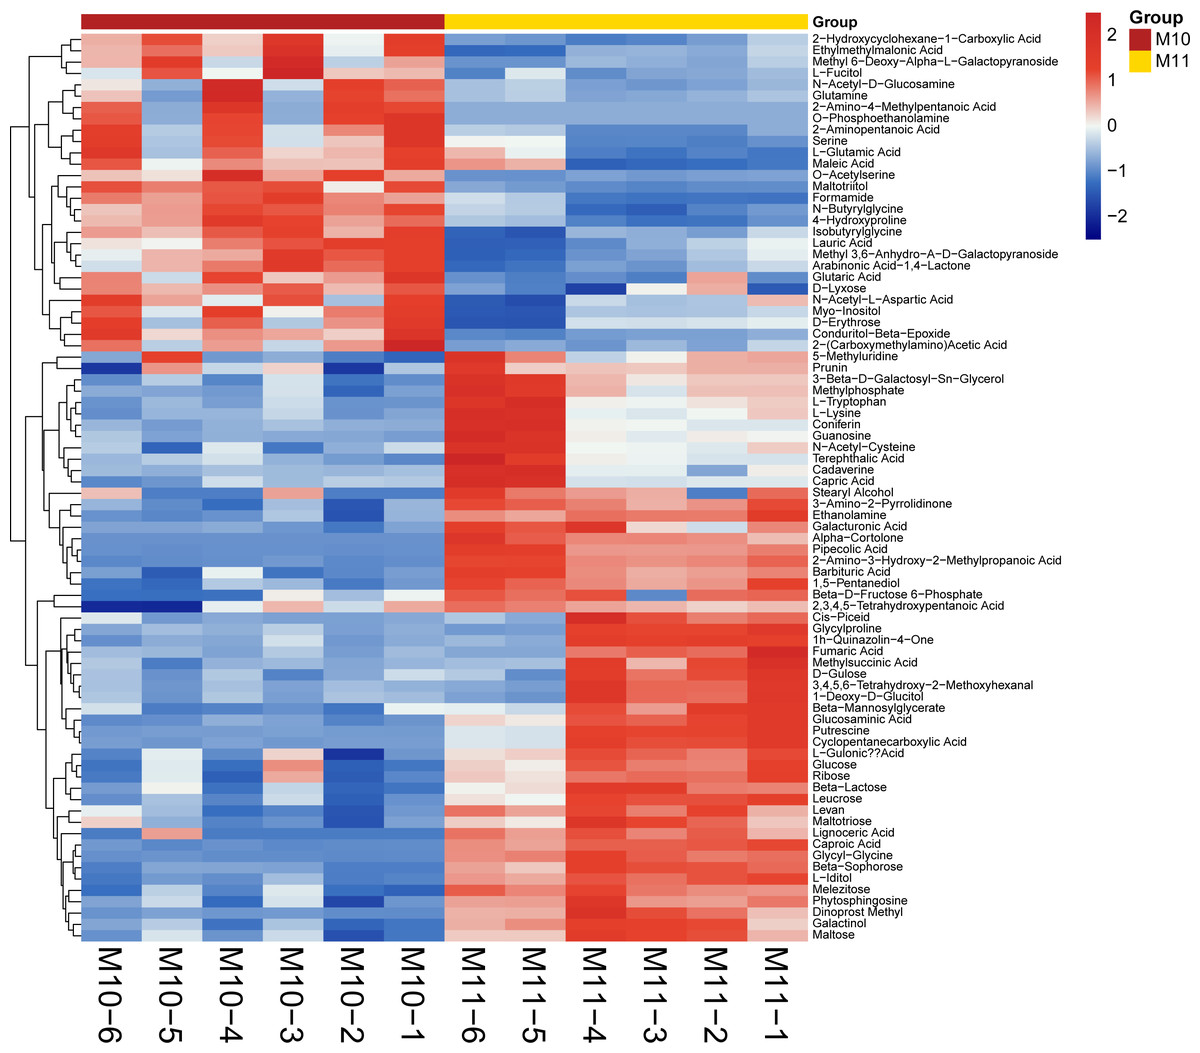
Figure 3: Heatmap visualization of differentially accumulated metabolites (DAMs) of rhizome between ‘Y11’ and ‘Y10’.
M10-1 M10-6: The six simples of ‘Y10’ for metabolome analysis; M11-1 M11-6: The six simples of ‘Y11’ for metabolome analysis.
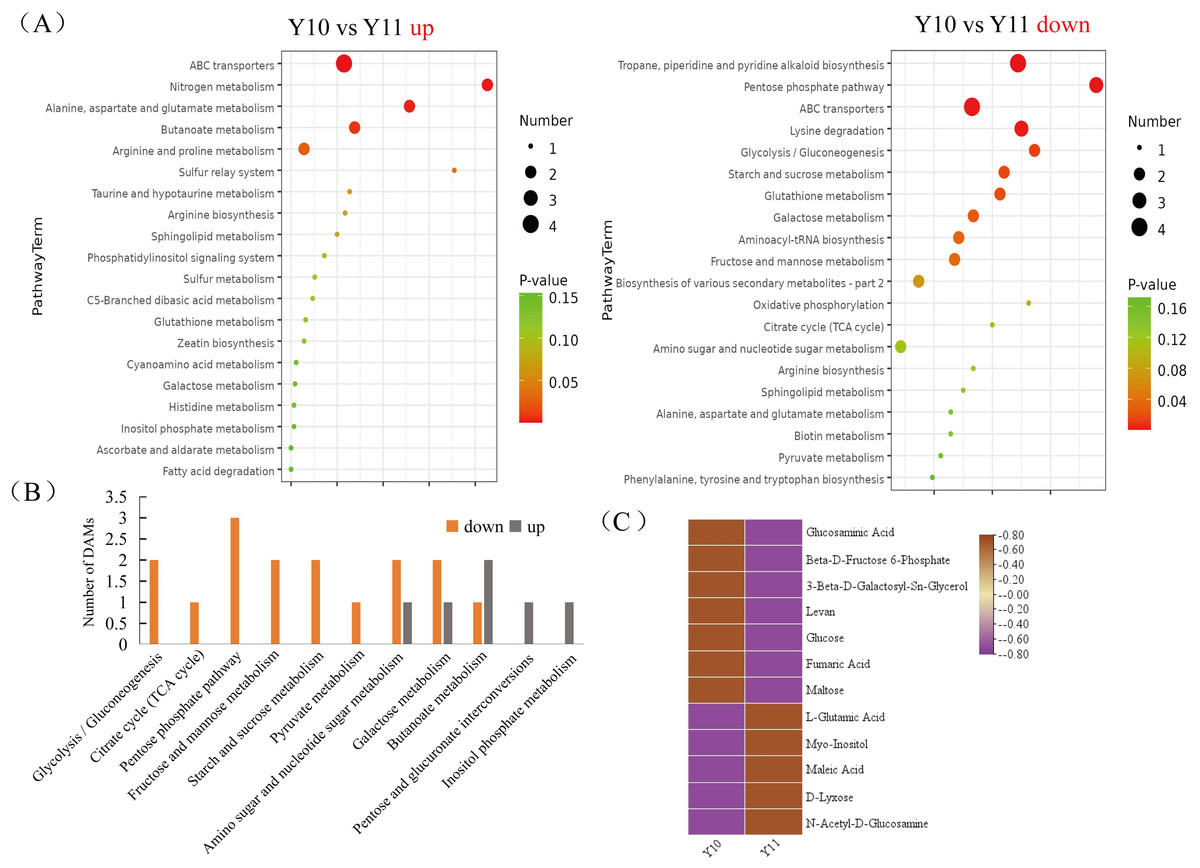
Figure 4: Functional enrichment analysis of differentially accumulated metabolites (DAMs) by Kyoto Encyclopedia of Genes and Genomes (KEGG) pathway-based enrichment analysis.
(A) The top 20 pathway classifications selected by KEGG pathway-based enrichment analysis based on the DAMs between ‘Y11’ and ‘Y10’ group. (B) The number of up- or down-regulated DAMs related to the 11 pathway classifications for carbohydrate metabolism in the ‘Y10’ vs ‘Y11’ group. (C) Heatmap visualisation of up-regulated and down-regulated DAMs related to the 11 pathway classifications for carbohydrate metabolism.
Combined transcriptome and metabolome analyses
Combined transcriptomic and metabolomic analyses were performed to thoroughly investigate the changes in rizhomes of the two varieties for polysaccharide accumulation. According to the results of the KEGG enrichment analysis, the shared pathways of the DEGs and DAMs that were closely related to carbohydrate metabolism in the top 20 pathways were ‘pentose phosphate pathway’, ‘amino sugar and nucleotide sugar metabolism’, ‘starch and sucrose metabolism’, ‘galactose metabolism’, and ‘fructose and mannose metabolism’. The pathways-genes-metabolites interaction network revealed that four DAMs, including glucose, maltose, 3-beta-D-galactosyl-sn-glycerol and beta-D-fructose 6-phosphate, were further observed in these commom pathways, and could be regulated by 17 DEGs (Fig. 5A). Meanwhile, the correlation analysis between these DEGs and DAMs were performed. As shown in Fig. 5B, three DEGs were positively correlated with beta-D-fructose 6-phosphate, one DEG was negatively correlated with glucose, three DEGs were negatively correlated with maltose while another three DEGs were negatively correlated with maltose, and four DEGs were negatively correlated with maltose while another three DEGs were negatively correlated with maltose (Fig. 5B). Among these 17 DEGs, the 12 DEGs, including HK and UGP2, were down-regulated in ‘Y10’ compared with those in ‘Y11’, while five DEGs, such as SUS and UGDH, were up-regulated (Fig. S4). As the four genes (HK, UGP2, SUS and UGDH) were the key enzyme genes reported to be involved in plant polysaccharide biosynthesis, their expression patterns were further analyzed in five tissues (root, leaf, flower, stem, and rhizome) and in the rhizomes of four genotypes with distinctly different polysaccharide contents. As shown in Fig. 6A, except for UGDH and UGP2, the other two genes were preferably expressed in the rhizomes, the main tissue for polysaccharide accumulation. Meanwhile, the expression levels of SUS and HK showed similar or opposite tendency to the polysaccharide content of four genotypes, and there was no obvious tendency between the transcript levels of UGP2 and UGDH and the polysaccharide content in four genotypes (Fig. 6B).
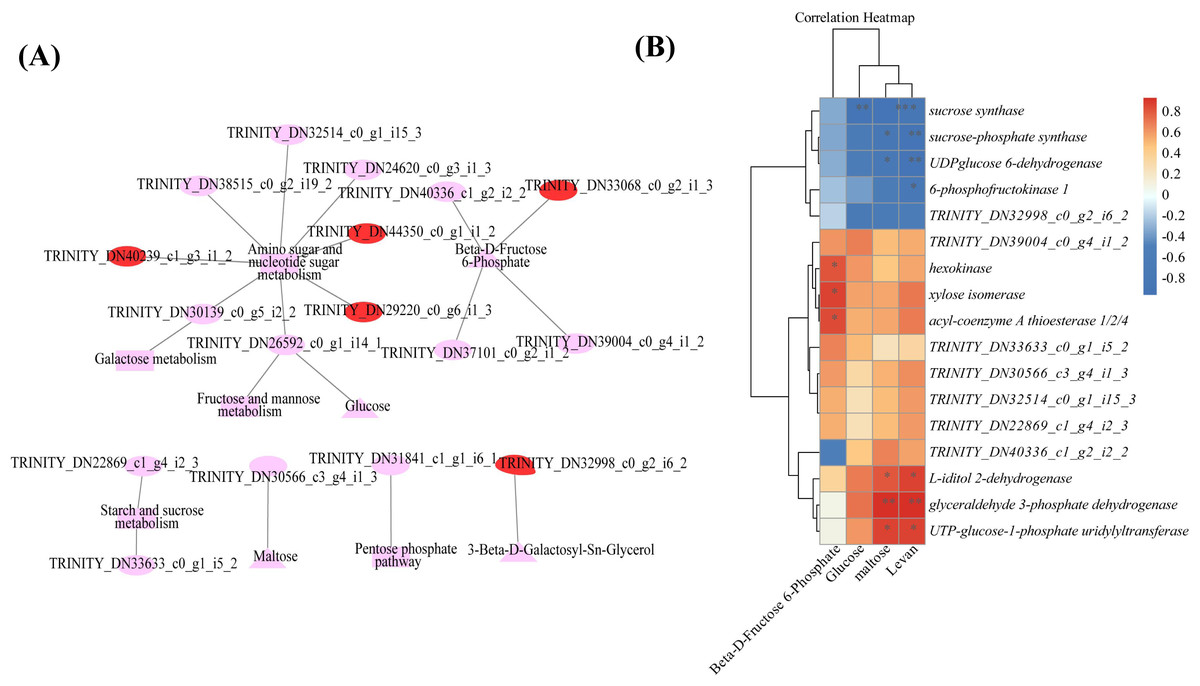
Figure 5: Correlation analysis of DAMs and DEGs related to carbohydrate metabolism (A) Genes-metabolites interaction network. (B) Heat map of the correlation coefficients between four DAMs and 17 DEGs.
Triangle: DAMs; Circle marked in red: the up-regulated genes in ‘Y10’ compared with those in ‘Y11’; Circle marked in pink: the down-regulated genes in ‘Y10’ compared with those in ‘Y11’. Asterisks represent statistical significance determined by Student’s t-test (*P ¡ 0.05, **P ¡ 0.01).
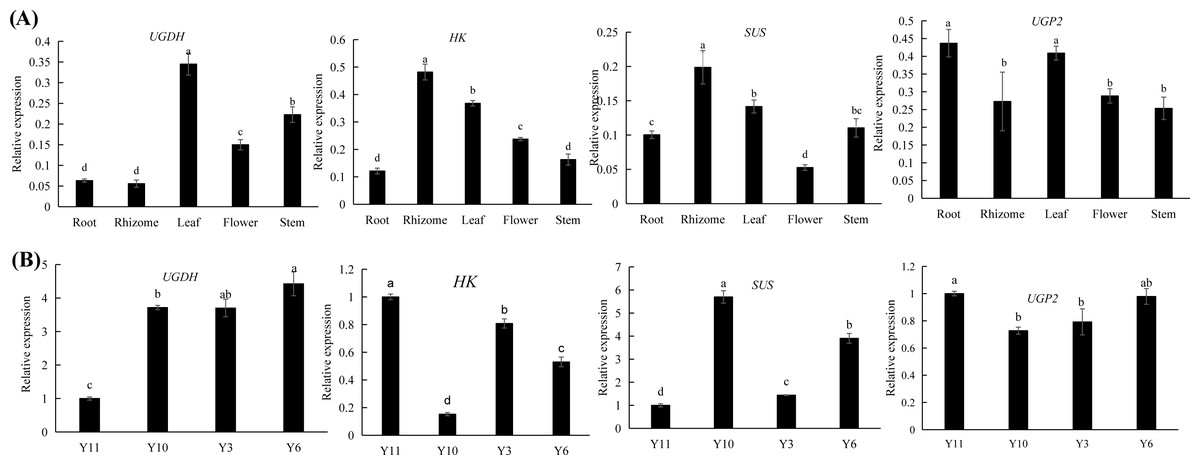
Figure 6: (A–B) Expression pattern analysis of SUS, HK, UGDH and UGP2 at different tissues and different genotypes.
Different letters indicate significant difference at P < 0.05.
Identification of metabolites and genes related to polysaccharide biosynthesis
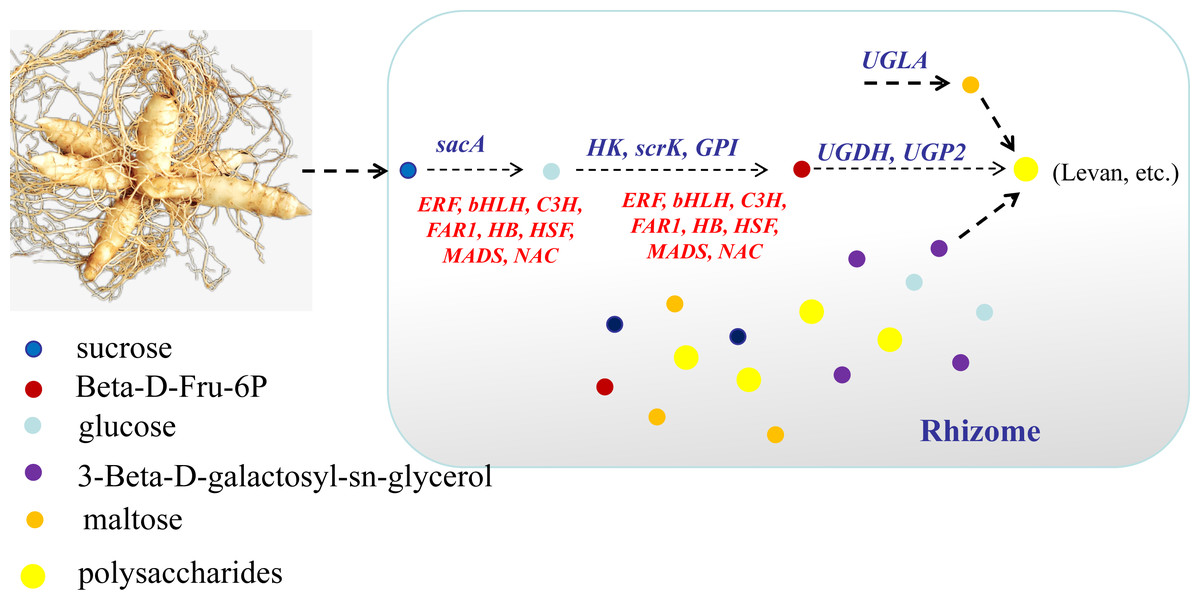
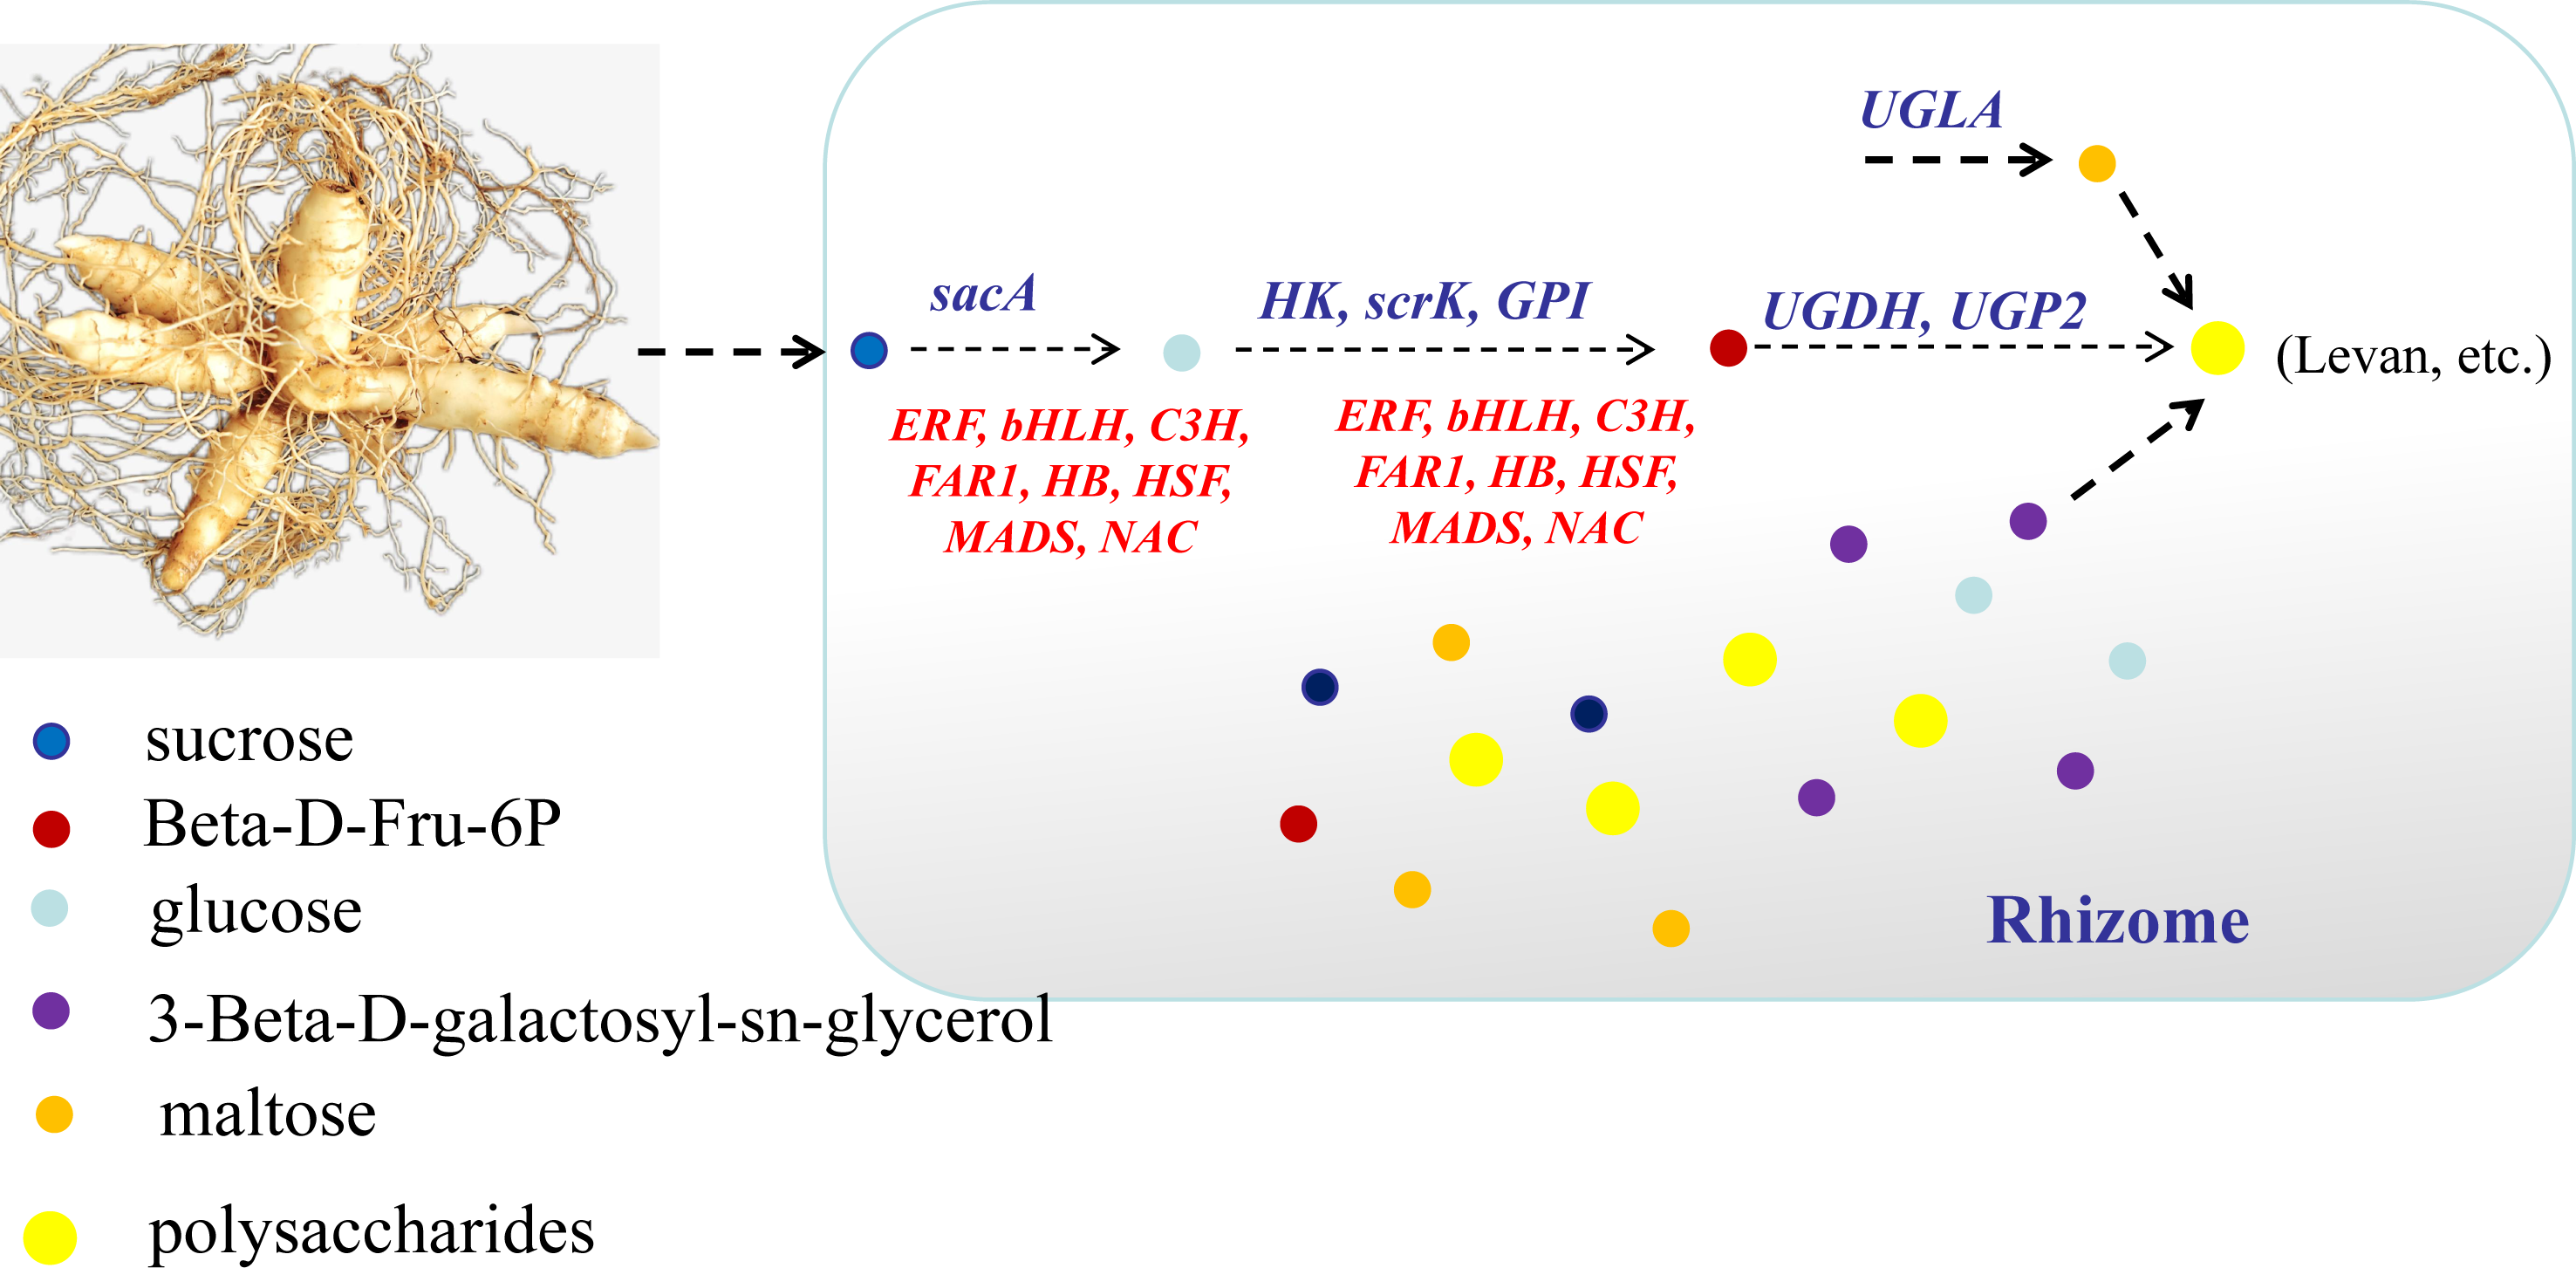
Based on the reported plant polysaccharide metabolic pathways, we further integrated our metabolomic and transcriptomic datasets and mapped the proposed polysaccharide biosynthetic pathway of P. odoratum (Fig. 7). In this pathway map, it was observed that ‘glucose’ and ‘beta-D-fructose 6-phosphate’ accumulated more in ‘Y11’ than those in ‘Y10’. Glucose is converted from sucrose by the enzyme beta-fructofuranosidase (INV/sacA), and beta-D-fructose 6-phosphate is converted from fructose, glucose-6-phosphate or mannose-6-phosphate by the enzymes hexokinase (HK), 6-phosphofructokinase (FRK/scrK), glucose-6-phosphate isomerase (GPI) and mannose-6-phosphate isomerase (MPI), respectively. In total, three DEGs annotated with scrK genes, three DEGs annotated with sacA genes, one DEGs annotated with HK gene, one DEGs annotated with GPI genes were identified. However, no one DEGs annotated with MPI gene were obtained. Among these eight DEGs, two scrK DEGs and one HK DEG showed higher expression levels in ‘Y11’ than those in ‘Y10’ (Fig. 7). These results suggest that the up-regulation of the three DEGs in Y11 may improve the efficiency of biosynthetic polysaccharide precursors in P. odoratum, which may account for the accumulation of polysaccharide in rhizomes.
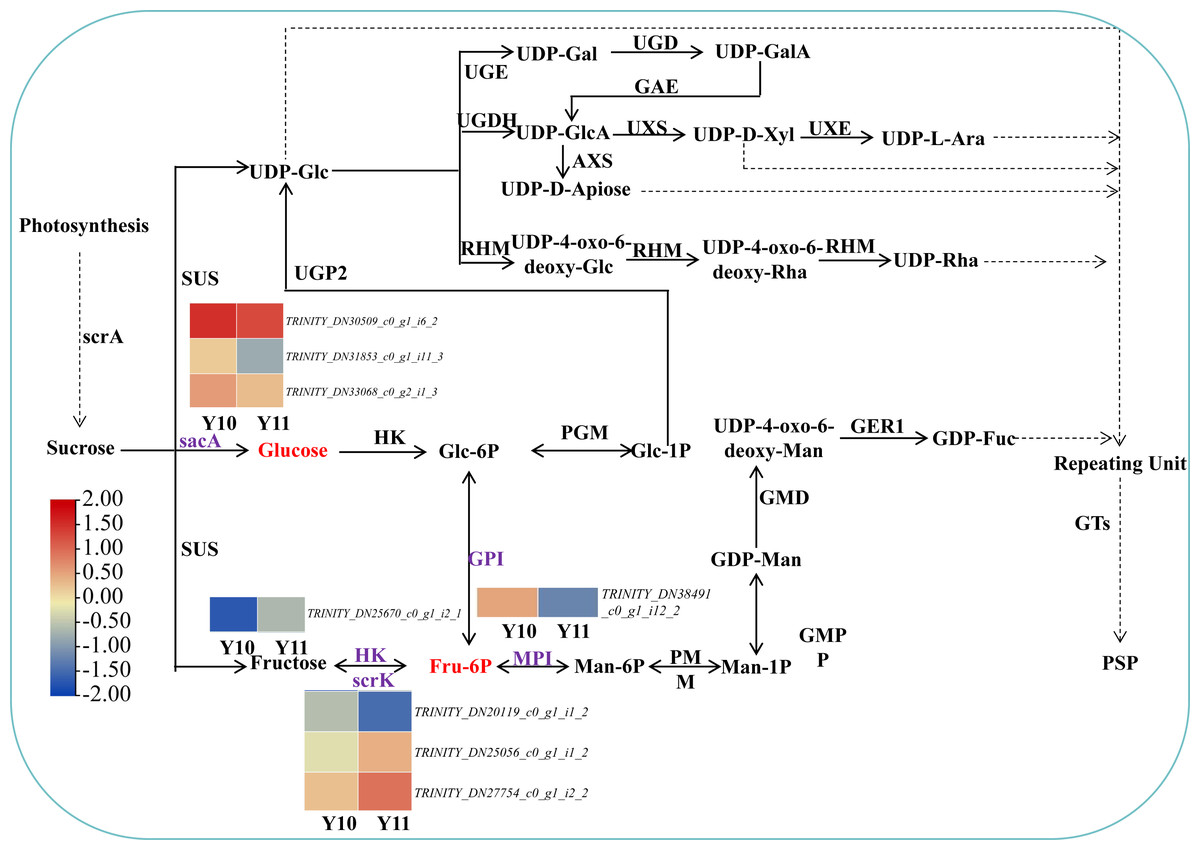
Figure 7: Proposed biosynthetic pathways of polysaccharide in P. odoratum rhizome.
The up-regulated DAMs in ‘Y11’, compared with ‘Y10’, were marked in red; key enzymes encoded by nine DEGs related to the above-mentioned DAMs were marked in purple.
Identification of transcription factors involved in polysaccharide accumulation
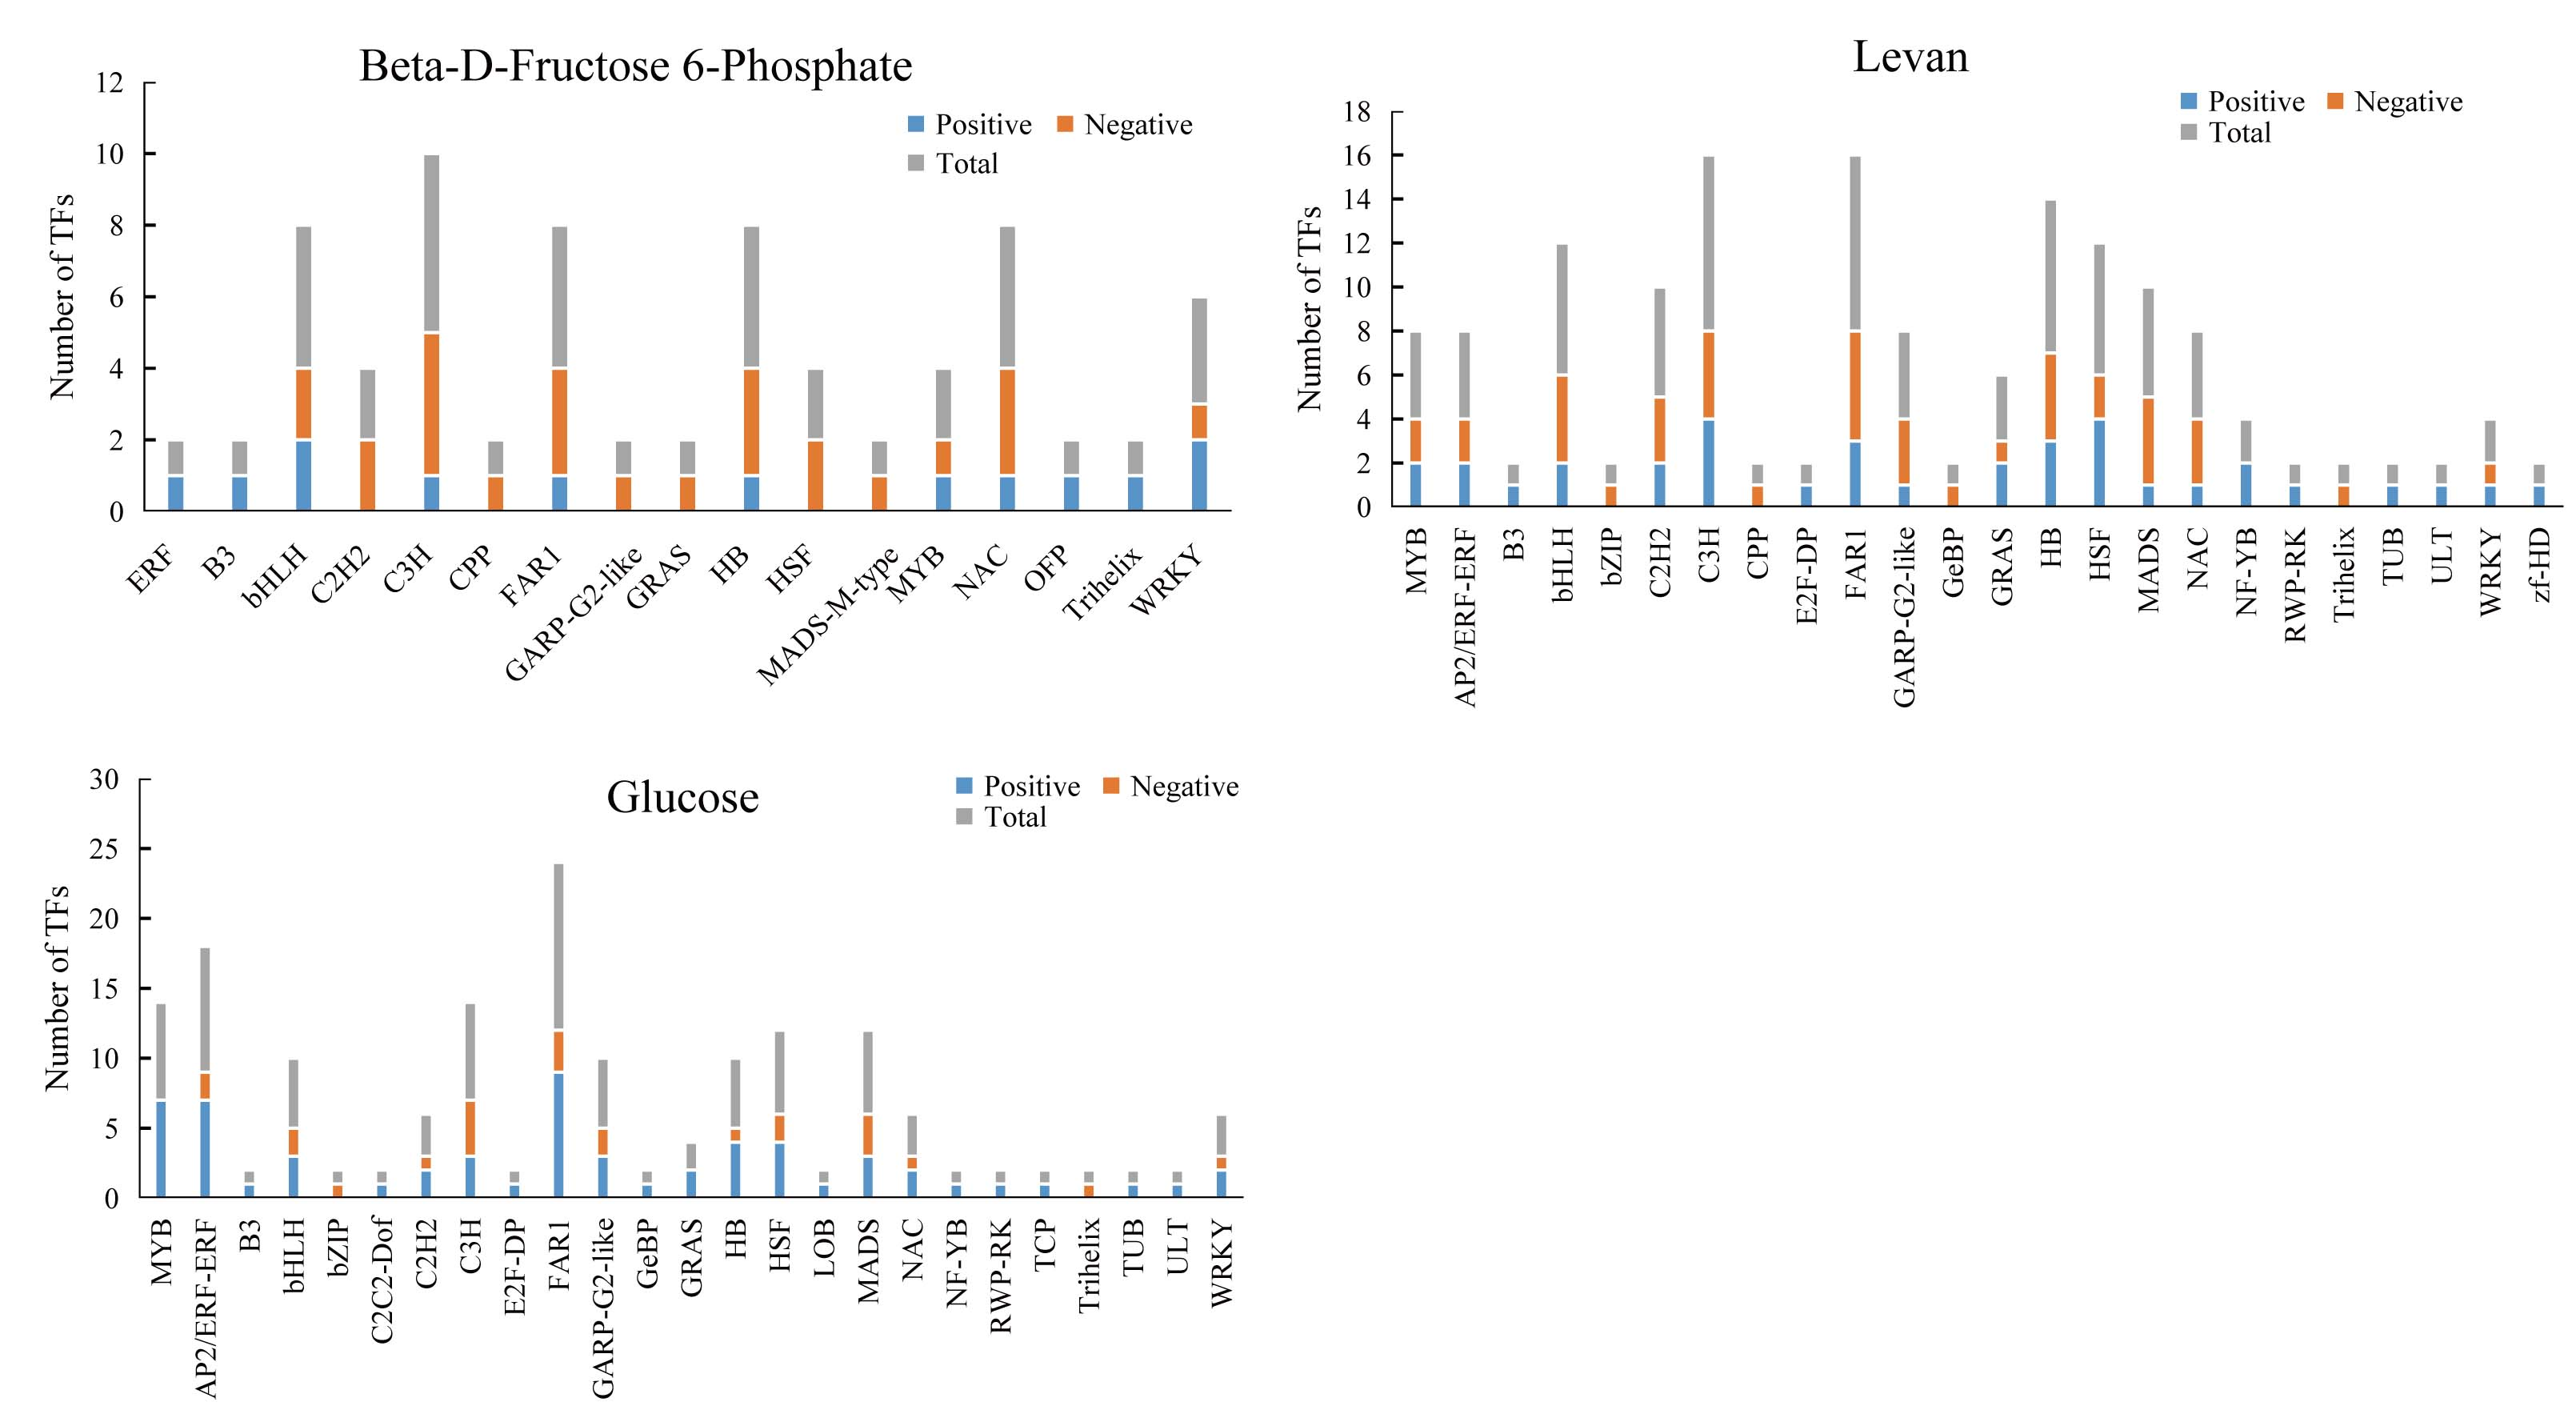
In order to explore the transcriptional regulation of the genes involved in the accumulation of polysaccharide , we analysed the transcription factors (TFs) in the rhizomes. In total, we found that 229 TFs were significantly up/downregulated in Y10 rhizomes compared to those in Y11 rhizomes. Among these genes, 134 TFs were downregulated, while 95 TFs were upregulated. The most abundant transcription factor is AP/ERF-ERF (21) and MYB (21), followed by FAR1 (19) and WRKY (14) (Fig. 8A). Furthermore, correlation analysis revealed that 85 TFs were significantly associated with the metabolites glucose accumulation, 78 TFs with levan and 38 TFs with beta-D-fructose 6-phosphate content (Fig. S4). In addition, 13 TFs such as C3H, FAR1, bHLH and ERF were found to have high correlations with these three metabolites (Fig. 8B,C). These results suggest that polysaccharide accumulation may be regulated by these TFs .
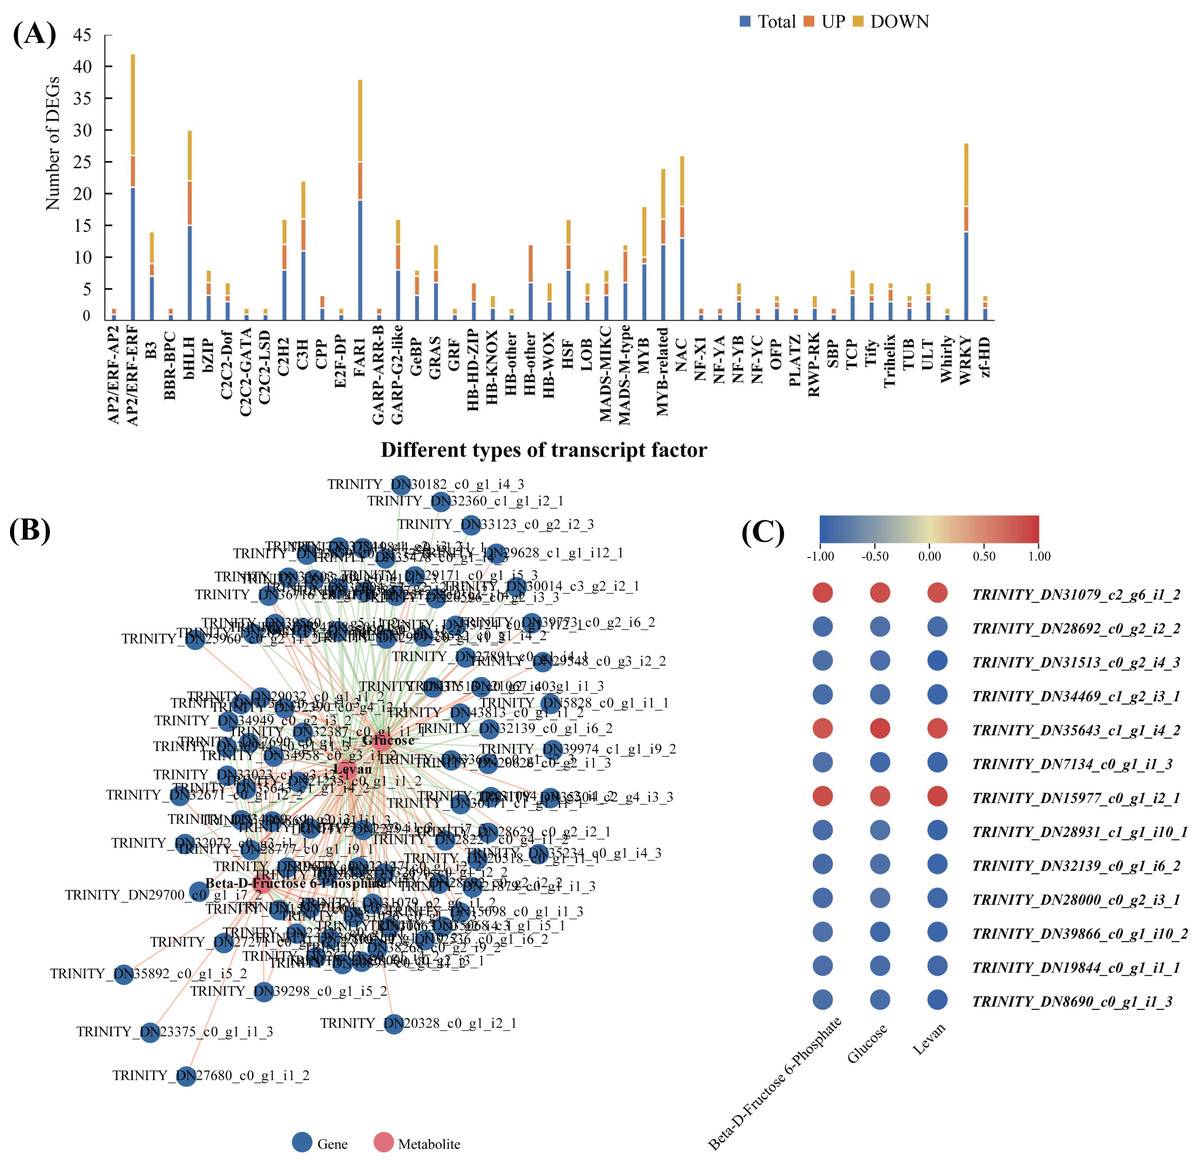
Figure 8: The transcription factors (TFs)-metabolite association network constructed according to the differentially expressed TFs and differentially accumulated metabolites involved in proposed pathways for polysaccharide biosynthesis in P. odoratum.
(A) Type and number of the differentially expressed TFs in P. odoratum rhizome. (B) TFs-metabolite association network analysis. The red lines indicate TFs that were positively significantly associated with the three metabolites, while the blue lines indicate TFs that were negatively significantly associated with the three metabolites. (C) Heatmap of the correlation coefficients between glucose, levan and beta-D-fructose 6-phosphate and the expression levels of TFs based on the Pearson’s correlation coefficient.
Verification of randomly selected DEGs using quantitative real-time PCR (qRT-PCR)
To verify the results of the RNA-seq analysis, nine DEGs were selected for the qRT-PCR analysis, of which four DEGs were related to ‘galactose metabolism’, 1 DEG related to ‘glycolysis/gluconeogenesis’, and four DEGs were related to ‘fructose and mannose metabolism’. Actin was used as a reference gene. The results showed that the expression counts of the transcriptome data of the tested genes had a similar transcript profile to the qRT-PCR results (Fig. 9), indicating that the RNA-seq results obtained in this study were reliable and accurate.
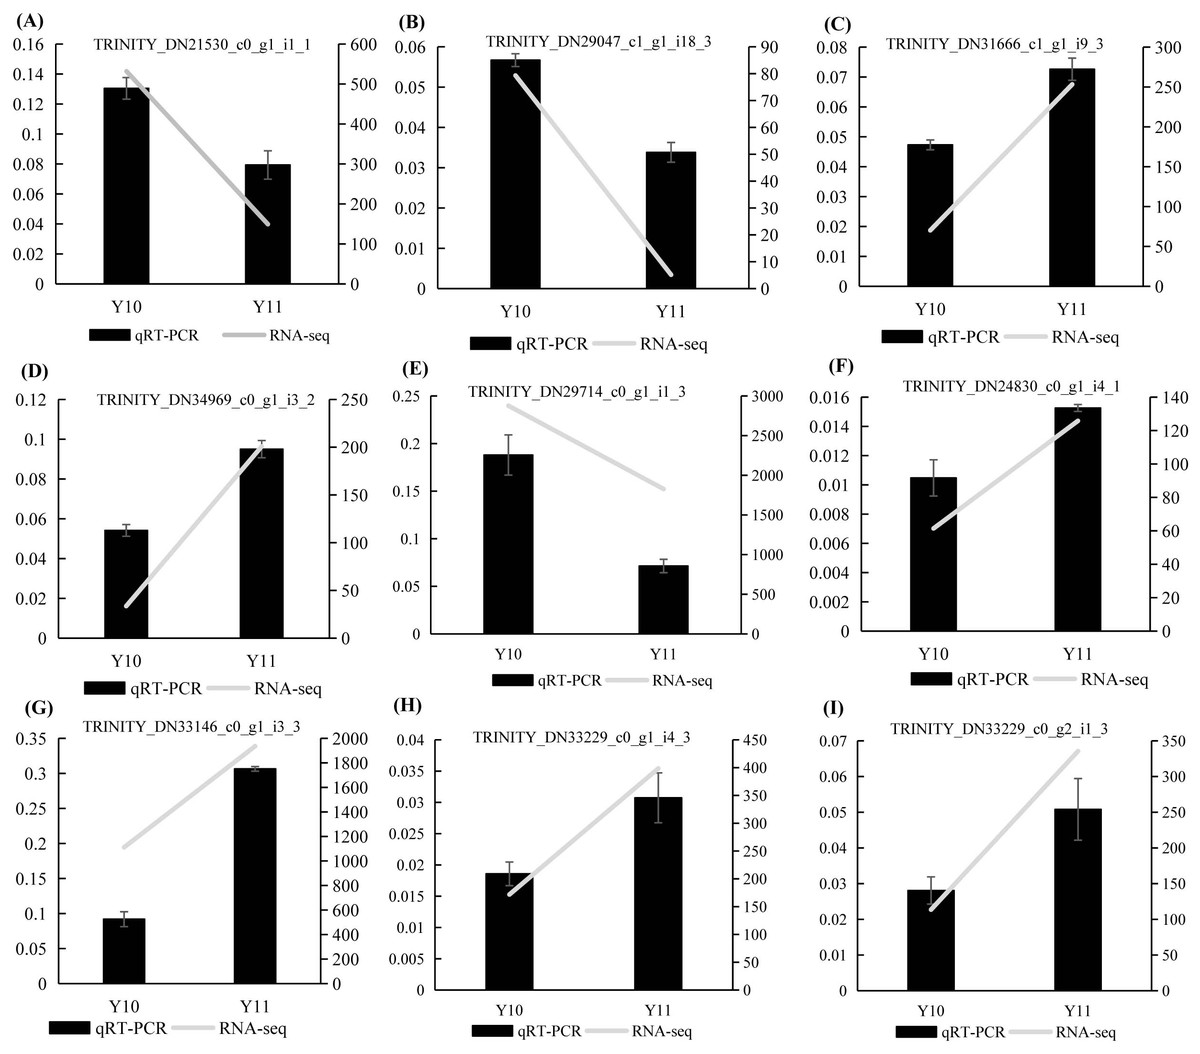
Figure 9: (A–I) The relative expression levels of nine selected DEGs were compared by RNA-seq and qRT PCR.
The line chart shows the gene expression level from the transcriptome (FPKM).
Discussion
First applications of multiomics to investigate the molecular mechanism of polysaccharide accumulation in P. odoratum
The rhizome is the main tissue for the medicinal use of P. odoratum and is rich in polysaccharides, a marker of medicinal quality. Although polysaccharides have several significant pharmacological functions, the molecular mechanism of polysaccharide biosynthesis remain largely unknown. To further explore the genes that encode the key enzymes that regulate polysaccharide biosynthesis, transcriptome and metabolome sequencing of the rhizomes of the two varieties with different polysaccharide contents was performed. In previous studies, only transcriptome analysis were performed to investigate the candidate genes involved in polysaccharide accumulation (Wang et al., 2017; Zhang et al., 2020; Li et al., 2022). However, multiomics combined analysis has greater advantages than single transcriptome analysis in comprehensively explaining the regulatory mechanisms of the accumulation of active ingredients by associating the changes in metabolites with gene expression in medicinal plants (Yuan et al., 2022; Zhang et al., 2022). To the best of our knowledge, this is the first report on the application of multiomics, including transcriptome and metabolome analyses, to identify the putative genes for polysaccharide accumulation in P. odoratum and its relative species of the genus Polygonatum. In this study, the Q30 values of each sample were higher than those previously reported for P. odoratum (89.33%) and similar to those reported for P. sibiricum and P. cyrtonema (Wang et al., 2017; Zhang et al., 2020; Li et al., 2022). In addition, the number of raw reads for the samples tested in this study was higher than the transcriptome of P. odoratum reported in 2020 (Zhang et al., 2020). These results indicate that the quality of the transcriptome was higher and more reliable than that reported previously for P. odoratum (Chen et al., 2014). Meanwhile, a total of 14,194 DEGs and 80 DAMs were obtained by transcriptome and metabolome analysis (Fig. S2, Fig. 3), and these data laid a foundation for exploring and explaining the complex and changeable gene expression regulation mechanism and biological phenomena of polysaccharide accumulation in P. odoratum.
Putative key DAMs involved in the polysaccharide accumulation in the rhizome of P. odoratum
In this study, we identified a total of 14,194 DEGs and 80 DAMs, of which 6,689 were up-regulated genes, and 52 were up-regulated in ‘Y11’ compared to ‘Y10’ (Fig. S2, Fig. 3). Based on the results of the KEGG enrichment analysis of the up-regulated DEGs and DAMs, we observed that seven up-regulated DAMs in ‘Y11’ were associated with carbohydrate metabolism (Fig. 4C). Among the seven up-regulated DAMs, the metabolite levan was a type of polysaccharide and constituted the major portion of polysaccharide (Jiang et al., 2013), suggesting that it is the major contributor for the polysaccharides accumulation in ‘Y11’. Except for the metabolite levan, the two metabolites, glucose and beta-D-fructose 6-phosphate were involved in the proposed biosynthetic pathway of polysaccharides (Fig. 7), this suggests that the accumulation of polysaccharides is partly dependent on the biosynthesis of glucose and beta-D-fructose 6-phosphate (Figs. 3, 6). Another four metabolites that were not involved in the proposed biosynthetic pathway of polysaccharides, may function in the other biosynthetic pathway of the intermediate products of polysaccharides. For example, among these four metabolites, glucosaminic acid can be metabolically synthesised into glucosamine, which is phosphorylated intracellularly to synthesise glucose-6-phosphate, which can be further synthesised into fructose-6-phosphate via the plant sugar pathway (Riegler et al., 2012). As their important roles in the polysaccharide accumulation, these seven DAMs could be used as candidate quality markers for the assessment of medicinal quality of P. odoratum.
Putative key DEGs acting in different manners to regulate polysaccharide accumulation in rhizome of P. odoratum
The pathways-genes-metabolites interaction network revealed that 17 DEGs could regulate the four putative key DAMs (Fig. 5). Among the 17 DEGs, the four DEGs (HK, UGP2, SUS and UGDH) were involved in the proposed biosynthetic pathway of polysaccharides (Fig. 7). HK and ScrK are key enzymes in the biosynthesis of polysaccharides and can convert D-fructose into D-fructose 6-phosphate. Previous studies have reported that the activity of scrK regulates the sucrose metabolism in apple leaves (Yang et al., 2018), and HK is involved in modulating the sugar content in pears (Zhao et al., 2019a; Zhao et al., 2019b). In this study, beta-D-fructose 6-phosphate was observed to be upregulated in ‘Y11’ compared with that in ‘Y10’, two scrK DEGs and one HK DEGs were identified and showed higher transcript levels in ‘Y11’ than in ‘Y10’, and the expression level of HK was positively correlated with the beta-D-fructose 6-phosphate content (Fig. 5B). Coupled with the previous results that the expression of scrK was positively correlated with polysaccharide content in P. sibiricum and ginseng contents (Wang et al., 2017; Fang et al., 2022), and the expression levels of HK were positively correlated with the polysaccharide content in P. cyrtonema Hua (Chen et al., 2022), we speculated that scrK and HK genes were the possible key putative genes that positively regulate polysaccharide accumulation.
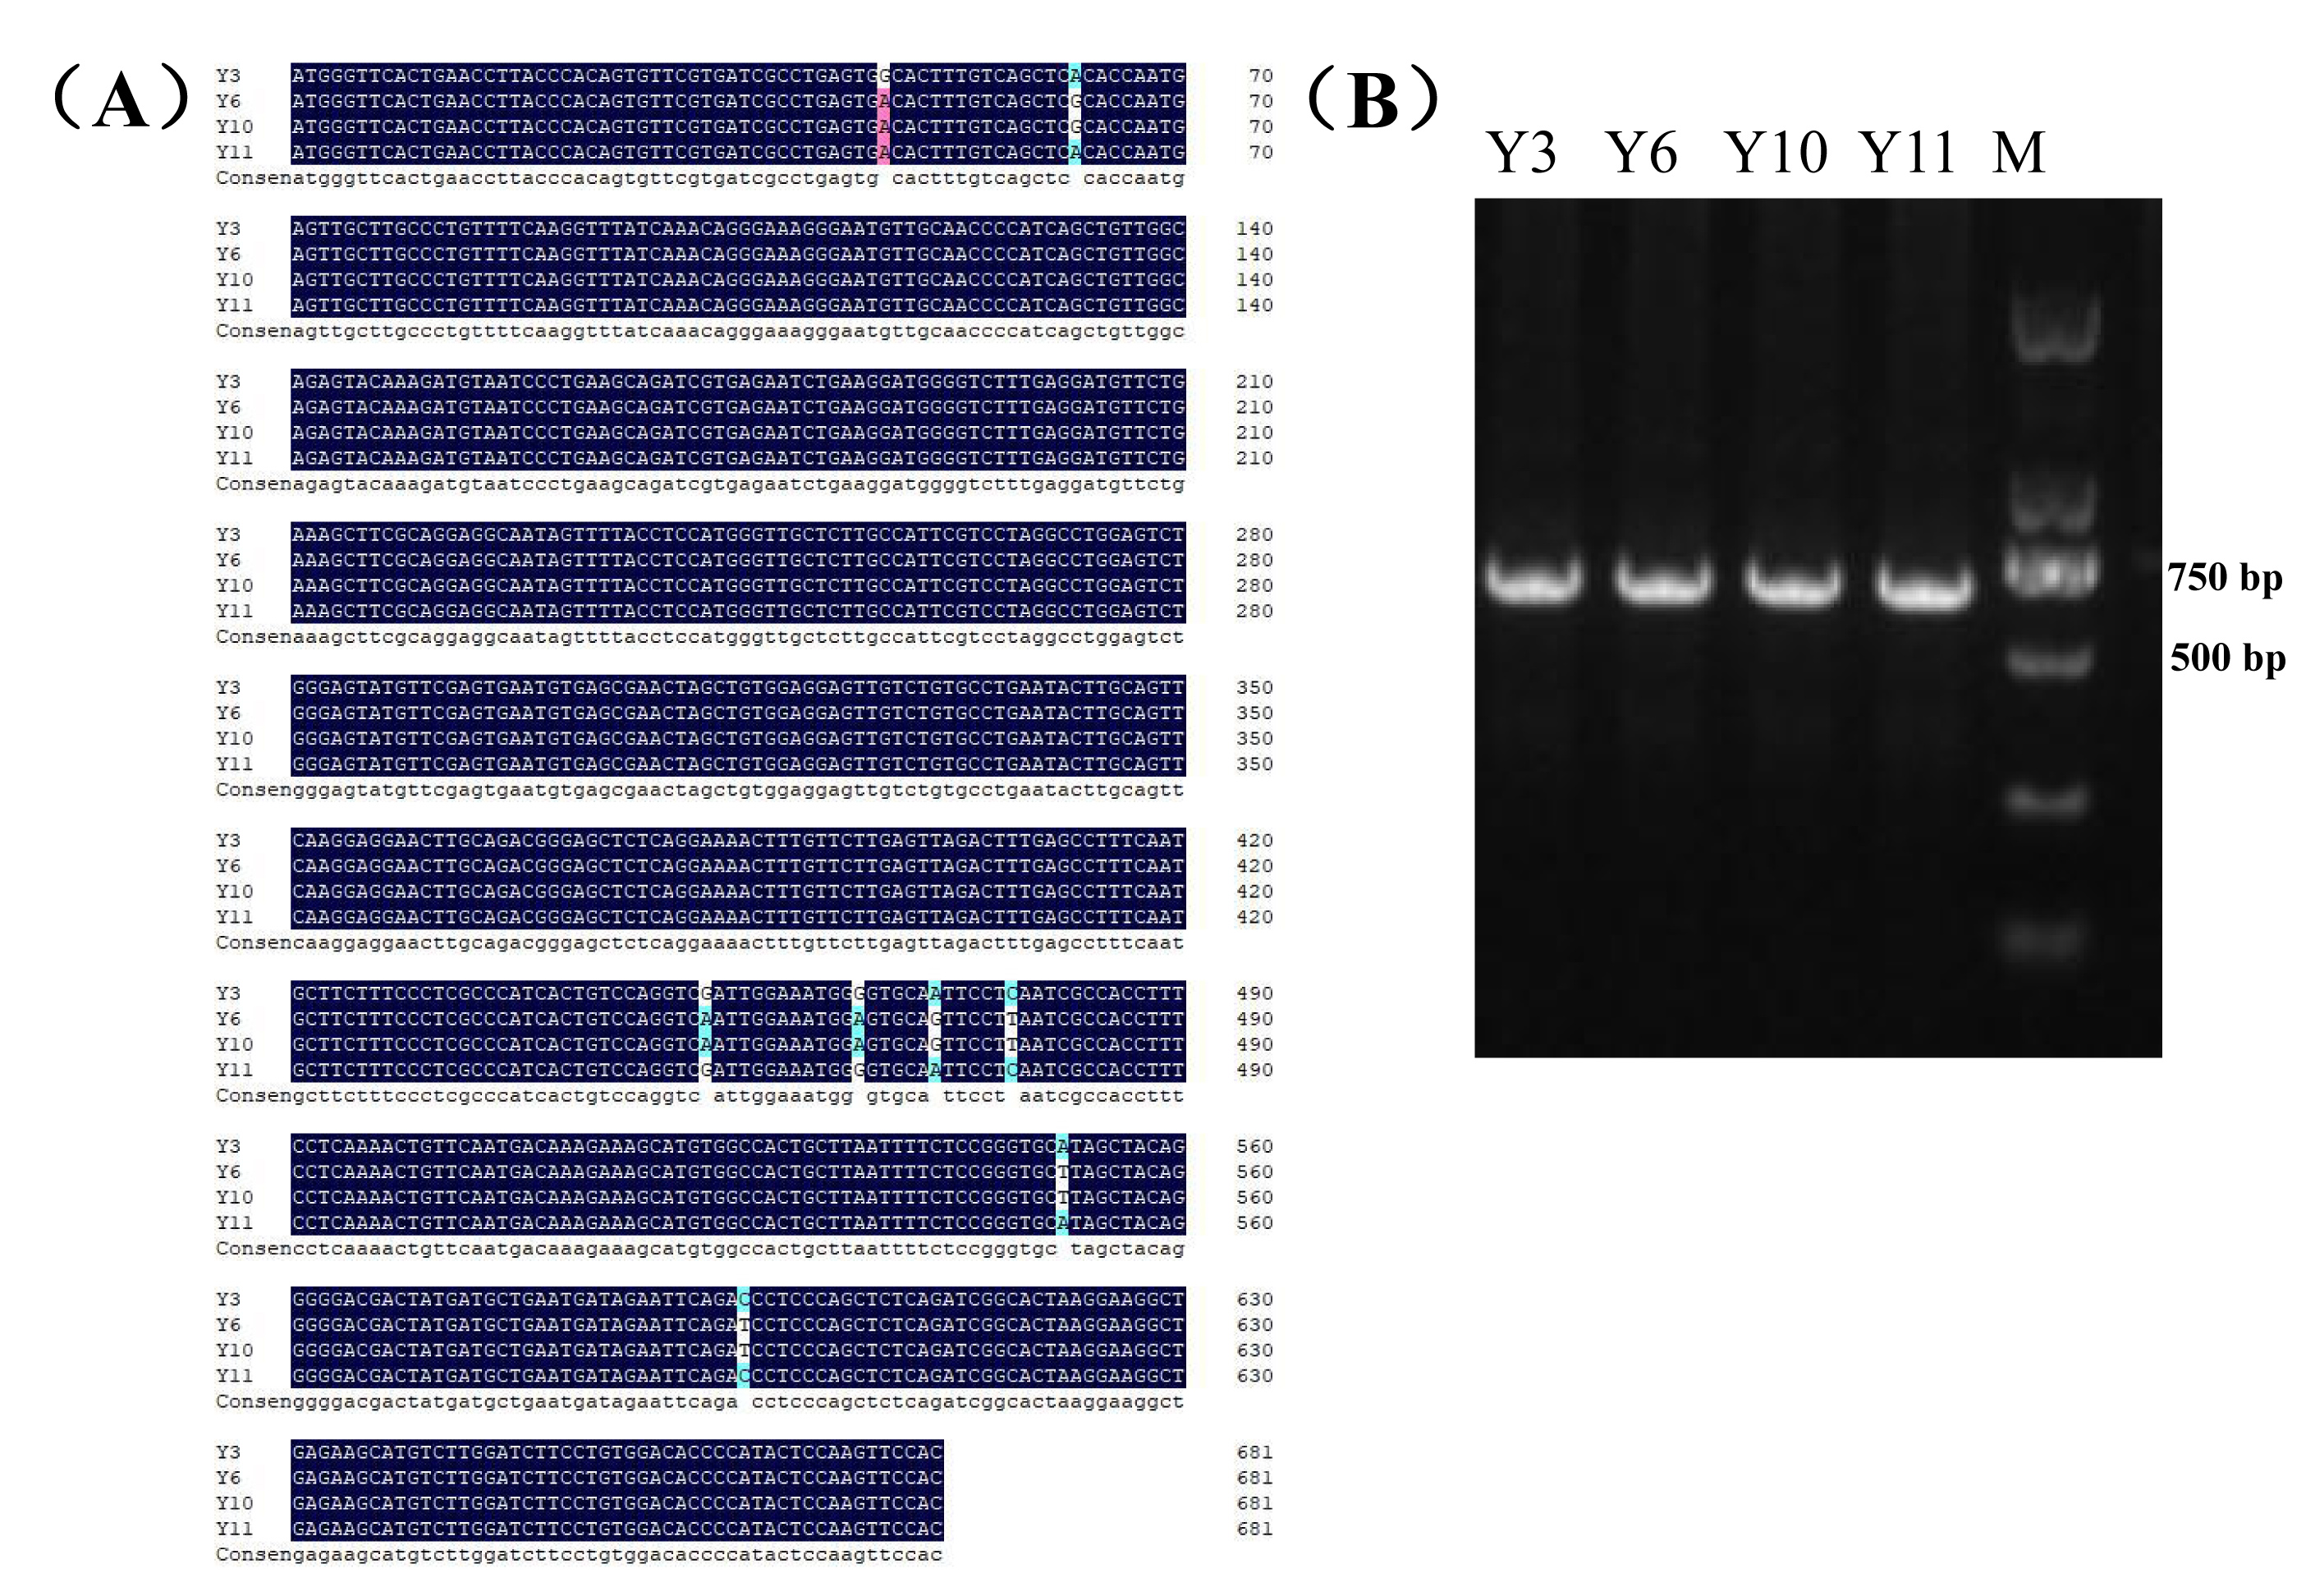
SUS was the key enzyme gene involved in the proposed biosynthetic pathway of polysaccharides. In this study, expression pattern analysis revealed that SUS gene preferably expressed in the rhizome, the main tissue for polysaccharides accumulating in P. odoratum, the transcript levels were opposite to the the trend of the polysaccharide content of the four cultivars, and was correlated with glucose, maltose and levan content (Figs. 5–6). In addition, the seven SNPs were found different in polysaccharide content in these four genotypes including two high polysaccharide content and two genotypes with low polysaccharide content (Fig. S5). Combined with the previous results that the expression levels of SUS were positively correlated with the polysaccharide and sucrose content and in P. cyrtonema Hua and ginseng contents (Chen et al., 2022; Fang et al., 2022), our results suggest that the SUS genes identified in this study may mediate the negative feedback regulation of the polysaccharide biosynthesis, and which also need to be further studied in the future.
Transcriptional regulatory networks involved in polysaccharide accumulation in P. odoratum
Several studies have shown that different transcription factors play an important role in the regulation of polysaccharide accumulation (Gao et al., 2021; Li et al., 2021). For example, an endosperm-specific transcription factor, TaNAC019, regulates starch accumulation and improves the wheat grain quality (Gao et al., 2021). In apple, MdWRKY32 is involved in starch-sugar metabolism by regulating the expression levels of MdBam5 during post-harvest storage (Li et al., 2021). In the medicinal plant P. cyrtonema Hua, TFs such as bHLH, bZIP, ERF and ARF have been identified as potential regulators involved in polysaccharide accumulation (Chen et al., 2022). Similar with these findings, correlation analysis in this study revealed that bHLH, ERF, NAC and other TFs may control the polysaccharide accumulation in the rhizome of P. odoratum (Fig. 8 and Fig. S4). Previous studies suggested that TFs act as regulators in polysaccharide accumulation by regulating the key enzyme gene (Gao et al., 2021; Li et al., 2021; Shi et al., 2022), and future research will focus on the identification and functional analysis of target gene of these TFs.
Conclusion
In conclusion, this study focused on the key genes and metabolites underlying polysaccharide accumulation in P. odoratum rhizomes using metabolomic and transcriptomic technologies. The integrated metabolomic and transcriptomic analyses revealed that DEGs and DAMs shared five pathways related to carbohydrate metabolism based on the KEGG enrichment analyses. Among these pathways, four DAMs and 17 DEGs were identified as key metabolites or key genes involved in the polysaccharide accumulation. The key enzyme genes including sacA, HK, scrk and GPI, may regulate the accumulation of two metabolites, glucose and Beta-D-Fru-6P, in the proposed polysaccharide biosynthetic pathway, which may be involved in the regulation of the transcription factors C3H, FAR1, bHLH and ERF (Fig. 10). Meanwhile, two other key metabolites, maltose and 3-Beta-D-galactosyl-sn-glycerol, involved in an unknown pathway to account for the accumulation of polysaccharide, and 3-Beta-D-galactosyl-sn-glycerol accumulated in the rhizome may be associated with the expression of the gene UGLA (Fig. 10). Although their biological functions in polysaccharide accumulation require further validation, this study is the first comprehensive analysis of polysaccharide accumulation using multiomics and lays a foundation for elucidating the molecular mechanisms of medicinal quality formation in P. odoratum rhizomes.