
Identification of the RRM1 gene family in rice (Oryza sativa) and its response to rice blast
- Published
- Accepted
- Received
- Academic Editor
- Diaa Abd El-Moneim
- Subject Areas
- Agricultural Science, Bioinformatics, Genomics, Molecular Biology, Plant Science
- Keywords
- Rice, Gene family, Rice blast, Bioinformatics
- Copyright
- © 2024 Jiang et al.
- Licence
- This is an open access article distributed under the terms of the Creative Commons Attribution License, which permits using, remixing, and building upon the work non-commercially, as long as it is properly attributed. For attribution, the original author(s), title, publication source (PeerJ) and either DOI or URL of the article must be cited.
- Cite this article
- 2024. Identification of the RRM1 gene family in rice (Oryza sativa) and its response to rice blast. PeerJ 12:e17668 https://doi.org/10.7717/peerj.17668
Abstract
To better understand RNA-binding proteins in rice, a comprehensive investigation was conducted on the RRM1 gene family of rice. It encompassed genome-wide identification and exploration of its role in rice blast resistance. The physicochemical properties of the rice OsRRM1 gene family were analyzed. There genes were also analyzed for their conserved domains, motifs, location information, gene structure, phylogenetic trees, collinearity, and cis-acting elements. Furthermore, alterations in the expression patterns of selected OsRRM1 genes were assessed using quantitative real-time PCR (qRT-PCR). A total of 212 members of the OsRRM1 gene family were identified, which were dispersed across 12 chromosomes. These genes all exhibit multiple exons and introns, all of which encompass the conserved RRM1 domain and share analogous motifs. This observation suggests a high degree of conservation within the encoded sequence domain of these genes. Phylogenetic analysis revealed the existence of five subfamilies within the OsRRM1 gene family. Furthermore, investigation of the promoter region identified cis-regulatory elements that are involved in nucleic acid binding and interaction with multiple transcription factors. By employing GO and KEGG analyses, four RRM1 genes were tentatively identified as crucial contributors to plant immunity, while the RRM1 gene family was also found to have a significant involvement in the complex of alternative splicing. The qRT-PCR results revealed distinct temporal changes in the expression patterns of OsRRM1 genes following rice blast infection. Additionally, gene expression analysis indicates that the majority of OsRRM1 genes exhibited constitutive expressions. These findings enrich our understanding of the OsRRM1 gene family. They also provide a foundation for further research on immune mechanisms rice and the management of rice blast.
Introduction
Rice (Oryza sativa subsp. japonica) is widely cultivated in warm regions such as Asia. It is one of the world’s main food crops, and plays a vital role in global food security. It is also an important model crop for biological research.
Gene expression follows strict processes, each step of which needs to be strictly regulated. This often occurs at the transcription level through DNA cis-acting elements and transcription factor binding (Jeune & Ladurner, 2004; Latchman, 2011). Studies have shown that post-transcriptional regulation plays an important role in regulating the gene expression of plants. Post-transcriptional regulation involves multiple processes, including alternative splicing, RNA editing, RNA transport from the nucleus to the cytoplasm, RNA stabilization, and translation, which require the help of RNA binding proteins (RBPs) (Jackson, Pombo & Iborra, 2000; Latchman, 2011). To achieve sequence-specific recognition of regulation at different levels and regulatory targets, there are several RNA binding domains with conserved characteristics in RBPs, such as RNA recognition motif (RRM) domains (Burd & Dreyfuss, 1994; Lorković & Barta, 2002).
The RRM, also known as the RNA binding domain (RBD) or ribonucleoprotein domain (RNP), is one of the most abundant protein domains in eukaryotes and was first identified in the late 1980s (Adam et al., 1986; Bandziulis, Swanson & Dreyfuss, 1989; Dreyfuss, Kim & Kataoka, 2002; Dreyfuss, Swanson & Piñol-Roma, 1988). The RRM domain has important roles in the regulation of development, signaling, gene expression, and cell differentiation (Gomes et al., 2001; O’Bryan et al., 2013; Paukku et al., 2012; Zhan et al., 2015). The RRM is a structurally conserved region consisting of about 80–90 amino acids, consisting of two short consensus sequences: RNP1 (hexapeptide) and RNP2 (octapeptide) (Maris, Dominguez & Allain, 2005). It folds into an αβ sandwich with a typical β1α1β2β3α2β4 topology that forms a four-stranded antiparallel β-sheet packed against two α-helices (Nagai et al., 1990). The specificity of RNA binding is determined by multiple exposures to surrounding amino acids (Cléry, Blatter & Allain, 2008; Maris, Dominguez & Allain, 2005). In some cases, a third helix is present during RNA binding (Birney, Kumar & Krainer, 1993). The largest single-stranded RNA-binding proteome is the eukaryotic RRM family, which contains eight amino acid RRM1 consensus sequences (Bandziulis, Swanson & Dreyfuss, 1989; Query, Bentley & Keene, 1989). RRM proteins have a variety of RNA-binding preferences and functions, including heterogeneous nuclear ribonucleoproteins (hnRNPs), proteins associated with alternative splicing regulation (SR, U2AF, Sxl), protein components of small ribonucleoproteins (U1 and U2 snRNPs), and proteins that regulate RNA stability and translation (PABP) (Chambers et al., 1988; Query, Bentley & Keene, 1989; Sachs, Davis & Kornberg, 1987). The RRM in the heterodimer splicing factor U2 snRNP cofactor (U2AF) appears to have two RRM-like domains with special features for protein recognition (Kielkopf, Lücke & Green, 2004). This motif also appears in some single-stranded DNA-binding proteins (Cléry, Blatter & Allain, 2008). However, there are few reports on the OsRRM1 gene family. Previously unknown RRM1 transcription factors have been identified that interact directly with NLR to activate plant defense, establishing a direct link between transcriptional activation of immune responses and NRL-mediated pathogen perception (Zhai et al., 2019). Although the rice genome encodes a large number of OsRRM1 proteins, the exact number and function of these gene families in rice remain unclear.
Rice blast (Magnaporthe oryza) is one of the world’s most widespread and harmful fungal diseases. It may infect rice at all stages of growth and development, seriously reducing the yield and quality of rice and, thus, threatening global food security. Although conventional chemical control methods can quickly and effectively control diseases and pests, long-term use of pesticide can cause severe environmental problems and, incur costs, which are not conducive to sustainable agriculture (Jeon et al., 2020). Germplasm resources of blast resistance have extensive genetic variation. Therefore, improving the host plant’s own resistance is the most effective, economical and environmentally friendly way to combat rice blast (Manandhar et al., 1998). Many studies have shown that the adaptability of rice blast fungus to the host changes frequently and that the resistance of rice varieties can only be maintained for 3 to 5 years (Jeon et al., 2020; Moriyama et al., 2018; Nasir et al., 2018). Plant genomes express a large number of RRM-containing proteins, but only a few of their roles have been identified in plants; these include immunity, possibly through RNA processing (Lee, Kim & Hwang, 2012; Lorković, 2009; Nina & Biology FJCOiP, 2002; Woloshen, Huang & Li, 2011). Some possible members of the RRM transcription factor family have been identified but the roles of all RRM genes in transcriptional activation in rice and other plants have not been predicted (Zhai et al., 2019). Therefore, it is necessary to further study the regulation of the gene network during rice blast occurrence and to explore and identify new blast resistance genes. Such research has important theoretical and practical significance for the breeding of new varieties resistant to rice blast.
RRM1 family members play an important role in the regulation of biological growth and development; however, studies on the resistance function of RRM1 family members to rice blast have not been systematically analyzed. In this study, bioinformatics was used to identify and characterize the whole genome of the RRM1 gene family in rice. The gene structure, physical and chemical properties, and domain and phylogenetic characteristics of the RRM1 gene family in rice were studied. In addition, RNA-seq was used to analyze the expression patterns of the RRM1 gene family in different time periods after rice blast fungus treatment. At the same time, the expression changes of RRM1 family genes in response to stress resistance were analyzed by quantitative real-time PCR. These results increase our understanding of the OsRRM1 gene family and provide a basis for further investigation of its function in response to rice blast infection. This study provides a theoretical foundation for subsequent research into the function of the OsRRM1 gene family.
Materials and Methods
Identification and physicochemical properties of RRM1 gene family members in rice
Rice genome sequence, annotation, protein sequence, and gene structure files were downloaded from the Ensembl Plants database (http://plants.ensembl.org/index.html). The HMM (Hidden Markov Model) PF00076.24 (RRM1 domain) of the RRM1 gene family was downloaded from the Pfam database (http://pfam.xfam.org/). We used HMMER3.2 software to search and analyze the database and predict the RRM1 gene family in rice, obtaining an E-value < 1 × 10⁻⁵. Domain analysis of identified RRM1 candidate sequences was performed using conserved RRM1 domain sequences in the Pfam database (PF00076.24) and SMART online analysis software (http://smart.embl.de/). We used the ExPASy (https://www.expasy.org/protparam/) online tools to predict protein isoelectric points, molecular sizes, and the lengths of amino acid protein sequences. Prediction and analysis of protein subcellular locations were performed using the Cell-PLoc 2.0 (http://www.csbio.sjtu.edu.cn/bioinf/Cell-PLoc-2/) online tool.
Chromosome location of the OsRRM1 gene family and phylogenetic tree construction
The position of the RRM1 gene on the chromosome was analyzed using the rice gene sequence file downloaded from Ensembl Plants, with a chromosome location map drawn using TBtools software. The NJ (neighbor-joining method) phylogenetic tree of the RRM1 protein was constructed using MEGA11.0 (Molecular Evolutionary Genetics Analysis 11.0) with bootstraps set to 1,000 and other parameters left as their defaults. Then, the online software Itol (https://itol.embl.de/) was used to beautify the tree.
Analysis of the conserved domain, gene structure and motif of the OsRRM1 gene family
The conserved domains of the identified gene families were analyzed using the online tool Pfam (http://pfam.xfam.org/) and visualized by TBtools software (Chen et al., 2020).
Rice gene structure annotation files were downloaded from Ensembl Plants (http://plants.ensembl.org/) to identify the structure of the RRM1 gene family, with TBtools software used to draw the genetic structure.
The conserved motif location of the identified RRM1 gene family was predicted using the online tool MEME (https://meme-suite.org/meme/). The parameter settings were: motifs = 10, other parameters = default. The prediction results were plotted using TBtools software.
Interspecies collinearity analysis of the OsRRM1 gene family
Collinearity analysis and prediction of the RRM1 gene in rice and Arabidopsis thaliana were carried out. A collinearity map was drawn using TBtools software.
GO and KEGG analysis of OsRRM1 gene family
GO and KEGG analyses of the OsRRM1 gene family were performed using PlantRegMap (http://plantregmap.gao-lab.org/) and Kobas (https://bio.tools/kobas), respectively. All results were calculated with q < 0.05. Prism8.0 was used to plot the path name as the ordinate and the −log10 (q-value) as the abscissa.
Analysis of presumptive cis-regulatory elements in the promoter region of OsRRM1
We used TBtools to predict cis-regulatory elements in the 2,000 bp upstream gene promoter region of OsRRM1 in the PlantCARE Database (https://bioinformatics.psb.ugent.be/webtools/plantcare/html).
Expression pattern analysis of the RRM1 gene in rice treated with blast fungus
Fungus-inoculated rice seedlings were kept in a dark chamber at 25 °C with 85% humidity for 24 h. They were then maintained in the growth chamber at 26/24 °C under a 14 h light/10 h dark cycle with 85% humidity. Flag leaves were harvested at 24, 36, and 48 h, with three biological replicates collected for each treatment. To study the changes in rice blast gene expression, RNA-seq data were downloaded from the National Center for Biotechnology Information Gene Expression Omnibus (GEO) database (https://www.ncbi.nlm.nih.gov/) under accession number GSE157400 (Yang et al., 2020). To present data suitable for clustering display, after data analysis, the absolute FPKM value was obtained by dividing it by the mean of the control group and then performing log2 transformation. TBtools was used to map the expression patterns of OsRRM1 gene family members identified in rice under blast fungus treatment.
Plant materials and rice blast stress treatment
Dried, mature, well-developed rice seeds were treated with 2% sodium hypochlorite solution for 48 h. The seeds were placed in a hydroponic box and divided into control and treatment groups. The hydroponic box was placed in a growth chamber with a 14/10 h light/dark cycle and 28/24 °C temperature cycle.
The rice seedlings were cultivated in the growth chamber until they reached the two-leaf stage at about 14 days. Finally, suspensions of blast fungus (guy11) with concentrations of 1 × 10⁵ /mL were used as stress treatment. At 0, 12, 24, 36, and 48 h after infection with rice blast (guy11), the young rice leaves were immediately frozen in liquid nitrogen and stored at −80 °C for later use.
Analysis of OsRRM1 gene expression by qRT-PCR
Total RNA was extracted from rice materials according to the instructions of the Total RNA Extraction Kit (Takara) and the experimental method of Du et al. (2021). The first-strand cDNA was synthesized with a PrimeScript First-strand cDNA Synthesis Kit (Takara). Specific primers for four candidate genes were designed (Table 1). Quantitative real-time PCR was performed on a quantitative real-time fluorescent quantitative PCR system (ABI 7500). The relative gene expression was calculated by the 2−∆∆CT algorithm. For the experimental stress treatment data, the expression levels of each gene at 0 h were standardized to 1, with the expression levels at other time points calculated relative to this.
| Gene | F | R |
|---|---|---|
| RRM1-15 | GGATGTGACTGAAGCTCGGGTGATC | CTGGAGGTCTCTCATTCGCGAAGTTC |
| RRM1-61 | GGAGGTCTTGGAAGCCAAGGTCATC | CCATCCATGTCAGCGCCATCAAG |
| RRM1-76 | CACTGAAGCAAAGGTGGTTTTTGAC | GAGCTTTATCGACAGTGATCGCC |
| RRM1-207 | CTTGGATGGAAAGGATCTCGATGG | CATAGCCACCGCCTCCATAG |
| Actin | CCAATCGTGAGAAGATGACCCA | CCATCAGGAAGCTCGTAGCTCT |
Note:
Actin is the internal reference gene used in this experiment. F is the forward primers, R is the reverse primers.
Subcellular analysis of the OsRRM1 gene
Construction of a subcellular carrier plasmid. The plasmid of the subcellular localization system (1300S-EGFP) was used to construct the vector for this experiment. It was subjected to single-enzyme digestion with Kpn I restriction enzyme to prepare a linearized vector. Specific primers were designed according to the candidate OsRRM1 gene sequence (Table S1), and the rice cDNA was used as a template to amplify the fragment. In this experiment, the homologous recombinant ligase ClonExpress II One Step Cloning Kit (Vazyme) was used to construct the recombinant plasmid.
Instantaneous transformation experiment with tobacco leaves. Several tobacco seeds were sown and grown for 28 d under a 12/12 h light/dark cycle for experimental use. The constructed recombinant plasmid was transferred to Agrobacterium EHA105 by the electrochemical method and cultured at 30 °C for 2 d. Agrobacterium was scraped off the surface of a solid culture dish with an inoculation ring and cultured in 10 mL YEB liquid medium at 170 rpm/min for 1 h. The bacteria were re-suspended with 10 mM MgCl2 solution. Tobacco plants with good growth conditions were selected, and the lower epidermis of tobacco leaves was injected with a 1 mL syringe and labeled. After injection, the tobacco plants were cultured in low light for 2 d. Tobacco leaves inoculated with Agrobacterium tumefaciens were selected to make slides, and observed and photographed by confocal laser microscopy.
Results
Screening and identification of RRM1 gene family members in rice
In this study, the domains (Pfam: PF00076.24) predicted that 212 RRM1 genes (all with E values < 1 × 10⁻⁵) were identified in the whole rice genome. Their conserved domain was analyzed by Pfam (Fig. 1). The results show that all 212 OsRRM1 genes contained RRM1, but its locations in the genes differed. These genes are named OsRRM1-1–OsRRM1-212 based on their physical location on the chromosome (Table 2). We used Expasy (https://web.expasy.org/protparam/) to analyze the 212 OsRRM1 genes’ molecular weights, lengths, isoelectric points, amino acids, etc. The results show that the lengths of amino acids encoding the 212 rice RRM1 genes ranged from 53 to 1,160 aa, the molecular weights ranged from 5,837 to 127,816 Da, and the theoretical isoelectric point distribution ranged from 3.97 to 12.37. Subcellular localization prediction shows that OsRRM1 was mainly located in the nucleus, followed by the extracellular matrix, mitochondria, chloroplast, cell membrane, and intracytoplasmic matrix. This suggests that these proteins mainly function in the nucleus. These variations suggest potential functional diversity and regulatory mechanisms, but they also pose challenges for researchers aiming to elucidate their roles in rice biology. Understanding how these differences impact protein structure, function, and interaction networks will require comprehensive experimental approaches, including functional assays, protein-protein interaction studies, and computational modeling. Moreover, considering the dynamic nature of gene expression and post-translational modifications, integrating multi-omics data and employing systems biology approaches will be essential for gaining deeper insights into the OsRRM1 gene family’s functions and regulatory networks in rice.
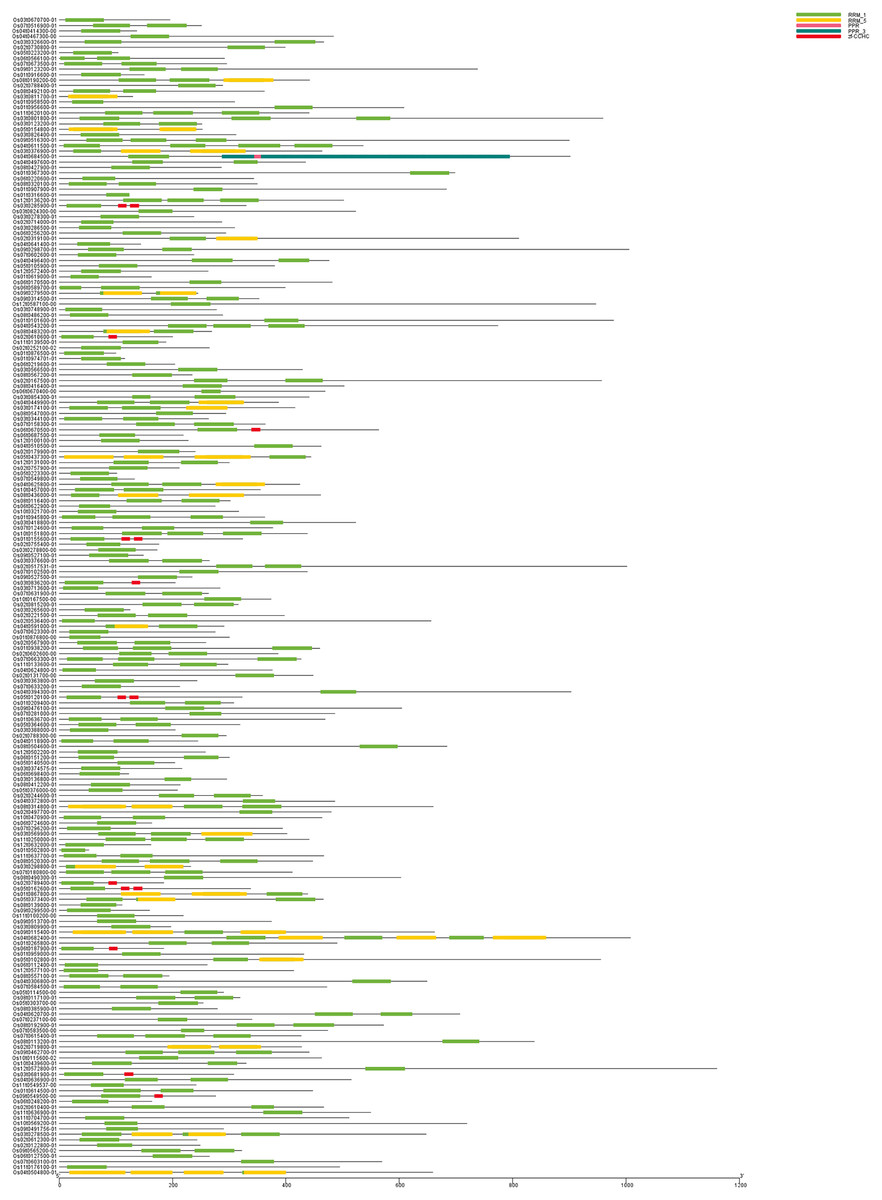
Figure 1: The conserved domain of OsRRM1 gene family.
The five most prominently present conserved domains in the upper right corner are represented by different colored boxes. All OsRRM1 genes contain the green RRM1 domain. The length of each conserved domain can be inferred from the scale at the bottom.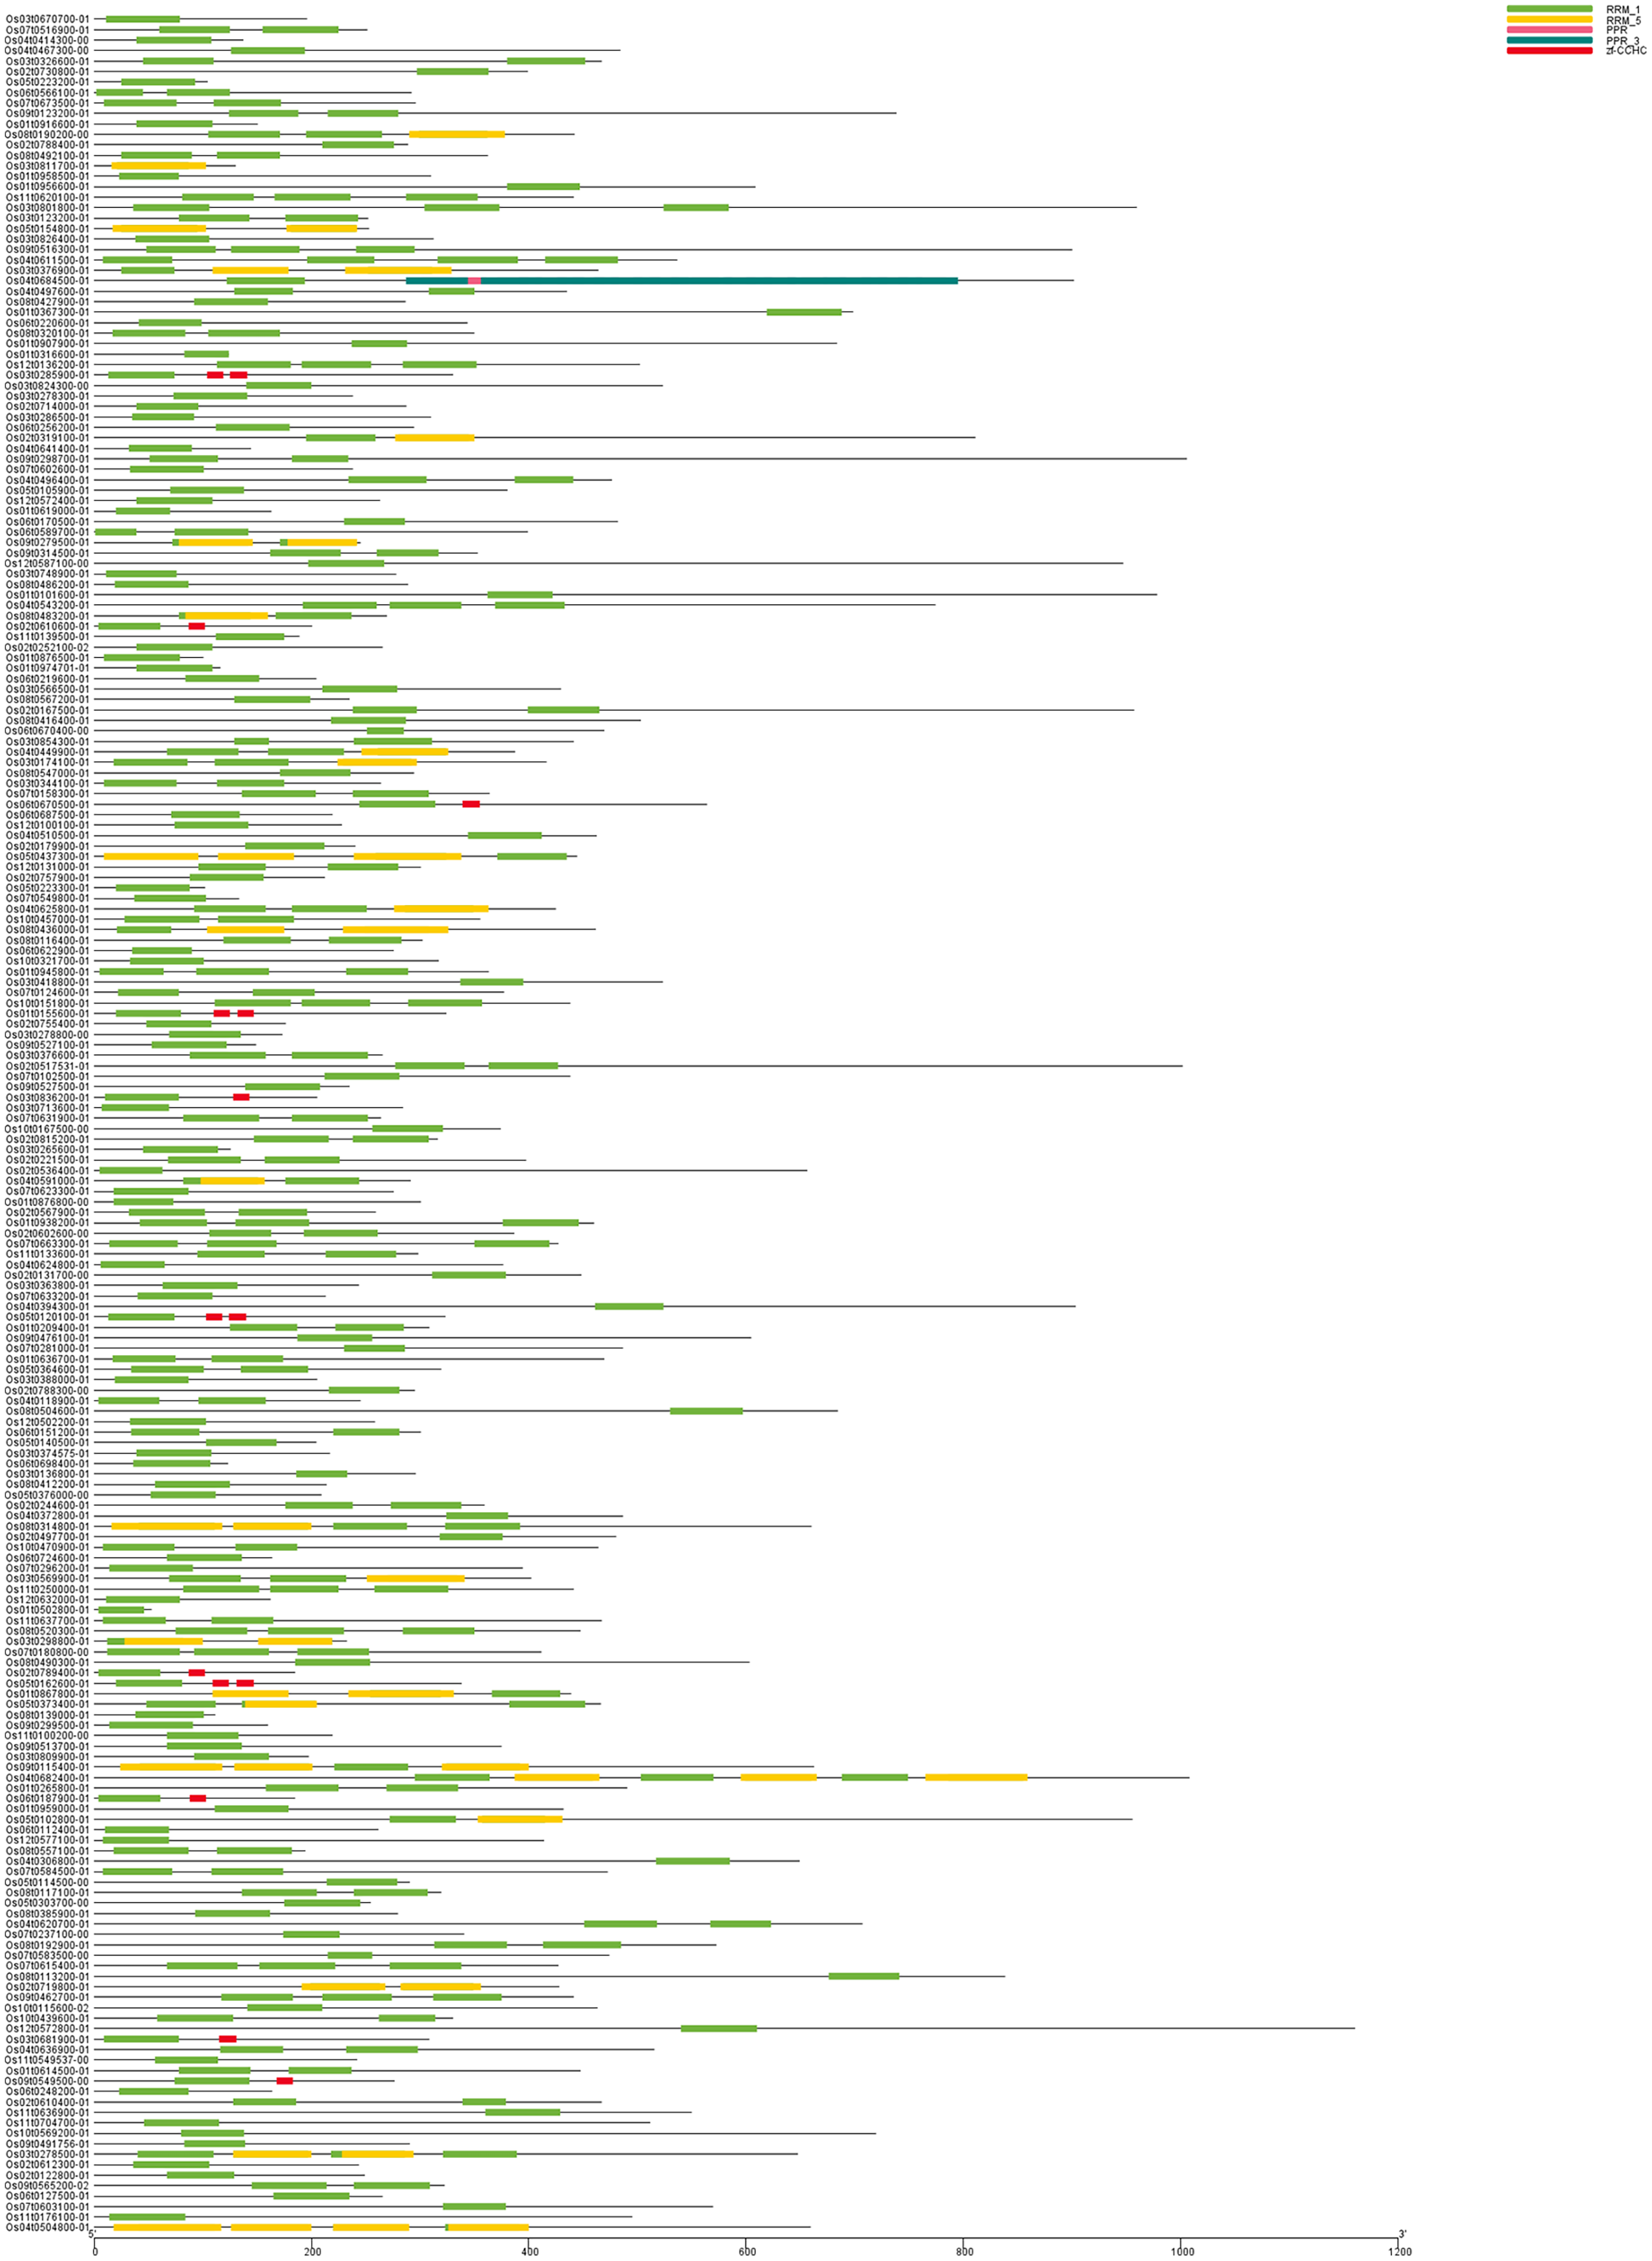
| Gene | RAP | NAA | MW | pI | Subcellular localization |
|---|---|---|---|---|---|
| RRM1-1 | Os01g0101600 | 978 | 106,323.33 | 9.56 | Nucleus |
| RRM1-2 | Os01g0155600 | 324 | 36,893.16 | 11.27 | Nucleus |
| RRM1-3 | Os01g0209400 | 308 | 33,656.38 | 8.94 | Nucleus |
| RRM1-4 | Os01g0265800 | 490 | 49,279.96 | 5.09 | Nucleus |
| RRM1-5 | Os01g0316600 | 124 | 13,965.3 | 9.91 | Chloroplast |
| RRM1-6 | Os01g0367300 | 698 | 79,763.67 | 10.57 | Nucleus |
| RRM1-7 | Os01g0502800 | 53 | 5,837.75 | 10.27 | Chloroplast |
| RRM1-8 | Os01g0614500 | 447 | 44,269.69 | 8.43 | Nucleus |
| RRM1-9 | Os01g0619000 | 163 | 18,016.54 | 5.76 | Extracellular space |
| RRM1-10 | Os01g0636700 | 469 | 52,108.23 | 8.63 | Nucleus |
| RRM1-11 | Os01g0867800 | 439 | 49,316.8 | 6.46 | Nucleus |
| RRM1-12 | Os01g0876500 | 100 | 11,385 | 7.72 | Chloroplast |
| RRM1-13 | Os01g0876800 | 300 | 31,951.79 | 8.91 | Extracellular space |
| RRM1-14 | Os01g0907900 | 683 | 71,779.19 | 6.37 | Nucleus |
| RRM1-15 | Os01g0916600 | 150 | 15,546.9 | 8.01 | Chloroplast thylakoid lumen |
| RRM1-16 | Os01g0938200 | 460 | 48,888.22 | 8.72 | Nucleus |
| RRM1-17 | Os01g0945800 | 363 | 40,073.63 | 6.61 | Nucleus |
| RRM1-18 | Os01g0956600 | 608 | 68,184.84 | 7.8 | Nucleus |
| RRM1-19 | Os01g0958500 | 310 | 31,802.78 | 8.34 | Nucleus |
| RRM1-20 | Os01g0959000 | 432 | 48,111.49 | 12.37 | Chloroplast thylakoid lumen |
| RRM1-21 | Os01g0974701 | 116 | 12,459.19 | 9.74 | Mitochondrion |
| RRM1-22 | Os02g0122800 | 249 | 28,953.55 | 10 | Nucleus |
| RRM1-23 | Os02g0131700 | 448 | 49,261.45 | 5.02 | Nucleus |
| RRM1-24 | Os02g0167500 | 957 | 105,767.07 | 7.88 | Extracellular space |
| RRM1-25 | Os02g0179900 | 240 | 28,105.95 | 8.85 | Nucleus |
| RRM1-26 | Os02g0221500 | 397 | 40,265.08 | 5.63 | Nucleus |
| RRM1-27 | Os02g0244600 | 359 | 38,737.53 | 5.62 | Nucleus |
| RRM1-28 | Os02g0252100 | 265 | 30,466.57 | 11.09 | Nucleus |
| RRM1-29 | Os02g0319100 | 811 | 90,295.23 | 6.27 | Nucleus |
| RRM1-30 | Os02g0497700 | 480 | 50,879.51 | 5.01 | Nucleus |
| RRM1-31 | Os02g0517531 | 1,001 | 110,368.83 | 6.39 | Nucleus |
| RRM1-32 | Os02g0536400 | 656 | 74,812.42 | 9.43 | Nucleus |
| RRM1-33 | Os02g0567900 | 259 | 28,284.5 | 9.18 | Nucleus |
| RRM1-34 | Os02g0602600 | 386 | 41,584.82 | 7.67 | Nucleus |
| RRM1-35 | Os02g0610400 | 467 | 51,689.83 | 5.56 | Nucleus |
| RRM1-36 | Os02g0610600 | 200 | 22,797.31 | 11.33 | Nucleus |
| RRM1-37 | Os02g0612300 | 243 | 28,573.22 | 5.44 | Chloroplast |
| RRM1-38 | Os02g0714000 | 287 | 30,609.94 | 9.32 | Nucleus |
| RRM1-39 | Os02g0719800 | 428 | 47,331.12 | 5.57 | Nucleus |
| RRM1-40 | Os02g0730800 | 399 | 43,547.8 | 6.15 | Extracellular space |
| RRM1-41 | Os02g0755400 | 176 | 18,512.61 | 9.99 | Mitochondrion |
| RRM1-42 | Os02g0757900 | 212 | 24,083.82 | 5.07 | Nucleus |
| RRM1-43 | Os02g0788300 | 295 | 32,235.18 | 7.72 | Nucleus |
| RRM1-44 | Os02g0788400 | 289 | 32,009.09 | 8.66 | Nucleus |
| RRM1-45 | Os02g0789400 | 185 | 21,023.33 | 11.24 | Nucleus |
| RRM1-46 | Os02g0815200 | 316 | 34,612.01 | 5.17 | Chloroplast thylakoid lumen |
| RRM1-47 | Os03g0123200 | 252 | 28,108.69 | 7.64 | Nucleus |
| RRM1-48 | Os03g0136800 | 296 | 32,305.94 | 9.02 | Nucleus |
| RRM1-49 | Os03g0174100 | 416 | 46,056.33 | 5.35 | Nucleus |
| RRM1-50 | Os03g0265600 | 125 | 13,993.55 | 7.86 | Chloroplast |
| RRM1-51 | Os03g0278300 | 238 | 24,720.42 | 9.83 | Chloroplast |
| RRM1-52 | Os03g0278500 | 647 | 72,627.76 | 8.43 | Nucleus |
| RRM1-53 | Os03g0278800 | 173 | 18,433.86 | 9.3 | Chloroplast outer membrane |
| RRM1-54 | Os03g0285900 | 330 | 37,042.2 | 11 | Nucleus |
| RRM1-55 | Os03g0286500 | 310 | 32,704.09 | 9 | Extracellular space |
| RRM1-56 | Os03g0298800 | 232 | 26,100.86 | 9.44 | Chloroplast |
| RRM1-57 | Os03g0326600 | 467 | 51,073.78 | 9.06 | Nucleus |
| RRM1-58 | Os03g0344100 | 264 | 29,782.1 | 10.08 | Nucleus |
| RRM1-59 | Os03g0363800 | 243 | 27,781.69 | 10.83 | Nucleus |
| RRM1-60 | Os03g0374575 | 217 | 25,589.48 | 11.17 | Nucleus |
| RRM1-61 | Os03g0376600 | 265 | 28,556.57 | 4.5 | Chloroplast outer membrane |
| RRM1-62 | Os03g0376900 | 464 | 49,564.37 | 6.39 | Nucleus |
| RRM1-63 | Os03g0388000 | 205 | 24,739.51 | 10.27 | Nucleus |
| RRM1-64 | Os03g0418800 | 523 | 56,761.18 | 8.75 | Chloroplast |
| RRM1-65 | Os03g0566500 | 429 | 46,194.37 | 9.62 | Chloroplast |
| RRM1-66 | Os03g0569900 | 402 | 43,945.82 | 5.34 | Extracellular space |
| RRM1-67 | Os03g0670700 | 196 | 20,375.4 | 6.73 | Nucleus |
| RRM1-68 | Os03g0681900 | 308 | 34,036.6 | 9.05 | Nucleus |
| RRM1-69 | Os03g0713600 | 284 | 30,904.71 | 5.06 | Nucleus |
| RRM1-70 | Os03g0748900 | 278 | 29,986.94 | 9.23 | Nucleus |
| RRM1-71 | Os03g0801800 | 959 | 105,396.52 | 9.48 | Nucleus |
| RRM1-72 | Os03g0809900 | 197 | 21,969.34 | 5.2 | Nucleus |
| RRM1-73 | Os03g0811700 | 130 | 14,710.82 | 9.49 | Cloroplast |
| RRM1-74 | Os03g0824300 | 523 | 58,186.08 | 7.22 | Nucleus |
| RRM1-75 | Os03g0826400 | 312 | 36,258.57 | 9.25 | Nucleus |
| RRM1-76 | Os03g0836200 | 205 | 21,823.38 | 8.29 | Nucleus |
| RRM1-77 | Os03g0854300 | 441 | 48,288.94 | 10.11 | Nucleus |
| RRM1-78 | Os04g0118900 | 245 | 28,783.89 | 9.94 | Nucleus |
| RRM1-79 | Os04g0306800 | 649 | 72,026.14 | 9.09 | Nucleus |
| RRM1-80 | Os04g0372800 | 486 | 51,446 | 5.1 | Nucleus |
| RRM1-81 | Os04g0394300 | 903 | 97,243.83 | 8.7 | Nucleus |
| RRM1-82 | Os04g0414300 | 137 | 15,074.25 | 9.93 | Chloroplast |
| RRM1-83 | Os04g0449900 | 387 | 41,807.64 | 8.68 | Extracellular space |
| RRM1-84 | Os04g0467300 | 484 | 51,314.72 | 7.33 | Nucleus |
| RRM1-85 | Os04g0496400 | 476 | 53,576.63 | 4.69 | Nucleus |
| RRM1-86 | Os04g0497600 | 435 | 48,295.81 | 5.49 | Nucleus |
| RRM1-87 | Os04g0504800 | 659 | 71,231.24 | 8.95 | Extracellular space |
| RRM1-88 | Os04g0510500 | 462 | 51,785.72 | 5.01 | Nucleus |
| RRM1-89 | Os04g0543200 | 774 | 86,649.43 | 5.64 | Nucleus |
| RRM1-90 | Os04g0591000 | 291 | 31,672.86 | 6.05 | Mitochondrion |
| RRM1-91 | Os04g0611500 | 536 | 60,240.64 | 9.16 | Nucleus |
| RRM1-92 | Os04g0620700 | 707 | 75,253.44 | 4.85 | Nucleus |
| RRM1-93 | Os04g0624800 | 376 | 40,858.93 | 5.59 | Nucleus |
| RRM1-94 | Os04g0625800 | 425 | 46,195.8 | 5.99 | Extracellular space |
| RRM1-95 | Os04g0636900 | 515 | 52,204.84 | 5.79 | Nucleus |
| RRM1-96 | Os04g0641400 | 144 | 16,026.58 | 4.61 | Nucleus |
| RRM1-97 | Os04g0682400 | 1,008 | 110,200.99 | 6.17 | Nucleus |
| RRM1-98 | Os04g0684500 | 901 | 101,135.53 | 6.65 | Chloroplast inner membrane |
| RRM1-99 | Os05g0102800 | 955 | 104,522 | 6.01 | Nucleus |
| RRM1-100 | Os05g0105900 | 380 | 42,434.11 | 12.18 | Nucleus |
| RRM1-101 | Os05g0114500 | 290 | 32,890.31 | 6.85 | Nucleus |
| RRM1-102 | Os05g0120100 | 323 | 36,222.41 | 10.83 | Nucleus |
| RRM1-103 | Os05g0140500 | 204 | 22,104.33 | 5.18 | Nucleus |
| RRM1-104 | Os05g0154800 | 253 | 28,203.66 | 9.2 | Cytoplasm |
| RRM1-105 | Os05g0162600 | 338 | 39,019.1 | 9.83 | Nucleus |
| RRM1-106 | Os05g0223200 | 104 | 11,486.44 | 8.03 | Nucleus |
| RRM1-107 | Os05g0223300 | 102 | 11,702.99 | 5.06 | Nucleus |
| RRM1-108 | Os05g0303700 | 254 | 29,800.11 | 8.77 | Nucleus |
| RRM1-109 | Os05g0364600 | 319 | 36,105.16 | 11.2 | Nucleus |
| RRM1-110 | Os05g0373400 | 466 | 50,213.29 | 8.1 | Nucleus |
| RRM1-111 | Os05g0376000 | 209 | 23,394.61 | 9.14 | Nucleus |
| RRM1-112 | Os05g0437300 | 444 | 49,754.23 | 6.41 | Nucleus |
| RRM1-113 | Os06g0112400 | 261 | 27,763.35 | 6.23 | Nucleus |
| RRM1-114 | Os06g0127500 | 265 | 28,209.55 | 7.14 | Nucleus |
| RRM1-115 | Os06g0151200 | 300 | 32,650.85 | 5 | Nucleus |
| RRM1-116 | Os06g0170500 | 482 | 54,009.89 | 8.12 | Nucleus |
| RRM1-117 | Os06g0187900 | 185 | 21,183.36 | 11.29 | Nucleus |
| RRM1-118 | Os06g0219600 | 204 | 23,178.94 | 5.19 | Nucleus |
| RRM1-119 | Os06g0220600 | 343 | 36,170.91 | 9.63 | Chloroplast outer membrane |
| RRM1-120 | Os06g0248200 | 164 | 17,952.57 | 5.98 | Nucleus |
| RRM1-121 | Os06g0256200 | 294 | 31,817.7 | 10.97 | Nucleus |
| RRM1-122 | Os06g0566100 | 292 | 29,810.49 | 9.33 | Nucleus |
| RRM1-123 | Os06g0589700 | 399 | 43,823.12 | 9.17 | Nucleus |
| RRM1-124 | Os06g0622900 | 275 | 29,594.2 | 8.39 | Nucleus |
| RRM1-125 | Os06g0670400 | 469 | 53,864.27 | 5.38 | Nucleus |
| RRM1-126 | Os06g0670500 | 564 | 64,975.32 | 5.63 | Nucleus |
| RRM1-127 | Os06g0687500 | 219 | 23,922.07 | 9.52 | Endomembrane system |
| RRM1-128 | Os06g0698400 | 123 | 13,222.7 | 5 | Nucleus |
| RRM1-129 | Os06g0724600 | 164 | 18,503.88 | 10.31 | Nucleus |
| RRM1-130 | Os07g0102500 | 438 | 47,703.93 | 9.53 | Nucleus |
| RRM1-131 | Os07g0124600 | 377 | 41,006.31 | 6.68 | Nucleus |
| RRM1-132 | Os07g0158300 | 364 | 39,084.91 | 4.61 | Mitochondrion |
| RRM1-133 | Os07g0180800 | 411 | 46,253.74 | 9.65 | Nucleus |
| RRM1-134 | Os07g0237100 | 340 | 36,144.67 | 10.27 | Chloroplast |
| RRM1-135 | Os07g0281000 | 486 | 54,334.99 | 6.72 | Nucleus |
| RRM1-136 | Os07g0296200 | 394 | 43,291.14 | 8.3 | Nucleus |
| RRM1-137 | Os07g0516900 | 251 | 27,613.79 | 6.3 | Extracellular space |
| RRM1-138 | Os07g0549800 | 133 | 14,421.25 | 9.41 | Chloroplast outer membrane |
| RRM1-139 | Os07g0583500 | 474 | 54,197.46 | 6.55 | Extracellular space |
| RRM1-140 | Os07g0584500 | 472 | 50,477.44 | 5.94 | Nucleus |
| RRM1-141 | Os07g0602600 | 238 | 23,564.23 | 8.54 | Mitochondrion |
| RRM1-142 | Os07g0603100 | 569 | 62,175.74 | 6.15 | Nucleus |
| RRM1-143 | Os07g0615400 | 427 | 46,723.56 | 7.19 | Nucleus |
| RRM1-144 | Os07g0623300 | 275 | 32,242.91 | 11.35 | Nucleus |
| RRM1-145 | Os07g0631900 | 264 | 28,099.31 | 4.75 | Chloroplast thylakoid lumen |
| RRM1-146 | Os07g0633200 | 213 | 24,820.57 | 10.68 | Nucleus |
| RRM1-147 | Os07g0663300 | 427 | 46,493.89 | 9.17 | Nucleus |
| RRM1-148 | Os07g0673500 | 296 | 33,141.48 | 10.64 | Nucleus |
| RRM1-149 | Os08g0113200 | 838 | 95,016.62 | 5.47 | Endomembrane system |
| RRM1-150 | Os08g0116400 | 302 | 32,739.26 | 6.4 | Nucleus |
| RRM1-151 | Os08g0117100 | 319 | 35,941.88 | 6.02 | Chloroplast outer membrane |
| RRM1-152 | Os08g0139000 | 111 | 11,938.8 | 9.55 | Chloroplast outer membrane |
| RRM1-153 | Os08g0190200 | 442 | 47,809.63 | 5.86 | Extracellular space |
| RRM1-154 | Os08g0192900 | 572 | 60,393.68 | 4.98 | Nucleus |
| RRM1-155 | Os08g0314800 | 660 | 71,558.46 | 7.55 | Nucleus |
| RRM1-156 | Os08g0320100 | 350 | 36,738.65 | 9.22 | Nucleus |
| RRM1-157 | Os08g0385900 | 279 | 32,947.48 | 11.88 | Nucleus |
| RRM1-158 | Os08g0412200 | 214 | 25,104.07 | 10.05 | Chloroplast |
| RRM1-159 | Os08g0416400 | 503 | 54,742.2 | 7.66 | Nucleus |
| RRM1-160 | Os08g0427900 | 286 | 30,491.17 | 11.05 | Nucleus |
| RRM1-161 | Os08g0436000 | 461 | 49,888.14 | 6.46 | Nucleus |
| RRM1-162 | Os08g0483200 | 269 | 29,132.14 | 9.39 | Mitochondrion |
| RRM1-163 | Os08g0486200 | 289 | 33,541.09 | 11.8 | Nucleus |
| RRM1-164 | Os08g0490300 | 603 | 64,733.85 | 6.09 | Nucleus |
| RRM1-165 | Os08g0492100 | 362 | 38,125.83 | 9.22 | Nucleus |
| RRM1-166 | Os08g0504600 | 684 | 75,299.38 | 6.19 | Nucleus |
| RRM1-167 | Os08g0520300 | 447 | 48,765.28 | 6.86 | Nucleus |
| RRM1-168 | Os08g0547000 | 294 | 31,708.05 | 7.08 | Nucleus |
| RRM1-169 | Os08g0557100 | 194 | 21,388.83 | 4.95 | Chloroplast |
| RRM1-170 | Os08g0567200 | 235 | 26,254.56 | 9.77 | Nucleus |
| RRM1-171 | Os09g0115400 | 662 | 71,630.27 | 6.45 | Mitochondrion |
| RRM1-172 | Os09g0123200 | 738 | 79,658.29 | 9.09 | Nucleus |
| RRM1-173 | Os09g0279500 | 245 | 26,681.14 | 8.53 | Chloroplast thylakoid lumen |
| RRM1-174 | Os09g0298700 | 1,005 | 110,844.59 | 6.79 | Nucleus |
| RRM1-175 | Os09g0299500 | 160 | 17,315.17 | 5.76 | Extracellular space |
| RRM1-176 | Os09g0314500 | 353 | 38,868.39 | 5.96 | Nucleus |
| RRM1-177 | Os09g0462700 | 441 | 46,949.78 | 8.52 | Chloroplast |
| RRM1-178 | Os09g0476100 | 604 | 64,263.07 | 6.3 | Nucleus |
| RRM1-179 | Os09g0491756 | 290 | 34,087.52 | 8.92 | Nucleus |
| RRM1-180 | Os09g0513700 | 375 | 43,193.42 | 9.74 | Nucleus |
| RRM1-181 | Os09g0516300 | 900 | 97,198.57 | 6.85 | Nucleus |
| RRM1-182 | Os09g0527100 | 149 | 16,616.66 | 8.8 | Nucleus |
| RRM1-183 | Os09g0527500 | 235 | 25,960.25 | 8.81 | Nucleus |
| RRM1-184 | Os09g0549500 | 276 | 29,500.33 | 9.18 | Nucleus |
| RRM1-185 | Os09g0565200 | 322 | 35,425.05 | 4.41 | Mitochondrion |
| RRM1-186 | Os10g0115600 | 463 | 55,113.96 | 9.1 | Nucleus |
| RRM1-187 | Os10g0151800 | 438 | 47,821.62 | 4.98 | Nucleus |
| RRM1-188 | Os10g0167500 | 374 | 40,267.56 | 3.97 | Nucleus |
| RRM1-189 | Os10g0321700 | 317 | 32,244.11 | 4.59 | Chloroplast thylakoid lumen |
| RRM1-190 | Os10g0439600 | 330 | 34,829.59 | 4.96 | Nucleus |
| RRM1-191 | Os10g0457000 | 355 | 38,849.39 | 8.55 | Nucleus |
| RRM1-192 | Os10g0470900 | 464 | 45,620.47 | 6.24 | Nucleus |
| RRM1-193 | Os10g0569200 | 719 | 83,181.8 | 4.98 | Nucleus |
| RRM1-194 | Os11g0100200 | 219 | 24,033.05 | 9.87 | Nucleus |
| RRM1-195 | Os11g0133600 | 298 | 32,998.39 | 7.65 | Nucleus |
| RRM1-196 | Os11g0139500 | 189 | 21,471.25 | 4.13 | Extracellular space |
| RRM1-197 | Os11g0176100 | 495 | 52,955.01 | 6.43 | Extracellular space |
| RRM1-198 | Os11g0250000 | 441 | 48,446.94 | 5.68 | Nucleus |
| RRM1-199 | Os11g0549537 | 242 | 26,479.77 | 6.08 | Chloroplast |
| RRM1-200 | Os11g0620100 | 441 | 47,561.26 | 6.86 | Nucleus |
| RRM1-201 | Os11g0636900 | 550 | 61,141.76 | 7.78 | Nucleus |
| RRM1-202 | Os11g0637700 | 467 | 49,048.64 | 8.44 | Nucleus |
| RRM1-203 | Os11g0704700 | 511 | 57,960.23 | 10.14 | Chloroplast |
| RRM1-204 | Os12g0100100 | 228 | 24,809.9 | 9.87 | Nucleus |
| RRM1-205 | Os12g0131000 | 300 | 33,277.87 | 8.81 | Chloroplast |
| RRM1-206 | Os12g0136200 | 502 | 55,072.87 | 5.03 | Nucleus |
| RRM1-207 | Os12g0502200 | 258 | 25,044.52 | 4.74 | Mitochondrion |
| RRM1-208 | Os12g0572400 | 263 | 30,186.19 | 10.9 | Nucleus |
| RRM1-209 | Os12g0572800 | 1,160 | 127,816.97 | 8.61 | Plasma membrane |
| RRM1-210 | Os12g0577100 | 414 | 47,380.57 | 9.1 | Nucleus |
| RRM1-211 | Os12g0587100 | 947 | 106,893.09 | 9.14 | Nucleus |
| RRM1-212 | Os12g0632000 | 162 | 16,083.1 | 6.31 | Nucleus |
Note:
RAP represents the gene ID of OsRRM1 gene, NAA represents the number of amino acids of the OsRRM1 gene, MW represents the molecular weight of OsRRM1 gene, and PI represents the isoelectric point of OsRRM1 gene. On the far right is the subcellular localization of the OsRRM1 gene.
Chromosome localization and phylogenetic tree analysis of the OsRRM1 gene family
The positions of 212 OsRRM1 genes on chromosomes were mapped using TBtools software (Fig. 2). There were 212 OsRRM1 genes distributed on all 12 chromosomes, among which the 31 OsRRM1 genes on chromosome 3 were the most distributed, and only eight OsRRM1 genes were on chromosome 10, being the least distributed. Distinct gene clusters were formed on chromosomes 1, 2, and 3.
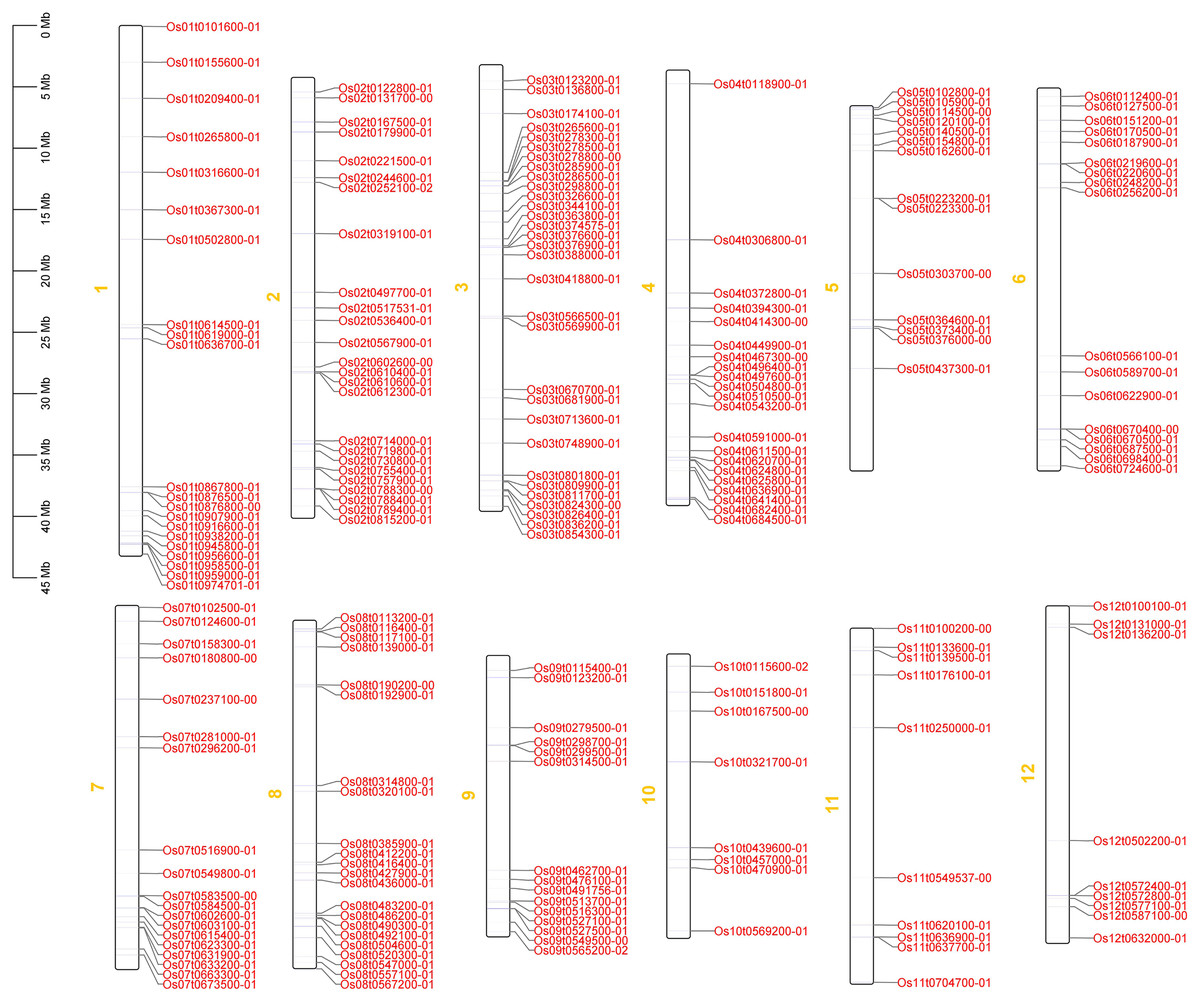
Figure 2: Chromosome mapping of OsRRM1 gene family.
OsRRM1 gene is widely distributed in twelve chromosomes of rice, and the position of OsRRM1 gene of chromosome in rice can be inferred according to the picture.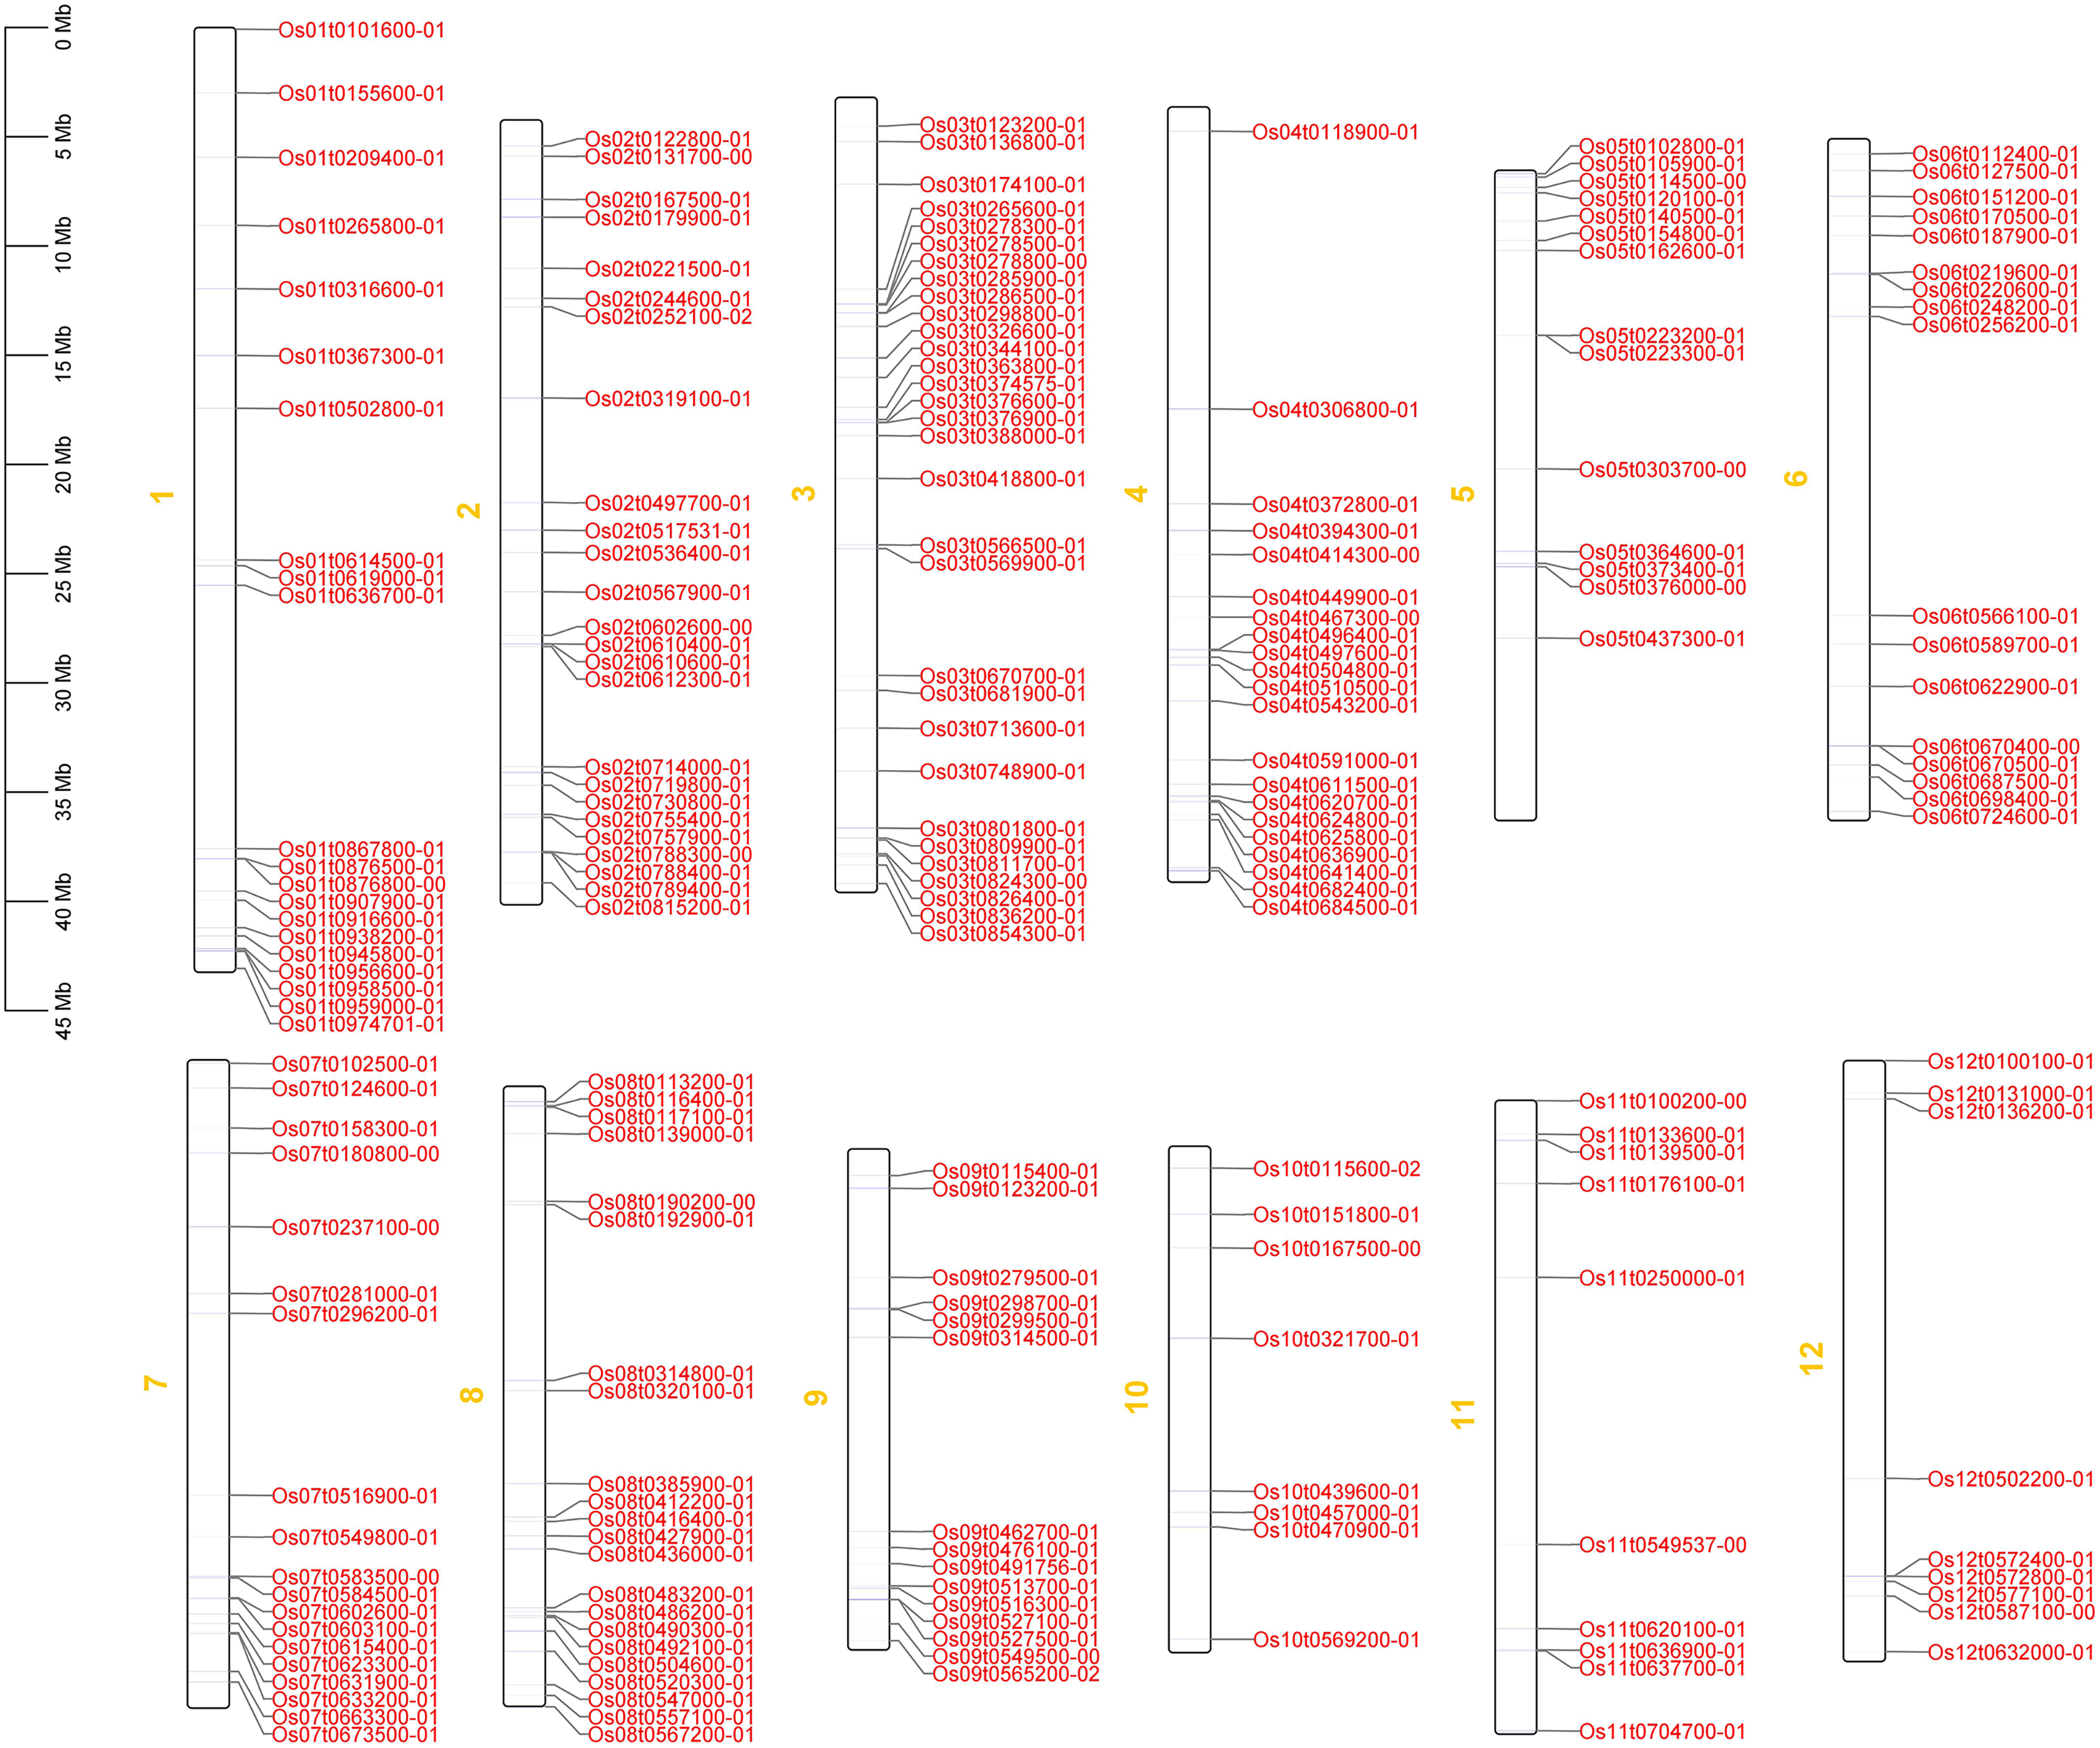
Phylogenetic trees of the 212 OsRRM1 proteins were constructed (Fig. 3). By analyzing the structure of the evolutionary tree, these proteins could be divided into five classes. The group V contained the highest number of OsRRM1 proteins (61). The group III contained 58 RRM1 proteins, while the group II and group IV contained 33 and 53 RRM1 proteins, respectively. The group I had the lowest number of RRM1 proteins (7). These groupings reflect the correlation and kinship between OsRRM1 protein sequences. By studying the differences and similarities between these groups, we can better understand the evolution and functions of OsRRM1 proteins.
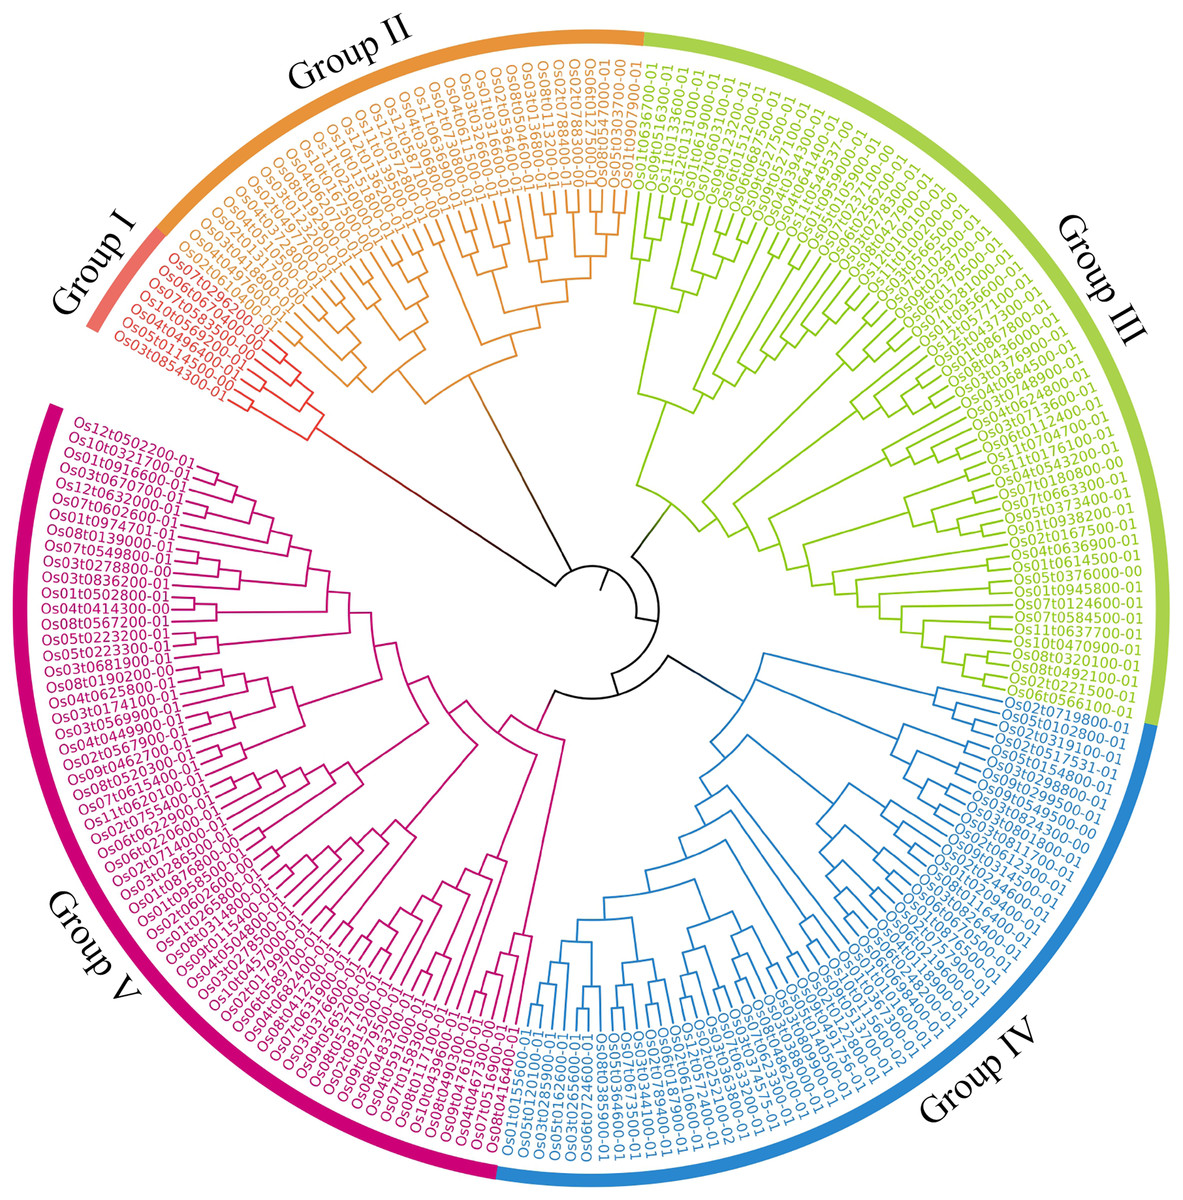
Figure 3: Phylogenetic tree of OsRRM1 gene family.
MEGA11.0 with the bootstrap value of 1,000 and use default for other parameters. Different subfamilies are highlighted using different colors.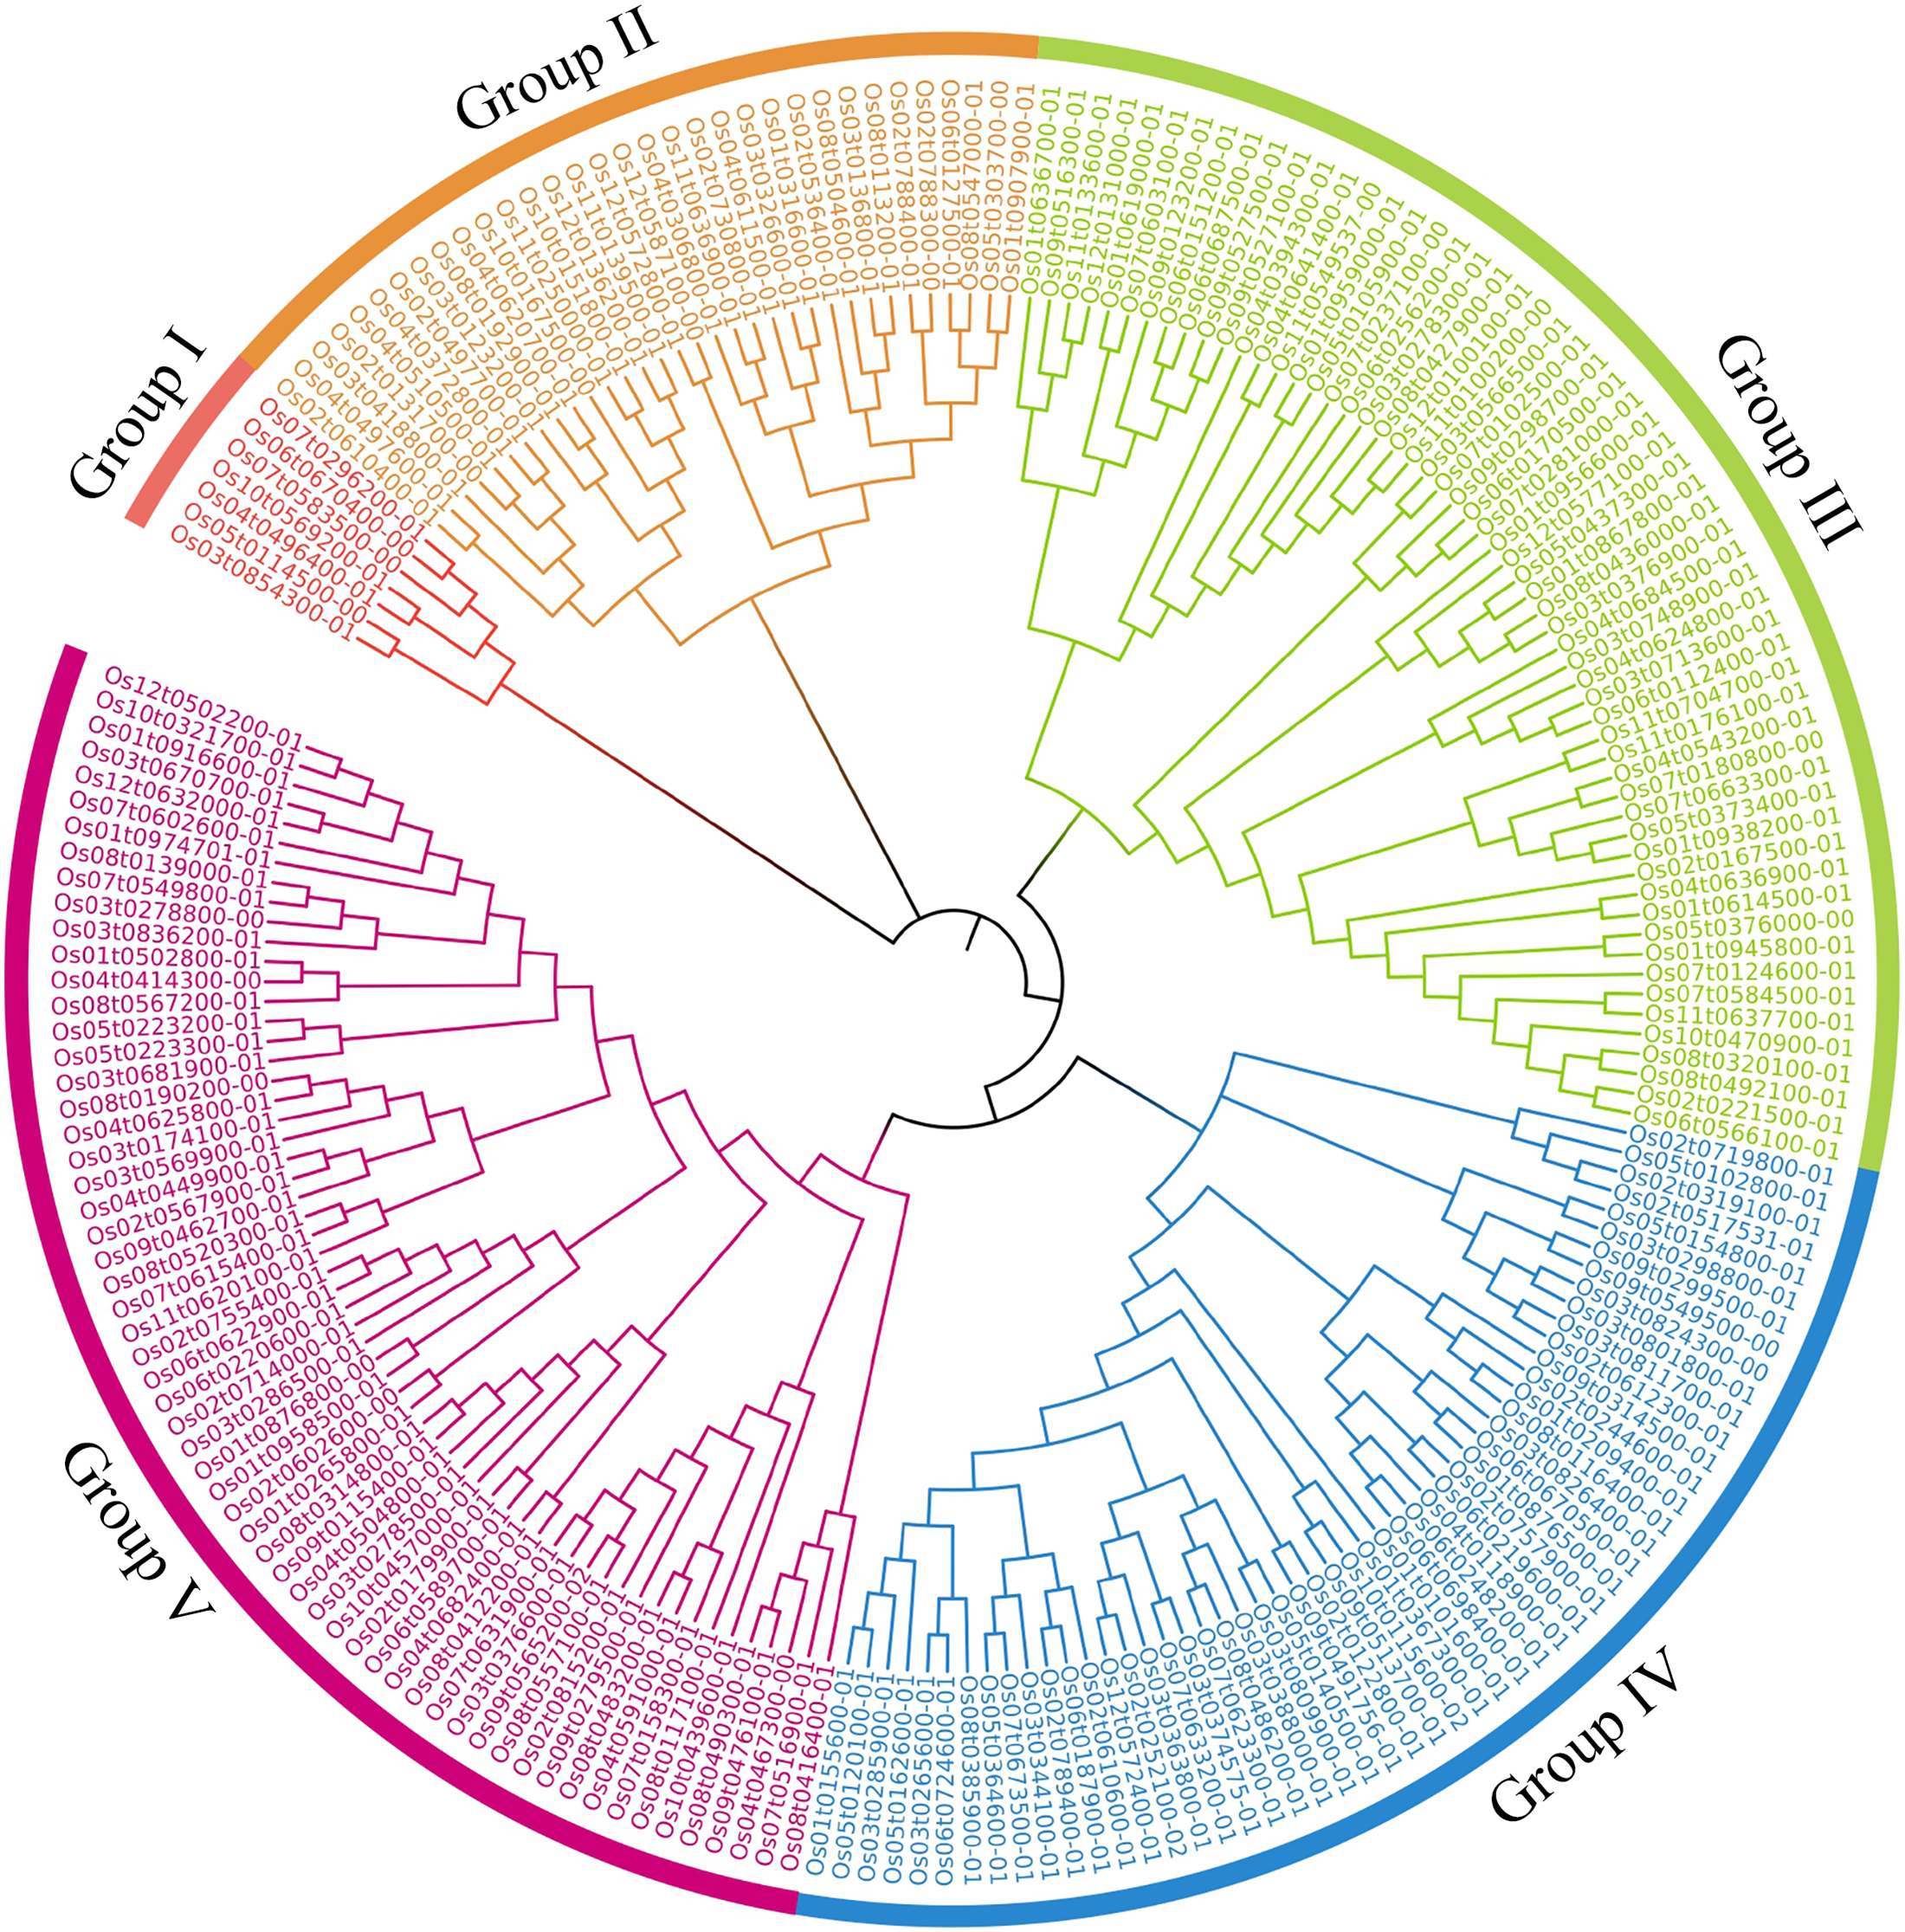
Motif analysis and gene structure analysis of the OsRRM1 gene family
Gene structures and conserved motifs are one of the conserved expression modes of gene families. To better understand the structure of the OsRRM1 gene, the exon intron structure of the OsRRM1 gene was analyzed using annotated information from the rice reference genome (Fig. S1). The results show that the number, type, and order of conserved motifs in the OsRRM1 gene family were different. The sequence length and gene structure were also very different. This may be the result of replication of these sequences. However, according to the cluster analysis, the conserved motifs and gene structures of each category had similar distributions, which proves that the classification results are reliable.
The MEME online prediction tool was used to identify the conserved motifs of rice OsRRM1 proteins. Multiple motifs existed in the 212 OsRRM1 protein sequences (Fig. S1), and the types and numbers of motifs were highly overlapping. In addition, gene families within the same subfamily in the evolutionary tree were composed similarly on the motif. The gene families of the same subfamily in the phylogenetic tree were similar in motif composition, reflecting the sharing or similarity of their functions.
Evolutionary analysis of the OsRRM1 gene family and collinearity analysis between rice and Arabidopsis
A phylogenetic tree was constructed by comparing 212 and 230 AtRRM1—a total of 442 members. According to the topological structure of the evolutionary tree, the RRM1 proteins of the two species can be divided into five groups (Figs. S2–S7). Most of the RRM1 protein members of rice and Arabidopsis do not cluster into their own clades. Each subfamily contains members of the RRM1 family of Arabidopsis and rice, and the members of each subfamily may have similar functions and domains. According to the phylogenetic relationship of the protein sequences, the function of the OsRRM1 protein can be predicted by the function of the plant RRM1 protein, the function of which is known.
To further explore the evolutionary relationships of the OsRRM1 gene family, collinearity analysis between rice and Arabidopsis was conducted. The results (Fig. 4) show that 20 pairs of RRM1 genes in the two species were collinear, while no collinearity was found on chromosomes 8, 9, 10, 11, and 12 of rice or chromosome 4 of Arabidopsis. The analysis suggests that 20 pairs of RRM1 genes may have similar functions in rice and Arabidopsis, and were conserved during evolution.
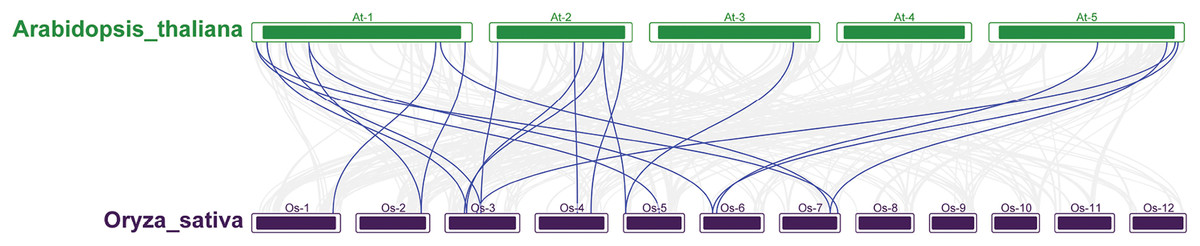
Figure 4: The synteny analysis RRM1 gene family in Arabidopsis and rice.
The segmental duplication gene pairs were linked by the lines between chromosomes.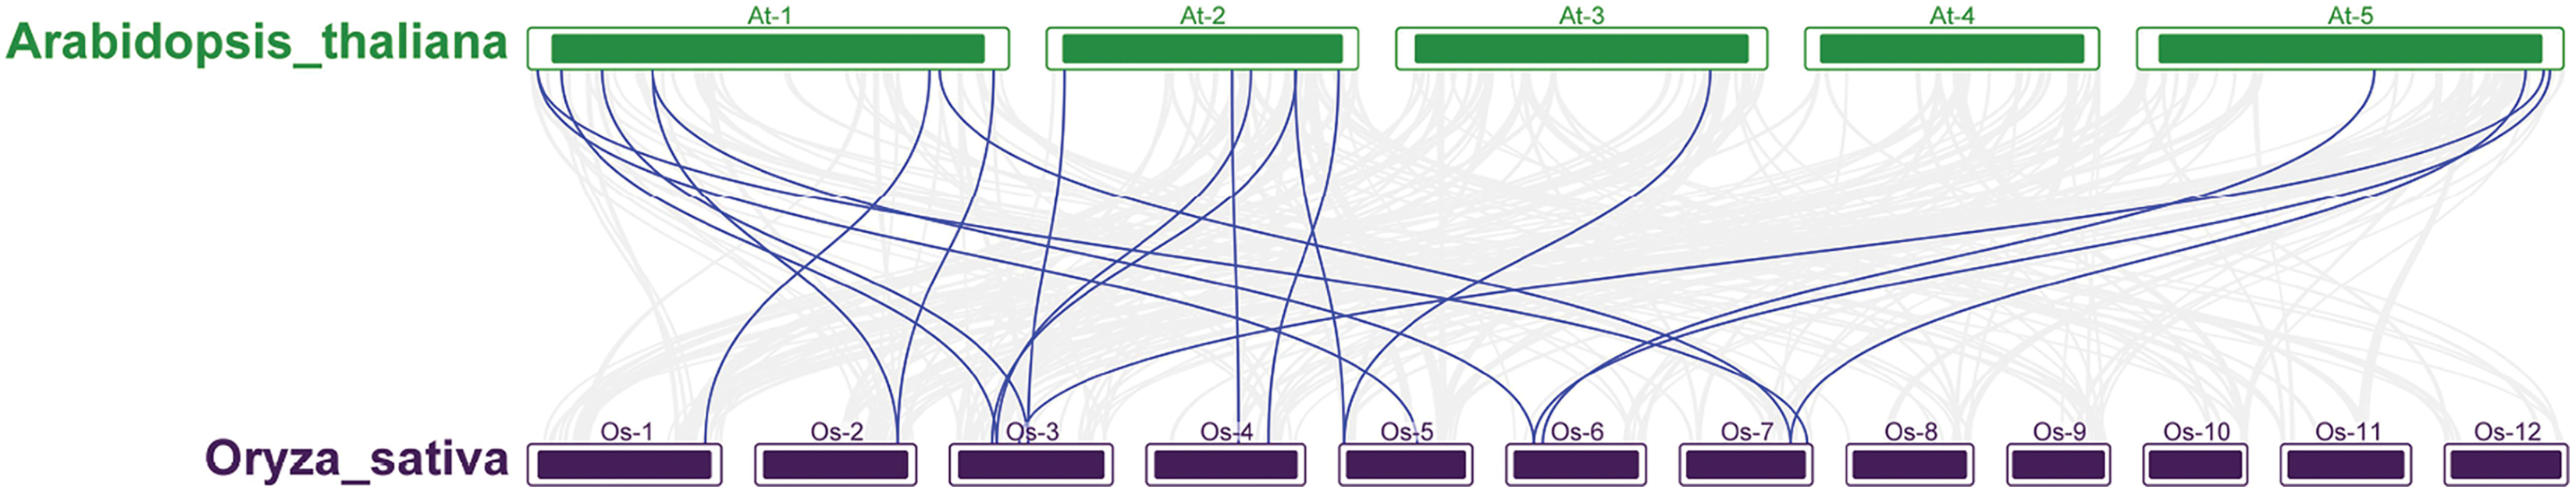
GO and KEGG analysis of the OsRRM1 gene family
GO annotation results (Fig. 5A) show that the OsRRM1 gene family plays an important role in the alternative mRNA splicing, pre-spliceosome, RNA splicing, U2-type spliceosomal complex, defense response, immune response, immune system process, innate immune response. KEGG analysis (Fig. 5B) showed that the OsRRM1 gene family plays an important role in spliceosome, RNA processing and transport. For example, RRM1-185 (Os09g0565200) enhances rice resistance. By regulating the stability of chloroplast mRNA, it is important for the mRNA stability of NAD (P) H dehydrogenase (NDH) complex (Bang et al., 2021). RRM1-212 (Os12g0632000) is related to mRNA splice and ribosome synthesis. Under heat shock conditions, it may be involved in regulating RNA transport from specific stress-related genes to the nucleus, maintaining RNA stability and protein translation, etc. Overdosage of RRM1-212 can improve its tolerance to high temperature stress (Sahi et al., 2007). RRM1-113 (Os06g0112400), named PigmR, promotes the accumulation of PIBP in the nucleus to activate immunity (Zhai et al., 2019). As a transcription factor, PIBP1 can directly bind to the promoters of defense genes OsWAK14 and OsPAL1 to activate their expression. When PIBP1 and Os06g02240 were knocked out, blast resistance was greatly reduced (Zhai et al., 2019). Overexpression of RRM1-208 (Os12g0572400) (OsSCL30-OE) decreased the resistance of rice to low temperature, drought and salt stress, and led to the accumulation of reactive oxygen species (Zhang et al., 2022). These results further confirm the reported function of the OsRRM1 gene.
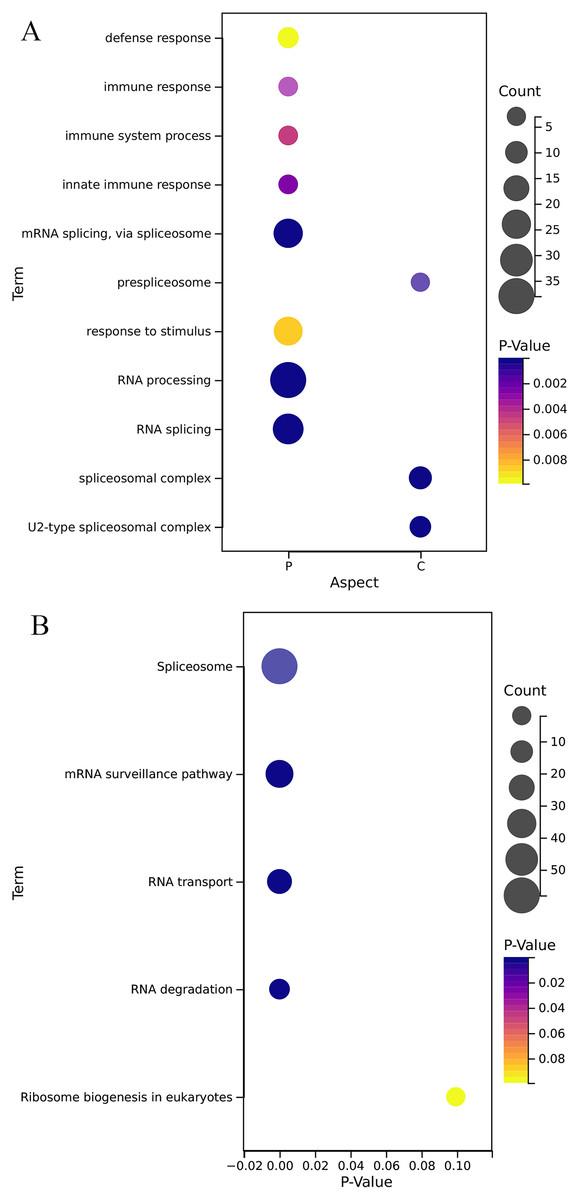
Figure 5: Gene function enrichment analysis.
(A) Analysis of GO of OsRRMl gene family; (B) KEGG annotation of OsRRMl gene family.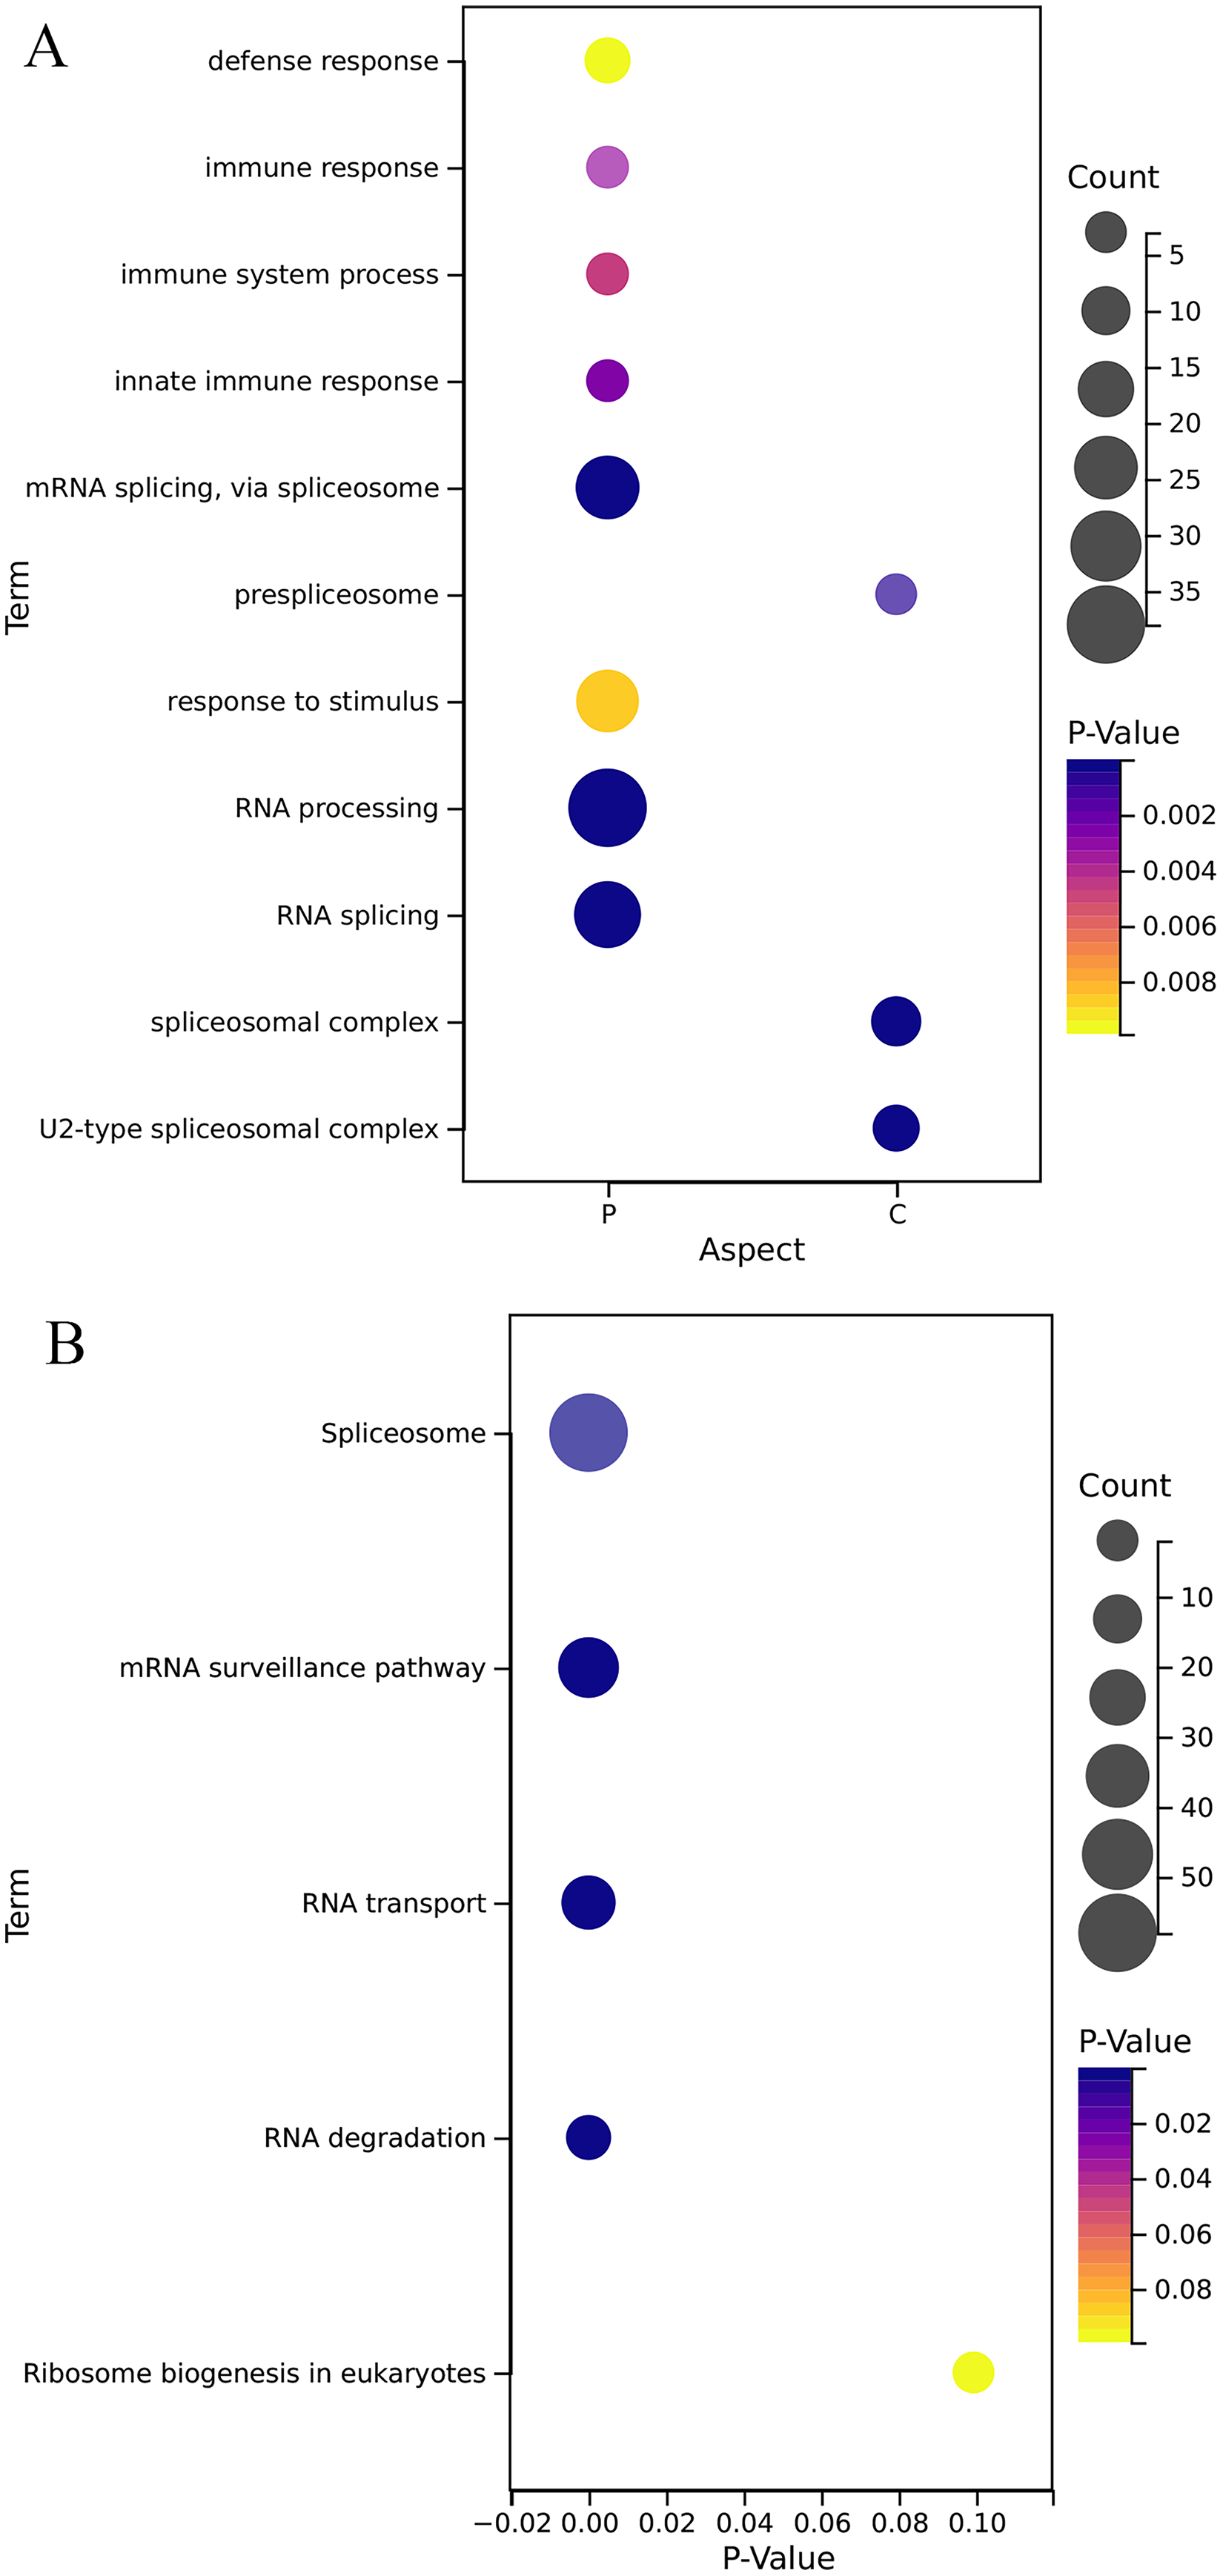
Characterization of presumptive cis-regulatory elements in the promoter region of the OsRRM1 gene
In plants’ response to stress, gene expression is closely related to cis-regulatory elements in the promoter region. Using the PlantCARE online analysis tool, the promoter of the rice OsRRM1 gene was predicted in the 2,000 bp region, and five stress-response regulatory elements were found, including the TGACG motif (involved in the JA response), CGTCA motif (involved in the MeJA response), ABRE motif (involved in abscisic acid stress), TCA element (involved in salicylic acid reactivity) and WUN motif (wound response element). In the OsRRM1 gene family, the element associated with the largest number of stress response elements was ABRE (Fig. S8), and ABA was synthesized mainly in response to blast stress. These results show that the stress-related response elements of the OsRRM1 gene were relatively intact, suggesting that it might be involved in regulation of the stress response in rice. However, the types and amounts of stress-related elements contained in each OsRRM1 gene promoter were different, which also indicates that each OsRRM1 had different responses to different stresses.
Expression pattern of the RRM1 gene family in rice after treatment with blast fungus
Using RNA-seq data, heat maps of the 212 OsRRM1 genes represented by log2-fold-change values were constructed at different time periods after infection with rice blast (Fig. 6). All OsRRM1 genes were expressed, and three major clusters of expression patterns were distinguished according to the expression specificity at different time periods after treatment. The RRM1 gene in two clusters showed an obvious up-regulation trend.
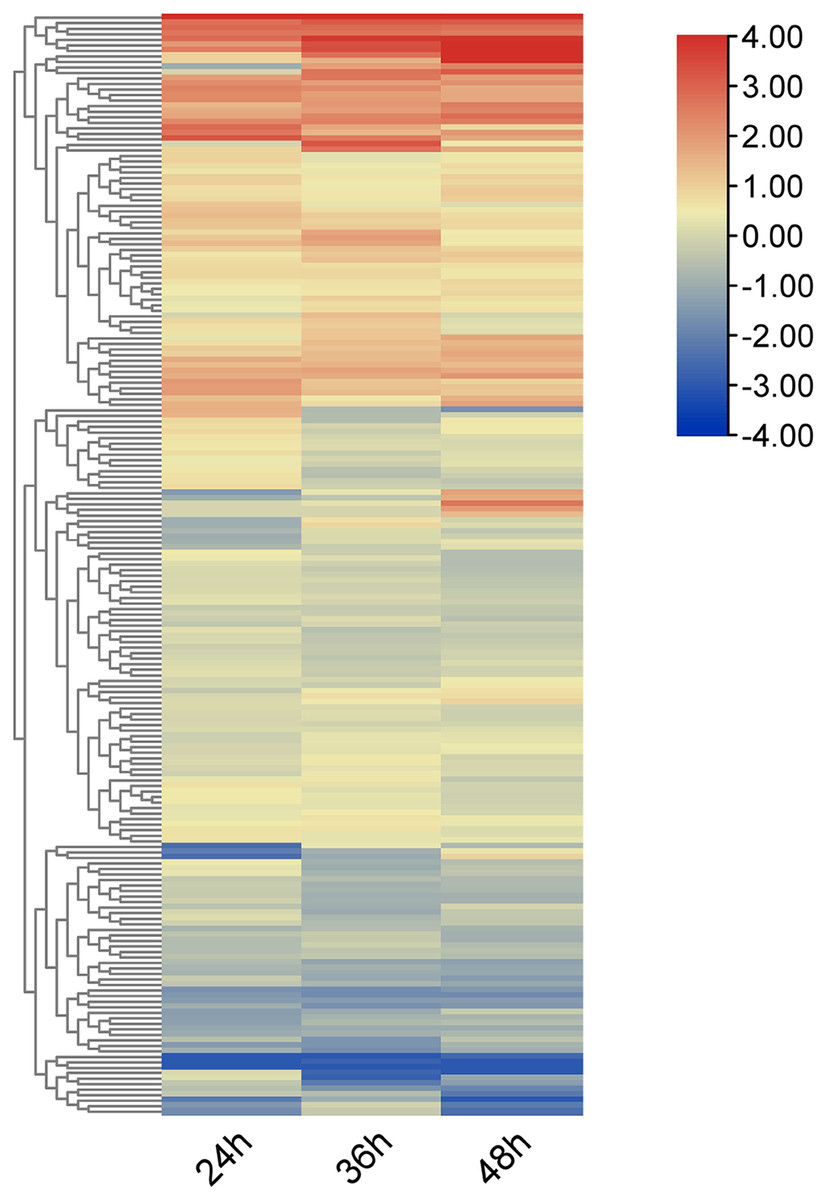
Figure 6: Expression heat map of OsRRM1 gene family treated with rice blast.
Expression level is expressed by color and intensity: dark red indicates highest expression level, dark blue indicates lowest expression level. Other colors represent intermediate levels of expression.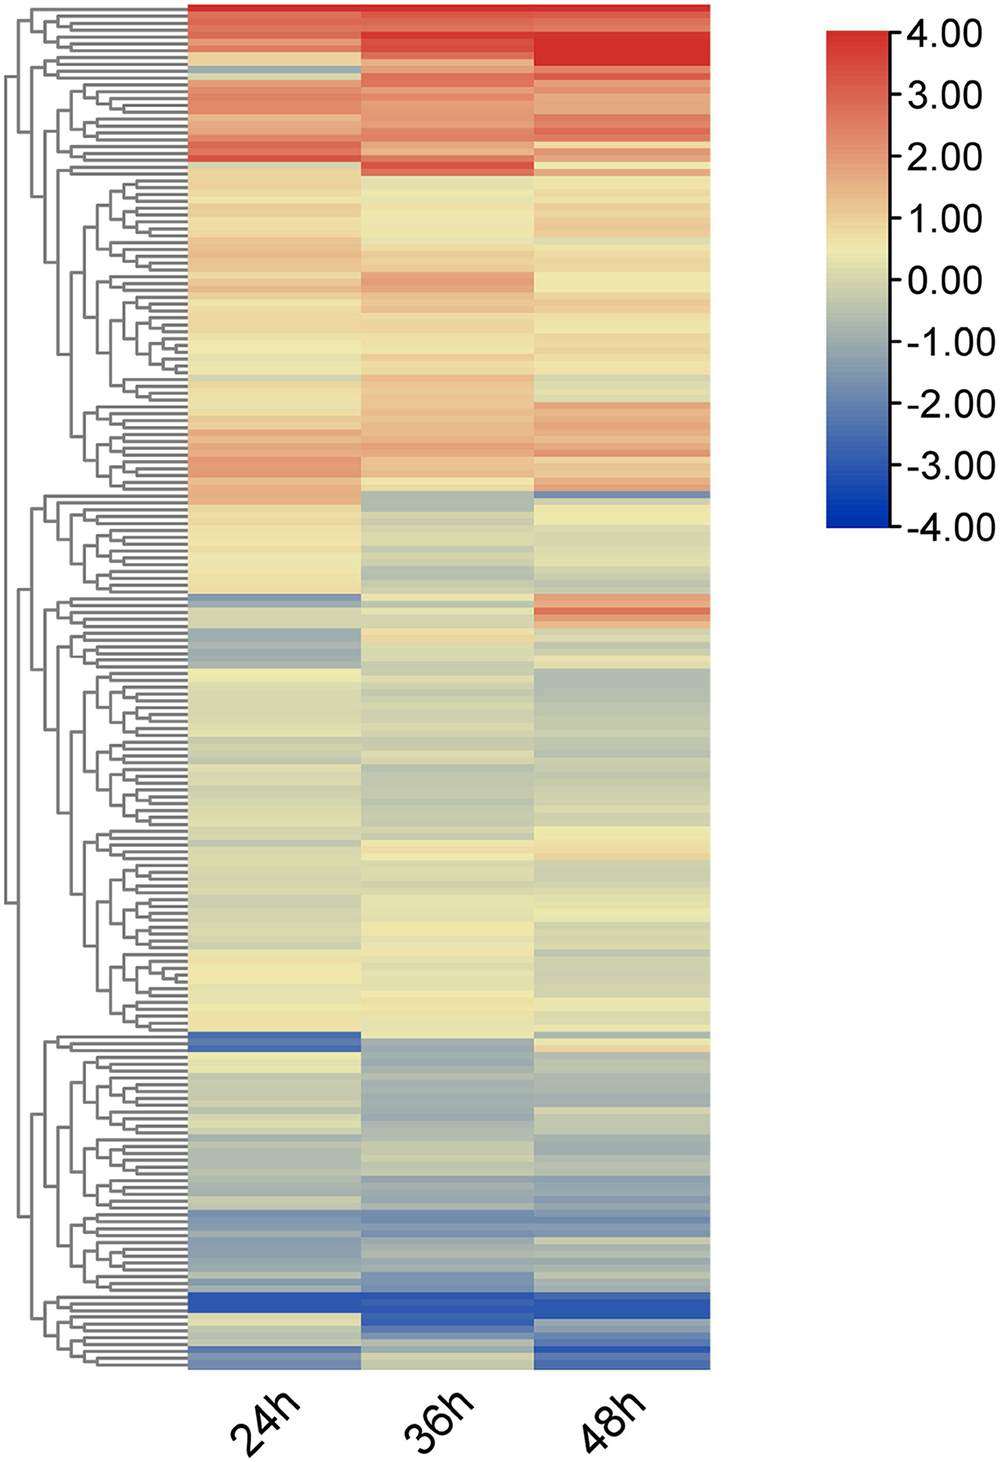
Expression analysis of the OsRRM1 gene in response to biological stress
To further investigate the expression changes of OsRRM1 gene under biological stress, we selected eight OsRRM1 genes from five phylogenetic groups by analyzing GO and KEGG results and expression heat maps. The transcription level of eight OsRRM1 genes was measured by qRT-PCR. Rice seedlings were cultured in an artificial growth chamber until the two-leaf stage (about 14 d), and qRT-PCR was performed at 0, 12, 24, 36 and 48 h after infection with P. oryzae. Disease spots were observed on rice leaves after 7 days (Fig. S9). As shown in the figure (Fig. 7), there was no significant difference in the expression level of RRM1-193 (group I) under blast stress. The expression level of RRM1-79 (group II) was slightly down-regulated under blast stress, but the difference was not obvious. There was no significant difference in the expression of RRM1-10 (group III) under blast stress. The expression level of RRM1-37 (group IV) decreased significantly under blast stress. However, the expression levels of RRM1-15, RRM1-61, RRM1-76 and RRM1-207 (group V) were significantly increased under blast stress. Therefore, it is speculated that the RRM1 gene in group V plays a role in rice blast response.
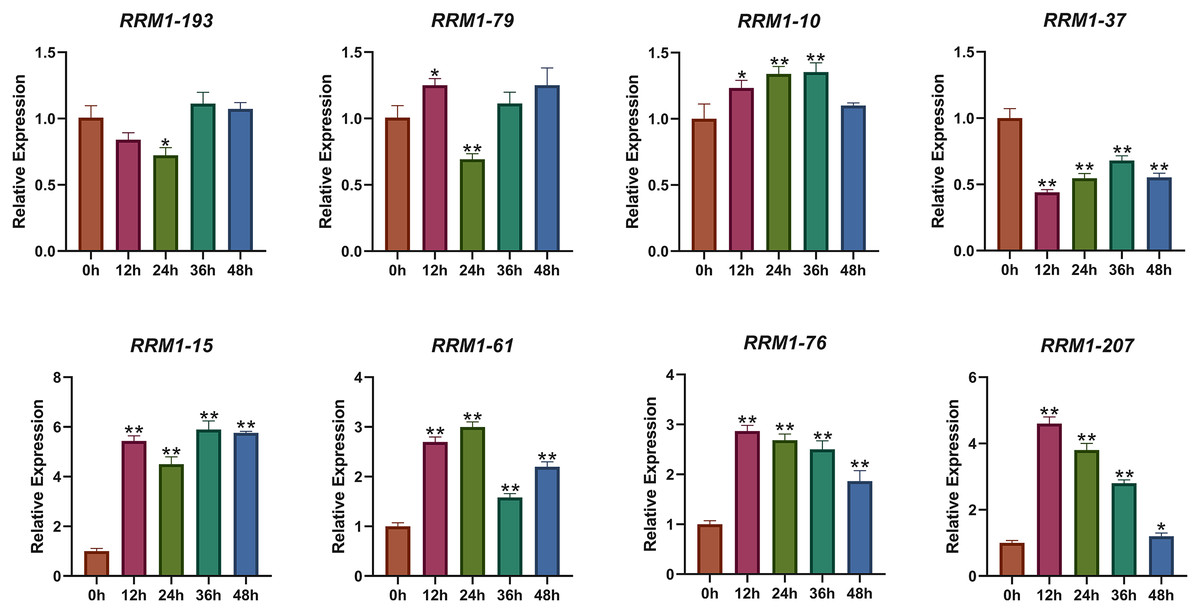
Figure 7: Expression levels of OsRRM1 gene at different time periods under rice blast stress.
OsRRM1 gene expression levels at different periods under rice blast stress. Four OsRRM1 candidate genes were identified by GO and KEGG results analysis combined with expression heat maps, and their relative expression levels at different periods were verified by qRT-PCR. The X-axis represents 12, 24, 26 and 48 h after rice blast treatment, respectively. Error bars were obtained from three measurements. Note: The “stars” above the column indicated significant differences (p < 0.05) and (p < 0.01) respectively between different time stages.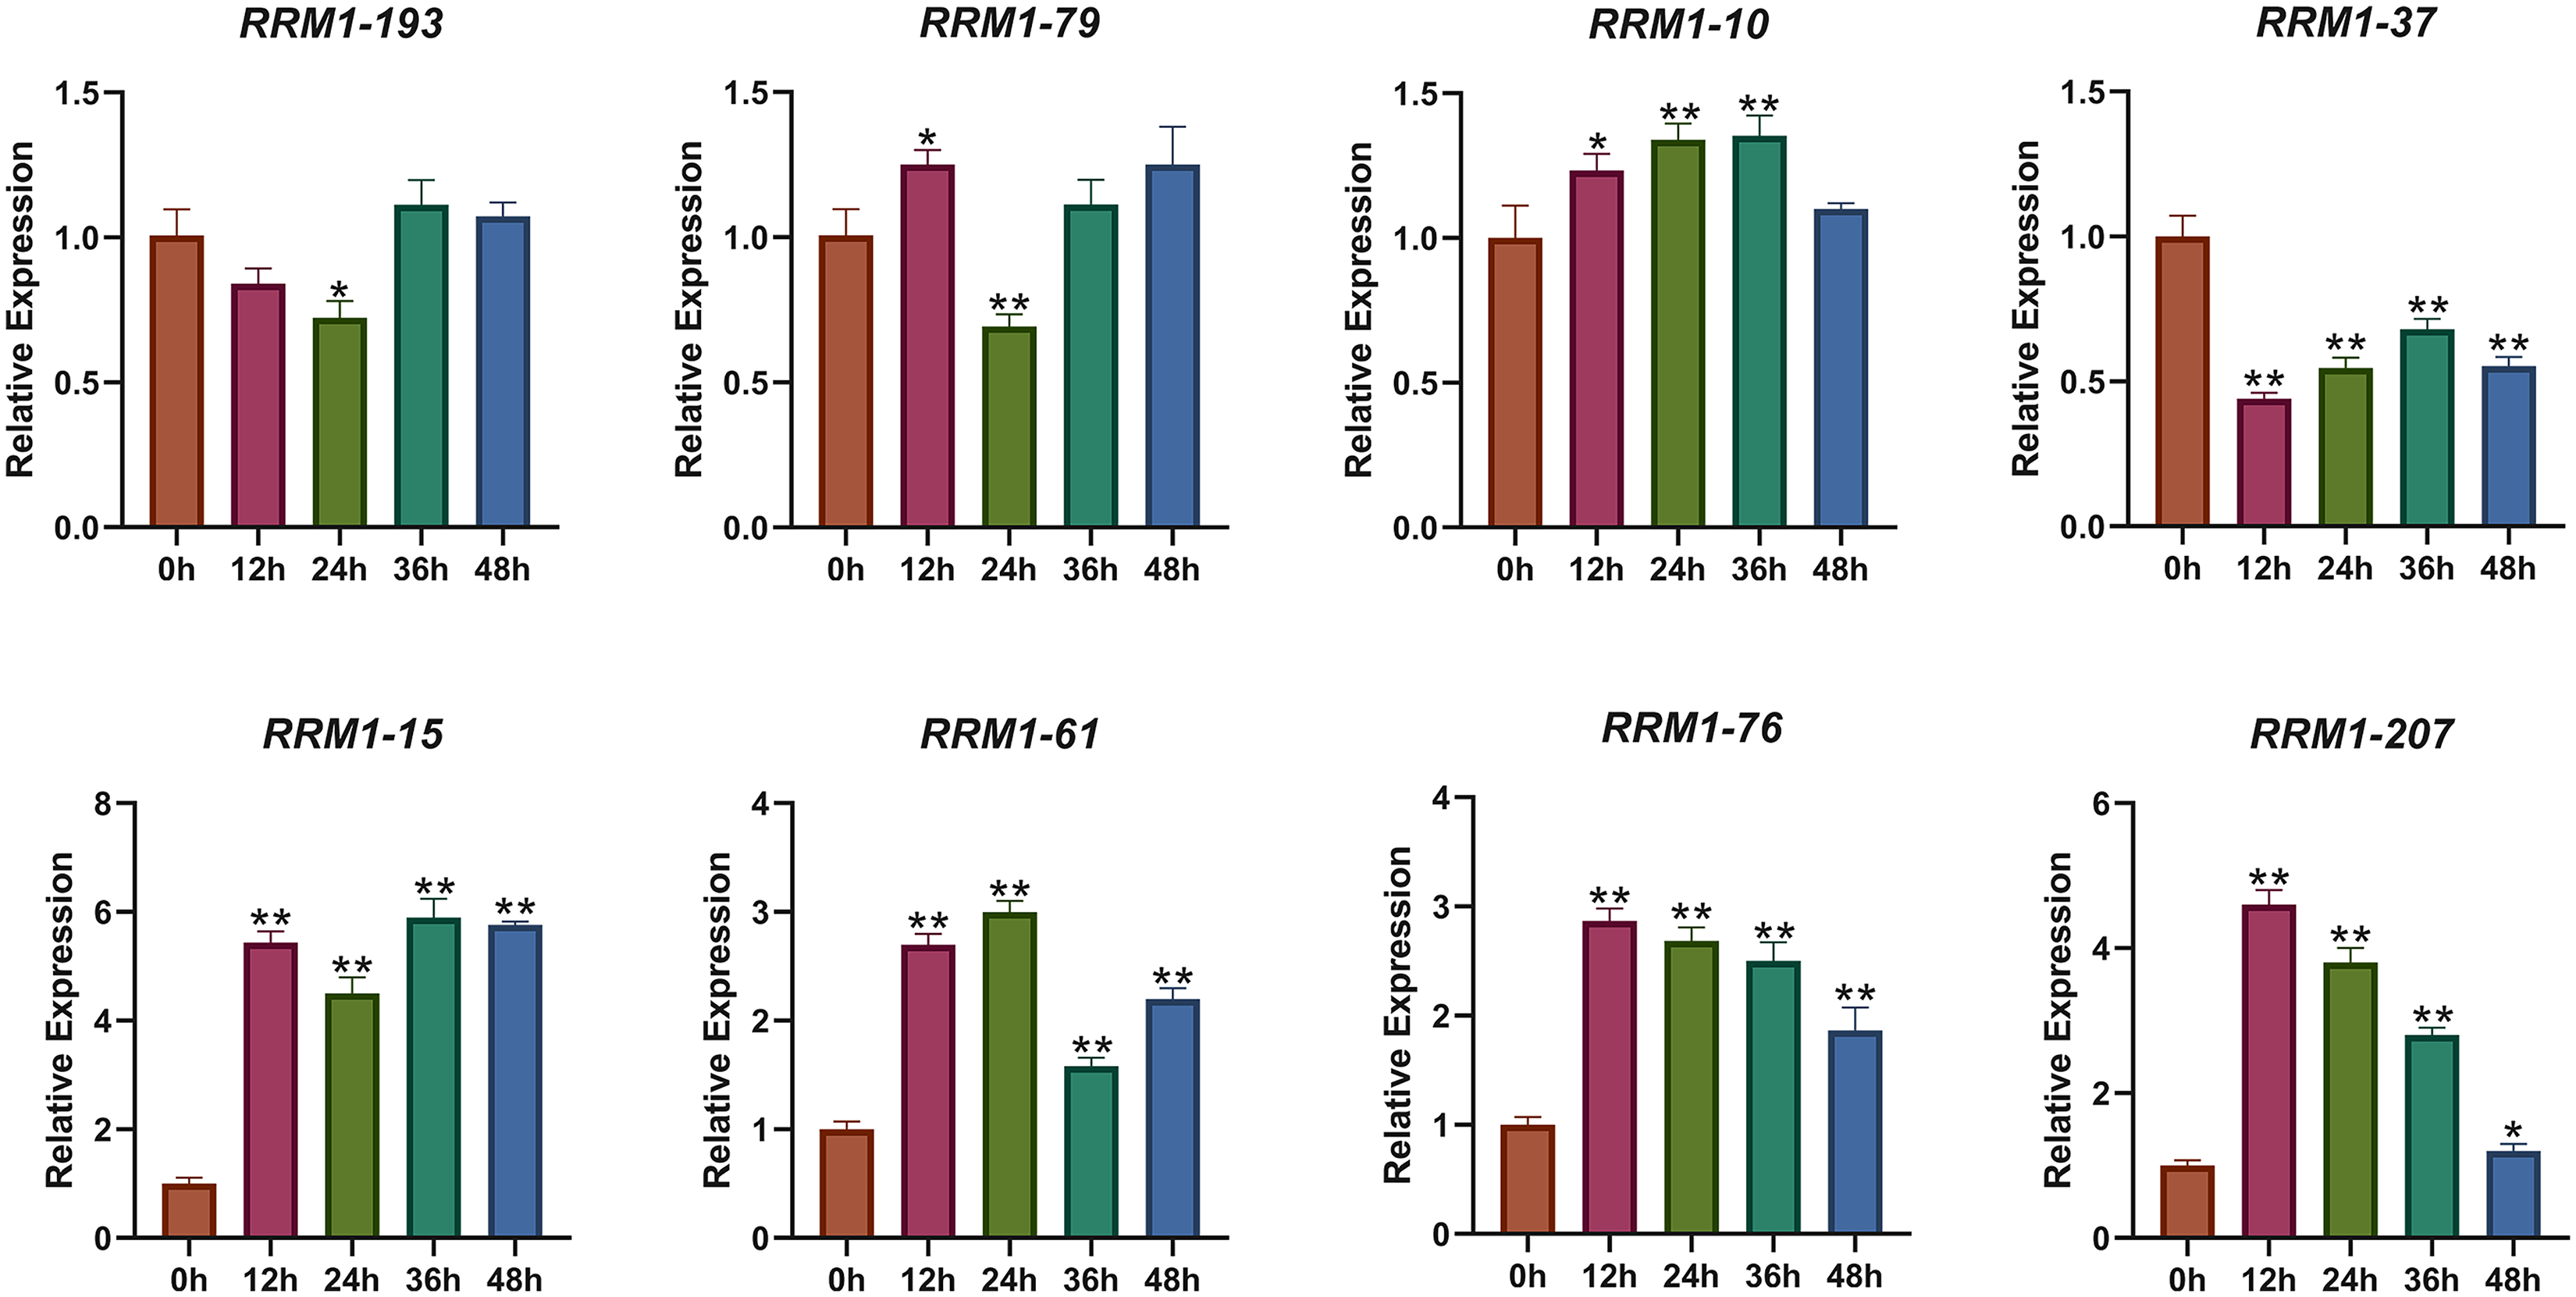
Subcellular analysis of OsRRM1 genes
To further explore the subcellular localization of the OsRRM1 protein, transient expression of OsRRM1-15 and OsRRM1-207 was performed in tobacco epidermal cells. Confocal laser microscopy revealed green fluorescent protein signals of OsRRM1-15 on the nucleus and cell membrane (Fig. 8) and of OsRRM1-207 on the nucleus, cell membrane, and cytoplasm, indicating the locations of these genes.
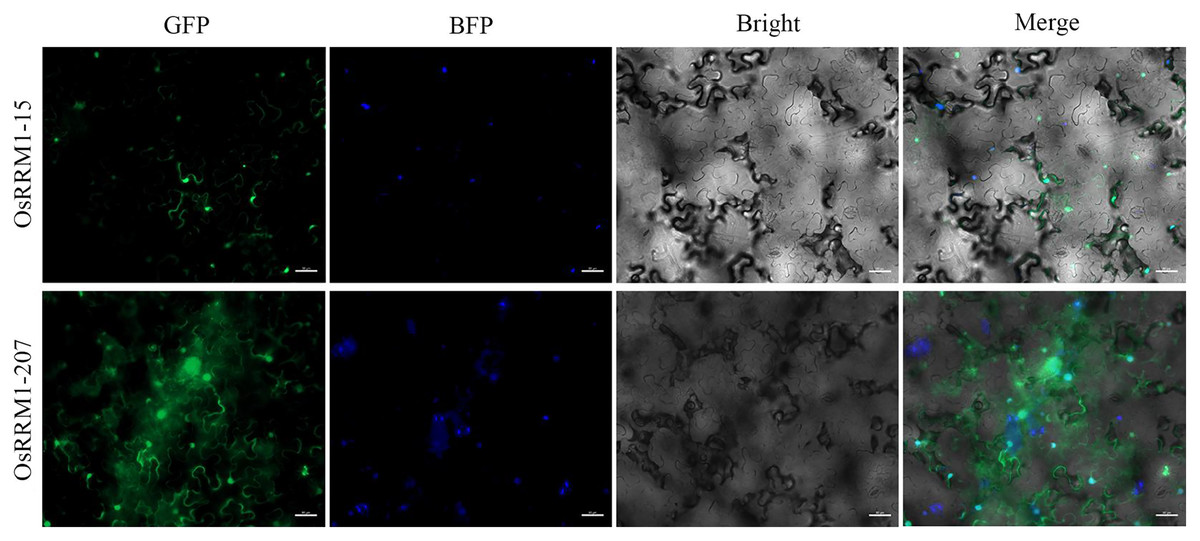
Figure 8: Subcellular localization of OsRRM1 protein.
Green fluorescent protein signals were detected on the nucleus and cell membrane of OsRRM1-15, while green fluorescent protein signals were detected on the nucleus, cell membrane and cytoplasm of OsRRM1-207. “GFP” stands for RRM1 gene green fluorescence. “BFP” stands for marker gene blue fluorescence. Bright field and superimposed are in the back.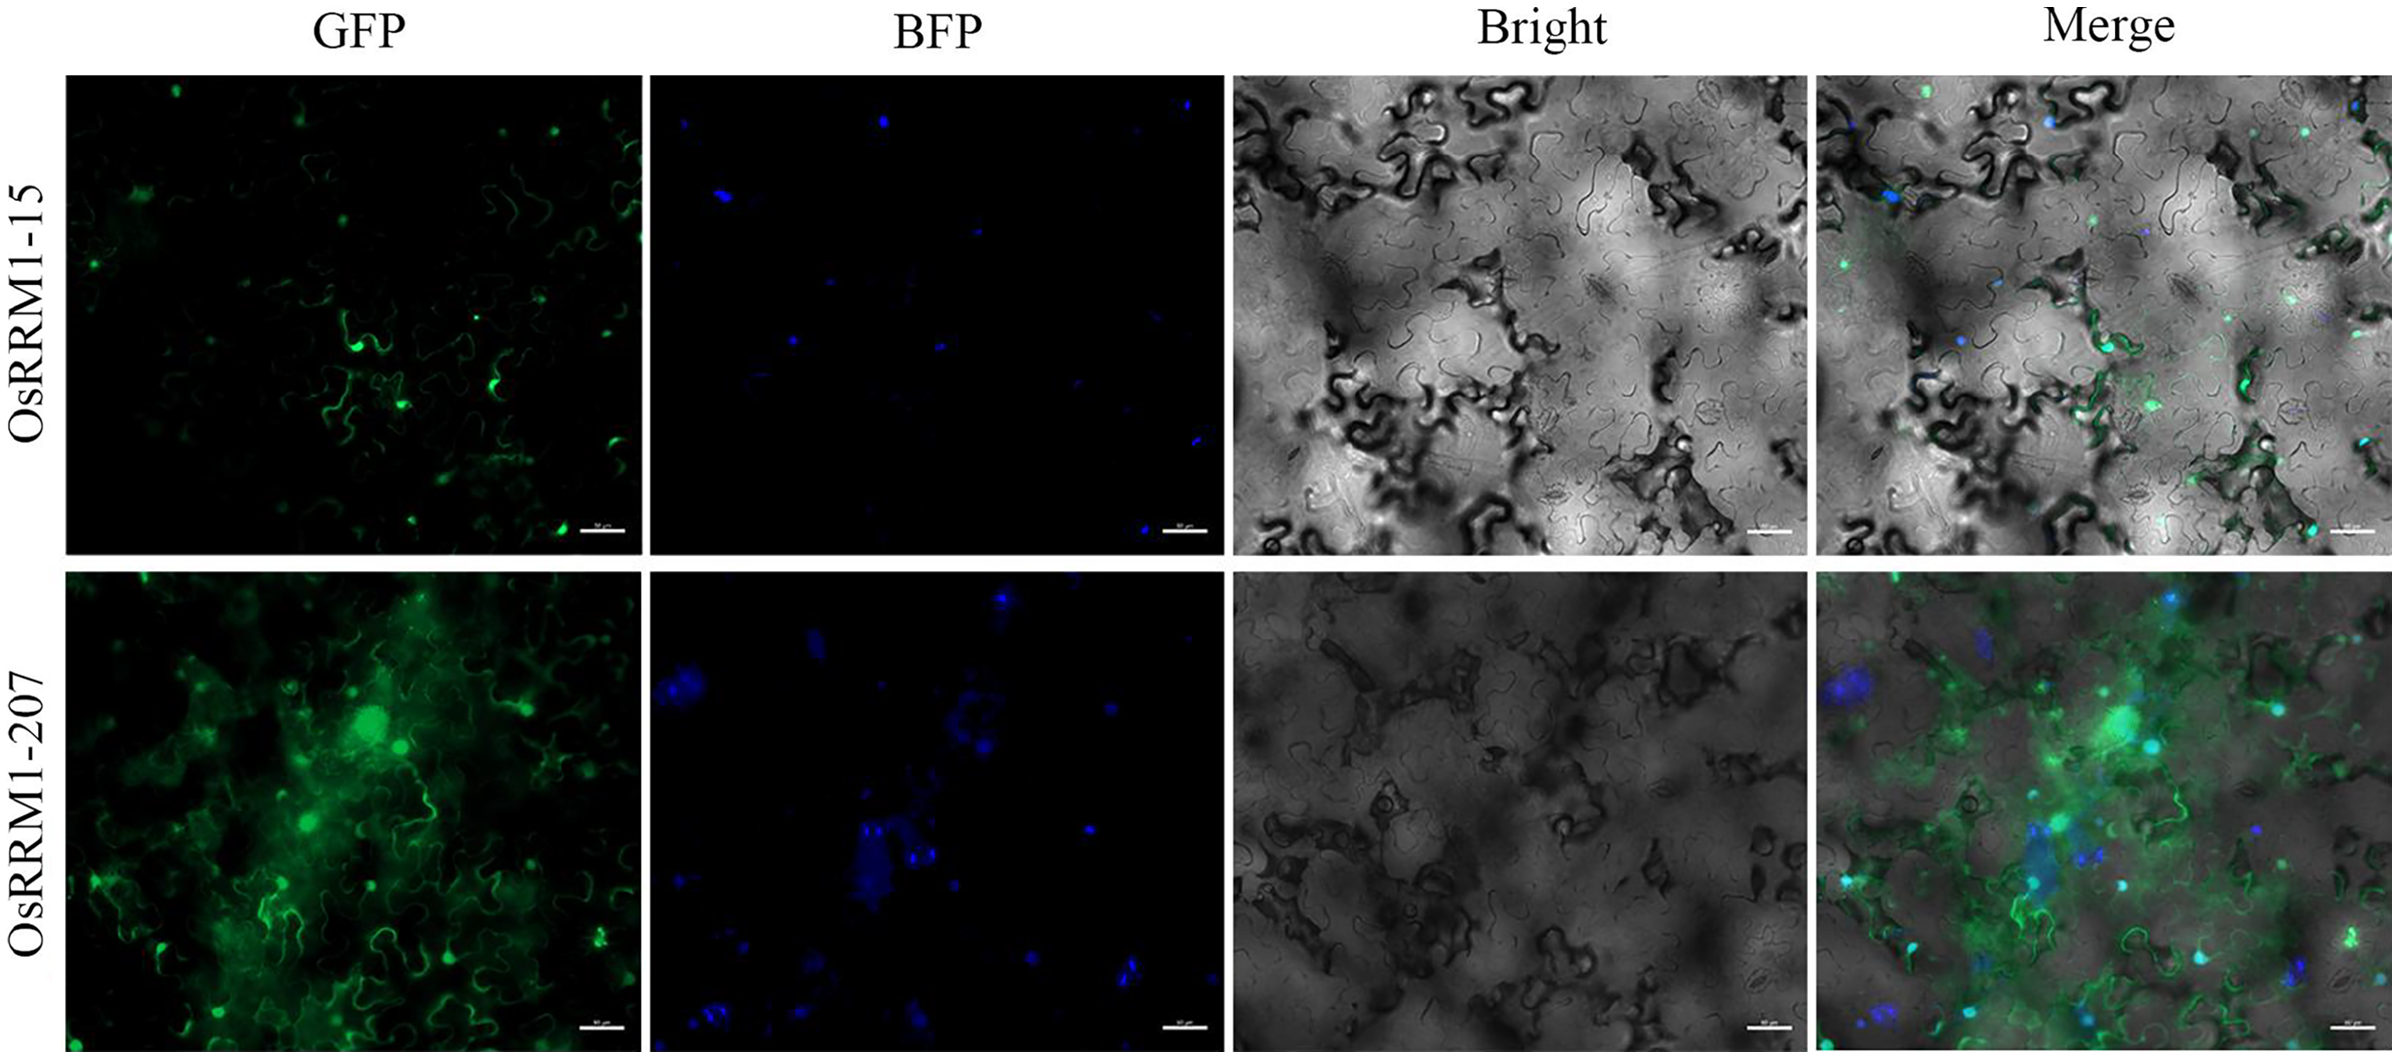
Discussion
This study used bioinformatics to identify and characterize the whole genome of the RRM1 gene family in rice. The family’s gene structure, physical and chemical properties, and domain and phylogenetic characteristics were also studied. In addition, RNA-seq was used to analyze the expression patterns of the RRM1 gene family at different times after rice blast fungus treatment. Expression changes in RRM1 family genes in response to stress were analyzed by quantitative real-time PCR. This study increases our understanding of the OsRRM1 gene family, providing (1) a basis for further investigation of its functions in response to rice blast infection and (2) a theoretical basis for more general study of its functions.
Bioinformatics has been used to identify the whole genome of the rice OsRRM1 gene family. The length of amino acids encoded by 212 OsRRM1 genes ranges from 53 to 1,160 aa. Cléry, Blatter & Allain (2008) indicate that the length of RRM is 90 amino acids, indicating that there are a large number of introns in the RRM1 gene in rice that are largely discarded during transcription and translation (Fig. 3). It is now clear that RRM1 is an important domain that needs to be further understood and that further biochemical and structural studies are needed to obtain a complete model of its role in cell (Cléry, Blatter & Allain, 2008). The RRM1 gene family is found in many species, with 230 of its genes having been identified in Arabidopsis and 212 in rice. Previous studies have shown that the complete Arabidopsis genome contains proteins with RRM and KH RNA binding domains, and encodes 196 RRM proteins (Lorković & Barta, 2002). The phylogenetic tree of the RRM1 protein in rice and Arabidopsis shows that there are multiple pairs of RRM1 homologous genes in these species, suggesting that these genes have similar amino acid sequences and may have similar functions. Since rice is a monocotyledonous plant and Arabidopsis is a dicotyledonous plant, it can be inferred that the time of RRM1 gene evolution may be earlier than the time of species differentiation. In addition, there were multiple gene clusters on some chromosomes, which may be attributed to tandem duplication, resulting in gene amplification, which is of great significance in evolution.
Subcellular localization prediction showed that the OsRRM1 gene was mainly located in the nucleus and less so in the extracellular matrix, mitochondria, chloroplast, cell membrane, and intracytoplasmic matrix, indicating that the above proteins mainly function in the nucleus. Subcellular localization of the two OsRRM1 proteins was performed. Confocal laser microscopy revealed GFP signals of OsRRM1-15 in the nucleus and cell membrane (Fig. 7), while signals of OsRRM1-207 were detected in the nucleus, cell membrane, and cytoplasm, indicating these genes’ locations (Fig. 8) and confirming the predicted results. According to subcellular localization prediction tools, 23 Arabidopsis RRM proteins are reported to be located in chloroplasts and 10 in mitochondria (Shi, Hanson & Bentolila, 2017). This may be because the main function of RRM genes is to participate in post-transcriptional regulation. Only fully transcribed transcripts can exit the nucleus, which also occurs to a small extent in mitochondria and chloroplasts. In chromosome localization, 212 RRM1 genes were found to be distributed on 12 chromosomes.
Among the 212 OsRRM1 gene sequences, CDS and introns had different numbers and large spans. However, analysis of 10 amino-acid-conserved motifs showed that the conserved sequences of OsRRM1 were mostly similar, especially in homologous sequences (Fig. S1). The results also show that OsRRM1 genes among the same group have a similar structure, but there are differences in intron length, which may be related to alternative splicing combined with KEGG junctions. By using MEME, multiple conserved motifs were found to exist in 212 OsRRM1 protein sequences, and the types and quantities of these motifs were highly overlapping (Fig. S1). The similarity in motif composition of OsRRM1 gene families in different subfamilies reflects their functional similarity.
Studies have shown that RRM1-69 can specifically interact with PigmR and other similar NLRs to trigger resistance to blast in rice. PigmR promotes the accumulation of PIBP1 in the nucleus and improves the resistance of rice to blast (Zhai et al., 2019). This gene is located in the third subgroup and is homologous to PIBP2, which has the function of regulating an antifungal innate immune response. PIBP2 is the RRM1-113 in this study, which is also located in the third subgroup and is very closely related (Fig. 3), which validates our results to a certain extent. In this study, RRM1-93 also had a strong homology relationship with PIBP1 and PIBP2 (Fig. 5).
As previous studies have shown, the RRM protein in plant organelles is involved in various RNA processes, regulating plant development (such as flowering) and plant stress responses (Shi, Hanson & Bentolila, 2017). Moreover, this gene family is highly enriched in alternative splicing and mRNA assembly processes (Zhan et al., 2015). Studies have shown that both PSRP2 and ORRM5 have RNA-binding activity, and it is speculated that RRM proteins increase their RNA-binding energy as RNA chaperones under stress conditions (Jin et al., 2007; Kim et al., 2007; Xu et al., 2013). They are also involved in plant development and stress responses, sometimes acting as proteins or RNA-binding proteins (Shi et al., 2016; Wang et al., 2016). In addition, several RRM proteins have been reported to be involved in plant development and stress response (Kim et al., 2007; Kwak, Kim & Kang, 2005; Lorković, 2009; Vermel et al., 2002). It can be inferred that this gene family may be involved in immunity in rice by regulating downstream gene alternative splicing. Interestingly, the cis-regulatory elements in the promoter region play an important role in plant responses to stress. We identified five stress response cis-regulatory elements (Fig. S8) in the upstream 2,000 bp of these OsRRM1 genes, including the TGACG motif (involved in JA response), CGTCA motif (involved in MeJA response), ABRE motif (involved in abscisic acid stress), TCA element (involved in salicylic acid reactivity), TGACG motif (involved in JA response), TCA motif (involved in salicylic acid reactivity), and WUN motif (wound response element). These results indicate that the stress-related response elements of the OsRRM1 gene are relatively complete, suggesting that members of the OsRRM1 gene family regulate stress to a certain extent. To further explore the expression changes of OsRRM1 gene in response to biological stress, qRT-PCR was performed on four OsRRM1 genes candidates via GO and KEGG analyses, and the results combined with an expression heat map to measure the transcription level of OsRRM1 gene. There were differences in the expression levels of four OsRRM1 genes under rice blast stress, all of which were up-regulated after treatment (Fig. 7), indicating that OsRRM1 plays a certain role in the response to rice blast, which also verifies the results of Wang et al. (2016).
Conclusions
RRM is one of the most abundant protein domains in eukaryotes and is an important player in the regulation of development, signaling, gene expression and cell differentiation. In this study, the RRM1 gene family and its role in rice blast resistance were investigated by bioinformatics. There are 212 OsRRM1 genes, distributed across 12 chromosomes, with conserved structure and similar patterns. The study also revealed cis-acting elements related to rice stress resistance. GO and KEGG analyses shows that four of these genes play a key role in plant immunity. Gene expression analysis shows that most OsRRM1 had tissue-specific expression that changed significantly after rice blast treatment. These results contribute to the in-depth understanding of the OsRRM1 gene family and provide a basis for further study of its role in resisting rice blast infection.
Supplemental Information
Specific primers for subcellular localization of OsRRM1 gene.
Note: F is the forward primers, R is the reverse primers.
Real-time quantitative fluorescent PCR (qRT-PCR) was used to evaluate the expression pattern of selected OsRRM1 gene after rice blast infection.
Above are the Cq values of the four candidate OsRRM1 genes and the internal reference gene actin. Samples were collected at 0, 12, 24, 36 and 48h after infection with Rice blast fungus (guy11). The table includes three experimental replicates and three biological replicates.
Phylogenetic relationship, gene structure and conserved motif analysis of OsRRM1 genes.
Phylogenetic tree of 212 OsRRM1 proteins (left). Distributions of conserved motifs in OsRRM1 genes (middle). Ten putative motifs are indicated in different colored boxes. Exon/intron organization of OsRRM1 genes (right). Yellow boxes represent exons and black lines with same length represent introns. The upstream/ downstream region of OsRRM1 genes are indicated in green boxes. The length of exons can be inferred by the scale at the bottom.
Evolutionary analysis of RRM1 gene family between rice and Arabidopsis.
Phylogenetic tree was constructed by comparing 212 OsRRM1 and 230 AtRRM1 a total of 442 members. According to the topological structure of the evolutionary tree, RRM1 proteins of the two species can be divided into five groups.
Evolutionary analysis of RRM1 gene family between rice and Arabidopsis in Group I.
According to the topological structure of the evolutionary tree, the RRM1 proteins of the two species can be divided into five classes. The red part is the first group, with a total of 18 RRM1 genes.
Evolutionary analysis of RRM1 gene family between rice and Arabidopsis in Group II.
According to the topological structure of the evolutionary tree, the RRM1 proteins of the two species can be divided into five classes. The orange part is the first group, with a total of 52 RRM1 genes.
Evolutionary analysis of RRM1 gene family between rice and Arabidopsis in Group II.
According to the topological structure of the evolutionary tree, the R RM1 proteins of the two species can be divided into five classes. The green part is the first group, with a total of 66 RRM1 genes.
Evolutionary analysis of RRM1 gene family between rice and Arabidopsis in Group IV.
According to the topological structure of the evolutionary tree, the RRM1 proteins of the two species can be divided into five classes. The blue part is the first group, with a total of 142 RRM1 genes.
Evolutionary analysis of RRM1 gene family between rice and Arabidopsis in Group V.
According to the topological structure of the evolutionary tree, the RRM1 proteins of the two species can be divided into five classes. The purple part is the first group, with a total of 164 RRM1 genes.
Predictive cis-regulatory elements in the promoter of OsRRM1 gene family.
Phylogenetic tree of 212 OsRRM1 proteins (left). Predictive cis-regulatory elements in OsRRM1 promoters (right). The five putative cis-regulating elements in the upper right corner are represented by different colored boxes. The length of the cis-regulating element can be inferred by the scale at the bottom.
Blast fungus was used to infect rice leaves.
(A) Rice leaves that grow normally for 21 days. (B) Rice leaves after seven days of blast fungus infection.
MIQE checklist.
To determine the relative expression levels of four candidate OsRRM1 genes (OSRRM1-15, OSRRM1-61, OSRRM1-76, OSRRM1-207) after 12, 24, 36 and 48h of rice blast infection. Therefore, Comprehensive analysis of gene expression using quantitative real-time PCR and adherence to MIQE guidelines.