
Functional variation among mesenchymal stem cells derived from different tissue sources
- Published
- Accepted
- Received
- Academic Editor
- Nuno Silva
- Subject Areas
- Bioinformatics, Cell Biology, Developmental Biology, Genetics, Molecular Biology
- Keywords
- Single-cell transcriptome profiling, Tissue source, Passage number, Hypoxic cultivation, Vascular regeneration, Reproductive system regeneration, Regenerative medicine, Mesenchymal stromal cells
- Copyright
- © 2024 Yi et al.
- Licence
- This is an open access article distributed under the terms of the Creative Commons Attribution License, which permits using, remixing, and building upon the work non-commercially, as long as it is properly attributed. For attribution, the original author(s), title, publication source (PeerJ) and either DOI or URL of the article must be cited.
- Cite this article
- 2024. Functional variation among mesenchymal stem cells derived from different tissue sources. PeerJ 12:e17616 https://doi.org/10.7717/peerj.17616
Abstract
Background
Mesenchymal stem cells (MSCs) are increasingly recognized for their regenerative potential. However, their clinical application is hindered by their inherent variability, which is influenced by various factors, such as the tissue source, culture conditions, and passage number.
Methods
MSCs were sourced from clinically relevant tissues, including adipose tissue-derived MSCs (ADMSCs, n = 2), chorionic villi-derived MSCs (CMMSCs, n = 2), amniotic membrane-derived MSCs (AMMSCs, n = 3), and umbilical cord-derived MSCs (UCMSCs, n = 3). Passages included the umbilical cord at P0 (UCMSCP0, n = 2), P3 (UCMSCP3, n = 2), and P5 (UCMSCP5, n = 2) as well as the umbilical cord at P5 cultured under low-oxygen conditions (UCMSCP5L, n = 2).
Results
We observed that MSCs from different tissue origins clustered into six distinct functional subpopulations, each with varying proportions. Notably, ADMSCs exhibited a higher proportion of subpopulations associated with vascular regeneration, suggesting that they are beneficial for applications in vascular regeneration. Additionally, CMMSCs had a high proportion of subpopulations associated with reproductive processes. UCMSCP5 and UCMSCP5L had higher proportions of subpopulations related to female reproductive function than those for earlier passages. Furthermore, UCMSCP5L, cultured under low-oxygen (hypoxic) conditions, had a high proportion of subpopulations associated with pro-angiogenic characteristics, with implications for optimizing vascular regeneration.
Conclusions
This study revealed variation in the distribution of MSC subpopulations among different tissue sources, passages, and culture conditions, including differences in functions related to vascular and reproductive system regeneration. These findings hold promise for personalized regenerative medicine and may lead to more effective clinical treatments across a spectrum of medical conditions.
Introduction
Mesenchymal stem cells (MSCs) have garnered significant attention in the field of regenerative medicine, primarily owing to their abundant sources, limited risk immune rejection, and substantial capacity for differentiation into multiple cell types. These characteristics are beneficial for diverse applications in tissue engineering and regenerative medicine (Saeedi, Halabian & Imani Fooladi, 2019).
However, the practical use of MSCs in clinical settings is impeded by their inherent functional variability. This diversity is influenced by several factors, including their tissue of origin, donor-specific attributes, and culture conditions (Lukomska et al., 2019). Effectively addressing this diversity is of paramount importance for the personalized and efficient utilization of MSCs in clinical practice. Achieving this goal necessitates the selective identification of MSC subpopulations based on their distinct functional profiles. Moreover, it is imperative to control environmental conditions to enhance MSC performance. This approach ensures consistent and efficacious outcomes in the field of regenerative medicine (Costa et al., 2021).
Single-cell RNA sequencing (scRNA-seq) is a powerful method for analyzing the heterogeneity of MSCs. Unlike traditional approaches, which generally concentrate on population averages, scRNA-seq delves deeply into gene expression and functional variation among individual cells, providing a comprehensive understanding of MSC complexity. This is vital for uncovering cellular development, functional regulation, disease mechanisms, and potential therapies (Pittenger et al., 2019). Several scRNA-seq studies have investigated MSCs derived from various tissues and under different culture conditions. These studies have revealed that MSCs obtained from distinct tissue sources (e.g., bone marrow, adipose tissue, umbilical cord, and placenta) exhibit differences in functional characteristics and differentiation potential (Barrett et al., 2019; Harman et al., 2020; Huang et al., 2019; Lin et al., 2023; Liu et al., 2019; Oguma et al., 2022; Sun et al., 2020; Zhang et al., 2022, 2021; Zhou et al., 2019). Additionally, culture conditions, such as the composition of the growth medium, oxygen levels, cell density, and duration of culture, have an impact on the functionality and features of MSCs. Optimizing these parameters can enhance MSC proliferation, differentiation potential, and stability (Antebi et al., 2018; Miura et al., 2023; Udani et al., 2023).
Furthermore, understanding the heterogeneity of MSCs is crucial for elucidating their specialized differentiation potential and particularly their roles in angiogenesis and reproductive system development. Accordingly, comprehensive studies of the impact of the tissue source and culture conditions on MSC functionality are expected to provide a basis for diverse therapeutic applications in regenerative medicine. MSCs have pro-angiogenic potential via paracrine signaling and angiogenic growth factors (Bronckaers et al., 2014; Liao et al., 2009; Maacha et al., 2020). However, these functions vary depending on the tissue source and culture conditions of MSCs; for example, bone marrow- and adipose tissue-derived MSCs show robust angiogenic effects (Liao et al., 2009; Mathew et al., 2020; Samakova et al., 2019). Despite these promising findings, systematic comparisons of the pro-angiogenic potential of MSCs from different origins and culture environments are insufficient. This gap highlights the need for further research to determine the specific impact of the tissue source and culture conditions on MSC-mediated vascular regeneration, providing a basis for tailored and effective strategies for regenerative medicine.
Recent studies have demonstrated the role of MSCs in enhancing germ cell development and treating reproductive system disorders (Rungsiwiwut, Virutamasen & Pruksananonda, 2021; Zhao et al., 2019). MSCs have the potential to differentiate into granulosa and spermatogenic cells, promoting germ cell development (Afsartala et al., 2016; Huang et al., 2010; Latifpour et al., 2014). They also secrete growth factors and extracellular vesicles, creating a supportive microenvironment, reducing inflammation, and exerting antioxidant effects in reproductive organs (Takehara et al., 2013). Additionally, MSCs exhibit immunomodulatory properties, thereby suppressing autoimmune responses in reproductive diseases (Chen et al., 2021; Rizano et al., 2023; Zohrabi et al., 2021). However, the mechanisms underlying effects of MSCs may vary depending on the tissue source, culture conditions, and recipient microenvironment. A systematic comparative investigation is needed to understand the variation in the MSC-induced promotion of germ cell maturation and reproductive system development with respect to sources and culture conditions.
In this study, single-cell RNA sequencing was employed to evaluate MSCs derived from four tissue sources in ten individuals and umbilical cord sources in four individuals across different passages and under hypoxic culture conditions. Through a clustering analysis, we identified six subpopulations and performed a systematic comparison of their functional features and proportions. Revealing variation in the relative frequencies of subpopulations related to reproductive function and vascular development across different tissue sources, passages, and low-oxygen-cultured umbilical cord sources. These insights not only shed light on the nuanced differences among subpopulations but also provide substantial evidence supporting the targeted application of MSCs. Furthermore, these findings are expected to contribute to the broader field of tissue engineering, opening new avenues for clinical treatments and advancements in regenerative medicine.
Materials and Methods
Study approval
Amniotic membrane, chorionic villi, and umbilical cord MSCs were sourced from full-term placentas of healthy women post-vaginal delivery or cesarean section, without any evident pregnancy complications or infections such as HIV, syphilis, or hepatitis B virus. ADMSCs were sourced from the lower abdominal fat of healthy individuals without obesity, chronic illnesses, or infections such as HIV, syphilis, or hepatitis B virus. Table S1 provides sample details. This study was approved by the ethics committee of China Human Genetic Resources Management Office ([2022] BC0102). All procedures involving human participants were performed in accordance with the ethical standards of the research committee. Informed consent was obtained from all participants.
Isolation and cultivation of human MSCs under normoxic and hypoxic conditions
Following tissue collection, the samples were promptly transported to the laboratory of Yuanpin Cell Biotechnology Co., Ltd. (Hunan, China) within 12 h for further processing, maintaining a continuous cold chain at 4 °C throughout the entire process.
For amniotic membrane MSCs, amniotic membrane tissue was separated from the placenta, cut into 1 × 1 cm2 pieces, and then digested with an equal volume of 0.4 U/mL Collagenase NB6 (N0002779; Nord Mark, Plymouth, MN, USA) for 1 h at 37 °C with agitation. After digestion, the sample was filtered through a 70 µm cell sieve, followed by centrifugation at 1,000 × g for 5 min. The supernatant was removed, and the cells were seeded in a T75 culture flask with MSC-T4 (Baso 04304P05) complete culture medium.
For umbilical cord MSCs, umbilical cord tissue was transferred to a 15 cm culture dish, both ends were trimmed with ophthalmic scissors to remove any remaining blood, and the sample was transferred to a new 15 cm culture dish. The umbilical cord was cut into 2–3 cm segments, longitudinally split along the vein, and the umbilical vein, artery, and Wharton’s jelly were removed. The tissue was placed in a 10 cm culture dish. Wharton’s jelly was cut into small tissue blocks (0.2–0.4 cm2) and transferred to T75 cell culture bottles, with approximately 40 tissue blocks per bottle. The culture bottles were transferred to a CO2 incubator and allowed to stand for 1 h to allow the tissue to adhere to the bottom. Then, 8 mL of MSC-T4 (Baso 04304P05) complete culture medium was slowly added to ensure that the tissue was completely immersed, and the culture was continued in a CO2 incubator.
For chorionic villus MSCs, placental tissue was transferred to a 10 cm culture dish, a portion of the tissue was trimmed into the dish using ophthalmic scissors, and the outer surface of the placenta was rinsed to remove blood. The rinsed placenta was then placed in a new 10 cm culture dish and immersed in 0.9% saline solution for 3 min. After soaking, the placenta was washed with 0.9% saline solution 2–3 times to separate the chorionic membrane layer from the amniotic membrane and maternal tissue blocks. The separated chorionic membrane was placed in a 10 cm culture dish, cut into 2 mm tissue blocks, and transferred to T75 cell culture bottles with approximately 50–60 tissue blocks per bottle, filling the bottle completely. The bottles were transferred to a CO2 incubator to allow the tissue to adhere to the bottom of the bottle for 1 h. Then, 8 mL of MSC-T4 (Baso 04304P05) complete culture medium was slowly added to ensure complete immersion of the tissue, and the culture was continued in a CO2 incubator.
For adipose-derived MSCs, adipose tissue was washed three times with phosphate-buffered saline (PBS) (A12858-01; Gibco, Waltham, MA, USA) containing 1% penicillin-streptomycin and then transferred to a 15 mL centrifuge tube, where it was minced using surgical scissors. Next, an equal volume of 0.2% type I collagenase (C1639; Sigma, St. Louis, MO, USA) was added, and the mixture was mixed thoroughly by pipetting. The mixture was placed on a 37 °C shaker at 80 rpm to ensure digestion. After digestion was complete, an equal volume of MSC-T4 (Baso 04304P05) complete culture medium was added to terminate digestion, and the mixture was pipetted to ensure uniform mixing. The mixture was then centrifuged at 1,200 rpm for 10 min, the supernatant was removed, and the cell pellet was resuspended in 1 mL of MSC-T4 (Baso 04304P05) complete culture medium. Cells were seeded at a density of 2.50 × 10⁴/cm2 in T25 culture flasks and incubated in a CO2 incubator.
MSCs from these four distinct tissue sources were cultured at 37 °C with 5% CO2 under normal atmospheric oxygen conditions (approximately 21% oxygen concentration) and hypoxic conditions (1% oxygen). The hypoxic condition was generated using a hypoxia chamber (catalog no. 4131F0; Thermo Fisher Scientific, Waltham, MA, USA) according to the manufacturer’s instructions. In brief, the cultures were placed in the chamber and flushed with a gas mixture (95% nitrogen and 5% carbon dioxide) for 3 min. After the flushing period, the chamber was sealed to prevent the ingress of external air. The final level of hypoxia was maintained at 1%, as specified by the manufacturer (Rosová et al., 2008).
Flow cytometry sorting and analysis
The MSCs derived from individual donors were subjected to trypsinization using TrypLE Express (Thermo Fisher Scientific, Waltham, MA, USA) and subsequently washed twice with PBS at either the first or second passage. Flow cytometry was employed to isolate and identify the MSCs based on specific surface markers (i.e., positive for CD90, CD44, CD73, and CD105 and negative for CD11b, CD19, CD34, CD45, and HLA-DR), as per the instructions outlined in the BD Stemflow™ Human MSC Analysis Kit. A minimum of 10,000 events were recorded and analyzed using a FACSVerse instrument (BD Bioscience, Franklin Lakes, NJ, USA).
Lineage differentiation in vitro
Stem cell chondrogenic differentiation was conducted in a 24-well plate, with cells labeled for identification and controls. Passage 5 (P5) stem cells (2.0 × 10⁵) were placed in the wells and cultured in a 37 °C, 5% CO2 incubator. Chondrogenic differentiation medium (A1007101; Gibco, Waltham, MA, USA), prepared by mixing 10% Chondrogenesis Supplement with 90% Chondrogenesis Differentiation Basal medium, was applied every 3 days after cells reached 60–70% confluence. To confirm chondrogenic differentiation, Alcian Blue (G2541; Solarbio, Beijing, China) staining was performed on days 14–21. After fixation with 4% PFA and washing, cells were stained with Alcian Blue and observed under a fluorescent microscope to evaluate aggregation.
Passage 5 (P5) MSCs were cultured in 24-well plates and adipogenic differentiation was induced (A1007001; Gibco, Waltham, MA, USA) when they reached 70–80% confluence. The culture medium was changed every 3 days. To confirm adipogenic differentiation, Oil Red O staining (G1260; Solarbio, Beijing, China) was performed on days 7–14. The procedure included fixation, isopropanol rinsing, and Oil Red O staining, followed by observation under a fluorescent microscope.
Passage 5 (P5) MSCs were cultured in 24-well plates and osteogenic differentiation (A1007201; Gibco, Waltham, MA, USA) was induced when they reached 60–70% confluence. The culture medium was changed every 3 days. To confirm osteogenic differentiation, 0.2% Xylene Red staining (G1452; Solarbio, Beijing, China) was performed on days 14–21. The procedure included fixation, rinsing, and Alizarin Red S staining, followed by observation under a fluorescent microscope.
Single-cell RNA sequencing
Ten samples from P5 MSCs were isolated and cultured from adipose, amniotic membrane, chorionic villus, and umbilical cord tissues. Single cells from these samples were captured using a GEXSCOPE microfluidic chip according to the instructions provided by NewGen Biotech Co. (Dallas, TX, USA). Barcoded Beads were collected from the microarray, and the mRNAs captured by the Barcoded Beads were reverse-transcribed into cDNA and amplified. cDNA was fragmented and ligated to build a library for sequencing using the Illumina platform.
ScRNA-Seq and quality control of samples were performed using the Singleron Matrix platform. The results were annotated according to GENCODE (Version 28, https://www.gencodegenes.org/) using Star (Version: 2.5.2b). Further correction was performed using the distribution-based error correction (DBEC) algorithm, and all putative cells were distinguished from background noise using a second-order derivative analysis.
To further resolve the profiles of UCMSCs, we obtained eight samples from P0, P3, and P5 UCMSCs and P5L UCMSCs. The analysis procedure, from sample processing to cDNA library construction, was completed based on the instructions provided with the 10× Genomics platform. The quality of the library was evaluated using the Agilent Bioanalyzer and a High-Sensitivity DNA Kit (Agilent Technologies, Santa Clara, CA, USA). Libraries were sequenced in 2 × 150 bp double-end mode using the Illumina NovaSeq 6000 system (Oe Biotech, Shanghai, China). Cell Ranger v2.1.0 (https://support.10xgenomics.com/single-cell-gene-expression/software/pipelines/latest/what-is-cell-ranger) was used for cell demultiplexing, human genome (version GRCh38) matching, barcode processing, and unique molecular identifier (UMI) counting. STAR aligner was used for read mapping against the human genome and transcriptome.
Single-cell data processing
A power analysis for scRNA-seq was performed using the R package RNASeqPower (version: 1.40.0, https://bioconductor.org/packages/RNASeqPower/) with parameters set to effect = 0.5 and alpha = 0.05. RNASeqPower was 0.9994395. The Seurat R package (Version 4.0.3, https://satijalab.org/seurat) was used for further analyses of single-cell RNA-seq data. After the initial evaluation of Cell Ranger metrics, the data from adipose, amniotic, chorionic, and umbilical cord P5 cells under normoxic conditions were analyzed. Cells with fewer than 1,100 genes, more than 5,000 genes, or more than 15% mitochondrial genes were excluded, and 77,151 cells were retained for downstream bioinformatics analyses. For the datasets for P0, P3, P5 MSCs and P5 MSCs under hypoxic conditions, cells with fewer than 2,000 genes, more than 7,000 genes, or more than 15% mitochondrial genes were excluded, leaving 61,756 cells for downstream bioinformatics analyses. The sequencing reads for each gene were normalized to the total UMI in each cell to obtain the normalized UMI values via the “NormalizeData” function. In other words, the UMI for each gene was divided by the total UMI for the cell, multiplied by the median total UMI, and finally converted to the natural logarithmic form. The “ScaleData” function was used to scale and center the expression levels in the dataset for dimensionality reduction.
PCA downscaling and clustering analysis
To avoid batch effects between samples and experiments, the first 2,000 highly variable genes were evaluated using a canonical correlation analysis (CCA) implemented in Seurat. The aligned vectors were then used for downstream downscaling and clustering analyses. Subsequently, a principal component analysis (PCA) was performed using the “RunPCA” function. Since the cell cycle has a strong influence on properties of MSCs, the cell cycle score for each cell based on specific genes associated with the G2M and S phases was evaluated using the “CellCycleScoring” function, followed by the elimination of cell cycle effect using the “SCTransform” function. Then, the data were downscaled using the “RunUMAP” function and visualized using Uniform Manifold Approximation and Projection (UMAP). For P5 MSCs derived from adipose, amniotic, chorionic, and umbilical cord tissues, cell clustering was performed using the “FindClusters” function with a resolution of 0.8, and the first nine main components were used to define cell identity. For P0, P3, P5, and P5L generation UCMSCs, cell clustering was performed using the “FindClusters” function at a resolution of 0.4, and the first nine principal components were used to define cell identity. The Wilcoxon rank sum test was performed using the “FindAllMarkers” function to determine the marker genes for each cluster, and only genes with |avg_log2FC| > 1, p_val < 0.05, and min.pct > 0.1 were considered markers.
GO enrichment analyses
Gene Ontology (GO) analyses of tagged genes were performed using Metascape (Version 3.5, http://metascape.org/) and visualized using the R package ggplot2 (Version 3.3.5, https://github.com/tidyverse/ggplot2).
Monocle 3 construction for a pseudo-time-series analysis
The pseudo-time-series analysis R package Monocle3 (Version 1.0.0, https://cole-trapnell-lab.github.io/monocle3/) was used to reconstruct the developmental trajectories of UCMSCs. Based on the routine process, the developmental start and end positions were selected using the “choose_graph_segments” function in combination with the timing diagram. Then, the “graph_test” function was used to identify genes associated with the development of MSCs. The “find_gene_modules” function was used to assign genes to modules, and the expression levels of the genes in these modules were evaluated. The “pheatmap” package was used to create a heat map of gene expression.
Results
Identifying tissue-specific MSC subpopulations and expression profiles via scRNA-seq
MSC isolation methods and culture conditions were validated through the flow cytometry-based detection of surface markers as well as multilineage differentiation under in vitro induction conditions (Figs. S1–S4). To establish a comprehensive single-cell transcriptome atlas of human MSCs, we obtained MSCs at passage five from various tissue types from 10 healthy donors (Table S1), including adipose (two donors), chorionic villi (two donors), amniotic membrane (three donors), and umbilical cords (three donors). Subsequently, we performed scRNA-seq. After stringent quality control to eliminate low-quality cells with high mitochondrial gene signatures and doublets, our dataset comprised 77,151 cells. Our analysis, utilizing UMAP for dimensionality reduction, unveiled six cell clusters (Fig. 1A). This diversity of MSC subpopulations exhibited a tissue-dependent pattern, underscoring substantial transcriptomic heterogeneity among MSCs from distinct tissues (Figs. 1B and 1C). We observed differences in the proportions of subpopulation among MSCs derived from four different tissue sources (Fig. 2A). Additionally, we found that the differences in relatively subpopulation frequencies among different samples were relatively small, indicating that MSC samples from the same tissue source exhibited a degree of consistency in subpopulation distributions. However, AMMSC3 differed from AMMSC1 and AMMSC2. This observation suggests that there may be substantial differences in the number and composition of subpopulations of MSCs among different tissue sources, which is crucial for understanding the diversity and potential applications of MSCs. Furthermore, for MSCs from the same tissue source, subpopulation sizes and proportions were relatively consistent; however, there may still be variation among samples. To quantitatively support our observations, we performed a Chi-squared goodness of fit test to compare the subpopulation distributions among different groups. The results are presented in the Table S2, which includes statistical comparisons of the proportions across different MSC samples. The Chi-squared test results showed significant differences in the proportions of subpopulations across different tissue sources and samples. For example, the AMMSC3 sample shows significant differences in subpopulation proportions compared to AMMSC1 and AMMSC2, confirming our earlier visual observations. These differences could be caused by various factors, including individual variation, collection methods, and culture conditions, which will require further investigation in future studies. By applying the SCT method to remove cell cycle effects and conducting a PCA, we observed that the cell cycle phases were evenly distributed among cells from four different sources, and the samples also exhibited a uniform distribution (Figs. 1D and 1E). Furthermore, we did not detect a significant difference in cell cycle distribution among cells from different tissue sources. However, a noticeable difference in the cell cycle distribution existed among different subpopulations (Figs. 2C and 2D). Although we divided MSCs from four different tissue sources into six subpopulations, apart from the C5 subpopulation (which exhibited the upregulation of MEST, CDCA8, and KIF11), there were no significantly differentially expressed marker genes among subpopulations (Fig. 1F). This suggests that the subpopulations share similarities in functions or features. This similarity might reflect key shared biological characteristics. Nevertheless, in-depth functional analyses and feature descriptions are needed to gain a more comprehensive understanding of the biological roles and functions of each subpopulation.
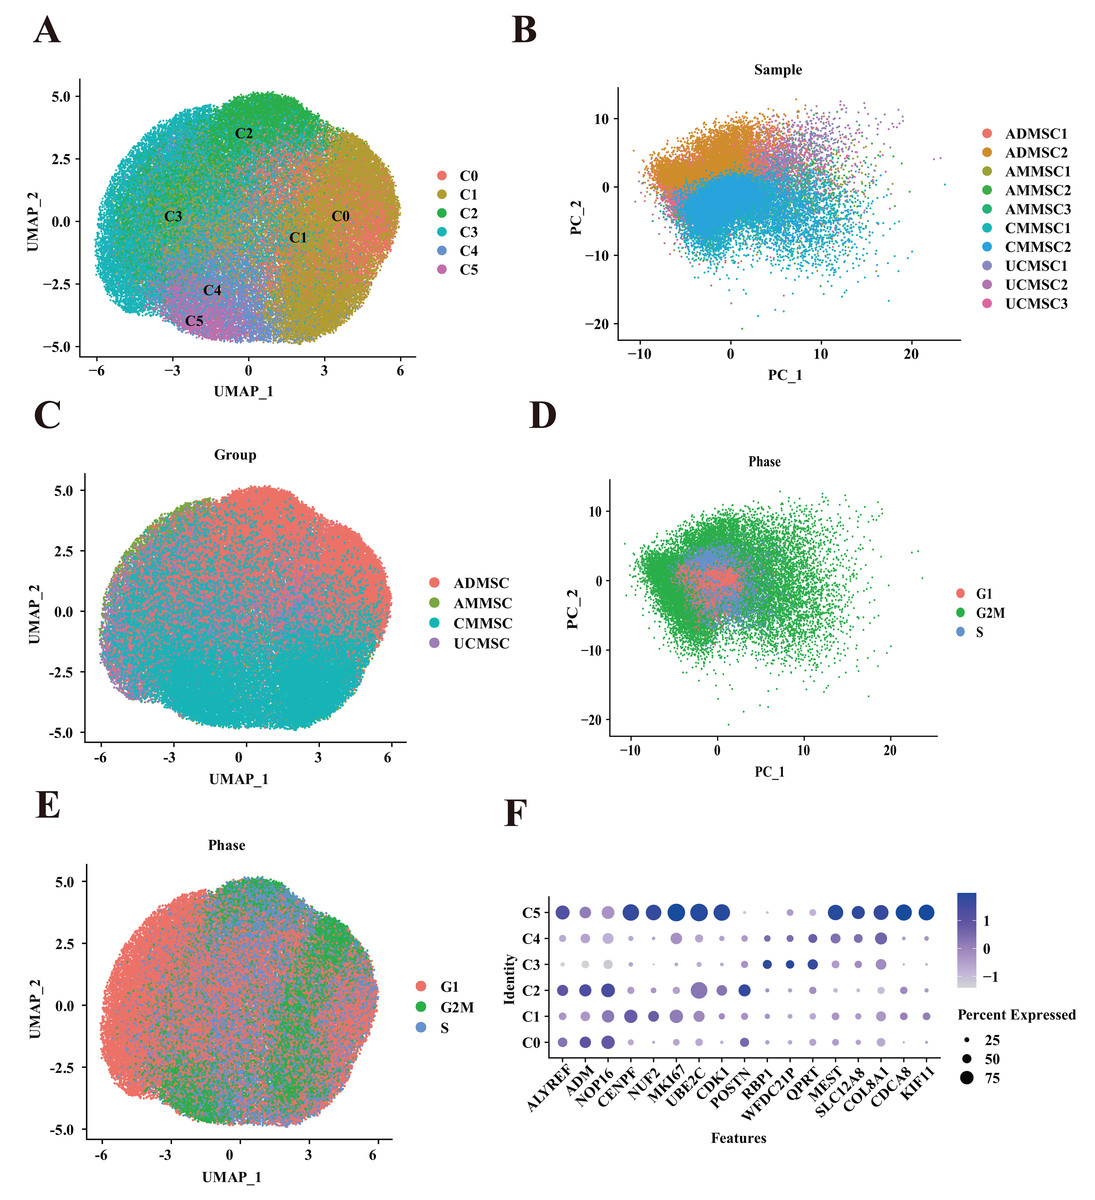
Figure 1: Mapping of MSCs from different tissue sources.
(A) Unbiased clustering using UMAP hierarchical clustering maps categorized ADMSCs, AMMSCs, UCMSCs, and CMMSCs into six subgroups. (B) Principal component analysis, highlighting differences among samples from various sources with low batch effects within similar samples. (C) UMAP plots representing ADMSCs, AMMSCs, UCMSCs, and CMMSCs. (D) UMAP plots indicating cell cycle phases G1, G2M, and S. (E) Cell cycle PCA clustering. (F) Expression of marker genes for each subpopulation.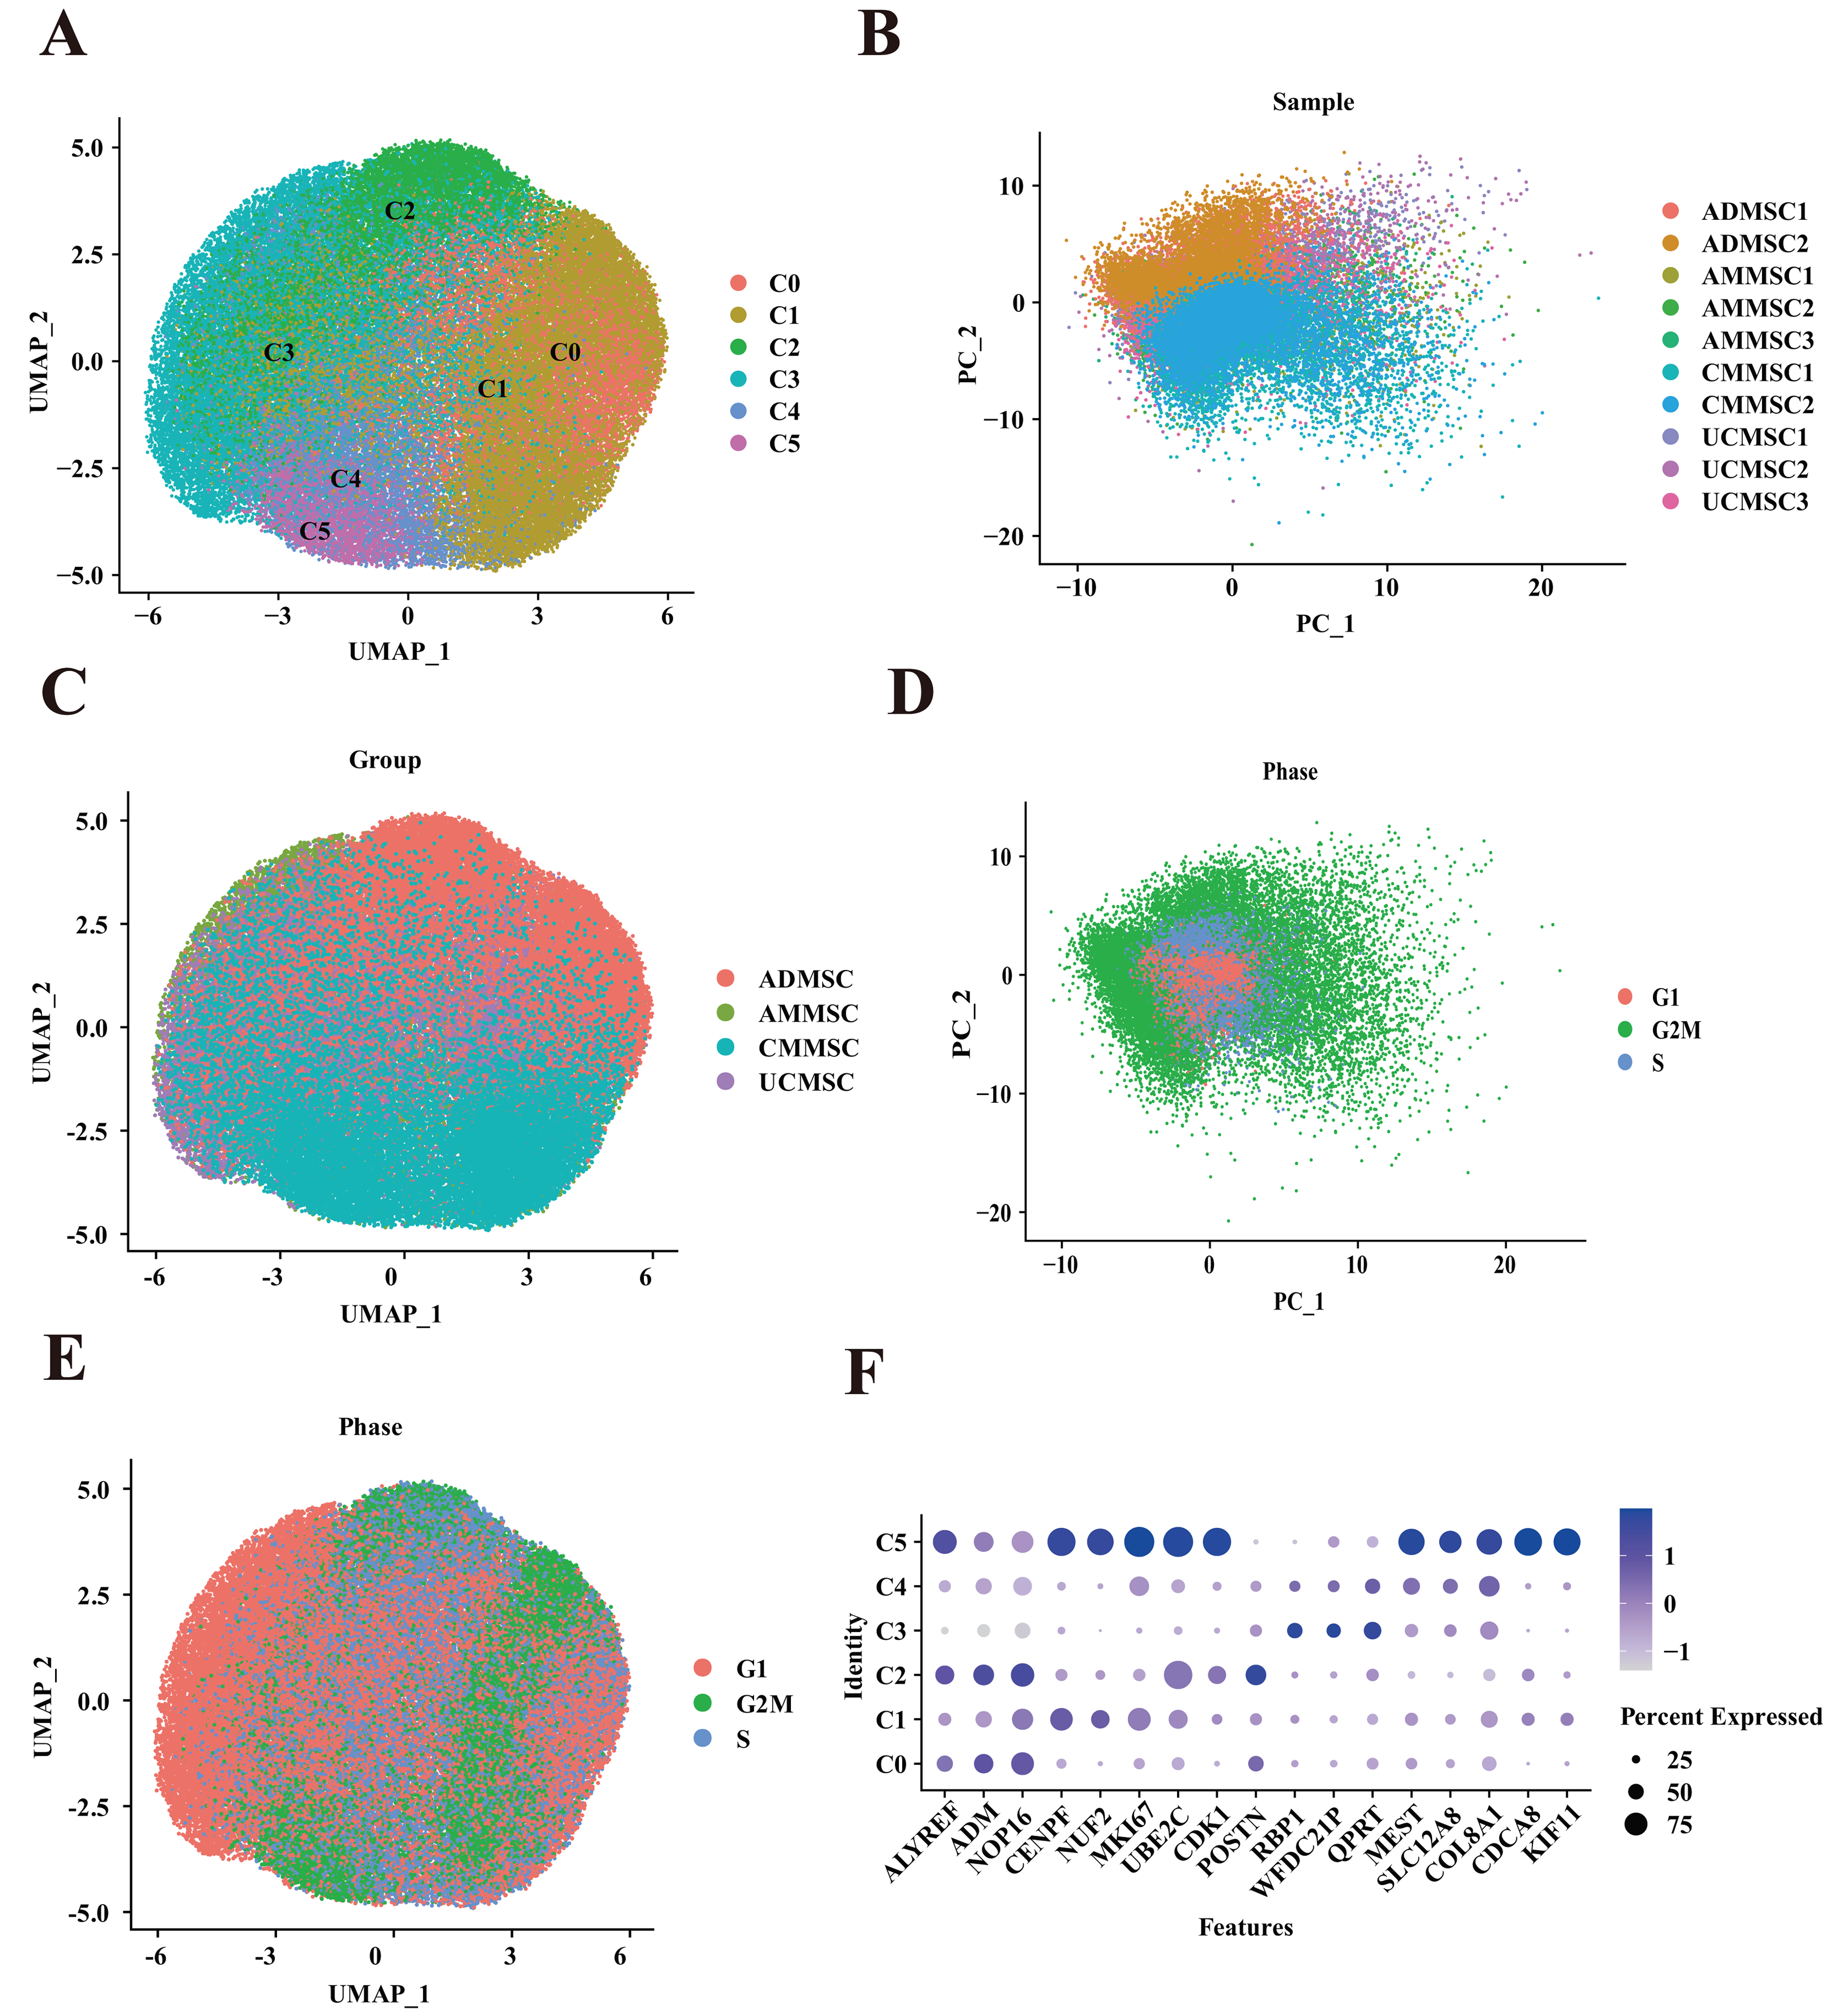
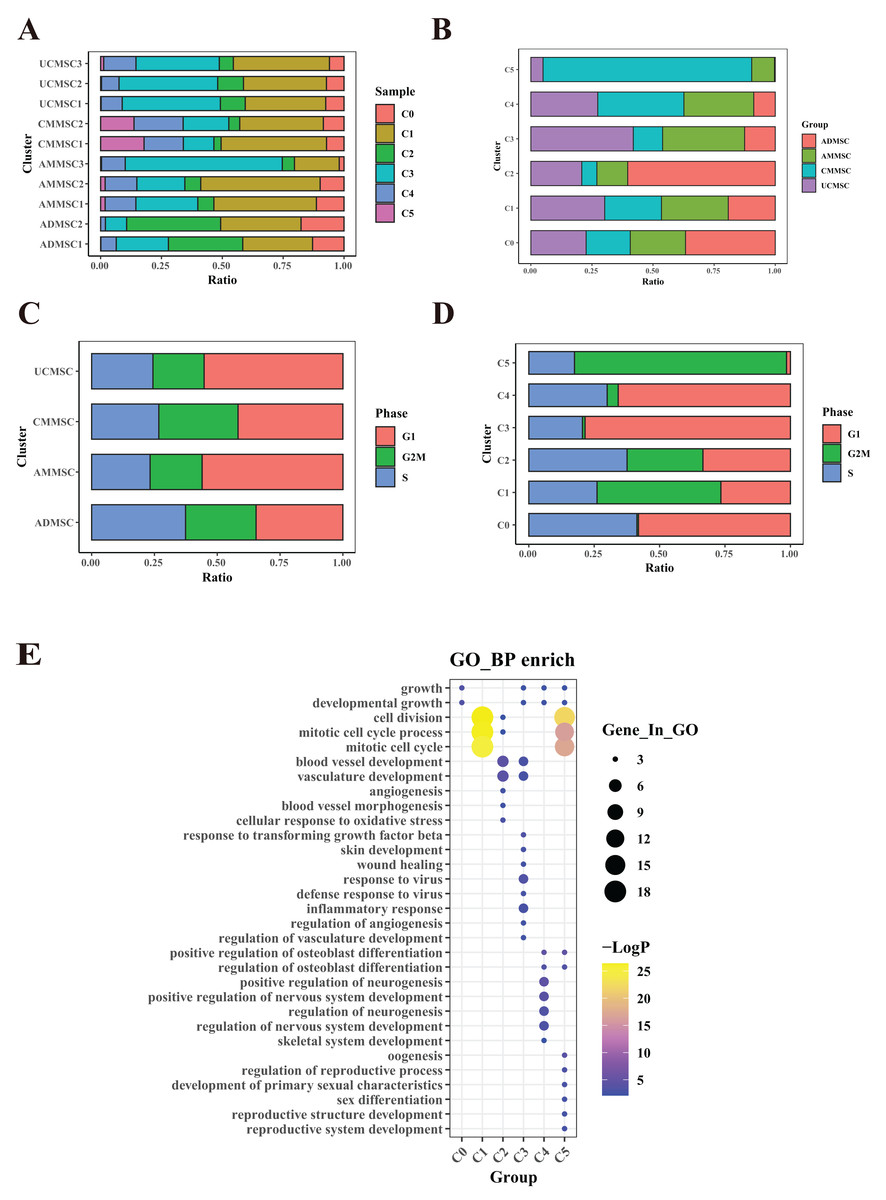
Figure 2: Functional heterogeneity among subpopulations from different tissue sources.
(A) Percentage of sample cells within each cell subpopulation. (B) Cell proportions of MSC subpopulations from various tissue sources. (C) Comparison of cell cycle proportions among cells from different sources. (D) Cell cycle proportions in different subpopulations. (E) Bubble plots illustrating marker gene enrichment for each subpopulation. The horizontal axis represents different subpopulations, the vertical axis represents enrichment categories; the bubble size corresponds to the number of enriched genes in each category and bubble color, as indicated on the LogP color scale on the right, indicates the significance of enrichment in each category.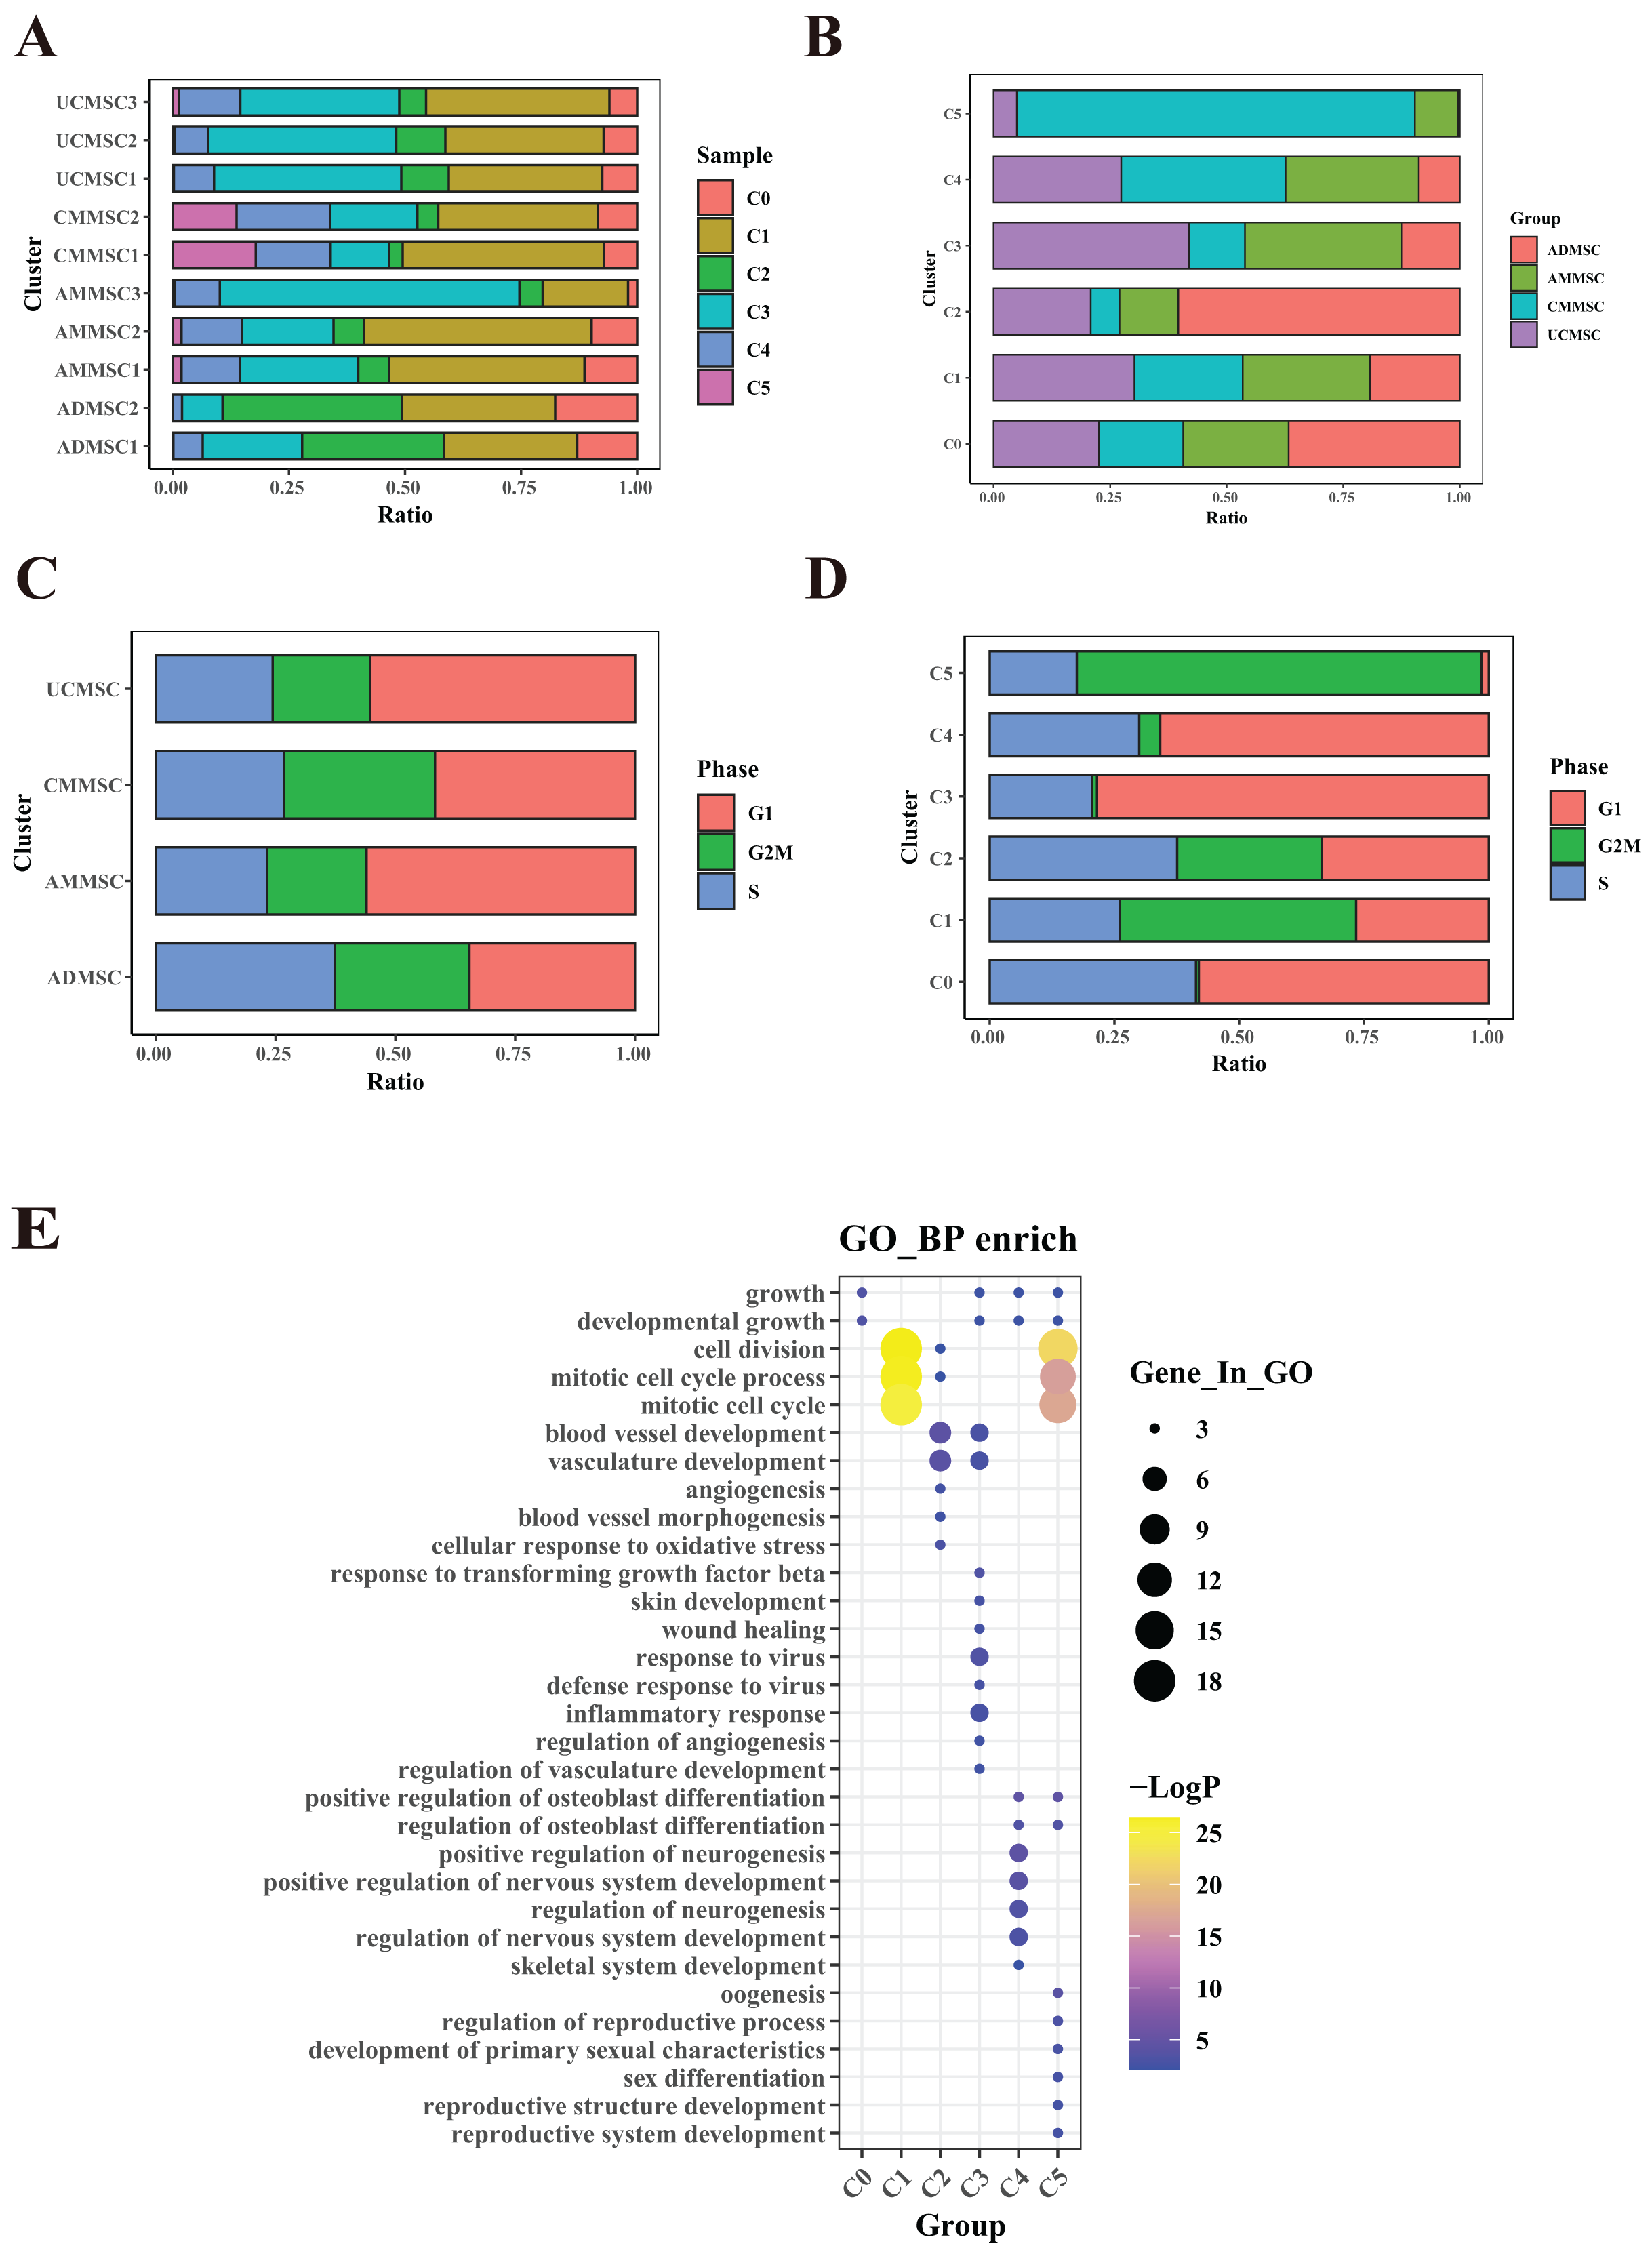
MSCs from different tissue sources exhibit varying functional characteristics
To elucidate the functional differences among MSCs derived from four different tissue sources, we compared the relative frequencies of the subpopulations from the four different sources (Fig. 2B and Table S2). Additionally, we conducted a functional enrichment analysis of differentially expressed genes in the six subpopulations (Fig. 2E). Among the subpopulations, the most notable differences in cell proportions were observed in two clusters, C2 and C5. Based on the number of cells in each group within the subpopulation, cluster C2 was predominant, accounting for 60.38% of ADMSCs. Conversely, this subpopulation was much less prevalent in AMMSCs (12.59%) and UCMSCs (20.83%), with the lowest proportion in CMMSCs (6.19%). The gene expression patterns within cluster C2 were associated with blood vessel development and angiogenesis. This suggests that ADMSCs exhibit stronger functionality in terms of angiogenesis and blood vessel development when compared with that of cells from the other three sources. Furthermore, we identified a subpopulation, cluster C5, with variation in proportions among MSCs derived from four different tissue sources. Notably, the C5 subpopulation accounted for 85.39% of CMMSCs but was less prevalent in AMMSCs (9.29%) and UCMSCs (4.99%). Of note, this subpopulation was nearly absent in ADMSCs (0.33%). Gene expression patterns within cluster C5 were linked to oogenesis and the regulation of reproductive processes. This finding strongly suggests that CMMSCs possess more pronounced functional characteristics related to oogenesis and the regulation of reproductive processes, while ADMSCs may lack such characteristics.
Regarding other cell proportions, C0 (accounting for 36.7% of ADMSCs, 22.61% of AMMSCs, 18.06% of CMMSCs, and 22.63% of UCMSCs), C1 (accounting for 19.21% of ADMSCs, 27.36% of AMMSCs, 23.2% of CMMSCs, and 30.22% of UCMSC). Although the C0 and C1 subpopulations exhibited slightly different proportions across the four sources, these differences were relatively minor, and there was no significant variation in cell numbers. Cluster C0 was linked to cell growth and developmental processes, while cluster C1 displayed gene expression patterns associated with cell cycle regulation and mitosis. These results suggest that differences in regeneration and cell cycle regulation among MSCs from the four sources are not substantial.
Cluster C3 was prevalent in UCMSCs (41.92%) and AMMSCs (33.55%) and less common in ADMSCs (12.54%) and CMMSCs (11.99%). Cluster C3 exhibited gene expression patterns related to wound healing, skin development, and inflammatory responses. This implies that UCMSCSs and CMMSCs have important roles in wound repair and immune regulation. Cluster C4 was the least prevalent in ADMSCs (accounting for 8.78%). Cluster C4 demonstrated gene expression patterns associated with the regulation of osteoblast differentiation and neurogenesis. These results indicate that ADMSCs may have relatively weaker effects on osteoblast differentiation and neurogenesis than those of cells from the other three sources.
In summary, MSC subpopulations exhibit variation with respect to tissue sources, with ADMSCs associated with blood vessel development, CMMSCs associated with reproductive processes, and subtle differences in cell growth and cycle regulation. Umbilical cord and chorionic MSCs demonstrated roles in wound repair and immune regulation, while ADMSCs had relatively weak effects on osteoblast differentiation and neurogenesis compared with those of cells from other sources.
Passages and hypoxic culture umbilical cord MSC subpopulations and expression profiles via scRNA-seq
UCMSCs have become the most widely used cell sources in many clinical trials owing to their low immunogenicity, ease of acquisition, and minimal ethical controversies. To investigate the effects of in vitro culture conditions on subpopulations of UCMSCs, we performed a single-cell expression analyses. UCMSCs were obtained from four healthy donors (Table S1) and were evaluated at various passages and culture environments (UCMSCP0 = 2, UCMSCP3 = 2, UCMSCP5 = 2, and UCMSCP5L = 2) using the 10× Genomics platform. We identified six subpopulations through a UMAP clustering analysis (Fig. 3A). Through a PCA and UMAP clustering analysis, we discovered heterogeneity in UCMSCs across different passages and culture environments, with relatively minor individual differences between samples (Figs. 3B and 3C).
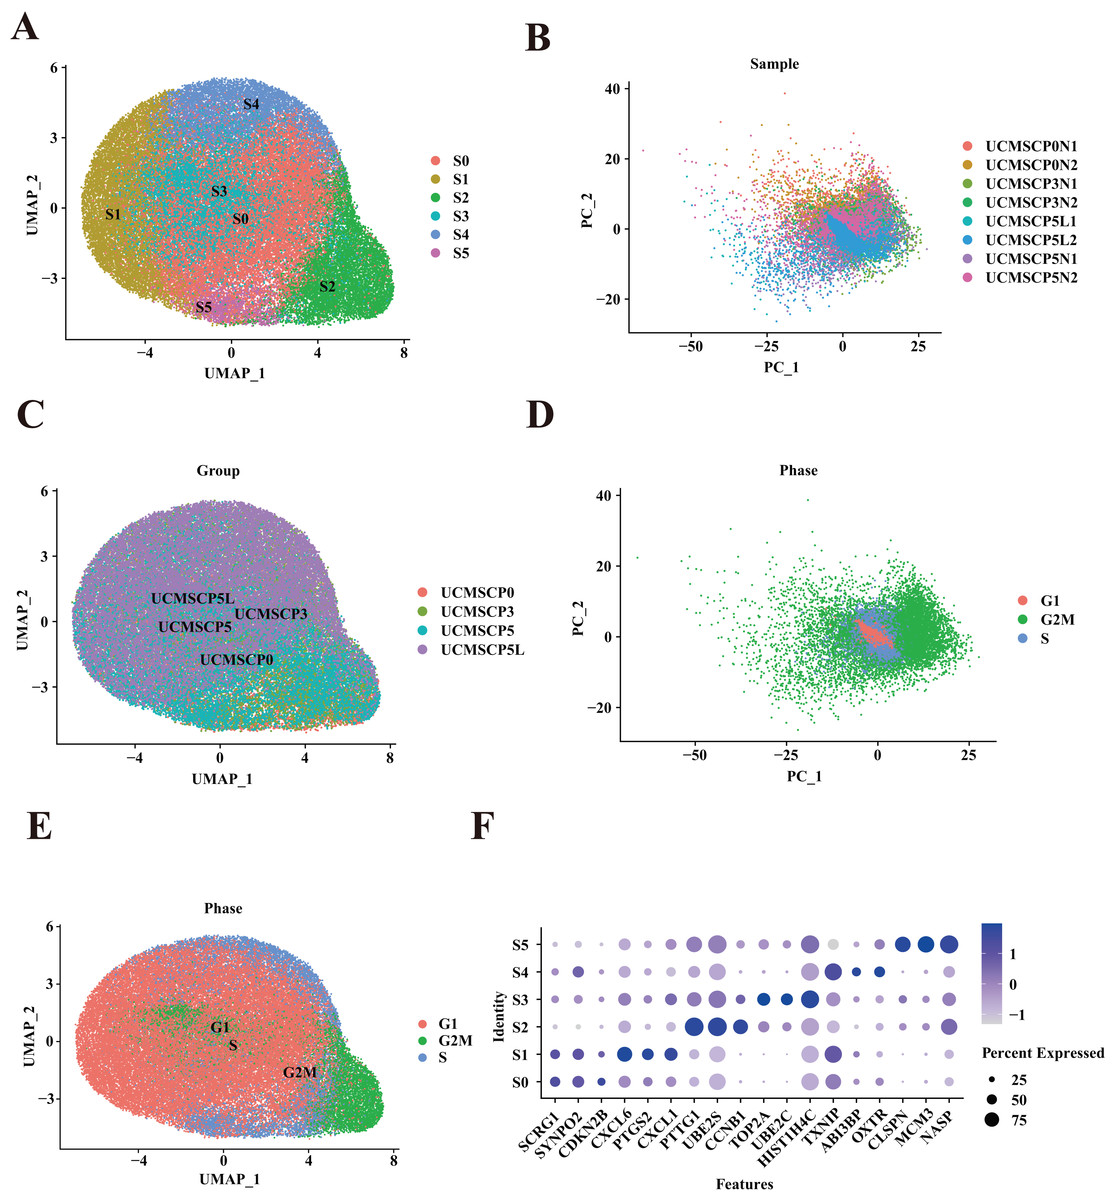
Figure 3: Mapping of UCMSCs from different passages and under hypoxic conditions.
(A) Unbiased clustering using UMAP hierarchical clustering maps categorized UCMSCP0, UCMSCP3, UCMSCP5, and UCMSCP5L into six subgroups. (B) Principal component analysis, demonstrating differences among samples from various passages and under hypoxic conditions with minimal batch effects in similar samples. (C) UMAP plots representing UCMSCP0, UCMSCP3, UCMSCP5, and UCMSCP5L. (D) UMAP plots indicating cell cycle phases G1, G2M, and S. (E) Cell cycle-based PCA clustering. (F) Expression of marker genes for each subpopulation.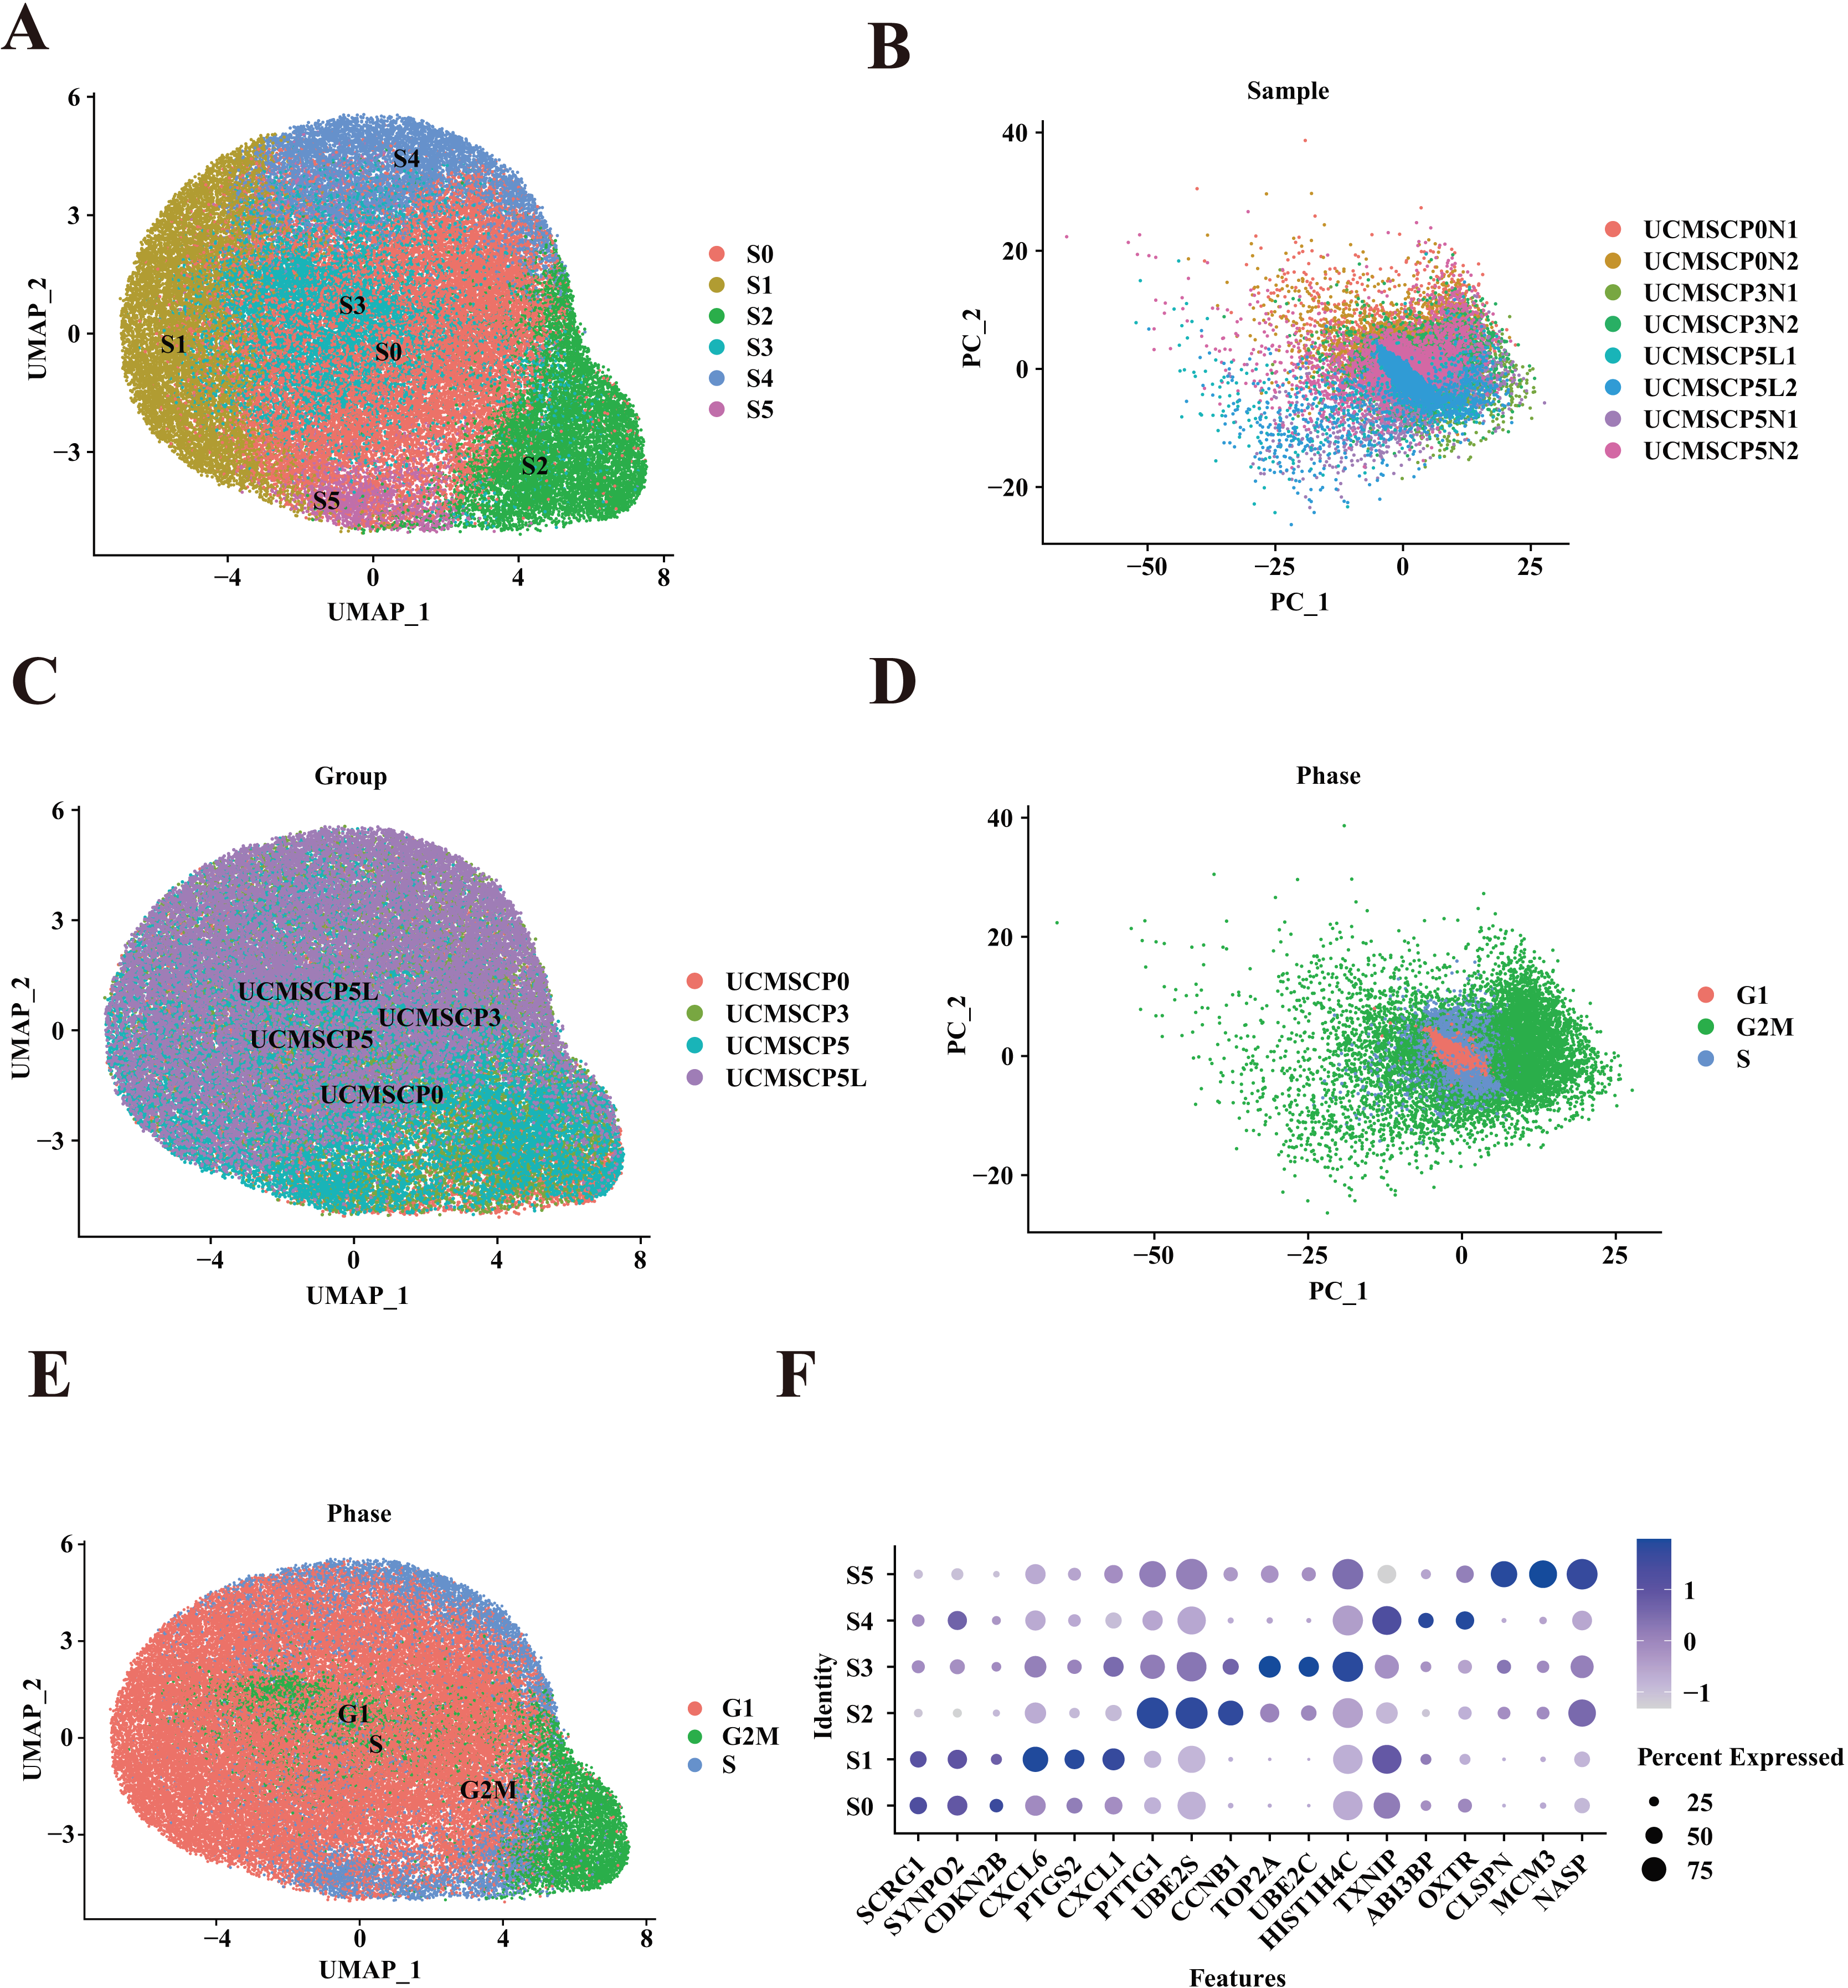
A more detailed examination indicated that the proportions of subpopulations among different samples from the same group were relatively consistent, despite variations in passages and hypoxic conditions (Fig. 4A). Nevertheless, there was variation in specific samples (e.g., between subpopulations S0 and S5 in UCMSCP3N1 and UCMSCP3N2). To quantitatively support our observations, we performed a Chi-squared goodness of fit test to compare the subpopulation distributions among different groups. The results are presented in the Table S3, which includes statistical comparisons of the proportions across different MSC samples. The Chi-squared test results show significant differences in the proportions of subpopulations across passages and hypoxic conditions. For example, between UCMSCP3N1 and UCMSCP3N2, there are significant differences in the proportions of subpopulations S0 to S5. These differences might be attributed to various factors, such as genetic background, necessitating further exploration.
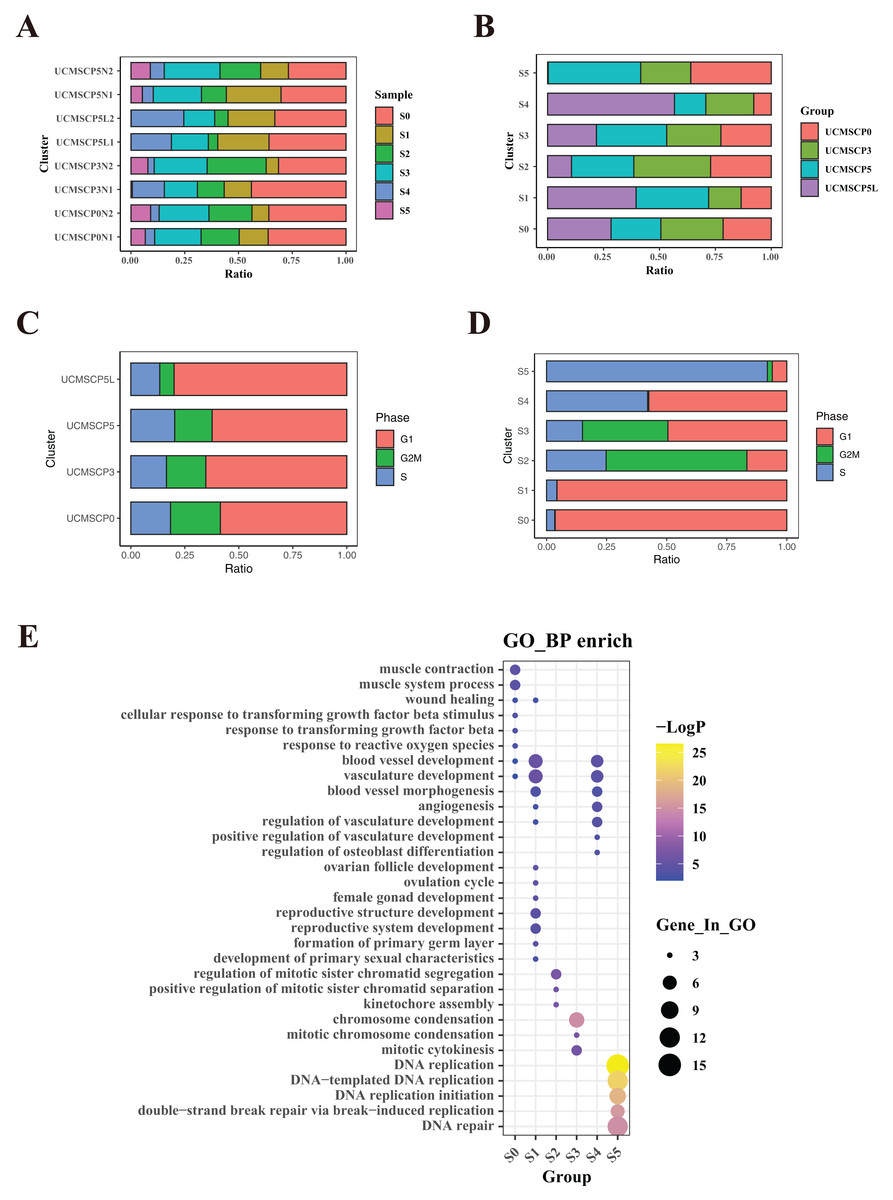
Figure 4: Functional heterogeneity among different passages and under hypoxia.
(A) Percentage of sample cells within each cell subpopulation. (B) Proportions of MSC subpopulations from various passages and under hypoxia. (C) Comparison of proportions of cell cycle phases among cells from different passages and under hypoxia. (D) Cell cycle proportions in different subpopulations. (E) Bubble plots illustrating marker gene enrichment for each subpopulation. The horizontal axis represents different subpopulations, the vertical axis represents enrichment categories; the bubble size corresponds to the number of enriched genes in each category, and bubble color, as indicated on the LogP color scale on the right, indicates the significance of enrichment in each category.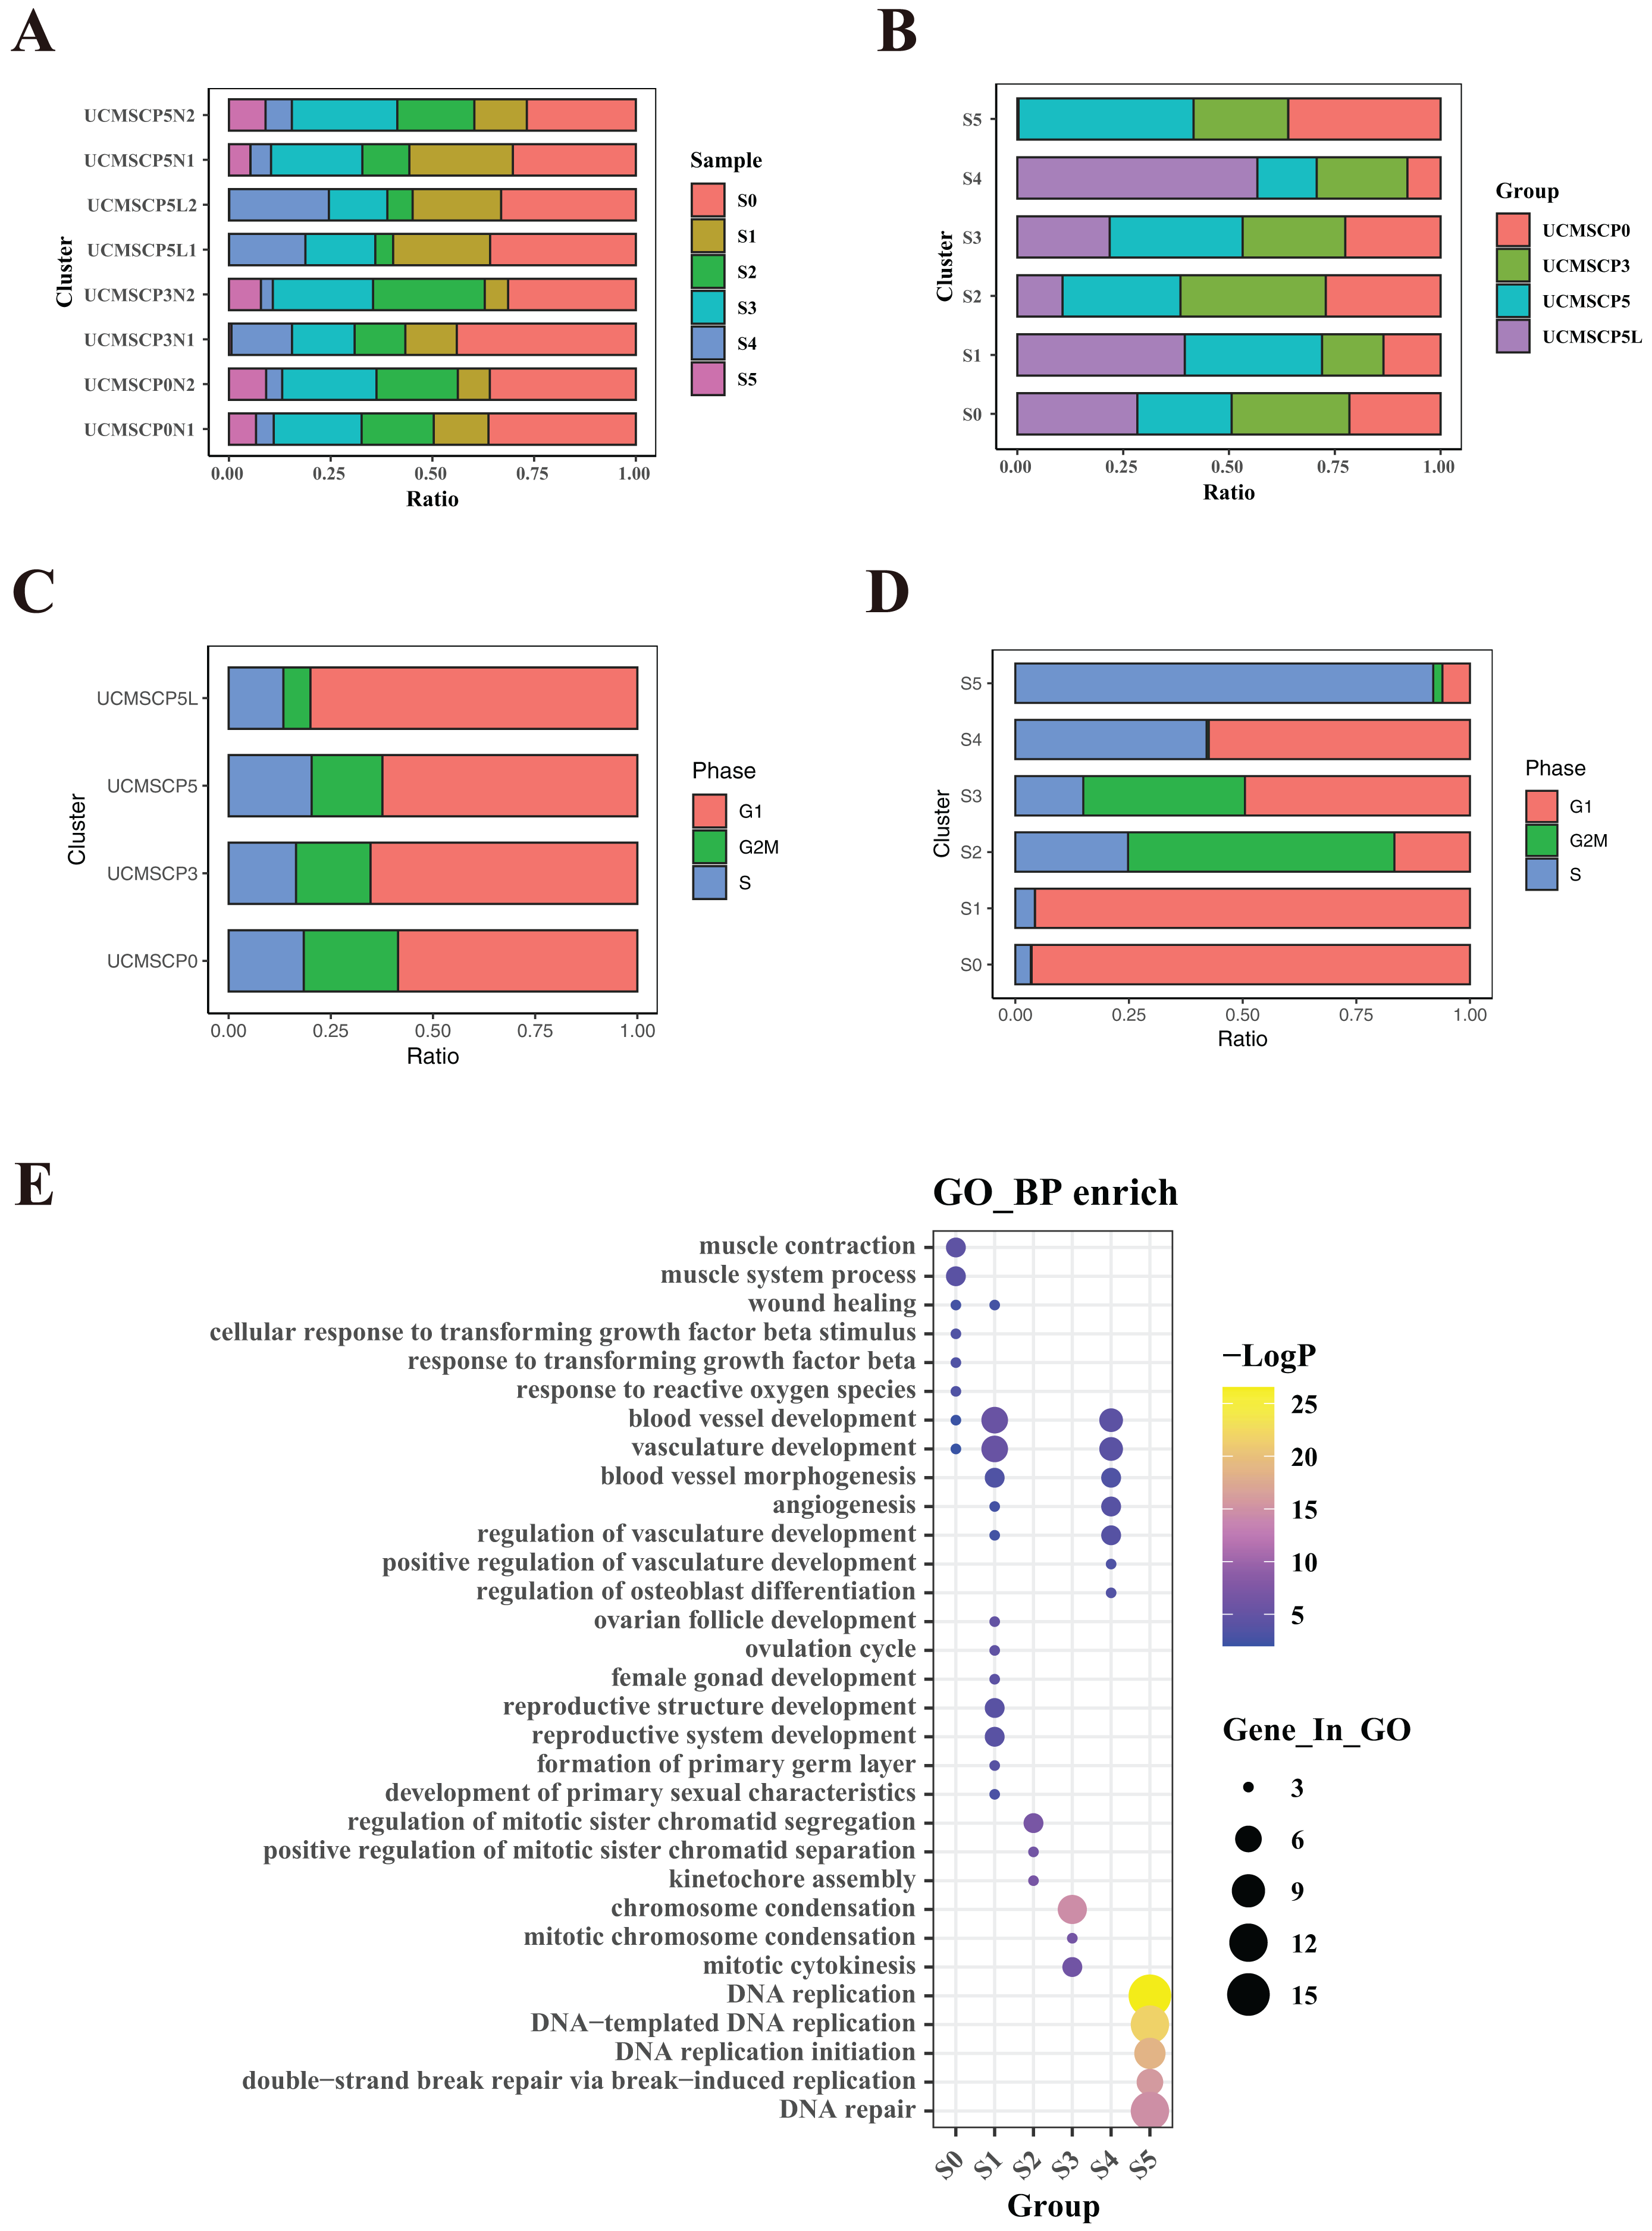
Additionally, after applying the SCT method to remove cell cycle effects and conducting a PCA, we compared the distribution of cell cycle phases within subpopulations among samples. We observed that the variation in cell cycle phases among the UCMSCP0, UCMSCP3, UCMSCP5, and UCMSCP5L groups was relatively minor. The differences in cell cycle phases between various subpopulations were more pronounced (Figs. 3D and 3E). A detailed analysis of relative frequencies of cell cycle phases revealed no significant differences in the cell cycle distribution among UCMSCP0, UCMSCP3, and UCMSCP5. However, in UCMSCP5L, we observed an increased proportion of G1 phase cells and a decreased proportion of G2M phase cells. This suggests that the low oxygen environment may slow cell cycle progression (Fig. 4C). Nevertheless, distinct differences in the cell cycle distribution were evident among subpopulations (Fig. 4D). These results suggest that these subpopulations have distinct characteristics in terms of cell cycle control and regulation, which could potentially impact their functions and functional specificity. Further research on the cell cycle characteristics of these subpopulations improve our understanding of their biological roles. Furthermore, we analyzed relatively specific marker genes of cluster S0–S5 (Fig. 3F). The absence of significant marker genes for these subpopulations implies that they exhibit shared functions or features. For a more comprehensive grasp of the biological roles and functions of subpopulation, in-depth functional analyses and feature descriptions are warranted.
Variation in the proportional composition of umbilical cord MSC subpopulations across passages P0, P3, P5, and low-oxygen culture conditions
To elucidate the functional differences among UCMSCs derived from various passages and oxygen environments, we compared cell proportions and conducted a functional enrichment analysis of differentially expressed genes among the six subpopulations (Figs. 4B, 4E and Table S3). The cell proportions in different subpopulations showed variation within UCMSCP0, with a higher proportion of cluster S5 (36%) and lower proportions of cluster S1 (13.52%) and S4 (7.85%). Differentially expressed genes in cluster S5 were enriched for functions related to DNA replication, while genes in cluster S1 showed enrichment for functions related to vascular development, follicular development, and reproductive system development. Differentially expressed genes in cluster S4 exhibited enrichment for vascular development and regeneration. These findings suggest that UCMSCP0 cells have a strong capacity for proliferation; however, their potential for vascular and reproductive functional regeneration may be relatively weak. In UCMSCP3, the proportions of various subpopulations were relatively consistent. In UCMSCP5, the S5 subpopulation was most abundant (41.33%), while the S4 subpopulation was less frequent (14%). This distribution suggests that in P5, cells were disproportionately involved in DNA replication, indicating a faster rate of cell proliferation. However, this may also indicate a relatively weaker capacity for vascular regeneration. Additionally, when analyzing the proportions of subpopulations in UCMSCP5L, we detected variation. The S4 subpopulation accounted for 56.71% of cells, followed by the S1 subpopulation (39.54%), suggesting that UCMSCP5L from P5 under low oxygen conditions contributes to vascular regeneration and reproductive function. Interestingly, the S5 subpopulation was notably scarce (0.29%), and the S2 subpopulation only accounted for 10.68% of cells. These results imply that a limited number of cells in P5 under low oxygen conditions are involved in DNA replication and chromosome separation, possibly due to a slow rate of cell cycle progression induced by the low oxygen environment. UCMSCP5 may have a greater role in reproductive functions when compared with those of UCMSCP0 and UCMSCP3. Moreover, a low-oxygen culture environment might promote vascular regeneration while inhibiting cell cycle progression.
To further confirm the specialized functions of the S1 and S4 subpopulations in clinical applications related to vascular and reproductive function, we performed a pseudotime trajectory analysis of UCMSCs across different passages and oxygen conditions. This analysis confirmed that the S1 and S4 subpopulations follow unique differentiation trajectories (Figs. 5A and 5B). Importantly, these trajectories appeared to be minimally influenced by the cell cycle and displayed subpopulation-specific and tissue-specific characteristics (Figs. 5C and 5D).
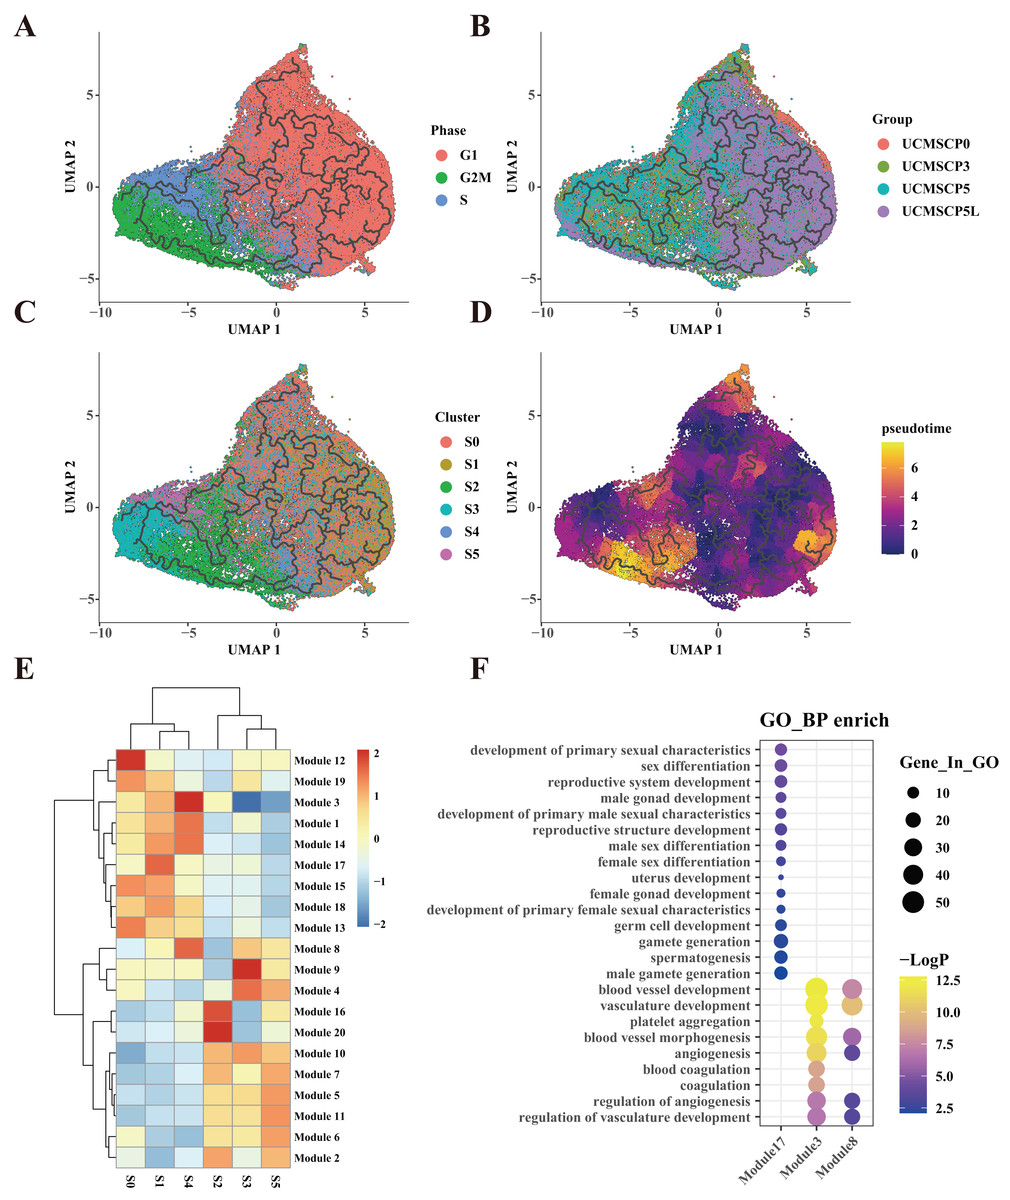
Figure 5: UCMSC differentiation trajectory and differentiation-related gene expression.
(A) Temporal trajectory plot constructed for UCMSCs using monocle3 for G1, G2M, and S phases, with ordinal numbers representing predicted differentiation branching paths. (B) Temporal trajectory plot constructed for UCMSCP0, UCMSCP3, UCMSCP5, and UCMSCP5L, with ordinal numbers indicating predicted differentiation branching paths. (C) Temporal trajectory plot constructed for S0–S5 clusters, with ordinal numbers representing predicted differentiation branching paths. (D) Temporal trajectory plot constructed by UCMSCP0, UCMSCP3, UCMSCP5, and UCMSCP5L, where the color scale on the right side shows yellow indicating the end and purple indicating the beginning of the period. (E) Gene module expression heatmap. (F) Gene Ontology (GO) Biological Process (BP) enrichment bubble plots for module 17, module 3, and module 8; horizontal coordinates indicate subgroups, vertical coordinates represent enrichment entries; the bubble size indicates the number of genes enriched in each entry, and bubble color, as shown on the right-hand LogP color scale, signifies the significance of enrichment in each entry.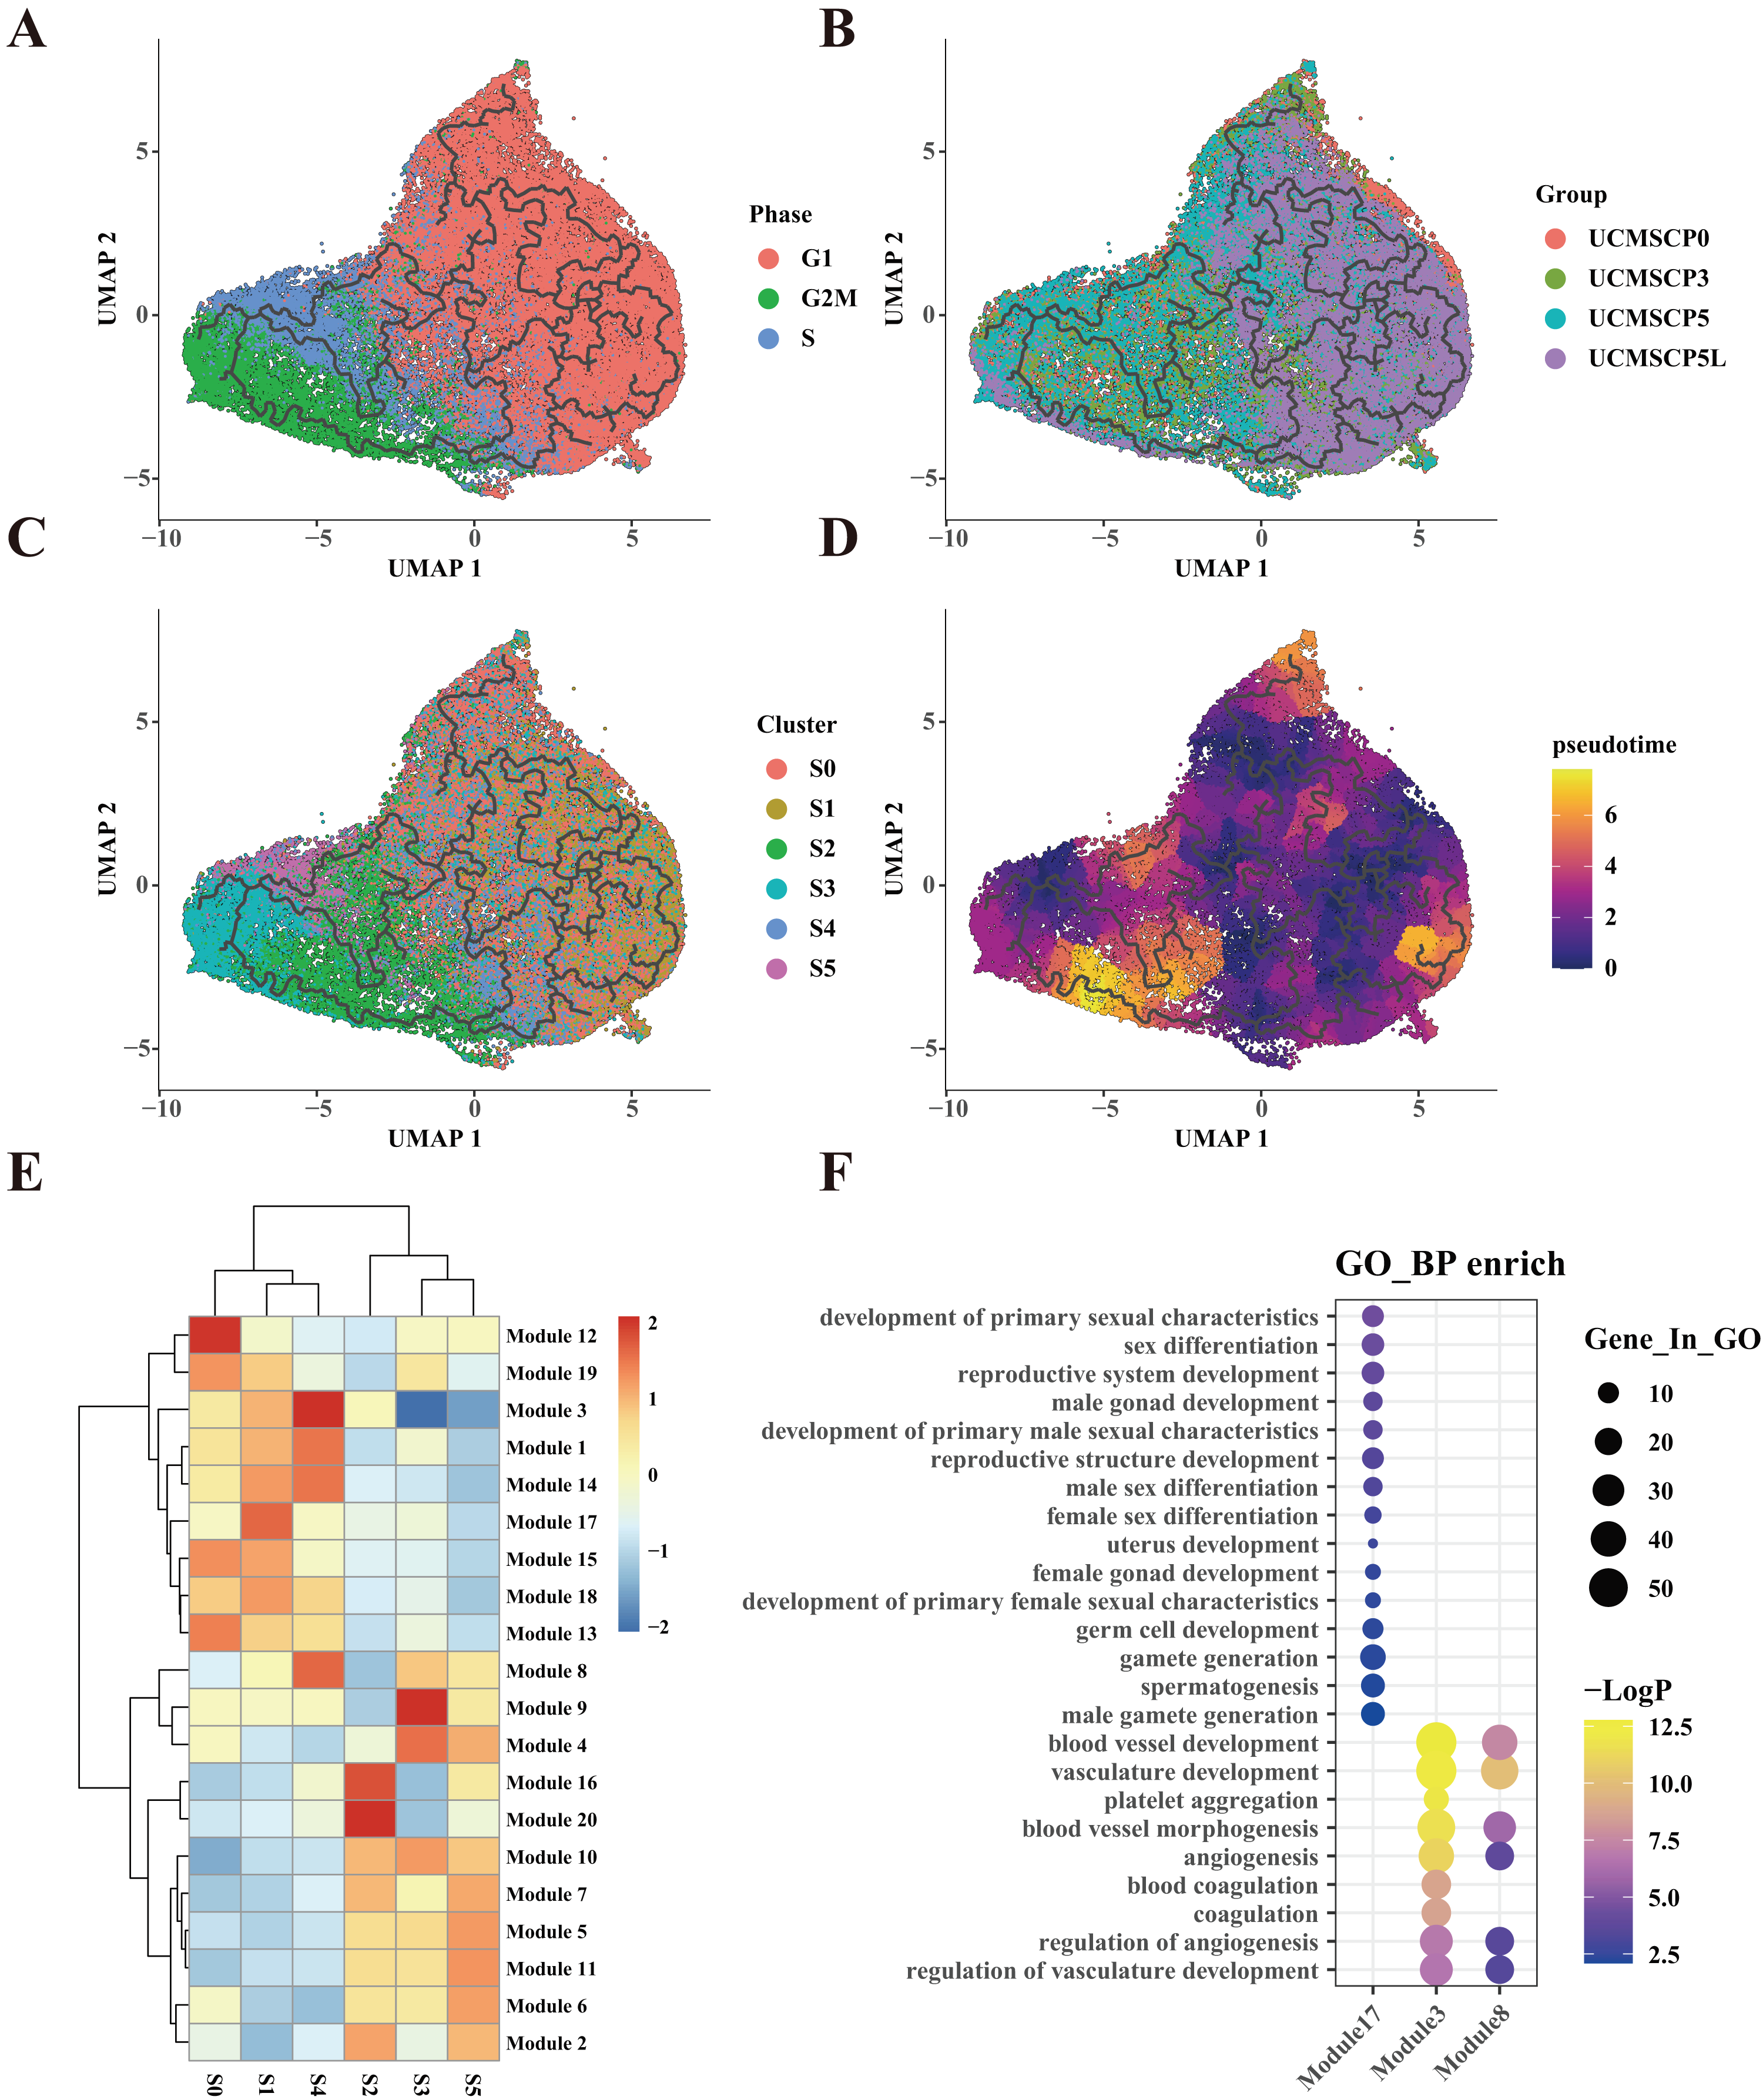
Based on correlations between pseudotime and gene expression results, we categorized 14,837 genes into 20 gene modules, revealing distinct expression patterns in the S0–S5 subpopulations. Notably, the S1 subpopulation exhibited the specific upregulation of module 17 (Fig. 5E). A functional enrichment analysis of the genes in module 17 indicated their association with reproductive system development (Fig. 5F). This further corroborates the enrichment of reproduction-related functions within the S1 subpopulation in UCMSCP5 and UCMSCP5L. Similarly, a functional enrichment of genes within modules 3 and 8, specifically upregulated in the S4 subpopulation, indicated roles in vascular development (Figs. 5E and 5F). This provides additional evidence of the enhanced vascular regeneration functions of the S4 subpopulation, particularly in UCMSCP5L. Additionally, we observed that subpopulations S0, S2, S3, and S5 were characterized by the upregulation of genes in modules 12, 16, 10, and 11. A functional enrichment analysis of these gene modules (see Fig. S5) revealed enrichment for similar functions to those of subpopulations S0, S2, S3, and S5 (Fig. 4E).
Discussion
We explored the functional diversity of MSCs obtained from different tissue sources, passages, and culture conditions. We found substantial differences among MSCs derived from different tissues, highlighting the importance of considering the tissue source when designing personalized regenerative therapies. Additionally, variation in passages and culture conditions led to shifts in UCMSC subpopulations, which may impact their clinical applicability. Our findings provide valuable insights into how these factors can influence MSC functionality, specifically in the context of vascular and reproductive system regeneration.
MSCs derived from the adipose tissue, chorionic villi, amniotic membrane, and umbilical cord exhibited distinct functional characteristics (Fig. 2B). These differences were particularly evident in subpopulations associated with vascular regeneration and reproductive processes (Fig. 2E). ADMSCs displayed a higher proportion of subpopulations linked to blood vessel development, indicating their potential for vascular regeneration. In contrast, CMMSCs demonstrated a higher prevalence of subpopulations associated with reproductive processes, suggesting their specialized role in supporting reproductive system development.
MSCs have a propensity to promote angiogenesis. Previous studies have already demonstrated the significant role of MSCs in promoting vascular regeneration, particularly those derived from adipose tissue (Kern et al., 2006; Kondo et al., 2009). The novelty of this study is the more in-depth exploration of diversity among MSCs from different tissue sources, with a specific focus on the exceptional potential of adipose-derived MSCs to promote vascular development. Previous research has not clearly established genetic diversity within MSCs and its dependence on their tissue source and culture environment (Baergen & Baergen, 2011; Berebichez-Fridman & Montero-Olvera, 2018; Cao et al., 2021). There is evidence that MSCs around blood vessels stabilize the endothelial network and exert synergistic effects with endothelial cells on the formation of new blood vessels in vivo (Crisan et al., 2008). These newly formed vessels connect with the host vascular system, guiding blood flow and exhibiting network stability. Generally, adipose tissue contains more blood vessels compared with those in umbilical cord, placental membranes, and amniotic membrane tissues (Baer & Geiger, 2012). Adipose tissue is highly vascularized, primarily serving to store energy and maintain body temperature, requiring abundant blood vessels to supply oxygen and nutrients. In contrast, umbilical cord, placental membrane, and amniotic membrane tissues typically have fewer blood vessels due to their relatively weaker structures. This difference may explain the stronger vascular regeneration functions of adipose-derived MSCs observed in this study.
Similarly, in the context of reproductive function regeneration, the capacity of MSCs to facilitate the development of reproductive cells, including follicular and sperm cells, is well-established (Fazeli et al., 2018). These MSCs also secrete growth factors and extracellular vesicles, generating a favorable microenvironment within reproductive organs, mitigating inflammation, and exhibited antioxidant effects. These functions are of paramount importance for reproductive system health and function. Various types of MSCs, such as those derived from adipose tissue, bone marrow, and the placenta, may exhibit distinct functions. However, few systematic studies have focused on elucidating key subpopulations with reproductive regenerative potential and comparing properties across different MSC types and passage conditions. In our analysis, the C5 subpopulation accounted for over 80% of CMMSCs but was less prevalent in AMMSCs and UCMSCs. Most notably, this subpopulation was nearly absent in ADMSCs. This may be attributed to the closer proximity of the chorionic membrane to the uterus than to the umbilical cord, amniotic membrane, and adipose tissue. As an integral part of the placenta, the chorionic tightly adheres tightly to the uterine wall and is connected to the maternal bloodstream via capillaries in chorionic villi. Studies have indicated the presence of proliferative fetal and maternal MSCs in the terminal chorionic villi of the full-term human placenta (Mathews et al., 2015; Rosner et al., 2023). Therefore, we speculate that CMMSCs may interact directly with the uterus, potentially resulting in a greater abundance of subpopulations associated with reproductive system development. Although the amniotic membrane and umbilical cord do not directly interact with the uterus, they develop in conjunction with the nourishing outer embryonic layer (Baergen & Baergen, 2011). Conversely, MSCs derived from adult abdominal adipose tissue are not closely involved in reproductive processes.
The selection of these specific tissue sources over others, like bone marrow and dental pulp, was driven by various factors, including ethics, accessibility, and their potential for large-scale clinical applications and drug development (Berebichez-Fridman & Montero-Olvera, 2018). The use of P5 cells was based on several key factors. P5 cells represent have expanded sufficiently for therapeutic use, maintaining vital properties and functionalities. Accordingly, the utilization of P5 cells ensures optimal proliferation without senescence, while maintaining potency and efficacy. P5 cells show low batch-to-batch variation, which crucial for reproducibility in clinical applications. Additionally, they exhibit stable characteristics and genetic stability, reducing risks, e.g., tumorigenicity associated with prolonged culture (Cao et al., 2021; Yang et al., 2023). Further, the consideration of hypoxic conditions was driven by the growing understanding of how physiological oxygen levels impact MSC characteristics in their microenvironment. Our aim was to provide new insights into MSC functions under conditions resembling the in vivo state (Ejtehadifar et al., 2015; Rosová et al., 2008). Owing to their ease of procurement, immunomodulatory properties, and lack of ethical issues, we chose UCMSCs to evaluate heterogeneity across different passages and culture conditions. These cells are widely utilized, possess immune privilege, and have various research applications (Nagamura-Inoue & He, 2014).
Our research contributes to a deeper understanding of the functional variation in MSCs, offering insights into how the tissue source, passage number, and culture conditions can influence their regenerative potential. However, it is important to acknowledge the limitations of our study, including the small number of biological replicates used for scRNA-seq and the potential confounding effects of donor heterogeneity in low-oxygen conditions. Despite these limitations, our findings open new avenues for personalized regenerative therapies and pave the way for more effective treatments across a spectrum of medical conditions. Further studies of the specific mechanisms underlying these functional differences will be crucial for harnessing the full potential of MSCs in regenerative medicine.
Conclusions
In this study, the functional diversity of MSC subpopulations across various tissues and passages was evaluated. Adipose-derived MSCs exhibited a high proportion of subpopulations associated with vascular regeneration, while chorionic villi-derived MSCs were related to reproductive processes. Umbilical cord-derived MSCs at P5, particularly under low-oxygen conditions, demonstrated an increased representation of subpopulations related to female reproductive functions. These findings highlight the significance of the tissue source and passage number in identifying MSC subpopulations with a higher prevalence of specific functionalities. These findings hold promise for tailoring regenerative therapies and advancing personalized and effective clinical treatments.
Supplemental Information
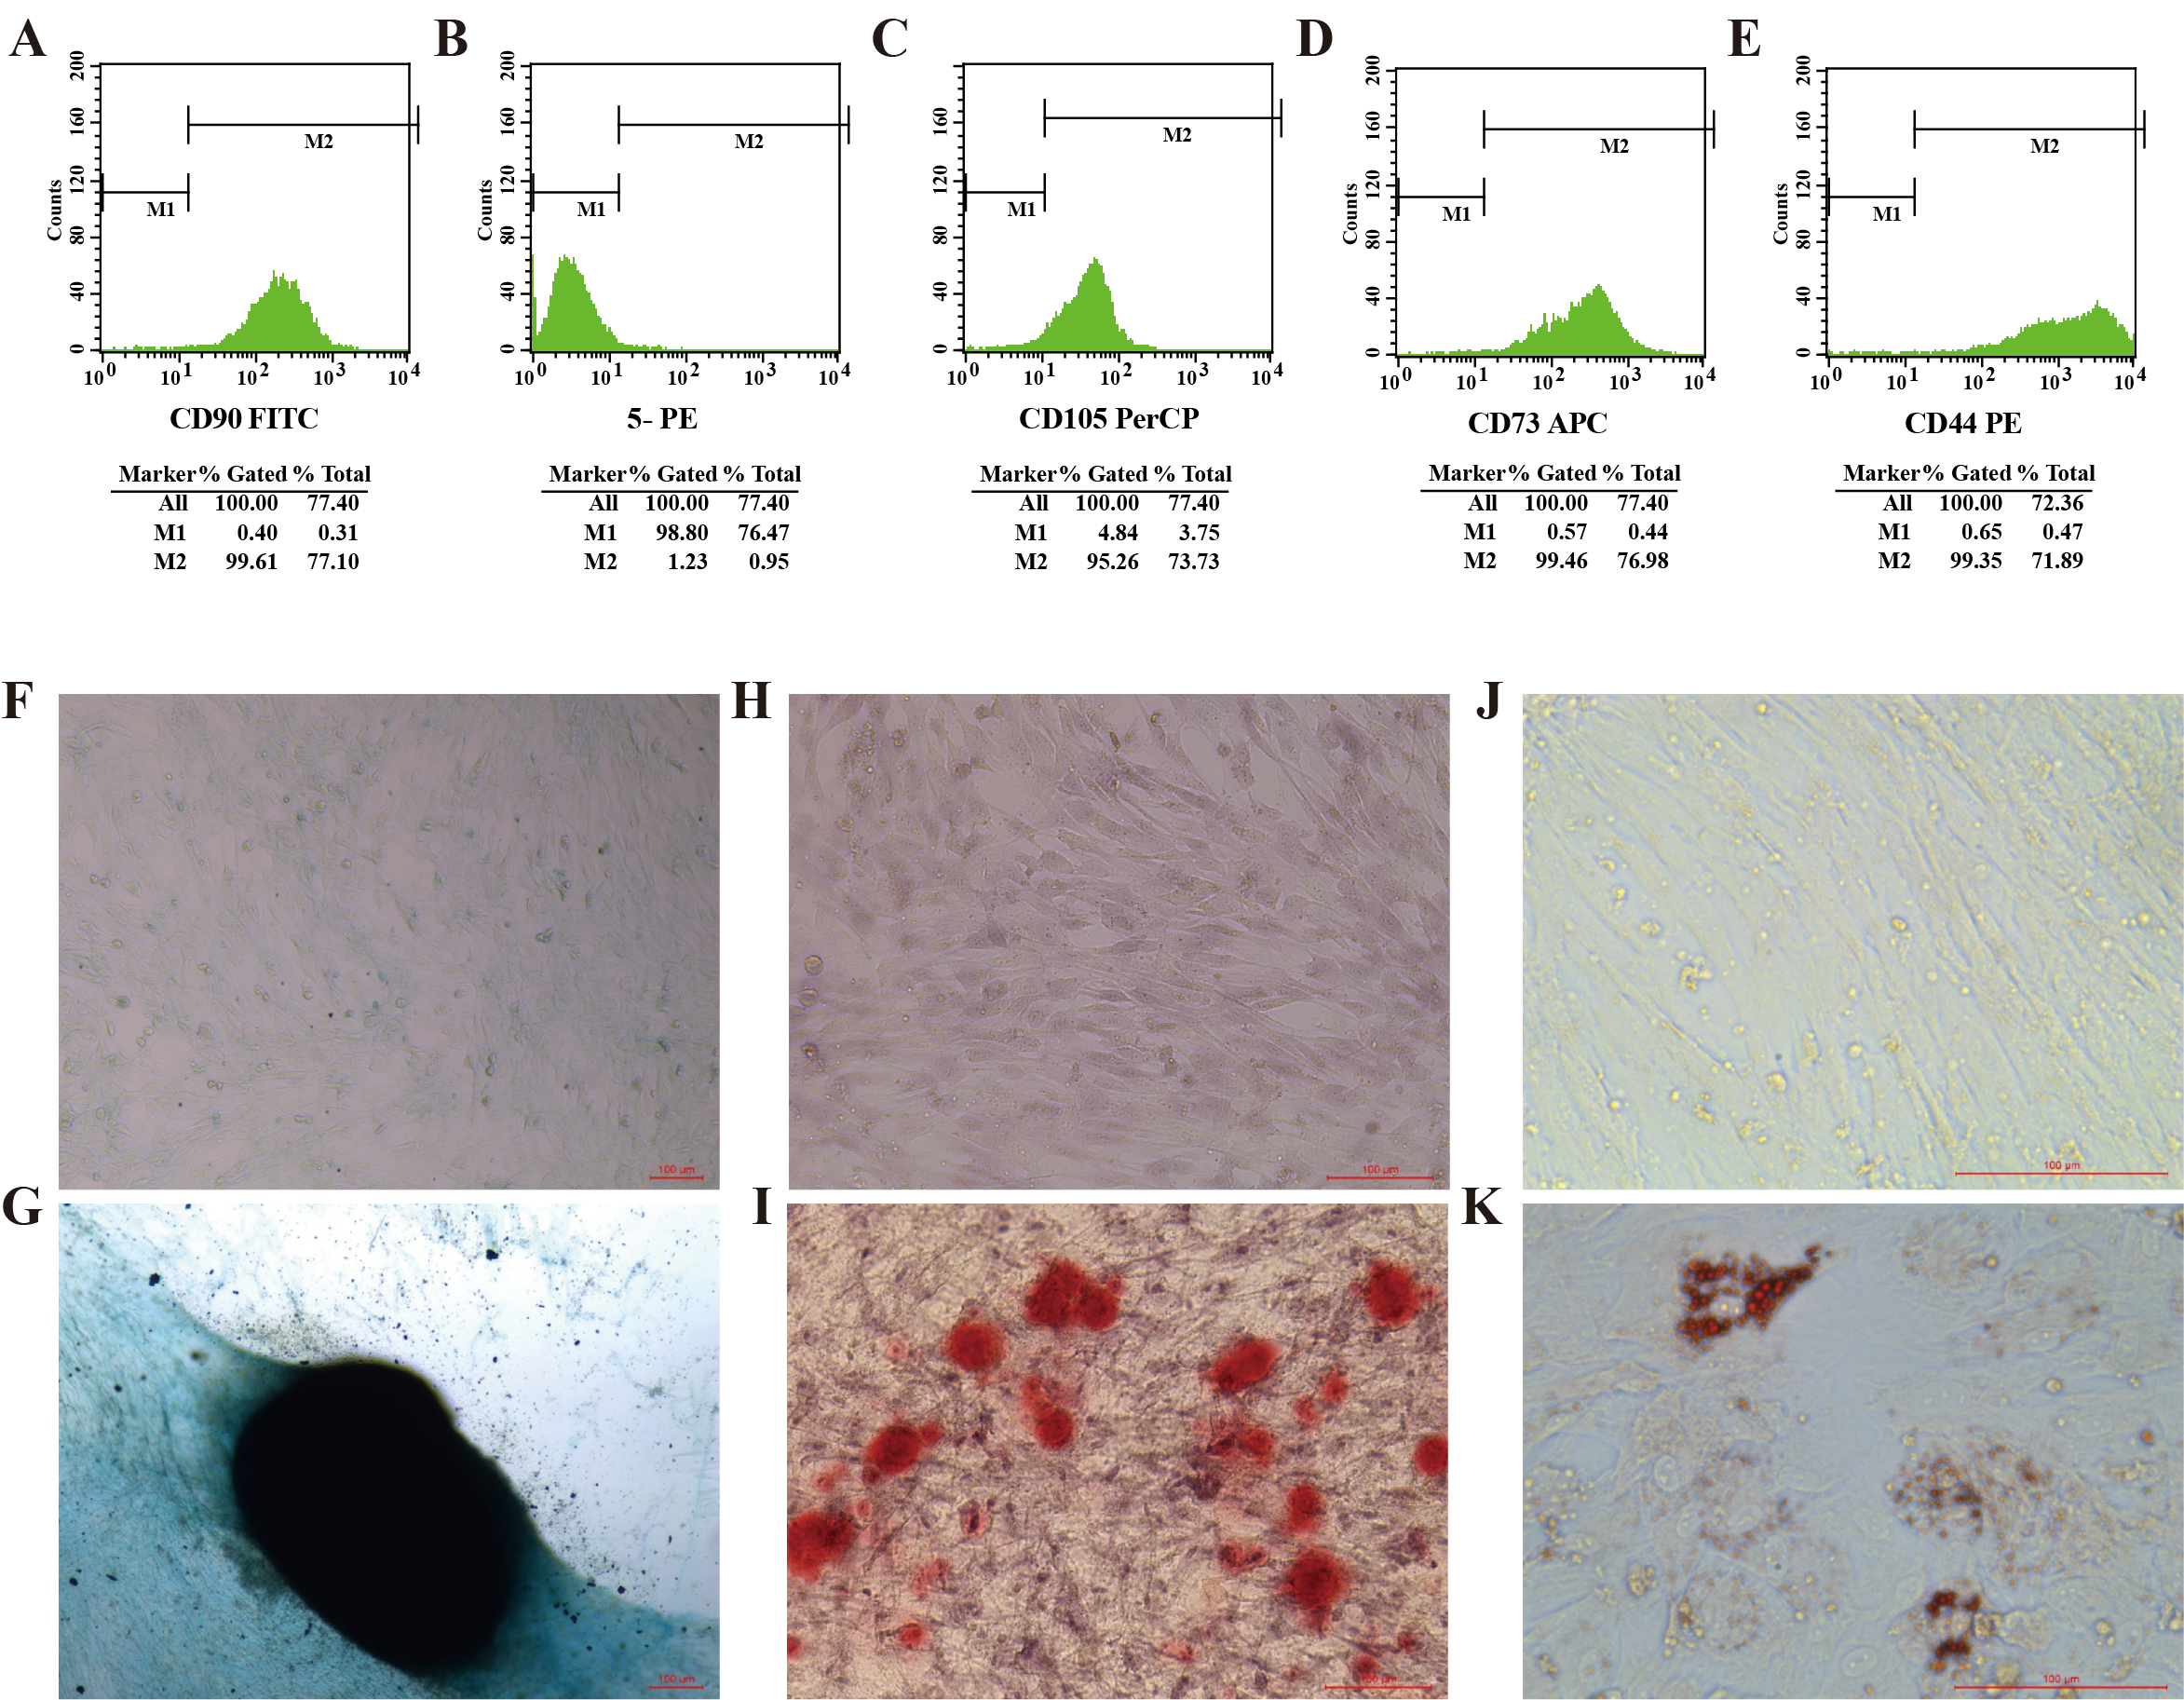
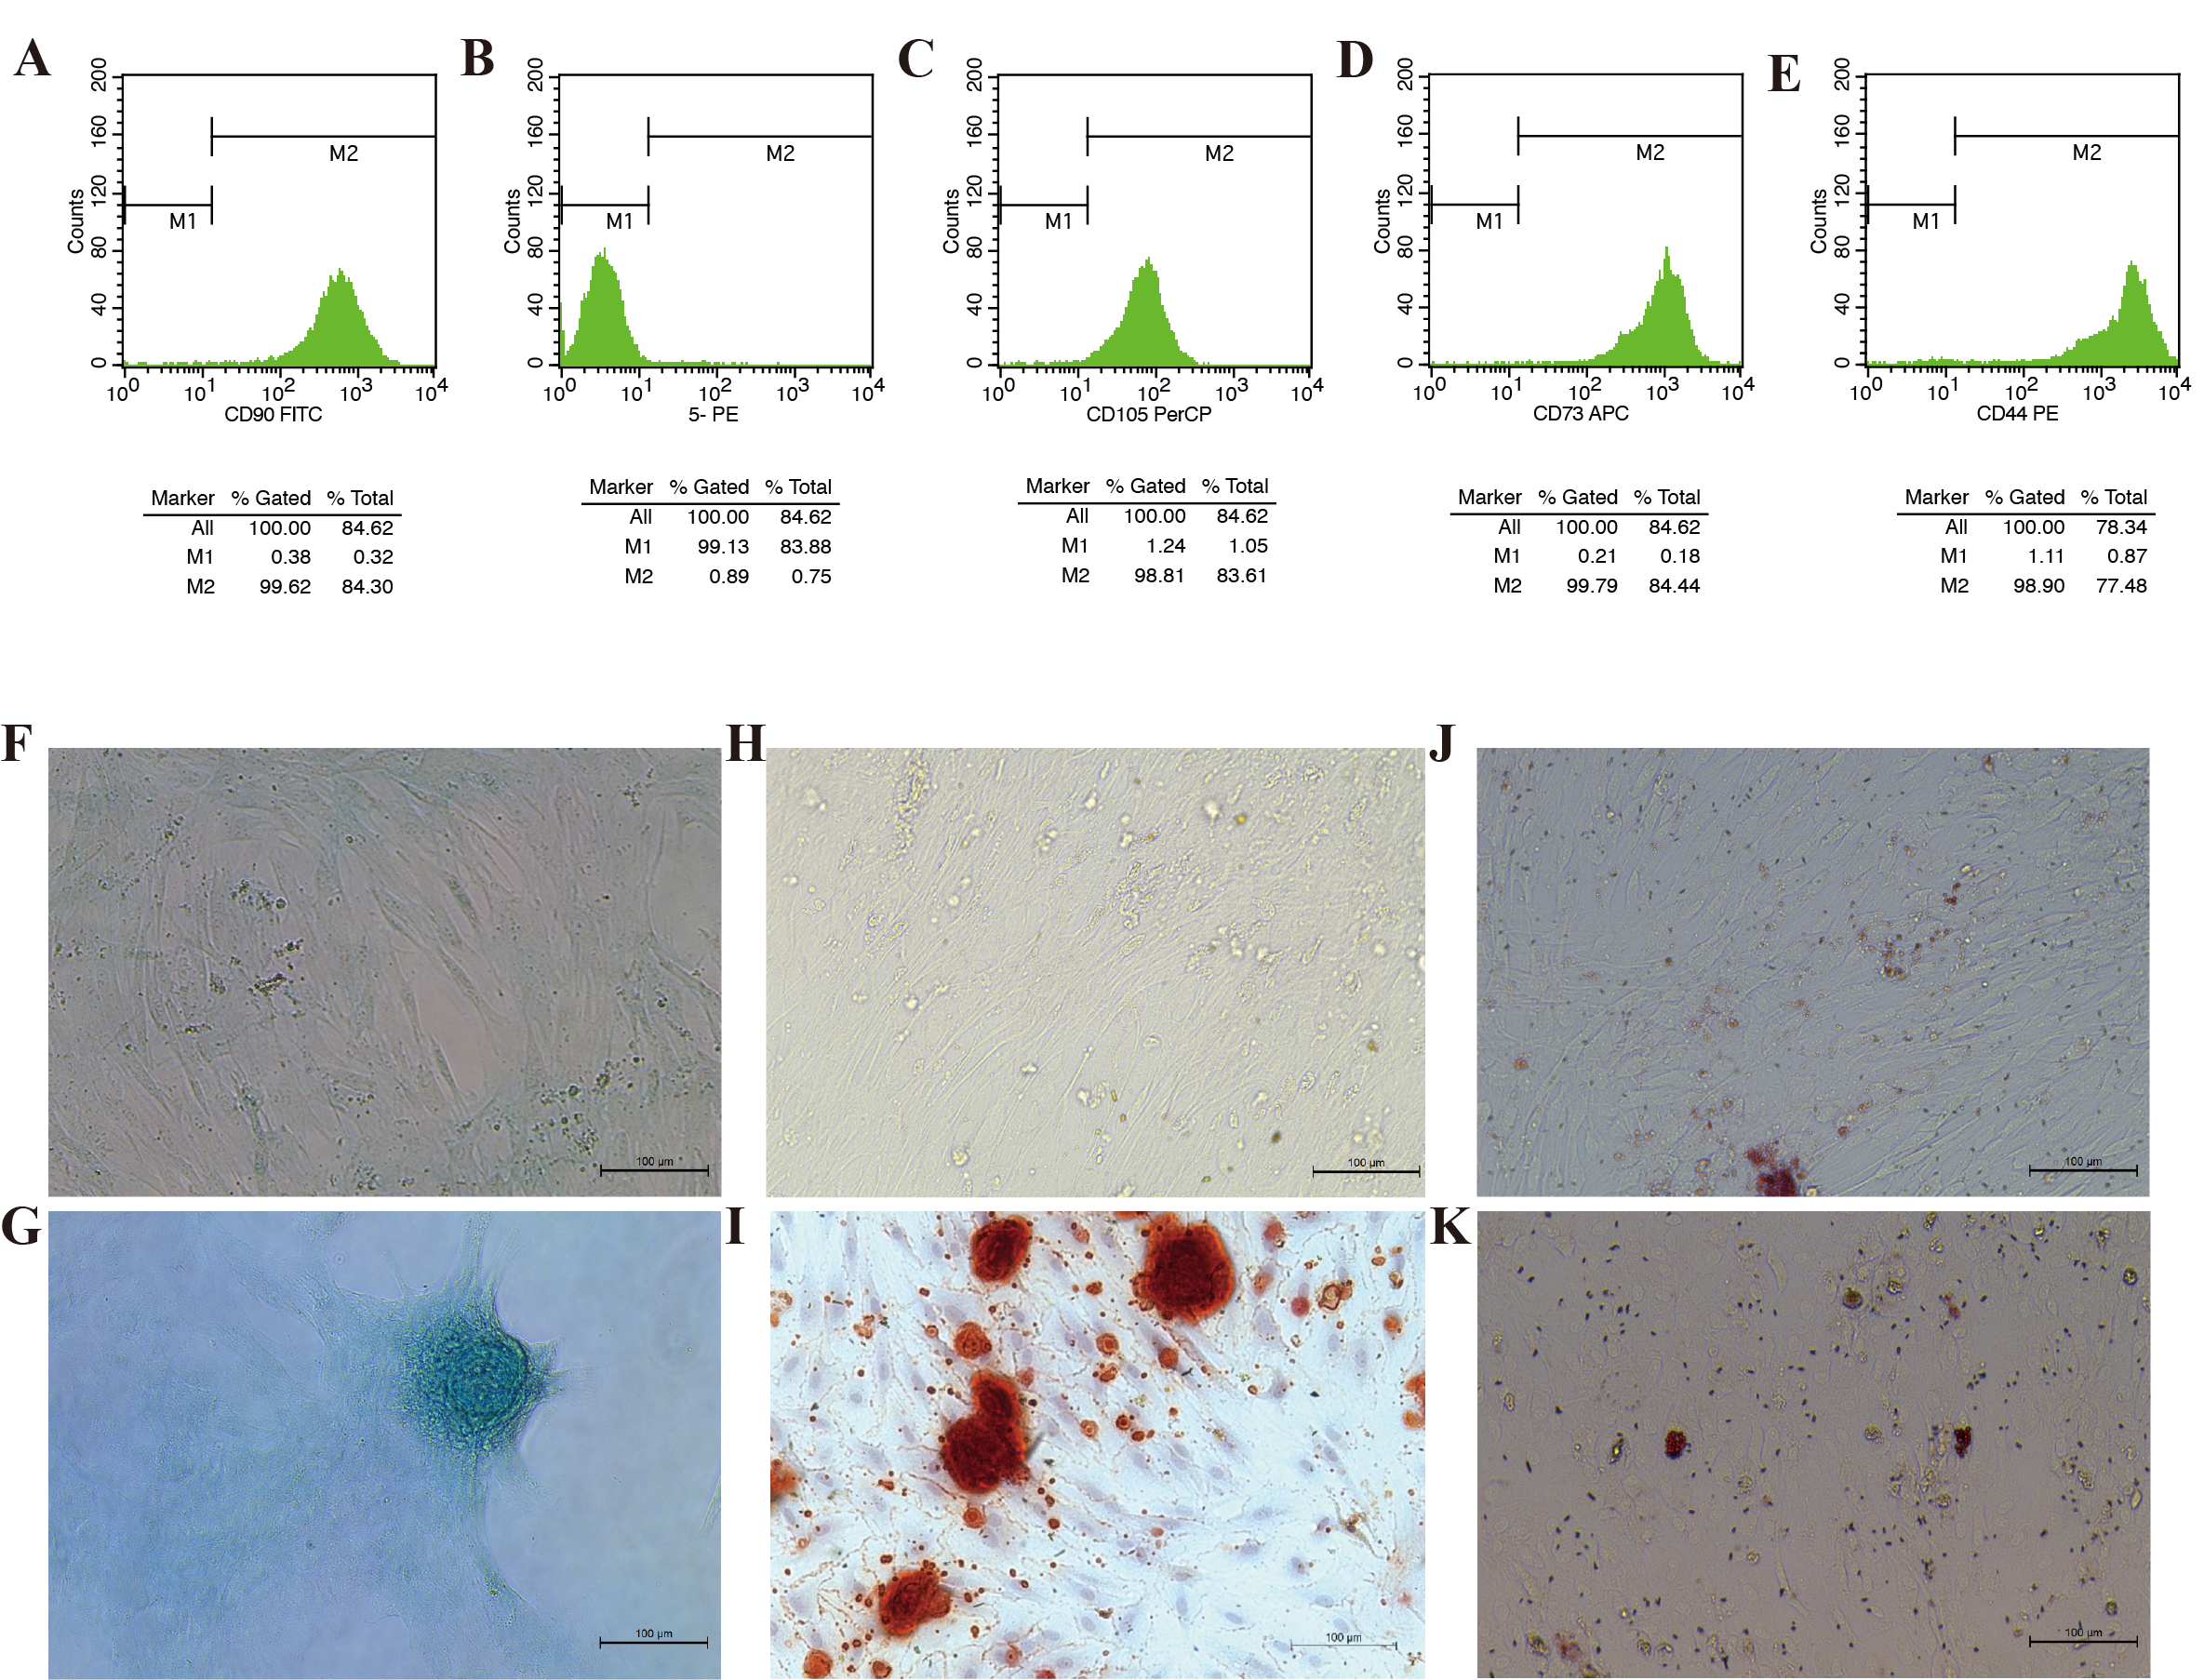
Identification of ADMSCs.
(A, C, D, E) Flow cytometry analysis of ADSMCs, defined as cells that are positive for the mesenchymal markers CD90, CD105, CD73, and CD44. (B) 5-PE: Negative for CD11b, CD19, CD34, CD45, and HLA-DR. All five markers show negative results. (F, G) ADMSCs were evaluated by a chondrogenic cell differentiation assay and stained with Alcian Blue. 10×, scale bar 100 µm. (H, I) ADMSCs were evaluated by osteogenic differentiation assays and stained with 0.2% Xylene Red. 20×, scale bar 100 µm. (J, K) ADMSCs were evaluated by an adipogenic differentiation assay and stained with Oil Red O. 40×, Scale bar 100 µm.
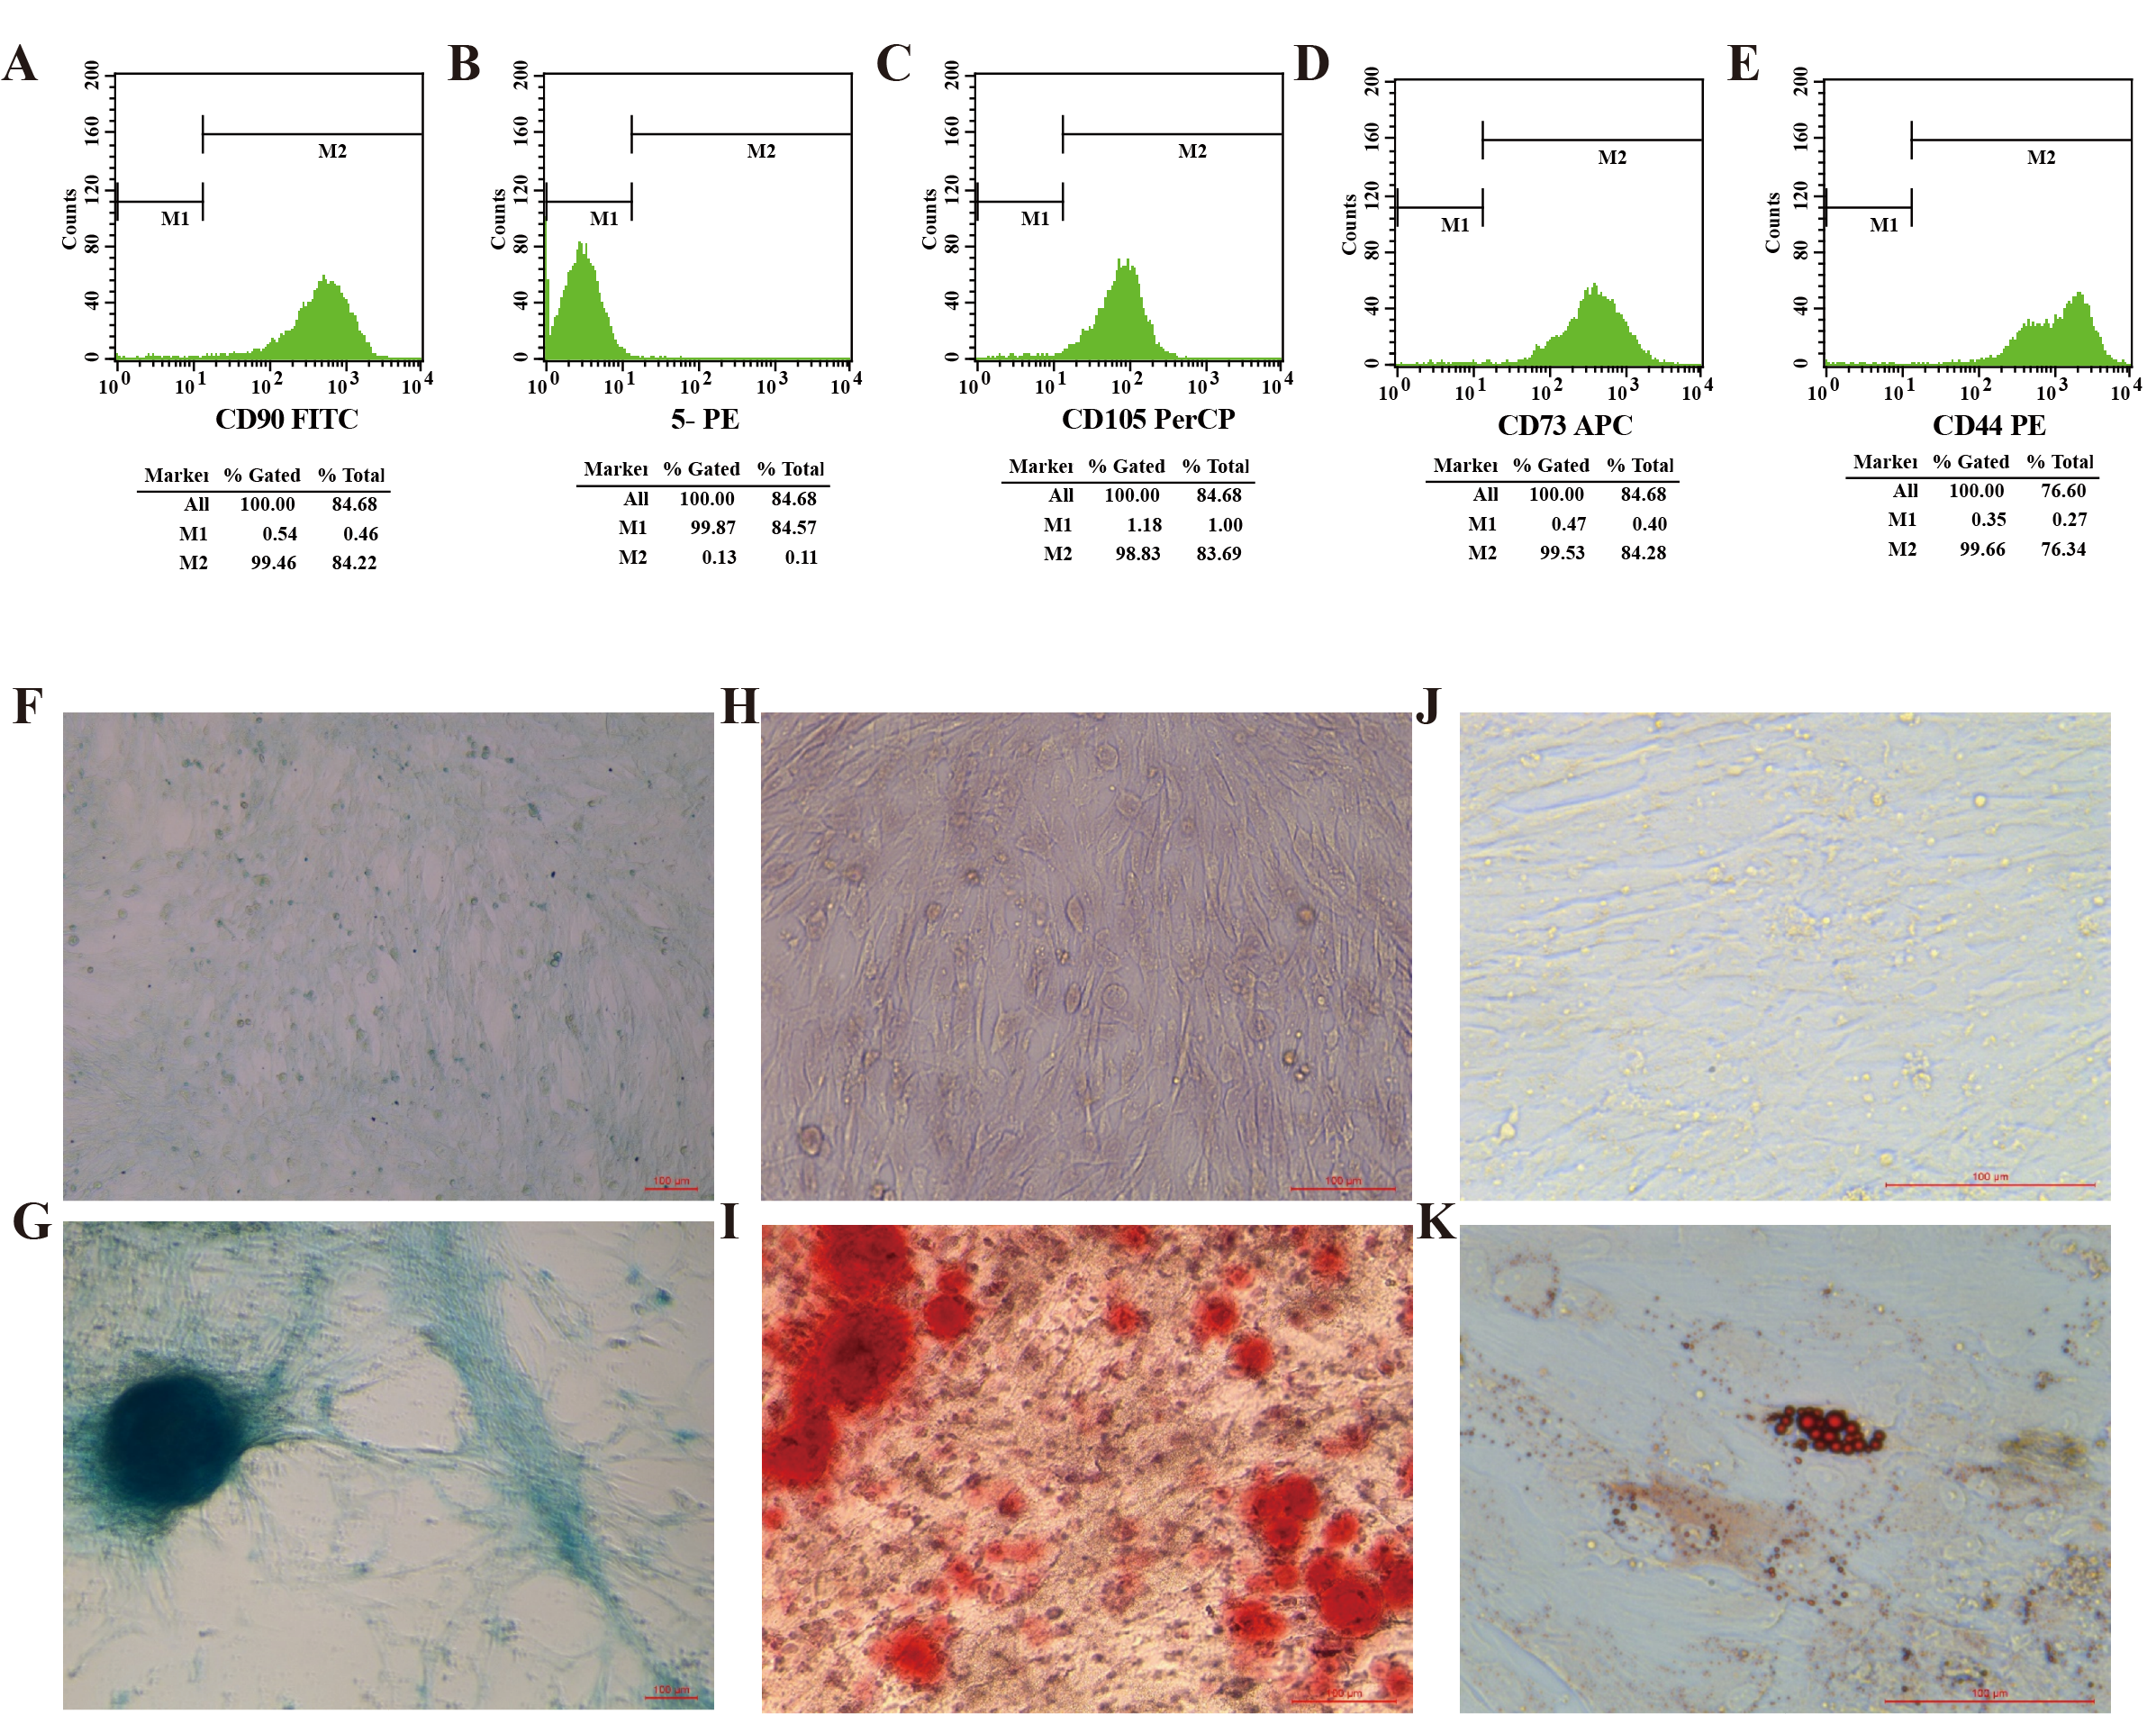
Identification of CMMSCs.
(A, C, D, E) Flow cytometry analysis of CMMSCs. Briefly, CMMSCs were positive for the mesenchymal markers CD90, CD105, CD73, and CD44 and (B) negative for CD11b, CD19, CD34, CD45, and HLA-DR. (F, G) CMMSCs were evaluated by a chondrogenic cell differentiation assay and stained with Alcian Blue. 10×, scale bar 100 µm. (H, I) CMMSCs were evaluated by an osteogenic differentiation assay and stained with 0.2% Xylene Red. 20×, scale bar 100 µm. (J, K) CMMSCs were evaluated by an adipogenic differentiation assay and stained with Oil Red O. 40×, scale bar 100 µm.
Identification of AMMSCs.
(A, C, D, E) Flow cytometry analysis of AMMSCs. Briefly, AMMSCs were positive for the mesenchymal markers CD90, CD105, CD73, and CD44 and (B) negative for CD11b, CD19, CD34, CD45, and HLA-DR. (F, G) AMMSCs were evaluated by a chondrogenic cell differentiation assay and stained with Alcian Blue. 10×, scale bar 100 µm. (H, I) AMMSCs were evaluated by an osteogenic differentiation assay and stained with 0.2% Xylene Red. 10×, scale bar 100 µm. (J, K) AMMSCs were evaluated by an adipogenic differentiation assay and stained with Oil Red O. 10×, scale bar 100 µm.
Identification of UCMSCs.
(A, C, D, E) Flow cytometry analysis of UCMSCs. Briefly, UCMSCs were positive for the mesenchymal markers CD90, CD105, CD73, and CD44 and (B) negative for CD11b, CD19, CD34, CD45, and HLA-DR. (F, G) UCMSCs were evaluated by a chondrogenic cell differentiation assay and stained with Alcian Blue. 10×, scale bar 100 µm. (H, I) UCMSCs were evaluated by an osteogenic differentiation assay and stained with 0.2% Xylene Red. 20×, scale bar 100 µm. (J, K) UCMSCs were evaluated by an adipogenic differentiation assay and stained with Oil Red O. 40×, scale bar 100 µm.
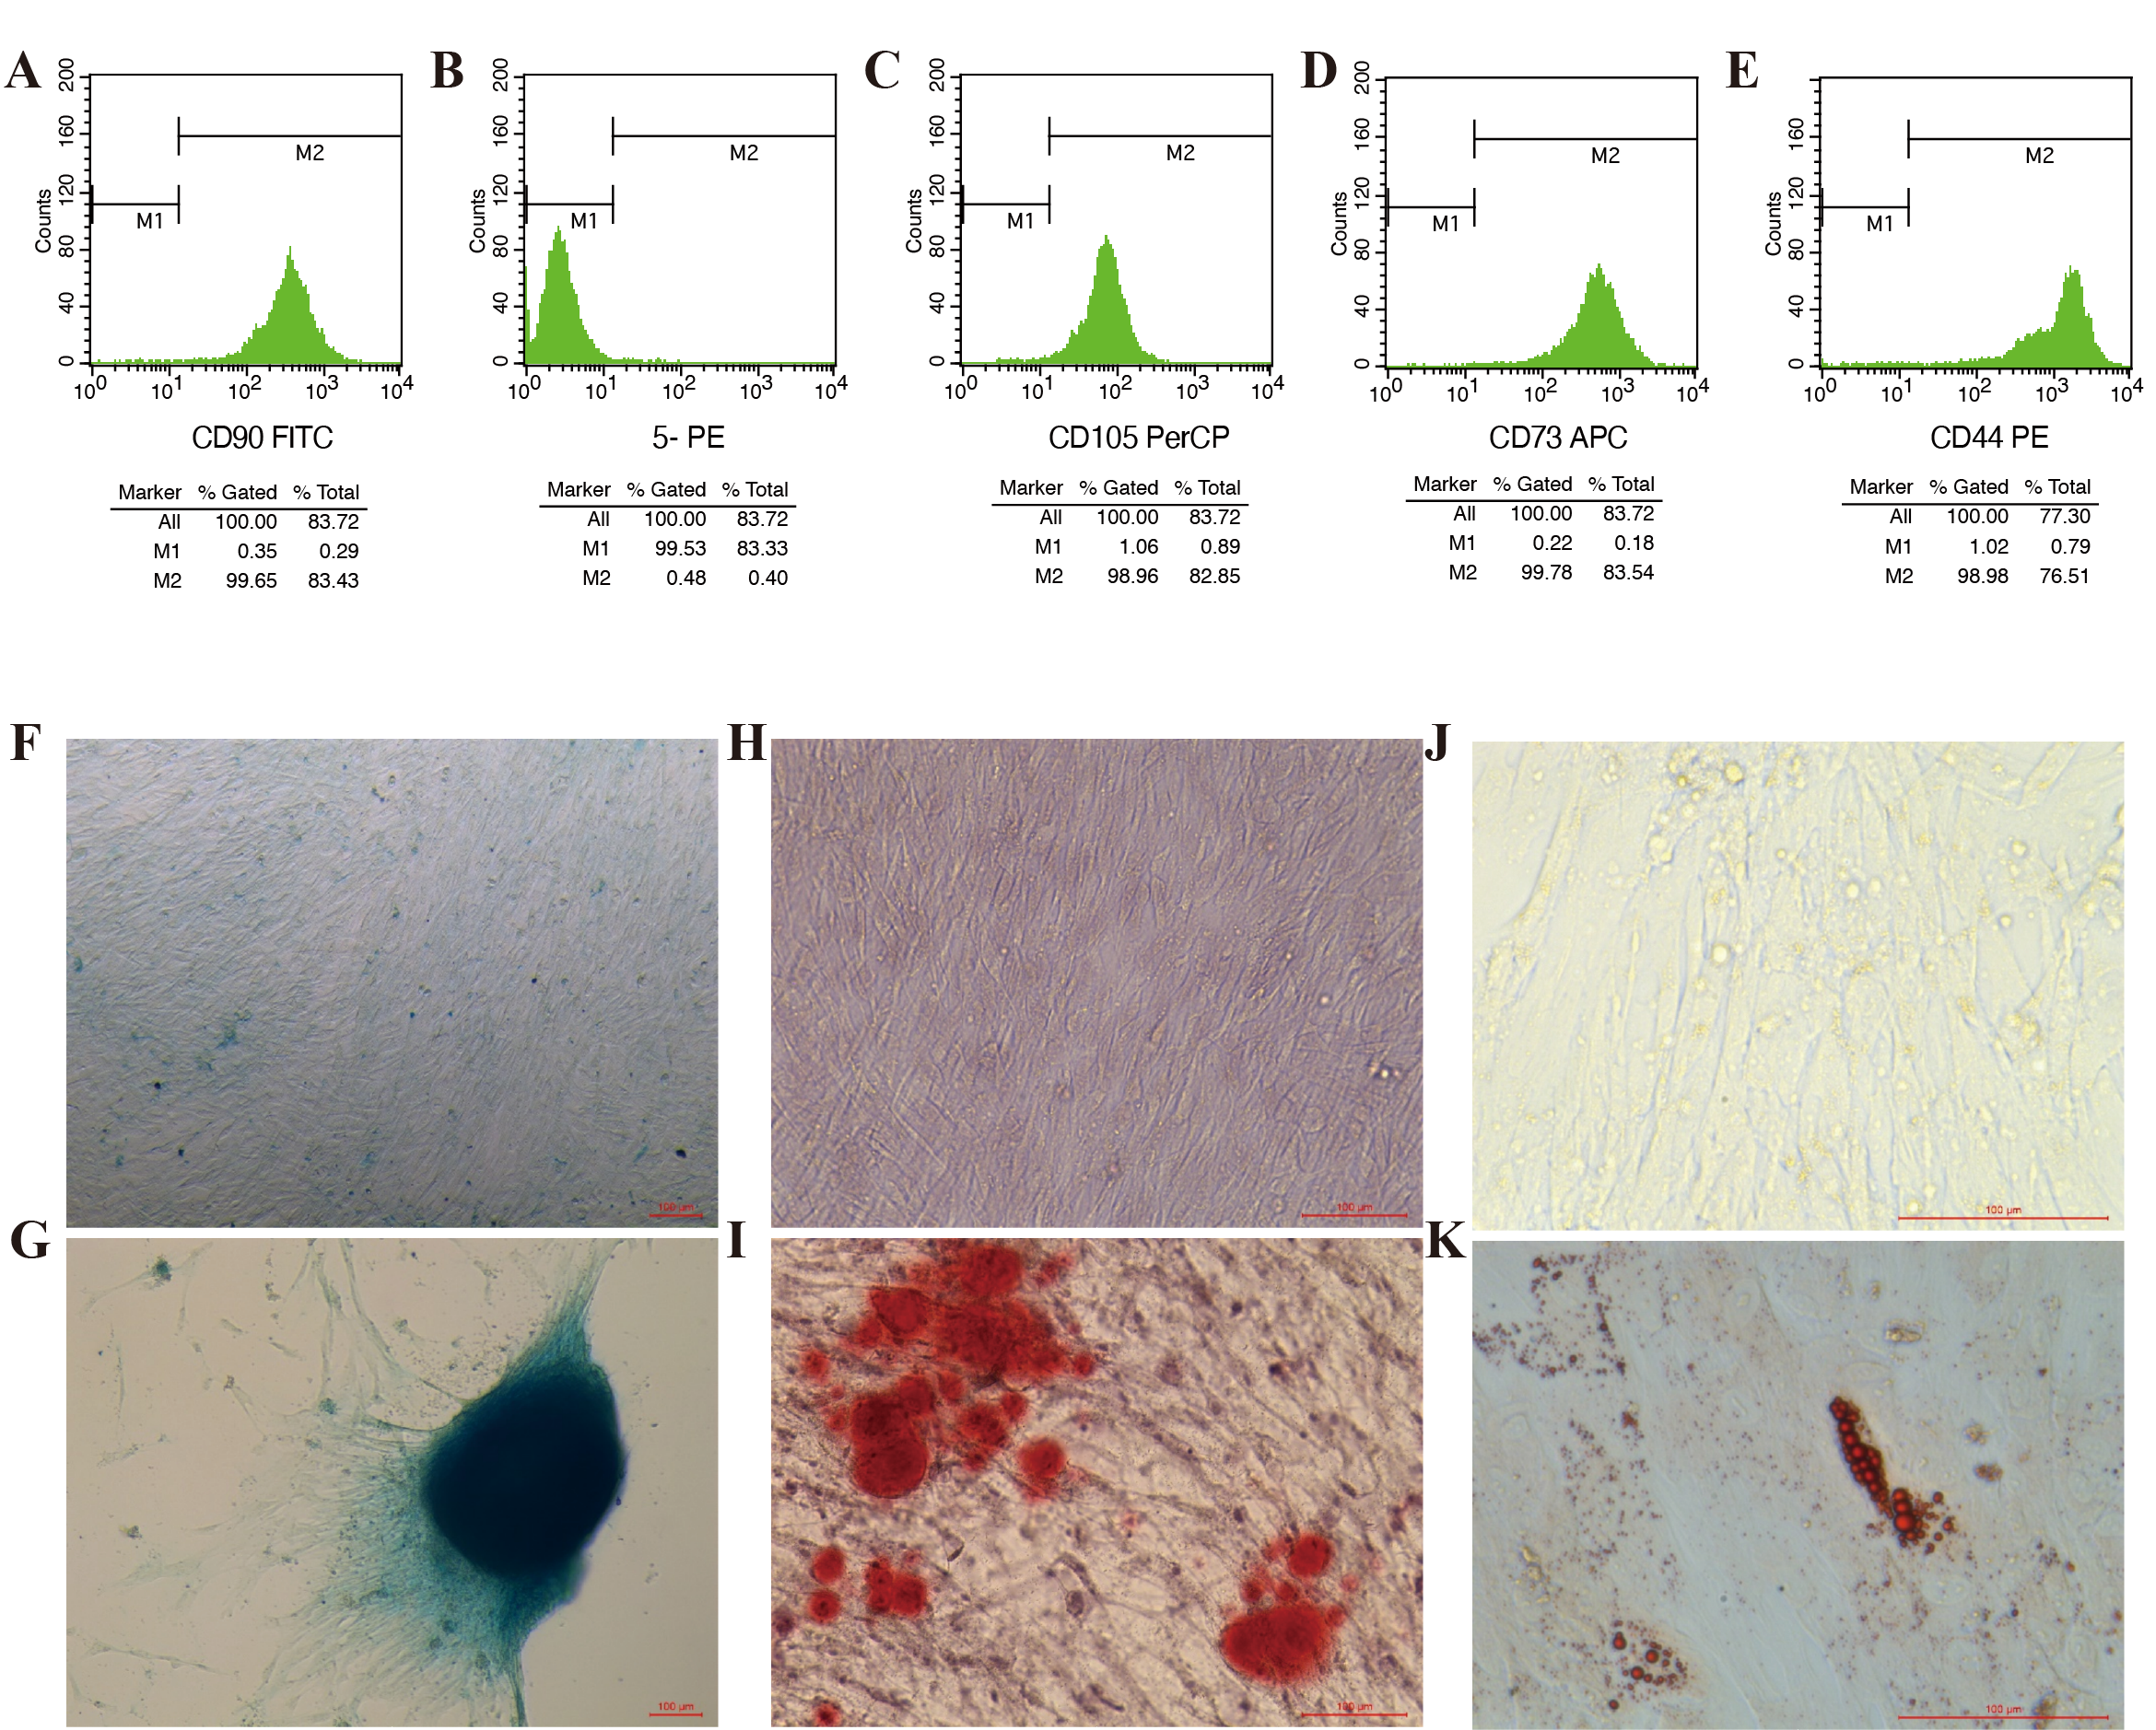
GO-BP enrichment analysis of gene modules.
(A) Bubble plot for Gene Ontology (GO) enrichment analysis (Biological Process (BP)) for module 10, module 11, module 12, and module 16. Horizontal coordinates indicate subgroups, vertical coordinates represent enrichment entries; the bubble size indicates the number of genes enriched for each entry, and bubble color, as shown on the right-hand LogP color scale, signifies the significance of enrichment for each entry.
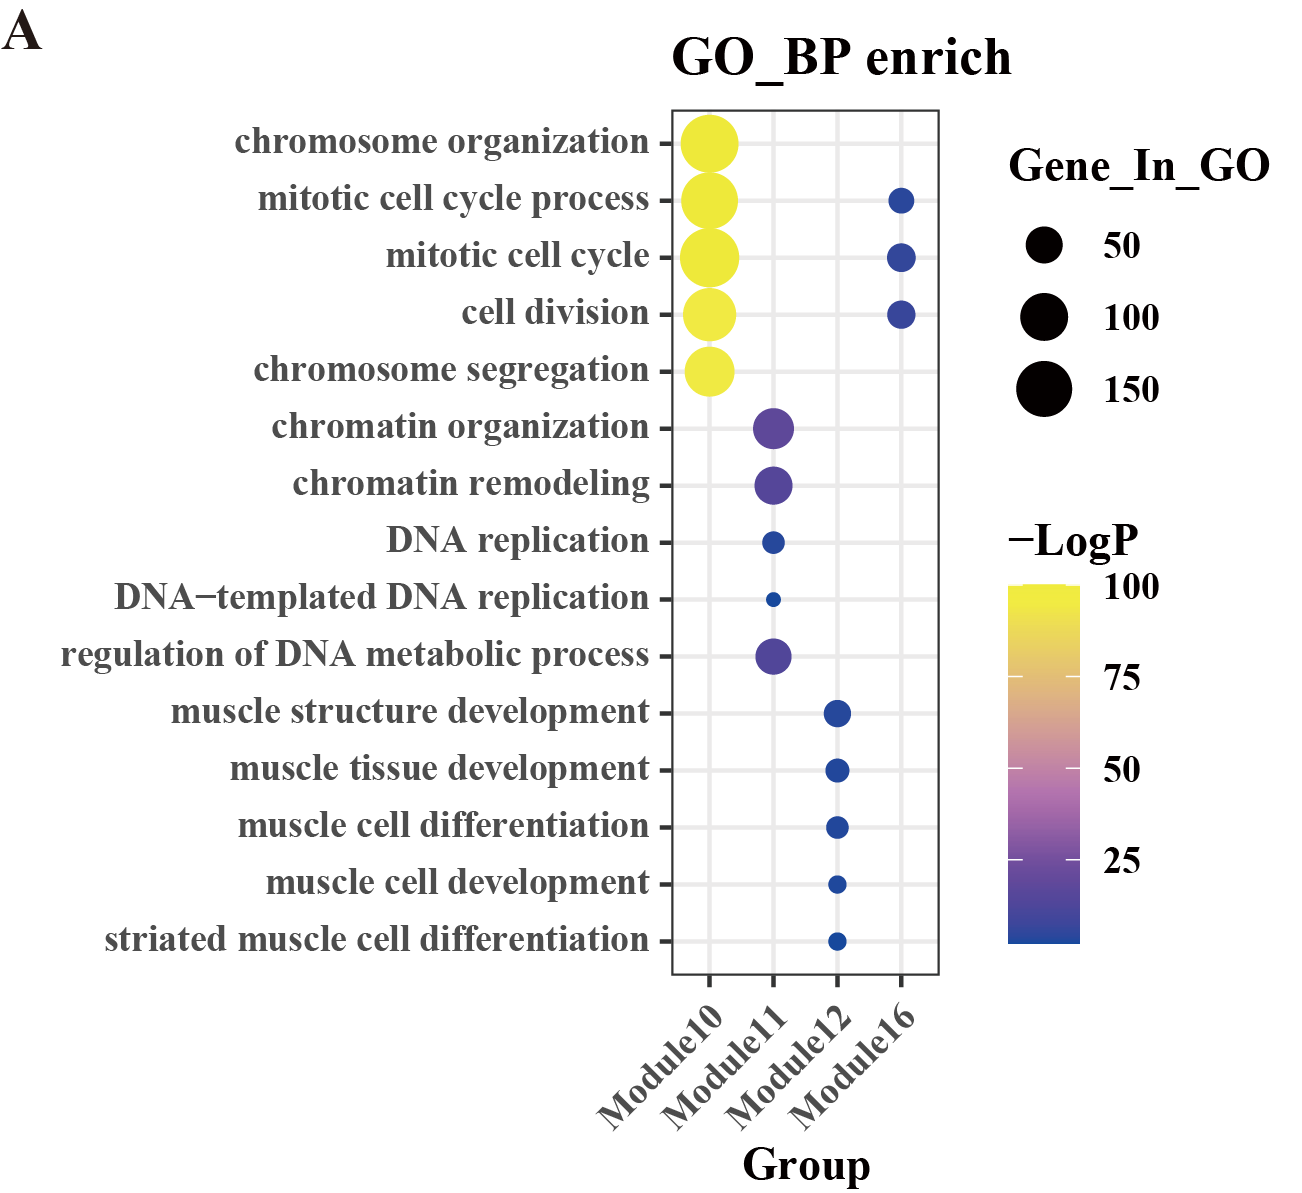