
iTRAQ-based proteomic analysis reveals the effect of ribosomal proteins on essential-oil accumulation in Houttuynia cordata Thunb.
- Published
- Accepted
- Received
- Academic Editor
- Altijana Hromić-Jahjefendić
- Subject Areas
- Agricultural Science, Biochemistry, Plant Science
- Keywords
- H. cordata, iTRAQ, Proteomics, Ribosomal proteins, Essential-oil
- Copyright
- © 2024 Guo et al.
- Licence
- This is an open access article distributed under the terms of the Creative Commons Attribution License, which permits using, remixing, and building upon the work non-commercially, as long as it is properly attributed. For attribution, the original author(s), title, publication source (PeerJ) and either DOI or URL of the article must be cited.
- Cite this article
- 2024. iTRAQ-based proteomic analysis reveals the effect of ribosomal proteins on essential-oil accumulation in Houttuynia cordata Thunb. PeerJ 12:e17519 https://doi.org/10.7717/peerj.17519
Abstract
Houttuynia cordata Thunb., also known as Yuxingcao in Chinese, occupies a pivotal role in Asian traditional medicine and cuisine. The aerial parts and underground stems of H. cordata exhibit remarkable chemical diversity, particularly in essential oil. Nevertheless, the mechanisms regulating essential oil biosynthesis in H. cordata remain unclear. In this study, we present a quantitative overview of the proteomes across four tissues (flower, stem, leaf, and underground stem) of H. cordata, achieved through the application of the isobaric tag for relative and absolute quantitation (iTRAQ). Our research findings indicate that certain crucial ribosomal proteins and their interactions may significantly impact the production of essential oils in H. cordata. These results offer novel insights into the roles of ribosomal proteins and their associations in essential oil biosynthesis across various organisms of H. cordata.
Introduction
The history of herbal medicine is rich and spans various cultures. It is notable that numerous contemporary pharmaceuticals were originally derived from these medicinal plants (Drasar & Khripach, 2019). As interest in the application of medicinal plants continues to grow, there is a pressing need for the analysis of frequently utilized botanical remedies. A multitude of herbs exhibiting a “medicine-food homology”, which ensures their safety for clinical use, have been meticulously investigated on a global scale (Hou & Jiang, 2013). H. cordata, a perennial herbaceous plant categorized under the Saururaceae family, is known to thrive in the damp and shaded locales of southwestern China. In traditional Chinese medicine, various parts of H. cordata are employed to alleviate swelling and pain, reduce inflammation, suppress coughs, and enhance diuretic effects (Wu et al., 2021b). Furthermore, the rhizomes and tender leaves of the plant are gathered as delectable spices and nutritious vegetables. Recent research has revealed its diverse array of attributes, including anti-allergic, anti-inflammatory, antiviral, antioxidant, anti-leukemic, and anti-cancer properties (Chen et al., 2013; Chiang et al., 2003; Kim et al., 2001; Li et al., 2005; Lu et al., 2006b; Ng et al., 2007; Zhuang et al., 2015). These diverse pharmacological activities are frequently linked to the chemical composition of H. cordata, which encompasses a range of compounds, including alkaloids, essential oils, and flavonoids (Bauer et al., 1996). Moreover, the bioactivities of H. cordata’s oil have been documented since 1921, including decanoyl acetaldehyde, myrcene, ethyl decanoate, ethyl dodecanoate, and more (Xu, 2012). The extraction methods, bioactivity, and distribution pattern of H. cordata’s essential oil has been studied for nearly a century. There was an obvious difference observed between the aerial stems and the underground parts, with elevated levels of 2-undecanone, myrcene, ethyl decanoate, ethyl dodecanoate, 2-tridecanone, and decanal. Additionally, 11 constituents were exclusively isolated from the leaves, whereas seven of the identified components in the underground-stems were absent from the leaves (Verma et al., 2017). As previously stated, numerous studies have been conducted on the chemidiversity and spatial distribution pattern of essential oils in vivo (Lin et al., 2022; Řebíčková et al., 2020), as well as their pharmacological activities in H. cordata (Wong et al., 2022; Wu et al., 2021a). However, the key regulatory proteins or enzymes study involved in the biosynthesis of essential oils still remains unclear.
Isobaric tags for relative or absolute quantitation (iTRAQ), recognized as one of the premier mass spectrometry techniques for facilitating high-throughput proteomic analysis, offers the benefits of heightened sensitivity and robustness (Evans et al., 2012). iTRAQ has found extensive application across various domains including animals, plants, and microorganisms (Baslam, Kaneko & Mitsui, 2020; Lü et al., 2021). In recent times, iTRAQ analysis has been employed in some medical plants to investigate proteomic shifts in Panax notoginseng seeds (Ge et al., 2021), assess protein abundance in the underground stems of Rehmannia glutinosa (Chen et al., 2021), explore proteomic changes during the development haustorium of Taxillus chinensis (Pan et al., 2022), and conduct proteome profiling of Anemone flaccida (Zhan et al., 2016). However, iTRAQ has some limitations. Firstly, the commercial reagent is relatively expensive. Second, the maximum number of samples that can be labelled is limited. Thirdly, sample handling is complicated and time consuming. Finally, coverage of low abundance proteins can be poor (Chen et al., 2021; Evans et al., 2012). Despite these limitations, iTRAQ remains a valuable and powerful tool in quantitative proteomics.
The objective of this study is to employ iTRAQ proteomic technology to analyse the spatial proteome profiling of distinct medicinal parts in H. cordata. Furthermore, the correlation between protein expression patterns and essential oil accumulation across the distinct parts of H. cordata will be explored, thus deepening our comprehension of the molecular regulation mechanisms underlying their biosynthesis of essential oils.
Materials and Methods
Plant material and sample source
H. cordata wild type plants were grown in medical plant garden of pharmacy college, Navy Medical University, under the natural climate. Different tissues samples for flower, stem, leave and underground-stem were collected from flourishing plants in summer. They were put in a 1.5 ml tube and immediately in liquid nitrogen and stored at −80 °C until further use.
CDS library prediction
The RNA of flower, stem, leave and underground-stem tissues were extracted by Trizol kit as described. Total amounts and integrity of RNA were assessed by the RNA Nano 6000 Assay Kit of the Bioanalyzer 2100 system (Agilent Technologies, Santa Clara, CA, USA). cDNA library construction started with mRNA purification and then doble- strand cDNA synthesis and was quantified to ensure the quality of library. The separate libraries are pooling equivalently according to the concentration of samples, then being sequenced by the use of the Illumina NovaSeq 6000. The transcriptome assembly was performed using Trinity software (version 2.6.6) (Grabherr et al., 2011). Several databases were used to annotate gene functional annotation: Nr (NCBI non-redundant protein sequences); Nt (NCBI non-redundant nucleotide sequences); Pfam (Protein family); KOG/COG (Clusters of Orthologous Groups of proteins); Swiss-Prot (A manually annotated and reviewed protein sequence database); KO (KEGG Ortholog database); GO (Gene Ontology).
CDS represents the sequence encoding protein. CDS prediction firstly is mapped into NR and Swissprot. protein library. If mapped successfully, the open reading frame (ORF) of the transcript is isolated and the coding region sequence is translated into amino acid sequence (5′–>3′). For the sequences without successfully, the ORF was predicted by TransDecoder (3.0.1) software.
Protein extraction
Protein extraction was carried out according to the protocol of Isaacson et al. (2006) with some modifications. Frozen tissues were homogenized with a plant-tissue grinder. Protein extraction buffer was added to the sample and mixed gently in a vortex for 5∼10 min. Adding two volume of phenol saturated with Tris–HCl (pH 8.0) to each sample and then mixing for 10 min, followed by centrifugation at 14,000 g for 10 min at 4 °C. The upper phenolic phase was picked and mixed with 1.2 volume of protein extraction buffer, and then centrifuged. The upper phenolic phase was again collected and mixed with pre-cooled 0.1M ammonium acetate in methanol, followed by the incubation for 6 h at −20 °C. The precipitate was obtained by centrifugation at 14,000 g for 10 min and washed 1–2 times by pre-cooled methanol. Then the precipitate was washed 2–3 times by acetone containing 0.07% β-Mercaptoethanol and dried at room temperature. Protein concentration was determined by the BCA method (Smith et al., 1985).
Protein digestion
Protein digestion was carried out according to the method of FASP (Wiśniewski et al., 2009). Dried protein powder sample was resolved in 8M urea with Tris-Hcl (pH 8.0). 1M reducing reagent (DTT) was added to cell protein lysates and incubated at 55 °C for 1 h, followed by 5 µL 1M cysteine-blocking reagent (IAA) for 30 min at 25 °C in dark. Then the samples were transferred into 10 KDa ultrafiltration tube and centrifuged 14,000 g for 15 min at 4 °C. Then 100 µL 8M urea was added twice to the ultrafiltration membrane to protein denaturation completely. 0.5 M TEAB was added and centrifuged three times at 14,000 g for 15 min to clean denaturation reagent. Sequencing grade trypsin (Enzyme: Substrate = 1:50) was incubated with samples at 37 °C overnight. Next day, the peptide samples were collected and added 1% formic acid to stop the reaction.
iTRAQ labeling and high pH reverse phase separation by HPLC
The peptides were subjected to vacuum centrifugation to facilitate drying. Subsequently, the dried peptides were suspended in TEAB buffer and labeled by iTRAQ 8-plex kits in accordance with the manufacturer’s instructions (AB SCIEX Inc., Framingham, MA, USA, AB SCIEX Inc., USA). The labeling reaction was initiated by the addition of a reagent vial to the digested peptides, which were then incubated at room temperature for a period of two hours. Following this, 100 µL of water was added to halt the reaction. The labeling scheme was as follows: The tags used were 113 and 114, F1 and F2; Tags 115 and 116, L1 and L2; Tags 117 and 118, S1 and S2; Tags 119 and 121, Us1 and Us2. Following this, all the samples were pooled for mass spectrometry analysis. High pH reverse phase separation by HPLC was performed in accordance with the previously decribed methodology (You et al., 2017), with certain modifications. The Agilent 1100 HPLC with Agilent Zorbax Extend C18 column (2.1 × 150 mm, 5 µm) were used for peptide separation at a flow rate of 1.0 ml/min. The mobile phases A was 20 mM ammonium formate (pH = 10), while the mobile phases B was 80% acetonitrile with 20 mM ammonium formate (pH = 10). The entire gradient course lasted for 65 min, with the following profile: 5 min at 5% B, 30 min at 15% B, 45 min at 38% B, 46 min at 90% B, 54.5 min at 90% B, 55 min at 5% B, and finally 65 min at 5% B.
LC–MS/MS analysis
Microflow LC-MS/MS analysis was conducted by coupling Eksigent Micro LC-1D plus system to Triple TOF 5600 System (AB SCIEX Inc., Framingham, MA, USA). Samples for the proteome analysis were resuspended in 2% acetonitrile containing 0.1% formic acid. Peptide loading and washing were done on a trap column (ChromeXP C18_CL-3 µm, 120A, 350 µm × 0.5 µm, AB,SCIEX) at a flow rate of 10 µL/min in 2% acetonitrile (0.1% formic acid) for 7 min. Peptide separation was performed on an analytical column (0.075 × 150 mm, 3 µm, 120A, AB SCIEX Inc.) at a flow rate of 5 µL/min using a 120 min gradient from 5% to 80% solvent B (solvent A: 2% acetonitrile with 0.1% formic acid in LC-MS grade water; solvent B: 98% acetonitrile with 0.1% formic acid in acetonitrile) for proteome analysis. A spray voltage of 2.3 kV and ESI ion source temperature of 150 °C were employed to facilitate the ionisation of peptides. A switch from MS to MS2 scanning was automatically initiated based on the data collected from the instrument. For the full proteome samples, full scan MS spectra (m/z 350–1,500) were acquired. In the Time of Fight detector, high-resolution MS2 spectra were acquired for the 40 most abundant precursor ions. This analysis was conducted with the objective of fragmenting precursors with charge states between 2 and 5.
Analysis of proteomic data
Peptide and protein identification and quantification data files were searched with Protein Pilot software (v.5.0) using default parameters (Zhang et al., 2014). MS/MS spectra were searched against CDS library (Hc. blast.pep.fasta). Trypsin was the only specific protease and iTRAQ-8-plex (peptide labelled) was chosen as sample labeling type (FDR ≤ 1%). The annotations of the identified proteins, combined with the result of BLAST alignments. The screening criteria for differential expression proteins (DEPs) was —Fold Change (FC)— ≥ 2 and a p-value ≤0.05 in aerial parts (Leaf, Stem, Flower) compared to underground -stem. The Weighted Gene CoExpression Network Analysisn (WGCNA) of identified proteins was performed with the R package WGCNA (https://cran.rstudio.com/web/packages/WGCNA), and further bioinformatic analysis of DEP was performed using the OECloud tools (https://cloud.oebiotech.cn/), based on the Gene Ontology (GO) categories and KEGG Ortholog database.
Bioinformatic analysis of different expression proteins
The KEGG pathway enrichment profile of DEPs was analyzed by OECloud tools with FDRs less than 0.05, and DEPs data was displayed using volcano plots and Wayne diagram with the help of the image GP. The prediction of functional protein association networks was analyzed by the STRING database (http://string-db.org/).
Results
Plant morphology and chemical composition
The general morphology of the H. cordata plant during its flowering period is illustrated (Fig. 1A). The plant is divided into four sections: flowers, stems, leaves, and underground stems (Us). Flowers, stems, and leaves are classified as aerial parts (AP). Medicinal components application in both AP and Us, were recognized for their heat-clearing and detoxifying properties in traditional Chinese medicine. Among the constituents of H. cordata essential oil, the most predominant compounds were 2-undecanone (23.96–36.07%), β-myrcene (12.57–14.29%), bornyl acetate (6.03−8.61%), and β-pinene (trace - 23.29%) (chemical structures shown in Fig. 1B). The previous findings indicated that the essential oil content is higher in the aerial parts of H. cordata compared to its underground stems (Lu et al., 2006a). These findings suggest that the substantial variation of essential oil content could potentially be linked to the differential expression of proteins across distinct plant parts in H. cordata.
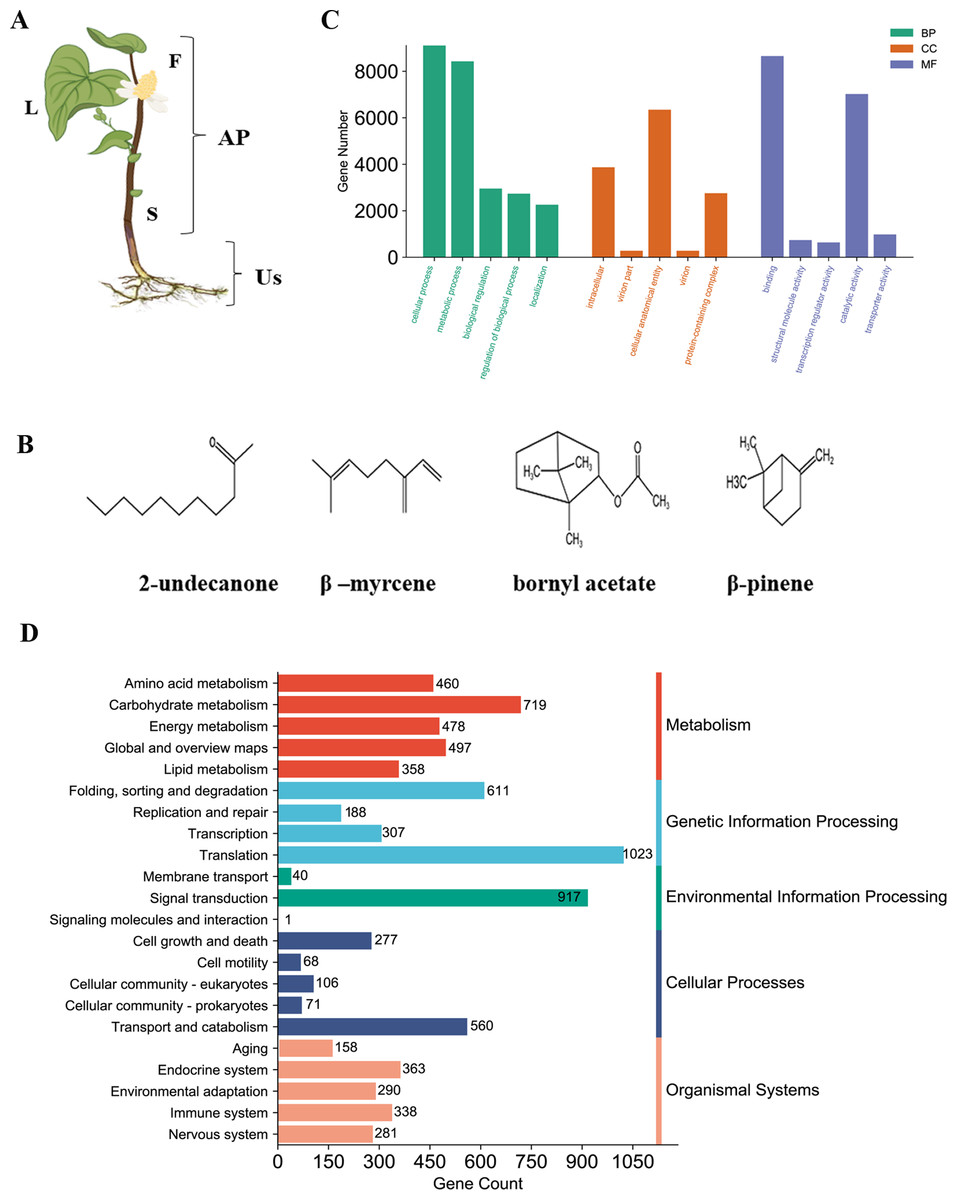
Figure 1: Phenotype and chemical components and RNA-seq analysis of H. cordata.
(A) Tissue samples analyzed according to morphology group, F, Flower; S, Stem; L, Leaf; and Us, Underground-stem. AP, Aerial parts; Us, Underground-stem. This image was drawn following images available at the Plant Photo Bank of China: http://ppbc.iplant.cn/sp/15036. (B) Structures of the major chemical components of H. cordata. (C) GO annotation classification includes biological process (BP), cellular component (CC), molecular Function (MF). (D) KEGG pathway classification was divided into five branches.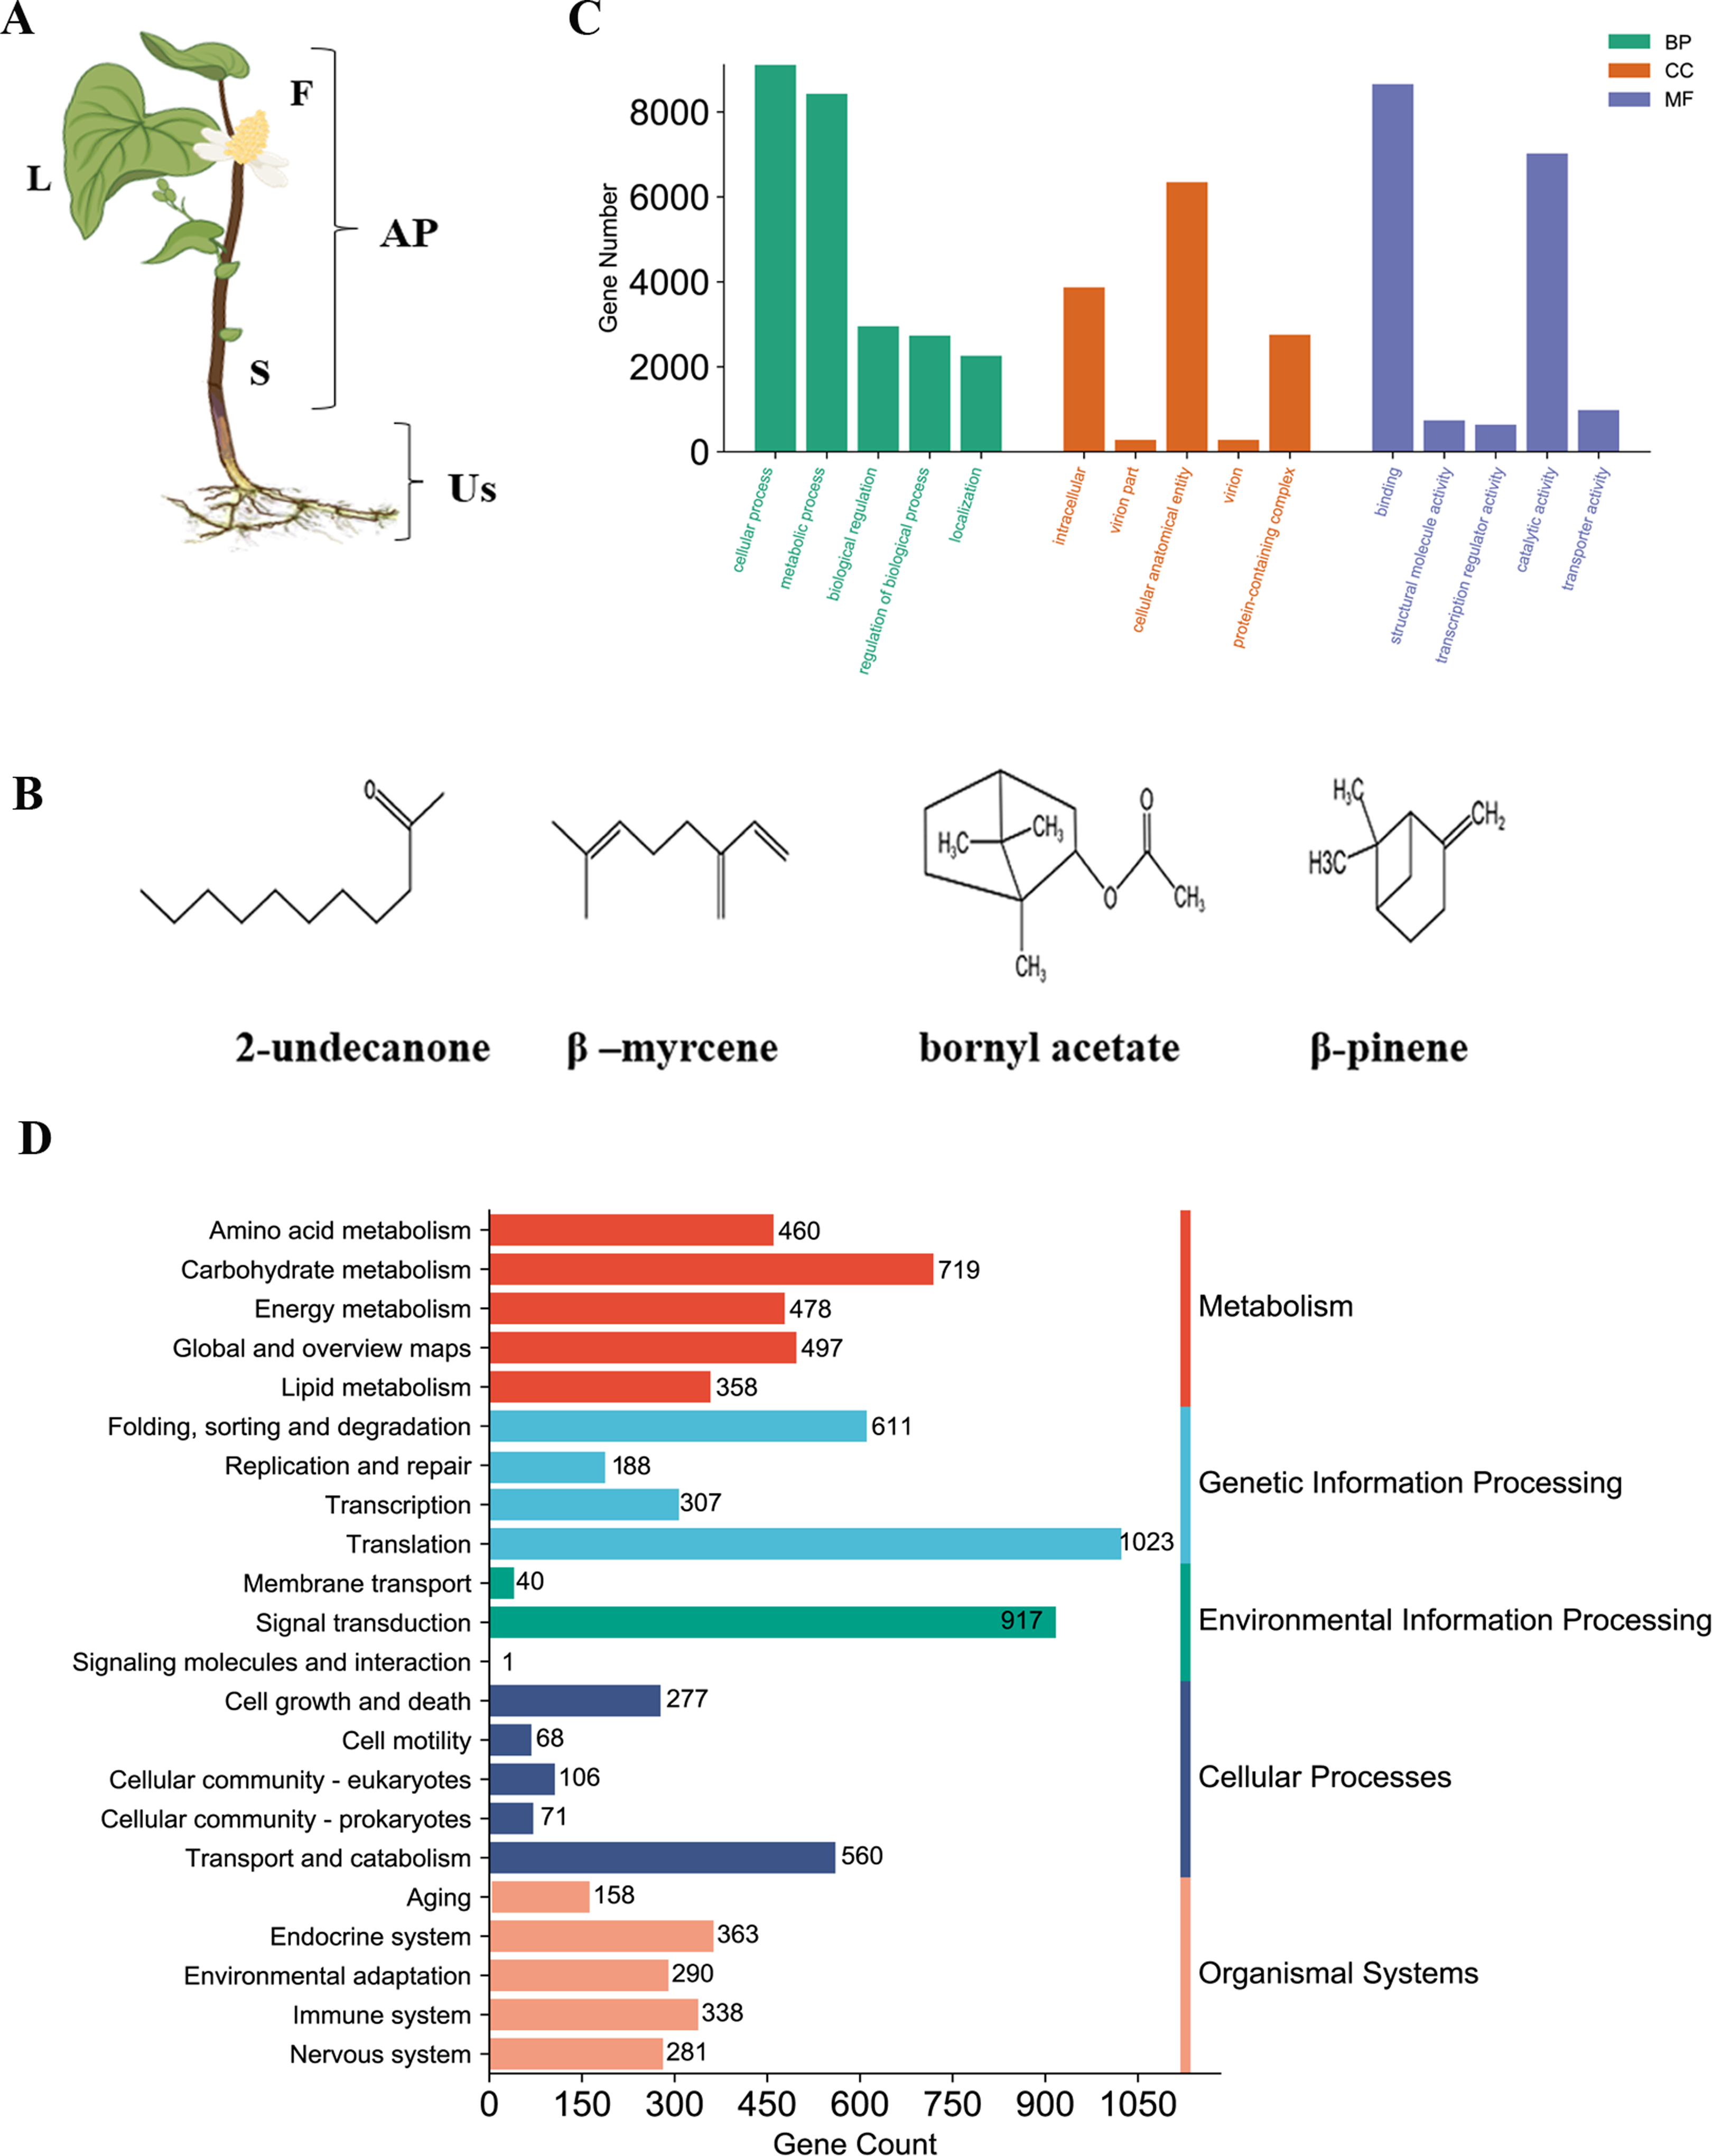
Assembled transcriptome analysis
To perform proteomics analysis, RNA-seq is carried out to build non-model plant proteins identification search database. Based on transcriptome result, 90,067 transcripts were assembled in tissues pool (flower, stem, leave and underground-stem) of H. cordata, of which 33,493 were unigenes that represents the longest transcript of each gene. More than 50% of unigenes were distributed between 300–1000 bp (Fig. S1A). 21,661 unigenes (64.67%) were annotated by Nr (NCBI non-redundant protein sequences) database, while annotated 13,290 unigenes were screened out by Nt (NCBI nucleotide sequences) database. 15,756 were annotated by GO (Gene Ontology) and involved in cellular and metabolic process (Fig. S1B and Fig. 1C). 8,928 unigenes were mapped to KO and KEGG (Kyoto Encyclopedia of Genes and Genomes) pathway which mainly participated in translation and signal transduction (Figs. 1C and 1D). In total of 4,177 unigenes existed in multiple databases. 19,271 peptides sequence of CDS were predicted through Nr and SwissProt. Assembled transcriptome database serves as an extensive public repository, serving as a valuable search resource for proteomic studies of H. cordata.
Overview of proteomics analysis
The proteomics analysis identified a total of 3,261 proteins across the four parts (flower, stem, leaf, and underground-stem) of H. cordata. Notably, the expression clusters exhibited significant distribution shifts among the various plant parts, as shown in Fig. 2A. In terms of GO categories, 1,470 proteins were involved in biological processes, 1,194 proteins were linked to cellular components, and 2,247 proteins were associated with molecular functions (Fig. S2A). Moreover, 1,684 proteins were assigned to KEGG pathways, with 31 notable signalling pathways exhibiting significance (p value ≤ 0.05). The three leading pathways were those of dihydrolipoamide dehydrogenase, photosystem I P700 chlorophyll apoprotein A1, and the 26S proteasome complex subunit DSS1 (Fig. S2B). To assess the correlation coefficients among the expressed proteins across various parts of H. cordata, WGCNA analysis was conducted. This analysis classified the 3,930 proteins into five distinct modules, revealing correlations that ranged from high to low among the MEturquoise proteins. Notably, the proteins expressed in the underground-stem exhibited a lower correlation coefficient with those in the aerial parts (Fig. 2B and Fig. S3).
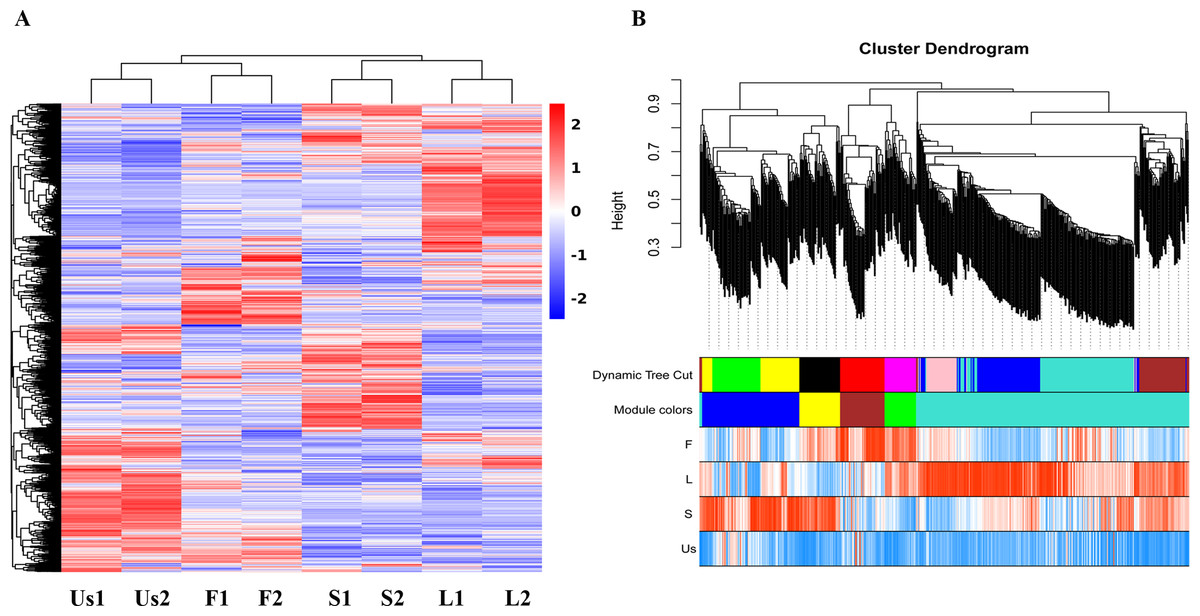
Figure 2: Cluster maps of identified proteins in each tissue of H. cordata.
(A) Heatmaps of proteins in different tissues. (B) Visualization of WGCNA results.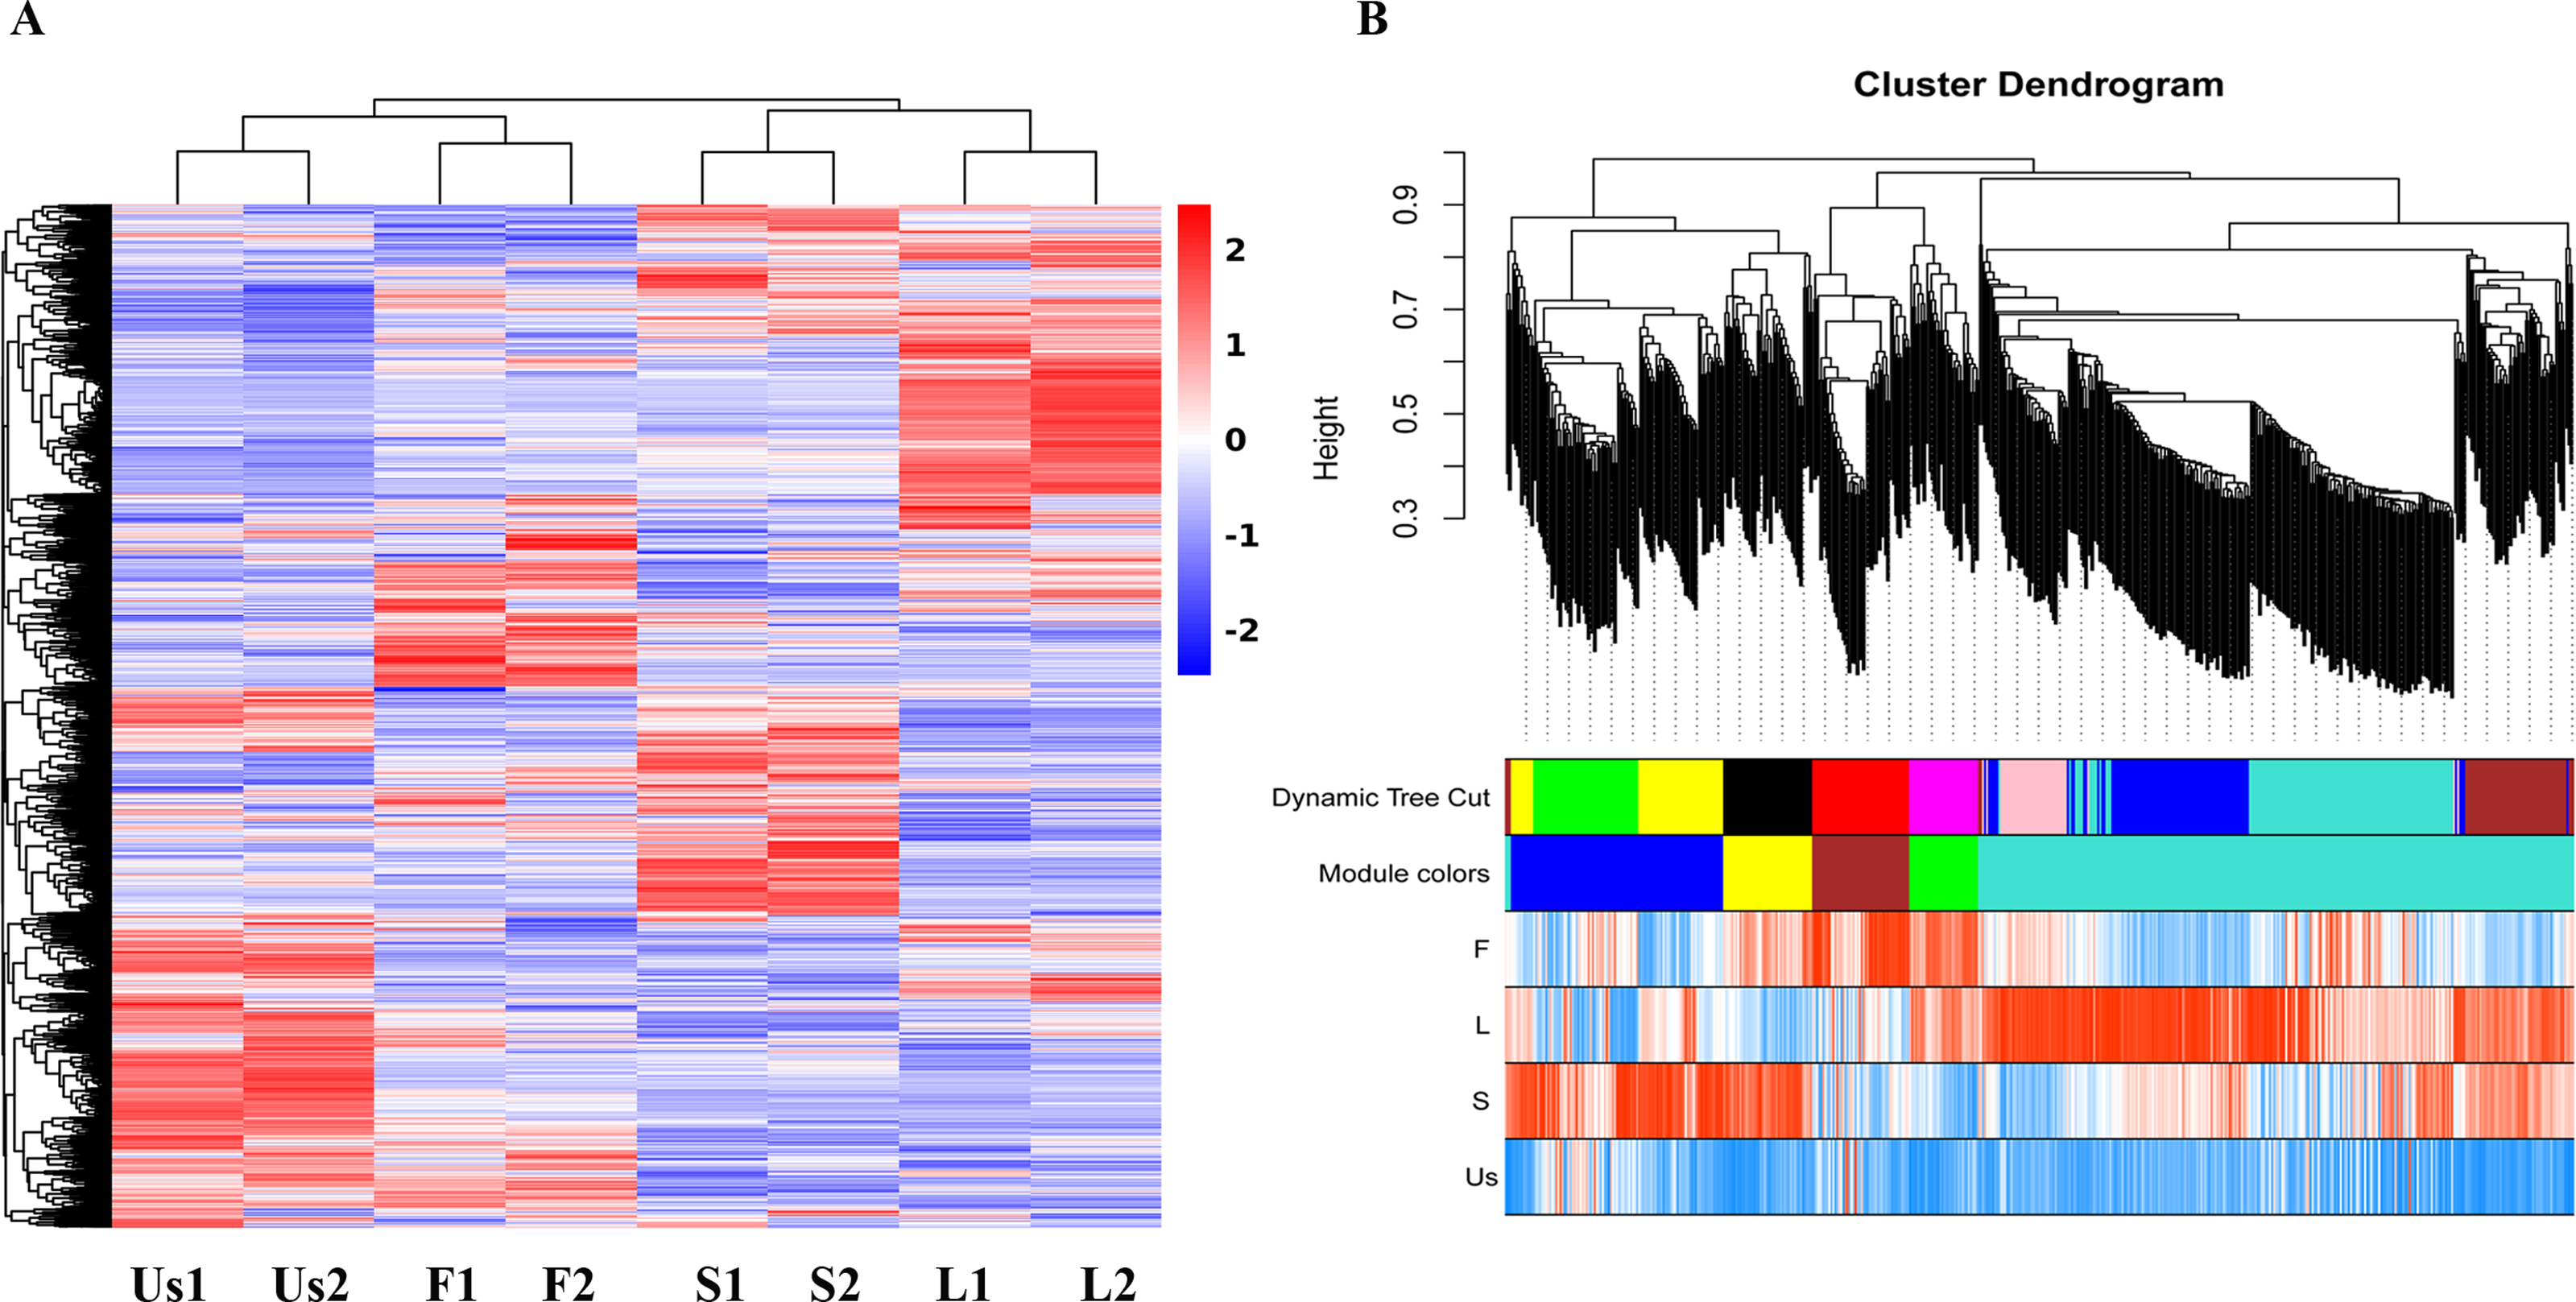
DEPs analysis of aerial parts and underground-stem
A significance cutoff was established with criteria including a fold change ≥ 1.5 and a p-value ≤ 0.05 (t-test), along with a false discovery rate of ≤ 1%. Compared with the proteins in underground-stem, 306 proteins were up-regulated in leaf, 192 were up-regulated in flower, and 266 were up-regulated in stem, there were 61 proteins increased both in leaf and stem (Fig. 3A). In comparison to the underground-stem, ribosomal proteins L23A and S28 displayed a notable upregulation in flower tissue. Similarly, proteins L1, L30e, L23A, L4, and L29 exhibited upregulation in both the stem and leaf. Conversely, P3-like and S8 were found to be downregulated in the stem and leaf (Figs. 3B–3D). Furthermore, the differential abundance proteins (DAPs) were associated with KEGG pathways, with 251 proteins being mapped to these pathways. Notably, this study revealed 12 significant signalling pathways (p-value ≤ 0.05), with the differentially expressed proteins (DEPs) being most prominently enriched within the large subunit ribosomal protein group (Fig. 3E). The findings suggest that large subunit ribosomal proteins might play a role in influencing essential oil accumulation in aerial parts (AP).
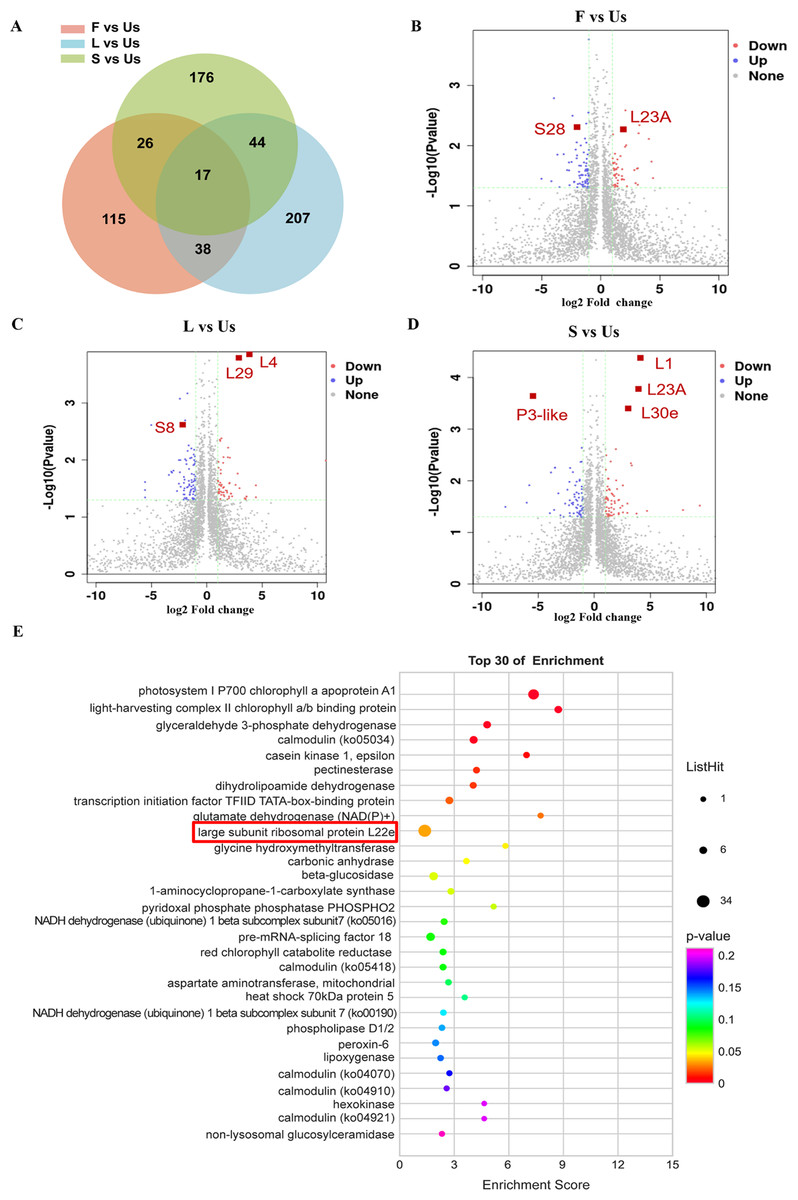
Figure 3: Differentially expressed proteins analysis of different tissues in H. cordata.
(A) Venn diagrams showing the numbers of differentially expressed proteins. (B, C, D) Volcano plot of differentially expressed proteins (n = 2). (E) KEGG pathway enrichment analysis of differentially expressed proteins.
The expression profile of interesting proteins
In this study, a total of 34 ribosomal proteins were identified, including 10 small subunit ribosomal proteins and 24 large subunit ribosomal proteins (Table 1). The majority of these exhibited higher expression levels in the leaf and stem, a pattern consistent with the spatial distribution of active components (Fig. 4A) (Lu et al., 2006a). The internet analysis revealed that the majority of ribosomal proteins in H. cordata exhibited robust interactions with those in Arabidopsis thaliana according to STRING model data. (Fig. 4B, Table 1).
| Accession | type | F | L | S | Us |
|---|---|---|---|---|---|
| Cluster-4666.13037 | Small subunit ribosomal protein S5 | 0.587694 | 8.207778 | 4.26584 | 0.605816 |
| Cluster-4666.5849 | Small subunit ribosomal protein S6 | 0.858897 | 20.8466 | 2.611892 | 0.351564 |
| Cluster-4666.12357 | Small subunit ribosomal protein S3e | 1.048239 | 1.852502 | 6.082382 | 2.13907 |
| Cluster-4666.11333 | Small subunit ribosomal protein S4e | 1.593881 | 1.045695 | 7.180683 | 1.842053 |
| Cluster-4666.14273 | Small subunit ribosomal protein S8e | 1.048239 | 0.630984 | 1.070769 | 0.520195 |
| Cluster-4666.9797 | Large subunit ribosomal protein L1 | 0.858897 | 10.89376 | 2.863531 | 0.125623 |
| Cluster-4666.7389 | Large subunit ribosomal protein L18 | 0.662544 | 1.847383 | 1.185969 | 0.707684 |
| Cluster-4666.13864 | Large subunit ribosomal protein L29 | 1.401509 | 11.81121 | 5.308409 | 0.411917 |
| Cluster-4666.9022 | Large subunit ribosomal protein L3 | 1.435341 | 3.710995 | 1.564803 | 1.024261 |
| Cluster-4666.11140 | Large subunit ribosomal protein L4 | 1.196579 | 5.888499 | 2.755063 | 0.103792 |
| Cluster-4666.7056 | Large subunit ribosomal protein L4 | 0.995416 | 2.374982 | 1.609338 | 1.068313 |
| Cluster-4666.11973 | Large subunit ribosomal protein LP1 | 0.91973 | 0.304113 | 0.117207 | 2.137985 |
| Cluster-4666.14276 | Large subunit ribosomal protein L13Ae | 1.129462 | 0.894154 | 4.487644 | 1.125452 |
| Cluster-4666.12344 | Large subunit ribosomal protein L14e | 0.879289 | 3.034696 | 7.178391 | 1.481314 |
| Cluster-4666.11498 | Large subunit ribosomal protein L18Ae | 1.337471 | 0.559793 | 4.573985 | 1.273215 |
| Cluster-4666.12924 | Large subunit ribosomal protein L21e | 1.033298 | 0.616777 | 7.188906 | 1.592887 |
| Cluster-4666.11662 | Large subunit ribosomal protein L23Ae | 0.939511 | 0.470213 | 2.643782 | 0.228153 |
| Cluster-4666.12502 | Large subunit ribosomal protein L27Ae | 1.37694 | 1.348457 | 2.301466 | 0.974233 |
| Cluster-4666.11924 | Large subunit ribosomal protein L28e | 1 | 1.187894 | 2.329858 | 0.43075 |
| Cluster-4666.15104 | Large subunit ribosomal protein L4e | 1.153085 | 0.678525 | 4.328074 | 1.181494 |
| Cluster-4666.11447 | Large subunit ribosomal protein L6e | 0.977496 | 0.159101 | 2.885133 | 0.959655 |
| Cluster-4666.12046 | Large subunit ribosomal protein L7e | 0.769755 | 1.196298 | 4.234263 | 1.93658 |
| Cluster-4666.15918 | Large subunit ribosomal protein L13e | 2.418536 | 1.522815 | 14.21225 | 2.044358 |
| Cluster-4666.12871 | Small subunit ribosomal protein S3Ae | 1.401509 | 0.511285 | 1.508379 | 0.184063 |
| Cluster-4666.9242 | Large subunit ribosomal protein L38e | 1.677524 | 2.817341 | 7.806055 | 2.564219 |
| Cluster-4666.13728 | Large subunit ribosomal protein L11e | 1.196579 | 0.524089 | 5.445374 | 1.426766 |
| Cluster-4666.7689 | Large subunit ribosomal protein L19 | 1.004627 | 2.652266 | 0.740199 | 0.140157 |
| Cluster-4666.12018 | Large subunit ribosomal protein L30e | 0.951825 | 2.807338 | 10.42594 | 1.194464 |
| Cluster-4666.12688 | Small subunit ribosomal protein S15e | 0.777313 | 0.29411 | 2.414225 | 0.819777 |
| Cluster-4666.10888 | Large subunit ribosomal protein L13 | 1.928795 | 11.23692 | 5.154253 | 1.219788 |
| Cluster-4666.12692 | Small subunit ribosomal protein S25e | 1.095621 | 0.522402 | 0.965978 | 0.136825 |
| Cluster-4666.12733 | Large subunit ribosomal protein L5e | 0.868952 | 0.507198 | 1.837785 | 0.3925 |
| Cluster-4666.12390 | Large subunit ribosomal protein L18e | 1.242968 | 0.646883 | 2.356648 | 0.240595 |
| Cluster-4666.3656 | Small subunit ribosomal protein S24e | 0.875811 | 0.746968 | 1.599829 | 0.571713 |
Figure 4: Differentially expressed analysis of ribosomal proteins.
(A) Ribosomal proteins expression profiling in different tissues of H. cordata. (B) Interaction network of subunit ribosomal protein compared to Arabidopsis thaliana (confidence was set ≥0.9).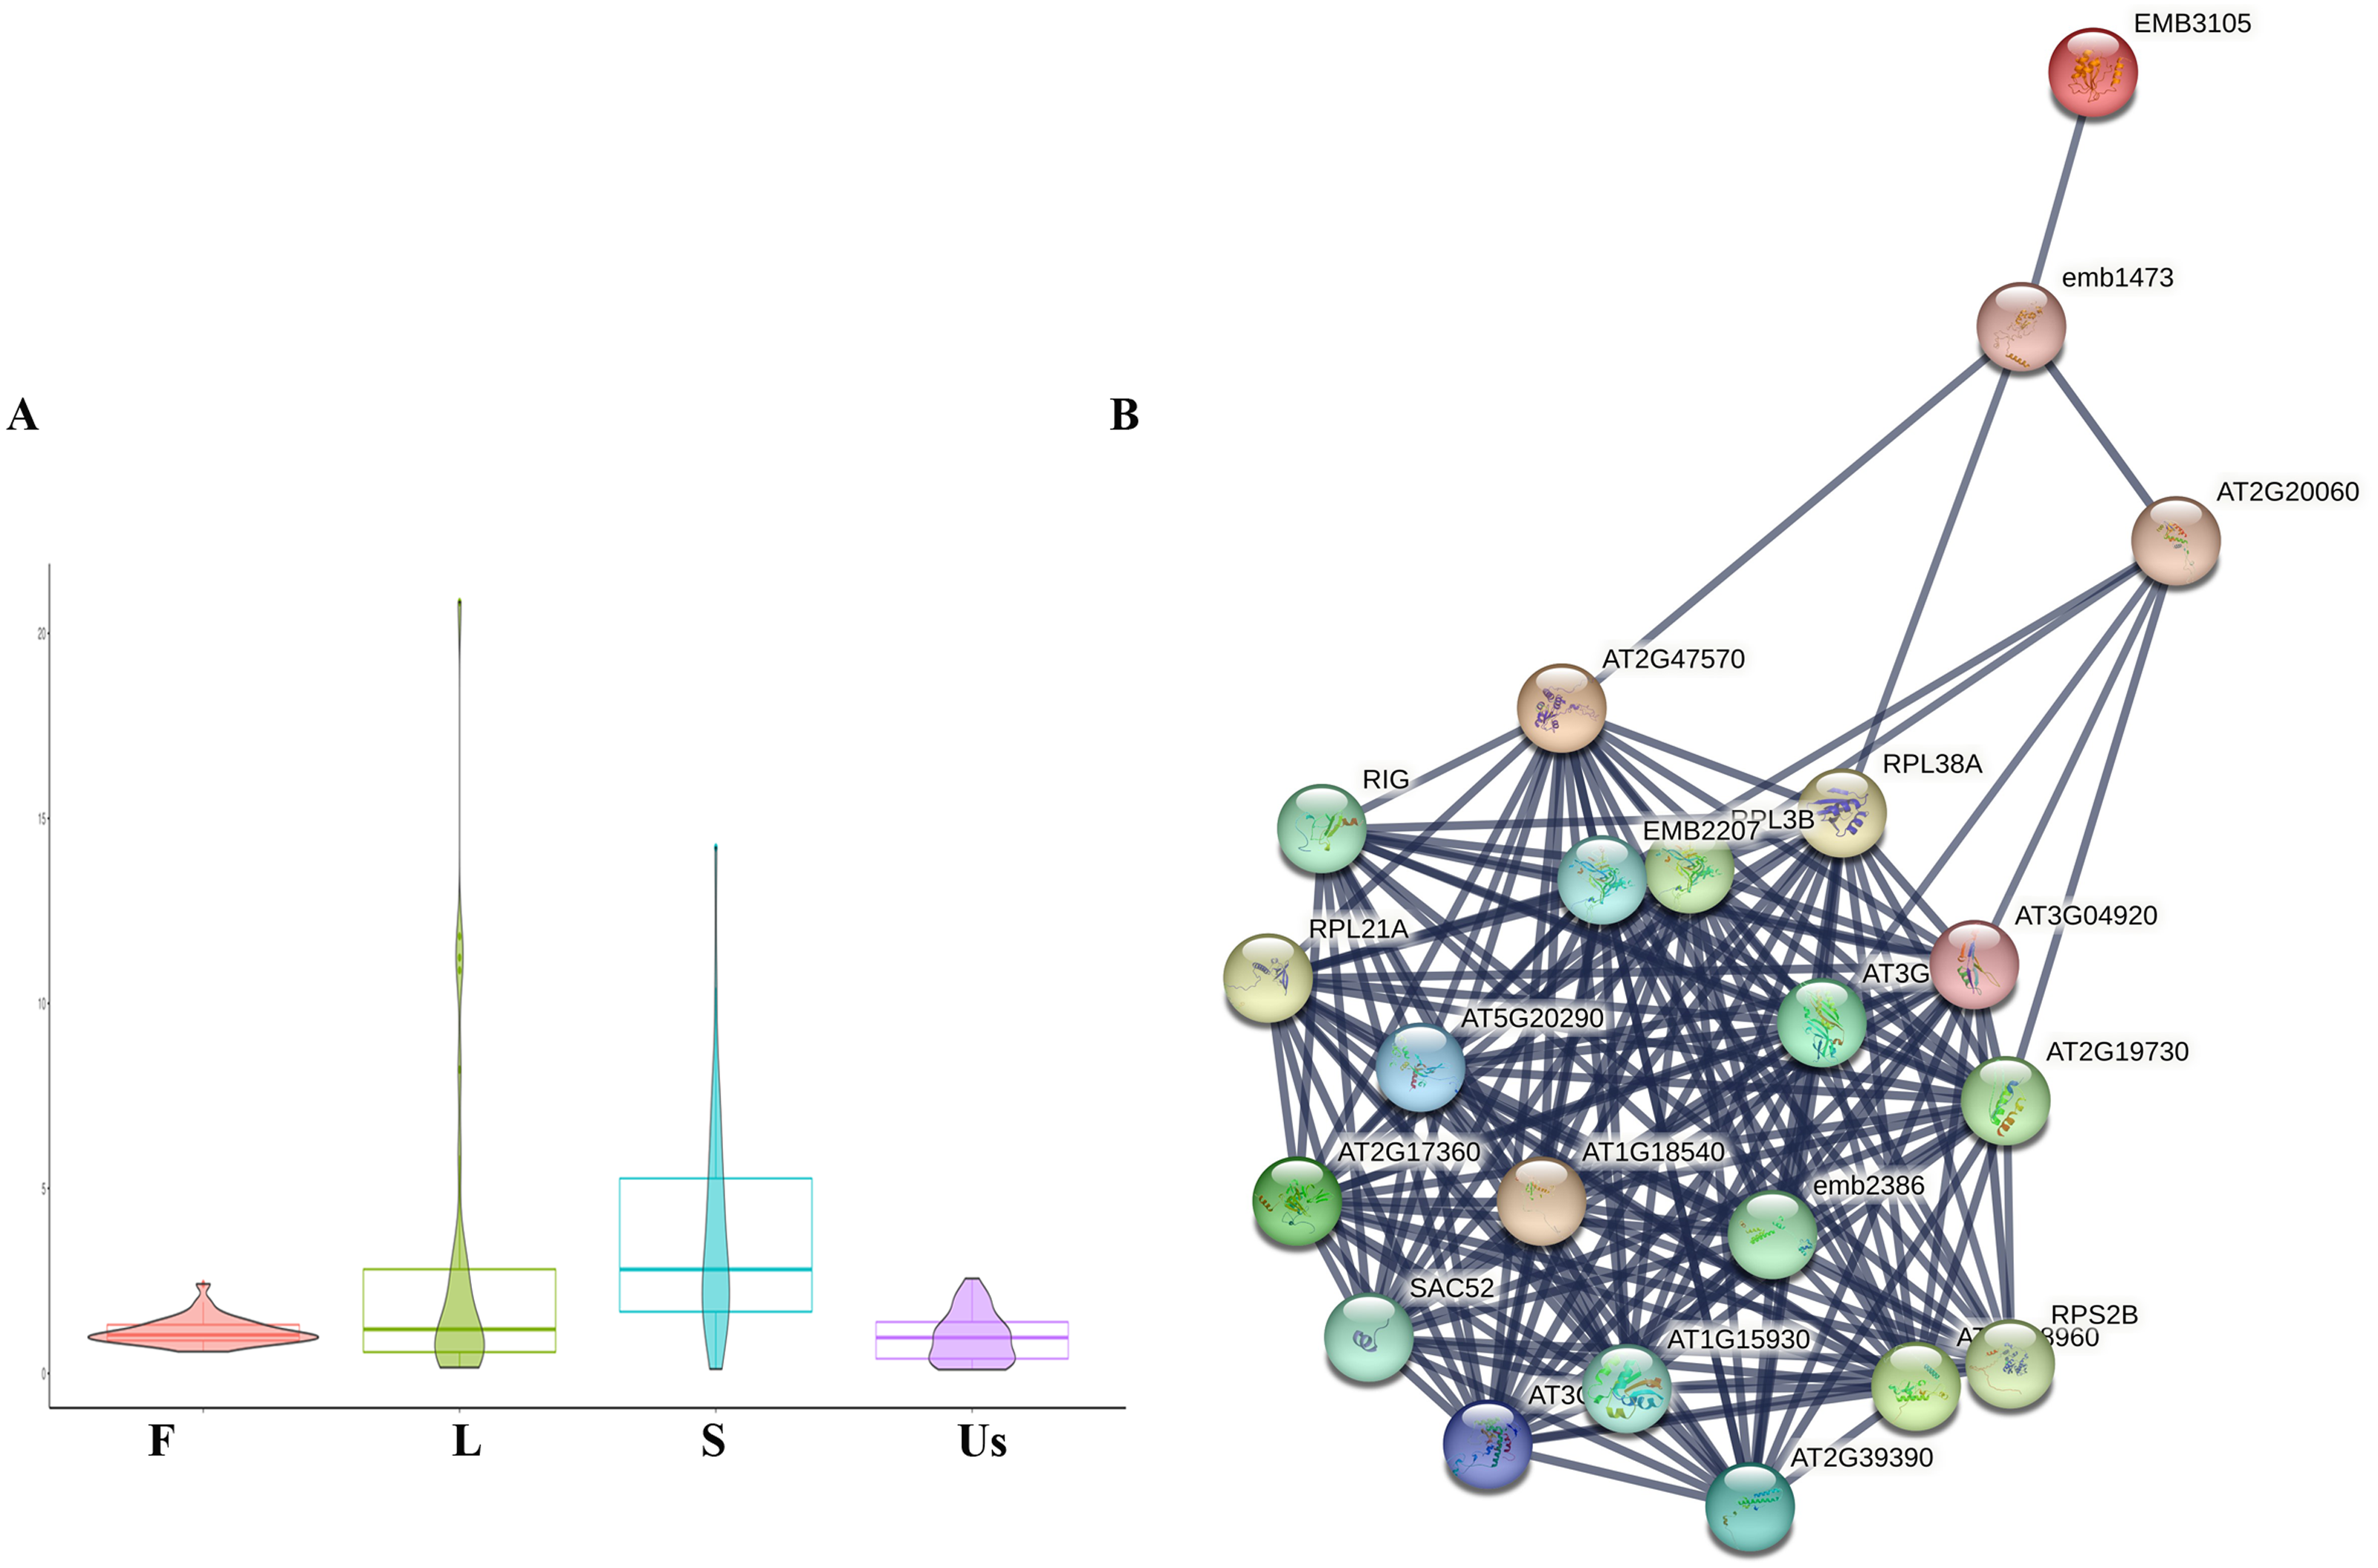
Discussion
As is well known, leaves, stems, and underground-stems of H. cordata are of great importance in traditional Chinese medicine due to their application in heat-clearing and detoxification therapies. Moreover, distinct variations in chemical composition have been observed between different plant parts (Verma et al., 2017). The essential oil, which is the main active constituent, shows significant variation between the aerial and underground parts. However, the distinctive protein profiling, which forms the basis for subsequent investigations into molecular mechanisms, remains elusive. To shed light on the variation in protein expression in H. cordata tissues, a comparative proteomic analysis using iTRAQ was performed. A total of 306 and 266 differentially abundant proteins (DAPs) were successfully identified in the leaf and stem, respectively, which showed up-regulated expression compared to the underground stem. These DAPs were categorized according to their functions and were found to be enriched in pathways such as photosynthesis, glycolysis, and ribosomal processes. These findings provide the basis for the identification and functional analysis of potential proteins associated with the interspecific variation of essential oil in H. cordata.
The ribosome, an ancient, intricate, and complex organelle, maintains a remarkably conserved structure and composition across prokaryotes and eukaryotes (Ramakrishnan & White, 1998). In a eukaryotic cell, the ribosome comprises four ribosomal RNAs and 79-81 ribosomal proteins. It is widely acknowledged that ribosomal proteins contribute to the maintenance of RNA conformation (Barakat et al., 2001). Nevertheless, an increasing number of studies have uncovered that ribosomal proteins are not solely involved in rRNA processing, folding, assembly, and ribosomal subunit transportation, but also in the reinforcement of subunit architectures and the interaction between ribosomes and diverse translation factors. Furthermore, they contribute to the folding and positioning of nascent peptides and potentially possess additional biological functions beyond the ribosomal context (Wilson & Doudna Cate, 2012). To date,, only a limited number of studies have revealed the significant role of ribosomal proteins in essential oil accumulation, which may regulate the biosynthesis of secondary metabolites and even impact plant development and abiotic stress tolerance (Wilson & Doudna Cate, 2012). According to reports, ribosomal proteins uS2c, uS4c, bL20c, and bL33c have been demonstrated to influence abnormal leaf morphologies (Rogalski et al., 2008). Furthermore, ribosomal protein bS1c has been demonstrated to affect nuclear and plastid genes encoding proteins involved in chlorophyll biosynthesis, chloroplast development, and photosynthesis (Gong et al., 2013; Zhou et al., 2021). In addition, the tobacco’s PRP bL33c plays a role in enhancing plant tolerance to low-temperature stress (Rogalski et al., 2008). PRP bS1c was observed to inhibit HsfA2-dependent heat stress responses in the chloroplasts of Arabidopsis (Yu et al., 2012).
Although considerable progress has been made in recent years, a comprehensive understanding of the individual functions of each PRP and their involvement in specific biological processes remains elusive. In the study, 18 upregulated Differentially Abundant Proteins (DAPs) were recognized as ribosomal proteins, encompassing large subunit ribosomal proteins L13, L19, and L3. Essential oils are defensive metabolites and physiological responses to environmental stress in H. cordata (Zhou et al., 2021). The essential oil of H. cordata contains a variety of components, some of which have significant medicinal value. Ribosomal proteins can directly affect the synthesis and accumulation of various components in the essential oil by regulating the expression of key genes or enzyme activities in the essential oil synthesis pathway. It is of great importance for the medicinal efficacy and quality control of the medicinal components in H. cordata. In addition, H. cordata grows in a variable environment and is exposed to various biotic and abiotic stresses. Ribosomal proteins may be involved in the regulation of essential oil biosynthesis to adapt to changes in the external environment and improve stress resistance in H. cordata.
This research suggests that manipulation of ribosomal protein expression by biotechnological tools may be an effective strategy to stimulate essential oil biosynthesis in H. cordata. These findings provide the basis for guiding the utilization of seed resources and enhancing the chemical diversity of components in both the aerial parts and underground-stem of H. cordata.
Conclusion
In this study, we reported iTRAQ-based quantitative proteomics of H. cordata, identifying a total of 3,261 proteins and mapping the differential expression pattern across multiple tissues. By correlating analysis with essential oil content, our results demonstrated that ribosomal proteins could significantly influence essential oil production in H. cordata. The research provides a novel insight into the study of protein function involved in essential oil in non-model plants.
Supplemental Information
The characterization of Transcriptome from H. cordata.
(A) Length distribution of unigenes. (B) Venn map of annotated unigenes in Nt, Nr, KOG, Go, Pfam database. (C) number of unigenes in different annotated database.
Overview of proteomics analysis
(A). GO annotation classification includes biological process (BP), cellular component (CC), molecular Function (MF). (B). Top 30 KEGG pathway classification.