
Gut microbiome-immune interactions and their role in rheumatoid arthritis development
- Published
- Accepted
- Received
- Academic Editor
- Praveen Korla
- Subject Areas
- Microbiology, Molecular Biology, Gastroenterology and Hepatology, Immunology, Rheumatology
- Keywords
- Rheumatoid arthritis, Gut microbiome, 16S rRNA, Sequencing, Immunology, Cytokines, Chemokines, Metabolic pathways
- Copyright
- © 2024 Nurgaziyev et al.
- Licence
- This is an open access article distributed under the terms of the Creative Commons Attribution License, which permits using, remixing, and building upon the work non-commercially, as long as it is properly attributed. For attribution, the original author(s), title, publication source (PeerJ) and either DOI or URL of the article must be cited.
- Cite this article
- 2024. Gut microbiome-immune interactions and their role in rheumatoid arthritis development. PeerJ 12:e17477 https://doi.org/10.7717/peerj.17477
Abstract
Objective
The primary objective is to study the impact of gut microbiota and their interactions with diverse immunological markers on the development of rheumatoid arthritis.
Methods
This study was performed in Astana, Kazakhstan, and included 77 Kazakh female patients older than 18 years, who met the American College of Rheumatology 2010 classification criteria for rheumatoid arthritis (RA), and 113 healthy controls. The DNA was extracted from fecal samples obtained from all study participants for subsequent sequencing at the 16S rRNA gene V1-V3 locus, facilitating the analysis of the gut microbiome. The Multiplex immunoassay was employed to measure the concentrations of inflammatory cytokines, chemokines, and immunoglobulins in both fecal and plasma samples.
Results
Our taxonomic analysis revealed significant differences in the composition of the gut microbiota between the healthy control cohort and the cohort with rheumatoid arthritis RA. Alpha diversity was significantly lower in the RA group. Lachnospiraceae were the most abundant taxon and found to be crucial, showing correlations with immunological markers such as IL5. Additionally, Lachnospiraceae and Oscillospiraceae exhibited the most predictable power and distinguished the composition of both study groups.
Conclusion
Our study identifies key differences in the gut microbiome of RA patients, revealing distinct microbial patterns and specific taxa abundance. We highlight potential biomarkers in immunological and bacterial pathways, offering insights into RA development and indicating possibilities for personalized treatment.
Introduction
Rheumatoid arthritis (RA) is a chronic autoimmune disease that affects millions of people worldwide, causing joint pain, inflammation, and increased levels of chemokines and cytokines (Scott, Wolfe & Huizinga, 2010). While the precise causes of RA remain unclear, recent studies have highlighted the role of the gut microbiome in the development and progression of this condition. The gut microbiome is a complex community of microorganisms that inhabit the human gastrointestinal tract and play a crucial role in maintaining host health. Studies have shown that changes in the gut microbiome can lead to alterations in host gene expression, ultimately leading to the development of autoimmune diseases such as RA triggering aberrant systemic immunity (Zhang et al., 2015). Various types of gut bacteria exhibit markedly diverse regulatory impacts on the functioning of the immune system. Certain strains possess the capability to elicit an immune response, providing advantages for individuals with compromised immune systems. In contrast, alternative strains can dampen the immune response, influencing immune regulation specifically in patients with RA (Amdekar et al., 2013; Jung et al., 2017; Ferreira-Halder, Faria & Andrade, 2017; Alpizar-Rodriguez et al., 2019; Iljazovic et al., 2021). As an example, in individuals with recently diagnosed untreated rheumatoid arthritis, there was an augmentation in the prevalence of Prevotella copri, accompanied by genomic reorganization. Additionally, one of its 27-kDa proteins demonstrated the capacity to induce the Th1 response in 42% of RA patients (Scher et al., 2013; Pianta et al., 2017).
This article aims to investigate the intricate connections between the gut microbiome and immunological markers in RA, with a particular focus on exploring these associations through the lens of metabolic pathways. In RA, two diagnostic markers, rheumatoid factor (RF) and anti-citrullinated protein antibodies (ACPA), play essential roles in disease classification (Sung & Tsai, 2021). RF is typically associated with RA and other autoimmune conditions, targeting the Fc region of IgG antibodies. In contrast, ACPA focuses on proteins that have been citrullinated, which is a specific change where the amino acid arginine is converted into citrulline. These alterations can impact the function of proteins and is linked to the RA development and progression. ACPA’s presence is particularly significant for RA diagnosis, offering a high level of specificity (Song & Kang, 2010). The presence or absence of these autoantibodies divides RA into different forms, each with its unique clinical presentation and prognosis. Positive RF and/or ACPA status is often associated with a more severe disease course, including higher disease activity and joint damage (Boer, Boonen & van der Helm-van Mil, 2018; Chen et al., 2018; Rönnelid, Turesson & Kastbom, 2021). Understanding these relationships is crucial for developing targeted treatments and personalized management strategies for RA.
Despite significant advances in understanding the complex interplay between the gut microbiome and RA, key questions remain unanswered. In particular, the mechanisms through which specific gut microbial communities influence the immune system’s role in RA development are not fully understood. This gap in knowledge represents a critical barrier to developing targeted interventions. This article aims to explore the complex connections between the gut microbiome and immunological markers in RA along with the influence of RA-specific autoantibodies, ACPA and RF, with a particular focus on exploring these associations through the lens of metabolic pathways. The study investigates the nuanced relationships between specific microbial families, such as Lachnospiraceae and Oscillospiraceae, and their corresponding metabolic pathways, shedding light on their potential implications for the immunopathogenesis of RA. We present a case-control study that compares the diversity and composition of the gut microbiome in Kazakhstani female patients diagnosed with RA to that of healthy individuals. Our study further encompasses an examination of correlations between the identified microbiome profiles and immunological markers. By understanding the complex interactions between the gut microbiome and immune system, we may be able to develop new therapeutic strategies for treating RA and other autoimmune diseases.
Materials and Methods
A study population
In this observational study, all participants were offered informed consent to join the research after they had an explanatory discussion about the study’s objectives and structure (they received information about the study, and a copy of the informed consent was provided). All participants who were part of the study underwent a registration process and were assigned an individual code to maintain confidentiality principles. The recruitments were carried out at City polyclinics No.10, No.12 and the Treatment and Diagnostic Center based at City Multidisciplinary Hospital No. 2 Astana, Kazakhstan. All RA patients were examined by the rheumatologist.
The research received approval from the ethics committee at the National Laboratory Astana, Nazarbayev University, with Protocol No. 03-2019, in Astana, Kazakhstan. Participants were informed about the study’s objectives and provided their consent by signing an informed consent document. We confirm that the informed consent was received from all participants of our study in the article form. Interactions with the participants adhered to the established guidelines and regulations.
The main group of the study were Kazakh female patients with the established RA diagnosis according to American College of Rheumatology 2010 classification criteria for RA (Radner et al., 2014), and the disease duration more than 1 year. Disease activity was determined by Disease Activity Score Calculator (DAS28), X-ray stage was established according to X-ray examination result conducted within last current year, and anamnestic data were collected. The control group consisted of healthy female individuals, matched by age (older than 18 years) and ethnicity with the RA patients, ensuring they had no family history of RA or other autoimmune diseases. Healthy controls underwent the identical laboratory examination as RA patient did, including specific autoimmune disease testing such as antinuclear antibody (ANA) tests, rheumatoid factor (RF), and anti-citrullinated protein/peptide antibody (ACPA) assays, and the acute phase reactants (C reactive protein and erythrocyte sedimentation rate). Those who tested positive were excluded from the study.
Exclusion criteria for study participants included the following: age less than 18 years, pregnancy, and lactation at the time of inclusion in the study, cancer at the study time and in anamnesis, severe concomitant somatic pathology in the decompensation stage, use of antibiotics, probiotics, antiviral medication in the last 3 months prior study, parasitosis at the study time or in anamnesis, acute respiratory disease at the study time, resection of the stomach and/or intestines, and inflammatory bowel disease in anamnesis. Additional exclusion criteria for control group were the presence of heredity for RA and other autoimmune diseases. The research study design is depicted using a STARD diagram (Fig. 1). This study employs data from the identical set of patients as presented in our earlier publication (Kozhakhmetov et al., 2023).
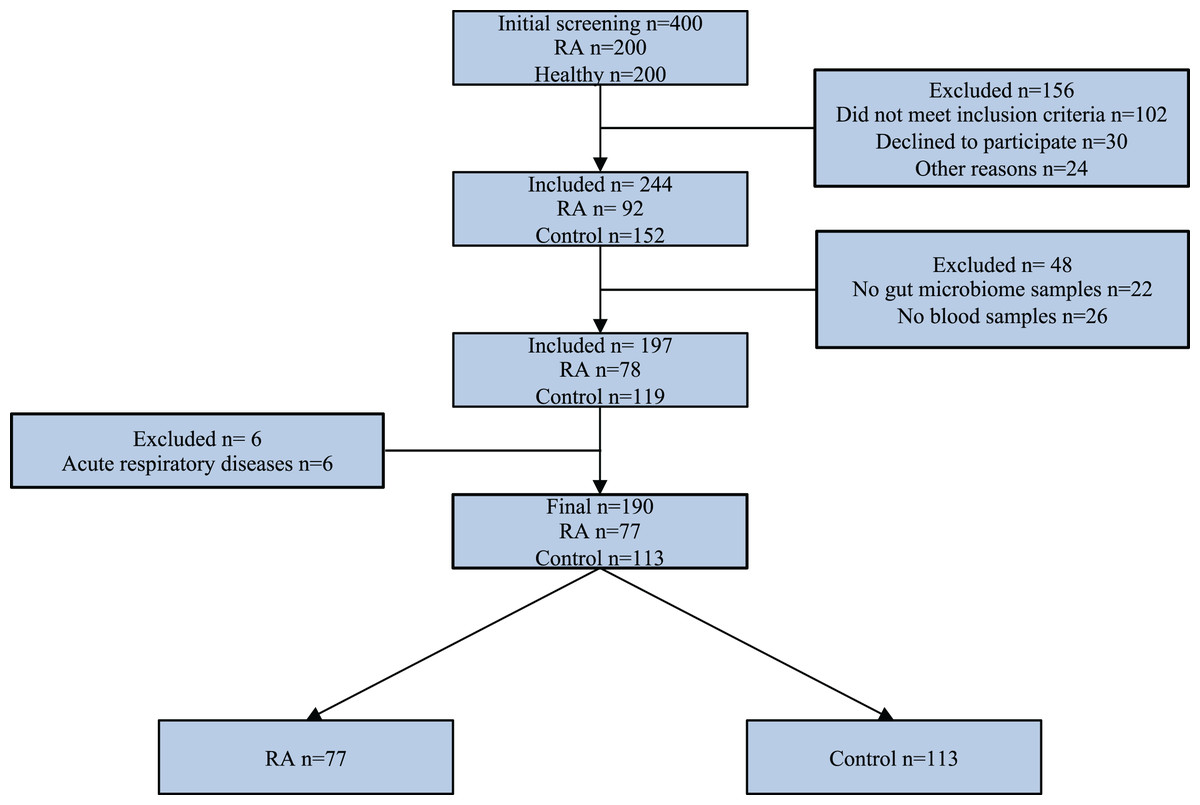
Figure 1: STARD diagram showing the flow of participants through the study.
Fecal and blood sample collection, DNA extraction and sequencing
All patients included in the study were sampled in the form of feces and blood in compliance with infectious safety measures. Feces were collected using the DNA/RNA Shield Fecal Collection Tube (Zymo Research, R1101; Tustin, CA, USA). Blood sampling, for the subsequent determination of the levels of cytokines, chemokines, and immunoglobulins, was carried out from a vein into vacutainers with ethylenediaminetetraacetic acid. Biomaterial labeling was carried out according to the coding.
All activities for the study of the gut microbiome were carried out subject to the requirements of good laboratory practice (GLP). Samples were stored as recommended by Zymo Research, Tustin, CA, USA. All genomic DNA extraction steps from fecal samples were performed using the ZymoBIOMICS DNA Miniprep Kit (Zymo Research, D4300; Tustin, CA, USA) according to the manufacturer’s protocol (Zymo Research, Tustin, CA, USA). The DNA isolation underwent a qualitative check through electrophoresis in a 1% agarose gel. To assess the concentration and purity of each DNA sample, an Invitrogen Qubit 3.0 Fluorometer (Invitrogen, Carlsbad, CA, USA) was employed. A negative control was maintained using sterile water. The analysis of gut microbiome composition involved the sequencing of the V1-V3 region of the 16S ribosomal RNA gene. This sequencing was performed using the Illumina NovaSeq 6000 platform (Illumina, San Diego, CA, USA) at the Novogene laboratory in Beijing, China, in accordance with established Illumina protocols.
Analyzing sequencing data
The 16S amplicon sequencing data, starting from raw reads, underwent processing into taxon density tables through the utilization of the LotuS2 pipeline (Less OTU Scripts 2). Key steps in this process included demultiplexing, quality filtering, and dereplication of reads, which were carried out with the assistance of a straightforward demultiplexer (sdm). Additionally, chimeric sequences were identified and eliminated using UCHIME algorithms. Taxonomic postprocessing and sequence clustering, employing the SILVA database, were performed using LCA and UPARSE, respectively. Total number of reads accounted for 16,796,296, employing a similarity threshold of 97% for distance comparison. After filtering, the sequences were categorized into 3,681 OTUs and were attributed to the bacterial domain,15,176,348 reads remained in the matrix, an average sequencing depth was 41,990 reads per sample.
Analysis of metabolic pathways
The analysis of metabolic pathways was conducted using PICRUSt2 (Phylogenetic Investigation of Communities by Reconstruction of Unobserved States) version 2.5.0, following its default settings, to predict functional metagenomic profiles from 16S rRNA sequencing outcomes. To determine the gene family copy numbers for each operational taxonomic unit (OTU), a reference tree was used with a Nearest Sequenced Taxon Index (NSTI) threshold of 2. The abundance of metabolic pathways in bacteria was predicted using the MetaCyc Metabolic Pathway database.
Measurement of the immunological profile
A volume of 20 μL from the serum sample was utilized for immunological analysis. The measurement of cytokine levels using the MILLIPLEX MAP #1 Human Cytokine/Chemokine Panel 1 kit (Merck, Rahway, NJ, USA) for multiplex analysis via the Luminex xMAP method in accordance with the manufacturer’s standard protocol. The levels of inflammatory cytokines, chemokines, and immunoglobulins in fecal and plasma samples were measured using the Multiplex immunoassay. Multiple cytokine and chemokine assays and immunoglobulin isotyping were performed using the Bio-Plex 200 system (Bio-Rad, Hercules, CA, USA).
Statistical analysis
All statistical evaluation was done in Python 3.9.16. Operational taxonomic unit (OTU) tables underwent rarefaction, retaining only OTUs detected in a minimum of 25% of samples per group. Two-group comparisons utilized the independent T-test, Welch’s t-test, or Mann-Whitney U-test as considered fitting, using the “SciPy 1.10.1” library. For analyses involving multiple groups, the Kruskal-Wallis test followed by Dunn’s post-hoc test was employed, with the Benjamini-Hochberg FDR correction for multiple testing applied via “statsmodels 0.13.5”, maintaining a significance threshold of q ≤ 0.05. Alpha diversity metrics, including Shannon, Chao1, and Faith’s indices, and beta diversity assessments utilizing Bray-Curtis distance through ANOSIM and PERMANOVA with 9,999 permutations were executed as per “scikit-bio 0.5.6”. Principal coordinate analysis (PCoA) facilitated ordination of between-sample compositions. Spearman’s r correlation coefficient, adjusted for FDR, identified taxonomic features significantly related to ordination results. Differential analysis of taxonomic features was determined using “LEfSe 1.0.8”, applying a significance criterion of LDA > 2, p ≤ 0.05, consistent with methods reported by Issilbayeva et al. (2024). Differential analysis of functional features was based on differences in medians with 95 CI estimation using the Hodlges-Leghman estimator, considering only those with non-overlapping intervals as significant, following the methods described by Kozhakhmetov et al. (2023). Correlation analyses was performed using Spearman’s r, and feature importance analysis for more robust estimation was performed using a combination of gradient boosting decision trees (GBDT) and binomial logistic regression (LR) with leave-one-out cross-validation using “scikit-learn 1.2.2” and “LightGBM 3.3.5” libraries.
Results
The demographic information and clinical serum biochemical data of study responders
Our study included 190 female participants, all Kazakh ethnicity, with 77 diagnosed with RA and 113 healthy individuals (as shown in Fig. 1). The average age of RA patients was 44 years, with the onset of the disease typically occurring in the third decade of life. The average disease duration amounted to 9 years. Most of the RA patients (81.8%) demonstrated from moderate to high disease activity.
Out of the 77 RA patients in the study cohort, 77.9% had RF positive and 22.1% RF negative RA form. While ACPA positive RA form accounted for 54.5% and ACPA negative RA form was 45.5% (Table 1).
| Parameters | RA (n = 77) | Control (n = 113) | p-value |
|---|---|---|---|
| Demographic characteristics | |||
| Mean age (years) | 43.97 ± 8.16 | 42.29 ± 7.06 | p-value = 0.13 |
| Age of RA onset | 34.3 ± 9.22 | – | |
| Disease duration (years) | 9.21 ± 7.92 | – | |
| Smokers | 4 (5.2%) | 7 (6.2%) | p-value = 1 |
| Heredity for RA | 27 (35%) | – | |
| Inflammatory marker | |||
| CRP (mg/L) | 8.76 ± 14.2 | 1.85 ± 2.5 | p-value < 0.0001* |
| Gamma globuline (%) | 19.84 ± 4.22 | 17.91 ± 2.87 | p-value = 0.0006* |
| ESR (mm/hour) | 28.45 ± 21.70 | 13.94 ± 10.67 | p-value < 0.0001* |
| Leukocytes (109/l) | 6.25 ± 2.16 | 5.33 ± 1.47 | p-value = 0.001* |
| Autoantibodies | |||
| RF positive (%) | 60 (77.9%) | – | |
| RF negative (%) | 17 (22.1%) | ||
| ACPA positive (%) | 42 (54.5%) | – | |
| ACPA negative (%) | 35 (45.5%) | – | |
| Disease activity (DAS 28) | |||
| High (3) | 27 (35.1%) | – | |
| Moderate (2) | 36 (46.7%) | – | |
| Low (1) | 7 (9.1%) | – | |
| Remission (0) | 7 (9.1%) | – | |
| X-ray stage | |||
| I | 16 (20.8%) | – | |
| II | 32 (41.6%) | – | |
| III | 18 (23.4%) | – | |
| IV | 11 (14.2%) | – | |
Note:
The results of gut microbiome sequencing
The results revealed significant differences in both alpha and beta diversity between the control and RA groups. No significant difference was shown by the Shannon index (p = 0.4) between the two groups, while the α-diversity of microbial taxa, as assessed by Chao 1 index (p = 0.019) and Faith’s PD (p = 0.006) of the gut microbiota, was observed to be somewhat lower in patients with RA when compared to healthy controls, and these differences were deemed statistically significant (Fig. 2A). The assessment of beta diversity at the group level showed a significant dissimilarity in community comparisons according to PERMANOVA (F = 2.66, p = 0.0009), whereas ANOSIM (p > 0.05) did not reveal any significant large-scale distinctions (Fig. 2B).

Figure 2: Variation in microbial diversity within the gut microbiome and relative abundance of both study groups.
(A) Comparing the distribution of alpha diversity in individuals with incident RA and healthy controls. (B) Comparing the beta diversity of the gut microbiome in both RA patients and controls. In the graphs, samples from the control group are represented by green points, while samples from the RA group are indicated by purple points. (C) Bar chart of relative abundance between to study groups RA and control at the phylum level. (D) Variations in the taxonomic profile among individuals with RA are depicted. A bar plot displaying LDA scores, with each score indicating the magnitude and order of each taxon that exhibits differential abundance (LDA > 2). (E) Cladogram representing taxonomic differences between the RA and control groups at multiple hierarchical levels. *p ≤ 0.05, **p ≤ 0.01, ****p ≤ 0.0001.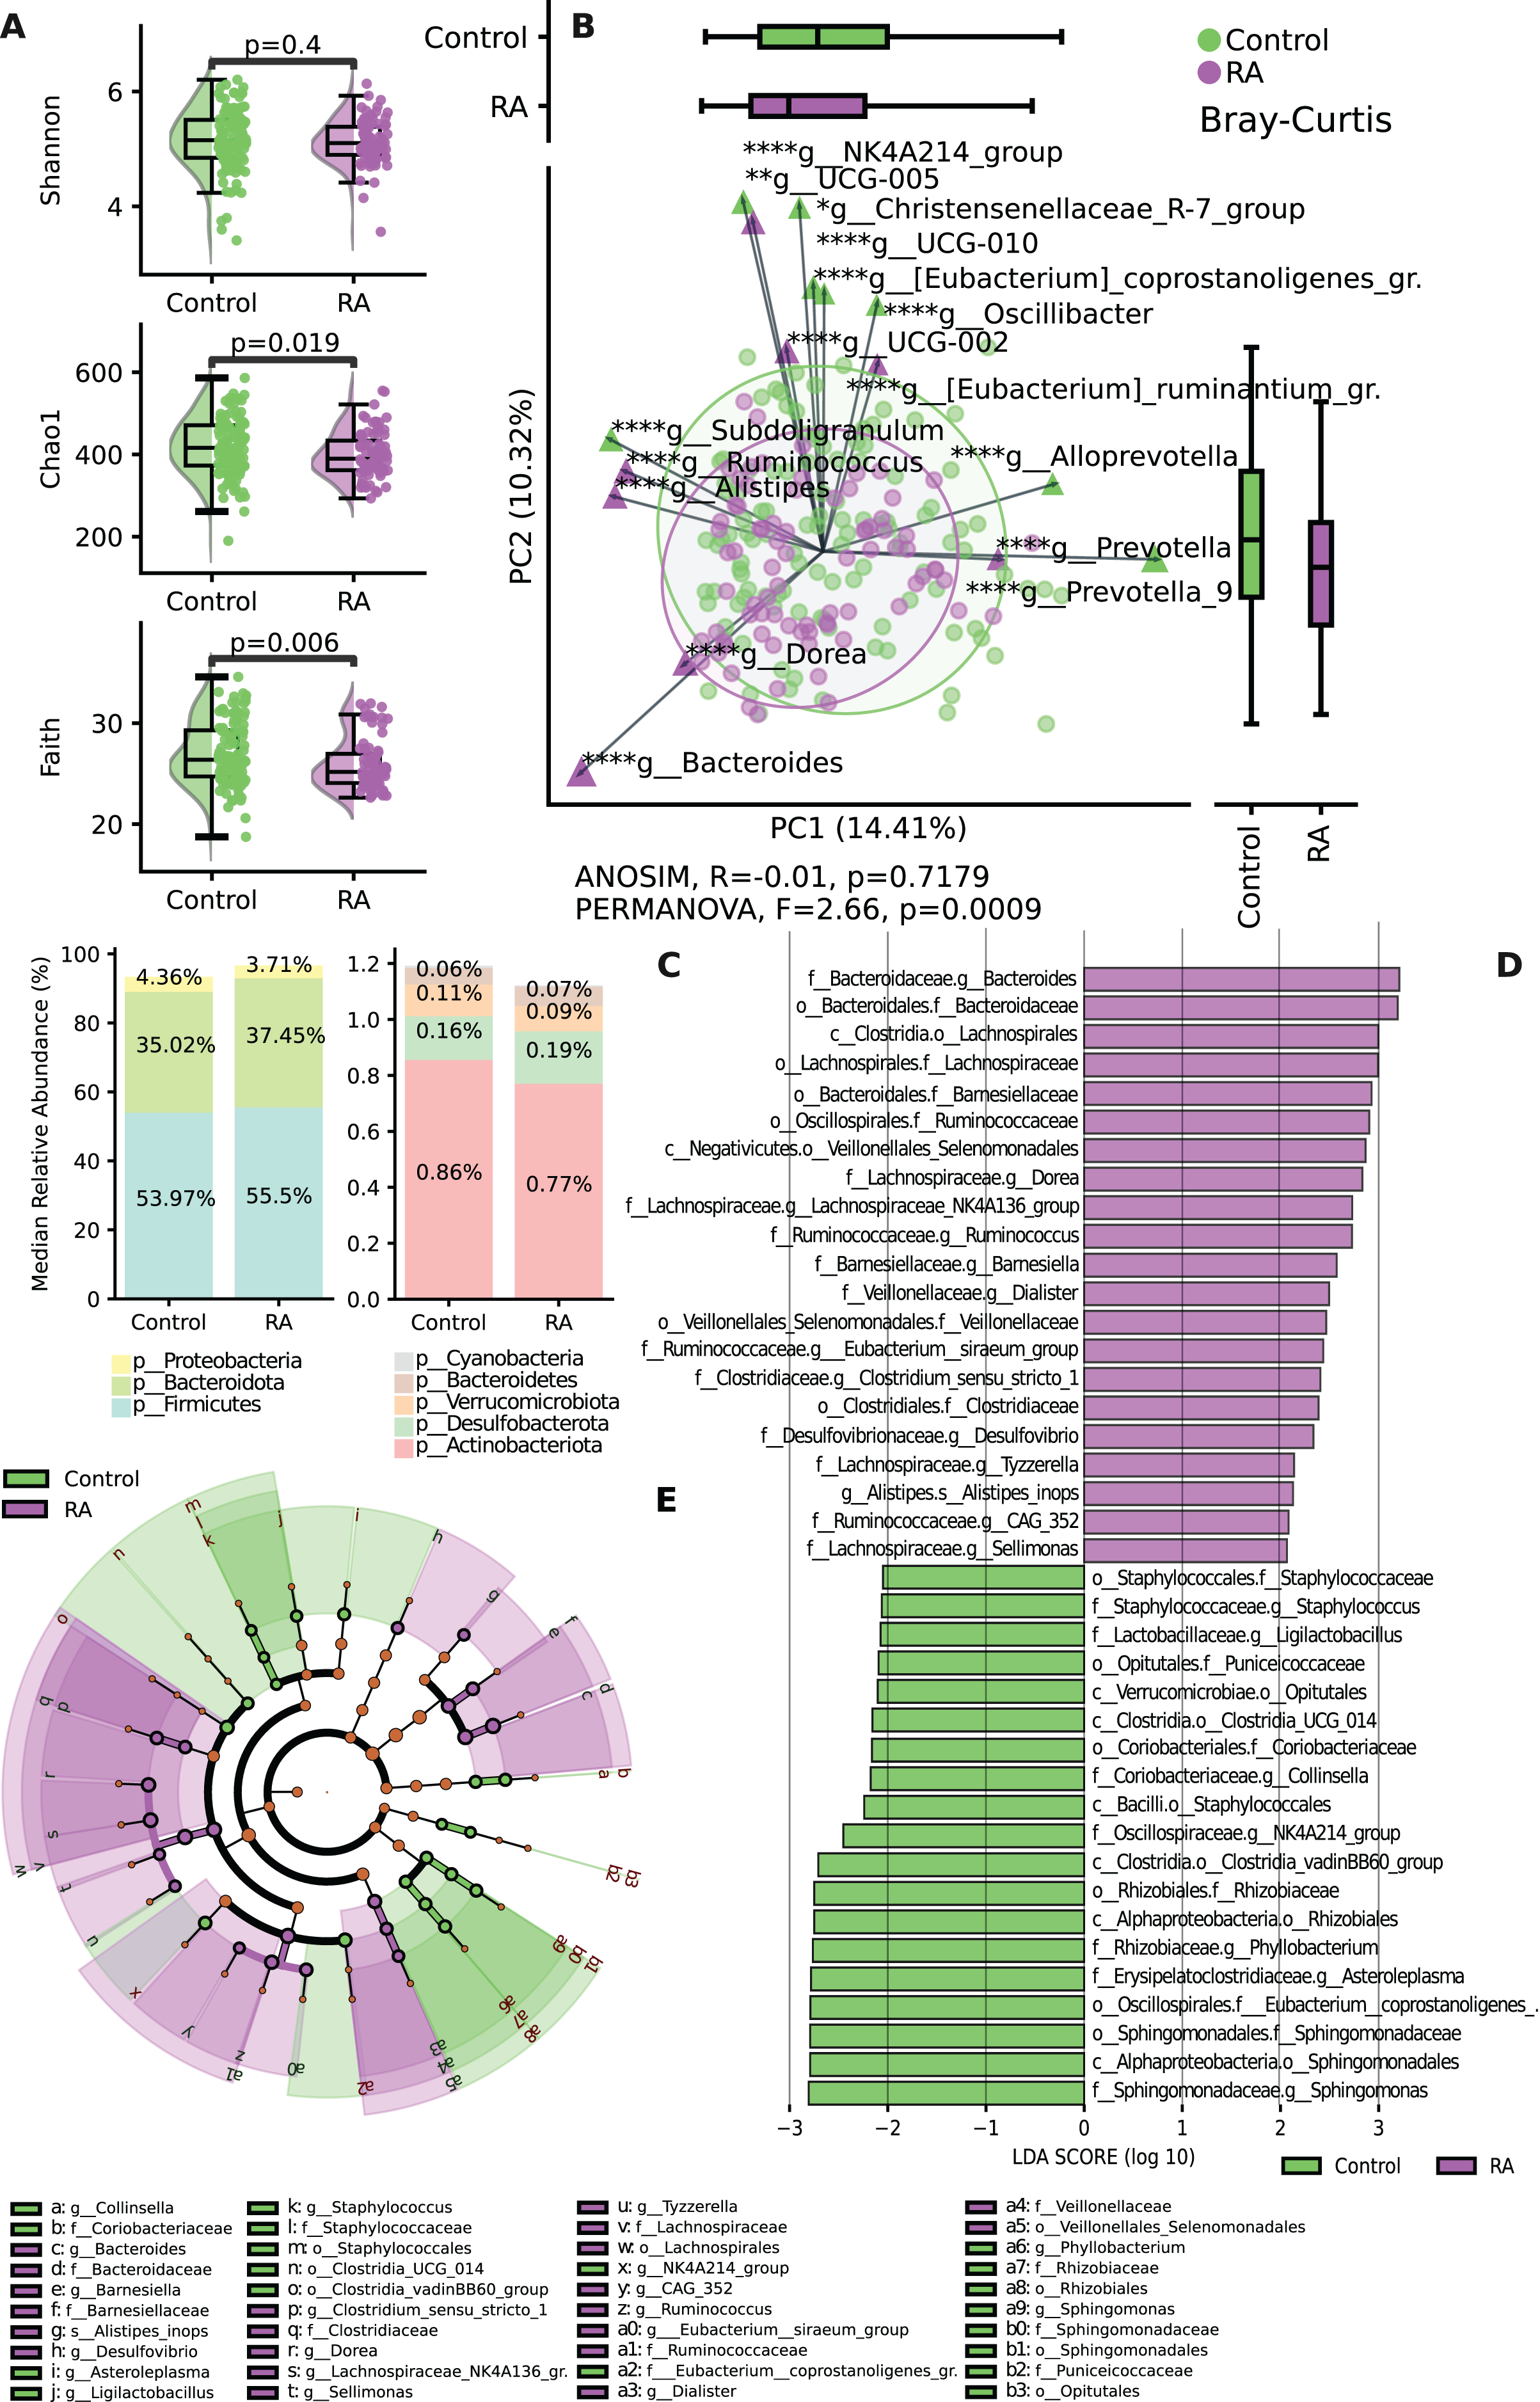
The findings regarding the most abundant phyla indicated shifts in relative abundance. The analysis of the relative abundance showed decreased levels of Proteobacteria and Actinobacteriota in the RA group compared to the control group (Fig. 2C). A histogram depicting the structure of the gut microbiota is shown in Fig. 2D. The most abundant taxa on the family level among RA group were Lachnospiraceae, Clostridiaceae, Bacteroidaceae, Ruminococcaceae and Veillonellaceae. While in control group the most abundant taxa were Staphylococcaceae, Coriobacteriaceae, Rhizobiaceae, Sphinogomonadaceae, Puniceicoccaceae and Eubacterium Coprostanoligenes group. The most abundant genera among RA group were Dorea, Tyzzerella, Sellimonas which belongs to Lachnospiraceae family (Fig. 2E).
The connection between gut microbiome, RF and ACPA
We conducted an analysis to examine the correlation between microbial taxa and the presence of autoantibodies, such as ACPA and RF, as well as the levels of inflammation in the blood, quantified by measuring CRP, in these patients. The examination of alpha (Shannon/Chao1, Faith PD) and beta (Bray-Curtis, PERMANOVA) diversity, based on the presence of RF and ACPA antibodies, did not reveal any significant differences within the RA group (Fig. S1).
Based on LEfSe analysis focusing on RF status, it was observed that Eubacterium_ruminantium, and Monoglobus were linked with the RF-positive form of the disease, whereas Prevotella, Colidextribacter, and Butyricimonas were associated with the RF-negative form (Fig. 3A).
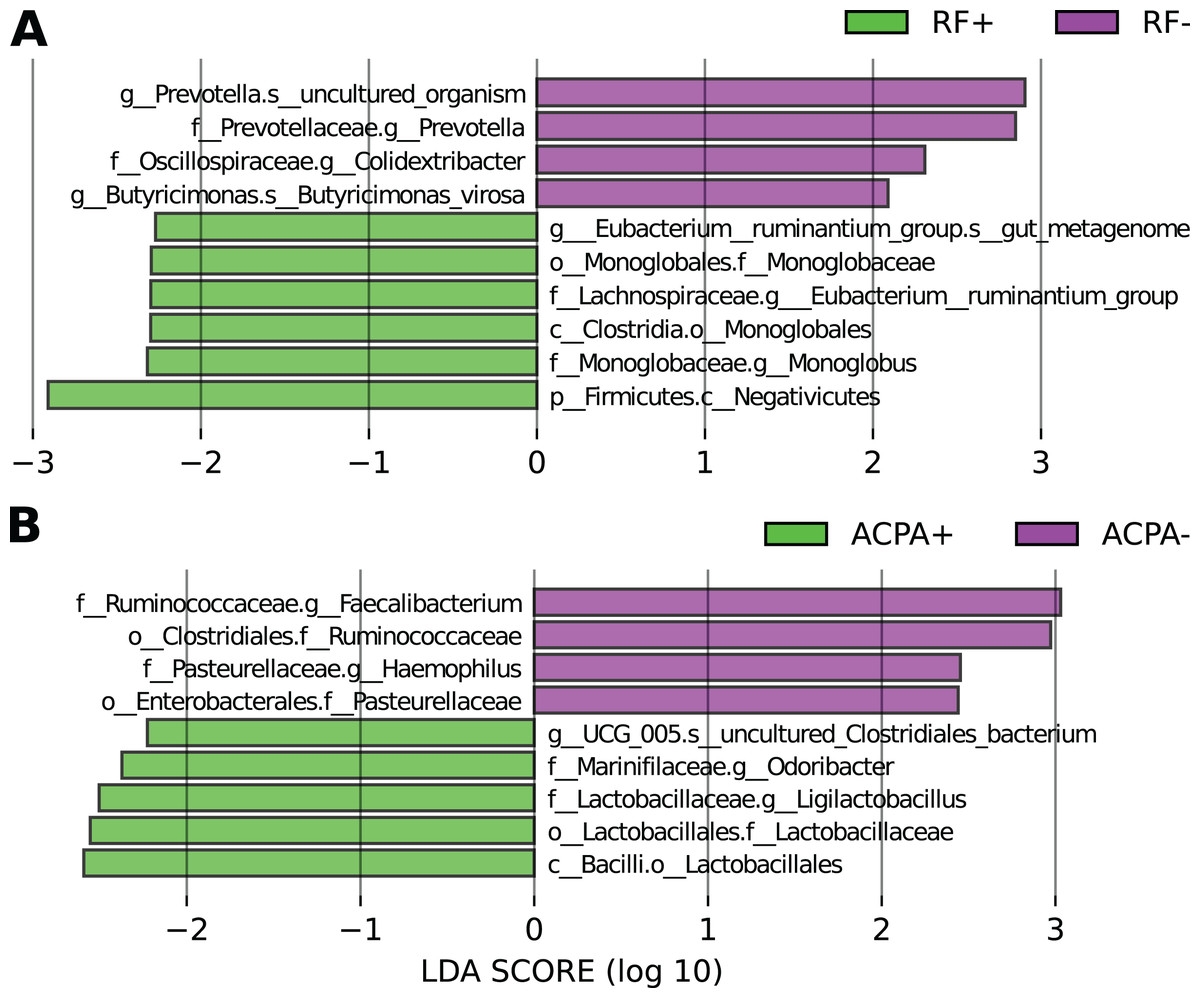
Figure 3: Differences in the taxonomic composition in individuals with RA based on their antibody status.
(A) LEfSe analysis focusing on RF status. (B) LEfSe analysis focusing on ACPA status.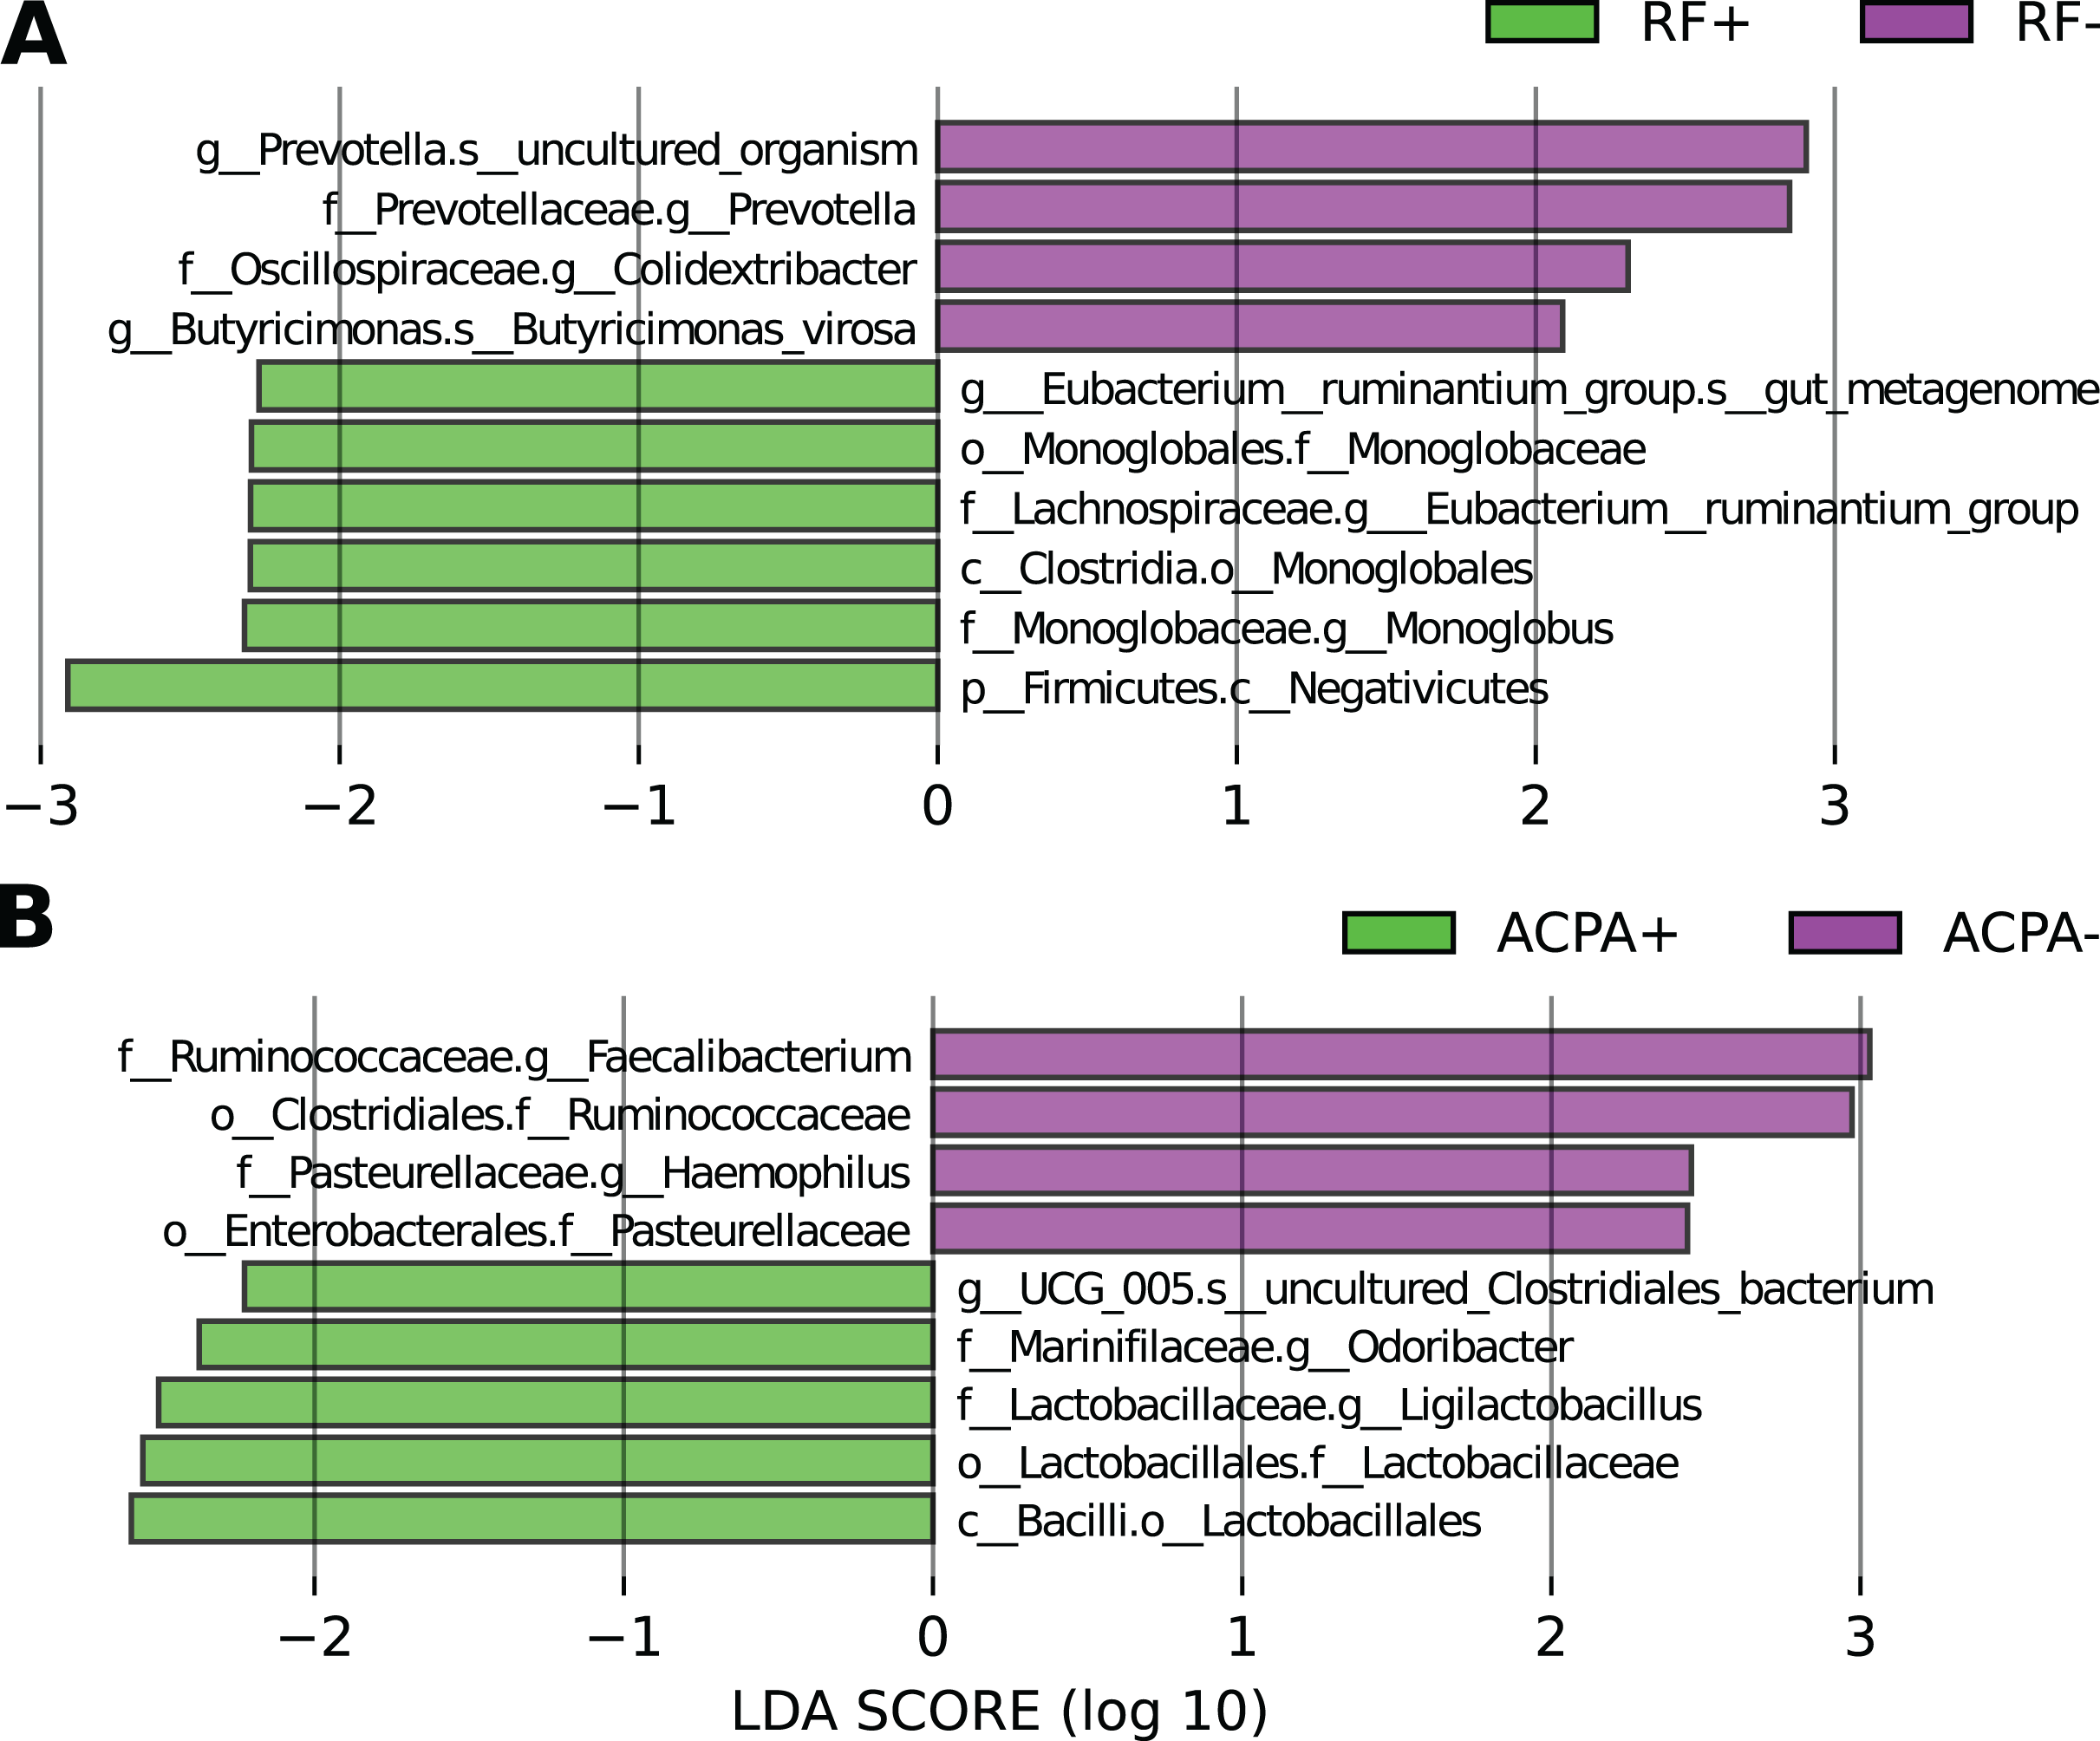
In relation to ACPA status, taxa like g_UCG_005, Odoribacter, and Ligilactobacillus were linked to ACPA-positive cases, while Faecalibacterium and Haemophilus were associated with the ACPA-negative disease form (Fig. 3B).
The study of immunological profile of the study groups
We conducted analysis to examine the relationship between the immunological profile and clinical parameters in RA. The findings revealed that RA patients with high disease activity exhibited elevated levels of MIG, IP10, FLT3L, IL6, TNFa, VEGF_A, IL17E_IL25, IL1a, GROa, and FGF2. The most substantial differences were observed in the chemokines MIG and IP10 (p < 0.01) (Fig. 4A). Increased levels of IL5, FGF2, and TNFb were noted in RA patients with RF positivity (Fig. 4B), while no significant differences were found in the analysis of the immunological profile and ACPA status (Fig. S2).
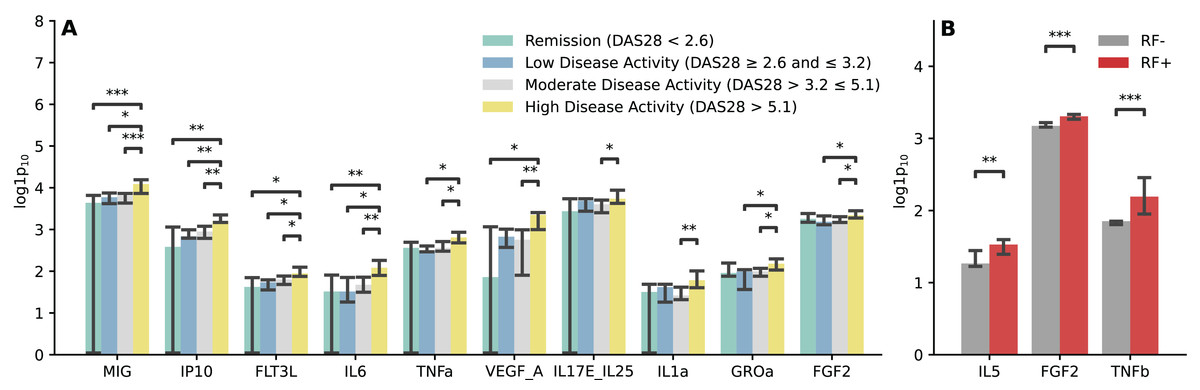
Figure 4: Immunological profile and clinical parameters of RA.
(A) Barplot illustrating comparisons of cytokine and chemokine levels regarding the RA activity. Kruskal-Wallis with Dunn’s post-hoc test, FDR. (B) Barplot illustrating comparisons of cytokine and chemokine levels regarding the disease form depending on the RF status. Mann-Whitney U, FDR. Median aggregation. *p ≤ 0.05, **p ≤ 0.01, ***p ≤ 0.001.
The analysis of correlations between taxa and cytokines-chemokines revealed various associations. For instance, Sellimonas showed a positive correlation with TGFa, Fractalkine, MIP1a, IL17a, IFNy, IL7F, FGF2, MCSF, and IL1b, but had negative correlations with IgM, IgG3, IgG4, IgA, and IgG2 (Fig. 5A).
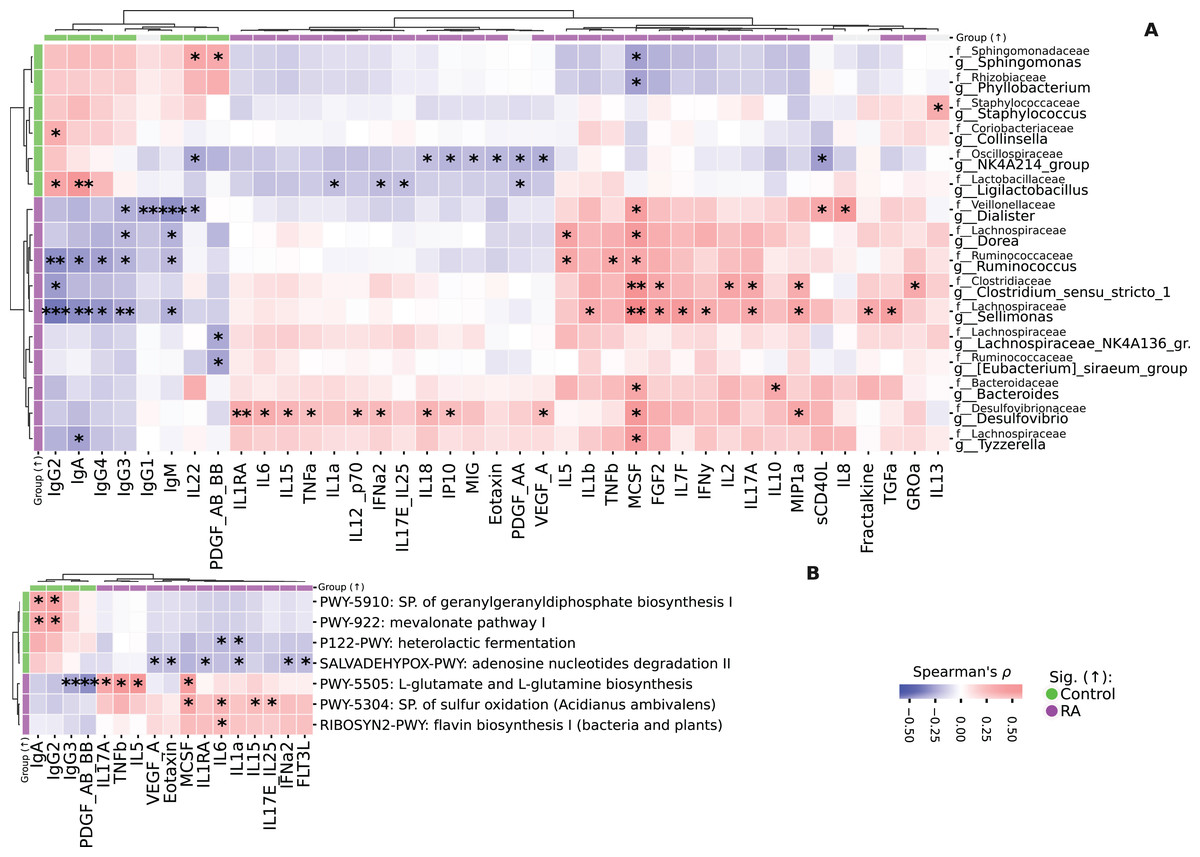
Figure 5: Heatmaps representing the correlation analysis.
(A) Heatmap of correlations between taxa and immunological profile in both study groups. Spearman’s ρ, FDR. (B) Heatmap of correlations between immunological profile and KEGG pathways. Spearman’s ρ, FDR. Correlation analysis was performed on all data. Colorbars on the heatmap edges indicate in which group the parameter is significantly higher: green—elevated in Control, purple—in RA group. Significantly differentially abundant parameters are highlighted on the heatmap edges, green—elevated in Control, purple—in RA group. *p ≤ 0.05, **p ≤ 0.01, ***p ≤ 0.001.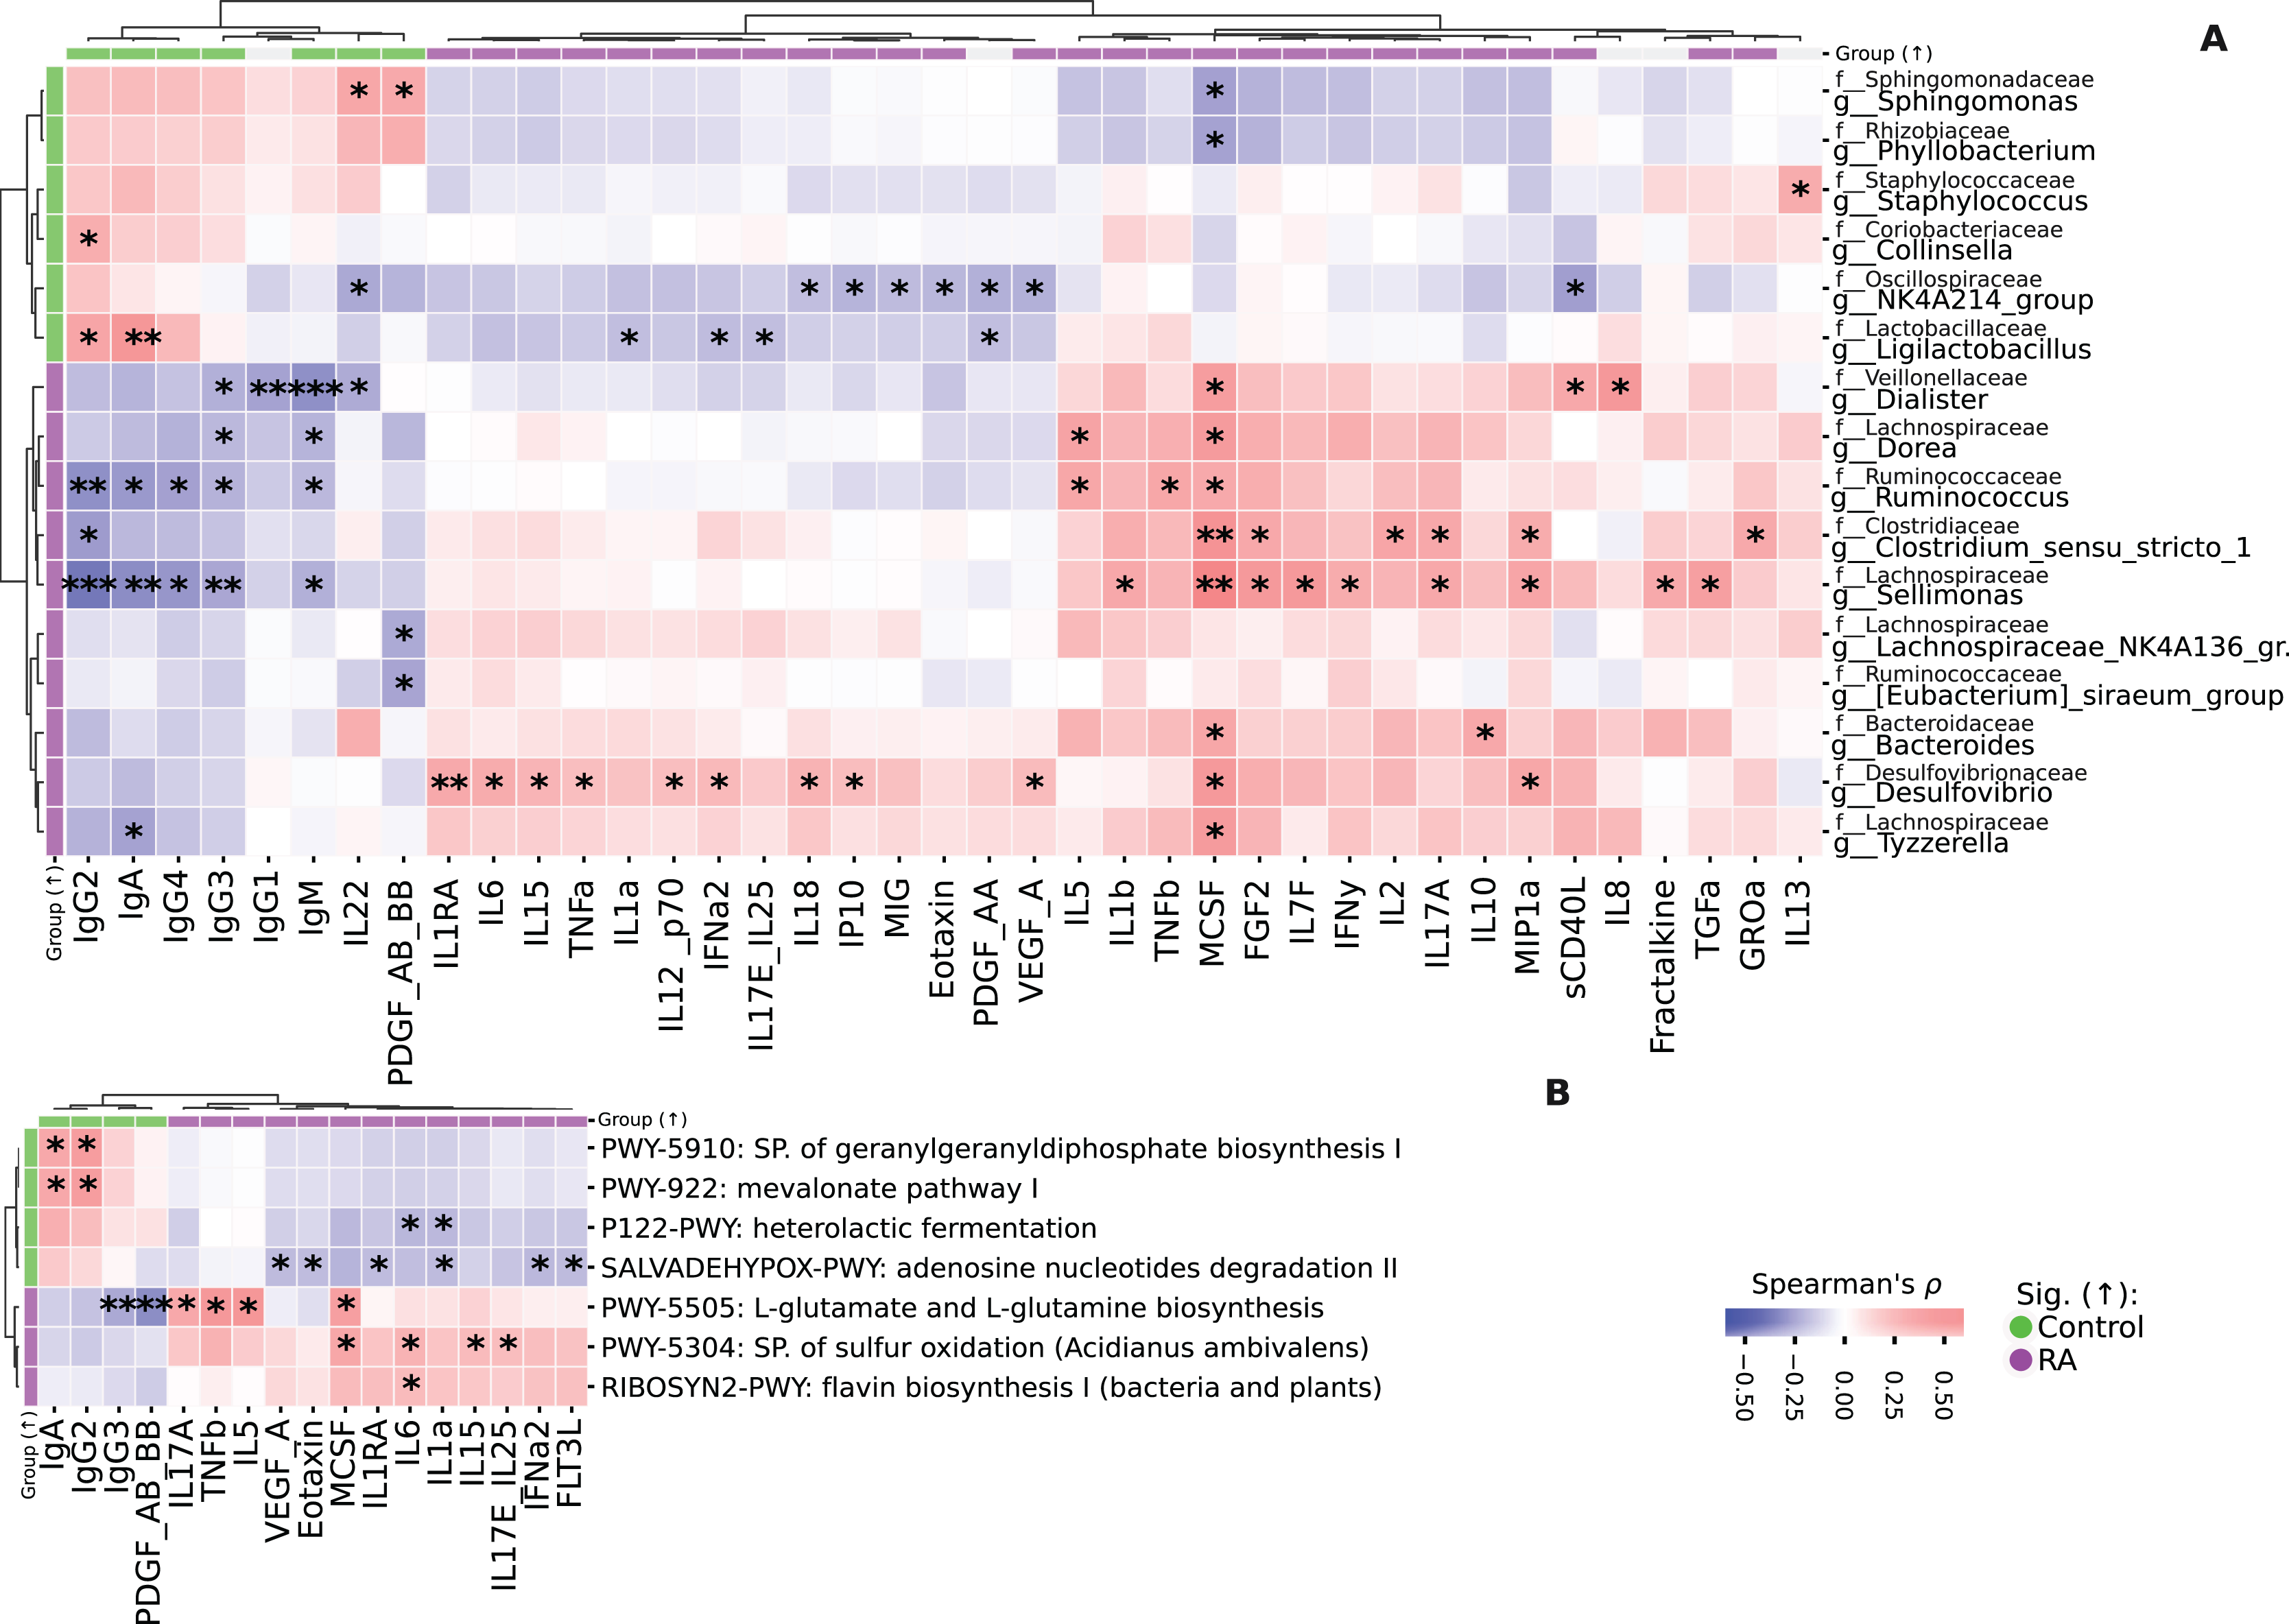
Similarly, Clostridium_sensu_stricto_1 was positively correlated with GROa, MIP1a, IL17A, IL2, FGF2, MCSF and negatively correlated with IgG2. Ruminococcus displayed a positive correlation with MCSF, TNFb, IL5, and negative correlations with IgM, IgG3, IgG4, IgA, and IgG2. Additionally, g_Dorea had positive correlations with MCSF and IL5, while being negatively correlated with IgM and IgG3. Tyzzerella was positively correlated with MCSF and negatively correlated with IgA. Bacteroides had positive correlations with IL10 and MCSF.
Both Lachnospiraceae_NK4A136_group and Eubacterium_siraeum_group were negatively correlated with PDGF_AB_BB. Collinsella exhibited a positive correlation with IgG2, while Staphylococcus was positively correlated with IL13.
We also identified differentially abundant taxa in fact follow the same pattern as cytokines/chemokines levels, demonstrating a correlation with RA/RA forms. Notably, the strongest correlation is observed in taxonomic features associated with RA, while features associated with Control show a weaker association, although consistent across all such features (Fig. S3). Additional information on differentially abundant taxa distribution in RA/RA forms is provided in Fig. S3. In study group with RA, there is a notable prevalence of the sulfur oxidation super pathway, which demonstrates a positive correlation with proinflammatory cytokines such as IL17E, IL25, IL15, IL6, and MCSF. Additionally, the biosynthesis pathways for L-glutamate and L-glutamine exhibit positive correlations with IL17A, TNFb, IL5, and MCSF. Conversely, these metabolic pathways exhibit a negative correlation with IgG3 and PDGF_AB_BB (Fig. 5B). Furthermore, Mevalonate pathway I and geranylgeranyldiphosphate biosynthesis I display positive correlations with IgG2 and IgA. The flavin biosynthesis I pathway is positively associated with IL6 (Figs. S4, S5).
Analysis of lachnospiraceae and oscillospiraceae families
The family-level relative median abundance revealed an increased level of Lachnospiraceae and a decreased level of Oscillospiraceae in the RA group (Figs. 6A–6C). Key taxa within the Lachnospiraceae family included Dorea, Sellimonas, Lach._NK4A136. and Tyzzerella. Similarly, key taxon within the Oscillospiraceae family was identified as NK4A214 (Fig. 6E). Among these families, two specific species, Dorea and NK4A214_group, exhibited significant differences in abundance (Fig. 6D) and emerged as the most crucial predictors in the dataset (Fig. 6E).
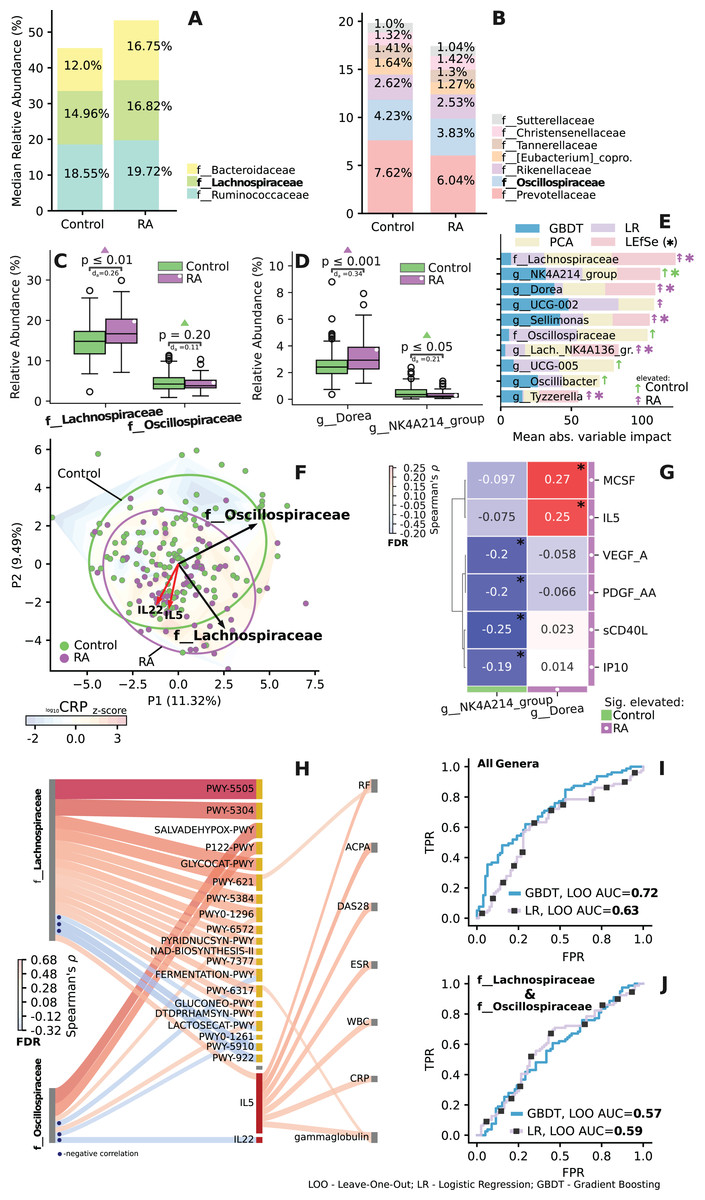
Figure 6: Importance and correlation analysis of differentially enriched and related taxa of the Lachnospiraceae and Oscillospiraceae (LO) families.
(A and B) Relative median abundance at family level. (C and D) Difference in relative abundance at family and genus level for key LO taxa. Mann-Whitney U test, with Cliff’s Delta abs. effect size (d). (E) Key taxa of LO families identified on leave-one-out cross-validation, by impact on PCA ordination and LEfSe analysis. Significant for LEfSe analysis, taxa are indicated by asterisks. Importance scores are scaled using ranking and min-max procedure. (F) Ordination based relative abundance of LO taxa and associated IL-5, IL-22 data (standard scaled). Loadings are shown as arrows, reflecting the effect of variables on the spread of ordination. Gradient reflects change in scaled log CRP level across ordination, based on linear interpolation. (G) Significant correlation between cytokine levels and key genera. (H) Significant correlation between relative abundance of LO families (left) with abundance of metabolic pathways and cytokines (middle), with clinical parameters (right). Spearman’s ρ, FDR. (I and J) ROC curve—reflects quality of classification between control and RA groups during leave-one-out cross-validation. AUC values >0.5 indicate non-random classification. (I) ROC curve and AUC value for LOO classification based on relative abundances of all genera. (J) Based on LO taxa. Control group shown in green, RA in purple. *p ≤ 0.05.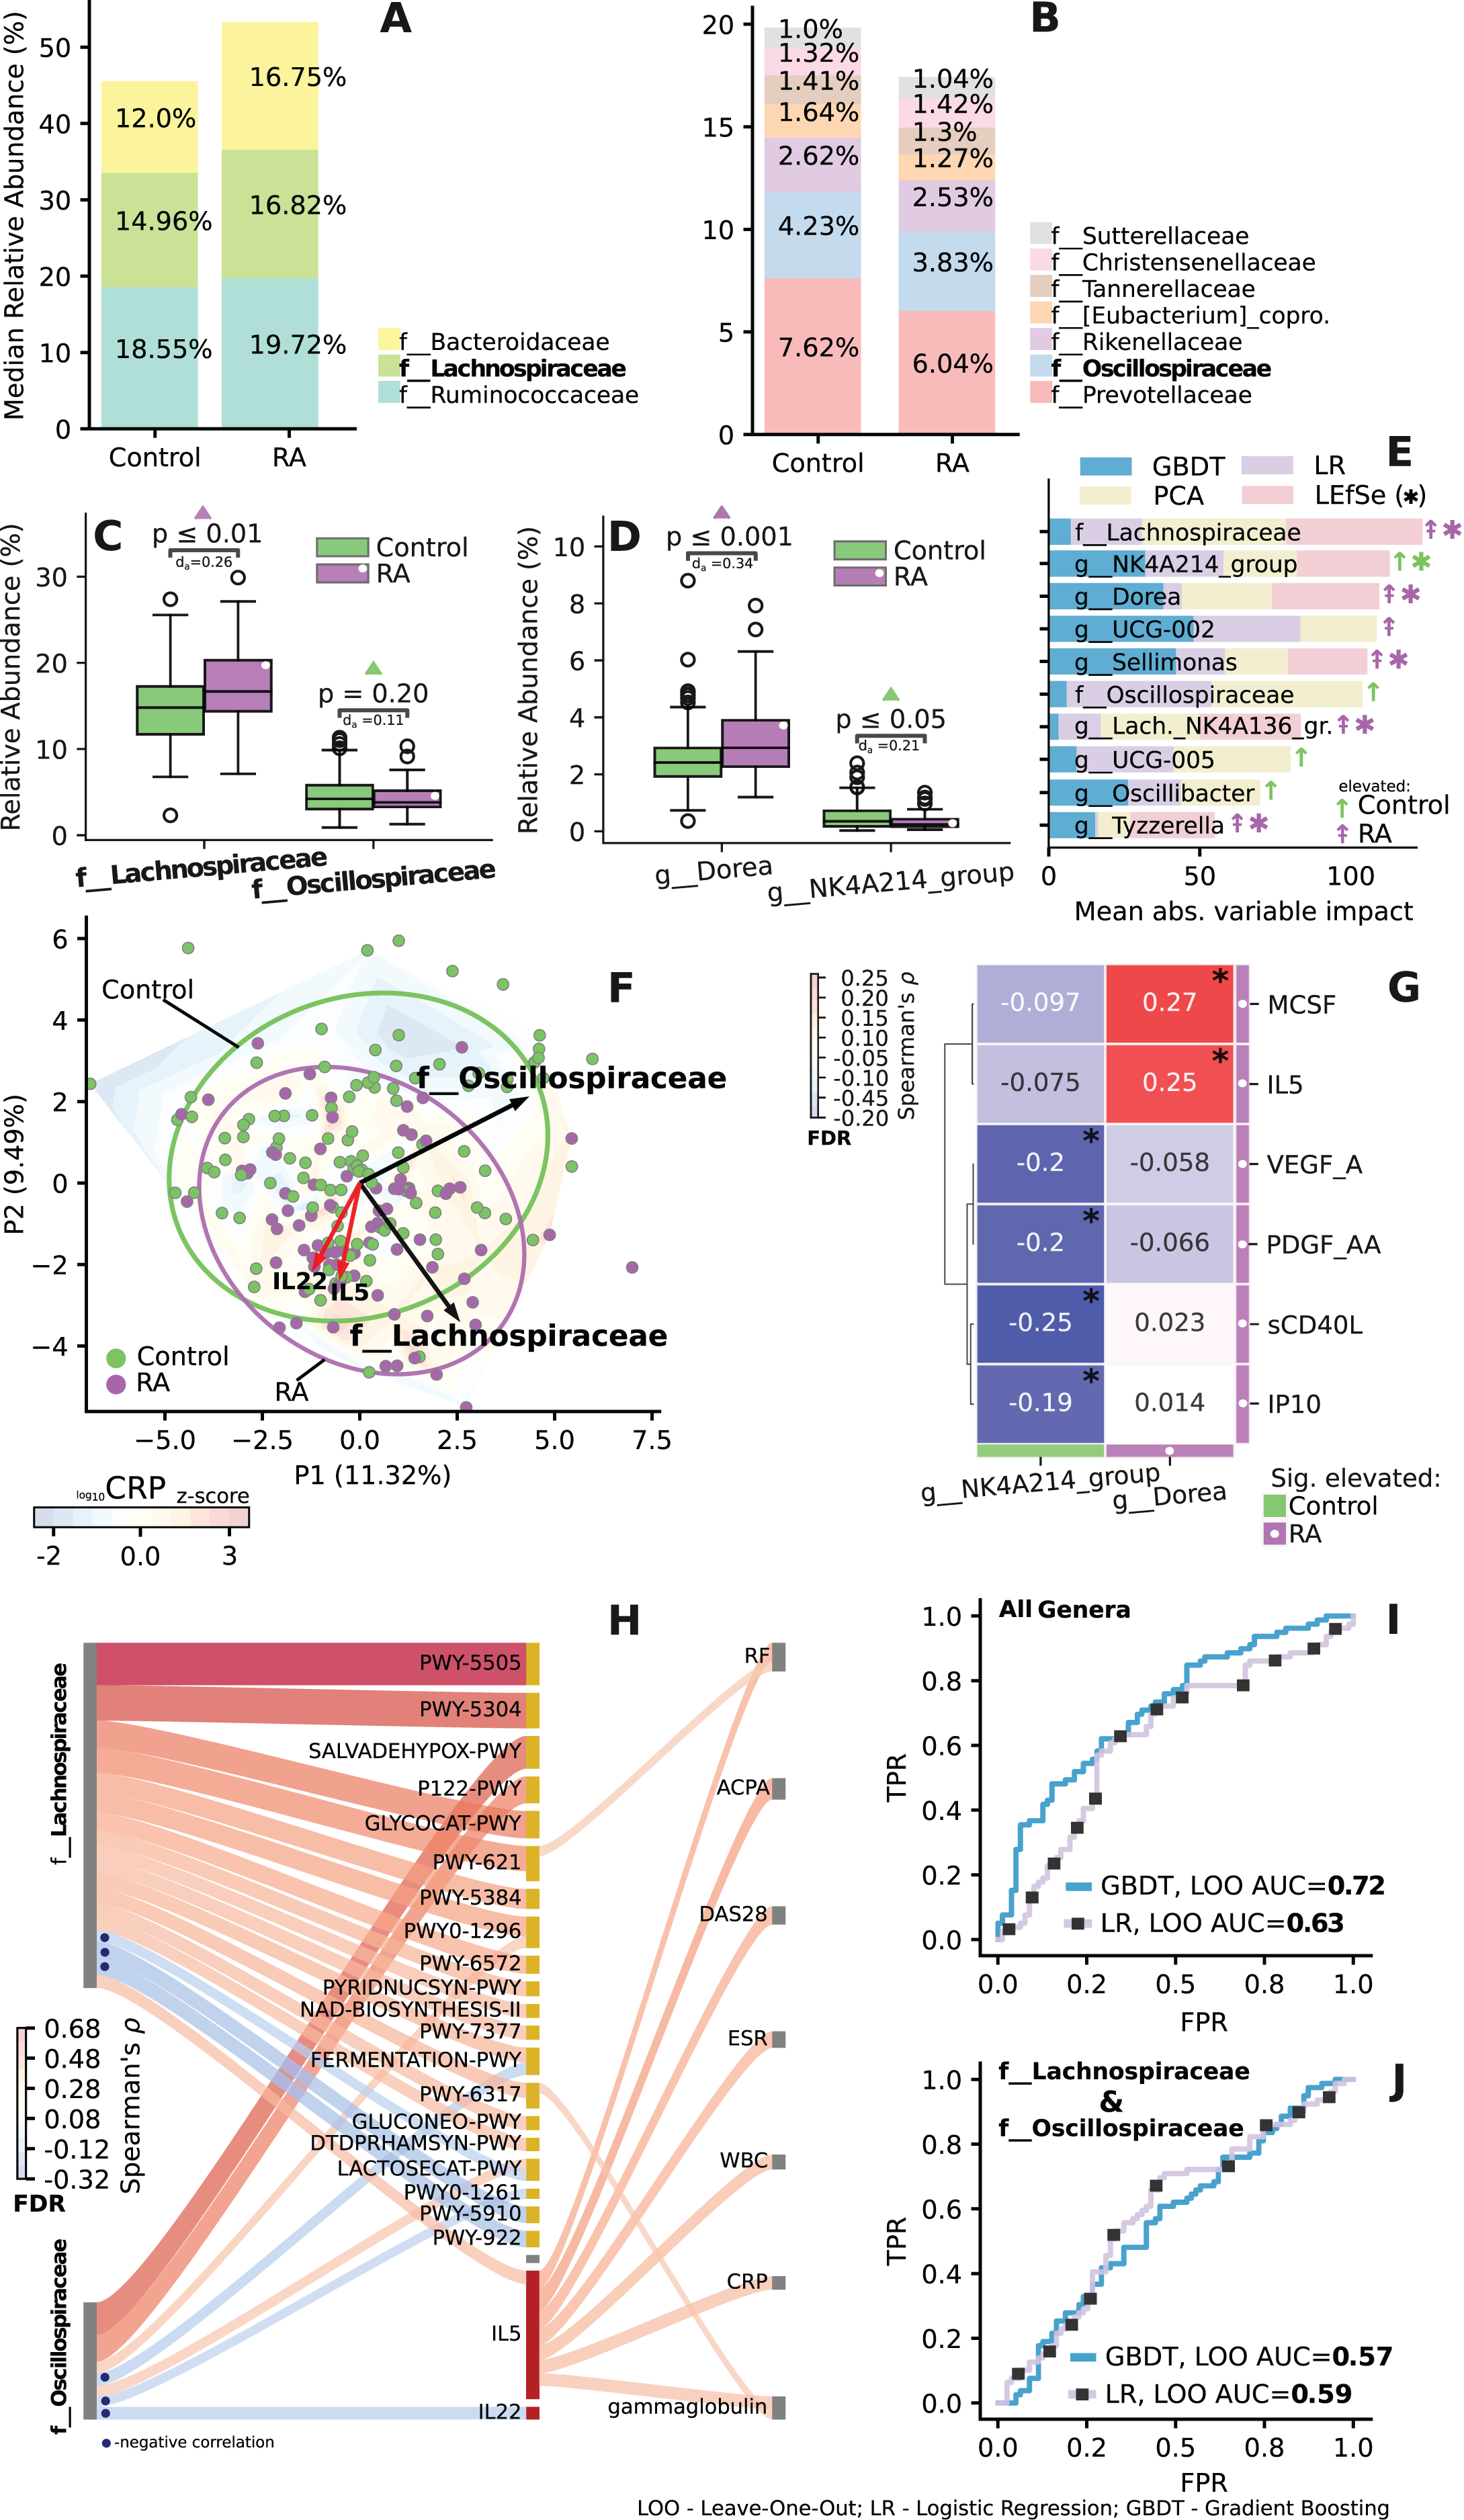
When examining significant correlations between the relative abundance of Lachnospiraceae and Oscillospiraceae (LO) families and both immunological markers and clinical parameters, significant associations emerge (Figs. 6F–6J). Notably, Lachnospiraceae correlates with interleukin-5 (IL5), which, in turn, is associated with various clinical indicators. Oscillospiraceae, on the other hand, exhibited a negative correlation with interleukin-22 (IL22) (Fig. 6H), key taxa of both families Dorea and NK4A214 also demonstrated specific correlations with certain immunological parameters (Fig. 6G).
LO families display divergent correlations with various metabolic pathways. Specifically, two pathways demonstrate inverse associations over LO: lactose degradation I (Lactosecat-PWY) and mixed acid fermentation (Fermentation-PWY) pathways (Fig. 6H). Additionally, a strong positive correlation is observed between the Lachnospiraceae family and L-glutamate and L-glutamine biosynthesis (PWY-5505), super pathway of sulfur oxidation (PWY-5304), sucrose degradation III pathway (PWY-621) (Fig. 6H). The LO families also had the highest impact on prediction (Fig. 6F), and when used alone independently from other taxonomic features exhibited AUC values of 0.57 and 0.59 (Fig. 6J). Additional information on feature importance analysis for all genera is provided in Fig. S6.
Discussion
The relationship between RA and gut microbiome has been demonstrated in a large number of studies (Scher & Abramson, 2011; Chiang et al., 2019b; Kishikawa et al., 2020; He et al., 2022; Zhao et al., 2022; Lin et al., 2023; Dagar et al., 2023; Romero-Figueroa et al., 2023). The bacteria-related metabolic pathways and their role in RA development are also of big scientific interest (Qiu et al., 2021). However, the influence of the taxa in the perspective of immunological biomarkers is still under study. Regarding this in our research, we assessed 113 healthy subjects and 77 RA patients to determine the effect of the gut microbiome, metabolic pathways, and their interactions with the various immunological markers on RA development.
The results of the taxonomic analysis showed that the gut microbiota of the healthy control group and RA group significantly differed. The certain correlations between immunological, microbiomic markers, and metabolic pathways were determined.
Our findings identified gut microbiome alteration in individuals with RA and control groups by both α-diversity and β-diversity, which was consistent with previous studies results (Bander et al., 2020; Li et al., 2021). α-diversity in the RA group was significantly lower compared to the control group, which was in concordance with most previous RA studies according to a review by Belvoncikova, Maronek & Gardlik (2022). Contrary to Chen et al. (2016) and Chiang et al. (2019b) we did not reveal any significance in α and β-diversity in subgroups depending on RF or ACPA status. Generally, data on taxa relative abundance differ from our previous study on the oral microbiome, where we observed a decrease in butyrate and propionate-producing bacteria (Kozhakhmetov et al., 2023). At the phylum level Proteobacteria and Actinobacteriota were decreased in RA group comparing with control group consistently with Sun et al. (2019), however these results were inconsistent with previous Chen et al. (2016) findings that demonstrated the increase of Actinobacteriota in RA. The predominance of Clostridiaceae, Bacteroidaceae, Lachnospiraceae, Ruminococcaceae, Veillonellaceae at the family level were in line with the most previous studies (Vacca et al., 2020; Bander et al., 2020; Wang et al., 2022b; Dagar et al., 2023), and inconsistent with research from China (Liu, Zou & Zeng, 2013; Chiang et al., 2019a). Interestingly, that genera Dorea, Tyzzerella and Sellimonas of Lachnospiraceae family were more abundant in RA group, that are fortified by the present investigations (Vacca et al., 2020; Dagar et al., 2023). In concordance with Chiang et al. (2019b) Clostridiales predominated in ACPA positive RA form, Prevotella predominated in RF positive RA form.
According to our findings the most predictable powered species were f. Lachnospiraceae g_Dorea and f. Oscillospiraceae g. NK4A214, which compositionally separate the RA and Control group.
Lachnospiraceae according to our findings was not only the most abandoned taxa, but also the most immunologically active taxa in RA group, these findings go in line with several recent studies including Rooney et al. (Zhang et al., 2015; Rooney et al., 2021; Dagar et al., 2023). Lachnospiraceae related metabolic pathways are known to affect homeostasis implying proinflammatory cytokines (Vacca et al., 2020). Our results are partly consistent with the research across the globe, precisely with the results of recent (Liu et al., 2023) animal model study, which demonstrated the increase of Lachnospiraceae, and Shi et al. (2019) also demonstrated the relation of this taxon to atherosclerosis in RA. Abundance of Dorea was previously associated with the most autoimmune disorders such as Hashimoto disease (Zhao et al., 2018), type 1 diabetes mellitus (Liu et al., 2021) and multiple sclerosis (Bonnechère, Amin & van Duijn, 2022). It also should be mentioned that according to Odamaki et al. (2016) Lachnospiraceae is broadly associated with the aging process. However, our results are controversial to the research of Kishikawa et al. (2020) which demonstrated the high abundance of Prevotella spieces in RA patients.
According to present studies Oscillospiraceae is negatively associated with inflammatory diseases (Xu et al., 2021; Lima & Longman, 2021), obesity (Konikoff & Gophna, 2016; Chen et al., 2021), lung cancer (Zhou et al., 2020), this taxon demonstrated a positive association in individuals with elevated social and personality traits (Johnson, 2020), which is consistent with the results of our research, explaining the increased abundance of this taxon in healthy control group. In a recent review, Yang et al. (2021) declare that Oscillospiraceae is probable taxon with the capacity to generate short-chain fatty acids (SCFAs), including butyrate and may serve as a crucial benchmark for identifying “next-generation probiotics”.
Two metabolic pathways: Fermentation pathway: mixed fermentation acid fermentation and Lactosecat pathway: lactose and galactose degradation I demonstrated the contradictory correlations regarding the two mentioned above taxa.
Fermentation pathway: mixed fermentation acid fermentation, showed the most predictable power and demonstrated positive association with the most abundant in RA group Lachnospiraceae and negative association with the most abundant in Control group Oscillospiraceae is essential in lactic acid regulation, the latter is broadly studied in perspective of autoimmunity, precisely rheumatoid arthritis. Its key role in synoviocytes’ proliferation, proinflammatory cytokines secretion, immune cell activation, and even ACPA secretion is widely discussed in Wang et al. (2022a), and it is also being considered as a new potential therapeutic approach.
Lactosecat pathway: lactose and galactose degradation I also showed predictable power demonstrating negative association with the most abundant in RA Lachnospiraceae and positively associating with the most abundant in Control group Oscillospiraceae, which could be explained by the capacity of lactose and galactose to induce the production of Galectine-10 (Fu et al., 2023). The latter is related to eosinophilic diseases (Tomizawa et al., 2022) and may contribute to autoimmune disorders as well according to our findings. Moreover, it is known that the action of the final product of lactosecat pathway lactate affects the mobility of synovial T cells, keeping them in the tissue space (Qiu et al., 2021), which allows us to assume that Lachnospiraceae may enhance autoimmunity via this pathway downregulation.
IL 5 demonstrated the most predictable power among immunological profiles, associating with the most abundant in RA group Lachnospiraceae, proinflammatory laboratory parameters, and essential RA antibodies. Interestingly in existing studies IL 5 is commonly associated with eosinophilic diseases (Nagase, Ueki & Fujieda, 2020), however, its role in autoimmune disorders is being unraveled, a recent study by Berti et al. (2023) related the eosinophilic granulomatosis with polyangiitis (Berti et al., 2023) proposed it as a potential target to this vasculitis treatment (Berti et al., 2023), this fortifies our finding and make it possible to consider IL5 as potential target for RA treatment as well, however further large-scaled studies are required. A negative correlation between Oscillospiraceae and IL22 is consistent with the review data by Xuan et al. (2021) reporting the two-folded nature of this cytokine and reinforces the importance of further studies on the latter marker.
Considering our investigations concerning gender disparities, it is widely acknowledged that RA disproportionately affects females, with a prevalence five times higher than that observed in males. Additionally, a more severe disease course and unfavorable prognosis have been consistently associated with the female gender (Finckh et al., 2022). Despite extensive research on gender-related distinctions in RA (Di Florio et al., 2020; Favalli et al., 2019), Yun et al. (2023) recently highlighted a lack of studies specifically examining the gut microbiome characteristics in females, elucidating their findings. Notably, our study’s findings regarding Oscillosperaceae are contradictory to those reported by Yun et al. (2023), who documented an increase in Oscillospira among RA patients. Consequently, our findings will contribute to a more comprehensive understanding of gender-specific variations in the gut microbiome.
Overall, a plethora of recent studies revealed specific potential mechanisms linking the gut microbiome, immune system, and RA pathogenesis. Thus, Prevotella copri has been mostly associated with RA susceptibility and progression (Alpizar-Rodriguez et al., 2019; Kishikawa et al., 2020), likewise, Blautia spp., Streptococcus spp. (Liu et al., 2020), and Ruminococcus (El Menofy et al., 2022; Wu et al., 2024) were associated with RA; while Roseburia spp., Lachnoclostridium spp. (Liu et al., 2020) and Lachnospiraceae (Wu et al., 2024) were diminished in RA. These gut microbiome alterations mostly lead to short-chain fatty acids (SCFAs), bile acids and tryptophan metabolic pathways (Krautkramer, Fan & Bäckhed, 2021; Li, Liang & Qiao, 2022; Wu et al., 2024) activation, which results in proinflammatory cytokines secretion, precisely TNF-α, IL-6, IL1 and IL-17 are highly recognized in degradation of bone and cartilage tissue in RA (Zhao et al., 2022; Romero-Figueroa et al., 2023). In the scope of these previous studies and established interrelated mechanisms our research demonstrates novel findings promoting Lachnospiraceae and Oscillospiraceae contribution to the RA development through the fermentation: mixed fermentation acid fermentation and lactosecat: lactose and galactose degradation I pathways regulation and subsequent IL 5 and IL 22 cytokines’ effect.
Our findings identifying and addressing abnormalities in the microbiome, metabolic pathways, and immunological markers may provide a novel direction for treating, and even potentially preventing RA, presenting new possibilities for personalized medical approaches. By adjusting the gut microbiota via diet changes, probiotics (Bungau et al., 2021), prebiotics (Abhari et al., 2016) or fecal microbiota transplantation (Pu et al., 2022), we could potentially modify RA’s progression and treatment response. The biomarkers, linked with disease activity and therapeutic outcomes, could serve as indicators for treatment effectiveness, thus refining treatment strategies and minimizing the current trial-and-error method in RA care. Our finding may contribute to the diagnostic immunological and microbiome panel development. Developing non-invasive, accurate tests for measuring microbial composition and function is crucial for incorporating these biomarkers into clinical practice. These tests could facilitate early RA diagnosis, monitor disease evolution, and customize treatment plans based on individual microbiome profiles. Understanding how these microbes affect RA could also uncover new therapeutic targets, providing alternative treatments for patients unresponsive to existing options.
Conclusion
Our research has identified differences in the gut microbiome of RA patients compared to healthy individuals. Notably, both groups showed a distinct microbial pattern marked by a high abundance of specific taxa, such as Lachnospiraceae in RA and Oscillospiraceae in healthy control group, demonstrating contradictory metabolic pathways involvement. Our study also offers potential biomarkers in perspective of immunological and bacterial metabolic pathways interactions. All these findings affirm the potential involvement of determined biomarkers in RA development, offering new directions for further research and determination of new treatment approach for precision RA treatment.
Strengths and limitations of the study
The strength of the study lies in its thorough examination of the complex interplay among the microbiome, metabolic pathways, and immunological markers. To the best of our knowledge, this study signifies pioneering research on the gut microbiome in individuals with RA in Kazakhstan, and potentially Central Asia at large. It constitutes a significant contribution to the existing knowledge base regarding the research landscape of RA in this region. Future studies undertaken by researchers worldwide with a broader range of demographic groups are required. This approach will, probably, ensure our findings are applicable across different cultures and genetic profiles, thereby broadening their relevance and impact on a global scale. Our findings offer insights into the RA pathogenetic aspects and their potential diagnostic and therapeutic implications, however further research is needed to unravel the underlying mechanisms and relevance of these differences in RA. Future research should also widen its focus to include long-term studies on individuals with RA from the debut of their condition, looking at how different treatments affect the microbiome over time. This method will help us better understand the microbiome’s role in RA development and responds to treatment.
Certainly, there are several limitations in our study. The study emphasizes the necessity for larger-scale research to enhance statistical power and increase the robustness of the findings. The current sample size may not adequately represent the diversity within the RA patient population. The study’s findings are limited by the focus on patients with RA with long-term disease duration, potentially limiting the generalizability of the results to individuals in the early stages of the disease. All RA patients received the treatment before and at the time of the study, which included disease-modifying and symptomatic treatment, while the control group included healthy individuals without getting any drugs. The functional compartment of the microbiome was assessed via 16S rRNA sequence profile, and we assume that further metagenome sequencing is required, which facilitates a more comprehensive metabolic profiling of microbial communities by capturing the diversity of all related genes, enabling predictions about their behavior under different conditions, including RA, offering insights into how the microbiome influences the disease’s development and progression.
Supplemental Information
Microbial biodiversity in rheumatoid arthritis (RA) patients depending on rheumatoid factor (RF) and anti-citrullinated protein antibody (ACPA) status.
A. Within-sample diversity by RF factor. B. Between group diversity by RF factor. A. Within sample diversity by ACPA status. B. Between group diversity by ACPA status. Mann-Whitney U test and ANOSIM, PERMANOVA with 999 permutations.
Cytokine levels in subjects with rheumatoid arthritis in ACPA status subgroups.
Mann-Whitney U, FDR. Median aggregation.
Association of differentially abundant taxa correlated with cytokines/chemokines with RA/RA forms.
(A) Correlation of identified differentially abundant taxa with control and RA/RA forms by expected RA severity (according to cytokines/chemokines profile). Control - 0, non-severe, RF- 1, moderate, RF+ - 2, severe. Control - 0, non-severe, ACPA- - 1, moderate, ACPA+ - 2, severe. Control - 0, non-severe, ACPA-/RF- 1, mild, ACPA+/RF- - 2, moderate, ACPA-/RF+ - 3, moderate, ACPA+/RF+ - 4, severe. (B-J) Boxplots showing strong associations from subplot A. Spearman’s r rank correlation, p≤0.05 without adjustment. * - p≤0.05, ** - p≤0.01, *** - p≤0.001, , **** - p≤0.0001
Correlation network shows significant correlation between variables.
Variables (shown as nodes) that correlate with each other are connected by an edge. The color of the edge indicates the direction of the correlation, red indicates positive correlation, blue indicates negative correlation between variables. Spearman’s ρ, FDR, |ρ|>0.4.
Boxplots illustrating the KEGG pathways relative abundance and difference in medians along with a confidence intervals analysis between two study groups.
Mann-Whitney U with Hodges-Lehmann estimator for CI estimation.
Feature importance analysis for discriminating between control and RA groups using all genera.
(A) Feature importance plot. Features ordered by importance for classification (from most to least important) using GBDT (gradient boosting), LR (logistic regression), PCA (principal component analysis), LEfSe (LDA>2 & p≤0.05). (B) Classification performance obtained using LR on cross-validation. (C) ROC-AUC curve showing the classification accuracy using GBDT and LR models on cross-validation. (D) Beta ordination obtained using the top 20 most important for classification genera. (E) Correlation between 2 most important genera (f__Lachnospiraceae|g__Dorea and f__Oscillospiraceae|g__NK4A214_group) and differentially abundant pathways. Spearman’s r rank correlation, FDR adjustment, q≤0.05. Leave-One-Out cross-validation without parameter tuning or feature selection.
Raw data for Figure 4.
Rheumatoid Arthritis Disease Activity Score (DAS28), Rheumatoid Factor (RF) status and immunological profile data in the RA group.
Raw data for Figure 5.
Grouping, immunological profile, relative abundance of differentially abundant genera and pathways in Control and RA groups.
Raw data for Table 1.
Raw data of demographic and clinical parameters.