
Circular RNA circMAN1A2 promotes ovarian cancer progression through the microRNA-135a-3p/IL1RAP/TAK1 pathway
- Published
- Accepted
- Received
- Academic Editor
- Rajesh Bhardwaj
- Subject Areas
- Evidence Based Medicine, Oncology
- Keywords
- circMAN1A2, miR-135a-3p, Ovarian cancer, IL1RAP, TAK1
- Copyright
- © 2024 Li et al.
- Licence
- This is an open access article distributed under the terms of the Creative Commons Attribution License, which permits using, remixing, and building upon the work non-commercially, as long as it is properly attributed. For attribution, the original author(s), title, publication source (PeerJ) and either DOI or URL of the article must be cited.
- Cite this article
- 2024. Circular RNA circMAN1A2 promotes ovarian cancer progression through the microRNA-135a-3p/IL1RAP/TAK1 pathway. PeerJ 12:e16967 https://doi.org/10.7717/peerj.16967
Abstract
Background
Ovarian cancer (OC) is the most lethal malignancy in women owing to its diagnosis only at the advanced stage. Elucidation of its molecular pathogenesis may help identify new tumor markers and targets for therapy. Circular RNAs (circRNAs) are stable, conserved, and functional biomolecules that can be used as effective biomarkers for various cancers.
Methods
In this study, a potential circRNA related to early diagnosis of OC, circMAN1A2, was analyzed. Overexpression/knockdown of circMAN1A2 in OC cells was used to decipher its effects on cell proliferation with a Cell Counting Kit-8, 5-ethynyl-2’-deoxyuridine (EdU), cell cycle, clone formation, and wound healing assay. RNA pull-down and Dual luciferase assay were used to explain the underlying mechanism by which circMAN1A2 regulates OC cell proliferation. In vivo, the effect of circMAN1A2 in OC was evaluated using nude mouse xenograft experiments.
Results
CircMAN1A2 was highly expressed in OC and promoted proliferation, clone formation, and tumorigenicity of OC cells. In addition, we found that circMAN1A2 acted as a sponge for microRNA (miR)-135a-3p; miR-135a-3p directly targeted the 3’ untranslated region of interleukin 1 receptor accessory protein (IL1RAP) in OC cells, thereby regulating the phosphorylation of transforming growth factor-beta activated kinase 1 (TAK1), which resulted in promotion of OC cell growth.
Conclusions
CircMAN1A2 promotes OC cell proliferation by inhibiting the miR-135a-3p/IL1RAP/TAK1 axis. In conclusion, circMAN1A2 may be a biomarker for early detection of OC and a target for subsequent therapy.
Introduction
Ovarian cancer (OC) is the leading cause of death in women diagnosed with gynecological cancer (Penny, 2020; Yang et al., 2020). Since OC symptoms are nonspecific, most cases are diagnosed at an advanced stage, which results in a poor prognosis for this disease (Lheureux et al., 2019). Early screening strategies cannot reduce the OC morbidity or mortality (Modugno & Edwards, 2012), owing to a lack of diagnostic markers for OC. In view of this, the study aims to identify effective circular RNAs (circRNAs), which are biomarkers for OC, and explore their mechanism of action in OC development.
Several circRNAs, which are stably expressed non-coding RNAs, have been reported as potential diagnostic biomarkers of OC (Li et al., 2021). Among them, circ-ABCB10, circMAN1A, and circEPSTI1 can be used as diagnostic biomarkers and therapeutic targets for OC (Chen et al., 2019b; Fan et al., 2019; Xie et al., 2019). In particular, circMAN1A2 expression is significantly upregulated in the sera of OC patients and has a promising clinical application as a good diagnostic marker (Fan et al., 2019). However, the molecular mechanism of circMAN1A2 in OC is still unclear.
MicroRNAs (miRNAs) are highly conserved small non-coding RNAs (21–23 bp in length). The mechanism of miRNAs affecting the process of OC is achieved by binding to the 3′ untranslated region (UTR) of downstream mRNAs to inhibit mRNAs transcription and translation and regulate intercellular signaling (Wu et al., 2021a; Li et al., 2020). During the occurrence and progression of many cancers, such as OC, miRNAs can regulate tumor growth and metastasis (Shi et al., 2021). In addition, studies have shown that circRNAs can also act as competitive endogenous RNA (ceRNA) to adsorb miRNAs, thereby affecting the process of OC (Wang et al., 2021). Such as circ-ITCH, it acts as a ceRNA sponge for miR-145, which can increase the protein level of RASA1 and inhibit the malignant progression of OC cells in vitro and in vivo through the circ-ITCH–miR-145–RASA1 axis, contributing to the occurrence and development of cancer (Hu et al., 2018). circCDR1as suppresses tumors by sponging miR-135b-5p, whereas miR-135b-5p is a tumor-promoting factor by targeting HIF1AN in OC (Chen et al., 2019a).
IL1RAP is a cell surface protein known to be associated with the IL1 receptor (IL1R) and acts as an IL1R coreceptor to mediate the IL1 family cytokine signaling pathway in immune cells such as T lymphocytes and mast cells. While its role in other cancers remains unclear, IL1RAP has previously been shown to promote tumor growth in myeloid leukemias (Järås et al., 2010). In contrast, it was found that in Ewing’s sarcoma, a highly metastatic pediatric sarcoma, the characteristic of this malignancy EWS-FLI1 and EWS-ERG fusion oncoproteins can directly induce IL1RAP expression to activate the systemic Xc-transporter and TSS pathways, but independently of IL1R. This unexpected function of IL1RAP confers on Ewing sarcoma cells the ability to maintain and replenish cysteine and GSH pools, even in the presence of limited extracellular cystine uptake, IL1RAP is used as a cytoprotective mechanism during the metastatic cascade. Circ0037078 promotes trophoblast cell proliferation, migration, invasion, and angiogenesis via the miR-576-5p/IL1RAP axis (Zou & Mao, 2022).
In this study, we used GEO to analyze circRNAs for the early diagnosis and prognosis of OC. The role and molecular mechanism of circRNA on OC were discussed, providing a solid biological theoretical basis and new therapeutic methods for OC.
Methods
Cell lines and culture
HEK 293T cells, SKOV3, A2780, and the normal ovarian cell line IOSE-80 were purchased from American Type Culture Collection. The SKOV3, A2780, and IOSE-80 cells were cultured in Roswell Park Memorial Institute-1640 (Gibco; Thermo Fisher Scientific, Inc., Waltham, MA, USA), and HEK 293 cell lines were cultured in dulbecco’s modified eagle medium (Gibco) at 37 °C with 5 % CO2. All medium were supplemented with 10 % fetal bovine serum (Gibco), 100 U/ml penicillin, and 0.1 mg/ml streptomycin (Gibco). HEK 293T cells (human embryonic kidney 293T cells) are an important human cell line. HEK 293T cells were originally derived from a variant of the human embryonic kidney cell line. HEK 293T cells have higher transfection efficiency and the ability to generate stably expressed proteins in a short time compared to original HEK 293 cells. HEK 293T cells have high transfection efficiency, which is suitable for transfection and efficient expression of exogenous genes. This makes them a popular cell model for studying aspects such as gene expression, protein function, and cell signaling. HEK 293T cells have good growth characteristics in vitro culture, are able to proliferate rapidly, and are easy to maintain and passage. They usually grow in suspension and are able to form dense cell communities. The IOSE-80 cell line is a mutant strain of human ovarian epithelial cells that is commonly used as a model cell line for in vitro studies. The IOSE-80 cell line was originally derived from normal human ovarian superficial epithelial cells and was formed by in vitro mutagenesis, so it has the characteristics of normal human ovarian superficial epithelial cells. The IOSE-80 cell line is commonly used to study the pathogenesis of ovarian cancer, the function of tumor suppressor genes, cell proliferation and cycle regulation. Due to the specificity of its origin, it has also been used as a research model to mimic precancerous ovarian lesions in vitro. IOSE-80 cells generally exhibit good cell proliferation and can be stably passaged in vitro culture. In addition, they have a relatively normal cell morphology and phenotype. SKOV3 cells are a commonly used human ovarian cancer cell line that is often used as a model for in vitro studies. SKOV3 cells were originally derived from ovarian cystadenocarcinoma tissue from a 64-year-old woman. SKOV3 cells are widely used in the study of ovarian cancer because of their ability to proliferate stably in vitro and exhibit typical cancer cell characteristics. Due to their origin from ovarian cystadenocarcinoma tissues, SKOV3 cells are of great significance in the study of tumor formation, invasion, and metastasis. SKOV3 cells have also been studied for the cytokines, growth factors, and proteins they produce, which may play important roles in tumor development, microenvironment regulation, and immune response. A2780 is a human ovarian cancer cell line that is commonly used in experimental studies in the fields of cancer biology and drug discovery. The A2780 cell line was originally derived from the ovarian malignant adenocarcinoma tissue of a 54-year-old ovarian cancer patient. The A2780 cell line is commonly used to assess drug sensitivity and cytotoxicity of anticancer drugs. Researchers can utilize the A2780 cell line for drug screening experiments to evaluate the anti-tumor activity of different compounds against ovarian cancer cells. Due to its stable cellular properties, the A2780 cell line is widely used in tumor biology, cell signaling, tumor immunotherapy and other research fields, providing scientists with an important experimental model A2780 cells are also used to study the metastasis and invasion mechanisms of tumor cells in order to better understand the development and metastasis of ovarian cancer. Portions of this text were previously published as part of a preprint (https://doi.org/10.21203/rs.3.rs-1643743/v1).
Plasmid construction and cell transfection
To construct the circMAN1A2 overexpression vector, full-length human circMAN1A2 was subcloned into the pLO5ciR vector (Geneseed Biotech, Guangzhou, China). To knockdown circMAN1A2, small interfering RNA (siRNA) targeting the back splice junction of circMAN1A2 (siRNA1, siRNA2, siRNA3) and siRNA-negative control (NC) were synthesized (GenePharma). The most effective siRNA1 and si-NC molecules were subcloned into the lentivirus vector (pLKO.1) to construct sh-circMAN1A2 and sh-NC vectors. The circMAN1A2 vector, sh-circMAN1A2, and its control plasmids were transfected into 293T cells for lentivirus preparation, and the viruses were collected to infect A2780 and SKOV3 cells, and then puromycin was selected. miR-135a-3p mimics, mimics-NC, inhibitor, and inhibitor-NC were purchased from GenePharma (Shanghai, China). All transfections were performed using Lipofectamine 2000 (Invitrogen, Thermo Fisher Scientific, Inc.) according to the manufacturer’s instructions. The sequences of siRNAs, miR-135a-3p mimics, mimics-NC, inhibitor, and inhibitor-NC are listed in Table 1.
| Gene symbol | 5′–3′sequence |
|---|---|
| miR-135a-3p mimics nc | GCAGUGUGGCUUAUCAGGGAGG |
| miR-135a-3p mimics | UAUAGGGAUUGGAGCCGUGGCG |
| miR-135a-3p inhibitor nc | CCACCACAGUGUCACAGCUCCU |
| miR-135a-3p inhibitor | CGCCACGGCUCCAAUCCCUAUA |
| circMAN1A2-siRNA control | AAACGGAGGGAGUAAUGGAUAAG |
| circMAN1A2-siRNA1 | GUGAAUUUGAGGAAGAGGAAG |
| circMAN1A2-siRNA2 | GCAAUGGUGAAUUUGAGGAAGAG |
| circMAN1A2-siRNA3 | GAAUUUGAGGAAGAGGAAGAACG |
| ILRAP-siRNA | GGUGCUCACGGUCAUUAAAUG |
| ILRAP-siRNA control | ACAGUUAUGGCUUCCAGGAUG |
Notes:
- Nc
-
negative control
- siRNA
-
Small interfering RNA
- circ
-
circular
- IL1RAP
-
interleukin 1 receptor accessory protein
- miR
-
microRNA
Polymerase chain reaction (PCR) and real-time quantitative PCR (RT-qPCR)
Total RNA from the tumor tissue samples or OC cell lines with or without 4 U/µg of RNase R (ab286929; Abcam, Cambridge, UK) was extracted using TRIzol reagent (Invitrogen). Nuclear and cytoplasmic RNA from the OC cells was separated with NE-PER™ Kit (Thermo Fisher Scientific, Inc.) following the manufacturer’s instructions. Subsequently, the RNA was reversely transcribed into cDNA using RevertAid First Strand cDNA Synthesis Kit (Thermo Fisher Scientific, Inc.), Genomic DNA (gDNA) was extracted with DNA extraction kit (TIANGEN, Beijing, China). For PCR, cDNA and gDNA were used as templates to amplify the target sequence according to PCR Amplification Kit (Takara, Tokyo, Japen), and 2% agarose gel was used to detect the condition of amplification. For RT-qPCR, the target genes were amplified in a 20 µL reaction using GoTaq® qPCR Master Mix (Promega Corporation, Madison, WI, USA), which was performed under the following conditions: 95 °C for 30 sec, followed by 40 cycles of 95 °C for 3 sec and 60 °C for 30 sec. The relative gene expression levels were quantified using the 2−ΔΔCt method (Livak & Schmittgen, 2001). Primer sequences are listed in Table 2.
| primers | 5′–3′ sequence |
|---|---|
| GAPDH-F | GTCTCCTCTGACTTCAACAGCG |
| GAPDH-R | ACCACCCTGTTGCTGTAGCCAA |
| circMAN1A2 (PCR linear primer)-F | GAAGAGGAAGAACGTCTGAG |
| circMAN1A2 (PCR linear primer)-R | GGTCTCCACCACGTATTC |
| circMAN1A2 (PCR circinal primer)-F | CTGAGAAACTCCTTCCTGCC |
| circMAN1A2 (PCR circinal primer)-R | CTCTGTCTGAATTTCTGCTC |
| MAN1A2-F | CACACCTACTGGGATTCCTTGG |
| MAN1A2-R | GTAGCTGAGGTGGATGAACTCC |
| CircMAN1A2-F | CTGAGAAACTCCTTCCTGCC |
| CircMAN1A2-R | CTCTGTCTGAATTTCTGCTC |
| CircABCB10-F | CTAAGGAGTCACAGGAAGACATC |
| CircABCB10-R | GTAGAATCTCTCAGACTCAAGGTTG |
| CircEPSTI1-F | AAGCTGAAGAAGCTGAACTC |
| CircEPSTI1-R | GTGTATGCACTTGTGTATTGC |
| CircITCH-F | AAGGAGCAATGCAGCAGTTT |
| CircITCH-R | AGTCACAACTACTTCTTCAACCCAT |
| CircHIPK3-F | TATGTTGGTGGATCCTGTTCGGCA |
| CircHIPK3-R | TGGTGGGTAGACCAAGACTTGTGA |
| CircLARP4-F | GGGCATCAGGAGCAAACTTA |
| CircLARP4-R | CTGGCGAATTAAAGCCATTC |
| HGF-F | GAGAGTTGGGTTCTTACTGCACG |
| HGF-R | CTCATCTCCTCTTCCGTGGACA |
| PRLR-F | CATGGTGACCTGCATCTTTCCG |
| PRLR-R | GTGGGAGGAAAGTCTTGGCATC |
| PPP2R2B-F | ATGACTACCTCCGCAGCAAGCT |
| PPP2R2B-R | CATCACGCTTGGTGTTTCTGTCG |
| IL1RAP-F | CTGAGGATCTCAAGCGCAGCTA |
| IL1RAP-R | AGCAGGACTGTGGCTCCAAAAC |
| PAK3-F | CGCTGTCTTGAGATGGATGTGG |
| PAK3-R | CAGTCTTAGCGGCTGCTGTTCT |
| U6-F | CTCGCTTCGGCAGCACAT |
| U6-R | TTTGCGTGTCATCCTTGCG |
| miR-135a-3p-F | ACACTCCAGCTGGGTATAGGGATTGGAGCC |
| miR-135a-3p-R | CTCAACTGGTGTCGTGGA |
| miR-449a-F | ACACTCCAGCTGGGTGGCAGTGTATTGTTA |
| miR-449a-R | CTCAACTGGTGTCGTGGA |
Notes:
- RT-qPCR
-
Real-Timequantitative Polymerase chain reaction
- F
-
forward
- R
-
reverse
- circ
-
circular
- miR
-
microRNA
- IL1RAP
-
interleukin 1 receptor accessory protein
- HGF
-
hepatocyte growth factor
- PRLR
-
prolactin receptor
- PPP2R2B
-
protein phosphatase 2 regulatory subunit Bbeta
- PAK3
-
p21 (RAC1) activated kinase 3
Western blotting
Total protein was extracted from cell lysates (Beyotime, Shanghai, China). Equal amounts of denatured proteins (30 µg) were subjected to 10 % sodium dodecyl sulfate-polyacrylamide gel electrophoresis. The resolved proteins were transferred to polyvinylidene fluoride membranes (Millipore, Burlington, MA, USA) and probed using IL1RAP (1:1,000; 73070; Cell Signaling Technology Co., LTD, Danvers, MA, USA), transforming growth factor-beta activated kinase 1 (TAK1; 1:1,000; 5206; Cell Signaling Technology) and p-TAK1 (1:1,000; 9339, Cell Signaling Technology) antibodies for 1.5 h. The membranes were then incubated with goat anti-rabbit antibody (1:5,000; SA00001-2; Proteintech Group, Inc. Wuhan, China) for 1 h. The blots were visualized after chemical development using an electrochemiluminescence reagent (Thermo Fisher Scientific, Inc.). Glyceraldehyde-3-phosphate dehydrogenase (GAPDH) was used as an internal reference antibody (1:5,000; 10494-1-AP; Proteintech).
Fluorescence in situ hybridization (FISH)
Fluorescein Isothiocyanate (FITC)-labeled circMAN1A2 (5′-CTTCCTCTTCCTCAAATTCAC-3′) and Cy3-labeled miR-135a-3p probes (5′-CGCCACGGCUCCAAUCCCUAUA-3′) purchased from Geneseed were used to observe colocalization of circMAN1A2 and miR-135a-3p in OC cells. FISH assay was performed using Fluorescent in Situ Hybridization Kit (GenePharma), according to the manufacturer’s instructions. The cell nuclei were stained with 4,6-diamidino-2-phenylindole (DAPI; Beyotime). Images were photographed using a fluorescence microscope (magnification, ×400; Leica Microsystems GmbH).
Cell counting Kit-8 (CCK8) assay
Briefly, a single-cell suspension was prepared using trypsin and inoculated in 96-well plates at a density of 4 × 10³ cells/well. The 96-well plate was incubated in a 37°C, 5% CO2 incubator, and the incubation time was generally 2 h. Next, 10 µL of CCK8 reagent (Beijing Solarbio Science & Technology Co., Ltd., Beijing, China) was added and gently tap the 96-well plate to assist in mixing. The cells were incubated in a 37 °C, 5% CO2 incubator for 60 minutes.The optical density (OD) at 450 nm was measured using a microplate reader (Thermo Fisher Scientific, Inc.).
EdU staining
A single-cell suspension was prepared using trypsin and inoculated in 6-well plates at a density of 5 × 10⁵ cells/well. This was placed in a 37 °C cell culture incubator overnight to allow the cells to adhere to the wall. EdU to 20 µM was diluted with complete medium, and 100 µl of diluted EdU working solution was added to each well in a 96-well plate to a final concentration of 10 µM, and continue incubation at 37 °C for 2 hours. The cell culture medium was removed and washed two times with PBS for 3 min each. The wash solution was removed and 50 µl of 4% paraformaldehyde per well was added to fix the cells for 30 minutes at room temperature. The fixative solution was removed and washed three times with PBS for 3∼5 min each. The PBS was removed and 100 µl permeabilization solution was added (0.5% TritonX-100 in PBS) per well and incubated for 10 min at room temperature. The permeabilization solution was removed and washed two times with PBS for 3 min each. The reaction was prepared according to the kit (Beyotime) instructions, and 50 µl of the reaction was added to each well; the plate was gently shaken to ensure that the reaction evenly covered the sample, and was incubated for 30 minutes at room temperature protected from light. After removing the PBS wash, 100 µl of 1 × Hoechst33342 was added per well and stained for 10 min at room temperature in the dark. The Hoechst was removed and washed three times with PBS for 3 min each. Images were photographed using a fluorescence microscope (magnification, ×200; Leica Microsystems GmbH).
Colony formation assay
The logarithmic cells in the growth phase were obtained. Cells were digested using 0.25 % trypsin and resuspended by centrifugation to obtain a single-cell suspension; 2 × 10² cells/well were inoculated in a 6-well plate. The medium was a complete medium containing 10% FBS, plated and shaken, and then placed in a 37 °C, 5% CO2 cell culture incubator, and the cell exchange was performed every 3 days and the cell status was observed. The cells were then fixed for 15 min in 5 ml of 4 % paraformaldehyde, an appropriate amount of 1X GIMSA dye solution (Solarbio) was applied, and the cells were incubated for 10–30 min at room temperature. After washing with phosphate buffered saline (PBS) three times, the cells were air-dried naturally.
Wound healing assay
Approximately 1 × 10⁶ cells were added to a six-well plate, and the next day, the pipette tip was used to scratch parallel lines on the cell layer. The cells were then washed three times with PBS, the streaked cells were removed, and serum-free medium was added. The remaining cells were then placed in a 37 °C incubator and cultivated. Images were acquired at 0 h and 24 h.
Dual luciferase assay
The sequences of circMAN1A2 or IL1RAP 3′UTR containing the wild-type or mutant binding site of miR-135a-3p was designed and synthesized by GenePharma. These sequences were transfected into the psiCHECK2 vector (Promega). HEK 293T cells were co-transfected with the psiCHECK2 plasmids containing Insertion sequence and miR-135a-3p mimics/mimics-NC or miR-135a-3p inhibitors/inhibitor-NC using Lipofectamine 2000 (Invitrogen). After 48 h of incubation, the activities of firefly and Renilla luciferase were measured using a Dual Luciferase Reporter Assay Kit (Promega), firefly fluorescence as an internal reference.
RNA pull-down assay
A biotinylated circMAN1A2 probe (5′-CTTCCTCTTCCTCAAATTCAC-3′) synthesized by RiboBio (Guangzhou, China) was used; an oligo probe (5′-CCCCACTTTTATCTATACCCT-3′) was used as a control. Approximately 1 × 10⁷ OC cells were transfected with the biotin-labeled circMAN1A2 probe. Subsequently, the biotin-coupled RNA complex was purified through streptavidin-coated magnetic bead adsorption. The enriched circMAN1A2 and miR-135a-3p were then analyzed using RT-qPCR.
Animals
Four-week-old female BALB/c nude mice were obtained from Beijing Vital River Laboratory Animal Technology Co. Ltd. All procedures were approved by Hainan Women and Children’s Medical Center Animal Care and Use Committee. The mice were housed in polystyrene cages in a temperature-controlled room (21°C) with 55% humidity, 12-hour light/dark cycle, and fed a standard chow ad-libitum diet and either water. The mice were subcutaneously inoculated with SKOV3 cells infected with the circMAN1A2 overexpression/mock plasmid or A2780 cells infected with lentiviruses carrying sh-circMAN1A2/sh-NC plasmid (2.5 × 10⁶ cells; 200 ml). A total of 32 mice were randomly assigned to eight mice per group (n = 8). After 28 days, mice are sacrificed intraperitoneally with pentobarbital sodium (200 mg/kg) and thermal photographs are performed. Then, tumors were extracted and photographed. The tumor volume was calculated in accordance with the formula (length × width2/2), and measured weekly. The tumor weight was also determined. This study was approved by the Medical Ethics Committee of Hainan Women and Children’s Hospital (Approval No: 2021-030).
Immunohistochemical staining
After removing the samples and returning to room temperature, they were washed times with PBS for 5 minutes each. Samples were completely soaked in citric acid buffer and repaired by heating at low temperature in a microwave oven. After cooling, samples were soaked in phosphate-buffered saline three times for 5 min each and then blocked for 20 min. The primary antibody MAN1A2 (ab272611; Abcam) was diluted to the target ratio with antibody diluent and stored overnight at 4 °C. After adding another 30 min, they were washed times with PBS for 5 min each. Then, the secondary antibody was diluted three times with antibody diluent for 5 min each and incubated for 2 h at room temperature in the dark. Then it was eluted with PBS three times for 5 min each, and DAB staining, backstaining, and blocking.
Statistical analysis
Data are expressed as mean ± standard deviation. Comparisons were performed using one-way analysis of variance (ANOVA) followed by Dunnett’s post-hoc test. All statistical analyses were performed using SPSS (version 19.0; SPSS Inc., Armonk, NY, USA). Statistical significance was set at P < 0.05.
Results
CircMAN1A2 is overexpressed in OC cells
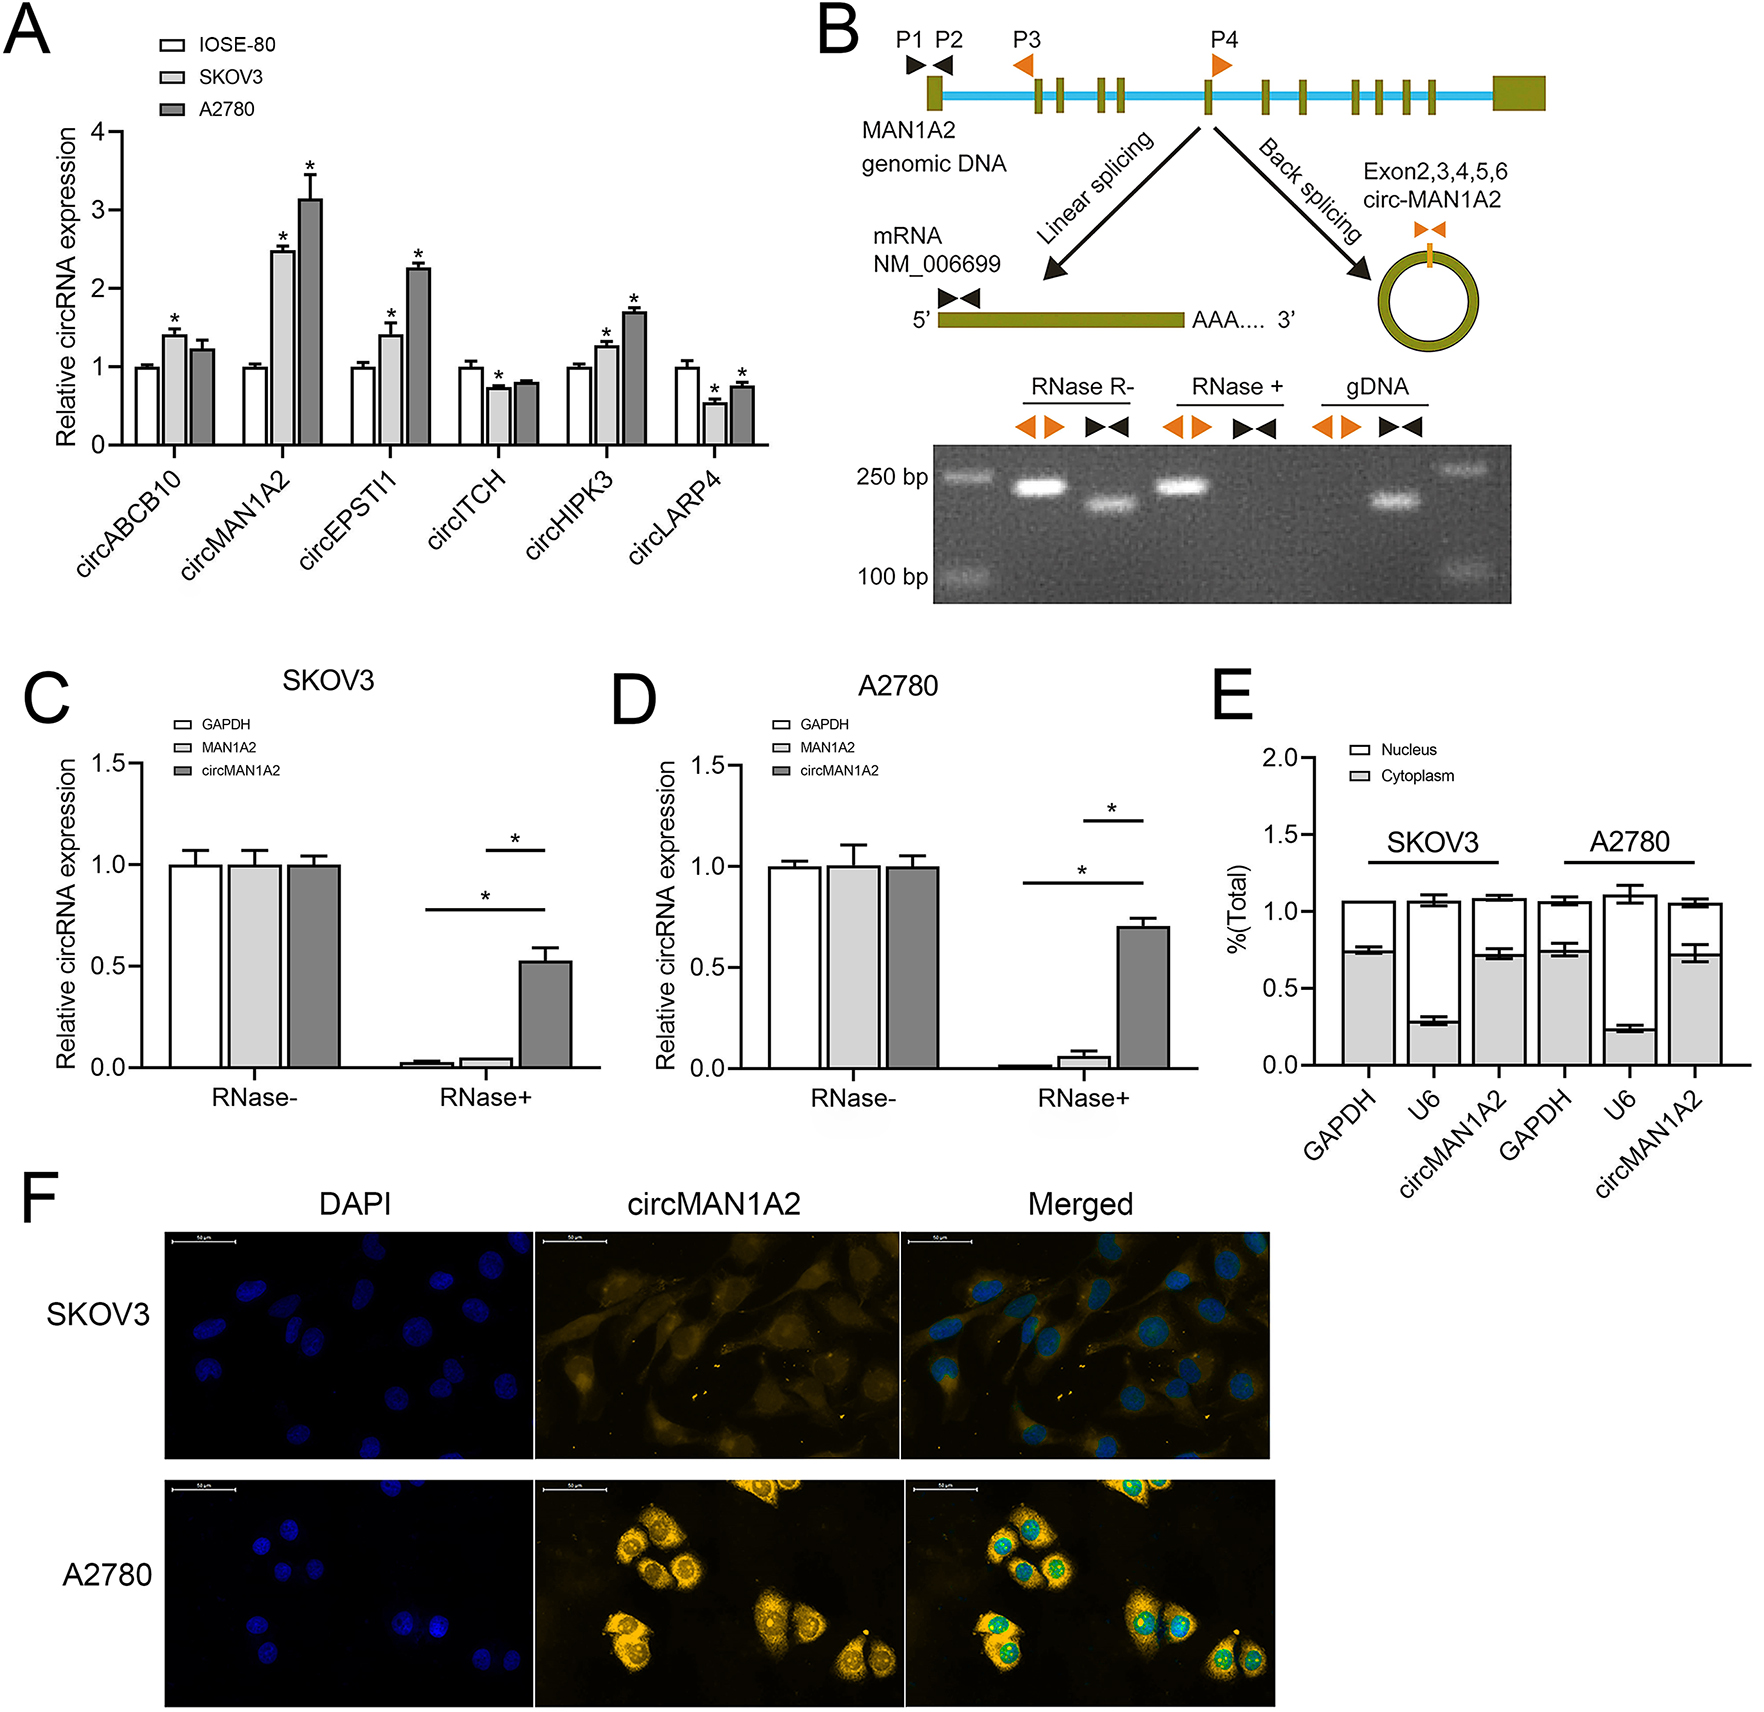
Based on previous studies (Fan et al., 2019; Xie et al., 2019; Zhou et al., 2021; Lin et al., 2021; Lin et al., 2020; Zou et al., 2018), we analyzed some circRNAs that can affect OC progression and early diagnosis, namely, circABCB10, circMAN1A2, circEPSTI1, circ-ITCH, circHIPK3, and circLARP4. These circRNAs were detected in SKOV3, A2780 human OC, and IOSE-80 human normal ovarian epithelial cells.Among them, the expression of circMAN1A2 in OC cells was higher than that in normal ovarian cells, and the expression was the highest in OC cells (Fig. 1A). In addition, PCR revealed that only circMAN1A2 was detected in cDNA (Fig. 1B). Therefore, circMAN1A2 was chosen as a potential therapeutic target for OC for further research. Subsequently, we found that in both SKOV3 and A2780 cells, RNase R treatment degraded the linear positive control (GAPDH) and MAN1A2, while circMAN1A2 was significantly resistant to the effects of RNase R (Figs. 1C and 1D). Thus, the circular structure of circMAN1A2 was verified. Moreover, through nucleoplasm isolation experiments, it was confirmed that the positive control U6 was predominantly expressed in the nucleus, supporting earlier studies (Zhang et al., 2022; He et al., 2022). The localization of circMAN1A2 was consistent with that of the positive control GAPDH, which was mainly expressed in the cytoplasm (Fig. 1E). The FISH assay showed that circIL1RAP was mainly located in the cytoplasm of SKOV3 and A2780 cells (Fig. 1F). These results indicated that circMAN1A2 may be a potential therapeutic target for OC, and the mechanism of its action may involve circRNA acting as ceRNA.
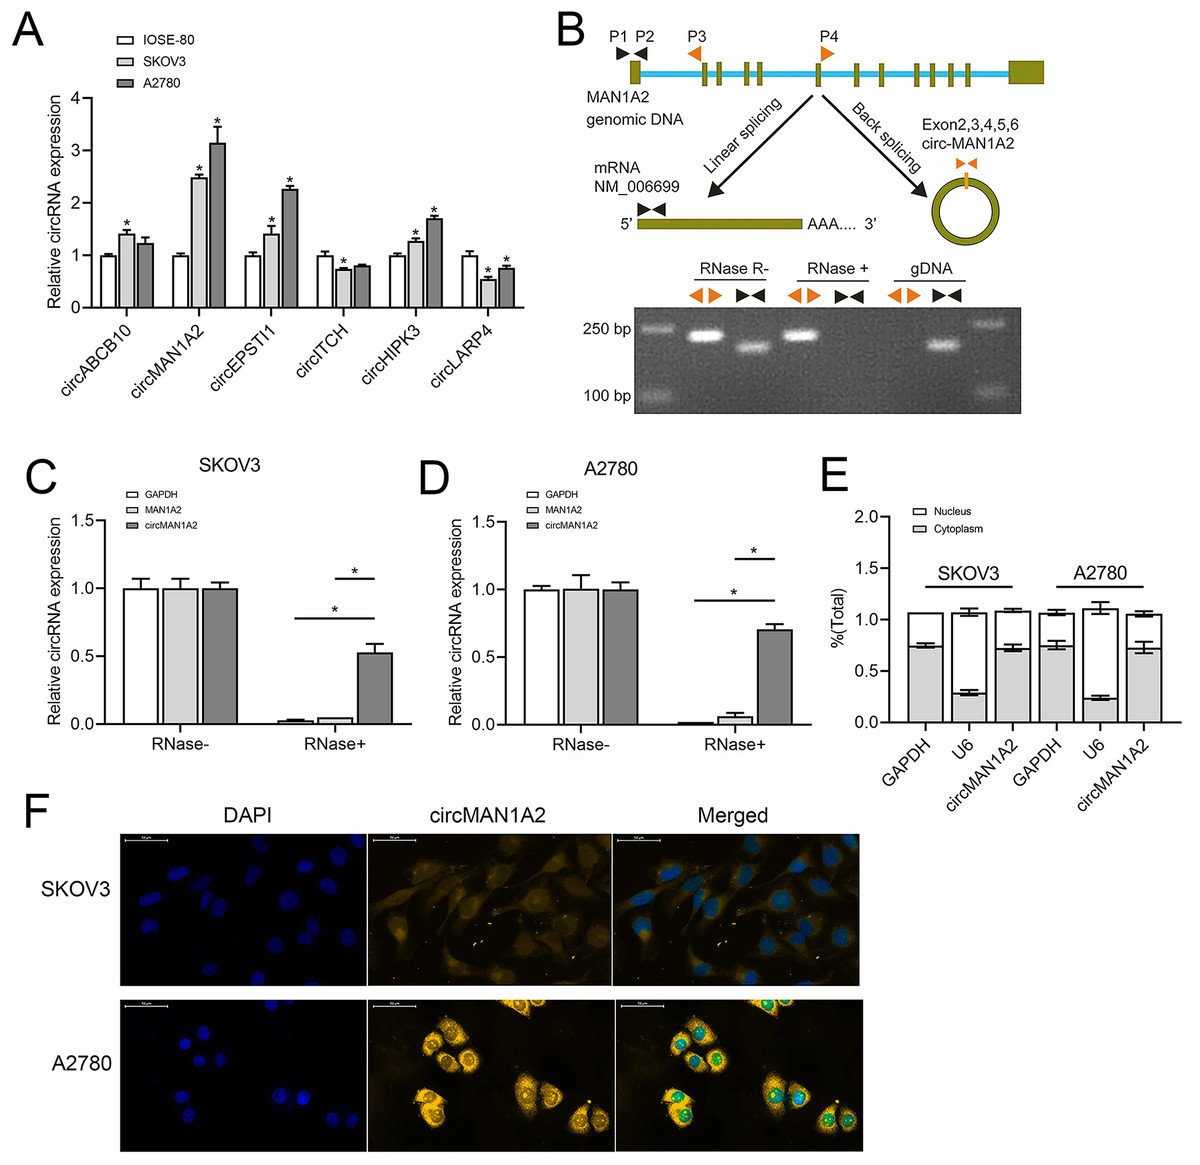
Figure 1: CircMAN1A2 is overexpressed in OC cell lines.
(A) RT-qPCR analyzed the expression of circABCB10, circMAN1A2, circEPSTI1, circITCH, circHIPK3, and circLARP4 in SKOV3, A2780, and ISOE-80 cells. (B) The looping site of circMAN1A2 was detected using agarose gel electrophoresis. (C, D) RT-qPCR analyzed the expression of circMAN1A2 in SKOV3 (C) and A2780 (D) cells with or without RNase R treatment. (E) Nucleoplasmic separation detected the expression of circMAN1A2, and positive controls GAPDH and U6 in nucleus and plasm. (F) FISH assay detected the localization of circMAN1A2 in cells. Magnification x400; Blue is DAPI staining and red is circMANA2 probe. *p < 0.05.CircMAN1A2 promotes OC cell proliferation
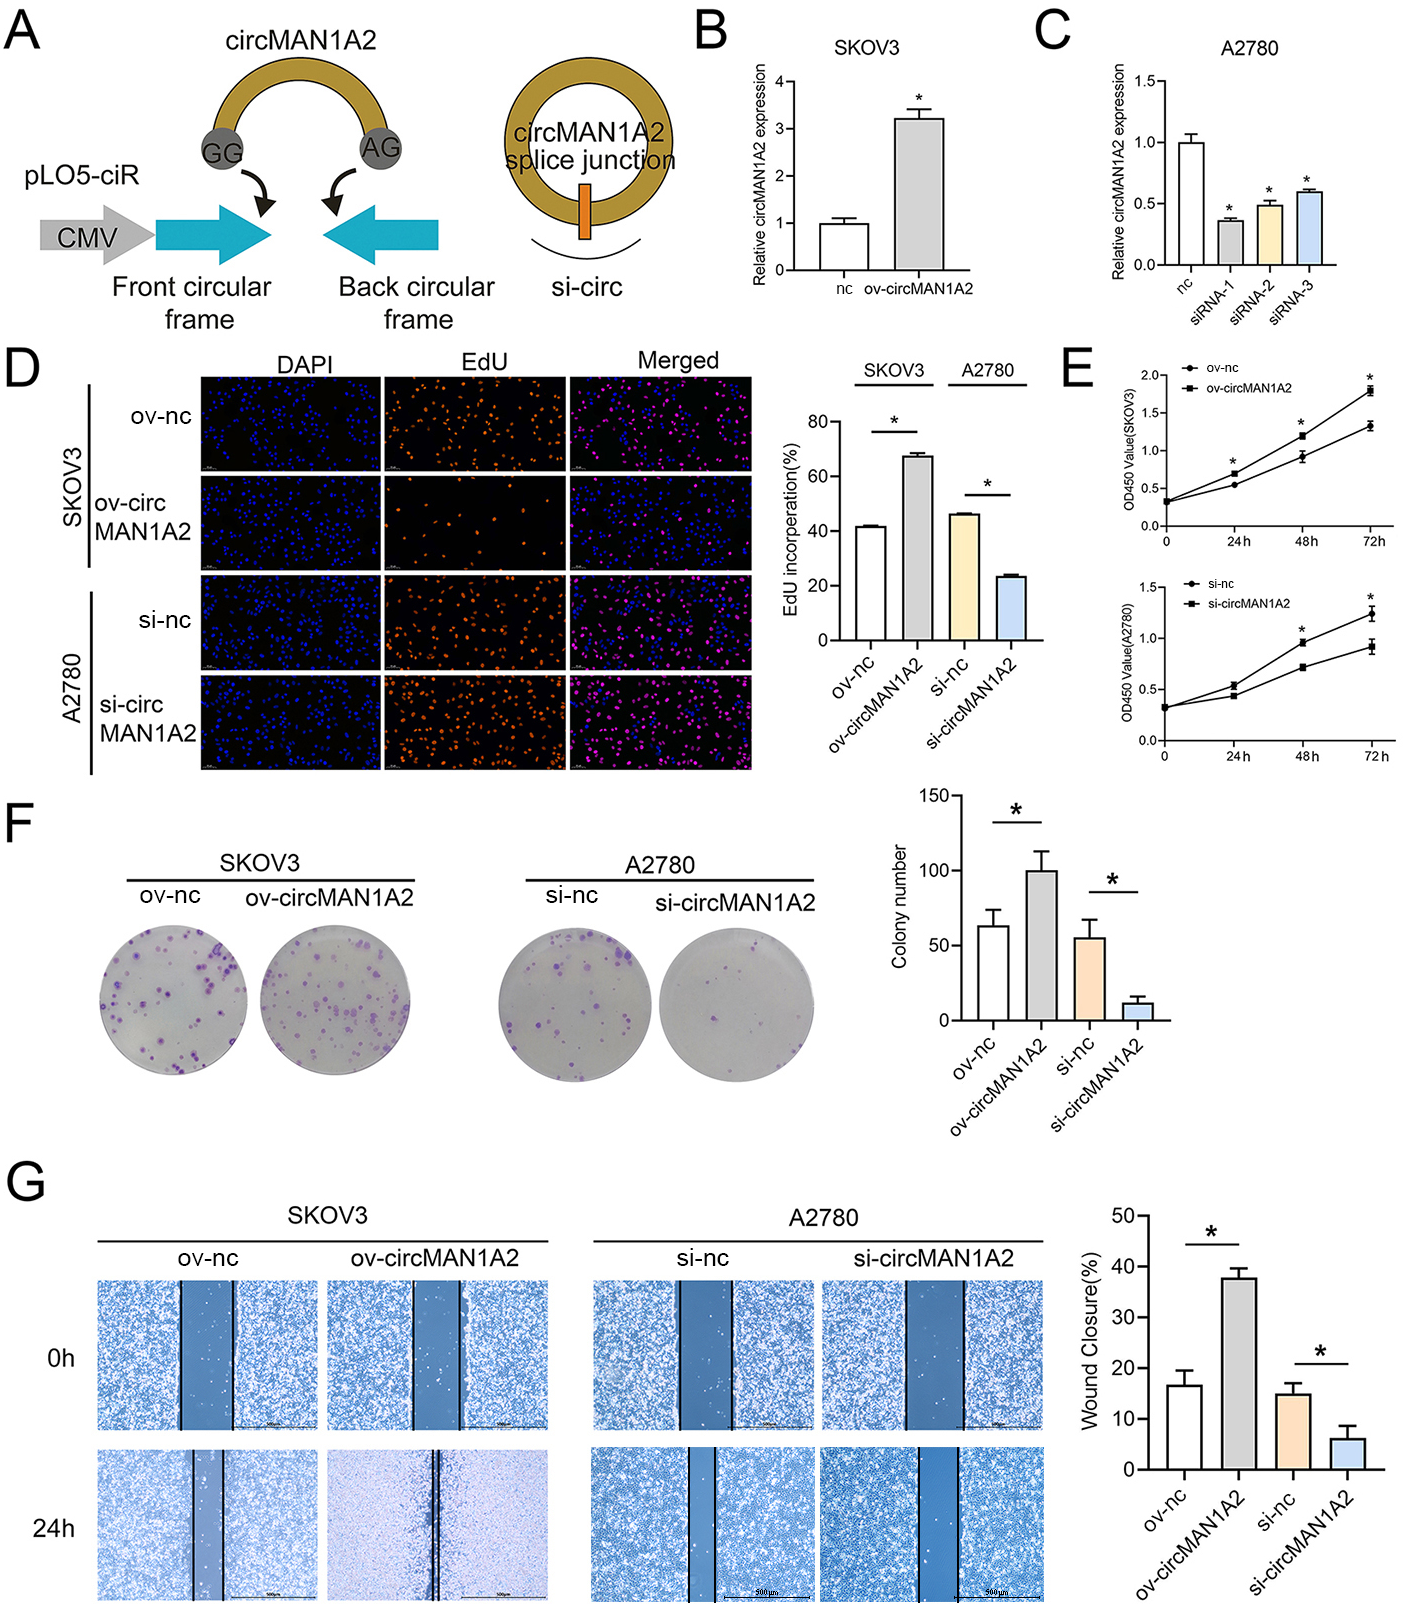
To explore the effect of circMAN1A2 on OC cell proliferation, three siRNAs targeting circRNA were designed for the junction of circMAN1A2. circMAN1A2 overexpression and knockdown plasmids were constructed (Fig. 2A). Compared with the control group, the expression of circMAN1A2 was upregulated in the ov-circMAN1A2 transfection group and down-regulated in the si-circMAN1A2 transfection group. Among the three si-circMAN1A2 transfection groups, circMAN1A2 expression was lowest in the si-circMAN1A2-1 group. The results indicated that si-circMAN1A2-1 had the best inhibition effect and was therefore used as an inhibitor of circMAN1A2 expression in subsequent experiments (Figs. 2B and 2C). The results of EdU staining showed that the EdU incorperation in the ov-circMAN1A2 group was significantly increased compared with the ov-nc group. Compared with the si-nc group, the EdU incorperation in the si-circMAN1A2 group was significantly reduced. The results of CCK8 staining showed that the OD value in the ov-circMAN1A2 group was significantly higher than that of the ov-nc group at 48 h and 72 h. Compared with the si-nc group, the OD value in the si-circMAN1A2 group was significantly reduced (Figs. 2D and 2E). It was found that upregulation of circMAN1A2 expression promoted OC cell growth. The staining results of clone formation experiment showed that the number of clones in the ov-circMAN1A2 group was significantly higher than that in the ov-nc group. Compared with the si-nc group, the number of clones in the si-circMAN1A2 group was significantly reduced (Fig. 2F). The results of wound healing assay showed that the cell healing rate in the ov-circMAN1A2 group was significantly higher than that in the ov-nc group. Compared with the si-nc group, the cell healing rate in the si-circMAN1A2 group was significantly reduced (Fig. 2G). The down-regulation of circMAN1A2 was the opposite of the up-regulation of circMAN1A2.

Figure 2: CircMAN1A2 promotes OC proliferation.
(A) Schematic diagram of circMAN1A2 overexpression and knockdown sites. (B, C) RT-qPCR verified the effect of transfection of ov-circMAN1A2 in SKOV3 cells (B) or si-circMAN1A2 in A2780 cells on circMAN1A2 expression (C). D EdU detected the effect of ov-circMAN1A2 or si-circMAN1A2 on DNA replication rate of SKOV3 cells or A2780 cells, respectively. Magnification x200. (E) CCK8 analyzed the effect of ov-circMAN1A2 or si-circMAN1A2 on the proliferation of SKOV3 cells or A2780 cells, respectively. (F) Colony formation assay analyzed the effect of ov-circMAN1A2 or si-circMAN1A2 on the ability of a cell to form clones of SKOV3 cells or A2780 cells, respectively. (G) Wound healing assay analyzed the effect of ov-circMAN1A2 or si-circMAN1A2 on migration rate of SKOV3 cells or A2780 cells, respectively. *p < 0.05.CircMAN1A2 acts as ceRNA, adsorbing miR-135a-3p
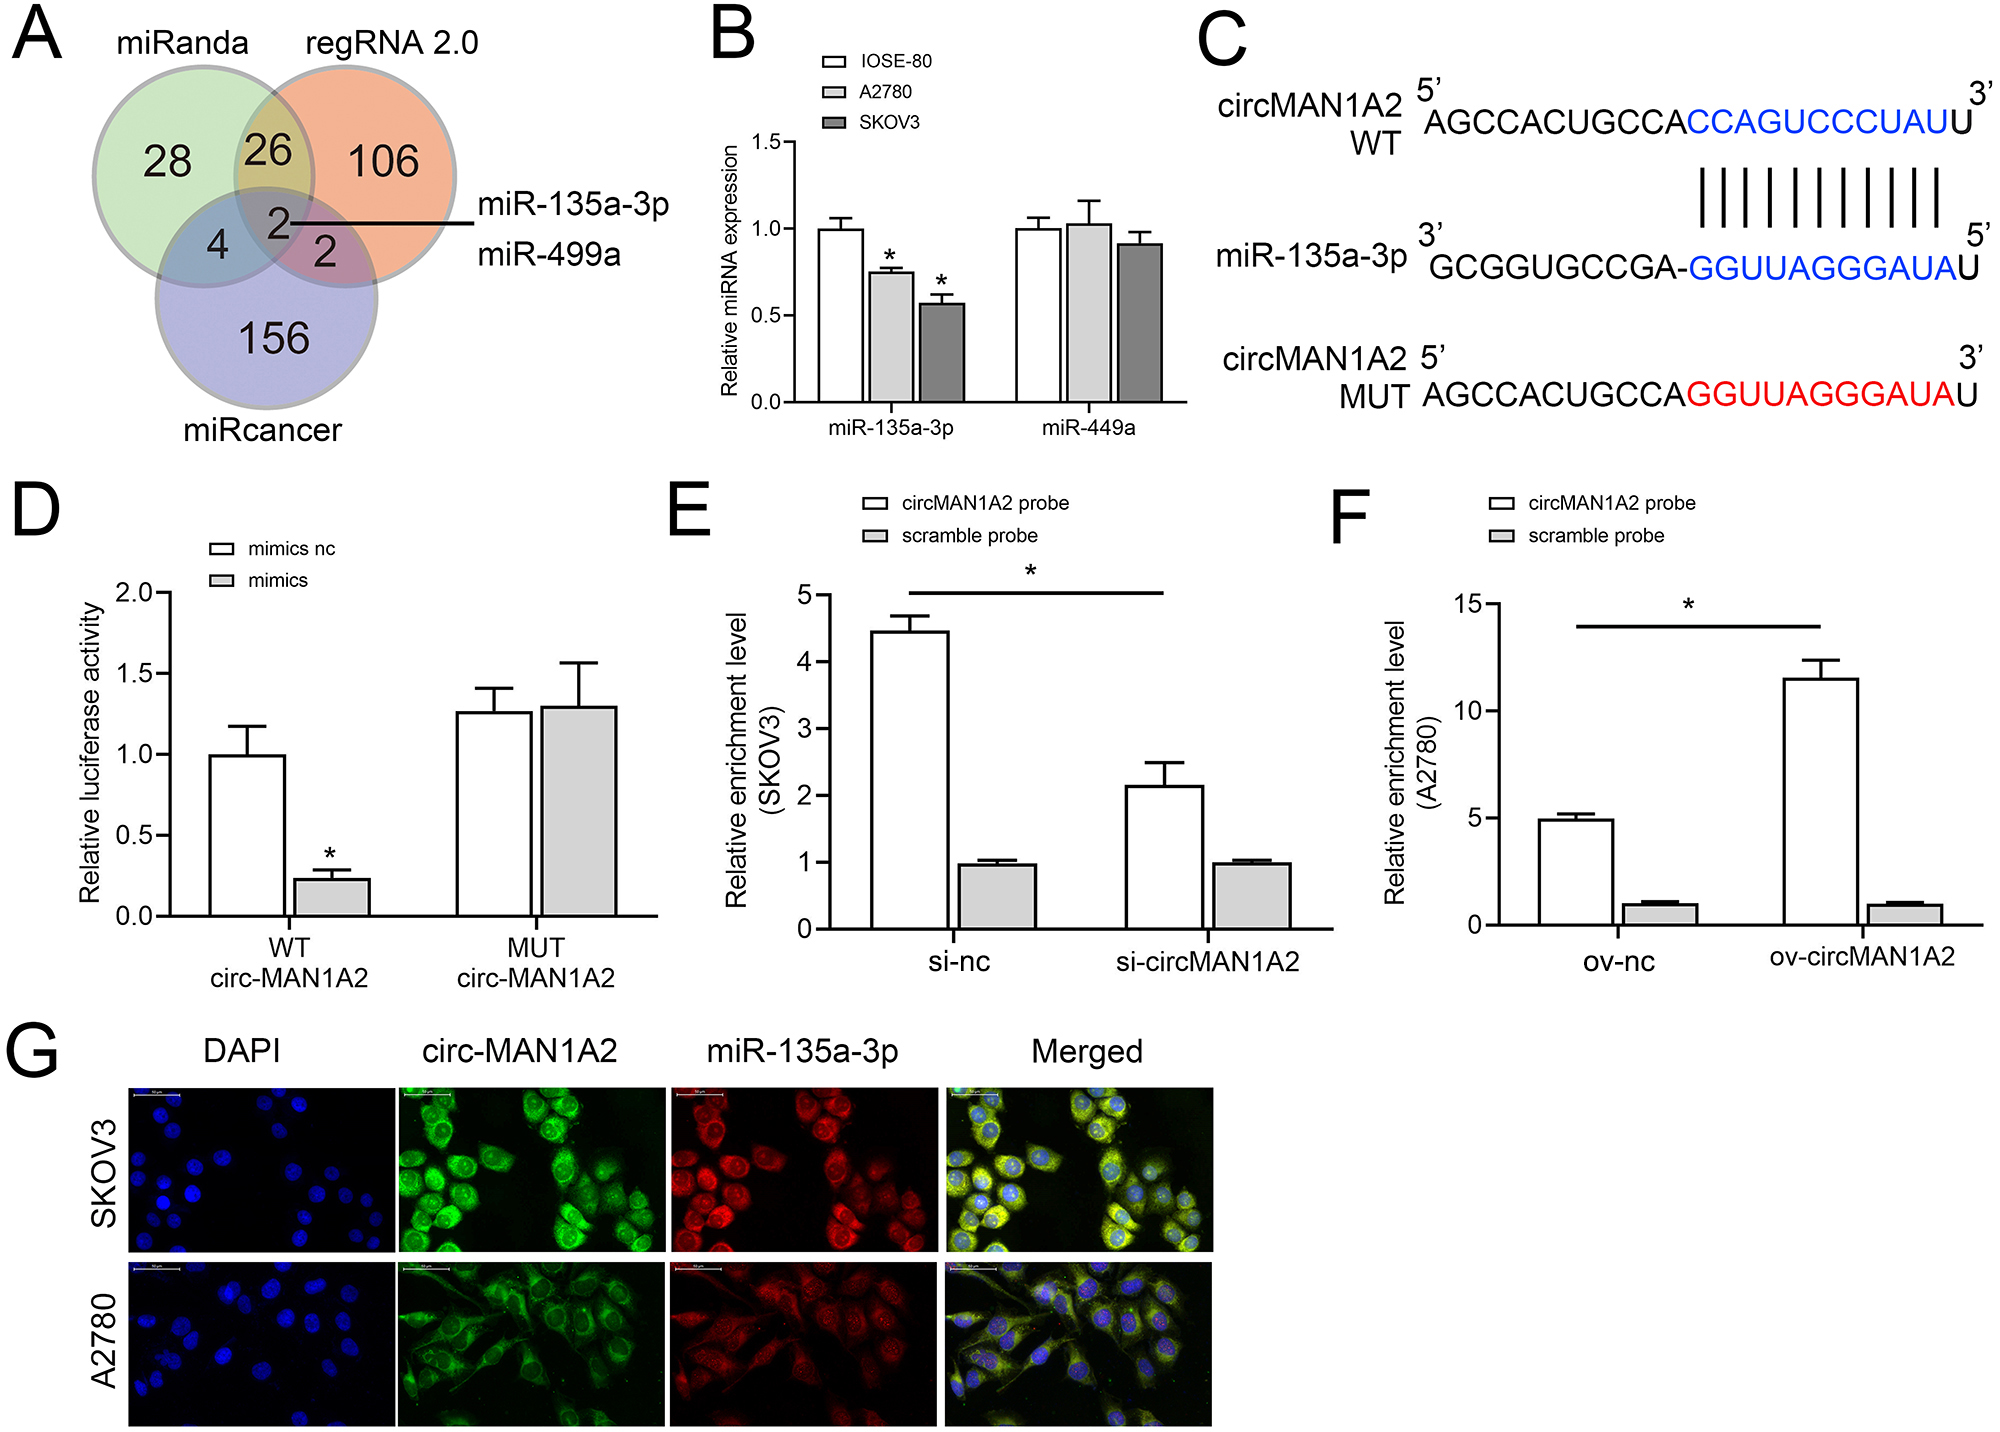
To further explore the molecular mechanism by which circMAN1A2 regulates OC proliferation, we screened miRNAs to identify possible targets of circMAN1A2 using three databases: miRanda (https://www.miranda.org/), regRNA 2.0 (https://www.lncrnablog.com/regrna-2-0-an-easy-to-use-web-server-for-identifying-regulatory-rna-motifs-and-functional-sites/), and miRcancer (http://mircancer.ecu.edu/). The results suggested that miR-135a-3p and miR-499a may be potential targets for circMAN1A2 (Fig. 3A). Subsequently, it was observed that the expression of miR-135a-3p was down-regulated in OC cells compared with IOSE-80 cells, but there was no significant difference in the expression of miR-499a (Fig. 3B). Therefore, miR-135a-3p was selected as a potential target of circMAN1A2, and the potential binding sites of the two were identified by bioinformatics analysis (Fig. 3C). Dual luciferase assay showed that in HEK 293T cells, the fluorescence activity of WT circMAN1A2 and miR-135a-3p mimics co-transfection group was significantly reduced compared with WT circMAN1A2 and miR-135a-3p mimics NC co-transfection group. What’s more, there was no significant difference in fluorescence activity between the mut circMAN1A2 with miR-135a-3p inhibitor NC co-transfection group and the mut circMAN1A2 with miR-135a-3p inhibitor co-transfection group (Fig. 3D). RNA pull-down results showed that miR-135a-3p and circMAN1A2 were enriched in the bio-circMAN1A2 and bio-miR-135a-3p groups, respectively, suggesting the binding between circMAN1A2 and miR-135a-3p (Figs. 3E and 3F). FISH analysis manifested that circMAN1A2 co-localized with miR-135a-3p in OC cells (Fig. 3G).

Figure 3: circMAN1A2 directly binds to miR-135a-3p.
(A) Venn diagram shows the miRNAs that can potentially bind to circMAN1A2 predicted using miRanda, regRNA2, and miRcancer. (B) RT-qPCR analyzed the expression of miR-449a and miR-135a-3p in SKOV3, A2780, and IOSE-80 cells. (C) Bioinformatics analysis of hypothetical binding sites of circMAN1A2 and miR-135a-3p. (D) Dual luciferase analysis of circMAN1A2 and miR-135a-3p binding. (E, F) RNA pull down analysis of circMAN1A2 and miR-135a-3p binding efficiency in SKOV3 (E) and A2780 (F) cells. (G) FISH detected colocalization of circMAN1A2 and miR-135a-3p in SKOV3 and A2780 cells. *p < 0.05.CircMAN1A2 reverses the inhibitory effect of miR-135a-3p on OC cell growth
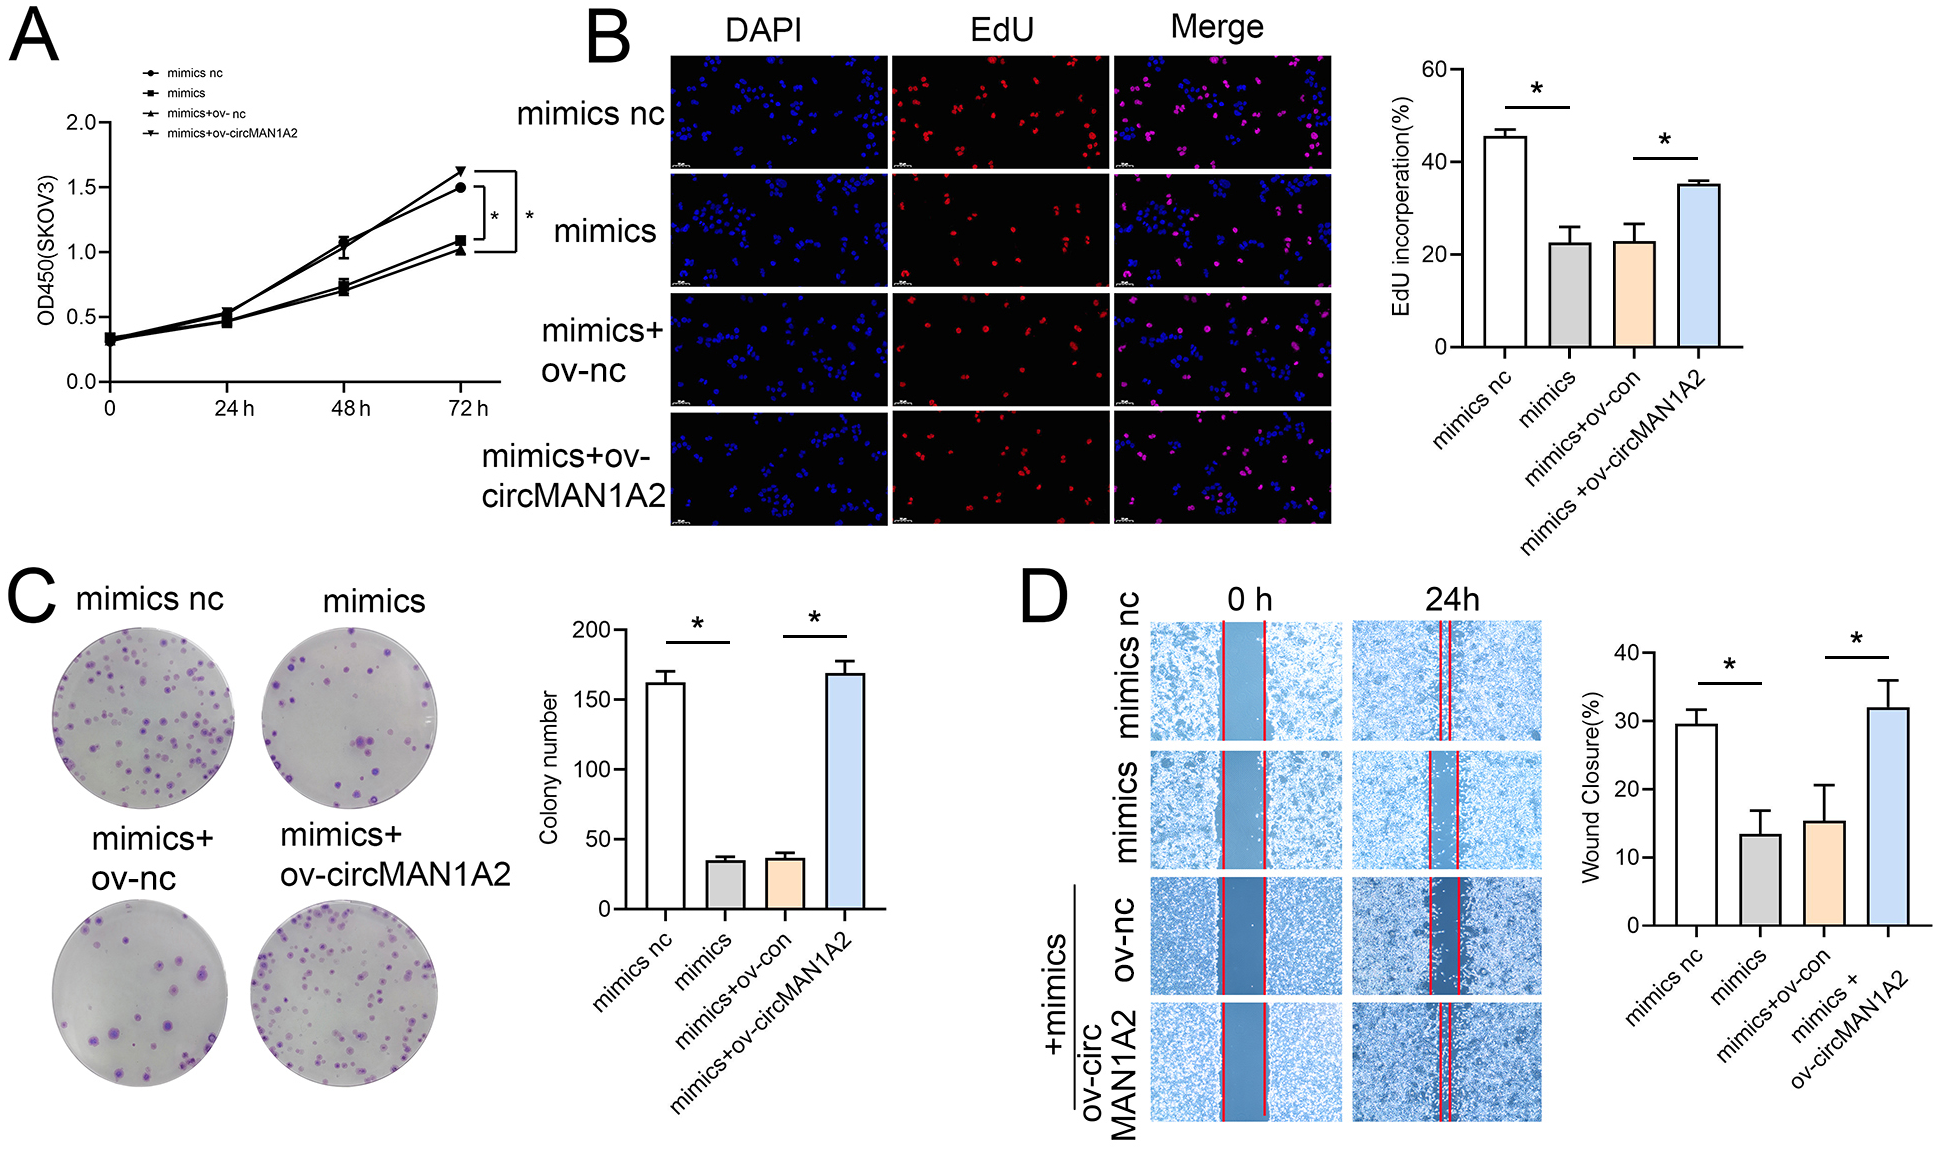
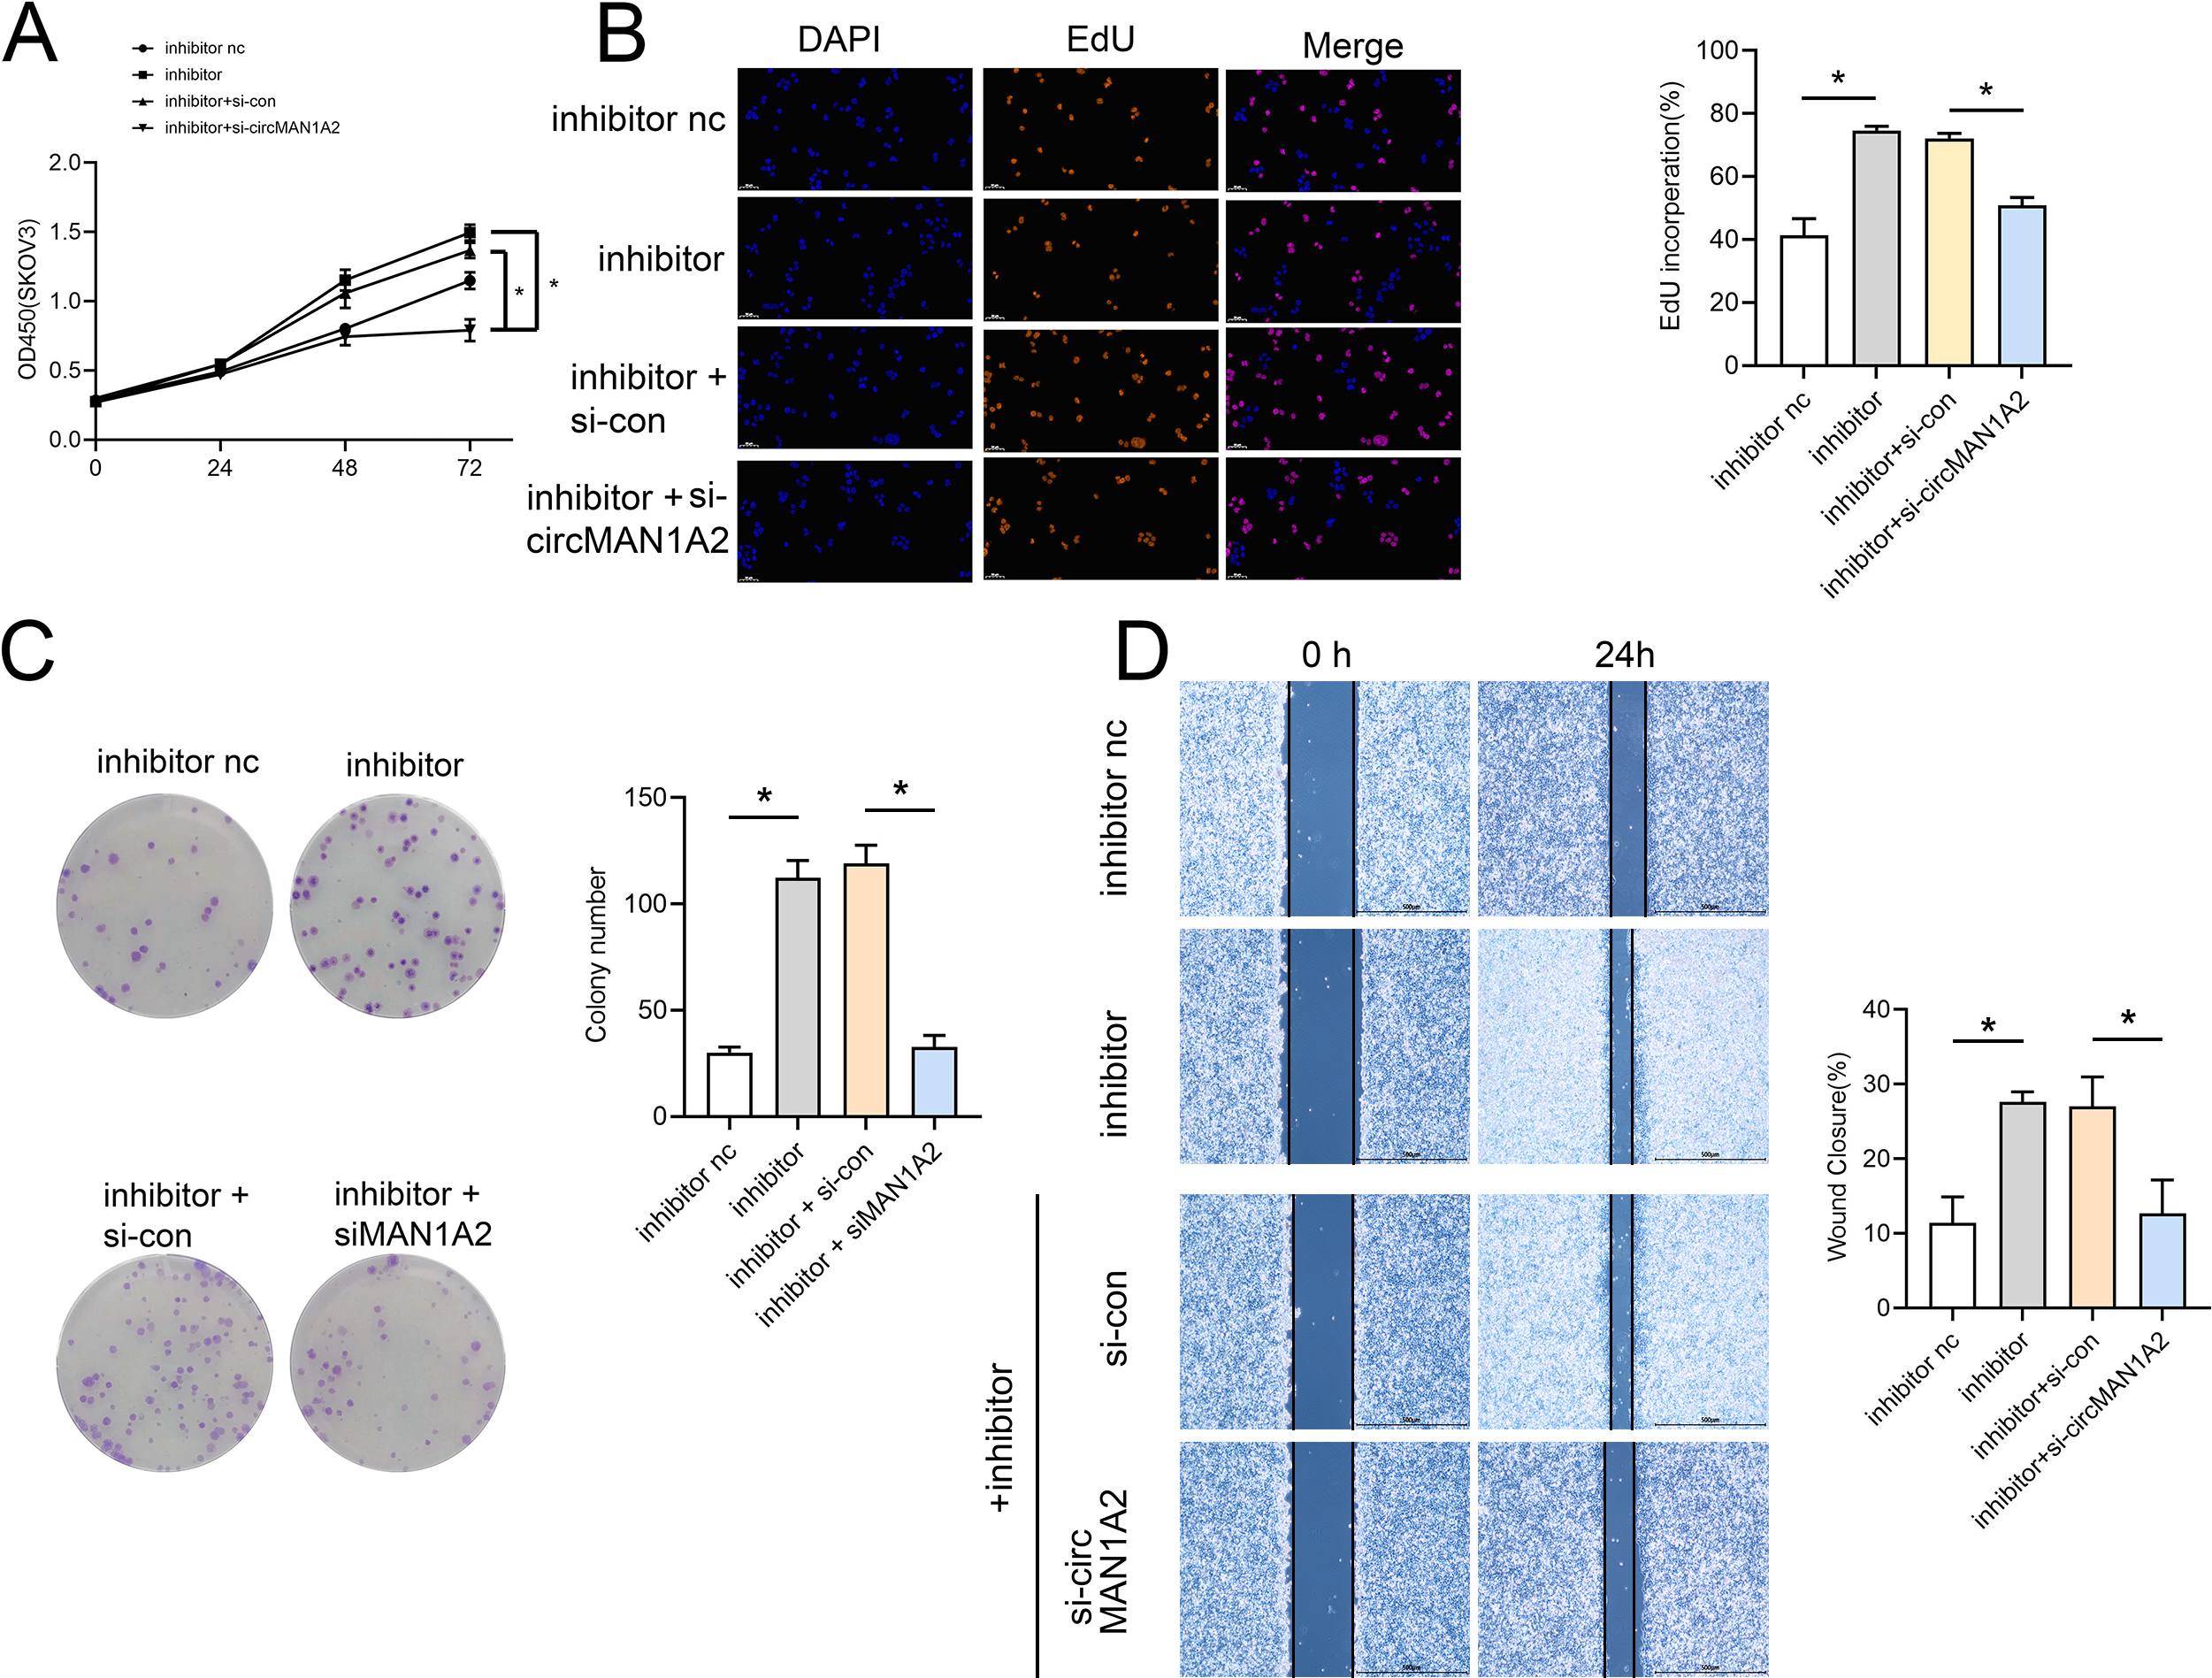
Rescue experiments were performed by co-transfection with miR-135-3p mimics or a miR-135a-3p inhibitor and circMAN1A2 or si-circMAN1A2 to further investigate the interaction between circMAN1A2 and miR-135a-3p in OC cells. The results of CCK8 showed that at 72 h, the OD value in the mimics group was significantly lower than that in the mimics nc group. Compared with the mimics+ov-nc group, the OD value in the mimics+ov-circMAN1A2 group was significantly increased (Fig. 4A). The results of EdU staining showed that the EdU incorperation in the mimics group was significantly reduced compared with the mimics nc group. Compared with the mimics+ov-nc group, the EdU incorporation in the mimics+ov-circMAN1A2 group was significantly increased (Fig. 4B). The results of monoclonal proliferation showed that the number of clones in the MIMICS group was significantly lower than that in the MIMICS NC group. The number of clones in the mimics+ov-circMAN1A2 group was significantly higher than that in the mimics+ov-nc group (Fig. 4C). The results of wound healing experiments showed that the wound healing rate of the MIMICS group was significantly lower than that of the MIMICS NC group. The wound healing rate of the mimics+ov-circMAN1A2 group was significantly higher than that of the mimics+ov-nc group. These results indicate that miR-135a-3p mimics can inhibit cell proliferation in SKOV3 cells (Fig. 4D). The ability to form clones, and wound healing ability, and the overexpression of circMAN1A2 reversed the effect of miR-135a-3p on SKOV3 cells. However, the effect of miR-135a-3p inhibitor was completely opposite to that of miR-135a-3p mimics. The results of CCK8 showed that at 72 h, the OD value in the inhibitor group was significantly higher than that in the inhibitor nc group. The OD value in the inhibitor+si-circMAN1A2 group was significantly lower than that in the inhibitor nc group (Fig. 5A). The results of EdU showed that the EdU incorperation in the inhibitor group was significantly higher than that in the inhibitor nc group. The EdU incorperation in the inhibitor+si-circMAN1A2 group was significantly lower than that in the inhibitor nc group (Fig. 5B). The results of clone formation experiments showed that the number of clones in the inhibitor group was significantly higher than that in the inhibitor NC group. The number of clones in the inhibitor+si-circMAN1A2 group was significantly lower than that in the inhibitor nc group (Fig. 5C). The results of wound healing assay showed that the cell healing rate in the inhibitor group was significantly higher than that in the inhibitor NC group. The cell healing rate in the inhibitor+si-circMAN1A2 group was significantly lower than that in the inhibitor nc group (Fig. 5D). In brief, miR-135a-3p inhibitor promoted cell proliferation, the ability to form clones, and wound healing ability, and si-circMAN1A2 reversed the effect of miR-135a-3p on A2780 cells.
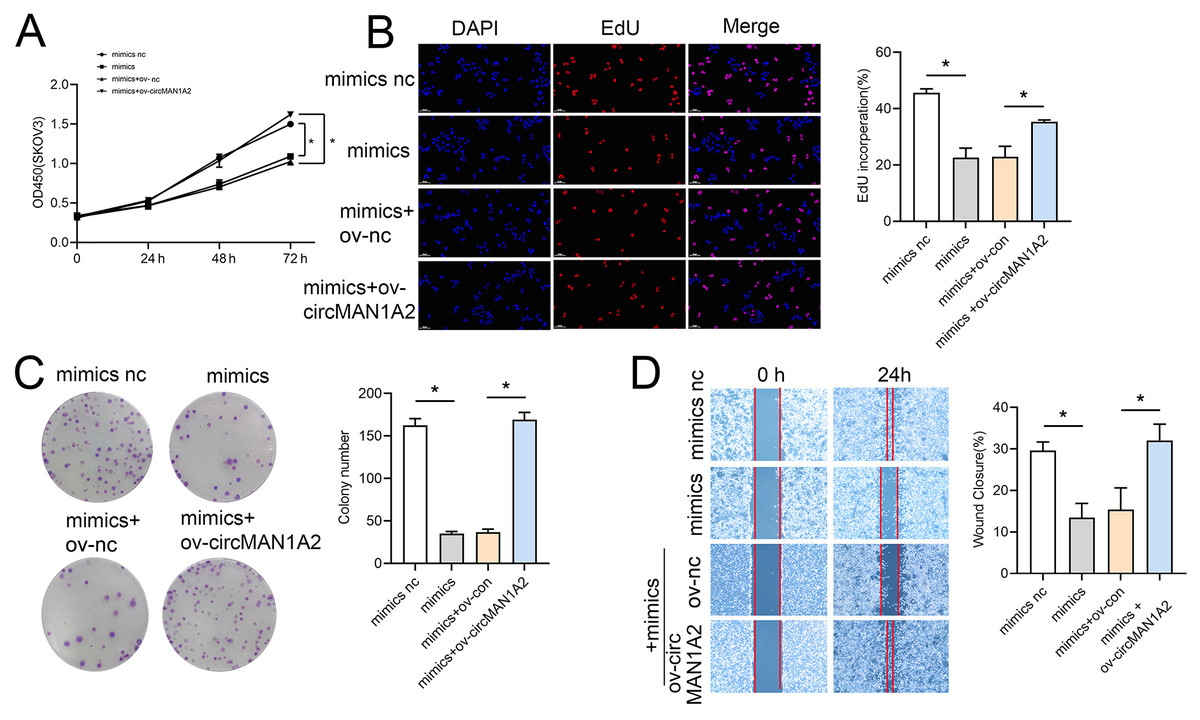
Figure 4: CircMAN1A2 reverses the inhibitory effect of miR-135a-3p on SKOV3 cell growth.
(A) CCK8 analyzed the effect of circMAN1A2 interaction with miR-135a-3p on the proliferation of SKOV3 cells. (B) EdU analyzed the effect of circMAN1A2 interaction with miR-135a-3p on DNA replication rate in SKOV3 cells. (C) Colony formation assay analyzed the effect of circMAN1A2 interaction with miR-135a-3p on the ability of a cell to form clones in SKOV3 cells. (D) Wound healing experiments analyzed the effect of circMAN1A2 interaction with miR-135a-3p on the migration rate of SKOV3 cells. *p < 0.05.
Figure 5: Si-circMAN1A2 reverses the promoting effect of miR-135a-3p inhibitor on A2780 cell growth.
(A) CCK8 analyzed the effect of si-circMAN1A2 interaction with miR-135a-3p inhibitor on the proliferation of A2780 cells. (B) EdU analyzed the effect of si-circMAN1A2 interaction with miR-135a-3p inhibitor on DNA replication rate in A2780 cells. (C) Colony formation assay analyzed the effect of si-circMAN1A2 interaction with miR-135a-3p inhibitor on the ability of a cell to form clones in A2780 cells. (D) Wound healing experiments analyzed the effect of si-circMAN1A2 interaction with miR-135a-3p inhibitor on the migration rate of A2780 cells. *p < 0.05.IL1RAP is a direct target of miR-135a-3p
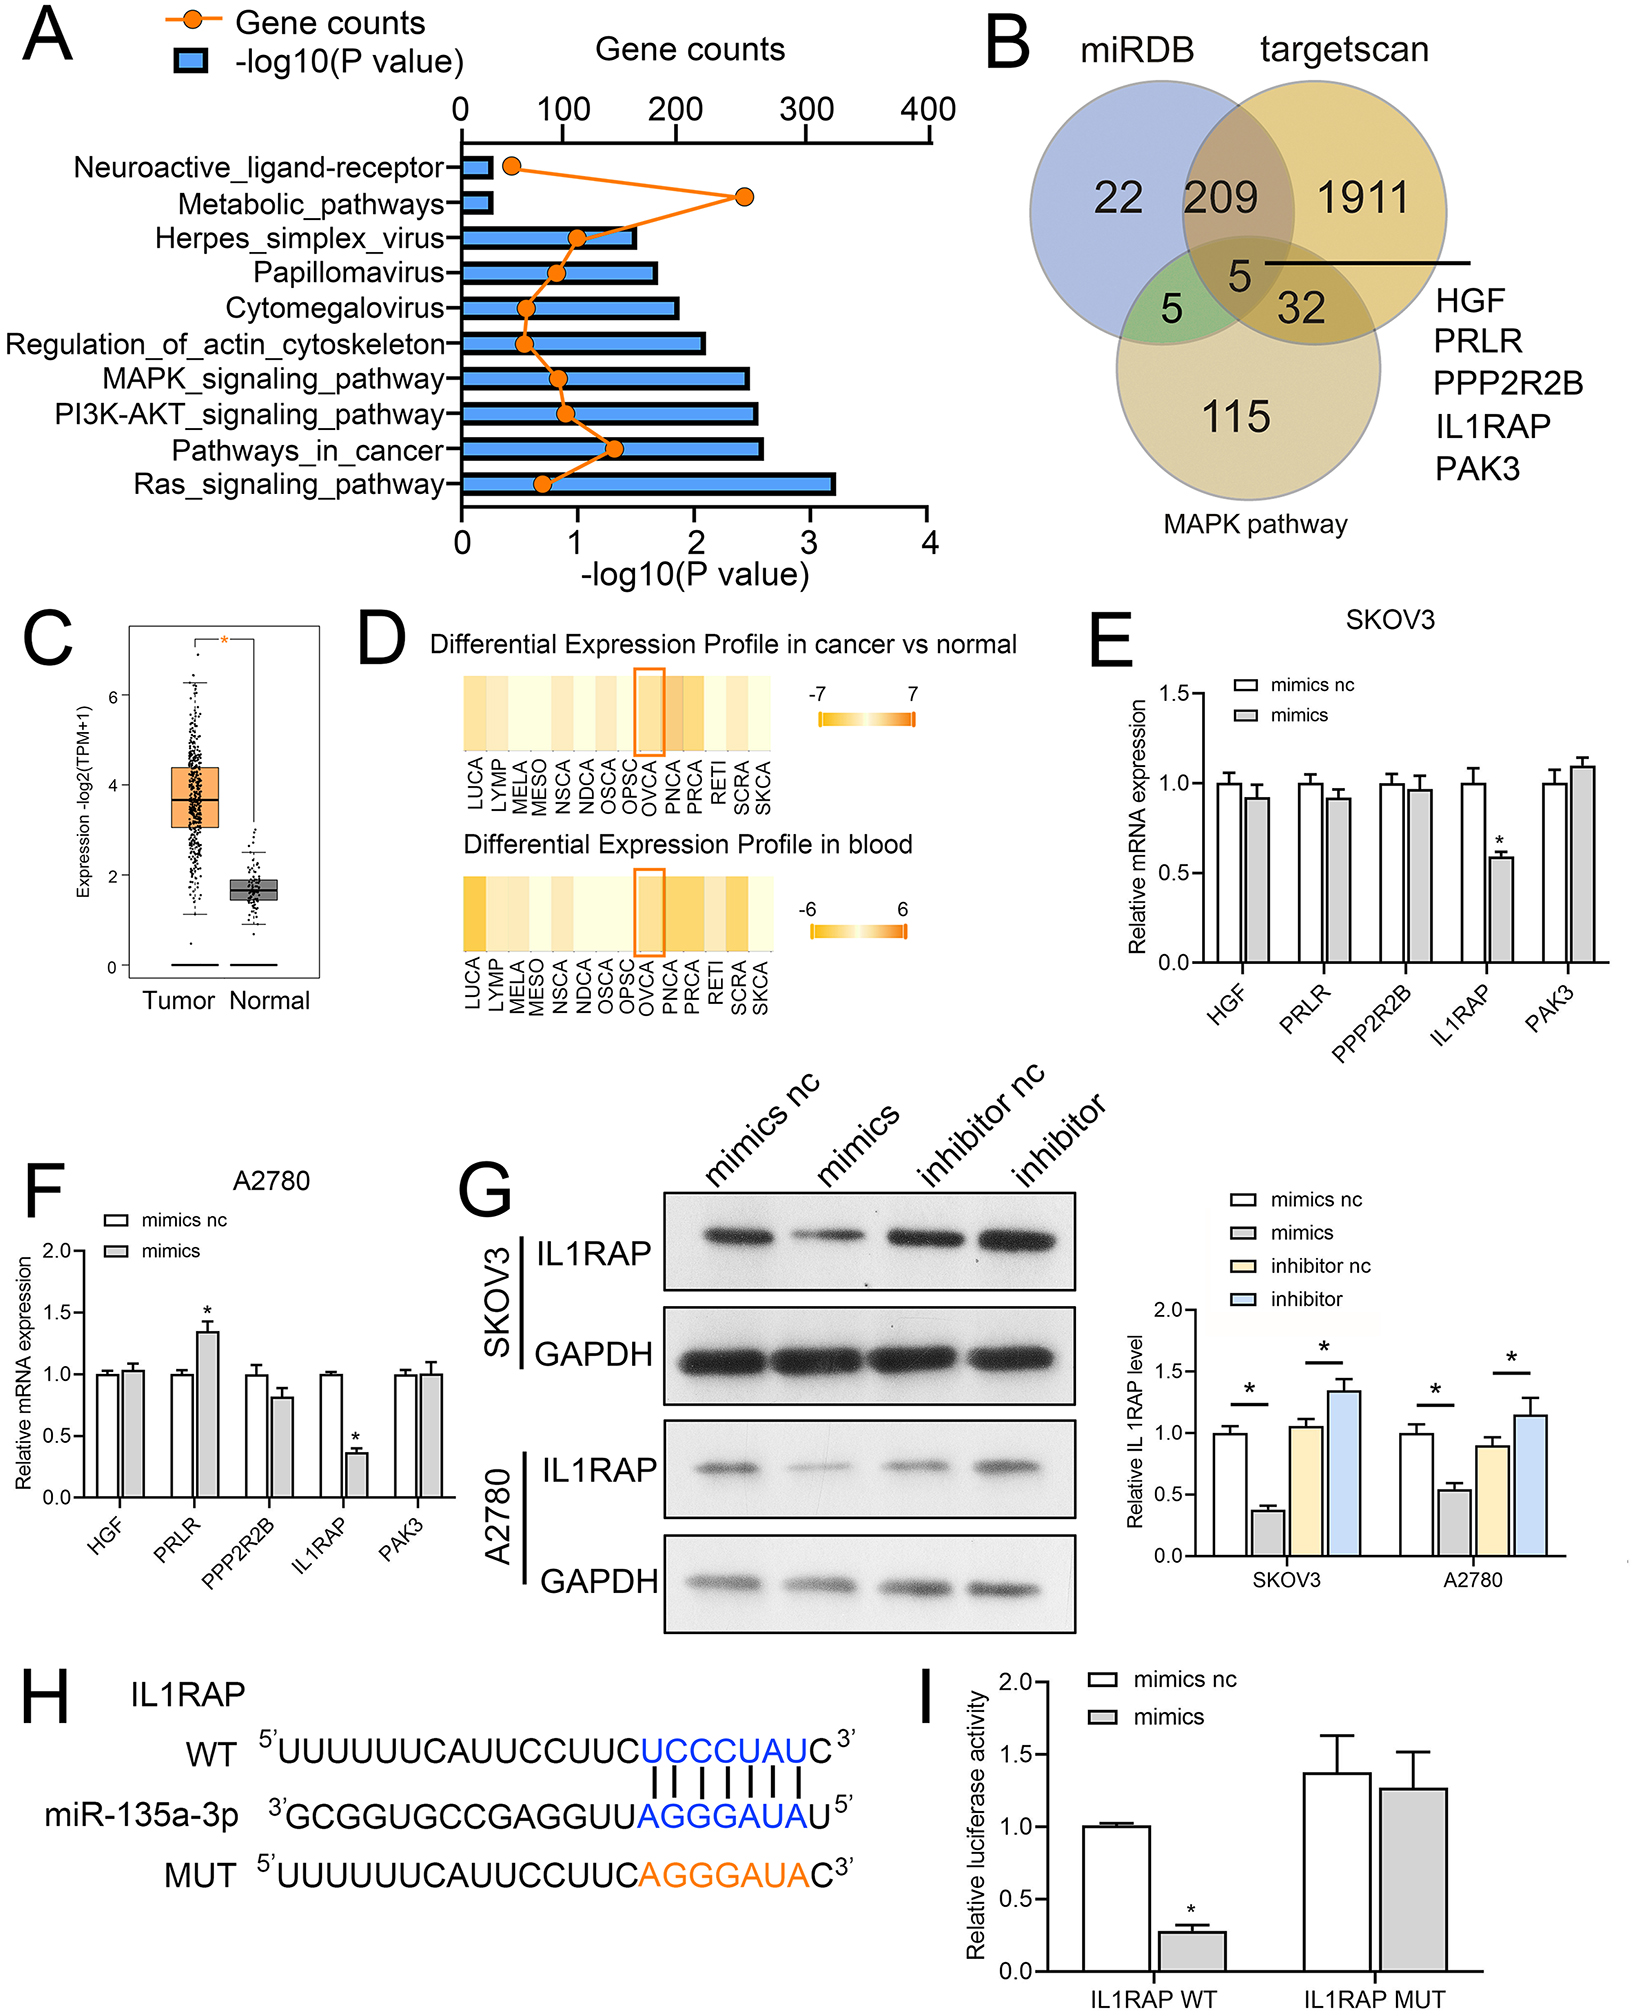
We first used miRwalk (http://mirwalk.umm.uni-heidelberg.de/) to identify the target genes of miR-135a-3p; the threshold was set to 0.95, and the predicted target genes were subjected to KEGG pathway analysis. The mitogen-activated protein kinase (MAPK), Phosphatidylinositol-3-kinase (PI3K)-protein kinase B (Akt) and RAS signaling pathway were the ones where the predicted target genes of miR-135a-3p were mostly found (Fig. 6A). To further explore the mechanism of action of circMAN1A2/miR-135a-3p, we screened the downstream mRNA of miR-135a-3p through miRDB (https://mirdb.org/), TargetScan (http://www.targetscan.org/vert_72/). Five candidate target genes were identified: hepatocyte growth factor (HGF), prolactin receptor (PRLR), protein phosphatase 2 regulatory subunit Bbeta (PPP2R2B), IL1RAP, p21 (RAC1) activated kinase 3 (PAK3) (Fig. 6B). Afterwards, we observed that miR-135a-3p had a significantly silenced IL1RAP in SKOV3 and A2780 cells, but did not significantly suppress the expression of other miRNAs (Figs. 6C and 6D). Also, IL1RAP is the receptor protein of IL-1, which can autophosphorylate TAK1 through signal transmission and activate the downstream MAPK, PI3K-Akt, and other growth-related signaling pathways (Muller et al., 2001; Prickett et al., 2008; Shin et al., 2019). Therefore, we believed that IL1RAP was an important target to study the mechanism of miR-135a-3p in OC. Subsequently, dbDEMC database (https://www.biosino.org/dbDEMC/index) showed that miR-135a-3p was low expressed in OC tissues and blood samples (Fig. 6E), while Gene Expression Profiling Interactive Analysis 2 (GEPIA2) database (http://gepia2.cancer-pku.cn/#index) analysis showed that IL1RAP was highly expressed in OC (Fig. 6F). Western blot result also indicated that miR-135a-3p mimics silenced the protein level of IL1RAP. miR-135a-3p inhibitor up-regulated the protein level of ILRAP (Fig. 6G). To determine the specific target site, the predicted target sequence of miR-135a-3p was mutated, and dual luciferase assay showed that in HEK 293T cells, the fluorescence activity of WT ILRAP and miR-135a-3p mimics co-transfection group was significantly reduced compared with WT ILRAP and miR-135a-3p mimics NC co-transfection group. There was no significant difference in fluorescence activity between the mut ILRAP with miR-135a-3p inhibitor NC co-transfection group and the mut ILRAP with miR-135a-3p inhibitor co-transfection group (Fig. 6H).
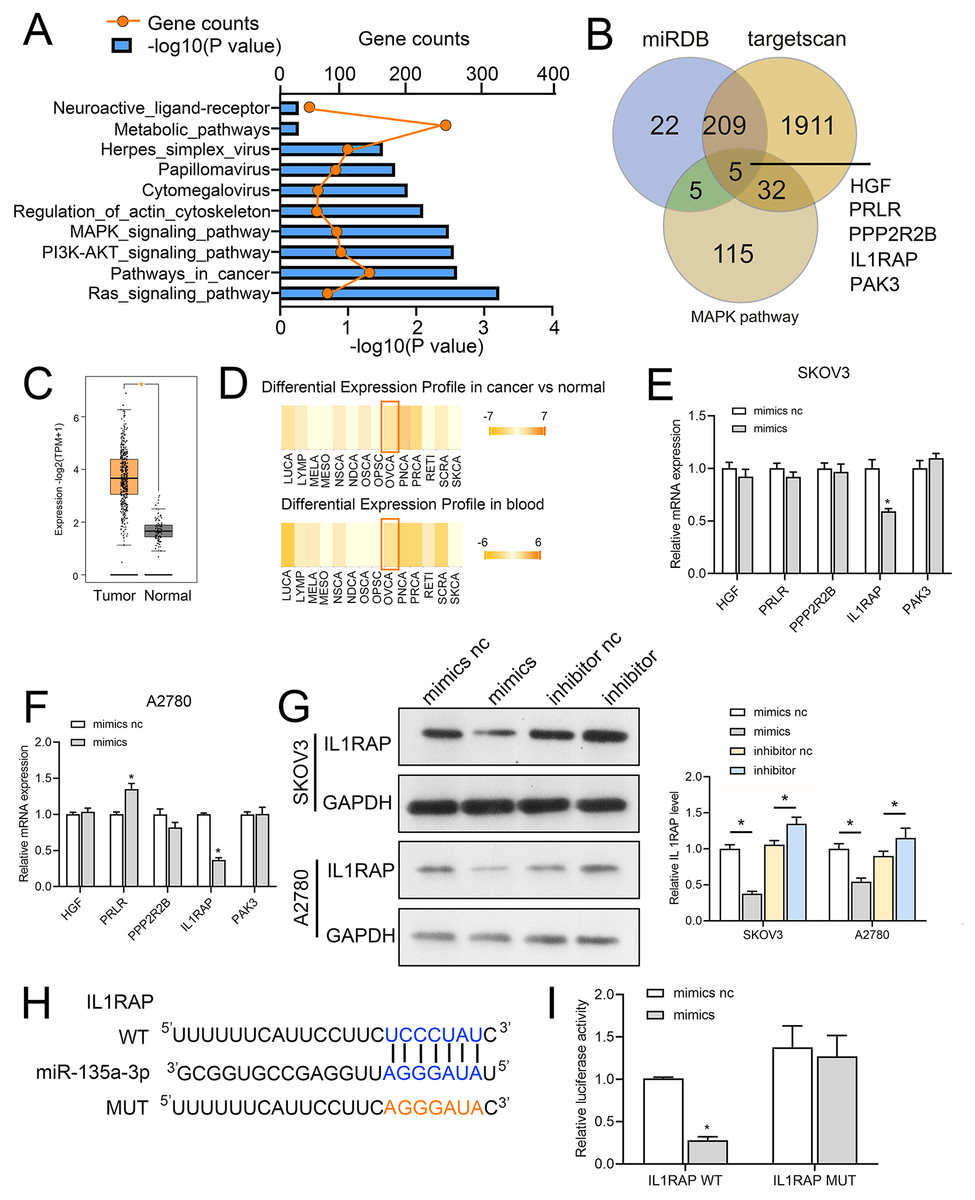
Figure 6: IL1RAP is a direct target of miR-135a-3p.
(A) miRwalk was used to predict the target genes of miR-135a-3p, and KEGG pathway analysis was performed on the target genes. (B) Venn diagram showing intersection between the target genes of miR-135a-3p predicted using miRDB, TargetScan, and miRwalk and KEGG signaling pathway genes. (C, D) RT-qPCR analyzed the effect of miR-135a-3p on the expression of five putative target genes (HGF, PRLR, PPP2R2B, IL1RAP, PAK3) in SKOV3 (C) or A2780 (D) cells. (E) The dbDEMC database analyzed the expression of miR-135a-3p in OC patients. (F) The GEPIA2 database analyzed IL1RAP expression in OC. The red box is high expression in the tumor, and the gray box is the low expression in the tumor. (G) Western blot analyzed the effect of miR-135a-3p on the protein level of IL1RAP in SKOV3 and A2780 cells. (H) Bioinformatics analysis of hypothetical binding sites of miR-135a-3p and IL1RAP. (I) Dual luciferase analysis of miR-135a-3p and IL1RAP binding. *p < 0.05.MiR-135a-3p promotes OC cell proliferation through the IL1RAP
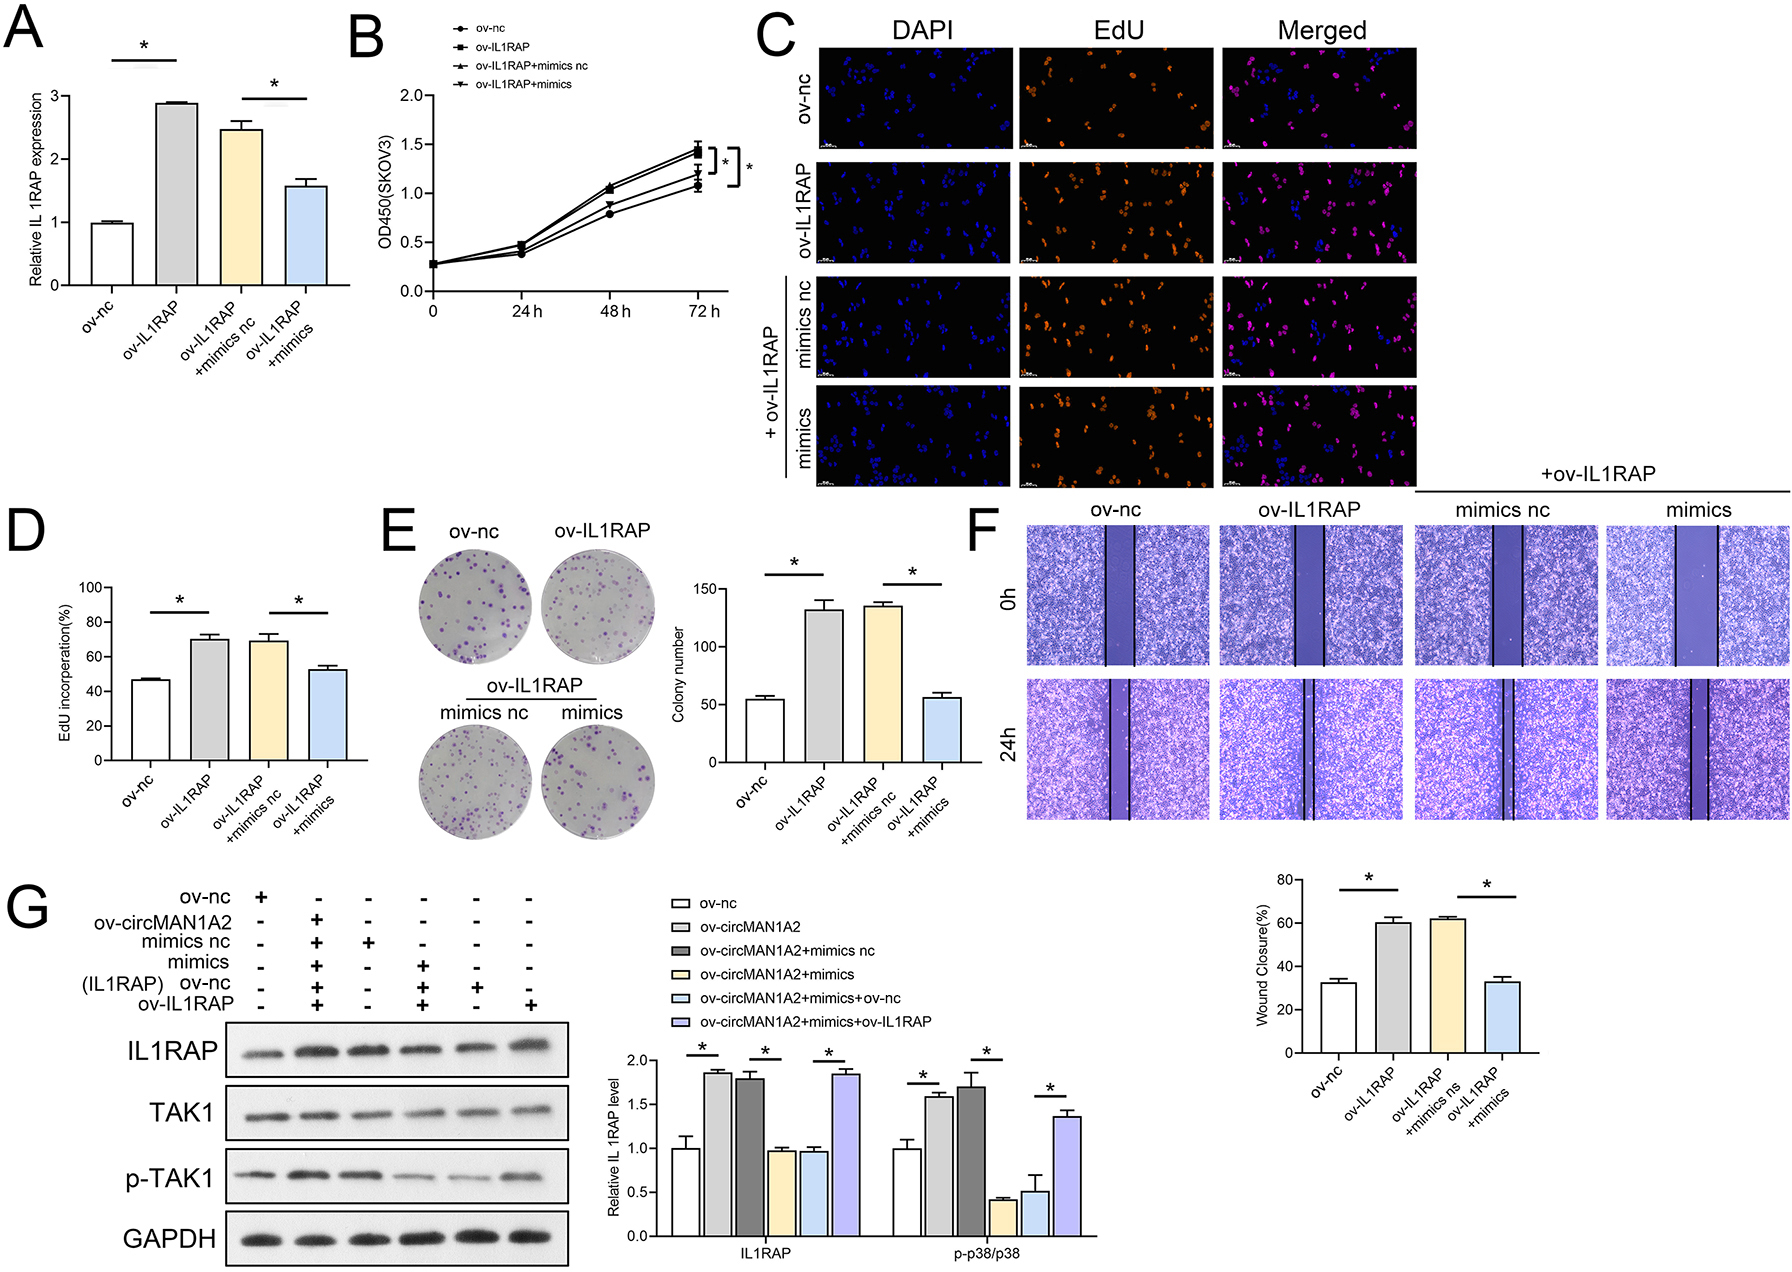
The interaction between miR-135a-3p and IL1RAP on OC cell function was then confirmed to affect OC cell function. Firstly, the results of RT-qPCR experiments showed that ov-IL1RAP transfection was successful, and mimics could inhibit the expression of IL-1RAP (Fig. 7A). The results of CCK8 showed that at 72 h, the OD value in the ov-IL1RAP group was significantly higher than that in the ov-nc group. The OD value in the ov-IL1RAP+mimics group was significantly lower than that in the ov-IL1RAP+mimics nc group (Fig. 7B). The results of EdU showed that the EdU incorperation in the ov-IL1RAP group was significantly higher than that in the ov-nc group. The EdU incorperation in the ov-IL1RAP+mimics group was significantly lower than that in the ov-IL1RAP+mimics nc group (Figs. 7C–7D). The results of clone formation experiments showed that the number of clones in the ov-IL1RAP group was significantly higher than that in the ov-nc group. The number of clones in the ov-IL1RAP+mimics group was significantly lower than that in the ov-IL1RAP+mimics nc group (Fig. 7E). The results of wound healing experiments showed that the healing rate in the ov-IL1RAP group was significantly higher than that in the ov-nc group. The healing rate in the ov-IL1RAP+mimics group was significantly lower than that in the ov-IL1RAP+mimics nc group (Fig. 7F). Western blotting results showed that IL1RAP and circ-MAN1A2 overexpression could promote the phosphorylation of TAK1, while mimics would inhibit the phosphorylation of TAK1 (Fig. 7G). It was observed that in SKOV3 cells, overexpression of IL1RAP promoted the expression of IL1RAP, proliferation, the ability to form clones, wound healing ability, IL1RAP protein levels and TAK1 phosphorylation, and miR-135a-3p reversed the effect of ov-IL1RAP on SKOV3 cells. However, the effect of si-IL1RAP was completely opposite to that of the ov-IL1RAP. Firstly, the results of RT-qPCR experiments showed that si-IL1RAP transfection was successful, and the inhibitor could promote the expression of IL-1RAP (Fig. 8A). The results of CCK8 showed that the OD value in the si-IL1RAP group was significantly lower than that in the si-nc group at 72 h. The OD value in the si-IL1RAP+inhibitor group was significantly higher than that in the si-IL1RAP+inhibitor nc group (Fig. 8B). The results of EdU showed that the EdU incorperation in the si-IL1RAP group was significantly lower than that in the si-nc group. The EdU incorporation in the si-IL1RAP+inhibitor group was significantly higher than that in the si-IL1RAP+inhibitor nc group (Figs. 8C–8D). The results of clone formation experiments showed that the number of clones in the si-IL1RAP group was significantly lower than that in the si-nc group. The number of clones in the si-IL1RAP+inhibitor group was significantly higher than that in the si-IL1RAP+inhibitor nc group (Fig. 8E). The results of wound healing experiments showed that the healing rate in the si-IL1RAP group was significantly lower than that in the si-nc group. The healing rate in the si-IL1RAP+inhibitor group was significantly higher than that in the si-IL1RAP+inhibitor nc group (Fig. 8F). Western blotting results showed that inhibition of IL1RAP and circ-MAN1A2 inhibited the phosphorylation of TAK1, while the inhibitor promoted the phosphorylation of TAK1 (Fig. 8G). Briefly, in A2780 cells, suppressing the expression of IL1RAP inhibited the expression of IL1RAP, proliferation, the ability to form clones, wound healing ability, IL1RAP protein levels and TAK1 phosphorylation, and miR-135a-3p inhibitor reversed the effect of si-IL1RAP on A2780 cells.
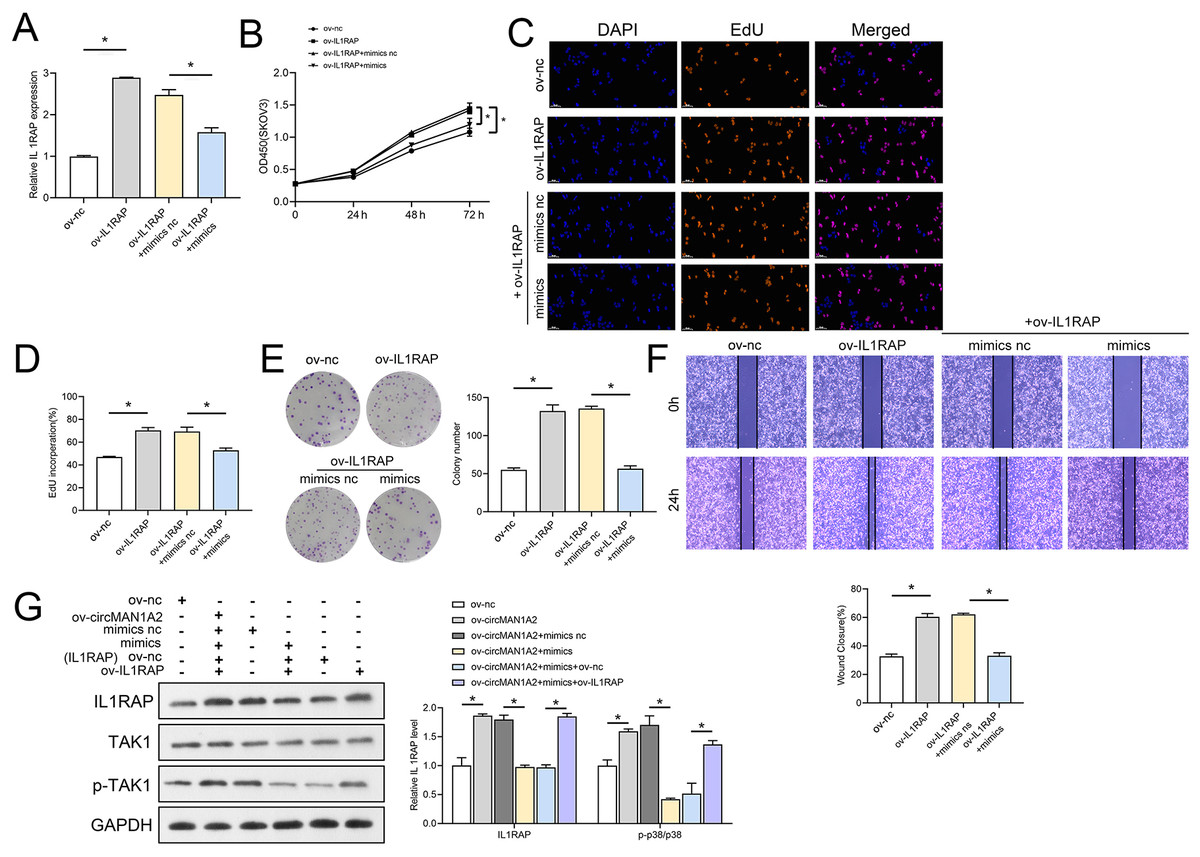
Figure 7: MiR-135a-3p inhibitor promotes proliferation of A2780 cells through the IL1RAP/TAK1 axis.
(A) RT-qPCR analyzed the effect of miR-135a-3p interaction with IL1RAP on IL1RAP expression in SKOV3 cells. (B) CCK8 analyzed the effect of miR-135a-3p interaction with IL1RAP on the proliferation of SKOV3 cells. (C, D) EdU analyzed the effect of miR-135a-3p interaction with IL1RAP on DNA replication rate in SKOV3 cells. (E) Colony formation assay analyzed the effect of miR-135a-3p interaction with IL1RAP on the ability of a cell to form clones in SKOV3 cells. (F) Wound healing experiments analyzed the effect of miR-135a-3p interaction with IL1RAP on the migration rate of SKOV3 cells. (G) Western blot analyzed the effect of miR-135a-3p interaction with IL1RAP on protein levels of IL1RAP, TAK1, and p-TAK1 in SKOV3 cells. *p < 0.05.
Figure 8: MiR-135a-3p inhibitor promotes proliferation of A2780 cells through the IL1RAP/TAK1 axis.
(A) RT-qPCR analyzed the effect of miR-135a-3p inhibitor interaction with si-IL1RAP on IL1RAP expression in A2780 cells. (B) CCK8 analyzed the effect of miR-135a-3p inhibitor interaction with si-IL1RAP on the proliferation of A2780 cells. (C, D) EdU analyzed the effect of miR-135a-3p inhibitor interaction with si-IL1RAP on DNA replication rate in A2780 cells. (E) Colony formation analyzed the effect of miR-135a-3p inhibitor interaction with si-IL1RAP on the ability of a cell to form clones in A2780 cells. (F) Wound healing experiments analyzed the effect of miR-135a-3p inhibitor interaction with si-IL1RAP on the migration rate of A2780 cells. (G) Western blot analyzed the effect of miR-135a-3p inhibitor interaction with si-IL1RAP on protein levels of IL1RAP, TAK1, and p-TAK1 in A2780 cells. *p < 0.05.CircMAN1A2 accelerates xenograft tumor growth in vivo
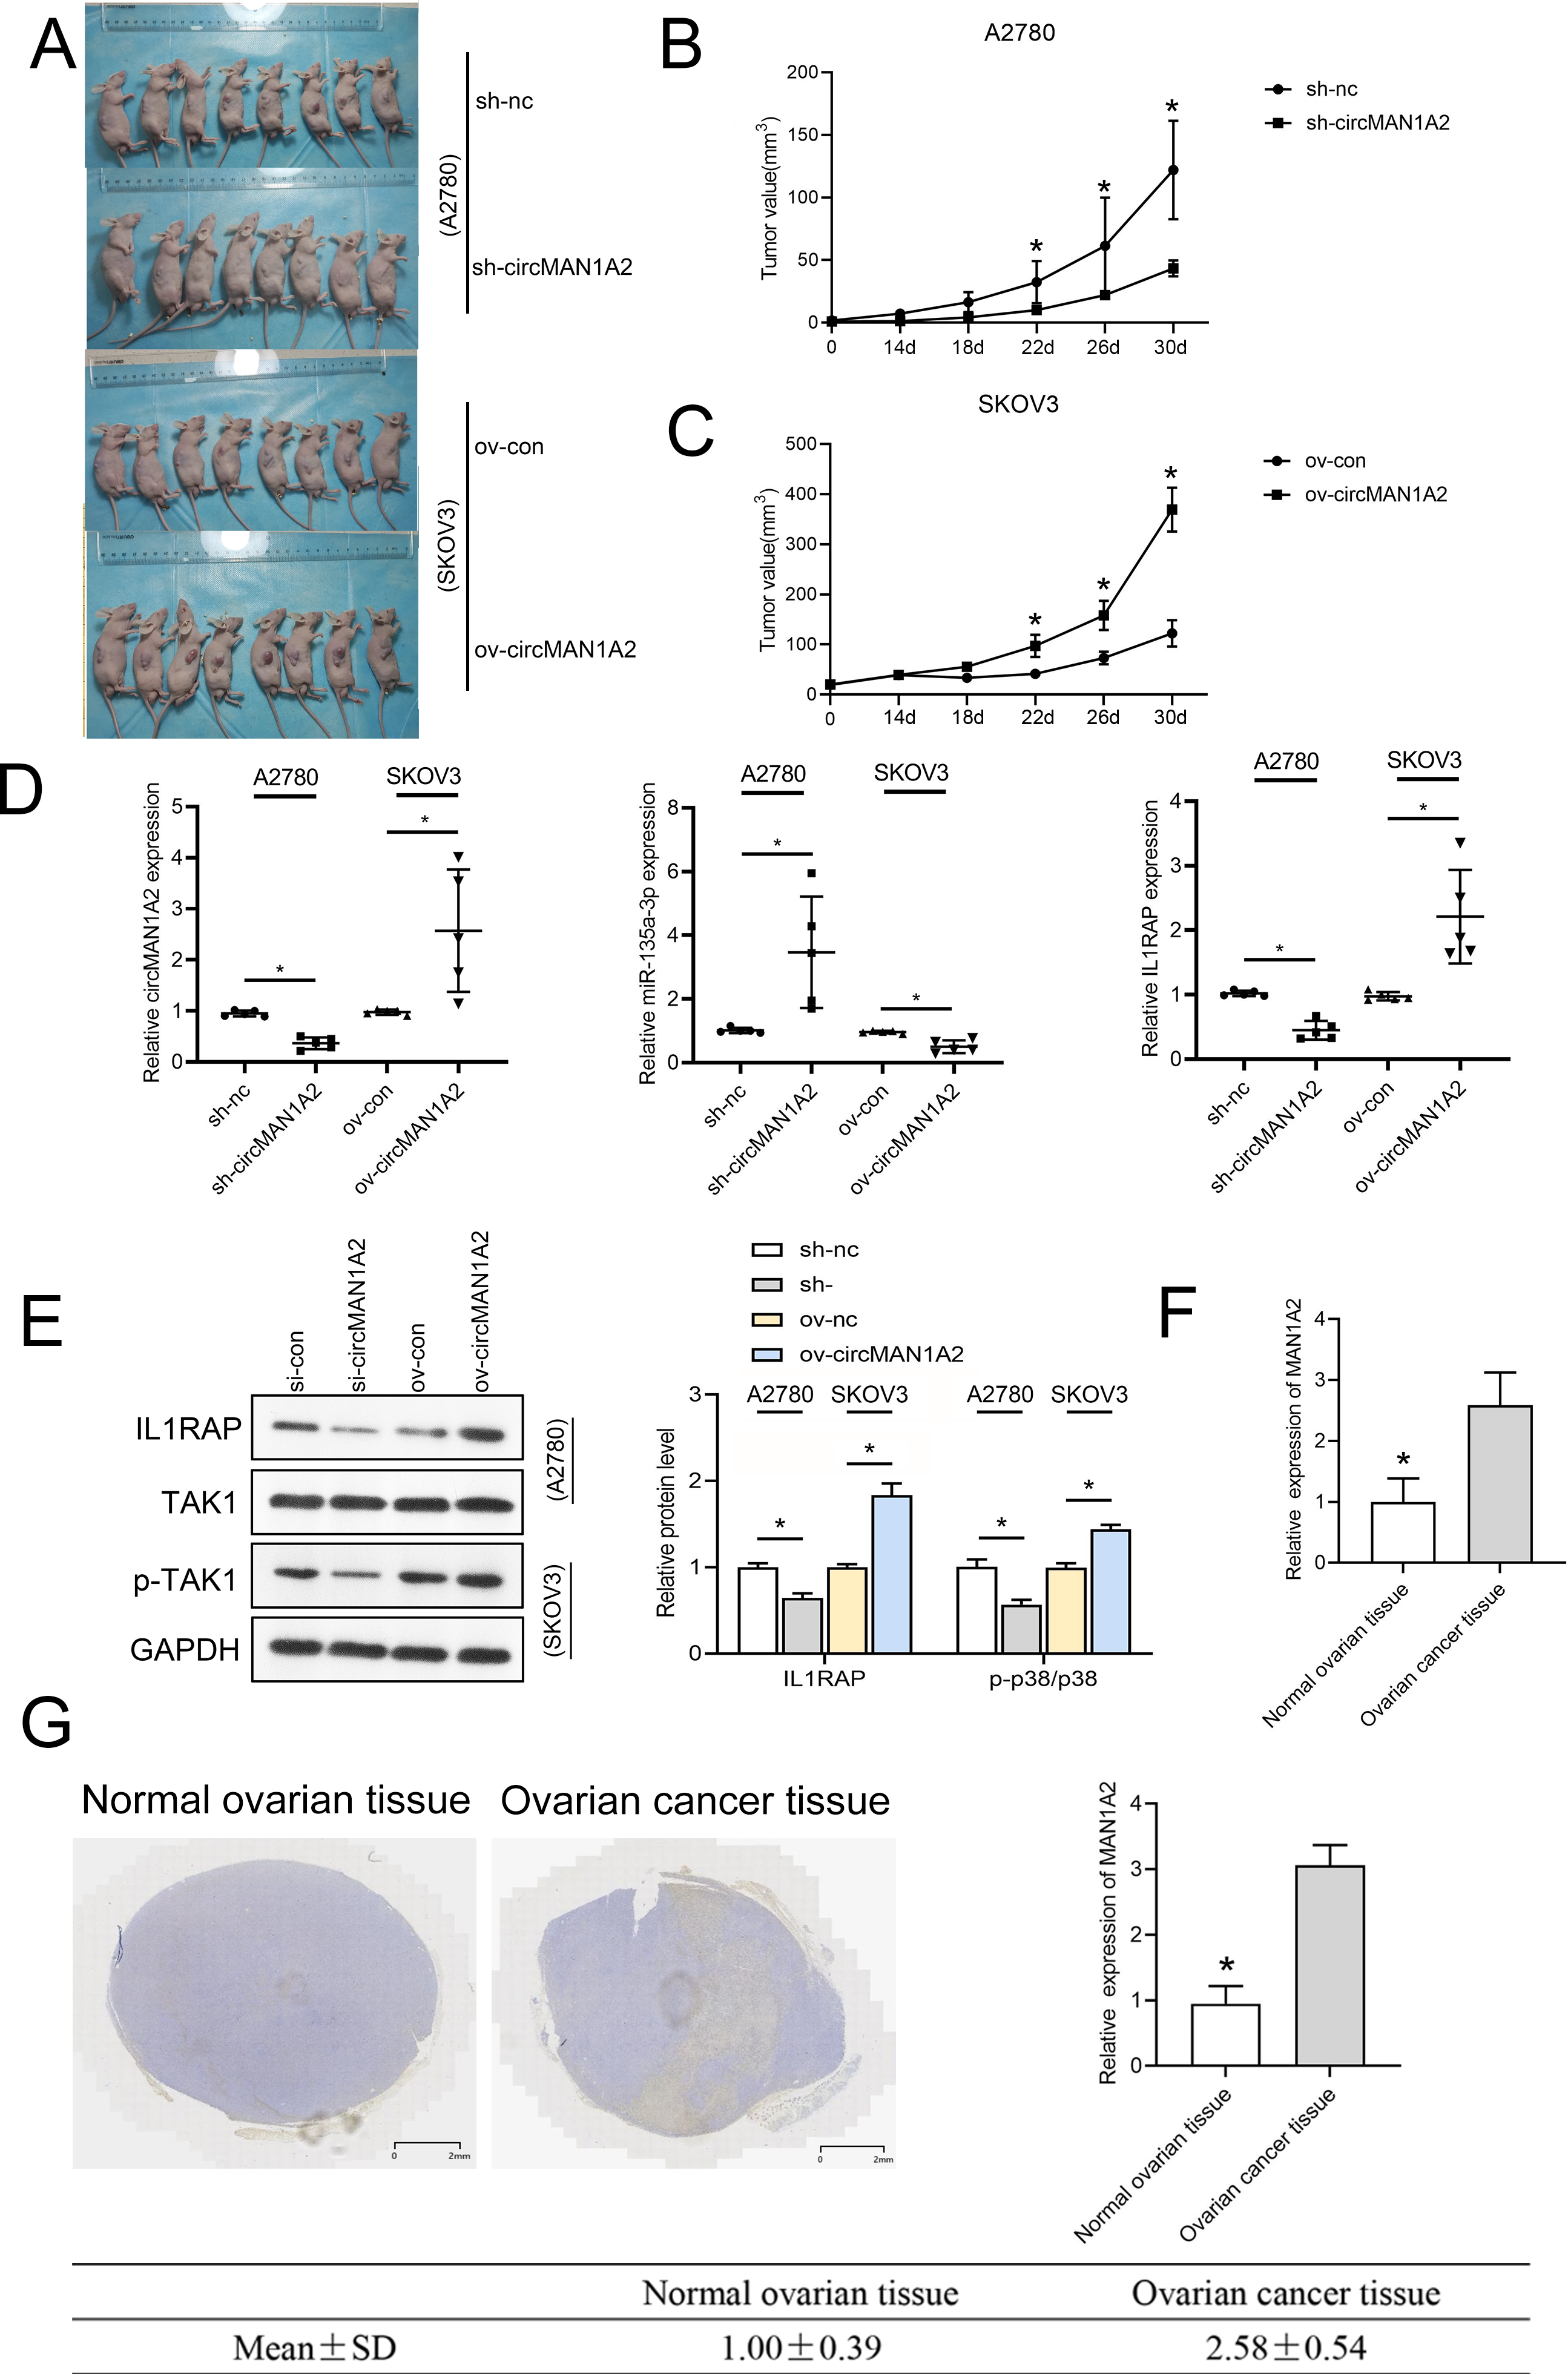
To investigate whether circMAN1A2 affects tumor growth in vivo, a human OC cell xenograft tumor model was established, and circMAN1A2-overexpressing SKOV3 cells, circMAN1A2-knockdown A2780 cells, and their respective controls were subcutaneously injected into female nude mice. It was found that circMAN1A2 exhibited significant tumorigenicity (Fig. 9A). In vivo, sh-circMAN1A2 lentivirus-infected A2780 cell tumor volume decreases compared to the sh-nc group, and ov-circMAN1A2 lentivirus-infected SKOV3 cell tumor volume increases compared to the mock group (Figs. 9B and 9C). Furthermore, the expression of circMAN1A2 and IL1RAP was increased, and the expression of miR-135a-3p was down-regulated in mice injected with circMAN1A2 overexpression compared with the mock group. The effect of the sh-circMAN1A2 group was completely opposite to that of the ov-circMAN1A2 group (Fig. 9D). Western blot results showed that ov-circMAN1A2 promoted IL1RAP protein levels and TAK1 phosphorylation in mice injected with SKOV3 cells compared with the mock group. In mice injected with A2780 cells, sh-circMAN1A2 inhibited IL1RAP protein levels and TAK1 phosphorylation compared with the sh-nc group (Fig. 9E). And the RT-PCR and immunohistochemical staining results showed that the expression of circMAN1A2 in ovarian cancer tissues was significantly higher than that in normal tissues (Figs. 9F and 9G).
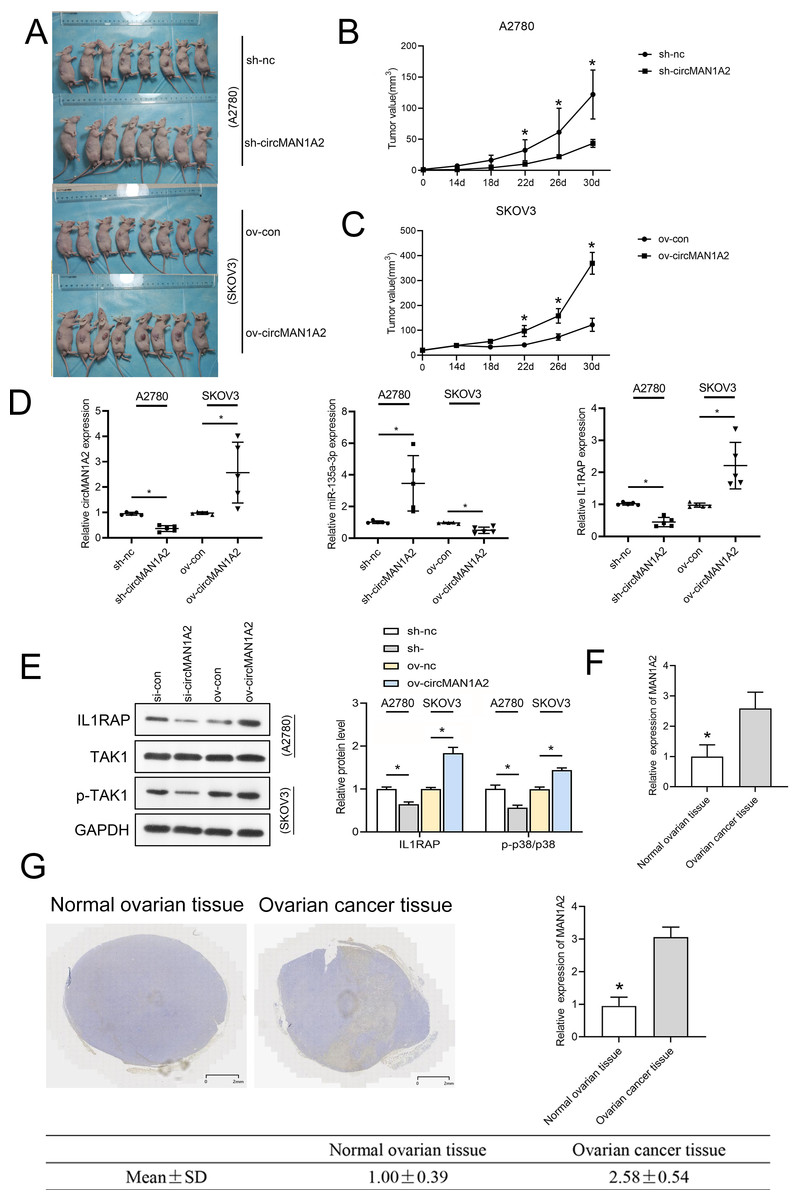
Figure 9: CircMAN1A2 accelerates xenograft tumor growth in vivo.
(A) Xenograft nude mices of each group are displayed (n = 8). (B) Effects of circMAN1A2 overexpression and knockdown on A2780 cell xenograft tumor volume. (C) Effects of circMAN1A2 overexpression on SKOV3 cell xenograft tumor volume. (D) RT-qPCR analyzed the effects of overexpression or knockdown of circMAN1A2 expression on circMAN1A2, miR-135a-3p, and IL1RAP expression in subcutaneous neoplasia. (E) Western blot analyzed the effects of overexpression or knockdown of circMAN1A2 expression onprotein levels of IL1RAP, TAK1, and p-TAK1 in subcutaneous neoplasia. (F) RT-qPCR was used to detect the expression of circMAN1A2 in ovarian cancer tissues and normal tissues. (G) Immunohistochemical staining was used to detect circMAN1A2 in ovarian cancer tissues and normal tissues. *p < 0.05.Discussion
With the advancement of RNA sequencing technology, numerous non-coding RNAs have been discovered, such as miRNAs, long non-coding RNAs, and circRNAs. These non-coding RNAs can regulate tumor initiation and progression. circRNAs differ from non-coding RNAs in a number of ways: circular in shape, lack of 5′ caps and 3′ tails, and relatively stable (Jeck et al., 2013). Concequently, CircRNAs are superior to linear transcripts as diagnostic or therapeutic targets in cancer because of these distinctive properties, and their tissue-specific expression (Ng, Mohd Mohidin & Shukla, 2018). In recent years, multiple circRNAs have been identified as tumor markers of OC (Sheng et al., 2020). For example, CircITGB6 promotes cisplatin resistance in ovarian cancer by resetting tumor-associated macrophage polarization to the M2 phenotype; m6A RNA methylation regulator is an important player in ovarian cancer pathology. The CircRNF144B/miR-342-3p/FBXL11 axis reduces autophagy and promotes ovarian cancer progression by increasing the ubiquitination of Beclin-1. However, the expression and function of most circRNAs in OC development remain unclear.
Studies have found that circFBXO7 acts as a competitive endogenous RNA for miR-96-5p to regulate MTSS1 expression. Thus, the downregulation of MTSS1 leads to excessive accumulation of β-catenin and increase in phosphorylation of GSK3 β, which results in translocation of β-catenin to the nucleus, thereby activating the Wnt/β-catenin signaling pathway, ultimately promoting ovarian cancer progression. Overexpression of Circ-PLEKHM3 exacerbated the effect of curcumin on ovarian cancer cell proliferation and apoptosis and antitumor effects (Wu et al., 2022; Sun & Fang, 2021). Here, we analyzed circRNAs associated with the early diagnosis and poor prognosis of OC. Among them, circABCB10, circMAN1A2, and circEPSTI1 are considered early diagnostic markers of OC (Chen et al., 2019b; Fan et al., 2019; Xie et al., 2019), and circ-ITCH, circABCB10, circHIPK3, and circLARP4 are associated with its poor prognosis (Chen et al., 2019b; Zou et al., 2018; Luo, Gao & Sun, 2018; Liu et al., 2018). The expression of these circRNAs was assessed in normal ovarian epithelial and OC cells; the expression of circMAN1A2 was significantly different in OC cells than in normal cells. Following that, it was found that the growth and cell cycle of OC cells could be significantly improved by overexpressing circMAN1A2, while knockdown of circMAN1A2 had the exact opposite effect as overexpression of circMAN1A2. These results were similar to previous study (Fan et al., 2019). In addition, in vivo xenograft experiments substantiated the pro-proliferative effect of circMAN1A2 on OC. It is suggested that ircMAN1A2, as an oncogene, can inhibit the development of OC when its expression is inhibited.
CircRNAs can act as ceRNAs to regulate the expression of oncogenes or tumor suppressor genes at the post-transcriptional level. circ_0006528 can adsorb miR7-5p and regulate Raf1, which is involved in the proliferation and migration of breast cancer (Hsiao et al., 2015). Under the regulation of androgen, circHIAT1 adsorbs miR-195-5p/29a-3p/29c-3p, regulates cyclin CDC42, and participates in the development of renal clear cell cancer (ccRCC) (Wang et al., 2017b). Moreover, circRNA_000839 regulates hepatocellular carcinoma (HCC) invasion and migration through the miR-200b–RhoA axis (Wang et al., 2017a). In previous studies, miR-135a-3p was found to be down-regulated in OC patients and tissues and thus it could be considered a tumor suppressor, biomarker, and nucleic acid therapeutic agent in OC (Duan et al., 2018; Fukagawa et al., 2017). In this study, we first identified the circular structure of circMAN1A2 and then found that circMAN1A2 and miR-135a-3p exhibit subcellular co-localization. Dual-luciferase and RNA pull-down assays further verified that circMAN1A2 directly binds to miR-135a-3p.
Since miRNA can bind to the 3′ UTR of mRNA and inhibit the transcriptional activity and translation level of mRNA (Wang & Liu, 2021; Zhang et al., 2019), when miR-135a-3p was adsorbed by circMAN1A2, we detected its downstream effect on the transcription and translation of target mRNA that affects the OC process. Then, we screened IL1RAP as a potential target of miR-135a-3p and verified the binding between the two by dual luciferase assay. Subsequently, we also confirmed the negative regulatory association between miR-135a-3p and IL1RAP in terms of expression and function of OC cells. Therefore, it was proved that circMAN1A2/miR-135a-3p/IL1RAP promotes the process of OC.
It is well known that alterations in signaling pathways may be key to the development and progression of cancer (Zhou et al., 2022). As a highly conserved signaling pathway, MAPK signaling is involved in a variety of biological events, including metabolic reprogramming, cell proliferation, migration, and differentiation (Asl et al., 2021; Lee, Rauch & Kolch, 2020). Existing evidence shows that the increase of phosphorylation level of TAK1, one of the main members of MAPK, can significantly promote the proliferation and metastasis of OC cells (Wu et al., 2021b). The study has demonstrated that circMAN1A2 promotes OC cell growth and tumorigenicity in vivo. In addition, phosphorylation levels of TAK1 increased in overexpressed circMAN1A2 and decreased in silenced circMAN1A2 in OC cells and in vivo tumors. It was shown that circMAN1A2 can inhibit miR-135a-3p to active IL1RAP and TAK1, thereby promoting the growth and migration of OC cells. Studies have found that circMAN1A2 up-regulates ERBB2 through sponge miR-940, which can promote the growth of nasopharyngeal cancer cells and angiogenesis simulation (Mo et al., 2023). The regulation of circMAN1A2 on the phosphorylation level of TAK1 involves the miR-135a-3p/IL1RAP axis.
This study has shortcomings. Firstly, we did not obtain the data on the association between circMAN1A2 and clinical characteristics in OC patients. Secondly, many RNAs that may affect the OC process are involved, but they are not discussed here. Thirdly, the effect and mechanism of interactions between RNAs or proteins on OC are not covered. Finally, we did not explore the role of circMAN1A2 in the treatment of OC with drugs or drug resistance. However, these are the main directions and goals of our future research.
Conclusion
The specific mechanism of circMAN1A2 on OC tumor progression was discussed, and the circMAN1A2/miR-135a-3p/IL1RAP/TAK1 axis and its role in the progression of OC were first introduced. The research findings may provide experimental basis for clinical application.