
Uneven demographic consequences of the 2022 disease outbreak for the sea urchin Diadema antillarum in Puerto Rico
- Published
- Accepted
- Received
- Academic Editor
- Anastazia Banaszak
- Subject Areas
- Ecology, Marine Biology, Zoology, Population Biology
- Keywords
- Diadema antillarum, Mass mortality, Sea urchin, Demography, Puerto Rico
- Copyright
- © 2023 Rodríguez-Barreras et al.
- Licence
- This is an open access article distributed under the terms of the Creative Commons Attribution License, which permits unrestricted use, distribution, reproduction and adaptation in any medium and for any purpose provided that it is properly attributed. For attribution, the original author(s), title, publication source (PeerJ) and either DOI or URL of the article must be cited.
- Cite this article
- 2023. Uneven demographic consequences of the 2022 disease outbreak for the sea urchin Diadema antillarum in Puerto Rico. PeerJ 11:e16675 https://doi.org/10.7717/peerj.16675
Abstract
Pervasive epizootic events have had a significant impact on marine invertebrates throughout the Caribbean, leading to severe population declines and consequential ecological implications. One such event was the regional collapse of herbivory, partly caused by the Diadema antillarum mortality event in 1983–84, resulting in a trophic cascade and altering the structure of reef communities. Consequently, there was a notable decrease in coral recruitment and an increase in the coverage of macroalgae. Nearly four decades later, in early 2022, the Caribbean basin experienced another widespread mass mortality event, further reducing the populations of D. antillarum. To assess the effects of this recent mortality event on the current demographics of D. antillarum, we surveyed eight populations along the eastern, northeastern, northern, and northwestern coast of Puerto Rico from May to July 2022, estimating their population density, size distribution, and disease prevalence. Additionally, the study compared these population parameters with data from four sites previously surveyed in 2012 and 2017 to understand the impact of the recent mortality event. The survey conducted in 2022 showed varying population densities at the surveyed reefs. Some populations exhibited mean densities of nearly one individual per square meter, while others had extremely low or no living individuals per square meter. The four populations with the highest density showed no evidence of disease, whereas the four populations with the lowest D. antillarum densities exhibited moderate to high disease prevalence. However, when considering all sites, the estimated disease prevalence remained below 5%. Nevertheless, the comparison with data from 2012 and 2017 indicated that the recent mortality event had a negative impact on D. antillarum demographics at multiple sites, as the densities in 2022 were reduced by 60.19% compared to those from the previous years. However, it is still too early to determine the severity of this new mortality event compared to the 1983–84 mortality event. Therefore, it is imperative to continue monitoring these populations.
Introduction
Over recent years, the incidence of infectious diseases affecting marine organisms has increased and resulted in structural and functional impacts on ecosystems (Yadav & Upadhyay, 2023). Even though infectious diseases are common in the marine realm, mass mortalities caused by infectious diseases are rare, yet their effects can be dramatic and long-lasting. Mass mortalities could be particularly damaging in regions characterized by a low redundancy of functional groups, such as the Caribbean reefs (Carpenter, 1990; Mumby et al., 2006). Such events could lead to a functional extinction of a key species (i.e., the level at which the species no longer fulfills its ecological role) (Valiente-Banuet et al., 2015), compromising the community assemblage of the entire region and consequently restructuring the services these ecosystems provide to humankind and their ecological roles in the oceans (Lessios, 1988; Carpenter, 1990).
The prevalence of disease outbreaks is increasingly impacting the marine environment (Harvell et al., 1999). Reports of large-scale episodic events leading to mass mortalities in marine organisms have increased since the latter half of the previous century (Hayes et al., 2001). Consequently, documented instances of population crash due to disease outbreak episodes have been reported in many marine taxa. However, population crashes are not uncommon among echinoderms (Hewson et al., 2019; Lawrence, 2020). This phylum is commonly referred to as a “boom-bust” group due to the frequent outbreak episodes and massive die-offs observed worldwide (Uthicke, Schaffelke & Byrne, 2009). Echinoderms play an important ecological role in the Caribbean region, not only as key herbivores, and structuring agents of the benthic community (Sammarco, 1982), but also due to their history of population crashes (Hughes et al., 1985; Steneck, 2013).
Several mass-mortality events affecting coral reefs in the Caribbean have been recorded, but the 1980 Diadema antillarum mass mortality event has been the most serious and well-studied of all (Lessios, 2016). Before the die-off, D. antillarum was among the main herbivores native to Caribbean coral reefs (Steneck, 2013; Mercado-Molina et al., 2015; Rodríguez-Barreras et al., 2014). However, a mysterious waterborne pathogen(s) demised over 98% of the D. antillarum population throughout the Caribbean basin (Lessios et al., 1984; Hughes et al., 1985). Immediately after, and in subsequent decades, reef-building corals declined, while the coral reefs experienced a significant increase in macroalgae, contributing to a severe decline in coral cover (Lessios, 2016). Nearly 40 years after the mass-mortality event, D. antillarum has shown variable levels of recovery across the region; however, D. antillarum densities have not reached pre-mortality levels in most localities (Mercado-Molina et al., 2015; Rodríguez-Barreras et al., 2015a; Tuohy, Wade & Weil, 2020; Pusack et al., 2022).
In early 2022, a new mortality event of D. antillarum was reported on several islands across the Caribbean (Response Network, AGRRA, 2022). The mortality was first reported in the US Virgin Islands, and subsequently, mortalities were reported in several reefs throughout the Caribbean. Many individuals have been found dead or showing signs of disease, i.e., sea urchins outside their shelters in midday hours, unable to attach to the substrate, showing slow movement of spines as a response to contact, and loss of spines (Hylkema et al., 2023). It is known that the species has a diurnal sheltering and nocturnal foraging behavior (Sharp et al., 2023). The resurgence of the D. antillarum die-off at a time when populations across the Caribbean have not fully recovered is of great concern for the scientific community, given the poor ecological state of Caribbean coral reefs (Levitan, Best & Edmunds, 2023). Monitoring demographic changes in keystone species populations is essential for gaining insights into the biological relationships within an ecosystem. Therefore, in this study, we surveyed D. antillarum populations along the eastern, northern, and northwestern coasts of Puerto Rico. At each site, we estimated the population density, size distribution, and disease prevalence. We subsequently compared these parameters to available demographic data collected in 2012 and 2017 for four of these sites. These surveys were driven by three central questions: (1) Is the disease found in all the surveyed reefs? (2) Is the disease prevalence similar in all the surveyed reefs, and therefore are these reefs affected by the disease in a similar way, and (3) Are different sizes of D. antillarum individuals equally affected by the disease?
Materials and Methods
Surveyed sites
Surveys were carried out in eight shallow water reefs (<3.0 m depth) along the eastern, northeastern, northern, and northwestern coasts of Puerto Rico (Fig. 1). These sites were selected based on (1) the availability of demographic data from 2012 and 2017, and (2) divers who posted images of diseased and dead D. antillarum individuals on social media. The surveys started in May 2022, in Playa Punta Bandera located in Luquillo, on the northeastern coast (PBA), and Cerro Gordo in Vega Baja (CGO), on the northern coast of Puerto Rico. Surveys continued in June, 2022 when we visited Punta Tamarindo (PTA) and Punta Melones (PME), both on Culebra Island, on the eastern coast of Puerto Rico; Playa Sardinera in Dorado, on the northern coast (PSA), and Shacks Beach (SBE) and Playa Peña Blanca (PBL) in Aguadilla, both on the northwestern coast of Puerto Rico. Surveys ended in July 2022, when we visited Playa El Escambrón in San Juan on the northern coast (ESC) (Table 1).
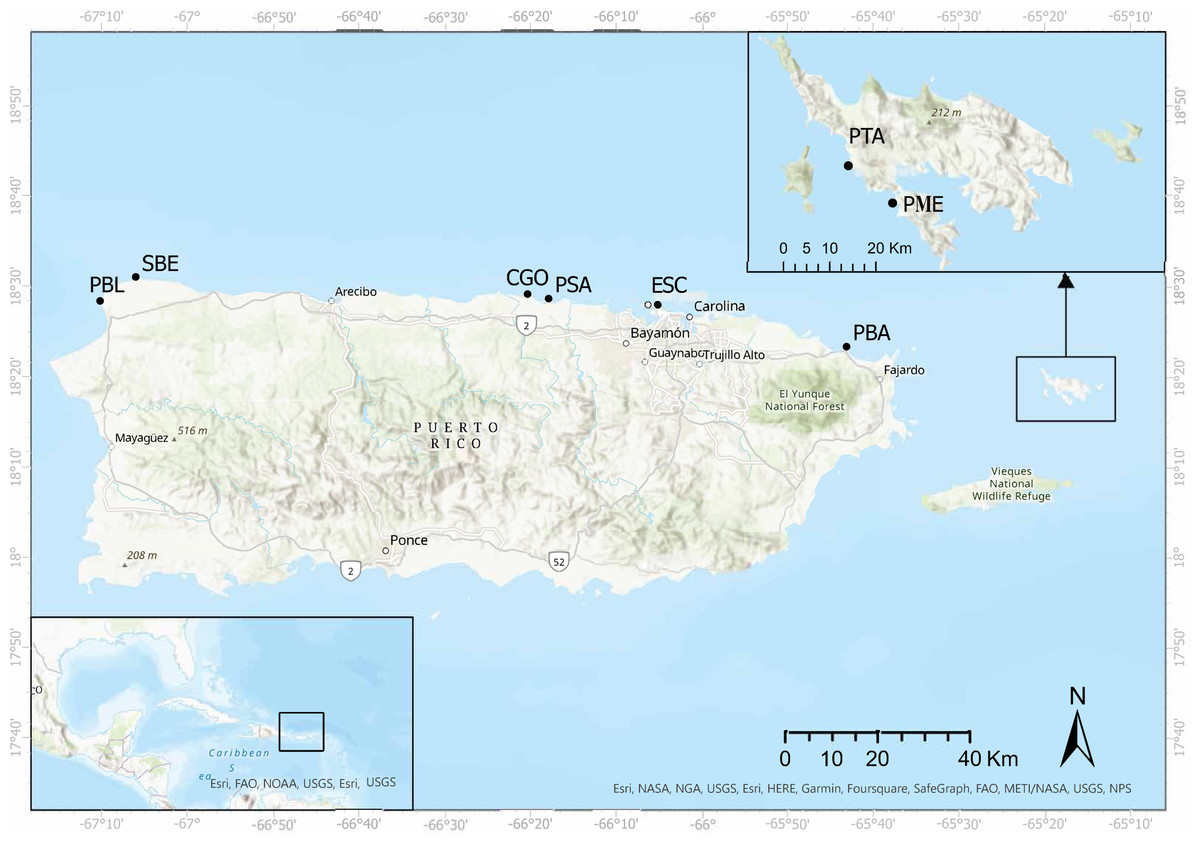
Figure 1: Surveyed sites along the eastern and northern coasts of Puerto Rico and Culebra Islands.
Punta Tamarindo (PTA) and Punta Melones (PME) in Culebra Island, Punta Bandera (PBA), El Escambrón (ESC), Cerro Gordo (CGO), Playa Sardinera (PSA), Shacks Beach (SBE), and Playa Peña Blanca (PBL). Image credit: Open Street Map. Esri World Imaginary.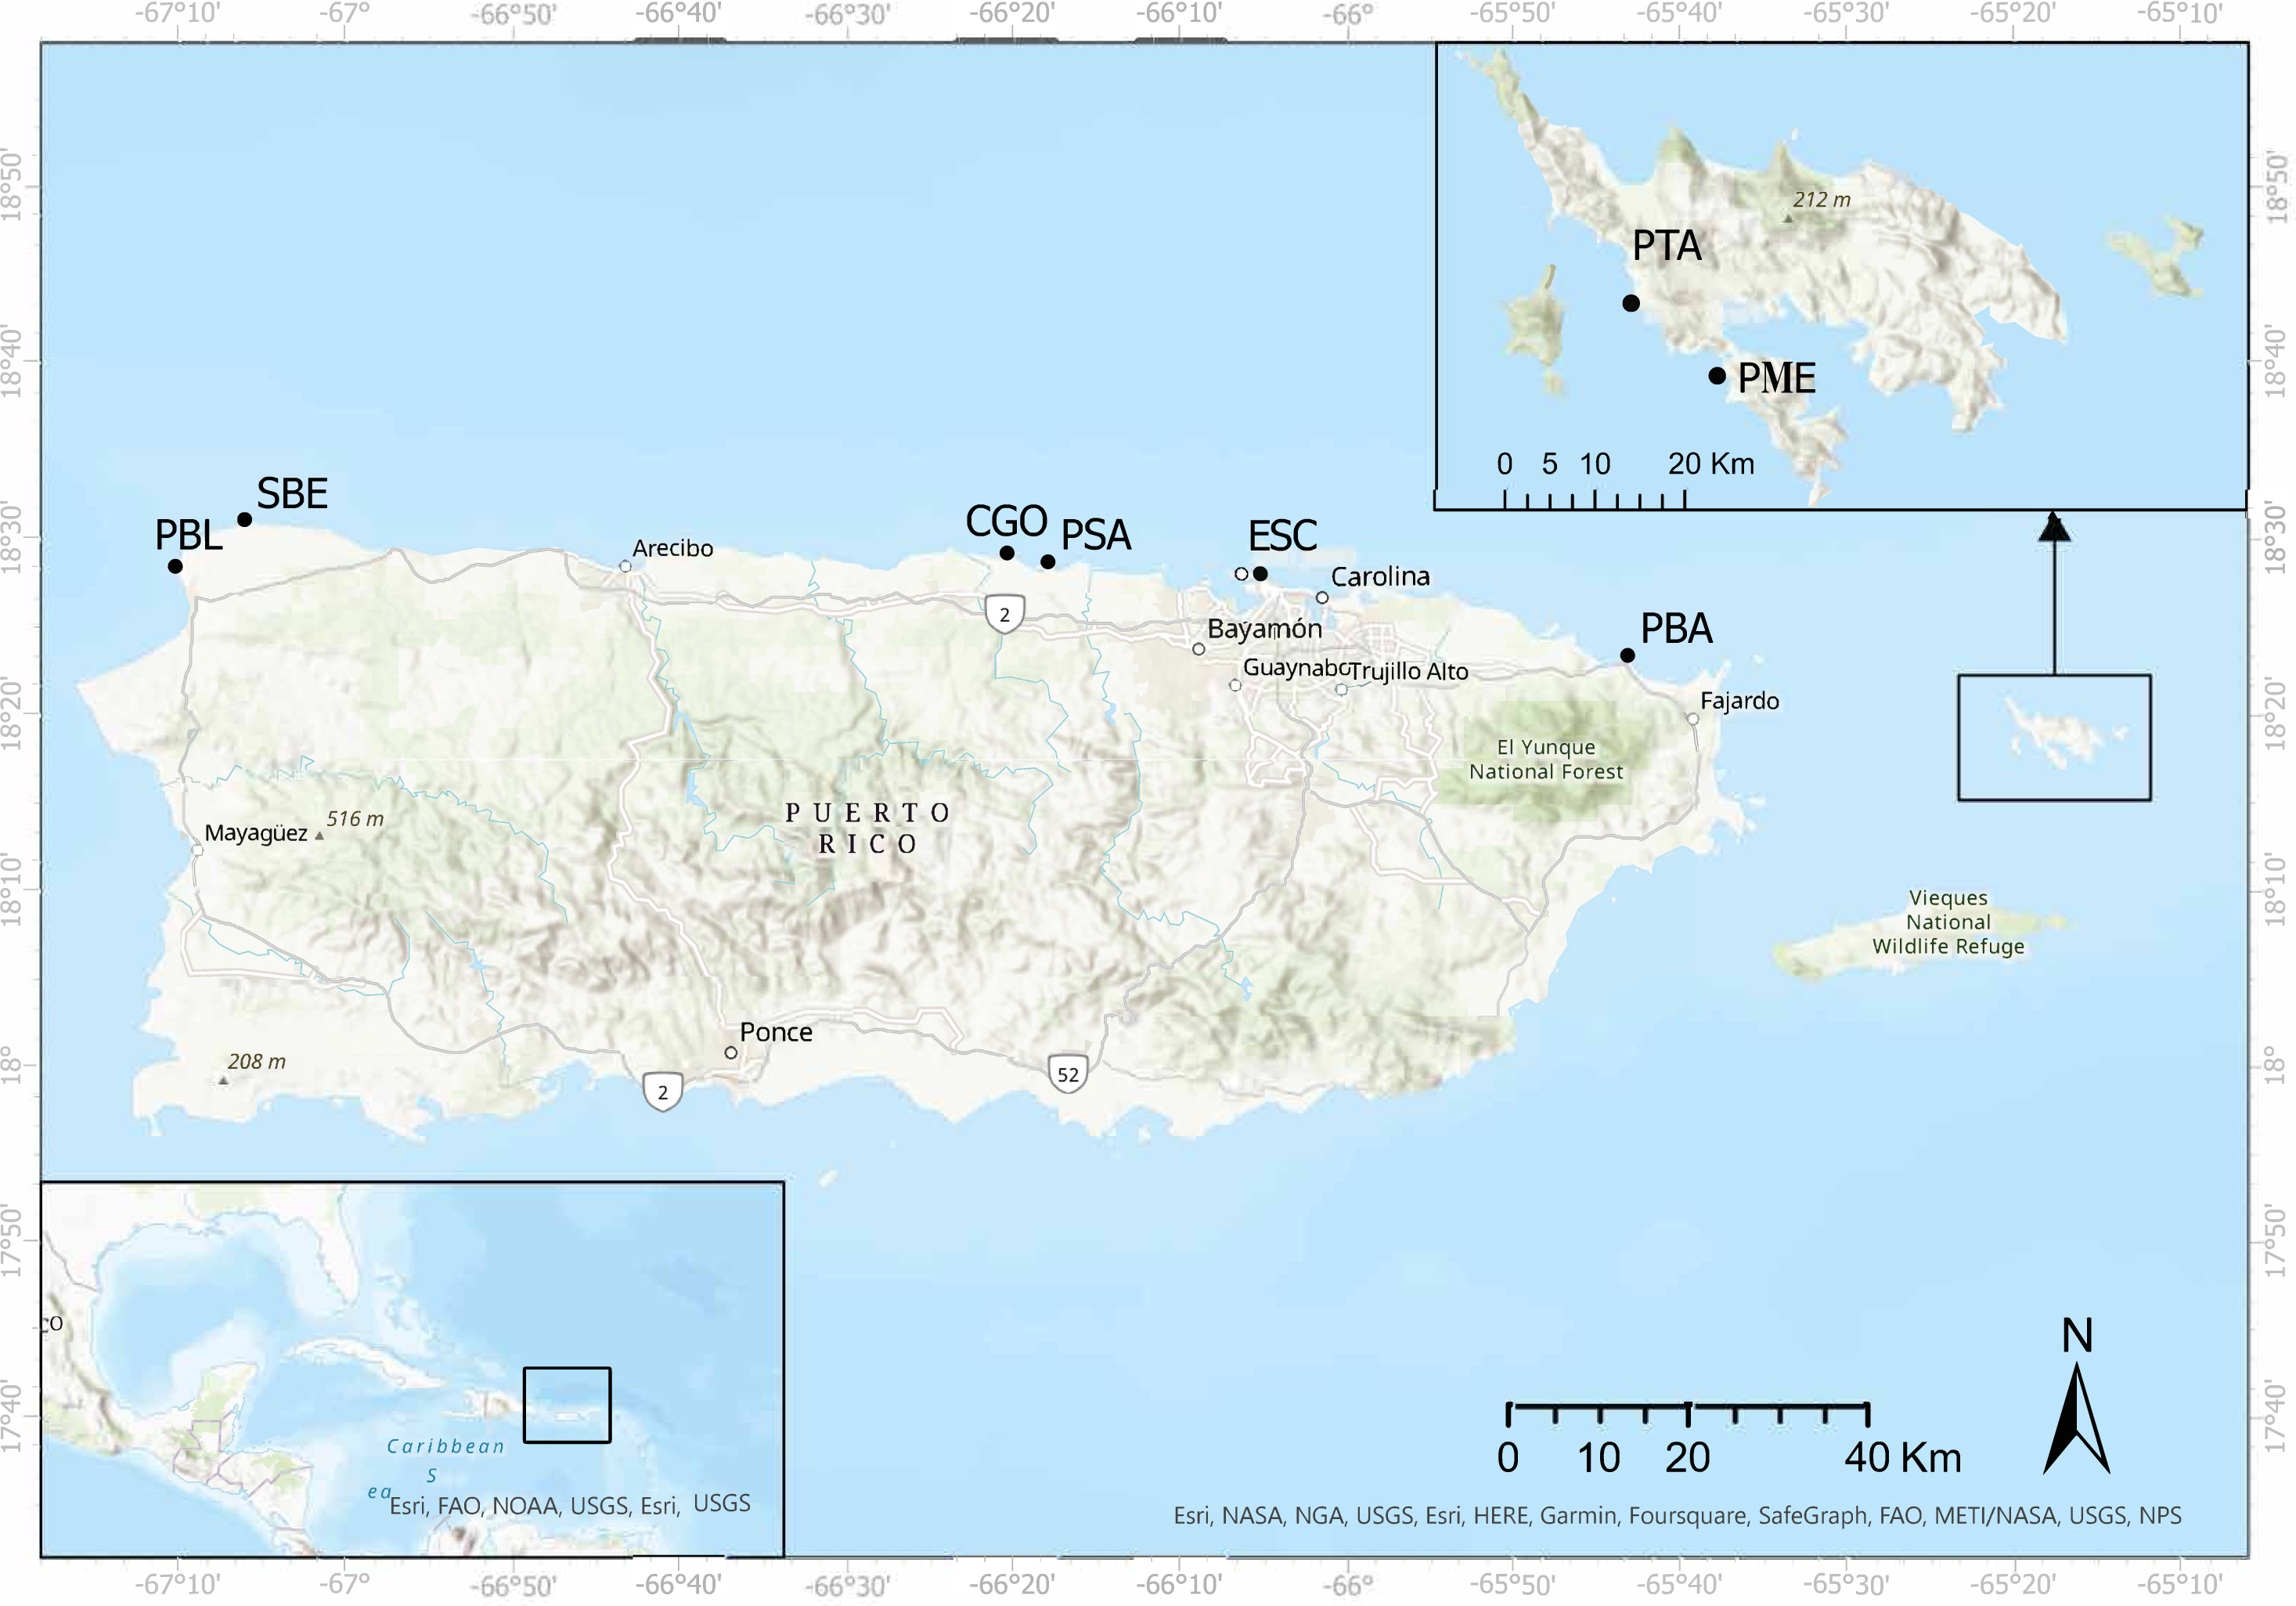
| Site | Acronym | County | Lat. | Long. | Coral cover (%) | Depth (m) |
|---|---|---|---|---|---|---|
| Punta Tamarindo | PTA | Culebra | 18.3151 | −65.3179 | 15–20 | 1–2 |
| Punta Melones | PME | Culebra | 18.3041 | −65.3112 | 15–20 | 1–3 |
| El Escambrón | ESC | San Juan | 18.4660 | −66.0858 | <5 | 0.5–3 |
| Punta Bandera | PBA | Luquillo | 18.3882 | −65.7185 | 15–20 | 0.5–1 |
| Cerro Gordo | CGO | Vega Alta | 18.4850 | −66.3389 | <10 | 1–3 |
| Shacks Beach | SBE | Isabela | 18.5164 | −67.1001 | <5 | 1–3 |
| Peña Blanca | PBL | Aguadilla | 18.4724 | −67.1691 | <10 | 1–3 |
| Playa Sardinera | PSA | Dorado | 18.4768 | −66.2984 | <5 | 0.5–1 |
PBA is a shallow bordering reef (<2 m in depth), with coral cover ranging from 20–60% and dominated by standing dead and live Acropora palmata and Pseudodiploria strigosa at the reef crest. At the back reef, the substrate is dominated by P. clivosa, and Porites furcata mixed with patches of Thalassia testudinum and Syringodium filiforme. Water clarity is nearly 10 m year-round. CGO is a patchy reef interconnected with patches of seagrass beds dominated by T. testudinum and, to a lesser extent, by S. filiforme. This reef is influenced by a natural freshwater channel that drains nearly 100 m west of this reef. Coral cover at this reef is <10%, and is mainly dominated by P. astreoides, P. strigosa, and P. clivosa. Water clarity is highly variable, ranging from <2 m during the rainy season to >10 m in the dry season. PTA and PME are basaltic rock outcrops with coral coverage ranging from 15–20% dominated by massive coral heads such as Porites astreoides, Pseudodiploria strigosa, P. clivosa, Favia fragum, and standing dead Acropora palmata. Water clarity exceeds 10 m year-round. Data collected from these reefs were compared with historical data available in Rodríguez-Barreras et al. (2018).
PSA is a shallow (<1 m water depth) emergent aeolianite platform of 4.4 km2, bordered by seagrass beds dominated by S. filiforme and to a lesser extent T. testudinum and sand. Coral cover is nearly 8% and is dominated by Madracis mirabilis, P. furcata, and Siderastrea radians. Water clarity is highly variable, ranging from <1 m during the rainy season to >15 m in the dry season. SBE is dominated by dead coral heads of Orbicella and Acropora, mixed with P. strigosa, P. clivosa, and A. palmata at the reef crest and by P. astreoides and A. palmata and octocorals the back reef. In this zone, coral coverage is <5%. Water quality ranged between 3-10m most of the year. PBL is a karstic in origin flat substrate, with a coral cover <10%, dominated by Pseudodiploria strigosa, P. clivosa, P. laberinthiformis, Porites astreoides and octocorals. Water clarity is >8–10 m year-round. ESC is a submerged seawall of basaltic rocks and steel girders oriented perpendicular to the shore. Coral coverage at this reef is less than 5% and is dominated by P. astreoides and octocorals such as Gorgonia ventalina. The natural substratum next to the rocks is a mixed assemblage of macroalgae and sand with small size patches of T. testudinum and S. filiforme. Water clarity ranged between 1–5 m year-round.
Population parameters
To determine sea urchin density, test diameter, and to be able to compare recently collected data with the historical data, we followed Mercado-Molina et al. (2015) and Rodríguez-Barreras et al. (2018). Briefly, at each reef and at hours ranging from 10:00–13:00, we set eight belt transects of 20 m2 (10 m × 2 m) parallel to the coast. Transects were at least 5 m apart from each other at depths ranging from 1–3 m, as at these depths sea urchin abundance tends to be higher (Ruiz-Ramos, Hernández-Delgado & Schizas, 2011; Rodríguez-Barreras et al., 2014; Mercado-Molina et al., 2015). We counted all individuals within each transect, including the healthy, the diseased, and the dead individuals. Sea urchin individuals were diagnosed as diseased if they were observed outside their cavities in daylight hours, unable to attach to the substrate, showing slow movement of spines as a response to contact and/or autotomy, i.e., loss of spines. We also carefully inspected crevices between corals and small holes within each transect to avoid missing cryptic individuals. These data were used to estimate the urchin density (i.e., the number of urchins per transect per site). We also measured the test diameter of individuals collected from the transects to estimate the size distribution at each reef. The total measured individuals per reef was 50. When needed, sea urchins out of the transects were measured until reaching 50 individuals per reef. Likewise, we also measured the tests from dead and sick sea urchins when possible. These data were used to classify sea urchins into three size classes: small or juvenile (test diameter ≤ 4.0 cm), medium or young adult (test diameter between 4.01 and 6.0 cm), and large or adult (test diameter >6.01 cm) individuals. This data was used to construct a size-frequency distribution (Miller et al., 2003; Lugo-Ascorbe, 2004; Rodríguez-Barreras et al., 2014). Sampling was approved by the Department of Natural and Environmental Resources of Puerto Rico, permit number DRNA- 2022-IC-046.
Data analysis
We ran a general linear model with a Poisson distribution using the number of observations per transect as the response variable and the surveyed reefs as the explanatory variable to determine statistical differences between the 2022 sea urchin densities and between sites. To determine statistical significances between the historical density (i.e., 2012 and 2017) and density data from 2022, we ran a general linear model with a Poisson distribution using the number of observed D. antillarum individuals per transect as the response variable and reefs (CGO, PTA, PME, and PBA) and years (i.e., 2012, 2017 and 2022) as the explanatory variables. To compare size distribution based on the horizontal test diameter of D. antillarum among reefs during 2022, we used a two-way ANOVA, with the test size (in cm) as the response variable and size categories (small, medium, and large), and surveyed reefs as the explanatory variables. To determine potential differences in size structure from data collected in 2012, 2017, and 2022, we ran a three-way ANOVA using the test diameter (in cm) as the response variable and size categories (small, medium, and large), surveyed reefs (CGO, PTA, PME, and PBA) and years (2012, 2017 and 2022) as the explanatory variables, and a Tukey post-hoc pairwise comparison. All statistical analyses were conducted using R Statistical Software (v 4.3.1; R Core Team, 2023).
Results
Spatio-temporal abundance
Out of the eight sites visited from May to July 2022, seven had living D. antillarum (i.e., PBA, CGO, PSA, SBE, PME, PBL, and ESC). We only observed dead individuals at PTA. Overall, a total of 665 living D. antillarum individuals were counted, resulting in a local mean density of 0.52 ±0.33 ind m−2 (mean ± SD). The highest densities were observed in CGO (1.09 ± 0.26 ind m−2) and PBA (1.05 ± 0.89 ind m−2), followed by PSA and PBL with 0.79 ± 0.43 ind m−2 and 0.78 ± 0.42 ind m−2, respectively. The lowest densities were found at PSA, ESC, and PME with 0.36 ± 0.27, 0.11 ± 0.17, and 0.01 ± 0.02 ind m−2, respectively (Figs. 2 and 3). The statistical analysis revealed significant differences in mean densities among all sites except between PBA and CGO (Table S1).
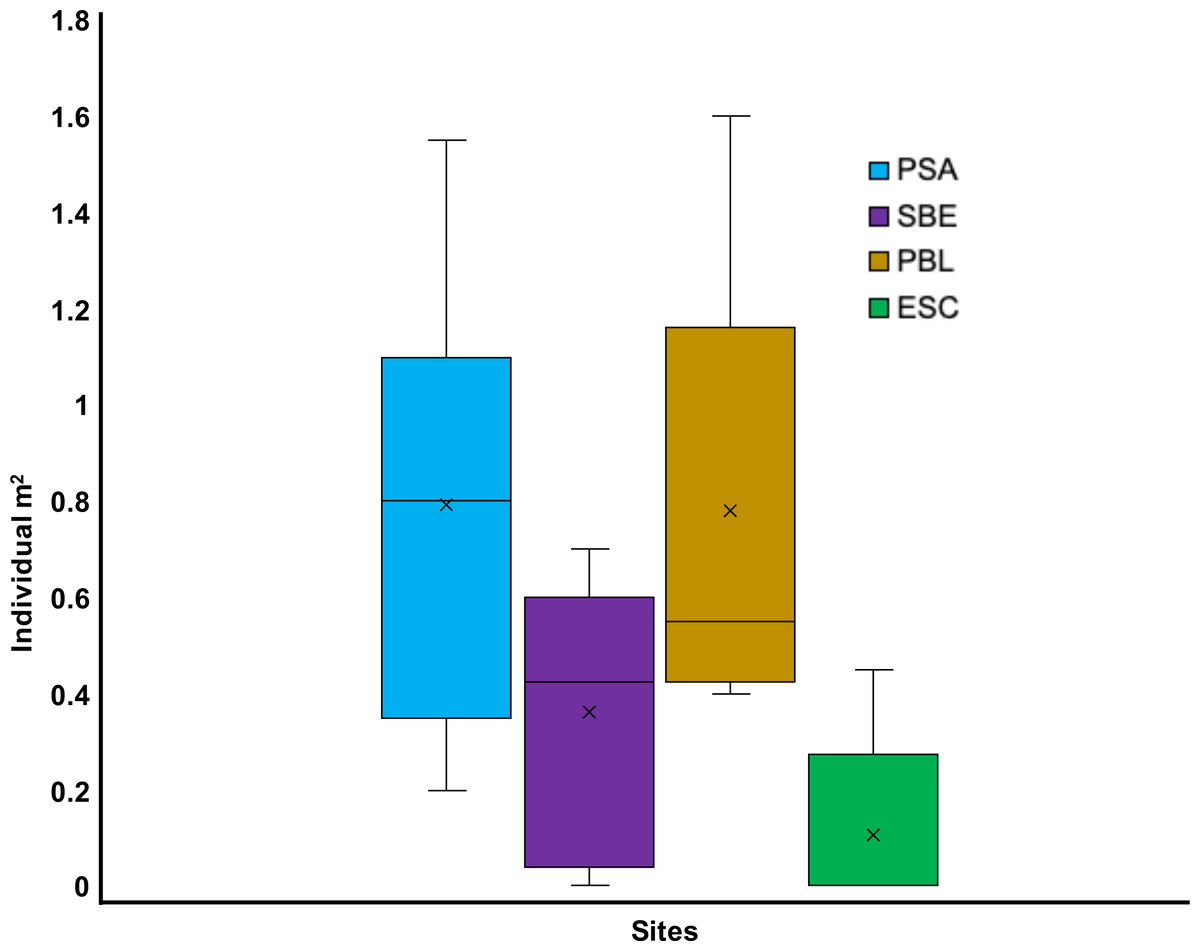
Figure 2: Boxplot showing the 2022 Diadema antillarum abundance across Cerro Gordo (CGO), El Escambrón (ESC), Punta Bandera (PBA), Playa Peña Blanca (PBL), Punta Melones (PME), Playa Sardinera (PSA), Punta Tamarindo (PTA), Shacks Beach (SBE).
The red circle represents the mean, the median is represented by the bold line, the extremes of the boxplot are the 1st and 3rd quartiles, and the whiskers are the maximum and minimum. The black dots represent the outliers.
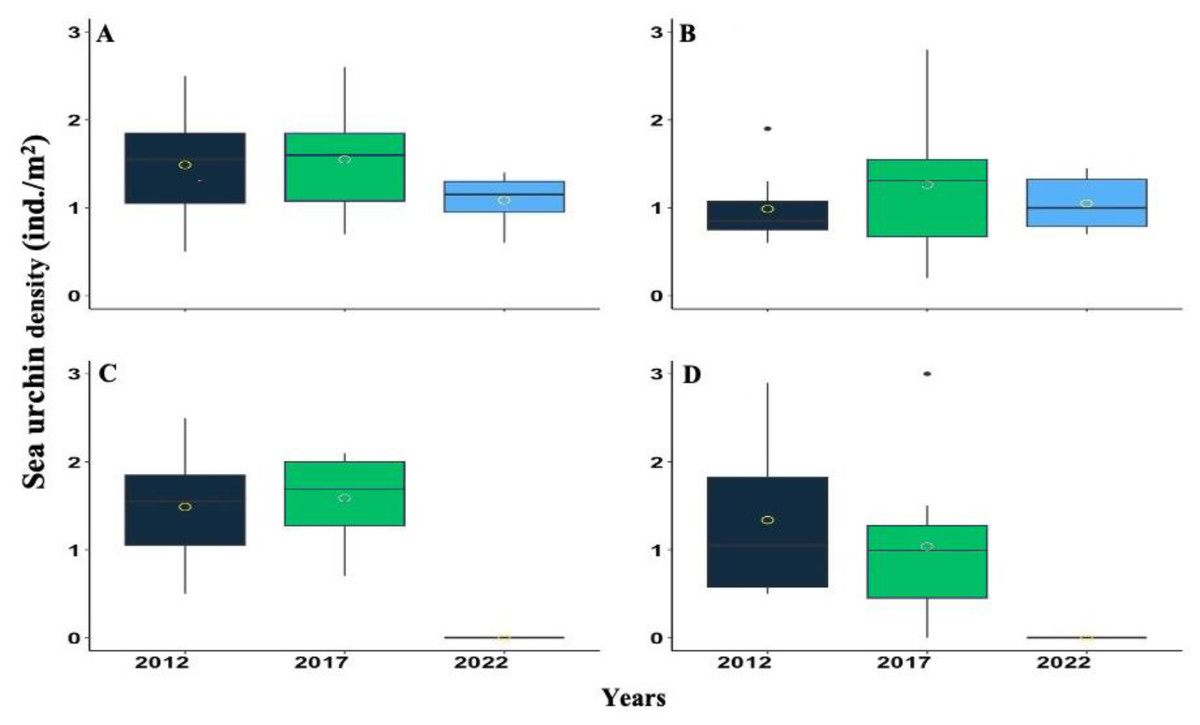
Figure 3: Boxplot showing the Diadema antillarum density across years 2012, 2017 & 2022 at (A) Cerro Gordo (CGO), (B) Punta Bandera (PBA), (C) Punta Tamarindo (PTA), and (D) Punta Melones (PME).
In the boxplot, the yellow circle represents the mean, the median is presented by the bold line, the extreme of the boxplot are the 1st and 3rd quartiles, and the whiskers are the maximum and minimum.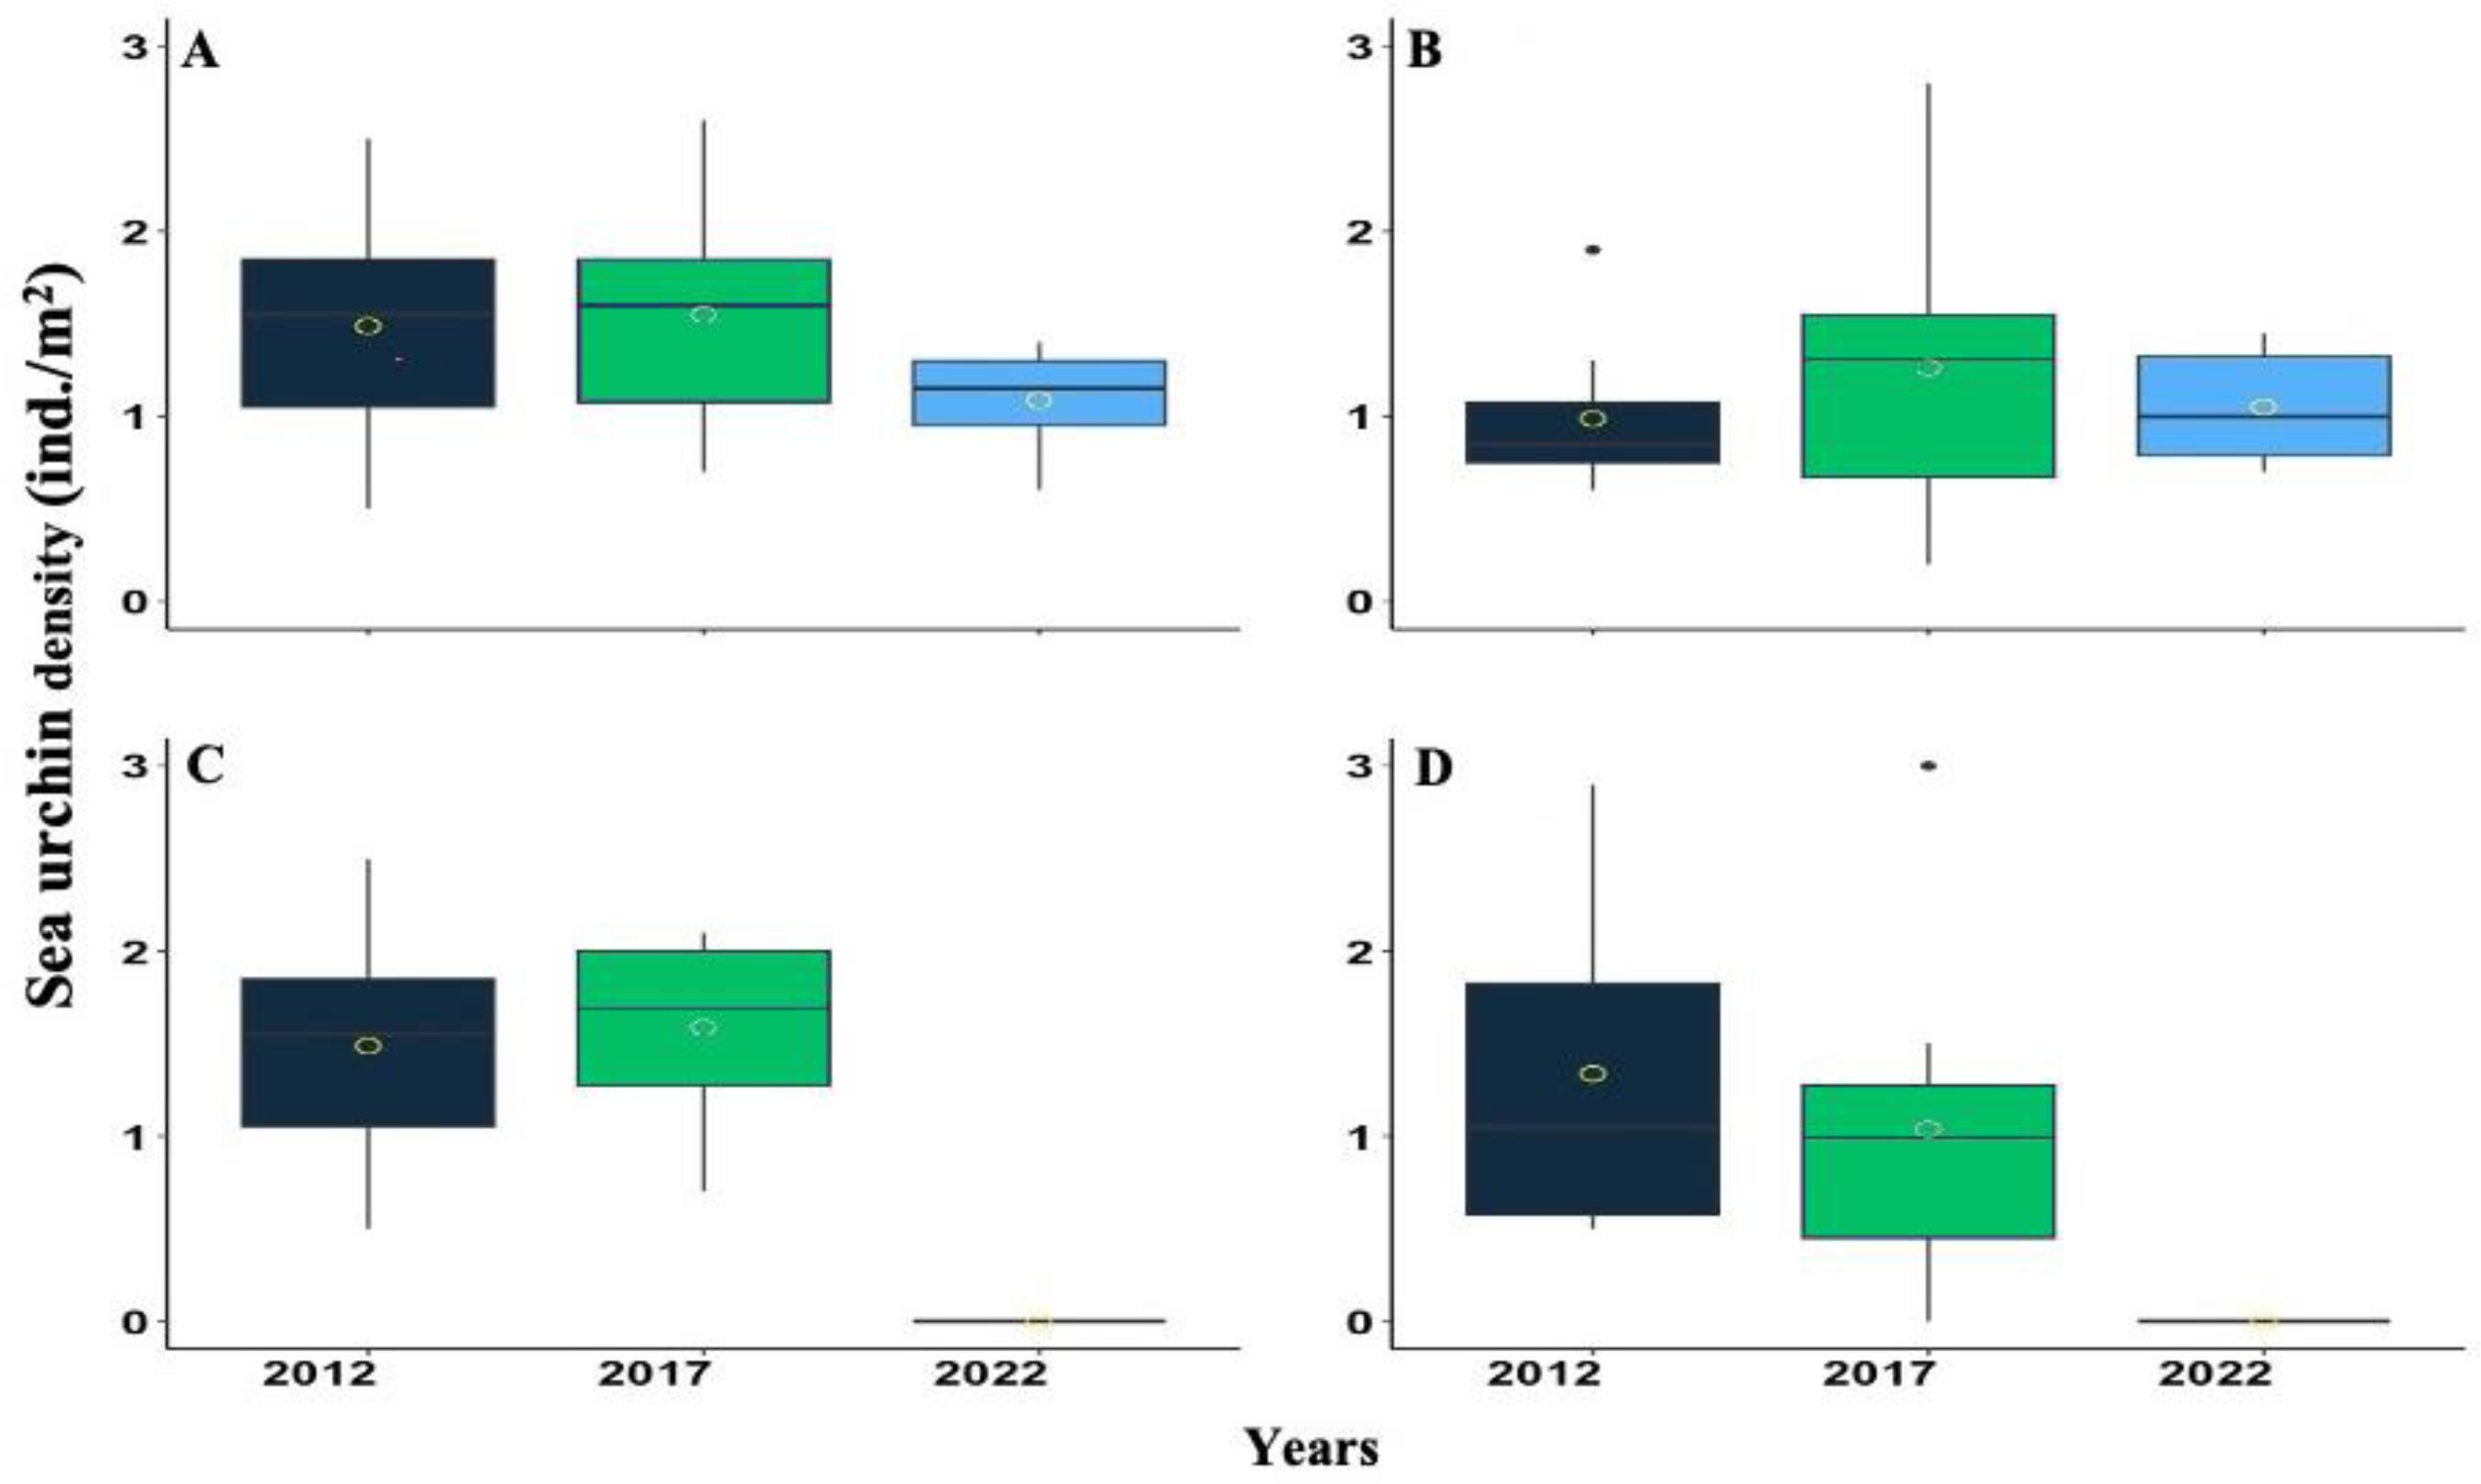
D. antillarum densities were highly variable from 2012, 2017, and 2022. Nonetheless, a consistent pattern of increasing from 2012 to 2017 and decreasing between 2017 to 2022 was observed at most of the surveyed reefs (Fig. 3). For instance, at CGO, density increased by 4.03% from 2012 to 2017, but from 2017 to 2022, it decreased by 29.84%. At PBA, density increased by 21.78% from 2012 to 2017 but decreased by 20.23% from 2017 to 2022 (Fig. 3). Likewise, at PTA, density increased by 6.30% from 2012 to 2017, yet no living individuals were observed in 2022. In contrast, density at PME steadily declined across the survey. For instance, from 2012 to 2017, density declined by 29%, and from 2017 to 2022 declined by 99%. Statistical differences were found among sites between 2012 and 2017 with 2022, and the interaction between sites and years (Table S2).
Test diameter distribution
Overall, the mean diameter of D. antillarum tests across reefs in 2022 were relatively similar. The highest test diameter was observed in PBA with 7.19 ± 0.89 cm, followed by SBE with 7.03 ± 1.33 cm, PSA with 6.81 ± 1.09 cm, ESC with 6.86 ± 1.23 cm, CGO with 6.46 ± 0.91 cm, and PBL with 5.84 ± 1.11 cm (Fig. 4). Only three individuals were measured at PME; the mean test diameter was 5.11 ± 1.07 cm. Similar test diameters were also recorded in 2012 and 2017. For instance, in 2012, PTA exhibited the highest mean test diameter at 6.82 ± 0.74 cm, followed by PME and PBA with 6.78 ± 0.77 cm and 6.75 ± 0.88 cm respectively, and lastly, CGO with 6.31 ± 1.31 cm. In 2017, CGO showed the highest test diameter with 6.79 ± 1.05 cm, followed by PBA and PME with 6.60 ± 1.13 cm and 6.57 ±1.10 cm, respectively, and lastly, PTA with 5.92 cm ±0.96 cm (Fig. 5). Statistical differences were detected between reefs (F = 5.334 df = 3, p-value = 0.001), years (F = 6.095, df = 2, p-value = 0.002), and the interaction between sites and years (F = 6.75, df = 5, p-value = 4.23 e-06). The post-hoc analysis revealed differences between PTA and the rest of the reefs across all years. The analysis also revealed differences between PBA-2022 and PME-2017, PBA-2017 and PTA-2017, PBA-2022, and CGO-2022.
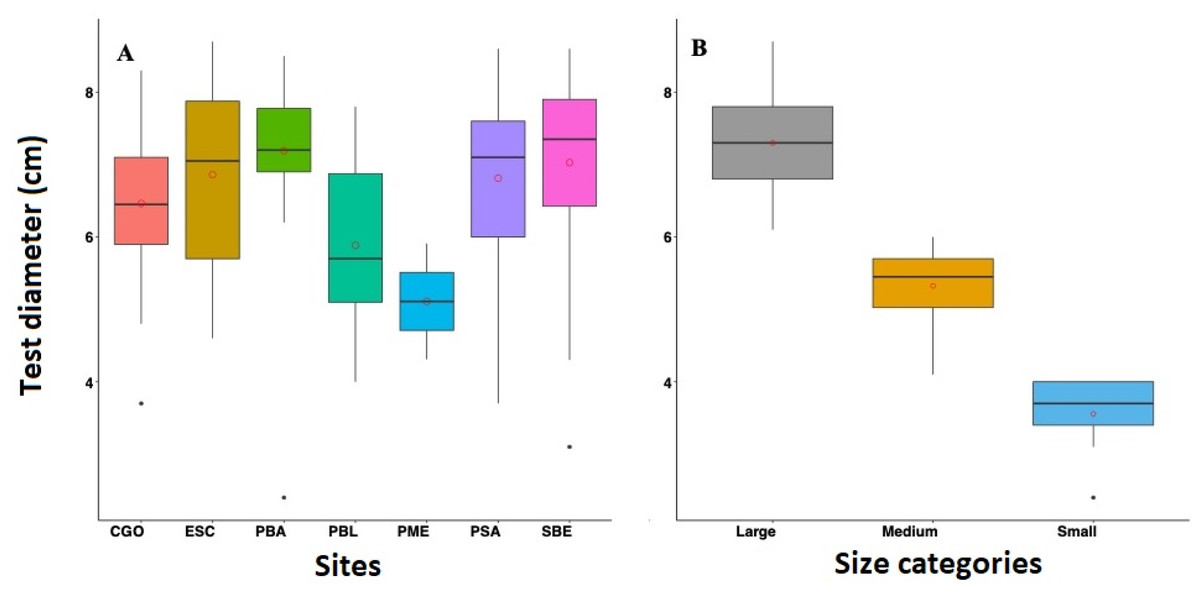
Figure 4: Boxplot showing the test diameter of Diadema antillarum in 2022 across the study sites (A) and by size categories (B).
Sites are Cerro Gordo (CGO), Escambrón (ESC), Punta Bandera (PBA), Playa Peña Blanca (PBL), Punta Melones (PME), Playa Sardinera (PSA), and Shacks Beach (SBE). Size class category: small (≤ 4.0 cm), medium (4.01 to 6.01 cm), and large (>6.01 cm). In the boxplot, the red circle represents the mean, the median is presented by the bold line, the extreme of the boxplot are the 1st and 3rd quartiles, and the whiskers are the maximum and minimum.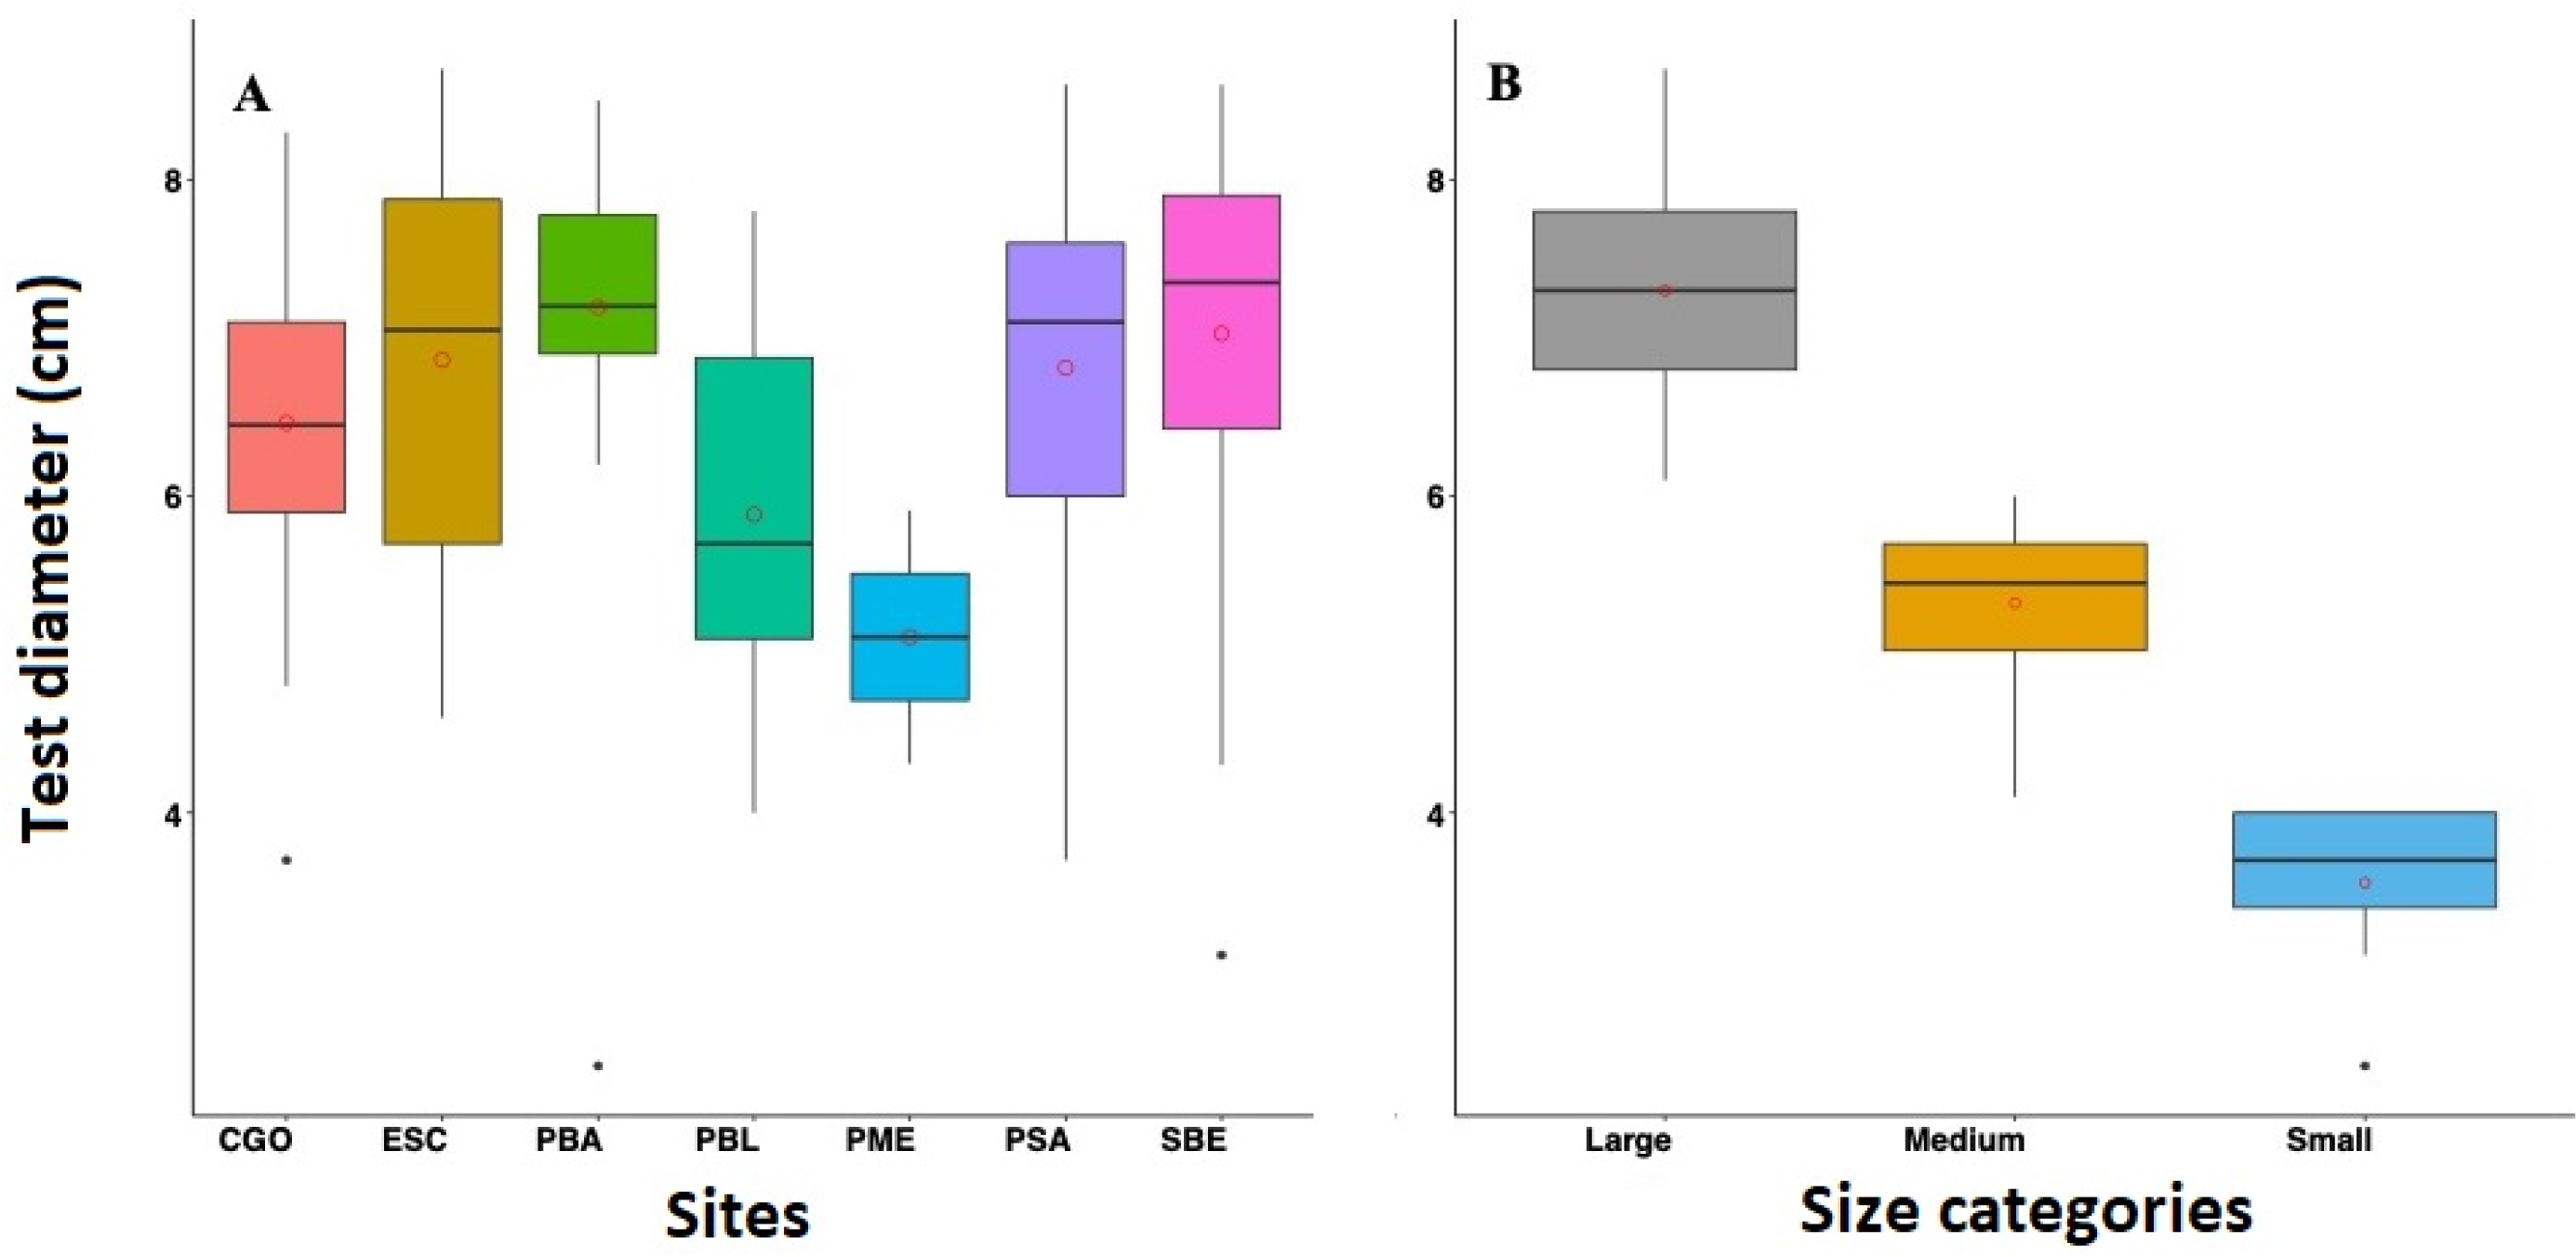
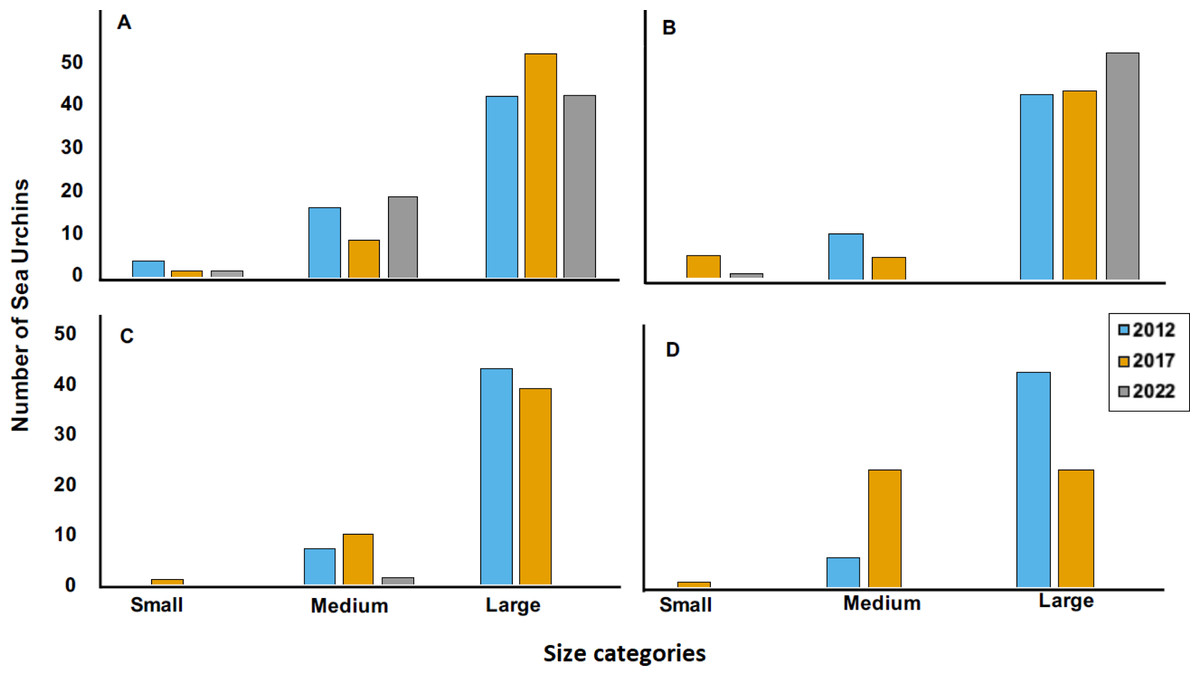
Figure 5: Size categories distribution across years 2012, 2017 and 2022 at four sites, where (A) is Cerro Gordo (CGO), (B) is Punta Bandera (PBA), (C) Punta Melones (PME), and (D) is Punta Tamarindo (PTA).
Size class category: small (≤ 4.0 cm), medium (4.01 to 6.0 cm), and large (>6.01 cm).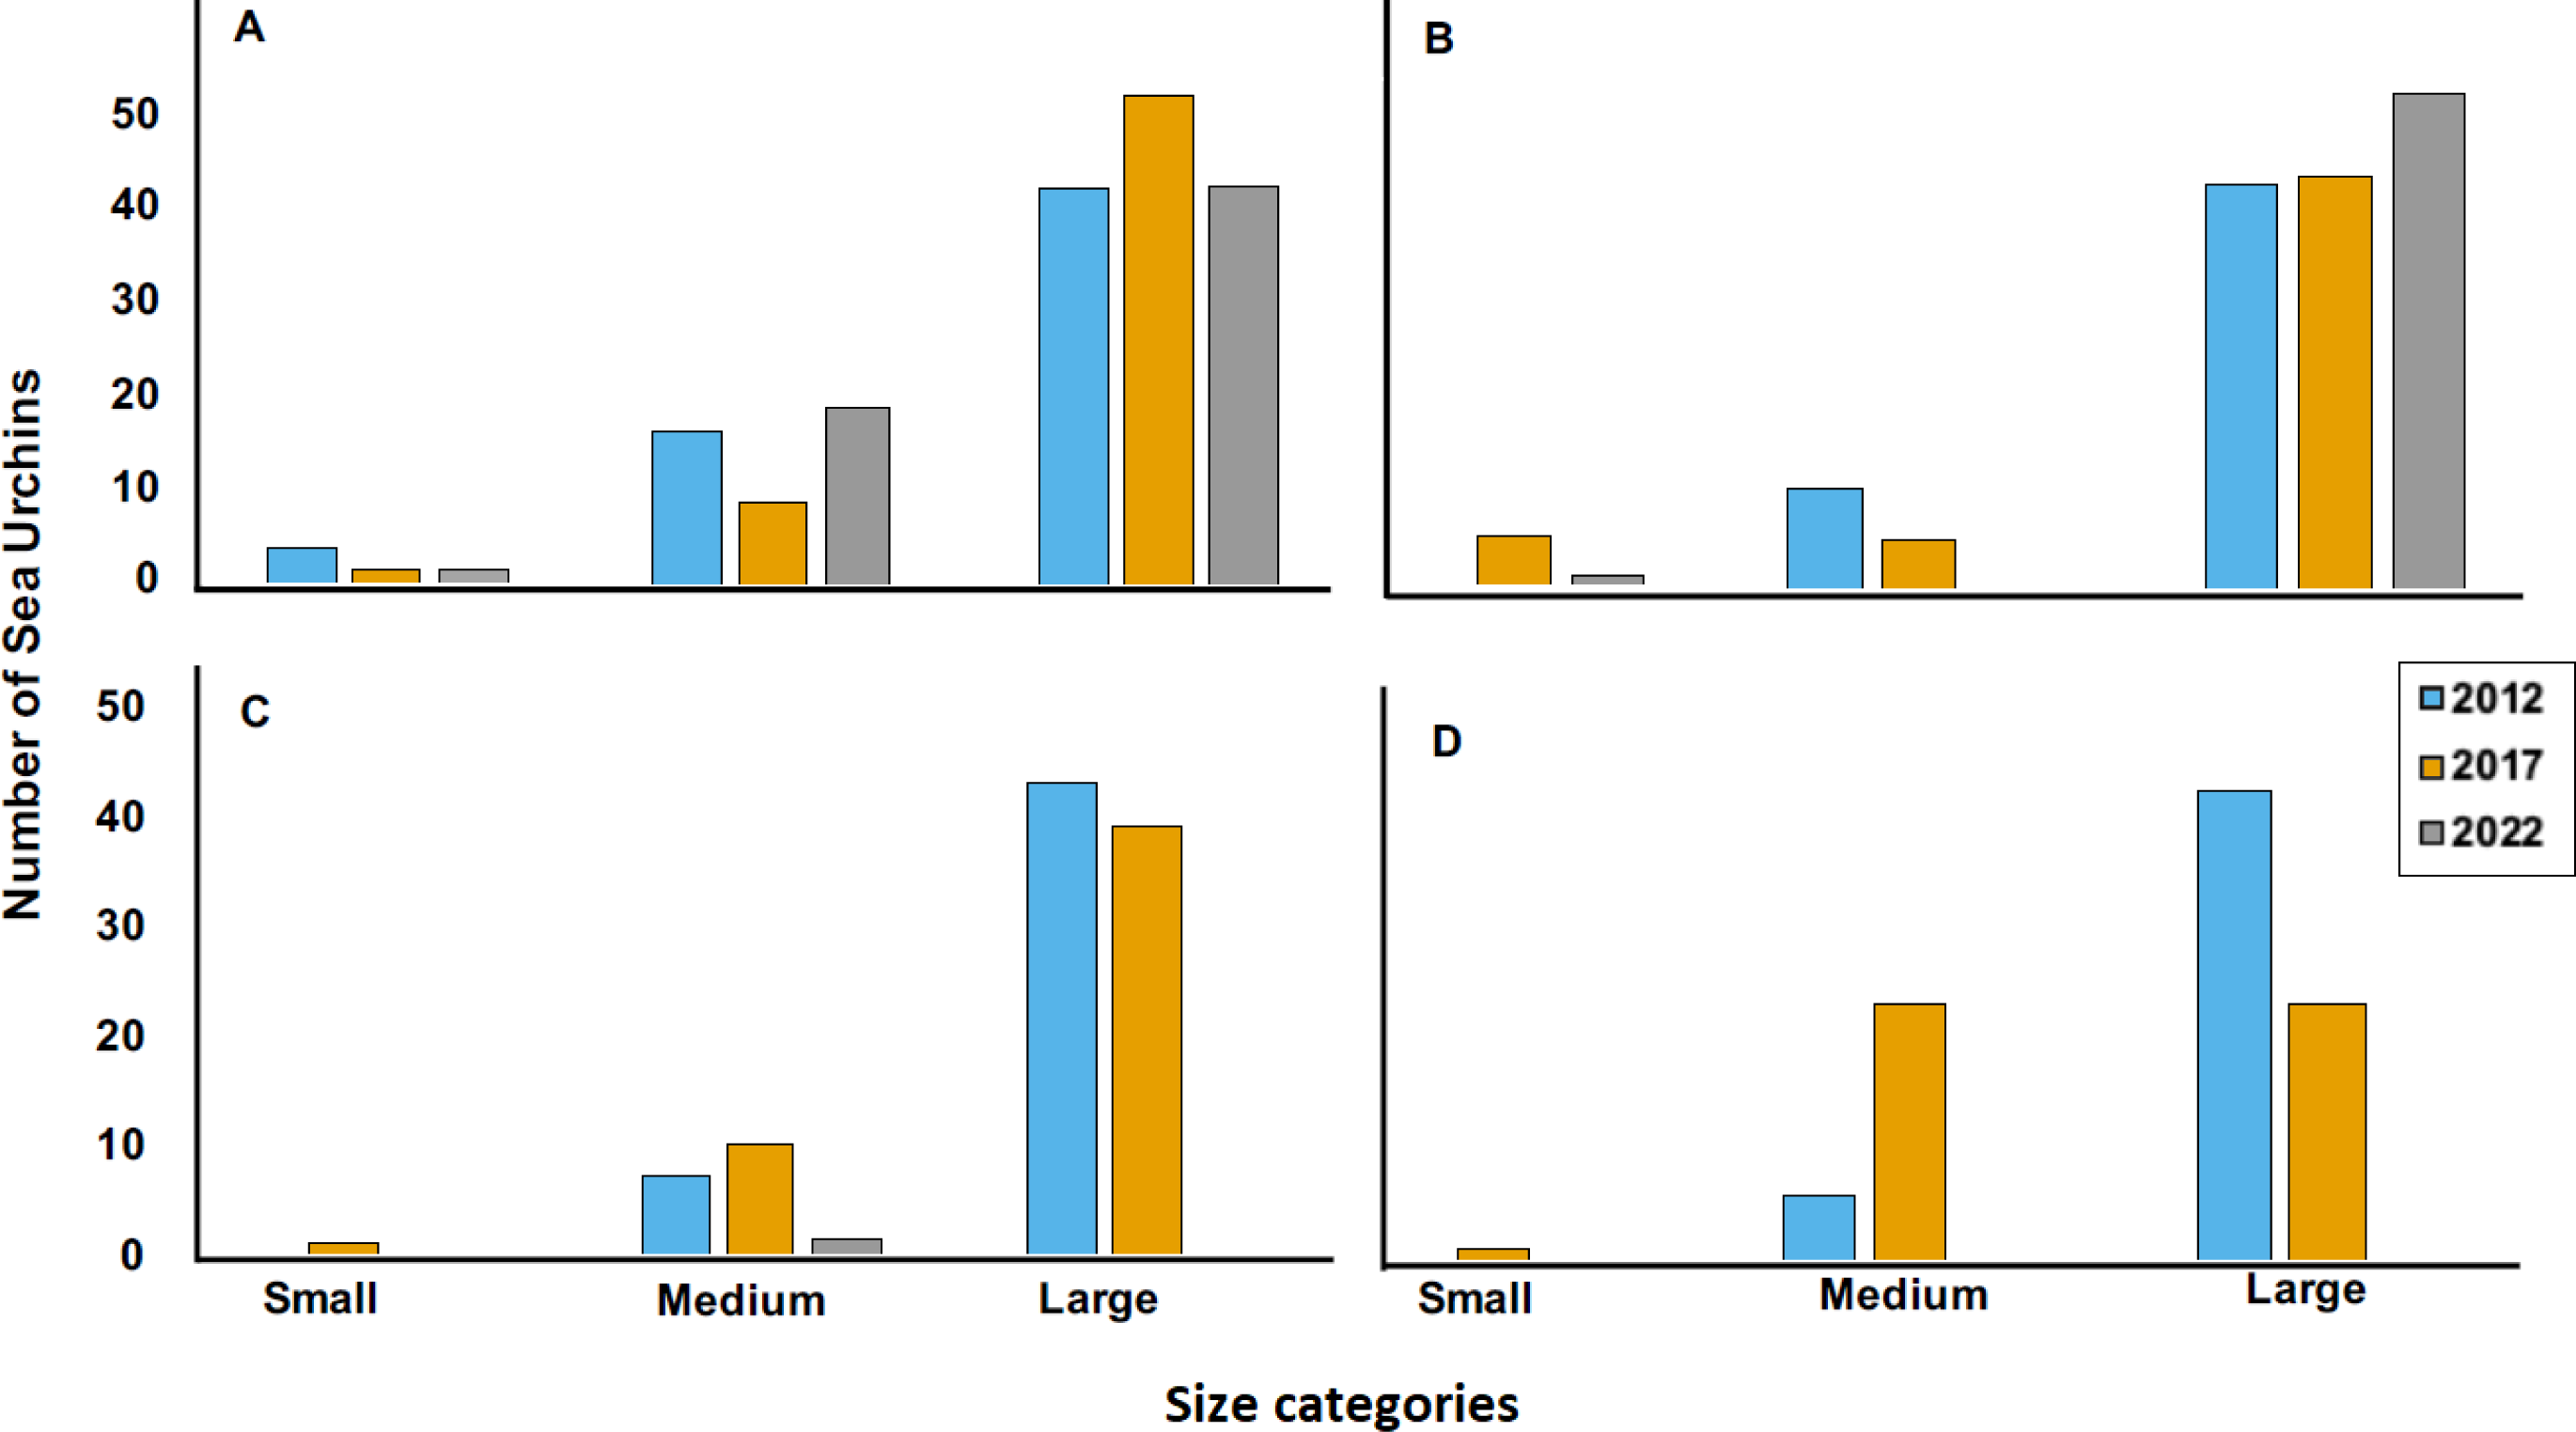
The 2022 test size distribution was dominated by individuals from the large size class (individuals with tests >6.01 cm) in most reefs (Fig. 4). For instance, at PBA, 98% of the encountered individuals belong to the adult size class and only 2% to the small size class. At SBE, the large size class comprised 80% of the population, while the medium and small size classes represented 18% and 2%, respectively. Meanwhile, at CGO, PSA, and ESC, the large size class comprised between 70 to 76% of the population. Medium size class at ESC comprised 30%, while at PSA and CGO, the medium size class comprised 22 and 28%. The small size class individuals at CGO and PSA comprised around 2%. A similar demographic pattern was observed in the populations surveyed in 2012 (Fig. 5). For instance, the individuals from larger size class comprised between 80–88% of D. antillarum populations at PBA, CGO, PME, and PTA, whereas the medium size class (4.0 <x ≤ 6.01 cm) comprised between 12 to 20%. No small individuals (≤ 4.0 cm) were observed in 2012 at the surveyed sites, except in CGO (Fig. 5). However, by 2017 we observed a decrease in the larger individuals, i.e., 86 to 50%, coupled with an increase in the medium size class, 10 to 50%, and the smaller size class, e.g., 2 to 8%. The statistical analysis showed differences by reefs, with CGO showing statistical differences with PME and PTA. In addition, the analysis revealed significant differences by year, with 2012 being statistically different from 2022, and by size class categories, with the frequency of large individuals being different from medium and small individuals (Table 2).
| Sites | CGO | PBA | DBE | PBL | SBE | ESC |
|---|---|---|---|---|---|---|
| CGO | 0.000 | 0.054 | 0.050 | 0.001 | 0.110 | |
| PBA | 0.083 | 0.000 | 0.714 | 0.243 | ||
| PSA | 0.000 | 0.171 | 0.885 | |||
| PBL | 0.000 | 0.002 | ||||
| SBE | 0.373 | |||||
| ESC |
Disease prevalence
Of the total of 665 sea urchins counted from May to July of 2022, only 4.3% were diseased. Diseased sea urchins were exclusively observed in DBE, PME, PTA, and ESC, but disease prevalence varied among sites. For instance, disease prevalence at DBE and ESC was 11.02% and 41.17%, respectively. Meanwhile, the observed individuals at the Culebra sites were either diseased, as in the case of PME where two out of the three observed individuals were diseased, or, as in the case of PTA, there were no live individuals. In addition, among the diseased sea urchins, 92.6% of them belonged to the large size class, while the remaining 7% were accounted for medium size class. No small diseased individuals were observed during the surveys at any of the sites (Fig. 6).
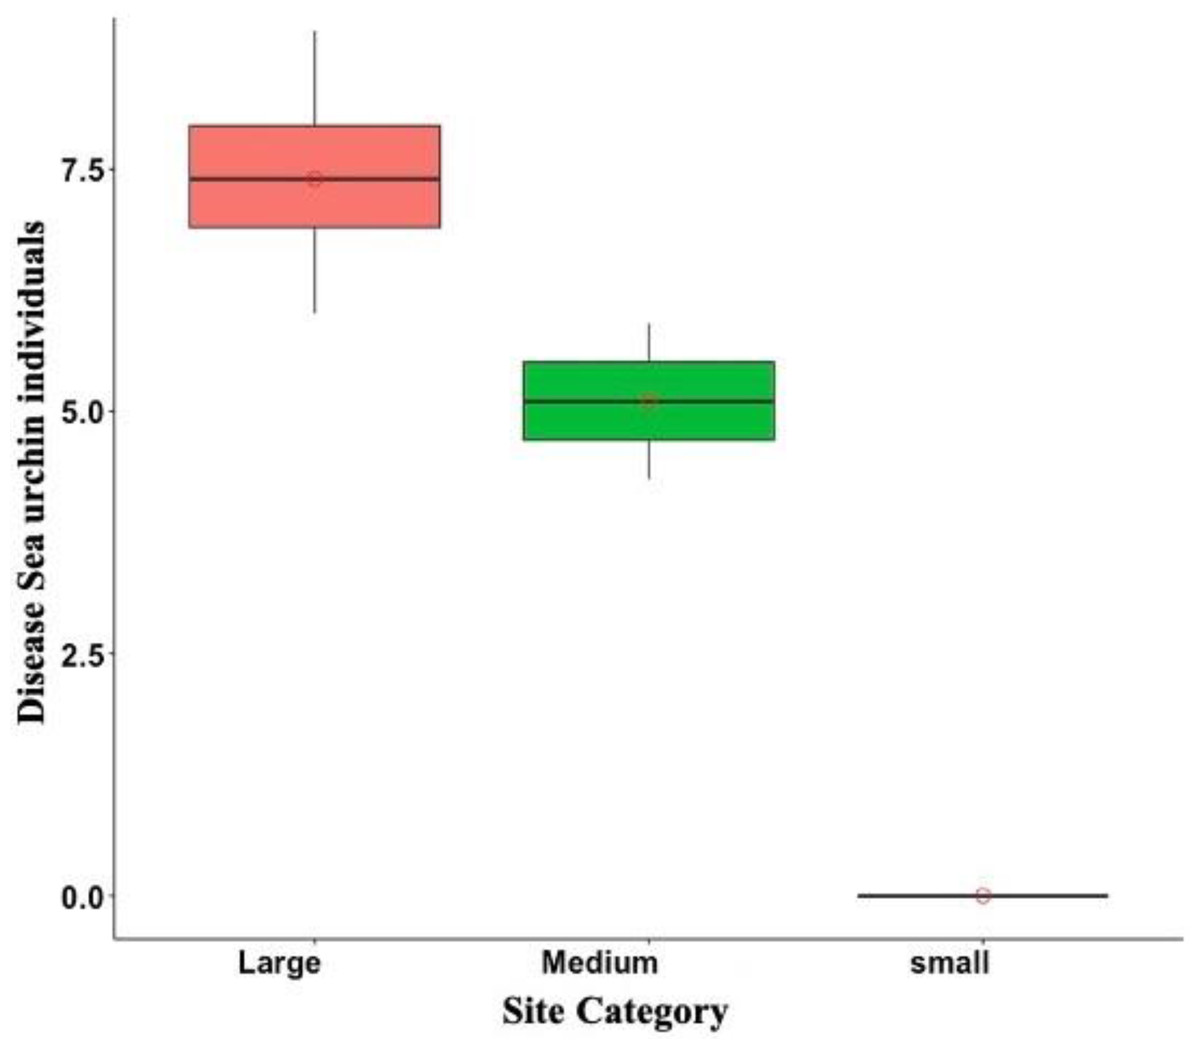
Figure 6: Overall disease sea urchin size class distribution in Puerto Rico for the eight surveyed sites in 2022.
Notice that no small diseased individuals were observed. In the boxplot, the red circle represents the mean, the median is presented by the bold line, the extreme of the boxplot are the 1st and 3rd quartiles, and the whiskers are the maximum and minimum.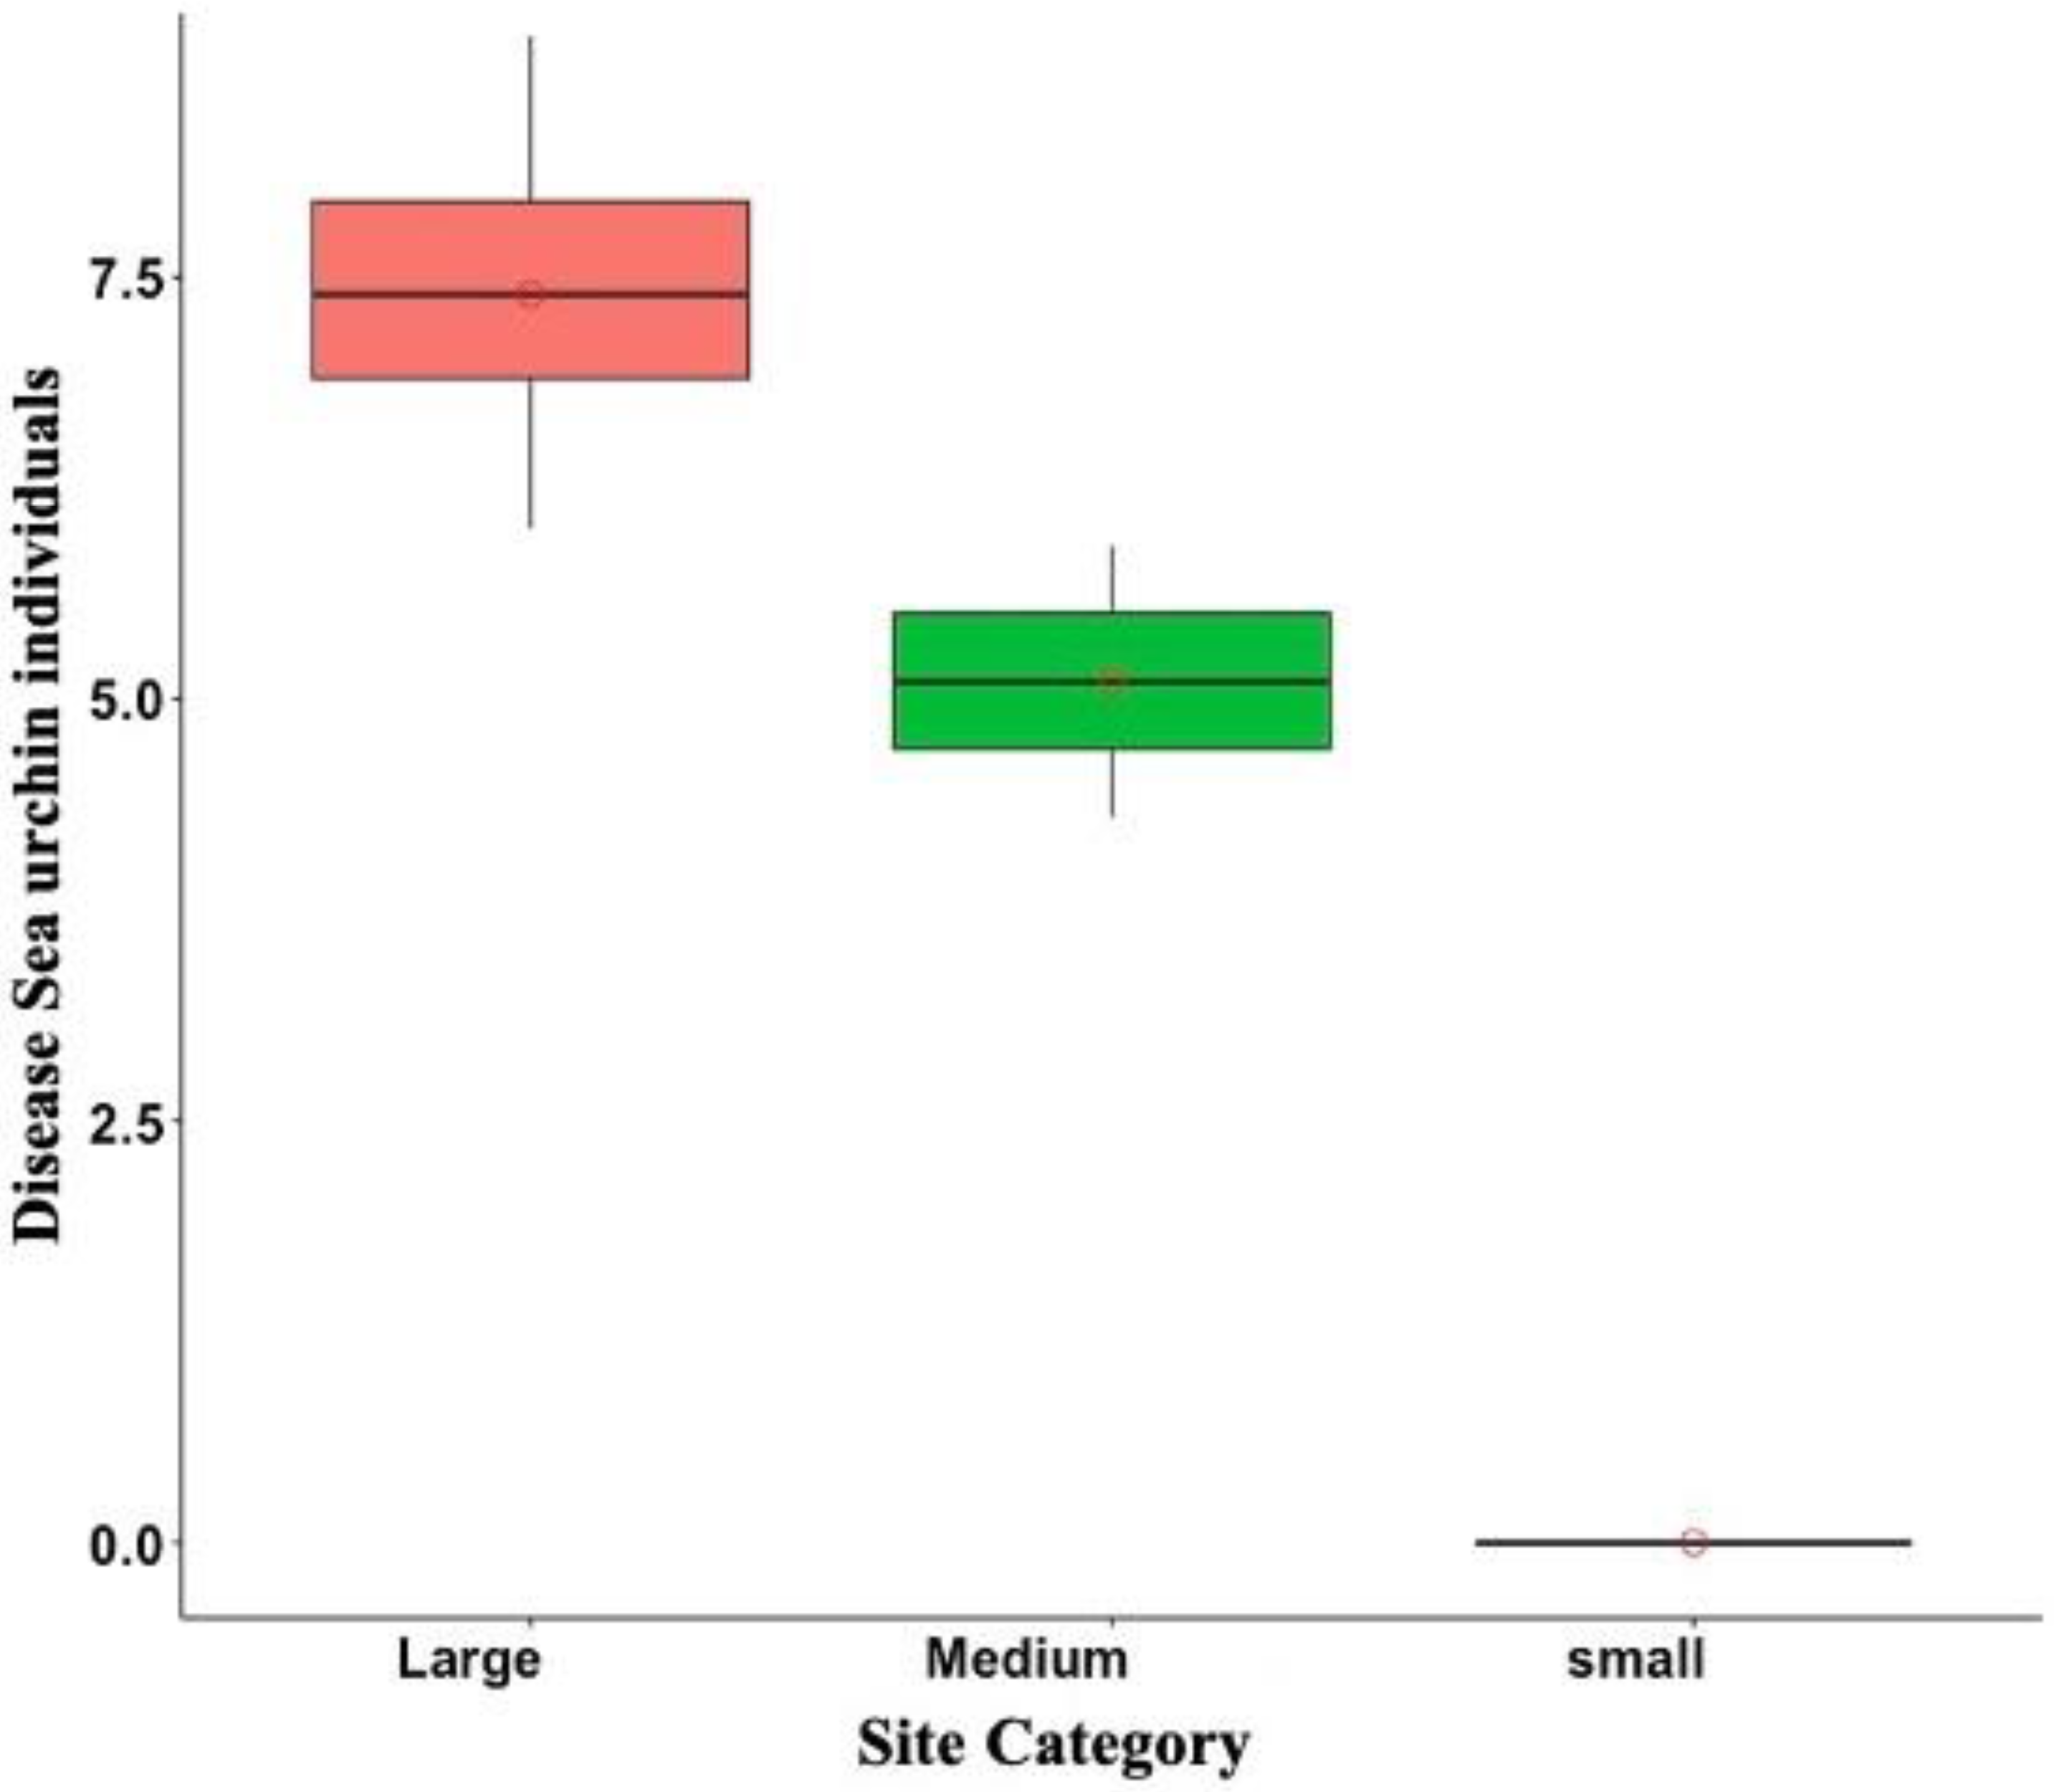
Discussion
D. antillarum density
This study, conducted during the midst of the disease outbreak caused by Scutico ciliatosis (Hewson et al., 2023), focuses on assessing the current density and size distribution of D. antillarum in eight reefs located along the eastern, northeastern, northern, and northwestern coasts of Puerto Rico. Furthermore, to determine the impact of this die-off, the study compares the demographic parameters observed in 2022 with historical data. Our results indicate that the disease impact on D. antillarum populations was heterogeneous across all surveyed sites, with variations observed among different locations. However, all the observed diseased sea urchins exhibited external signs of illness similar to those described in the literature by Hylkema et al. (2023). Furthermore, the concurrent timing of our observations with those reported in other Caribbean jurisdictions strongly suggests that we were indeed dealing with the same disease.
Our data reveals significant variability in the estimated densities of D. antillarum across the surveyed reefs, with notable differences observed among sites. Of particular concern is the considerable decrease in density in 2022 compared to historical data for the Culebra sites. This reduction is significant considering that these sites had the highest densities on the eastern coast of Puerto Rico in the early 2000s (Ruiz-Ramos, Hernández-Delgado & Schizas, 2011). For instance, these authors reported mean densities of 1.59 ± 0.50 ind m−2 at PTA, whereas no living individuals were detected in 2022. We also documented similar density at PME, where density dropped from 1.04 ± 0.90 ind m−2 in 2017 to no healthy sea urchins detected in 2022. Other sites have experienced similar D. antillarum reductions. For instance, Rodríguez-Barreras et al. (2014) reported densities of 1.10 ind m−2 at ESC, yet our 2022 survey revealed a density drop to 0.1 ind m−2, with nearly half of the individuals being affected by the disease. Given the current disease prevalence observed at ESC, it is anticipated that the outbreak will have a more significant impact if the diseased individuals do not recover, and the disease continues to spread. The other sites exhibited less severe outbreak impact. For instance, PSA and PBL exhibited similar densities, but PSA displayed a disease prevalence of over 10%, while no diseased individuals were detected in PBL. Therefore, the density at PSA would likely have been higher than that of PBL if it had not been affected by the outbreak event.
Densities at PBA and CGO have also experienced decreases even though evidence of disease was not found. For instance, a study conducted in 2017 by (Rodríguez-Barreras et al., 2018) estimated the density at PBA at 1.26 ind m−2, while the estimated current density decreased to 1.05 ind m−2. A similar declining trend was observed in CGO, where densities decreased from 1.55 ind m−2 in 2017 to 1.09 ind m−2 in 2022. respectively. In subsequent visits to these sites in February, May, and August 2023, we found no evidence of the disease, further suggesting that the disease may not be the primary cause of these declines (unpublished data). Instead, habitat degradation may have influenced the observed declines as multiple coral heads, including the dominant species in this area e.g., Pseudodiploria spp., were either recently dead or exhibited signs of Stony Coral Tissue Loss Disease (Dahlgren et al., 2021). Alternatively, the absence of diseased or dead sea urchins among the studied reefs may result in some populations being more resistant to the disease than others. It is also noteworthy to mention that from 2017 to 2022, three hurricanes onslaught Puerto Rico. These hurricanes caused significant damage to the reefs and seagrass beds, which, when combined with natural low recruitment, may have resulted in the observed low density in 2022 when compared to the 2017 densities (Miller et al., 2009; Rodríguez-Barreras et al., 2015a; Rodríguez-Barreras et al., 2015b; Pilnick et al., 2021).
Size distribution
The current size distribution of D. antillarum in the surveyed reefs was dominated by the large-size class individuals, with fewer medium-sized class individuals and even fewer small-size class individuals. The absence of juveniles may have multiple explanations. For instance, lower frequencies of small-size individuals may suggest a generally low recruitment given the relatively low abundance of mature and, therefore, larger D. antillarum individuals when compared to 80s pre-mortality events. In fact, most authors argued this as the main reason for the slow recovery after the massive mortality (Lessios, 1988; Miller et al., 2003; Rodríguez-Barreras et al., 2018). It could also suggest a high mortality among the recently settled and juvenile sea urchins due to predation, as several studies have argued that D. antillarum predation by reef-fishes may have a profound effect on the sea urchin size structure (Harborne et al., 2009; Rodríguez-Barreras et al., 2015a). Nonetheless, it is difficult to conclude that the reason for the low observations of juveniles and sub-adults was related to being more susceptible to the disease than mature individuals. Therefore, longitudinal studies, which include a collection of D. antillarum in the larval pool and recruit monitoring across several reefs, are required to better comprehend the demographic dynamics of D. antillarum under the current outbreak scenario.
Outbreak impact
Overall, the prevalence of the new outbreak was still relatively low in the surveyed reefs, as only 4.3% of the 665 counted sea urchins were diseased (Fig. 6). It also shows an erratic geographic distribution, with some reefs showing high prevalence and others with moderately to low prevalence and hence presumably low impact. A recent study conducted in the Dominican Republic also reported variable impact across different reefs, although the outbreak in the Dominican Republic seems to have had a higher impact than in Puerto Rico (Villalpando et al., 2022). Nonetheless, the outbreak in Puerto Rico just started, as judged by the lack of conclusive evidence of disease in some of the surveyed reefs. Therefore, it is still premature to capture the real magnitude of the impact, and if the ongoing outbreak is as destructive as the 80s mortality event when populations were decimated throughout the western Atlantic, including the Bermudas, in a relatively short period of time (Mumby et al., 2006; Bove, Mudge & Bruno, 2022). Instead, the spatial-heterogeneous nature of this new outbreak and the variable mortality of individuals resemble the mortality event occurring in the sibling urchin species D. africanum, from October 2009 to April 2010 in the subtropical eastern Atlantic (Clemente et al., 2014). Nonetheless, long-term monitoring programs at these reefs may help disclose size class patterns of disease susceptibility.
Conclusion
Populations of D. antillarum at surveyed reefs have not fully recovered since the mass mortality event in the 1980s (Mercado-Molina et al., 2015; Rodríguez-Barreras et al., 2018) and are now facing a second outbreak that is causing further damage. This study sheds light on the current state of D. antillarum populations in Puerto Rico’s reefs amid the Scutico ciliatosis outbreak, revealing different degrees of impact across different locations, with some reefs experiencing a drastic decline in sea urchin density, particularly concerning for sites like Culebra, which once boasted relative high densities. Nonetheless, the limited available data makes it difficult to determine which factors (abiotic and biotic) may favor the infection either by compromising the individual’s immune system or by favoring the proliferation of the biotic agent(s) or both. This 2022 outbreak’s complexity mirrors past events, emphasizing the importance of establishing long-term monitoring programs where key abiotic and biotic components known to cause stress to other coral reefs-associated organisms are regularly surveyed. This is especially critical in the face of climate change and changing marine conditions, which may weaken the immunity of marine organisms and increase the frequency and severity of disease outbreaks.
Supplemental Information
Comparison of sea urchin abundance between sites
Cerro Gordo (GGO) and El Escambrón (ESC), Punta Bandera (PBA), Playa Peña Blanca (PBL), Punta Melones (PME), Playa Sardinera (PSA), Punta Tamarindo (PTA), and Shacks Beach (SBE) over 2022 using a General Linear Model with Poison distribution, AIC= 655.75. The asterisks (*) indicate the level of significance.
Comparison of sea urchin abundance between Cerro Gordo (GGO) and Punta Bandera (PBA), Punta Melones (PME), and Punta Tamarindo (PTA) over the years 2012, 2017, and 2022 using a General Linear Model with Poison distribution, AIC=655.75
The asterisks indicate the level of significance. Note: no sea urchin was observed in 2022.
Raw data (abundance and test size diameter)
The number of sea urchins found at each transect and the test diameter of 50 individuals (when possible) for 8 sites in Puerto Rico.