
Soil microbial and enzyme activities in different land use systems of the Northwestern Himalayas
- Published
- Accepted
- Received
- Academic Editor
- Anis Shah
- Subject Areas
- Agricultural Science, Soil Science, Natural Resource Management, Food, Water and Energy Nexus, Forestry
- Keywords
- Arylsulphatase activity, Dehydrogenase activity, Ecosystem, Land use, Microbial population, Soil sustainability
- Copyright
- © 2023 Mir et al.
- Licence
- This is an open access article distributed under the terms of the Creative Commons Attribution License, which permits using, remixing, and building upon the work non-commercially, as long as it is properly attributed. For attribution, the original author(s), title, publication source (PeerJ) and either DOI or URL of the article must be cited.
- Cite this article
- 2023. Soil microbial and enzyme activities in different land use systems of the Northwestern Himalayas. PeerJ 11:e15993 https://doi.org/10.7717/peerj.15993
Abstract
Soil microbial activity (SMA) is vital concerning carbon cycling, and its functioning is recognized as the primary factor in modifying soil carbon storage potential. The composition of the microbial community (MC) is significant in sustaining environmental services because the structure and activity of MC also influence nutrient turnover, distribution, and the breakdown rate of soil organic matter. SMA is an essential predictor of soil quality alterations, and microbiome responsiveness is imperative in addressing the escalating sustainability concerns in the Himalayan ecosystem. This study was conducted to evaluate the response of soil microbial and enzyme activities to land conversions in the Northwestern Himalayas (NWH), India. Soil samples were collected from five land use systems (LUSs), including forest, pasture, apple, saffron, and paddy-oilseed, up to a depth of 90 cm. The results revealed a significant difference (p < 0.05) in terms of dehydrogenase (9.97–11.83 TPF µg g−1 day−1), acid phosphatase (22.40–48.43 µg P-NP g−1 h−1), alkaline phosphatase (43.50–61.35 µg P-NP g−1 h−1), arylsulphatase (36.33–48.12 µg P-NP g−1 h−1), fluorescein diacetate hydrolase (12.18–21.59 µg g−1 h−1), bacterial count (67.67–123.33 CFU × 106 g−1), fungal count (19.33–67.00 CFU × 105 g−1), and actinomycetes count (12.00–42.33 CFU × 104 g−1), with the highest and lowest levels in forest soils and paddy-oilseed soils, respectively. Soil enzyme activities and microbial counts followed a pattern: forest > pasture > apple > saffron > paddy-oilseed at all three depths. Paddy-oilseed soils exhibited up to 35% lower enzyme activities than forest soils, implying that land conversion facilitates the depletion of microbiome diversity from surface soils. Additionally, reductions of 49.80% and 62.91% were observed in enzyme activity and microbial counts, respectively, with soil depth (from 0–30 to 60–90 cm). Moreover, the relationship analysis (principal component analysis and correlation) revealed a high and significant (p = 0.05) association between soil microbial and enzyme activities and physicochemical attributes. These results suggest that land conversions need to be restricted to prevent microbiome depletion, reduce the deterioration of natural resources, and ensure the sustainability of soil health.
Introduction
Soil is typically considered the foundation of agricultural production and has increasingly been acknowledged as a key element for environmental sustainability, global climate change mitigation (Le Quere et al., 2018), ecological processes, and land use planning (Gossner et al., 2016). Therefore, sustainable land governance is fundamental for the longevity of life forms on earth, and it can only be accomplished by understanding the interactions between soil physical, chemical, and biological processes.
Land use, as an extensive reflection of anthropogenic interventions, is integrally associated with plant habitats, nutrient levels, and soil enzyme activities, causing modifications in soil microbial properties (Gong et al., 2022). Land conversion from natural ecosystems to cultivated lands is recognized as a major attribute of the global climate scenario, leading to habitat destruction, and unsustainability (Kooch, Tavakoli & Akbarinia, 2018). Deforestation, land conversions, and land management practices significantly alter the soil biochemical characteristics, microbial, and enzymatic patterns by changing the vegetation and soil structure (Guo et al., 2016), and carbon dynamics (Meena et al., 2018; Mir et al., 2023), thus harming soil ecosystem functioning. Both soil enzyme activities and microbial community diversity depend on land use patterns. Therefore, investigating soil physical, chemical, and biological characteristics under diverse land use patterns is vital to conserve and rejuvenate the soil’s ability to provide ecological services (van Leeuwen et al., 2017).
Soil microbes can account for up to 95% of total soil biomass and play a pivotal role in soil ecological processes (van Leeuwen et al., 2017). Soil metabolic processes regulated by microbial activity are susceptible to land use conversions, as evidenced by changes in litter composition, rooting depth, and turnover rates. The composition and biomass size of the microbial community govern the aptitude for enzyme production, and therefore, have a substantial influence on soil enzyme activity (Lopez-Aizpun et al., 2018). In addition, soil microbial activities, including bacteria, fungi, protozoa, actinomycetes, algae, and other microfauna, are significantly altered by anthropogenic disturbances such as land conversions (Kabiri, Raiesi & Ghazavi, 2016). Forest soils serve as a reservoir of microbiome diversity due to the presence of higher substrate and fewer perturbations, resulting in improved soil fertility compared to other land uses (Sofi et al., 2016). Multiple studies have revealed that microbial population declines with soil depth, which is due to a dearth of the substrate in deeper soil strata (Piotrowska-Długosz et al., 2022; Stone, DeForest & Plante, 2014).
Soil enzymes have high catalytic capacity and regulate several important reactions in soils, essential for microbial cycles, stabilization of soil structure, formation of soil organic matter (SOM), and nutrient cycling (Nivitha & Vimalan, 2022; Erdel, Şimşek & Kesimci, 2023). They are considered reliable indicators of biological and biochemical changes since they provide prompt and precise information on minor modifications in the soil environment (Li et al., 2019; Erdel, Şimşek & Kesimci, 2023). Therefore, the assessment of enzyme activities is a reliable indicator to determine the extent of soil deterioration caused by various environmental attributes (Rao et al., 2014). The extracellular soil enzyme activities fluctuate depending on the seasons, locations, and soil depth (Xiao et al., 2018). Furthermore, soil nutrients, microbes, vegetation patterns, and management practices all have varying degrees of impact on soil enzyme activities (Wu et al., 2020). Soil enzyme activity measurements in essential nutrient cycling (carbon, nitrogen, and phosphorus) and oxidation-reduction processes have been broadly employed as a capable indicator for detecting the influence of land transitions and management techniques on soil health (Pandey, Agrawal & Bohra, 2014). As a result, analyzing soil microbial properties and enzyme activity is essential in examining the impact of land conversions and prioritizing scientific soil management.
In the NWH, massive land conversion primarily due to an exploding population and infrastructural activities has been documented (Fayaz et al., 2020), becoming a major concern in the study region. The resulting consequences of deforestation and natural disturbances have led to the degradation of soil fertility in the region, negatively impacting the montane ecology and biological wealth of this fragile ecosystem. Therefore, an improved understanding of the response of soil microbial and enzymatic activities to land use conversions and their vertical dynamics is essential to evaluate ecosystem sustainability. However, very little information is available concerning the vertical dynamics of microbial and enzymatic activity under different land use systems in the Kashmir Himalayas. Therefore, we conducted a study to evaluate the impact of different land use systems and soil depth on soil microbial and enzyme activities in the Kashmir Himalayas and to identify the interrelationship among various soil properties and microbial and enzyme activities. The outcome of this research work is expected to be critical for formulating strategies to mitigate the detrimental repercussions caused by the depletion of microbiome diversity and to address the rising challenges of global unsustainability, thus serving the sustainable development goals in the long run.
Materials and Methods
Study area
Kashmir is a bowl-shaped valley, with an elevation range of 1,587–2,640 m above mean sea level, located to the north of India between 33°20′ and 34°41′N latitude and 73°55′ and 75°37′E longitude. It is surrounded by the Greater Himalaya and the Pir-Panjal Ranges in the northeast and southwest, respectively. The average temperature of the region ranges from −10 °C to 35 °C (Zaz et al., 2019), with an average annual precipitation of ~710 mm (Dar et al., 2015). The study area has different soil groups, including hapludalfs, hapludolls, ochraualfs, eustrochrepts, croboralfs, argiudolls, ustifluvents, and udifluvents, fluviatile, and lacustrine (Farooq, 2016). The prevailing land use systems in the region are forest, pasture, agriculture, horticulture, etc., with the higher reaches dominated by forest lands containing broad-leaved and coniferous vegetation, including Pinus excels, Populus sp., Ulmus spp., Cedrus deodara, etc. (Dar & Zeeden, 2020), mostly with adjacent pastures. Conversely, saffron fields dominate Karewa soils, whereas apple plantations have emerged as the prominent land use on both Karewas and non-Karewa soils, both having economic significance in the region. The low-lying terrains of the Kashmir Himalayas are occupied by paddy fields, which are the primary food source for the community. Forest soils were regarded as naturally less disturbed ecosystems, and moderately grazed pastures were taken as two reference soils. Among the cultivated lands, three differently managed soils (apple, saffron, and paddy-oilseed) were chosen based on their economic significance and social relevance. Therefore, these dominant land uses of the study region were chosen to examine the influence of the differently managed ecosystems on soil microbial diversity.
Soil sample collection and processing
The soil samples were collected from five selected land use systems: forest, pasture, apple, saffron, and paddy-oilseed, prevailing in the study area (Table 1). A total of 15 sites were selected (i.e., three locations × five land uses). Three samples were collected from each location up to a depth of 1 m at three intervals (0–30, 30–60, and 60–90 cm). Each sample was a composite of four sub-samples randomly collected and pooled from each location, resulting in a total of 45 composite samples. The collected samples were bagged, tagged, and subjected to laboratory processing, where a portion of the samples was stored at 4 °C for the determination of soil enzyme activities. On the other hand, another portion of samples was air-dried, ground, and sieved through a 2 mm sieve before determining other soil properties.
| Study sites | Location | Elevation (amsl) |
|
|---|---|---|---|
| Forest | |||
| Binner | 34°13′38.3″N | 074°20′34.4″E | 1,772 |
| Yousmarg | 33°50′04.9″N | 074°39′29.1″E | 2,405 |
| BohriHalan | 33°40′58.5″N | 074°46′10.5″E | 2,295 |
| Pasture | |||
| Kulangam | 34°24′11.9″N | 074°19′38.9″E | 1,640 |
| Yousmarg | 33°49′05.3″N | 074°40′42.6″E | 2,332 |
| Dubjan | 33°40′25.9″N | 074°39′54.4″E | 2,639 |
| Apple | |||
| Chogal | 34°20′46.9″N | 074°24′09.1″E | 1,587 |
| C.I.T.H | 33°59′07.0″N | 074°48′01.0″E | 1,643 |
| Pahnoo | 33°44′57.6″N | 074°51′23.3″E | 1,948 |
| Saffron | |||
| Sambora | 33°59′15.0″N | 074°56′05.5″E | 1,622 |
| Chandhara | 33°58′37.6″N | 074°57′16.3″E | 1,631 |
| Lethpora | 33°58′11.0″N | 074°56′55.6″E | 1,633 |
| Paddy-oilseed | |||
| Kralpora | 33°59′11.5″N | 074°48′30.3″E | 1,600 |
| Khudwani | 33°43′15.6″N | 075°05′48.5″E | 1,603 |
| Litter | 33°48′46.3″N | 075°00′48.4″E | 1,670 |
Note:
amsl, above mean sea level.
Soil physico-chemical properties
Bulk density (BD) was determined by the core method as outlined by Blake & Hartge (1986). The soil reaction (pH) was assessed in a 2.5:1 soil: water suspension with a glass electrode pH meter (pH 700; S/N 3011147; EUTECH, Singapore) as described by Jackson (1973). Organic carbon (OC) was estimated by the wet oxidation method (chromic acid) as described by Walkley & Black (1934). Available nitrogen (N) was determined by the Kjeldahl (KELPLUS DISTYL—BS; S/N 16216; Pelican Equipments, Chennai, Tamilnadu, India) method as previously described by Subbiah & Asija (1956).
Soil microbial count and enzyme activity
Dehydrogenase activity (DHA) was determined by adding a 3% aqueous solution of 2,3,5-triphenyl tetrazolium chloride (TTC) to the soil, followed by incubation at 37 °C for 24 h. The triphenyl formazan (TPF) was then quantitatively extracted by methanol and measured colorimetrically at 485 nm using a spectrophotometer (Klein, Loh & Goulding, 1971). The phosphatase activities (acid and alkaline) were assessed by using p-nitrophenyl phosphate as a substrate (pH 6.5 and 11, respectively), followed by incubation at 37 °C for 1 h. After incubation, the liberated p-nitrophenyl was extracted using 0.5M CaCl2 and 0.5M NaOH (Tabatabai & Bremmer, 1969). The activity of arylsulphatase (Aryl) was evaluated by incubating the soil with a substrate containing p-nitrophenyl sulfate solution and quantified using a spectrophotometer (SHIMADZU, UV-1900, SMA; S/N A12425680513 ML; Designed by Shimadzu, Kyoto, Japan and assembled by Shimadzu Manufacturing Asia Malaysia) following the protocols described by Tabatabai & Bremner (1970). Fluorescein diacetate hydrolase (FDA) was determined using sodium phosphate buffer (pH 7.6) and FDA substrate solution, followed by shaking, centrifugation, and quantification at 490 nm as per the method given by Green, Stott & Diack (2006). The viable bacterial, fungal, and actinomycete counts were evaluated using the pour plate technique following the method given by Aneja (2001).
Statistical analysis
Descriptive statistical analysis was performed using SPSS (version 21.0). The standard error of the mean was calculated for each parameter and at all depths. Analysis of variance (ANOVA) was performed to examine the impact of land uses (LUs) and soil depth (SD) on soil microbial and enzyme activity using R studio (version 4.2.1). A coefficient of correlation was calculated between physicochemical characteristics, soil microbial counts, and enzyme activities using R studio (version 4.2.1). Data from soil observations of the studied land uses were subjected to principal component analysis (PCA).
Results and discussion
Physicochemical properties
The bulk density (BD) ranged from 1.10 to 1.29, 1.19 to 1.27, 1.22 to 1.28, 1.29 to 1.34, and 1.37 to 1.39 Mg m−3 in the surface soil of the forest, pasture, apple, saffron, and paddy-oilseed, respectively (Table 2). The mean BD was highest in paddy-oilseed soil (1.37 Mgm−3), followed by saffron (1.32 Mgm−3), apple (1.25 Mgm−3), pasture (1.23 Mgm−3), and forest soils had the lowest BD (1.18 Mgm−3). The BD among the studied land uses varied due to the different levels of organic matter (OM) among the LUSs, with the highest levels in forests and the lowest in cultivated soils (Akhtaruzzaman, Osman & Sirajul Haque, 2015). Organic matter serves as a binding agent, facilitating the synthesis of stable aggregates, which in turn creates pores and lowers the overall soil density. In cultivated soils, the rapid breakdown of organic matter owing to tillage operations and crop residue clearance deprives the soil of SOM and inhibits the development of aggregates, thus weakening soil structure and resulting in increased BD. The trend was similar for 30–60 and 60–90 cm depths, with the highest values being recorded in lower depths (Table 2). This increase in BD in lower depths might be attributed to an increased clay percentage along the SD, reduced porosity, the weight of overlying soil layers, and use of heavy mechanization in cultivated soils (Chemeda, Kibret & Fite, 2017; Stöcker et al., 2020; Wang et al., 2022), thus leading to the compaction by mechanically pressing the soil particles closer, reducing pore spaces and increasing the BD in lower soil strata.
| BD (Mgm−3) | pH | OC (gkg−1) | N (kgha−1) | |||||||||
|---|---|---|---|---|---|---|---|---|---|---|---|---|
| Land use | Min | Max | Mean ± SE | Min | Max | Mean ± SE | Min | Max | Mean ± SE | Min | Max | Mean ± SE |
| 0–30 cm | ||||||||||||
| Forest | 1.10 | 1.29 | 1.18 ± 0.09f | 5.90 | 6.30 | 6.13 ± 0.20c | 21.80 | 22.20 | 22.00 ± 0.20a | 403.24 | 439.04 | 417.52 ± 18.96a |
| Pasture | 1.19 | 1.27 | 1.23 ± 0.04ef | 6.30 | 6.50 | 6.40 ± 0.10c | 16.12 | 17.90 | 16.90 ± 0.90bc | 370.56 | 407.68 | 389.43 ± 18.56a |
| Apple | 1.22 | 1.28 | 1.25 ± 0.03def | 6.30 | 6.60 | 6.43 ± 0.15c | 16.76 | 16.98 | 16.86 ± 0.11bcd | 320.30 | 386.50 | 360.33 ± 35.21ab |
| Saffron | 1.29 | 1.34 | 1.32 ± 0.02bcde | 7.05 | 7.14 | 7.08 ± 0.04ab | 12.30 | 12.50 | 12.36 ± 0.11fgh | 297.05 | 345.60 | 317.27 ± 25.27bc |
| Paddy-oilseed | 1.37 | 1.39 | 1.37 ± 0.01bcd | 7.10 | 7.20 | 7.16 ± 0.05a | 11.30 | 12.10 | 11.70 ± 0.40gh | 260.32 | 296.82 | 279.26 ± 18.28cde |
| 30–60 cm | ||||||||||||
| Forest | 1.17 | 1.31 | 1.25 ± 0.07def | 6.20 | 6.50 | 6.36 ± 0.15c | 17.90 | 19.70 | 18.86 ± 0.90b | 301.22 | 330.08 | 313.85 ± 14.76bc |
| Pasture | 1.25 | 1.32 | 1.28 ± 0.03def | 6.40 | 6.60 | 6.50 ± 0.10bc | 14.10 | 15.60 | 14.73 ± 0.77de | 292.40 | 313.60 | 305.50 ± 11.45bc |
| Apple | 1.27 | 1.31 | 1.29 ± 0.02def | 6.50 | 6.60 | 6.56 ± 0.05bc | 12.90 | 15.70 | 13.96 ± 1.51ef | 272.26 | 306.40 | 292.19 ± 17.77cd |
| Saffron | 1.34 | 1.39 | 1.36 ± 0.02bcd | 7.10 | 7.40 | 7.23 ± 0.15a | 11.10 | 12.10 | 11.50 ± 0.52gh | 246.76 | 289.94 | 268.41 ± 21.59cde |
| Paddy-oilseed | 1.40 | 1.45 | 1.42 ± 0.02abc | 6.90 | 7.60 | 7.30 ± 0.36a | 11.30 | 12.10 | 11.46 ± 0.56gh | 226.88 | 244.25 | 237.04 ± 9.05def |
| 60–90 cm | ||||||||||||
| Forest | 1.26 | 1.35 | 1.31 ± 0.04cde | 7.10 | 7.50 | 7.33 ± 0.20a | 15.40 | 17.10 | 16.36 ± 0.87cd | 205.44 | 270.02 | 235.44 ± 32.53def |
| Pasture | 1.31 | 1.39 | 1.34 ± 0.04bcde | 7.30 | 7.50 | 7.40 ± 0.10a | 12.70 | 14.40 | 13.33 ± 0.92efg | 216.54 | 235.56 | 225.54 ± 9.55ef |
| Apple | 1.33 | 1.37 | 1.34 ± 0.02bcde | 7.30 | 7.60 | 7.43 ± 0.15a | 11.50 | 12.10 | 11.73 ± 0.32gh | 201.30 | 214.15 | 207.40 ± 6.44fg |
| Saffron | 1.42 | 1.47 | 1.44 ± 0.02ab | 7.30 | 7.60 | 7.46 ± 0.15a | 10.30 | 11.50 | 10.80 ± 0.62h | 186.48 | 204.64 | 197.24 ± 9.53fg |
| Paddy-oilseed | 1.48 | 1.53 | 1.51 ± 0.02a | 7.00 | 7.90 | 7.50 ± 0.45a | 9.90 | 10.70 | 10.36 ± 0.41h | 158.80 | 179.30 | 167.67 ± 10.52g |
Note:
SE, standard error of mean; BD, bulk density; OC, organic carbon; N, available nitrogen. Mean values exhibiting different letters differ significantly at p < 0.05.
The soil pH was slightly acidic to slightly alkaline across the studied LUSs. The pH values varied from 5.90 to 6.30, 6.30 to 6.50, 6.30 to 6.60, 7.05 to 7.14, and 7.10 to 7.20 for forest, pasture, apple, saffron, and paddy-oilseed, respectively (Table 2). Forest soil exhibited the lowest pH, which could be attributed to several factors, including the acidic nature of the annual litter added by coniferous vegetation, the accumulation of SOM in forest soils, and the production of acids upon decomposition (Nanganoa et al., 2019). Over time, mineral breakdown can also contribute to increased acidity and a decrease in soil pH. Additionally, prolonged precipitation can leach the soil, elevating the level of hydrogen (H+) ions and increase the soil acidity. Conversely, cultivated soils showed the highest pH values, which might be a result of increased SOM oxidation due to tillage practices. This process can lower the soil’s buffering capacity, rendering it more susceptible to pH fluctuations caused by external factors. Similar patterns were observed at depths of 30–60 and 60–90 cm, with the highest pH values recorded in the lower depths (Table 2). This phenomenon may be attributed to base leaching from the surface to the sub-surface layers (Maqbool, Rasool & Ramzan, 2017; Muche, Addis & Molla, 2015; Wang et al., 2022).
The OC content in the surface soil layer varied from 21.80 to 22.20, 16.12 to 17.90, 16.76 to 16.98, 12.30 to 12.50, and 11.30 to 12.10 g kg−1 of soil, for forest, pasture, apple, saffron, and paddy-oilseed, respectively (Table 2). Forest soils exhibited the highest mean OC content (22.00 g kg−1), followed by pasture, apple, saffron, and paddy-oilseed soils. This could be due to several factors; forests receive increased annual litter additions, which are broken down into simpler compounds by microorganisms. Moreover, the low temperature at high altitudes slows down the rate of decomposition, leading to the accumulation of SOM in forest soils (Raza & Ali, 2018; Mir et al., 2023). The presence of an elated microbiome also facilitates the formation of stable organic matter compounds. Conversely, long-term cultivation under submerged conditions causes the breakdown of soil aggregates and accelerates SOM oxidation in cultivated soils, resulting in a reduction of OC content (Mojiri, Aziz & Ramaji, 2012). In addition, the removal of crop residues and lower litter inputs further reduce the replenishment of SOM, leading to its decline in cultivated soils. A similar trend was observed for sub-surface soils, with lower OC content in the lower depths. Forest soils had 23.36%, 43.81%, and 46.81% higher OC content compared to apple, saffron, and paddy-oilseed soils, respectively. These findings are consistent with the reports of Mir et al. (2023) and Uwituze et al. (2022), who reported reduced OC levels under highly disturbed land use compared to least disturbed ones.
The available nitrogen (N) content varied from 403.24 to 439.04, 370.56 to 407.68, 320.30 to 386.50, 297.05 to 345.60, and 260.32 to 296.82 kg ha−1 in the surface soil of the forest, pasture, apple, saffron, and paddy-oilseed soils, respectively (Table 2). Forest soils exhibited higher N levels compared to cultivated soils, following this trend: forest > pasture > apple > saffron > paddy-oilseed. This pattern was consistent at both 30–60 and 60–90 cm depths, with available N decreasing along the soil depth, showing the lowest N content in the deeper soil layers. These findings are substantiated by higher organic matter, enhanced enzymatic activities, and high humus content in forest soils (Pal, Panwar & Bhardwaj, 2013). Additionally, there is a positive association of N with OC (Chauhan, Pande & Thakur, 2014; Mir et al., 2023). On the other hand, cultivated soils tend to have reduced OM content, leading to the reduced levels of available N (Maqbool, Rasool & Ramzan, 2017). These findings are in line with the reports of Uwituze et al. (2022), who found low OC levels under high tillage systems compared to undisturbed soils. Specifically, forest soil had 13.69%, 24.01%, and 33.10% higher available N levels compared to apple, saffron, and paddy-oilseed soils, respectively, implying the detrimental repercussions of land conversion on soil organic carbon and nutrient dynamics.
Soil enzymatic activities
DHA in the soil reflected a trend similar to OC. The mean DHA of the soils in the surface layer followed this pattern: forest > pasture > apple > saffron > paddy-oilseed, accounting for 11.83, 11.56, 11.41, 10.79, and 9.97 TPF µg g−1 day−1, respectively (Fig. 1). In sub-surface soils, forest soils had the highest DHA (6.22, 3.34 TPF µg g−1 day−1), while the least was found in paddy-oilseed soils (2.99, 1.55 TPF µg g−1 day−1). The DHA showed a decreasing trend along the soil depth, with the lowest values in the lower depths (Fig. 1), which aligns with the findings of Ansari et al. (2022). This can be explained by the higher enzyme-organic matter association in forest soils, which provides nutrients and energy for soil microbes, including those accountable for dehydrogenase activity. Forest ecosystems, with less disturbance and higher nutrient deposits, foster thriving microbial communities, leading to higher dehydrogenase activity (Sofi et al., 2016). On the hand, intensive management practices like tillage, reduced substrate return for microbes, rapid oxidation, reduced nutrient availability, and residue removal can disrupt soil structure and microbial communities (Sofi et al., 2016; Doyen et al., 2013). Our findings are consistent with the results of Meena & Rao (2021), who also reported a decline in enzymatic activity in agricultural lands compared to the least disturbed soils. Similarly, Szostek et al. (2022) published better dehydrogenase activity in organic farming compared to conventional tillage, which substantiates the present findings.
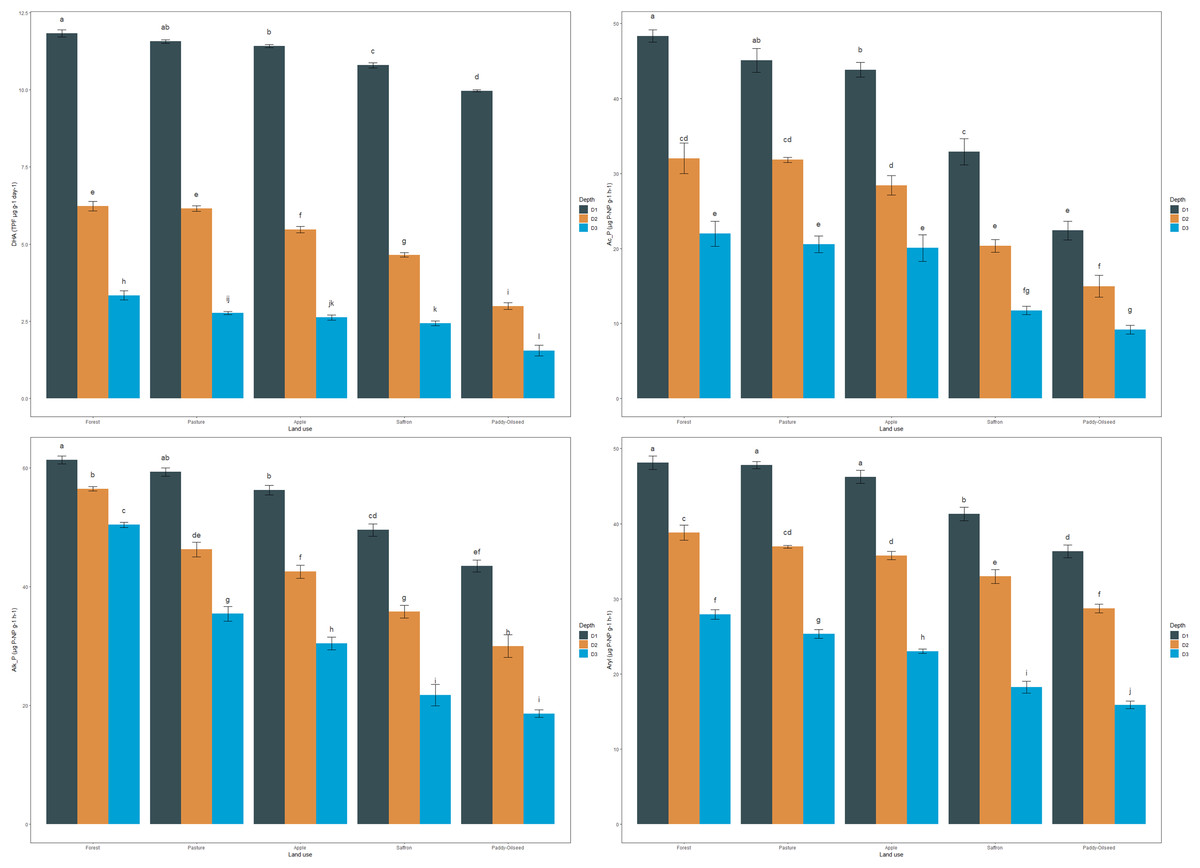
Figure 1: Effect of land use and soil depth on enzymatic activities.
Mean values exhibiting different letters differ significantly at p < 0.05.
The mean acid phosphatase activity (Ac_P) of soils in the surface layer was 48.43, 45.08, 43.82, 32.92, and 22.40 µg P-NP g−1 h−1, for forest, pasture, apple, saffron, and paddy-oilseed, respectively (Fig. 1). In sub-surface layers too, forest soil exhibited the highest activity compared to cultivated soils, with a similar trend observed at all depths. Acid phosphatase activity decreased along the soil depth, with the lowest activity observed in the lower soil depth (Fig. 1). Forest soils had 9.51%, 32.02%, and 53.74% higher acid phosphatase activity compared to apple, saffron, and paddy-oilseed soils, respectively. Soil acid phosphatase activity plays a vital role in the dissolution of organic phosphorus substances in the soil, making it available for plant utilization. The difference in acid phosphatase activity between forest and cultivated soils can be explained by substrate (SOM) variability, soil pH, and microbial diversity, which harbors phosphatase activity, thus enhances its performance. In contrast, cultivated soils are more sensitive to anthropogenic disturbances, such as tillage, fertilizer application, monoculture, and intensive management practices, leading to reduced phosphatase activity (Mijangos et al., 2006). These findings are further supported by the reports of Ansari et al. (2022), who also observed a decline in acid phosphatase activity along the soil depth.
The average alkaline phosphatase activity (Alk_P) in surface soils was 61.35, 59.31, 56.28, 49.55, and 43.50 µg P-NP g−1 h−1 for forest, pasture, apple, saffron, and paddy-oilseed soils, respectively (Fig. 1). In addition, a significant decline was observed along the soil depth, with the minimum activity in the lower depth (Fig. 1), which is in line with the reports of Ansari et al. (2022), who also reported a significant reduction in Alk_P. Forest soils had 8.26%, 19.23%, and 29.09% higher alkaline phosphatase activity compared to apple, saffron, and paddy-oilseed soils, respectively. Apple soil exhibited better acid and alkaline phosphatase activity compared to paddy-oilseed soils, which could be due to the inclusion of leaf litter and vegetation in apple orchards (Sofi et al., 2016). The activity of phosphatases was influenced by high nitrogen and P content and the presence of elevated soil microorganisms in forest soils, and vice versa in cultivated soils (Sofi et al., 2016; Singh et al., 2014). These enzymes are synthesized intracellularly by a range of microorganisms, notably bacteria and fungi, and subsequently dissipated into the soil through active extrusion or cell lysis. Additionally, alkaline phosphatase activity is altered by various environmental variables, such as soil pH, temperature, moisture content, and so on. In cultivated soils, various management approaches such as plowing and fertilization influences the activity of alkaline phosphatase. Our findings are further concordant with the reports of Gong et al. (2022) and Erdel, Şimşek & Kesimci (2023), who have also reported reduced levels of alkaline phosphatase activity in cultivated soils compared to undisturbed ecosystems.
The mean values of arylsulphatase activity in the surface layer followed a pattern of forest > pasture > apple > saffron > paddy-oilseed, amounting to 48.12, 47.79, 46.22, 41.28, and 36.33 µg P-NP g−1 h−1, respectively (Fig. 1). Arylsulphatase activity decreased along the soil depth, with the minimum activity in the deeper soil layer (Fig. 1). These findings are in agreement with the previous reports of Ansari et al. (2022), who also reported a significant decline in arylsulphatase activity in deeper soil layers. In the sub-surface layers, the pattern was similar, with forest soils exhibiting the highest activity compared to cultivated soils. Forest soils had 14.21% and 24.50% higher activity than saffron and paddy-oilseed soil, respectively. The highest activities of arylsulphatase are linked to the decomposition of organic matter (OM), including plant residues and litter, the presence of vegetation, and the abundance of microbial biomass in forest soil (Bowles et al., 2014). Soil pH fluctuations and sulfur immobilization rate also influence arylsulphatase activity. Sofi et al. (2016) demonstrated similar activities of arylsulphatase under different cropping sequences in the Himalayan region.
The mean values of FDA in the surface layer were 21.59, 19.05, 16.92, 14.77, and 12.18 µg g−1 h−1 for forest, pasture, apple, saffron, and paddy-oilseed soils, respectively (Fig. 2). Forest soils had the highest FDA values in sub-surfaces (30–60 and 60–90 cm), amounting to 17.82 and 14.96 µg g−1 h−1, and paddy-oilseed soils had the lowest FDA values with 8.345 and 5.77 µg g−1 h−1, respectively. FDA activity decreased along the soil depth, with the least activity in the lower depth (Fig. 2). This is in line with the findings of Piotrowska-Długosz et al. (2022). Paddy-oilseed soils had 43.58% lower FDA activity compared to forest soils, reflecting the detrimental impacts of land conversion on soil enzymatic activities. Higher FDA activity in forest soils corresponds to greater OC, microbial biomass, and overall enzymatic activities compared to cultivated soils. Forest ecosystems typically harbor diverse microbial communities, and FDA activity provides insights into the microbial processes associated with organic matter turnover and nutrient cycling. Its activity may vary due to the different organic inputs in managed ecosystems (Diack & Stott, 2001; Sofi et al., 2016). Therefore, lower FDA activity in cultivated soils can be ascribed to various factors, including agricultural practices that potentially affect microbial functioning and subsequently affecting FDA activity. Additionally, enzyme activity per gram of carbon was also assessed for each enzyme under different LUs (Table 3). The enzyme carbon ratios showed a declining pattern along the soil depth.
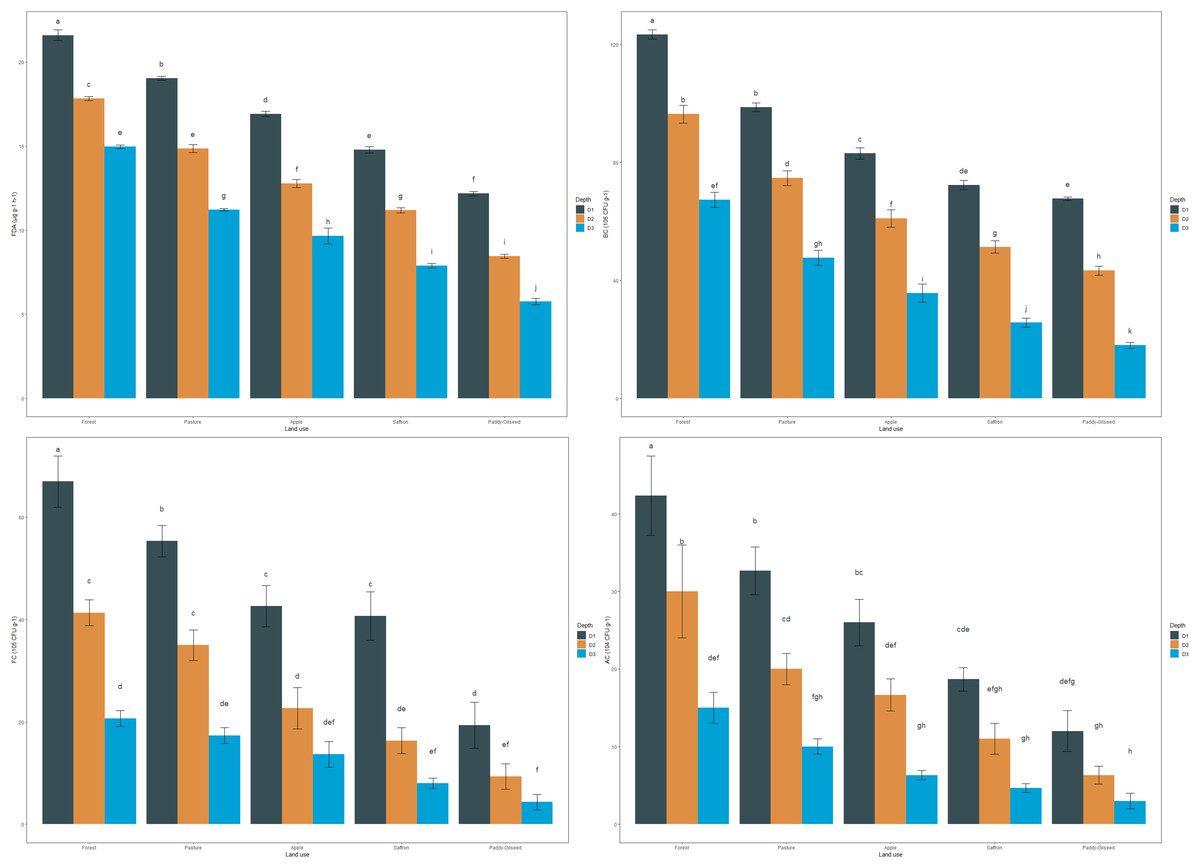
Figure 2: Effect of land use and soil depth on viable microbial counts.
Mean values exhibiting different letters differ significantly at p < 0.05.
| Depth (cm) | Land uses | DHA | Ac_P | Alk_P | Aryl | FDA |
|---|---|---|---|---|---|---|
| 0–30 | ||||||
| Forest | 2.60 | 10.63 | 13.50 | 10.59 | 4.75 | |
| Pasture | 1.96 | 7.62 | 10.03 | 8.08 | 3.22 | |
| Apple | 1.93 | 7.39 | 9.49 | 7.79 | 2.85 | |
| Saffron | 1.34 | 4.07 | 6.13 | 5.11 | 1.83 | |
| Paddy-oilseed | 1.17 | 2.62 | 5.09 | 4.25 | 1.43 | |
| 30–60 | ||||||
| Forest | 1.17 | 6.04 | 10.66 | 7.32 | 3.36 | |
| Pasture | 0.91 | 4.69 | 6.82 | 5.44 | 2.19 | |
| Apple | 0.76 | 3.97 | 5.94 | 5.00 | 1.78 | |
| Saffron | 0.54 | 2.34 | 4.12 | 3.79 | 1.29 | |
| Paddy-oilseed | 0.34 | 1.71 | 3.44 | 3.29 | 0.97 | |
| 60–90 | ||||||
| Forest | 0.55 | 3.59 | 8.25 | 4.57 | 2.45 | |
| Pasture | 0.37 | 2.74 | 4.72 | 3.38 | 1.50 | |
| Apple | 0.31 | 2.35 | 3.57 | 2.70 | 1.13 | |
| Saffron | 0.26 | 1.27 | 2.35 | 1.97 | 0.85 | |
| Paddy-oilseed | 0.16 | 0.95 | 1.93 | 1.65 | 0.60 | |
Note:
DHA, dehydrogenase activity; Ac_P, acid phosphatase activity; Alk_P, alkaline phosphatase activity; Aryl, arylsulphatase activity; FDA, fluorescein diacetate hydrolase. All the ratios represent enzyme activities per gram carbon across different studied LUs.
Soil microbial count
The bacterial count (BC) of soils followed the order: forest > pasture > apple > saffron > paddy-oilseed (Fig. 2). The mean values ranged from 67.67 to 123.33 CFU × 106 g−1, with the highest values observed in forest soils and the lowest in paddy-oilseed soils. Forest soils had 32.70%, 41.35%, and 45.13% highest bacterial counts compared to apple, saffron, and paddy-oilseed soils, respectively. The abundance of substrate in forests, along with good vegetation cover, enhances microbial activity (van Leeuwen et al., 2017; Kumar et al., 2017). In addition, bacteria can swiftly assimilate labile compounds, such as simple sugars and amino acids, leading to increased growth and activity. Moreover, the activity of plant roots and marginally reduced pH in undisturbed ecosystems promote bacterial growth (Fozia et al., 2018), and vice versa in cultivated soils, where the dearth of the substrate leads to reduced bacterial activity. The bacterial counts decreased along the soil depth, following a similar trend with the least counts in lower depth (Fig. 2). This could be attributed to a reduction in both the quantity and quality of substrate in deeper soil strata (van Leeuwen et al., 2017).
The fungal count (FC) of the soils followed the order: forest > pasture > apple > saffron > paddy-oilseed (Fig. 2). The mean fungal count in the surface soil varied from 19.33 to 67.00 CFU × 105 g−1, with the highest values observed in forest soils and the lowest in paddy-oilseed soils. The fungal count decreased with soil depth, following a similar trend as in the surface layer, with the minimum counts in the lower depth (Fig. 2). Forest soils had 36.31%, 39.29%, and 70.80% higher fungal counts than apple, saffron, and paddy-oilseed soils, respectively. This difference in fungal counts is due to the sensitivity of fungi to alterations in soil pH, nutrients, and surrounding conditions (Frąc et al., 2018). The existence of forest evergreens may stimulate the occurrence of ectomycorrhizal fungi, which can colonize most tree species and reduce the consequences of heavy rains, promoting plenteous fungal growth (Kumar et al., 2017; Asadu, Nwafor & Chibuike, 2015). On the other hand, exhaustive cultivation operations in agricultural land may lead to physical disruption and fragmentation of fungal hyphae, contributing to a lower proportion of fungi (van Leeuwen et al., 2017). In addition, since fungi require organic matter as their primary source of carbon, the low SOM levels in cultivated soil inhibit their number and activity. It is vital to remember that a drop in fungal populations in cultivated soils does not indicate the complete absence of fungi. Fungi can still be found in farmed soils; however, their prevalence is lower than in forest soils. These shifts in fungal assemblages have the potential to impact soil health, nutrient cycling, and plant-microbe interactions in agricultural settings. These results are further supported by the observations of Gong et al. (2022).
The actinomycete count (AC) of soils in the surface (0–30 cm) layer varied from 12.00 to 42.33 CFU × 104 g−1, following the order: forest > pasture > apple > saffron > paddy-oilseed (Fig. 2). In the sub-surface (30–60 and 60–90 cm) layers too, forest soils had the highest actinomycete counts (30.00 and 15.00 CFU × 104 g−1), while the least counts were recorded in paddy-oilseed soils (6.33 and 3.00 CFU × 104 g−1). Actinomycete counts decreased along the soil depth, with the least counts present in the lower depth (Fig. 2), which is in agreement with the findings of Kumar et al. (2022). Forest soils generally have a higher content of SOM, providing ample food sources for actinomycetes. In addition, the relative moisture, temperature, and the presence of vegetation in forest soils encourage the growth of the actinomycetes population (Hou et al., 2014). The existence of vegetation in the surface layer acts as a source of energy, and different plant species secrete various types of organic compounds (Kumar et al., 2017), providing a carbon-rich food source for the actinomycetes. On the other hand, cultivated soils are subjected to numerous disturbances, leading to a reduced population and diversity of actinomycetes in the soil.
Correlation coefficient between soil physico-chemical and microbial properties
The Pearson’s correlation coefficients (r) among the basic parameters and soil enzyme activities vary and are statistically significant at p = 0.05. BD and pH showed a significant negative correlation with DHA (r = −0.65**, −0.69**), acid phosphatase (r = −0.86**, −0.85**), alkaline phosphatase (r = −0.86**, −0.78**), arylsulphatase (r = −0.78**, −0.81**), and FDA (r = −0.89**, −0.82**), respectively (Fig. 3). On the other hand, OC and N exhibited a significant positive correlation with DHA (r = 0.57**, 0.89**), acid phosphatase (r = 0.81**, 0.95**), alkaline phosphatase (r = 0.84**, 0.88**), arylsulphatase (r = 0.70**, 0.95**), and FDA (r = 0.90**, 0.90**), respectively (Fig. 3). These correlation coefficients indicate a direct and/or indirect association of OC and N with soil microbial and enzyme activities. Several studies have shown that soil enzyme activities are related to changes in SOM content across various terrestrial ecosystems (Wang et al., 2016; Ngaba, Ma & Hu, 2020; Debnath et al., 2015).

Figure 3: Relationship among physico-chemical characteristics and enzymatic activities.
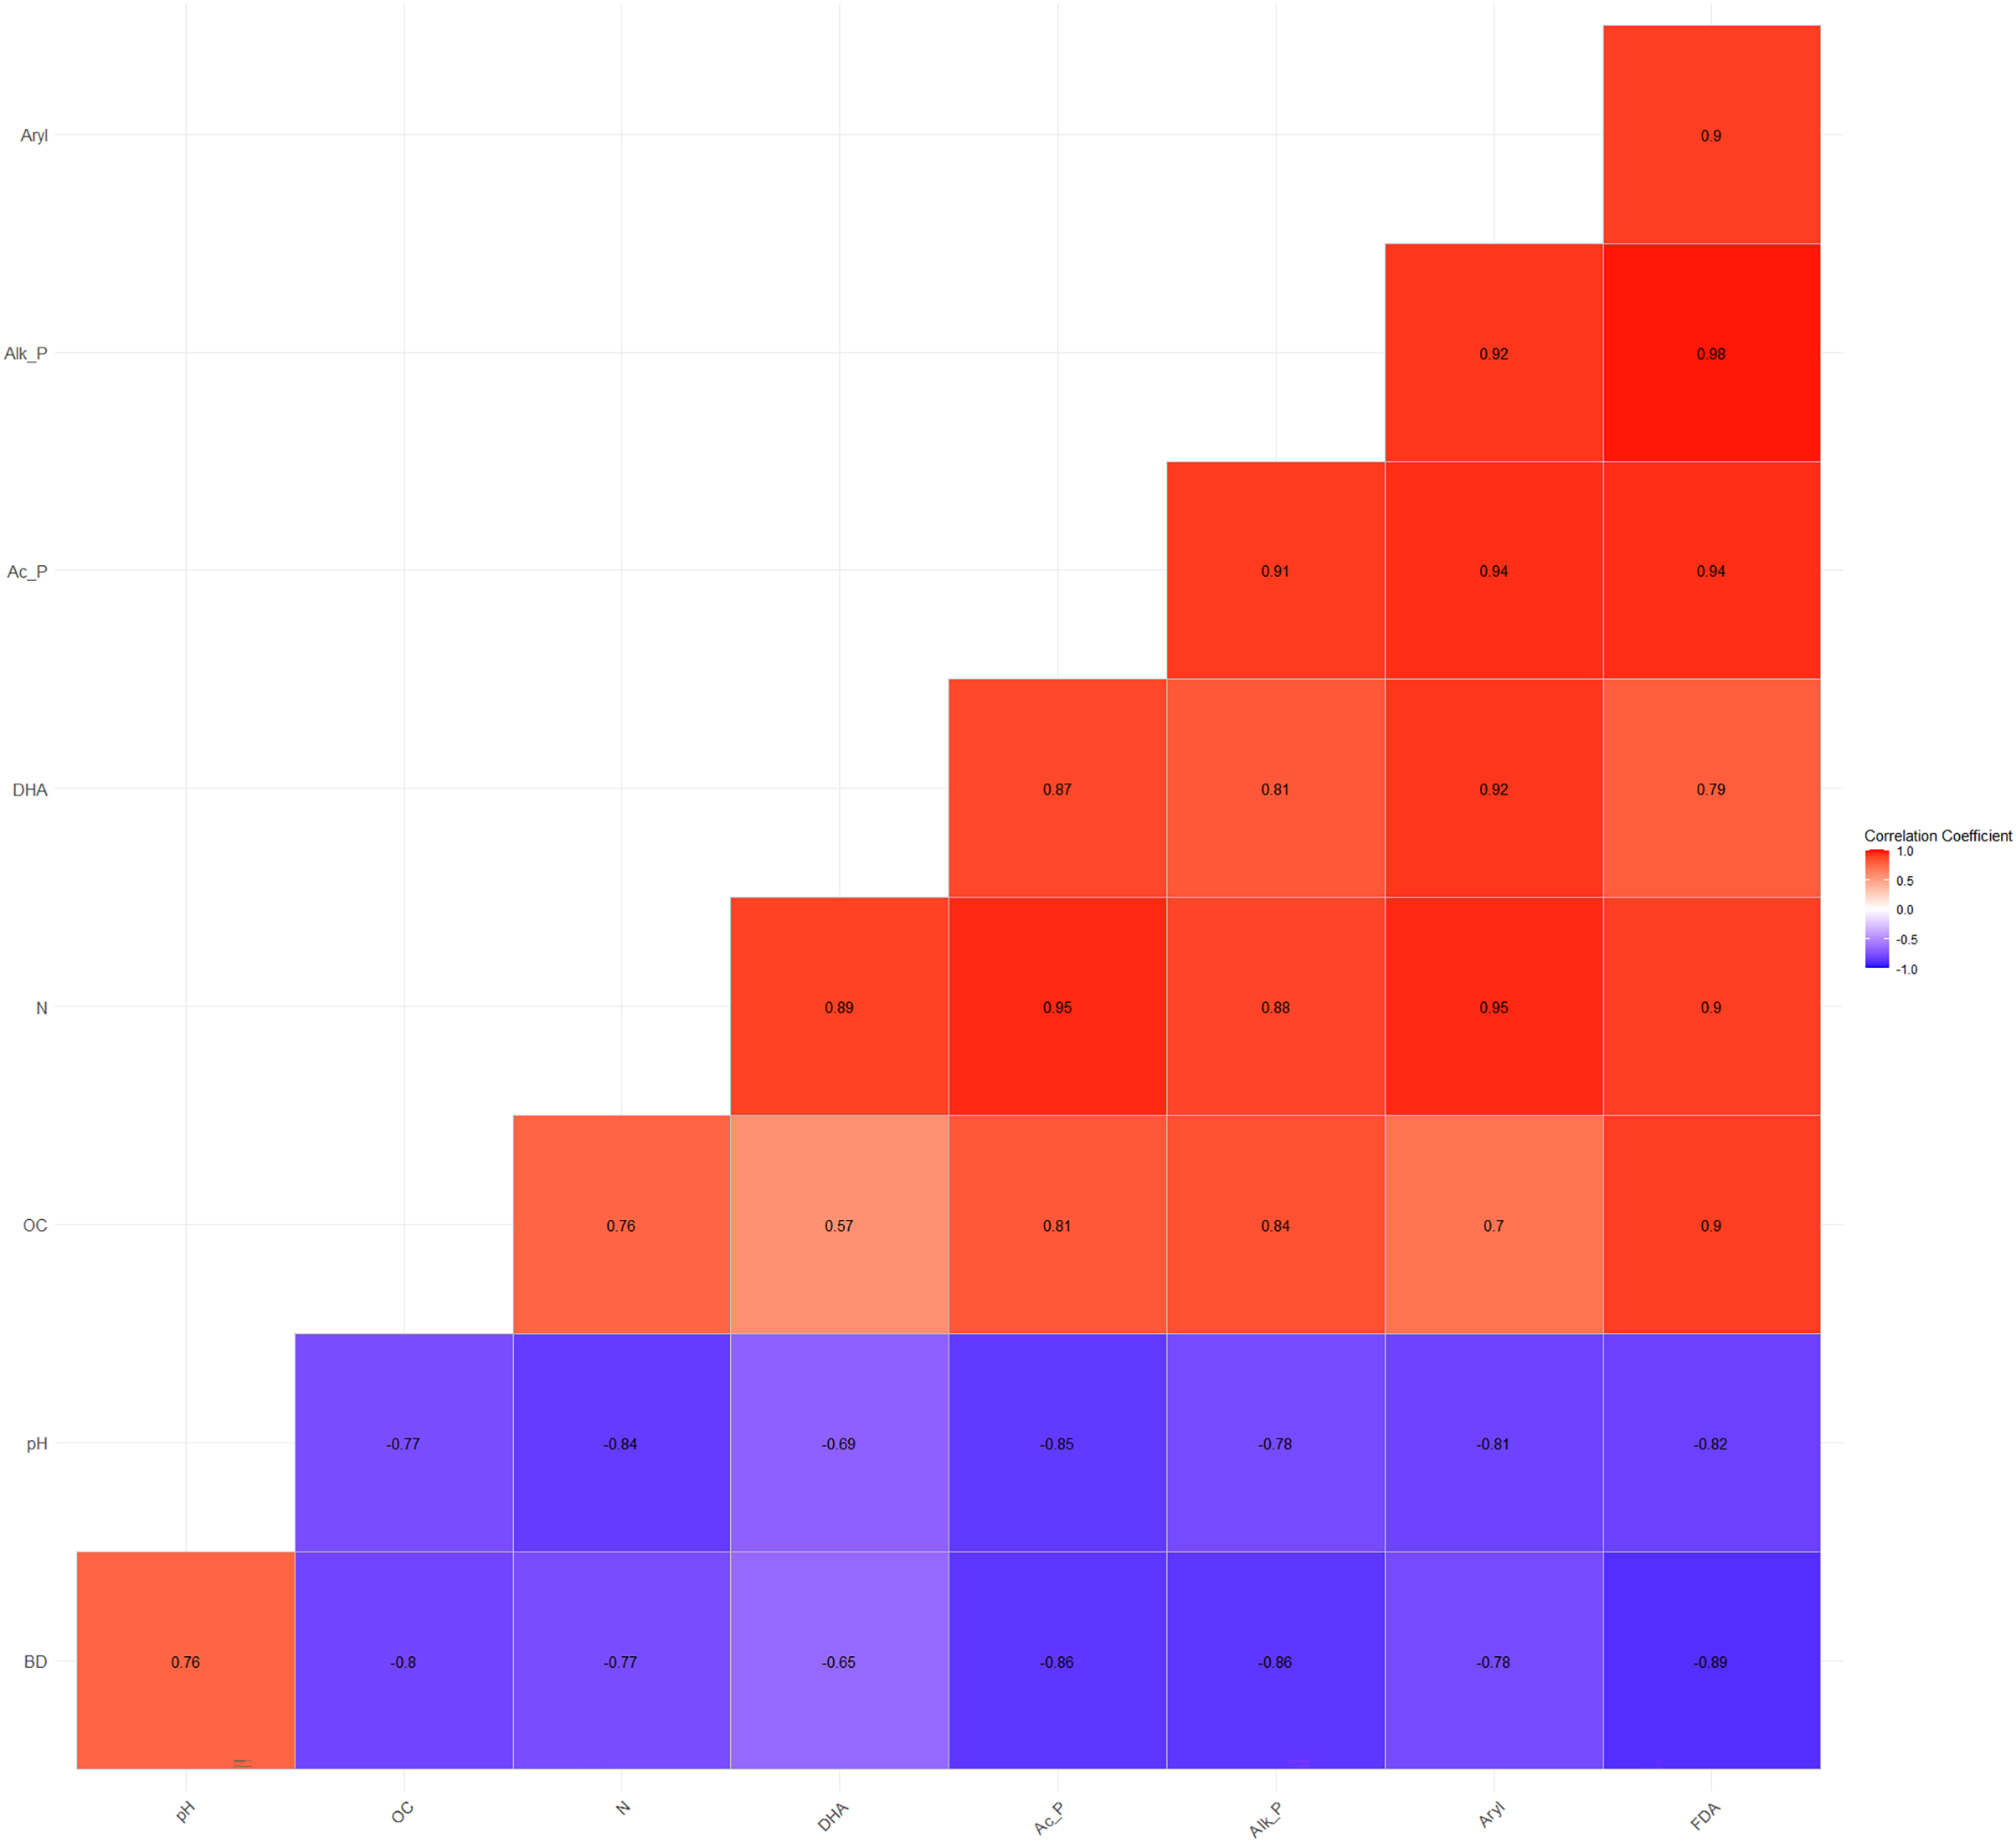
Furthermore, a high and significant positive correlation was also observed between soil microbial counts (bacterial, fungal, and actinomycete counts) and enzyme activities (Fig. 4). The higher energy supply, enzyme substrate, and the easily accessibility of H+ ions from carbohydrates and organic acids substantiate the significant positive correlations between microbial and enzyme activities (Wani, 2021).
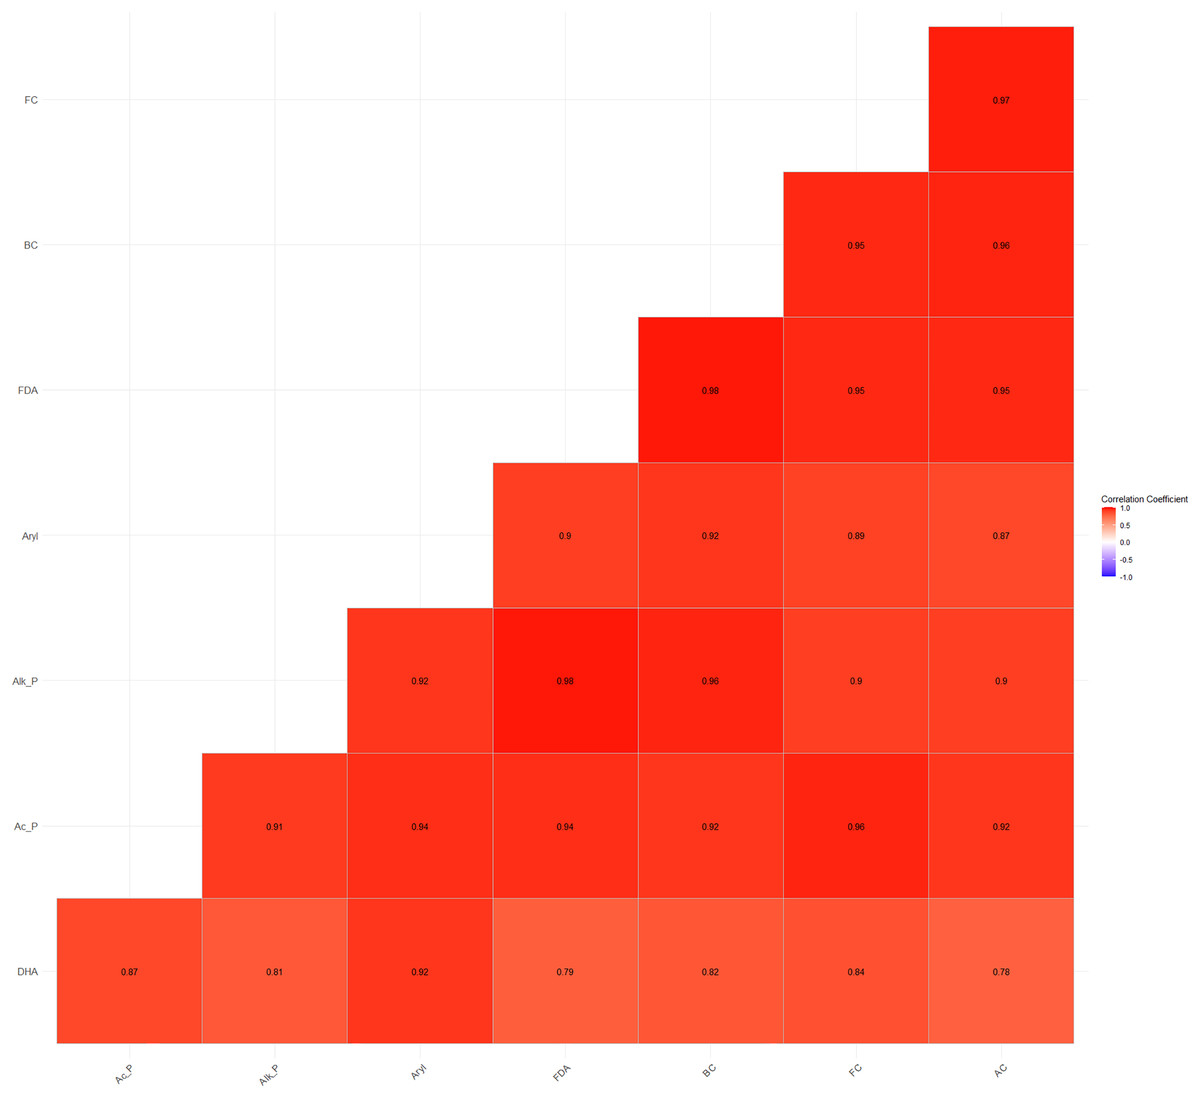
Figure 4: Relationship between soil microbial counts and enzymatic activities.
Principal component analysis (PCA) of basic soil properties and enzyme activities
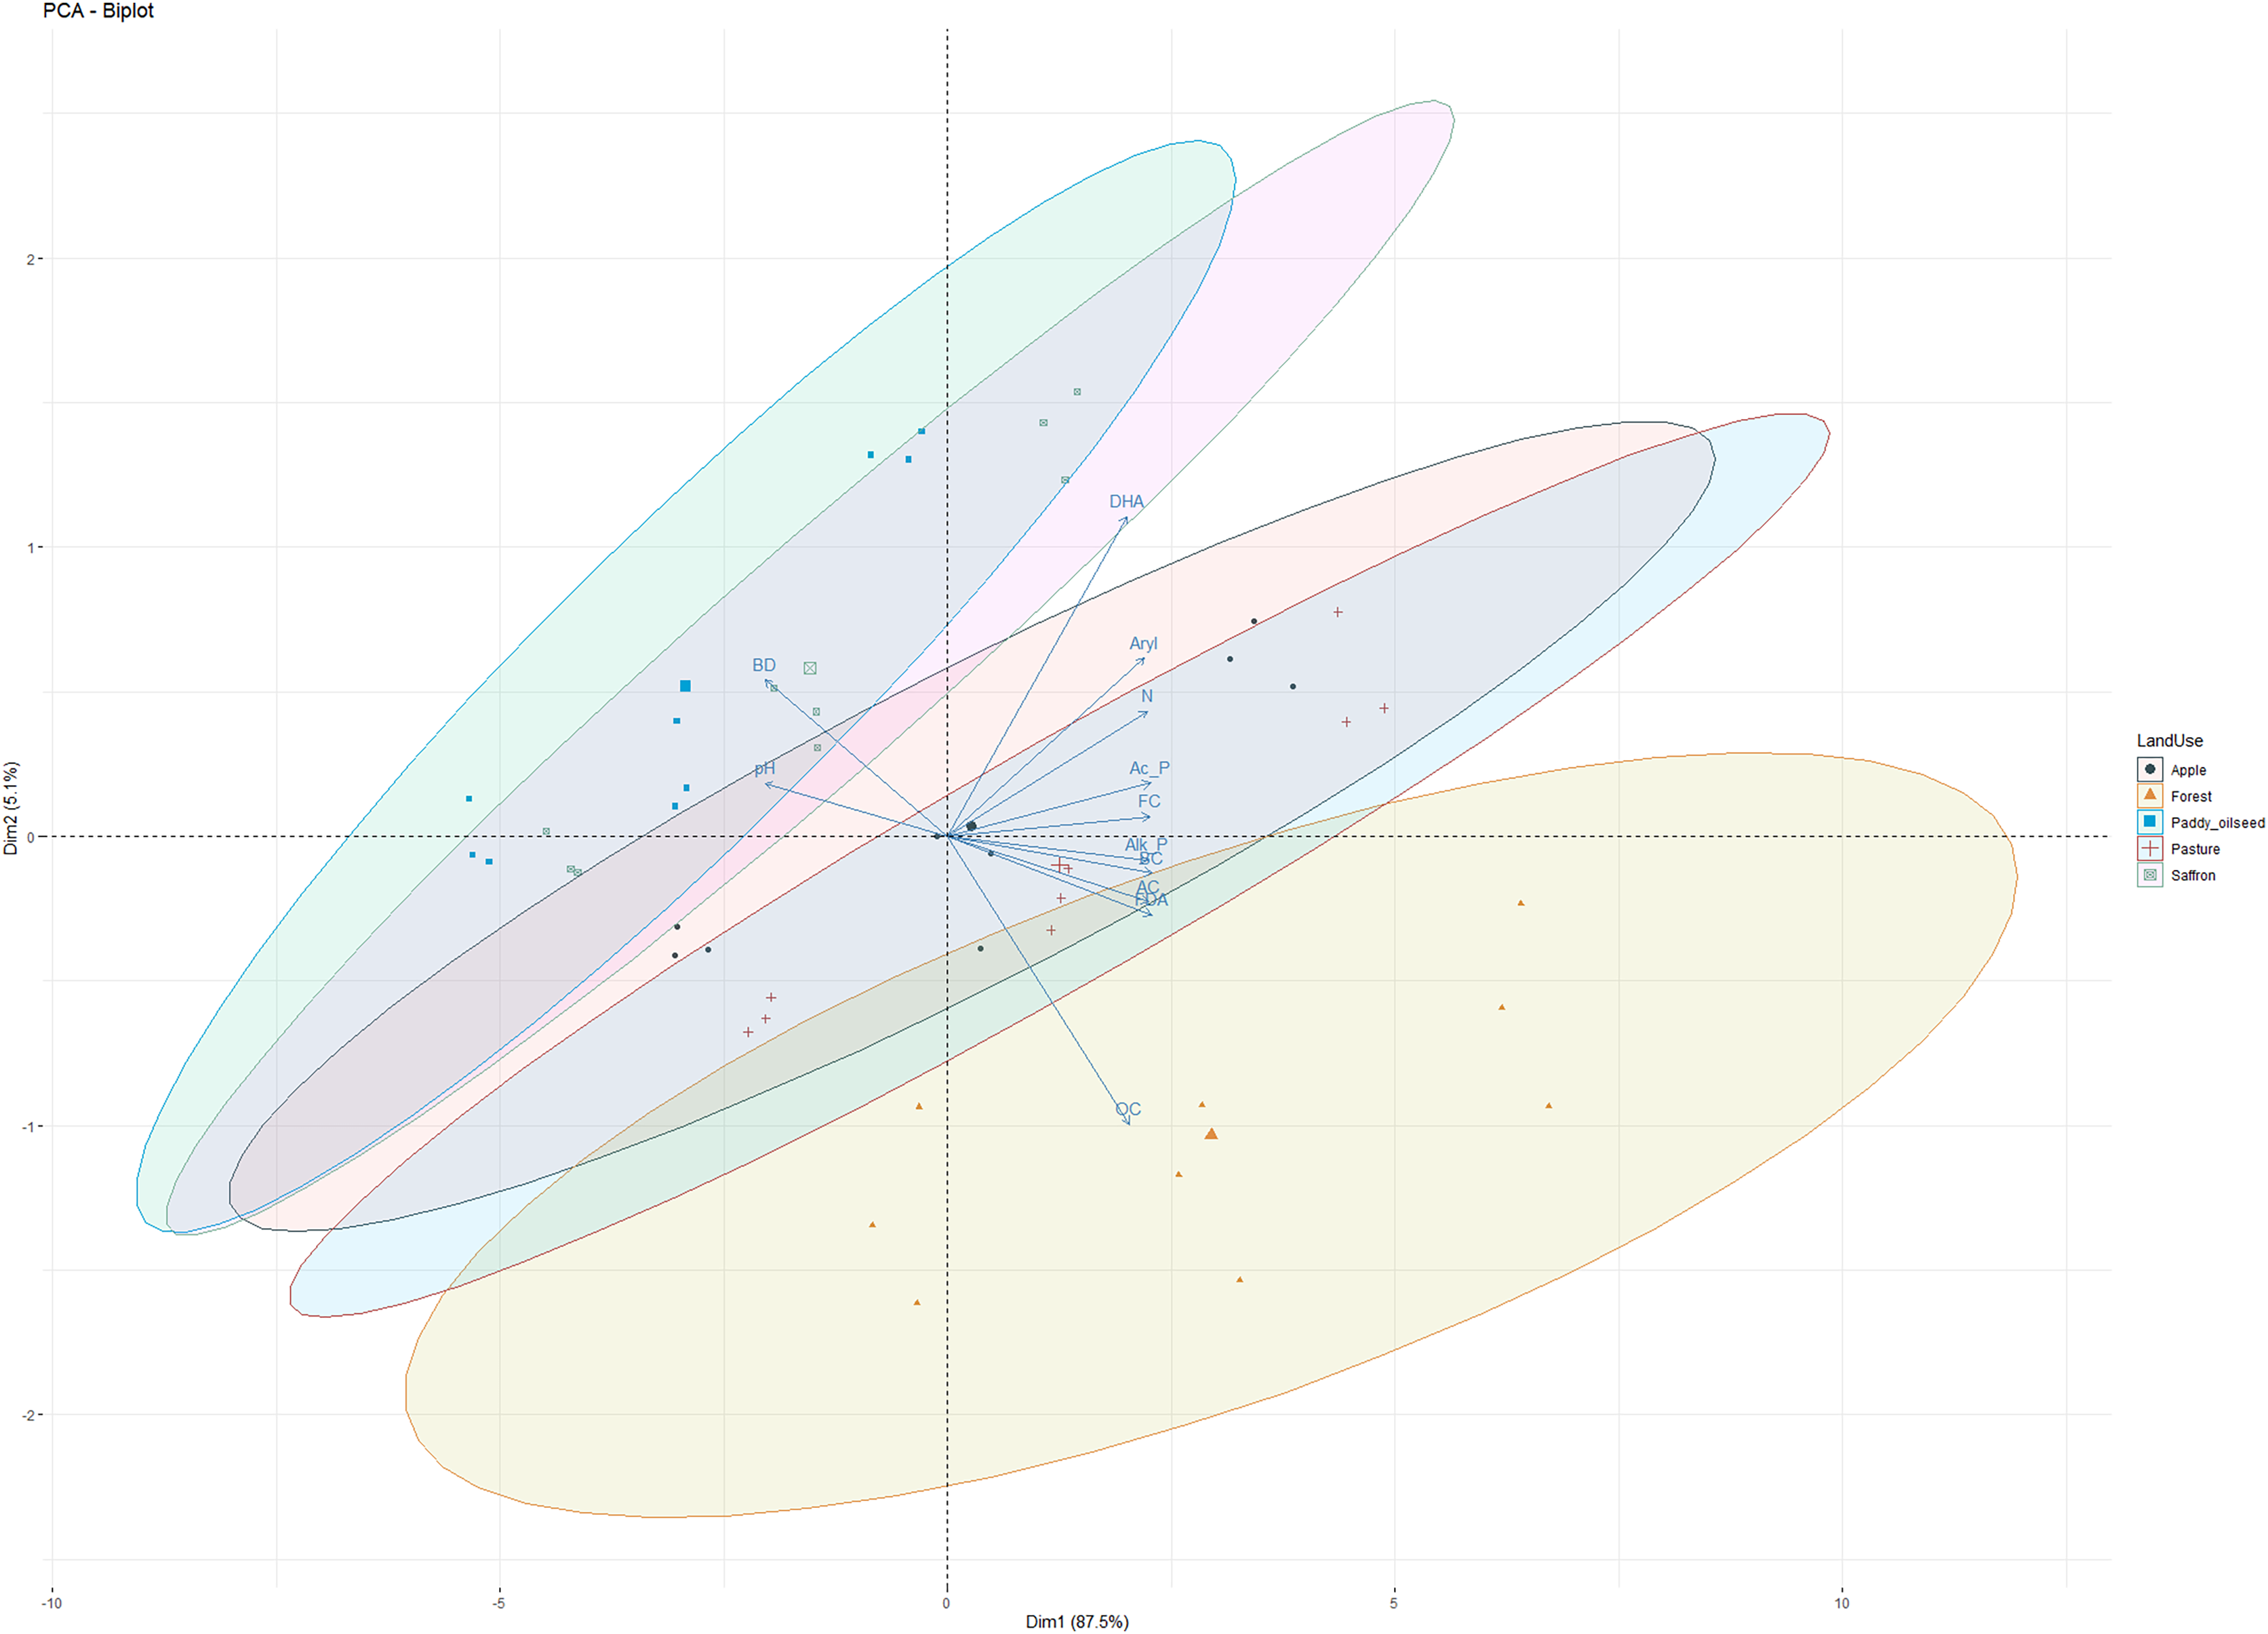
PCA was performed on soil physicochemical characteristics, microbial counts, and enzymatic activities (Fig. 5) to evaluate the primary governing variables affecting the shifts in soil characterization under different LUSs. PCA has been previously employed to examine the variance of different soil parameters and establish a productive relationship for soil quality assessment in different cropping systems (Sofi et al., 2016). The PCA of observations (physicochemical and microbial properties) depicted 92.6% variability along the two principal components (PC1 and PC2). PC1 explained 87.5%, of the variability, while PC2 explained 5.1%, with all the observations (DHA, acid phosphatase, alkaline phosphatase, arylsulphatase, FDA, OC, N, pH, and BD) contributing significantly to the total variation (Fig. 5). Sofi et al. (2016) reported a relatively comparable range of contribution from the first three components to the total variation for soil properties under different cropping systems. All the variables under study showed a significant positive association, except for pH and BD, which negatively correlated with enzymatic activities (Fig. 5). According to the PCA principle, when the cumulative variation percentage exceeds 85%, it could be utilized to interpolate the variation of the system. Therefore, the first principle component can fully reflect the variation information of the soil microbial community of different LUSs. These results confirmed our observations and align with the findings of Sofi et al. (2016) and Zhang et al. (2020).
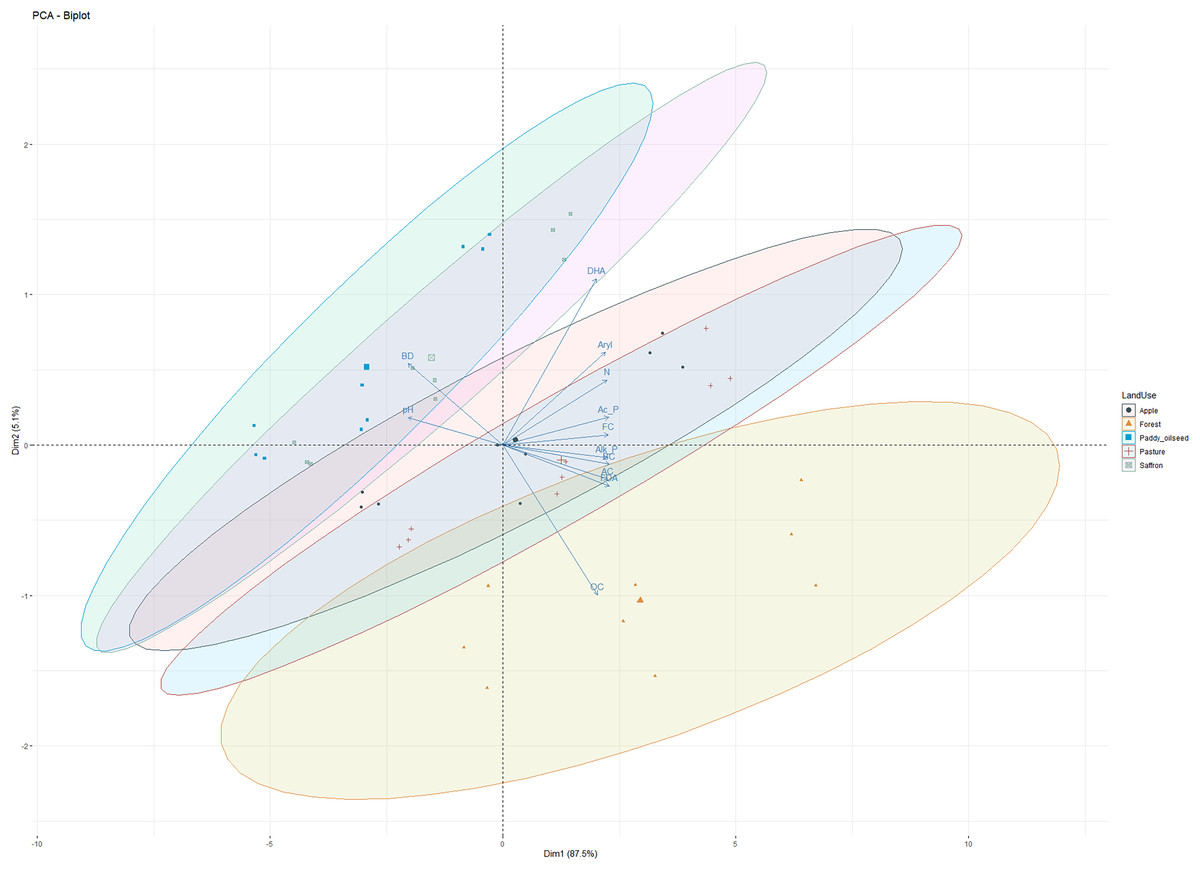
Figure 5: Principal component analysis of observations in five land use systems.
Conclusion
Numerous ecological investigations have attempted to link the multitude and diversity of soil organisms to habitat efficiency and functioning. However, the surface soils received the majority of emphasis, while lower soil strata concerning microbial and enzyme activities have been relatively understudied, particularly with regard to effects of land use and soil depth. This study revealed a significant impact of LUSs and SD on soil physicochemical characteristics, microbial, and enzymatic activity in the NWH of India. Soil bulk density and pH were lowest in forest soils (6.13, 1.18 Mgm−3) and highest in paddy-oilseed soils (7.16, 1.37 Mgm−3), respectively. OC and N content were highest in forest soils (22.00 g kg−1, 417.52 kg ha−1) and lowest in paddy-oilseed (11.70 g kg−1, 279.26 kg ha−1) soils, respectively. Microbial and enzyme activities (BC, FC, AC, DHA, Ac_P, Alk_P, Aryl, and FDA) were found to be elevated in forest soils (123.33 CFU × 106 g−1, 67.00 CFU × 105 g−1, 42.33 CFU × 104 g−1, 11.83 TPF µg g−1 day−1, 48.43 µg P-NP g−1 h−1, 61.35 µg P-NP g−1 h−1, 48.12 µg P-NP g−1 h−1, 21.59 µg g−1 h−1) compared to cultivated soils. A significant reduction of microbial and enzyme activity along the soil depth was also observed. As a consequence, microbiomes in agricultural soils are highly distressed and vulnerable to alterations in land management systems. Therefore, consistent return of organic substrates is necessary to maintain their functionality and prevent the reduction in soil microbiome. Considering the significance of microbial and enzymatic activities for enhanced crop output, soil livelihood, and sustainability, further investigations are required to monitor the diversity of microbial communities at a regional scale under changing climates. In addition, the implementation of conservation agricultural practices, crop diversification, rotations, inclusion of legumes, and efficient utilization of organic amendments and biofertilizers are promising tactics to counteract the negative effects and promote soil health and sustainability.
Supplemental Information
Dataset with replication.
Data of five land uses and three soil depths with three replications. The data of different parameters were used for the statistical analysis to compare land uses and soil depth.