
Genome-wide identification and expression analysis of diacylglycerol acyltransferase genes in soybean (Glycine max)
- Published
- Accepted
- Received
- Academic Editor
- Vladimir Uversky
- Subject Areas
- Agricultural Science, Bioinformatics, Molecular Biology, Plant Science
- Keywords
- Soybean, Diacylglycerol acyltransferase, Phylogenetic analysis, Genome-wide expression analysis
- Copyright
- © 2023 Zhao et al.
- Licence
- This is an open access article distributed under the terms of the Creative Commons Attribution License, which permits using, remixing, and building upon the work non-commercially, as long as it is properly attributed. For attribution, the original author(s), title, publication source (PeerJ) and either DOI or URL of the article must be cited.
- Cite this article
- 2023. Genome-wide identification and expression analysis of diacylglycerol acyltransferase genes in soybean (Glycine max) PeerJ 11:e14941 https://doi.org/10.7717/peerj.14941
Abstract
Background
Soybean (Glycine max) is a major protein and vegetable oil source. In plants, diacylglycerol acyltransferase (DGAT) can exert strong flux control, which is rate-limiting for triacylglycerol biosynthesis in seed oil formation.
Methods
Here, we identified soybean DGAT genes via a bioinformatics method, thereby laying a solid foundation for further research on their function. Based on our bioinformatics analyses, including gene structure, protein domain characteristics, and phylogenetic analysis, 26 DGAT putative gene family members unevenly distributed on 12 of the 20 soybean chromosomes were identified and divided into the following four groups: DGAT1, DGAT2, WS/DGAT, and cytoplasmic DGAT.
Results
The Ka/Ks ratio of most of these genes indicated a significant positive selection pressure. DGAT genes exhibited characteristic expression patterns in soybean tissues. The differences in the structure and expression of soybean DGAT genes revealed the diversity of their functions and the complexity of soybean fatty acid metabolism. Our findings provide important information for research on the fatty acid metabolism pathway in soybean. Furthermore, our results will help identify candidate genes for potential fatty acid-profile modifications to improve soybean seed oil content.
Conclusions
This is the first time that in silico studies have been used to report the genomic and proteomic characteristics of DGAT in soybean and the effect of its specific expression on organs, age, and stages.
Introduction
Soybean (Glycine max) is a major protein and vegetable oil source for humans. Lipids are primarily stored in the soybean seed as triacylglycerols (TAGs), which comprise three C16–C18 non-esterified fatty acids esterified to a glycerol molecule (Mekhedov, De Ilárduya & Ohlrogge, 2000). Soybean lipids are also stored in the leaf blade and stem via the formation of wax esters comprising aliphatic alcohols and acids, with both moieties being typically long-chain (C16 and C18) or very-long-chain (C20–C34 or longer) carbon structures (Yeats & Rose, 2013). In plants, diacylglycerol acyltransferase (DGAT) can exert strong flux control in TAG biosynthesis for seed oil formation (Barthole et al., 2012; Chen et al., 2022). Specifically, DGAT catalyzes the formation of an ester linkage between a fatty acyl-CoA and the free hydroxyl group of diacylglycerol to form TAGs (Liu et al., 2012). According to their structure and cellular or subcellular localization, DGATs are divided into four types: DGAT1 (Cases et al., 1998; Lardizabal et al., 2008), DGAT2 (Cases et al., 2001; Lardizabal et al., 2001), WS/DGAT (Kalscheuer & Steinbüchel, 2003), and cytoplasmic DGAT (cytoDGAT) (Saha et al., 2006). DGAT1 belongs to the acyl-CoA cholesterol acyltransferase family, whereas DGAT2 belongs to the DGAT2 superfamily; further, DGAT1 and DGAT2 primarily bind to the endoplasmic reticulum membrane and are microsomal enzymes. WS/DGATs, which are bifunctional enzymes that play a key role in wax-ester synthesis (Cases et al., 1998; Lardizabal et al., 2008), and cytoDGAT, recently discovered, have been relatively less studied (Kalscheuer & Steinbüchel, 2003; Saha et al., 2006). The DGAT1 protein subfamily members are expressed in both animals and plants. After cloning of the first DGAT1 gene in mice (Cases et al., 2001), Hobbs, Lu & Hills (1999) first cloned DGAT1 in plants, specifically in Arabidopsis, which has only one copy of the gene. Subsequently, DGAT1 has been cloned in other plant species (Xu et al., 2008; Zheng et al., 2008). DGAT1 (50–60 kDa and >500 amino acid residues) is expressed in flowers and developing and germinating seeds. The three-dimensional structure of the protein contains 9–10 hypothetical transmembrane regions and a hydrophilic N terminus (Nykiforuk et al., 2002; He et al., 2004a; He et al., 2004b) that faces the cytoplasmic surface of the endoplasmic reticulum membrane (Shockey et al., 2006). Structural differences in DGAT1 among species primarily exist in the N terminus (Zou et al., 1999) and may be related to the selectivity of DGAT1 to the acyl-coenzyme A substrate in different plant species.
The DGAT2 subfamily members are expressed in animals, plants, and yeast (Kroon et al., 2006; Oakes et al., 2011). DGAT2 (30–40 kDa, >300 amino acid residues) from Mortierella ramanniana liposomes was first cloned into other plant species by Routaboul et al. (1999). In turn, Kalscheuer & Steinbüchel (2003) identified a gene encoding a bifunctional enzyme with both wax-ester synthesis and DGAT functions in Acinetobacter calcoaceticus. This WS/DGAT enzyme (51.8 kDa, 458 amino acid residues) is unrelated to the known wax-ester synthases DGAT1 and DGAT2.
CytoDGAT is a novel DGAT gene that was cloned from immature peanut seeds (Hobbs, Lu & Hills, 1999). The gene encodes a 38 kDa protein containing 345 amino acid residues. The protein is localized in the cytoplasm of cotyledonary cells and does not contain any hypothetical transmembrane region. Its amino acid sequence is 13% homologous to that of WS/DGAT and less than 10% homologous to that of the DGAT1 and DGAT2 family members. Therefore, the DGAT genes in soybean were analyzed in this study using systematic identification and characterized through phylogenetic, structural diversification, and expression profile analyses.
There are many studies regarding the DGAT gene in soybean, most of them focusing on its function. Wang et al. (2006) cloned the DGATT1 and DGATT2 genes from wild-type and cultivated soybean using the RACE method. Li et al. (2013) cloned the DGAT1A and DGAT1B genes from JACK varieties. However, DGAT in standard soybean varieties has not yet been fully reported. The results of this study will aid in understanding the evolution and function of the GmDGAT gene family in soybean as well as the genomic architectures and biological functions of each subfamily. Our study could provide a comprehensive account of the GmDGAT gene family in soybean and also serve as a starting point for further elucidation of their roles in soybean seed oil synthesis and accumulation as well as plant growth and development.
Materials & Methods
Sequence retrieval and data analysis
To identify all putative DGAT proteins in soybean, G. max genome data were downloaded from the latest NCBI database (http://www.ncbi.nlm.nih.gov/). Data were collected as previously described in Zhao (2018). According to Arabidopsis DGAT1 and DGAT2 proteins in the Pfam database (http://pfam.xfam.org/), DGAT proteins should have a PF03982 domain and WS/DGAT should have Pfam: PF03007 and PF06974 domains. These protein domains were used as queries in Hmmer3.0 with the E-value set at 1E-005. Based on the amino acid sequence in peanuts, the DGAT3 (cytoDGAT) protein was searched and screened via BLAST in the soybean database. The exon/intron organization for G. max DGAT genes was defined by loading its coding sequence (CDS) and the corresponding genomic sequence into Phytozome13 (Phytozome). Molecular weights and isoelectric points of candidate GmDGAT proteins were analyzed using ExPASy (http://web.expasy.org/protparam/). Predicting subcellular localization of DGAT genes in soybean was performed using Cell-PLoc 2.0 (Chou & Shen, 2010) (http://www.csbio.sjtu.edu.cn/bioinf/plant-multi/), DeepLoc (Armenteros et al., 2017), and WoLF pSORT (www.genscript.com/wolf-psort.html) (Horton et al., 2007).
Conserved domain, motif, CDS, and phylogenetic analyses
To identify the conserved domains, motifs, and CDS in the GmDGAT proteins, we used the Pfam (http://pfam.xfam.org/) and MEME (https://meme-suite.org/meme/) databases and Gene Structure Display Server 2.0 (GSDS2.0, http://gsds.cbi.pku.edu.cn/), respectively. Using MEGA X (https://www.megasoftware.net/), we constructed a phylogenetic tree with the Jones–Taylor–Thornton model; bootstrap tests were performed using 1,000 replicates for statistical reliability.
Cis-element, chromosomal localization, and collinearity analyses of GmDGAT genes
The 2-kb region upstream of the start codon of the DGAT genes served as the promoter sequences that were submitted to PlantCARE (http://bioinformatics.psb.ugent.be/webtools/plantcare/html/) for predicting cis-acting elements in the promoter region. The chromosomal location of DGAT genes was obtained from Phytozome (https://phytozome-next.jgi.doe.gov/). MCScanX was used to determine the syntenic relationships among DGAT gene family members. The TBTools software was used to describe the distribution of the identified cis-elements, chromosome location map, and collinearity analysis results.
Estimating Ka/Ks ratios for duplicated gene pairs
In order to understand the mechanisms of DNA sequence evolution, reconstruct phylogenic trees, and identify protein coding exons, nonsynonymous (amino acid replacing) and synonymous (silent) substitution rates between protein coding sequences were used to determine whether there was selection pressure acting on this protein coding gene (Yang & Nielsen, 2000; Nekrutenko, 2002). Nonsynonymous (amino acid substitution) and synonymous (silent) substitutions are called Ka and Ks, respectively. Ka reflects nonsynonymous substitutions per nonsynonymous site, and Ks reflects synonymous substitutions per synonymous site. The Ka/Ks ratio (denoted as ω) is widely used as an estimator of selective strength for DNA sequence evolution, with ω >1 indicating positive selection, ω <1 indicating purifying (negative) selection, and ω close to 1 indicating neutral mutation (Chattopadhyay et al., 1998). Data are processed according to the protocol described by Aylward (2018), calculated the Ka/Ks ratios of GmDGATs.
GmDGAT expression pattern analysis
Based on the soybase database’s (https://soybase.org/soyseq/) published sequencing results of the soybean whole transcriptome, we screened relevant data and analyzed GmDGAT expression in different tissues from the expression data available for 51,529 soybean genes. We used Heatmap in the R software (version 2.15.2) to construct a heat map.
RT-PCR analysis of GmDGAT genes
The soybean variety Williams 82 (w82), used in this experiment, was provided by the Institute of Plant Sciences of Jilin University and planted at its variety trial station (43°55′22.63″N, 125°16′3216′33.00″E). Roots, stems, leaves, flowers, and seeds of soybean plants were collected 10, 20, 30, 40, 50, and 60 days after flowering (DAF) for subsequent analysis. Tissue samples were frozen in liquid nitrogen and stored in refrigerators at −80 °C. The E.Z.N.A.® plant RNA Kit (Omega Biotechnology, Norcross, GA, USA) was used for extracting total RNA from all collected samples according to the manufacturer’s instructions. The ReverTra Ace PCR RT Master Mix with gDNA Remover (TOYOBO, Japan) was used to reverse-transcribe RNA into first-strand cDNA. Subsequently, RT-PCR was conducted using QuantStudio™ 5 Real-Time PCR software (Foster City, CA, USA) and KOD SYBR qPCR Mix (TOYOBO) following the protocol proposed by the manufacturer. Three biological and three technical replicates were used for each treatment in the RT-PCR analysis. Soybean GmActin was used as a reference gene. The 2−ΔΔC(t) method was used to determine the relative gene expression levels of 10 randomly selected GmDGAT genes. The primers used for RT-PCR are listed in Table S1.
Results
Identification of DGAT proteins in soybean (G. max)
A total of 26 DGAT putative proteins were identified: three proteins containing the MBOAT (PF03062) protein domain, 10 proteins containing the DGAT (PF03982) protein domain, 12 proteins containing the WS/DGAT (PF03007 and PF06974) protein domains (Fig. 1Bi), which were identified in soybean in the latest version of the G. max genome assembly (Wm82.a4.v1). Using the peanut cytoDGAT sequence as a reference query, the sequence alignment program BLASTP identified one cytoDGAT protein (Glyma.13G118300) in soybean.
Among the identified DGAT proteins, three were assigned to the DGAT1 subfamily because they contained the membrane-bound o-acyltransferase (MBOAT) domain. In turn, 10 genes were assigned to the DGAT2 subfamily as they contained the monoacylglycerol acyltransferase domain; these genes were further classified into DGAT2a and DGAT2b according to the similarity of their encoded amino acid sequences and motifs. Meanwhile, the WS/DGAT subfamily identified 12 genes containing the acyl-CoA wax-alcohol acyltransferase domain; these genes were further classified into WS/DGATa, WS/DGATb, and WS/DGATc. CytoDGAT was found to contain only one gene.
We evaluated the basic properties of these DGAT proteins, including gene name, gene ID, CDS length, isoelectric point, molecular weight, and number of exons (Table 1). The amino acid (aa) length of DGATs varied from 249 to 704 aa and the isoelectric point (pI) ranged from 6.06 to 10.03. There were similarities in basic gene and protein properties within as well as among groups.
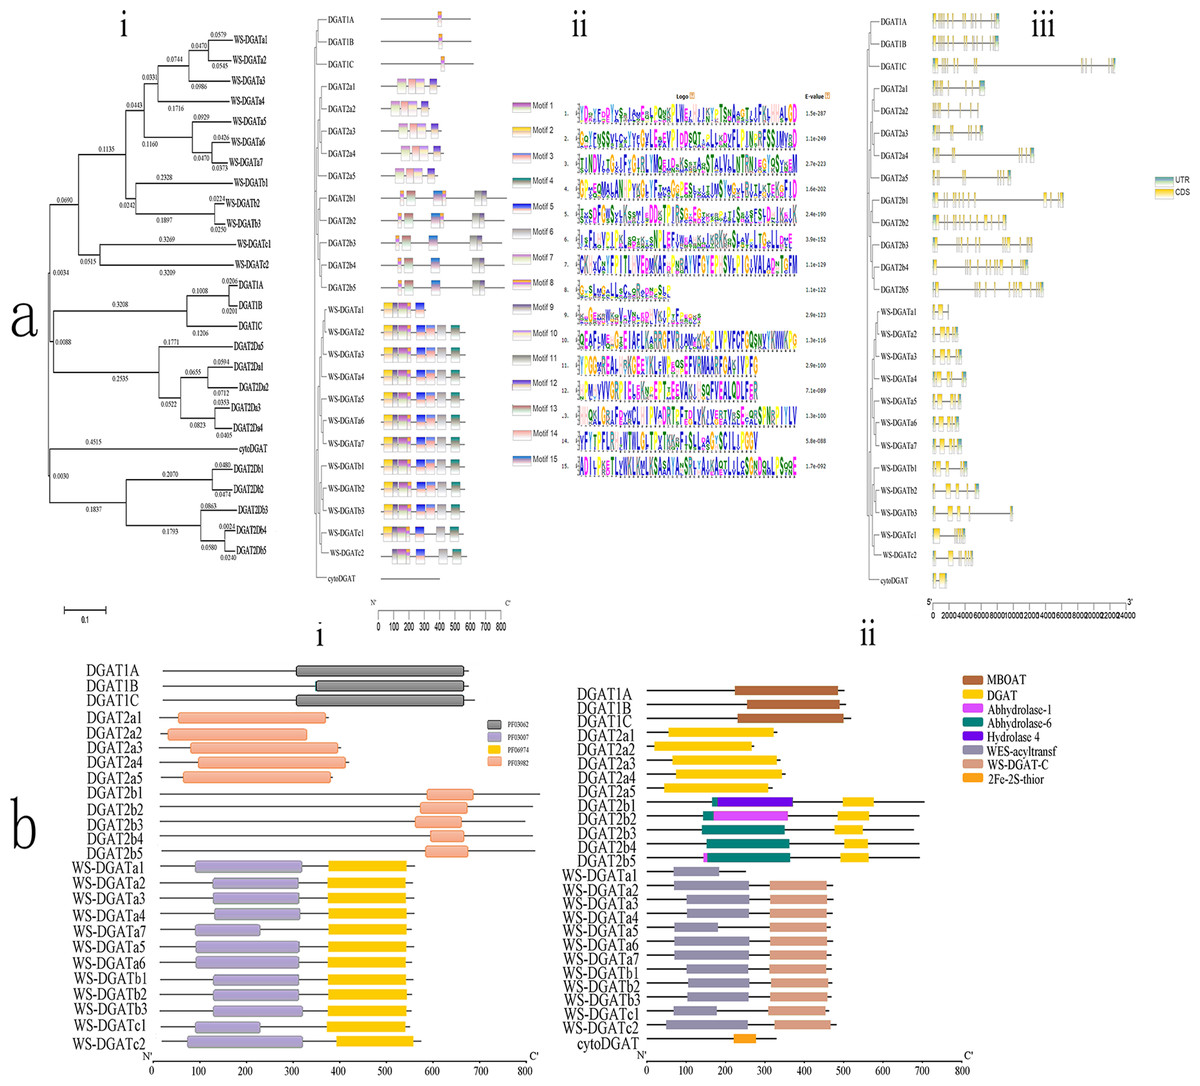
Figure 1: Conserved domain, motif, CDS, and phylogenetic analyses.
(A) Phylogenetic relationships, motifs, and coding sequence (CDS) of soybean diacylglycerol acyltransferase (DGAT) genes in soybean. (i) Phylogenetic tree based on the full-length sequence of soybean DGAT proteins built using MEGAX software. (ii) Fifteen predicted motifs are represented by boxes of different colors, and their sizes are indicated by the scale on the right. (iii) Exon/intron structure of GmDGAT genes. Green boxes represent untranslated 5′- and 3′-regions, yellow boxes represent exons, and black lines represent introns. (B) Organization of conserved domains in the identified DGAT proteins. (i) The signature domains of GmDGAT protein analyzed with Pfam. (ii) The conserved protein domain of GmDGAT protein.
| Gene name | Gene ID | cDNA length (bp) | pI | MW | Number of amino acid residues | Predicting subcellular localization |
|---|---|---|---|---|---|---|
| GmDGAT1A | Glyma.13G106100 | 1503 | 8.89 | 57563.72 | 500 | Cell membrane. Chloroplast. Golgi apparatus. |
| GmDGAT1B | Glyma.17G053300 | 1515 | 8.89 | 57999.11 | 504 | Cell membrane. |
| GmDGAT1C | Glyma.09G065300 | 1554 | 8.93 | 59286.5 | 517 | Cell membrane. |
| GmDGAT2a1 | Glyma.01G156000 | 990 | 9.7 | 36884.63 | 329 | Cell membrane. Chloroplast. |
| GmDGAT2a2 | Glyma.11G088800 | 813 | 10.03 | 30762.67 | 270 | Chloroplast. |
| GmDGAT2a3 | Glyma.09G195400 | 1014 | 9.62 | 38202.02 | 337 | Chloroplast. |
| GmDGAT2a4 | Glyma.16G115700 | 1053 | 9.68 | 39591.78 | 350 | Cell membrane. Chloroplast. |
| GmDGAT2a5 | Glyma.16G115800 | 954 | 9.26 | 36002.63 | 317 | – |
| GmDGAT2b1 | Glyma.03G243700 | 2115 | 7.02 | 78293.74 | 704 | Chloroplast. |
| GmDGAT2b2 | Glyma.19G241200 | 2076 | 6.06 | 76460.35 | 691 | Chloroplast. |
| GmDGAT2b3 | Glyma.16G051300 | 2034 | 9 | 76186.14 | 677 | – |
| GmDGAT2b4 | Glyma.16G051200 | 2076 | 6.99 | 76886.72 | 691 | – |
| GmDGAT2b5 | Glyma.19G099400 | 2079 | 8 | 77309.55 | 692 | – |
| GmWS/DGATa1 | Glyma.12G114400 | 750 | 6.3 | 28375.42 | 249 | Cytoplasm. |
| GmWS/DGATa2 | Glyma.06G291700 | 1416 | 9.04 | 53801.41 | 471 | Chloroplast. |
| GmWS/DGATa3 | Glyma.06G291300 | 1419 | 9.48 | 53807.73 | 472 | Chloroplast. |
| GmWS/DGATa4 | Glyma.12G114900 | 1413 | 7.66 | 52957.1 | 470 | Chloroplast. |
| GmWS/DGATa5 | Glyma.18G258100 | 1398 | 6.68 | 52264.01 | 465 | Cell membrane. Chloroplast. |
| GmWS/DGATa6 | Glyma.09G239600 | 1416 | 6.47 | 52783.67 | 471 | Chloroplast. |
| GmWS/DGATa7 | Glyma.18G257900 | 1404 | 8.62 | 52417.41 | 467 | Chloroplast. |
| GmWS/DGATb1 | Glyma.13G295900 | 1407 | 9.01 | 52574.35 | 468 | Cell membrane. Cytoplasm. |
| GmWS/DGATb2 | Glyma.19G046000 | 1410 | 8.77 | 52897.1 | 469 | Chloroplast. |
| GmWS/DGATb3 | Glyma.13G046600 | 1404 | 8.18 | 52713.85 | 467 | Chloroplast. |
| GmWS/DGATc1 | Glyma.07G000300 | 1386 | 8.37 | 51291.55 | 461 | Chloroplast. Nucleus. Peroxisome. |
| GmWS/DGATc2 | Glyma.09G196400 | 1443 | 9.35 | 53849.94 | 480 | Chloroplast. |
| GmcytoDGAT | Glyma.13G118300 | 984 | 8.52 | 34732.81 | 327 | Chloroplast. Cytoplasm. Mitochondrion. |
Notes:
- DGAT
-
diacylglycerol acyltransferase
- MW
-
molecular weight
- pI
-
isoelectric point
The subcellular localization prediction results showed that GmDGATs were centrally localized in the chloroplast, followed by the cell membrane, cytoplasm, nucleus, mitochondria, peroxisome, and golgi apparatus (Table 1). GmDGAT2a5, GmDGAT2b3, GmDGAT2b4, and GmDGAT2b5 failed to predict their subcellular location.
Conserved domains and phylogenetic analysis
Multiple alignment analyses were conducted to determine the classification and evolutionary relationships of DGAT genes in soybean, and an unrooted maximum-likelihood phylogenetic tree was constructed using the MEGA 5.10 software with the amino acid sequences of the 26 soybean DGAT proteins. Based on the phylogenetic tree (Fig. 1Ai), soybean DGAT genes were divided into four subfamilies: DGAT1, DGAT2, WS/DGAT, and cytoDGAT. Three DGAT proteins were included in the DGAT1 protein subfamily. The members of the DGAT2 subfamily were divided into two subgroups, each possessing five members of DGAT2a and DGAT2b. In turn, the WS/DGAT subfamily members were divided into three subgroups that possessed 7, 3, and 2 members from WS/DGATa, WS/DGATb, and WS/DGATc, respectively.
To understand the structural diversity of DGAT, the conserved domains (Fig. 1Bi) were analyzed with Pfam. All DGAT1 subfamily members contained the MBOAT domain, and all DGAT2 subfamily members contained the DGAT domain. Furthermore, the DGAT2b family included the Abhydrolase_6 domain, DGAT2b1 contained the Hydrolase_4 domain, and DGAT2b2 and DGAT2b5 contained the Abhydrolase_1 domain. Additionally, the WS/DGAT subfamily contained the WES_Acyltransf and WS_DGAT_C domains (Fig. 1Bii). In contrast, cytoDGAT did not contain any of the conserved domains but contained a unique 2Fe-2S_Thioredoxin domain. The conserved motifs of the DGAT genes were analyzed using the MEME motif search tool, which revealed 15 significant (e-value <e-100) conserved motifs (Fig. 1Aii). Different subgroups contained different motifs, including numbers and composition; however, the same group in the phylogenetic tree had the same conserved motif structures. Motif8 existed in all DGAT1 subfamily members. Subgroup DGAT2a had motif7, motif10, motif12, and motif14, and subgroup DGAT2b had motif11, motif13, and motif15; the WS/DGAT subfamily contained motif8 and motif9. In contrast, the cytoDGAT subfamily had none of these motifs.
The exon/intron organization (Fig. 1Aiii) showed similar numbers of introns and exons in one subgroup. All members of DGAT1 had 16 exons. The DGAT2a members had 9 exons, and DGAT2b subgroup members had 13–14 exons. The number of introns in the WS/DGAT subfamily varied from three to seven. WS/DGATa and WS/DGATb members mostly contained five exons, WS/DGATa1 contained three exons, WS/DGATc had six and seven exons, and CtyoDGAT had two exons.
Chromosomal localization and collinearity analysis
The chromosomal location of the DGAT genes was plotted according to the physical positions of the DGAT genes on soybean chromosomes (Fig. 2) (Kim et al., 2017). The 26 DGAT genes were unevenly distributed on 12 of the 20 chromosomes in soybean. Chromosomes 9, 13, and 16 had four genes; chromosome 19 had three genes; chromosomes 6, 12, and 18 had two genes; and chromosomes 3, 7, 11, and 17 had only one gene. To understand the evolution and amplification of DGAT genes in the soybean genome, we performed collinearity analysis. All segmentally duplicated gene pairs belonged to the same phylogenetic subfamilies, likely because, as an ancient tetraploid, soybean shows many chromosomal rearrangements, high genomic duplication, and multiple gene copies (Schmutz et al., 2010). DGAT1a, DGAT1b, and DGAT1c, located on chromosomes 9, 13, and 17, respectively, were collinear.
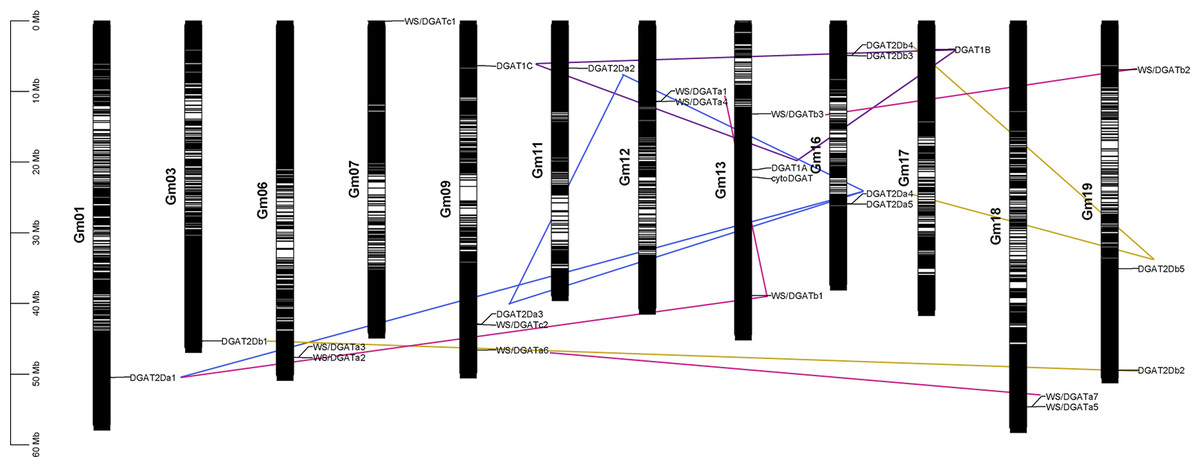
Figure 2: Chromosomal localization, and collinearity analyses of GmDGAT genes.
Distribution of 26 DGAT genes on soybean (Glycine max L.) chromosomes. Collinearity analysis of soybean DGAT genes. Red, blue, green, and brown lines indicate DGAT1, DGAT2a, DGAT2b, and WS/DGAT genes, respectively.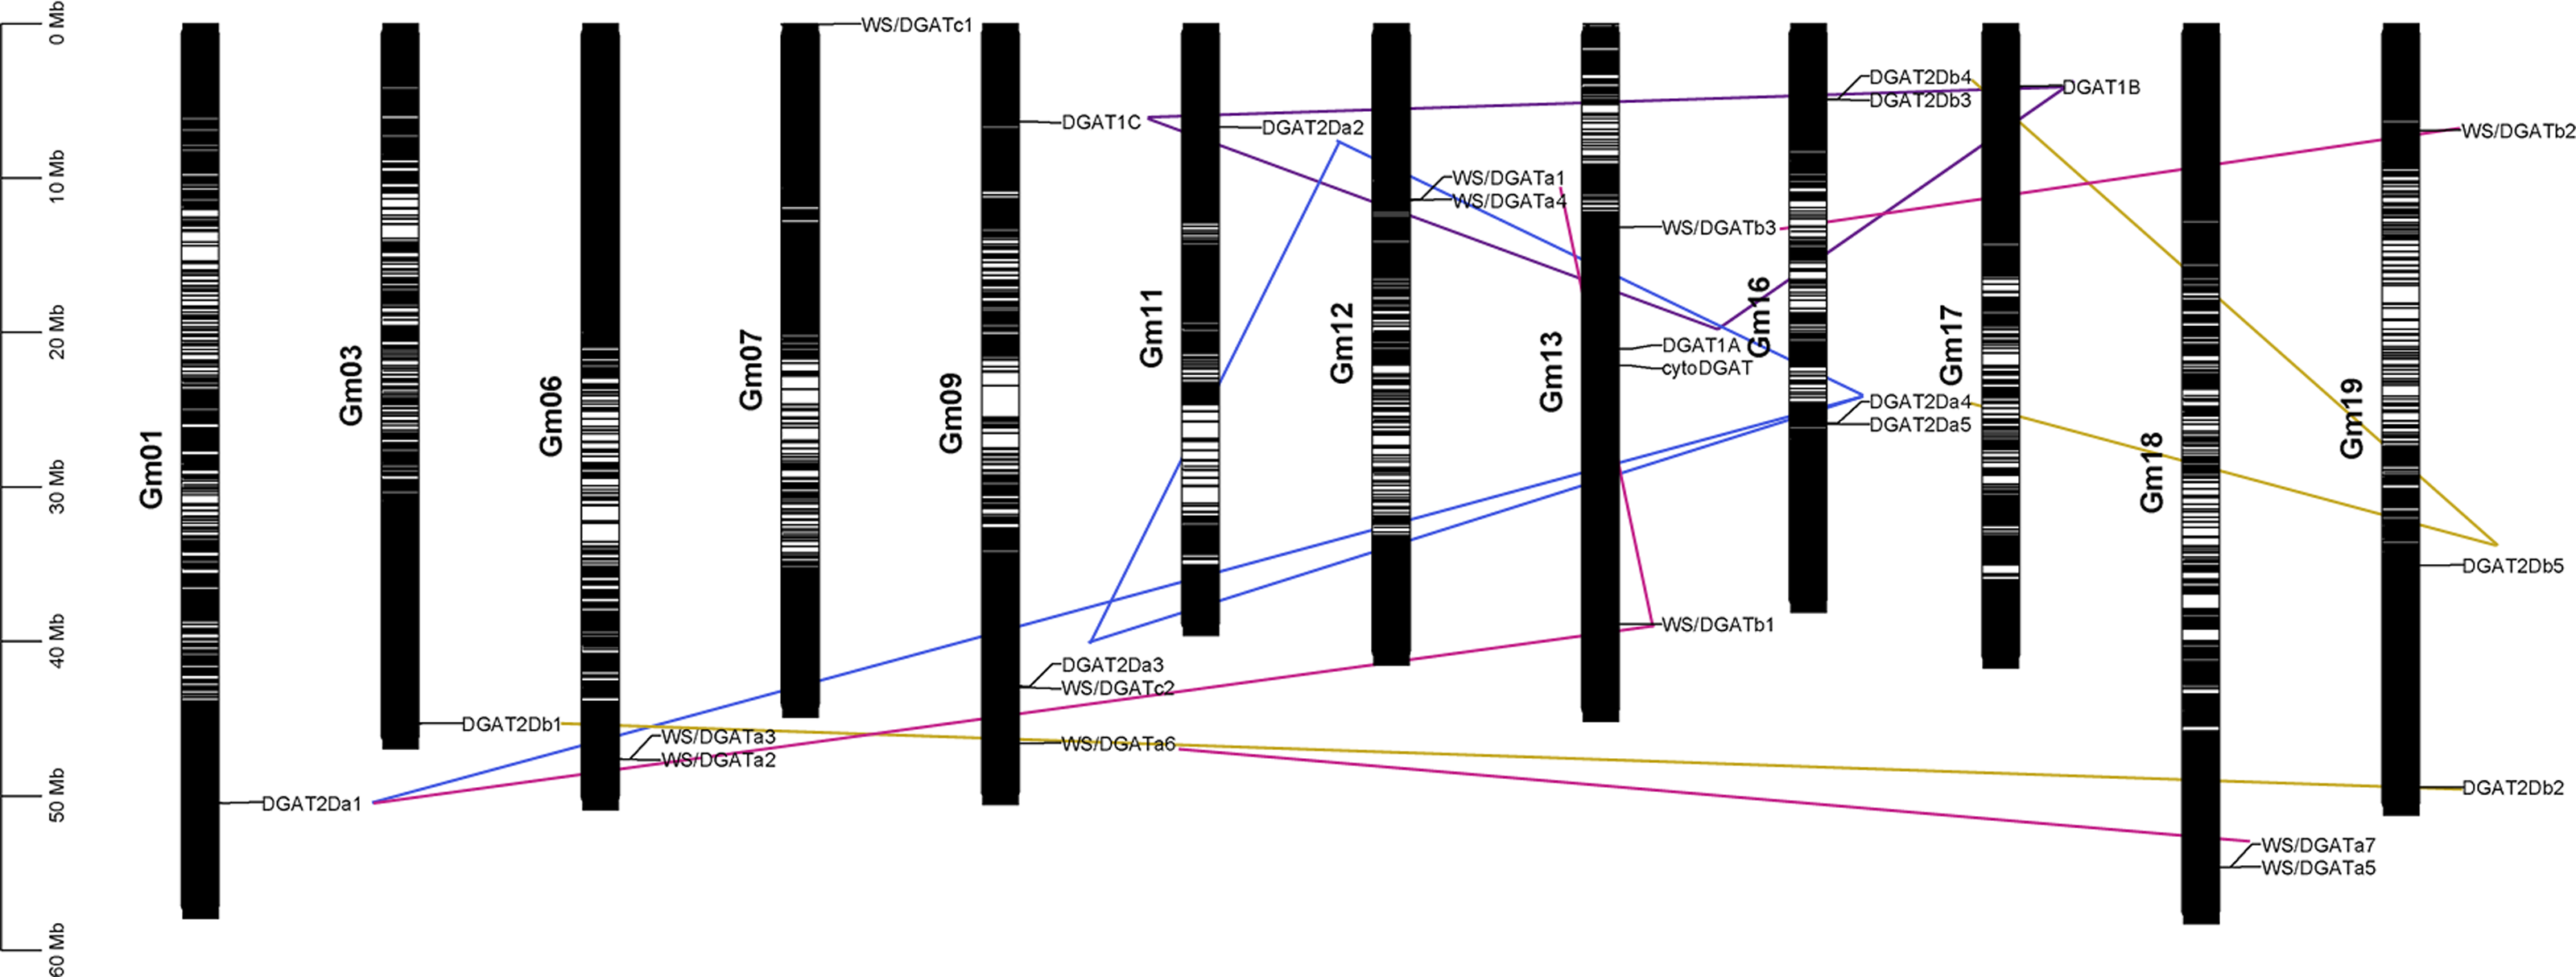
Synteny and collinearity is used to clarify angiosperm evolution and reveal patterns of differential gene loss after genome duplication and different gene retention associated with evolution of some morphological complexity (Tang et al., 2008). Furthermore, DGAT2a1, DGAT2a2, DGAT2a3, and DGAT2a4 showed collinearity, whereas DGAT2a5 was only collinear with DGAT2a4. In turn, DGAT2b1 and DGAT2b2 were collinear, and DGAT2b 4 was collinear with DGAT2b 3 and DGAT2b 5. Furthermore, WS/DGAT a6 and WS/DGAT a7 were collinear, and WS/DGAT b1 was collinear with WS/DGAT a1 and WS/DGAT a3. The results of collinearity analysis show that DGAT subfamilies evolved independently. Meanwhile, gene duplication and orphan genes occur in subfamilies. A collinear relationship was also found between WS/DGAT b2 and WS/DGAT b3. Due to the chromosome doubling event in soybean evolution, chromosome mapping and collinearity can help us analyze which genes are generated by chromosome reduplication and which genes are generated by DNA fragment doubling. Genes with collinearity may have come from the same original gene during gene evolution.
| Duplicated pair | Ka | Ks | Ka/Ks | P-Value | Divergence Time | Selection pressure | |
|---|---|---|---|---|---|---|---|
| DGAT1A | DGAT1B | 0.17 | 0.16 | 1.04 | 0.75 | 0.16 | |
| DGAT2a1 | DGAT2a4 | 2.89 | 2.55 | 1.13 | 0.01 | 2.81 | |
| DGAT2a1 | DGAT2b1 | 3.02 | 1.25 | 2.43 | 0 | 2.55 | |
| DGAT2a1 | DGAT2a3 | 5 | 1.09 | 4.59 | 0 | 3.91 | |
| DGAT2a2 | DGAT2b1 | 3.19 | 2.48 | 1.28 | 0.67 | 3.02 | |
| DGAT2a3 | DGAT2b2 | 2.09 | 4.15 | 0.5 | 0 | 2.53 | purifying |
| DGAT2a3 | DGAT2b5 | 2.74 | 4.08 | 0.67 | 0.15 | 3.04 | purifying |
| DGAT2a3 | DGAT2a4 | 2.85 | 1.16 | 2.45 | 0 | 2.43 | |
| DGAT2a3 | DGAT2b3 | 5.02 | 1.66 | 3.03 | 0 | 4.15 | |
| DGAT2a4 | DGAT2b5 | 2.43 | 4.11 | 0.59 | 0.19 | 2.81 | purifying |
| DGAT2a4 | DGAT2b3 | 2.7 | 2.57 | 1.05 | 0.87 | 2.67 | |
| DGAT2a4 | DGAT2b2 | 5.07 | 2.18 | 2.32 | 0.02 | 4.31 | |
| DGAT2a5 | DGAT2b1 | 2.29 | 1.44 | 1.6 | 0.03 | 2.1 | |
| DGAT2b1 | DGAT2b2 | 0.17 | 0.14 | 1.21 | 0.15 | 0.16 | |
| DGAT2b1 | DGAT2b5 | 2.49 | 1.55 | 1.6 | 0.01 | 2.25 | |
| DGAT2b1 | DGAT2b3 | 5.4 | 1.81 | 2.99 | 0 | 4.41 | |
| WS/DGATa1 | WS/DGATa4 | 2.5 | 2.28 | 1.1 | 0.75 | 2.45 | |
| WS/DGATa1 | WS/DGATa5 | 3.59 | 2.1 | 1.71 | 0.01 | 3.24 | |
| WS/DGATa2 | WS/DGATa5 | 5.13 | 1.35 | 3.8 | 0 | 4.11 | |
| WS/DGATa2 | WS/DGATa4 | 5.2 | 1.26 | 4.13 | 0 | 4.13 | |
| WS/DGATa3 | WS/DGATc2 | 2.16 | 3.05 | 0.71 | 0.36 | 2.35 | purifying |
| WS/DGATa3 | WS/DGATb1 | 3.14 | 2.06 | 1.52 | 0.83 | 2.91 | |
| WS/DGATa3 | WS/DGATa5 | 3.32 | 1.71 | 1.94 | 0 | 2.92 | |
| WS/DGATa4 | WS/DGATa7 | 0.56 | 0.56 | 1 | 0.63 | 0.56 | |
| WS/DGATa4 | WS/DGATc1 | 5.18 | 1.42 | 3.65 | 0 | 4.15 | |
| WS/DGATa5 | WS/DGATa6 | 2.51 | 2.92 | 0.86 | 0 | 2.6 | purifying |
| WS/DGATa5 | WS/DGATc1 | 3.03 | 1.67 | 1.81 | 0.02 | 2.69 | |
| WS/DGATa5 | WS/DGATa7 | 5.19 | 1.33 | 3.9 | 0 | 4.26 | |
| WS/DGATa5 | WS/DGATb3 | 5.15 | 1.28 | 4.01 | 0 | 4.12 | |
| WS/DGATa6 | WS/DGATc2 | 1.63 | 3.05 | 0.53 | 0.83 | 1.95 | purifying |
| WS/DGATa6 | WS/DGATb1 | 5.22 | 1.78 | 2.94 | 0 | 4.41 | |
| WS/DGATb1 | WS/DGATb3 | 5.17 | 1.58 | 3.28 | 0 | 4.32 | |
| WS/DGATb1 | WS/DGATb2 | 5.25 | 1.15 | 4.56 | 0 | 4.22 | |
| WS/DGATb2 | WS/DGATc2 | 3.13 | 4.24 | 0.74 | 0.36 | 3.38 | purifying |
| WS/DGATb3 | WS/DGATc2 | 1.78 | 1.53 | 1.16 | 0.44 | 1.72 | |
Notes:
- Ka
-
Nonsynonymous substitution rate
- Ks
-
synonymous substitution rate
Selective pressure on DGAT genes
The replacement times of non-synonymous replacement sites (Ka) to the replacement times of synonymous site (Ks). The Ka/Ks ratio is usually used to insight the pressure on the selective evolution of each gene in the whole gene family. In this study, 35 paralogous gene pairs were determined among the DGAT genes using the Clustal W software (Table 2). Based on 6.161029 synonymous mutations for soybean per synonymous site per year, the Ka, Ks, and Ka/Ks values varied from 0.165 to 0.539, 0.138 to 4.24, and 0.164 to 4.412 Mya, respectively. Most gene pairs showed an estimated Ka/Ks >1, suggesting they are under significant positive selection pressure. Moreover, members of duplicated gene pairs seemingly indicated positive selection. For pairs DGAT2a3–DGAT2b2, WS/DGATa6–WS/DGATc2, DGAT2a4–DGAT2b5, DGAT2a3–DGAT2b5, WS/DGATa3–WS/DGATc2, WS/DGATb2–WS/DGATc2, and WS/DGATa5–WS/DGATa6, the Ka/Ks ratio was estimated at <1, suggesting purifying selection. Our syntenic analysis revealed that the soybean DGAT gene family expanded through both segmental and tandem duplications. Furthermore, most orthologous genes are distributed on different chromosomes (Gm09 contains four genes: DGAT1C, DGAT2a3, WS/DGAT6, and WS/DGAT12, and Gm13 contains four genes: DGAT1A, cytoDGAT, WS/DGAT8, and WS/DGAT10); similarly, most paralogous genes are distributed on different chromosomes (WS/DGATa3–WS/DGATa2 on Gm06, WS/DGATa1–WS/DGATa4 on Gm12, DGAT2a4–DGAT2a5 on Gm16, DGAT2b3–DGAT2b4 on Gm16, and WS/DGATa5–WS/DGATa7 on Gm18), indicating that most duplications of the DGAT gene family occur with genome replication.
Promoter analysis
Positions of promoters of 26 DGAT genes are shown in Fig. 3A. Some diverse distribution patterns of cis-acting elements were observed in the promoter region of GmDGAT genes, indicating that the DGAT gene family of soybean participates in various biological processes. The analysis of the promoter regions of the 26 DGAT genes revealed 25 cis-acting elements that were classified into three divisions (Fig. 3B): hormone response, biotic and abiotic response, and development and metabolism. Light-responsive elements occur in all DGAT gene promoters. Elements responsive to abscisic acid and light were found in the promoters of the DGAT1 subfamily. Except for DGAT2a1 and DGAT2b1, the DGAT2 subfamily members showed enriched light-responsive and MYB-binding cis-elements in their promoters. Anaerobic induction elements were found in the WS/DGATa1 gene promoters. Interestingly, although cytoDGAT does not share protein domains, it does share promoter features with other DGAT genes.
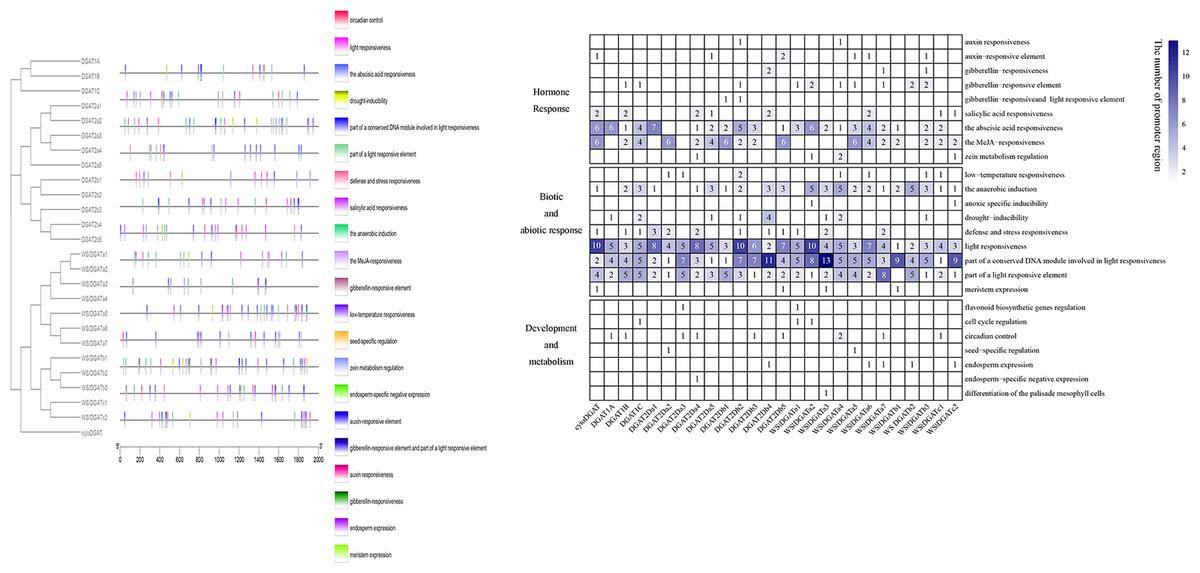
Figure 3: Promoter analysis.
Promoter structure of soybean DGAT genes. (A) Positions of various cis-acting elements in the promoter region 2,000 bp upstream of DGAT genes. The black outlined box represents DGAT genes with similar promoter structures. (B) The type and frequency of promoter element of DGAT genes. The data standardized using absolute value.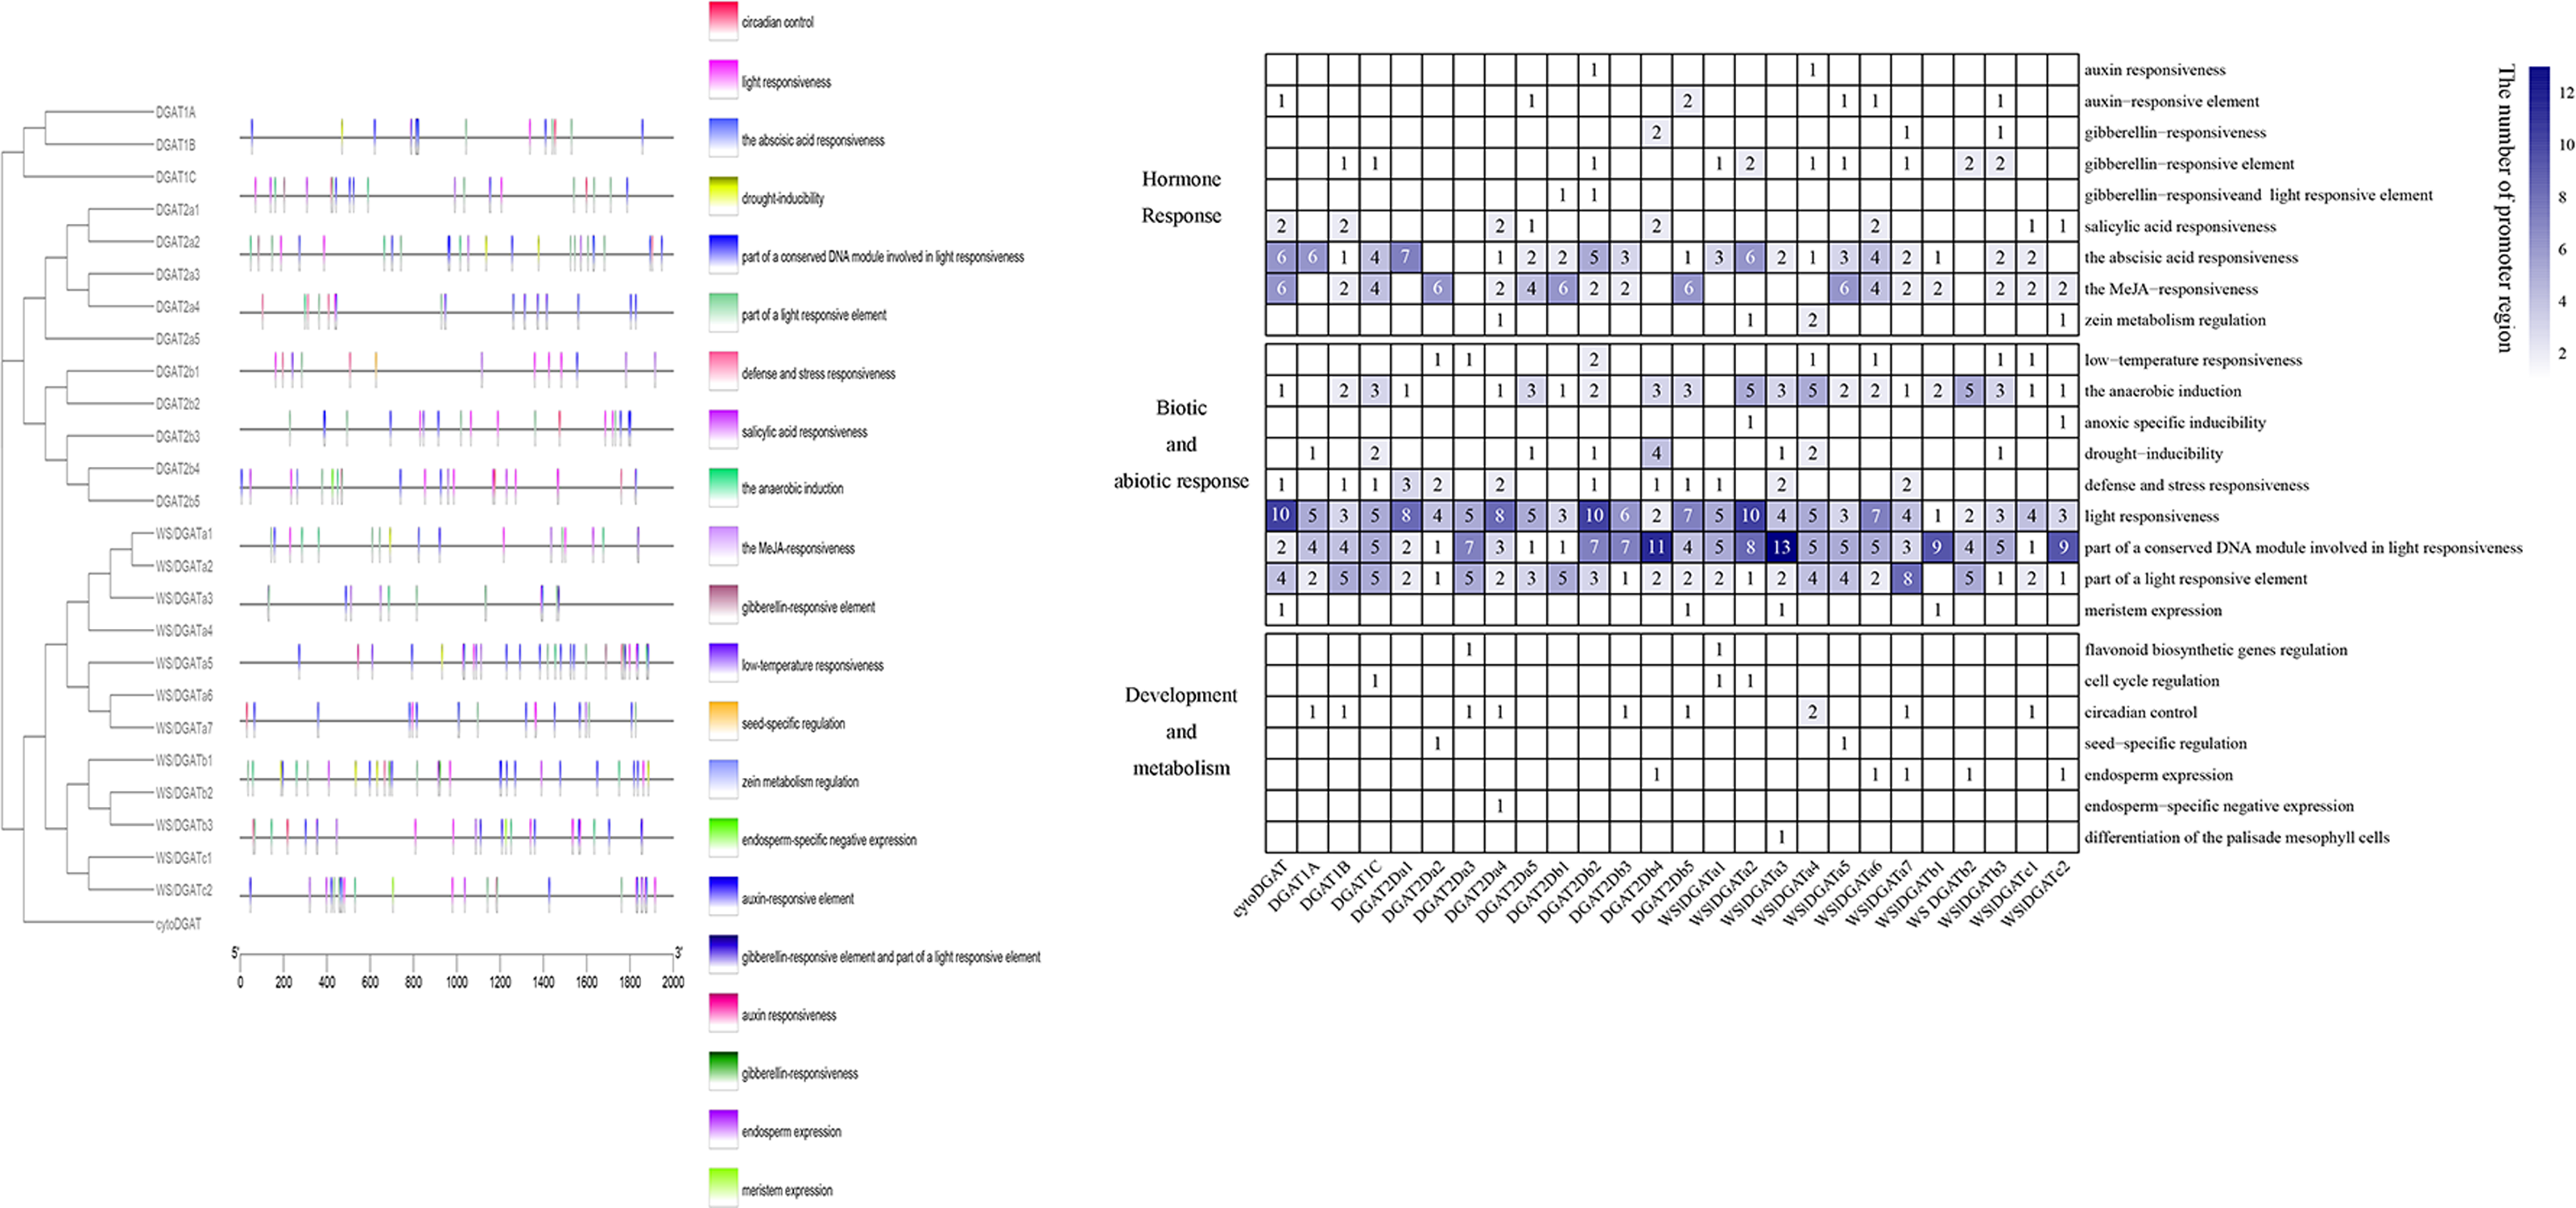
Spatial DGAT gene expression patterns
The expression patterns of soybean DGAT genes in various tissues (root, stem, leaf at different times, flower, seed (stages 1–9), nodule, and shoot) were analyzed from public databases and were found to exhibit evident tissue specificity (Fig. 4). The DGAT1 subfamily members are primarily expressed during the intermediate stages of grain development; meanwhile, the DGAT2 subfamily members are primarily expressed in the late stage of grain development. WS/DGAT subfamily members are expressed in flowers, leaves, and stems as vegetative growth proceeds. In turn, the cytoDGAT subfamily members are primarily expressed late during grain development.
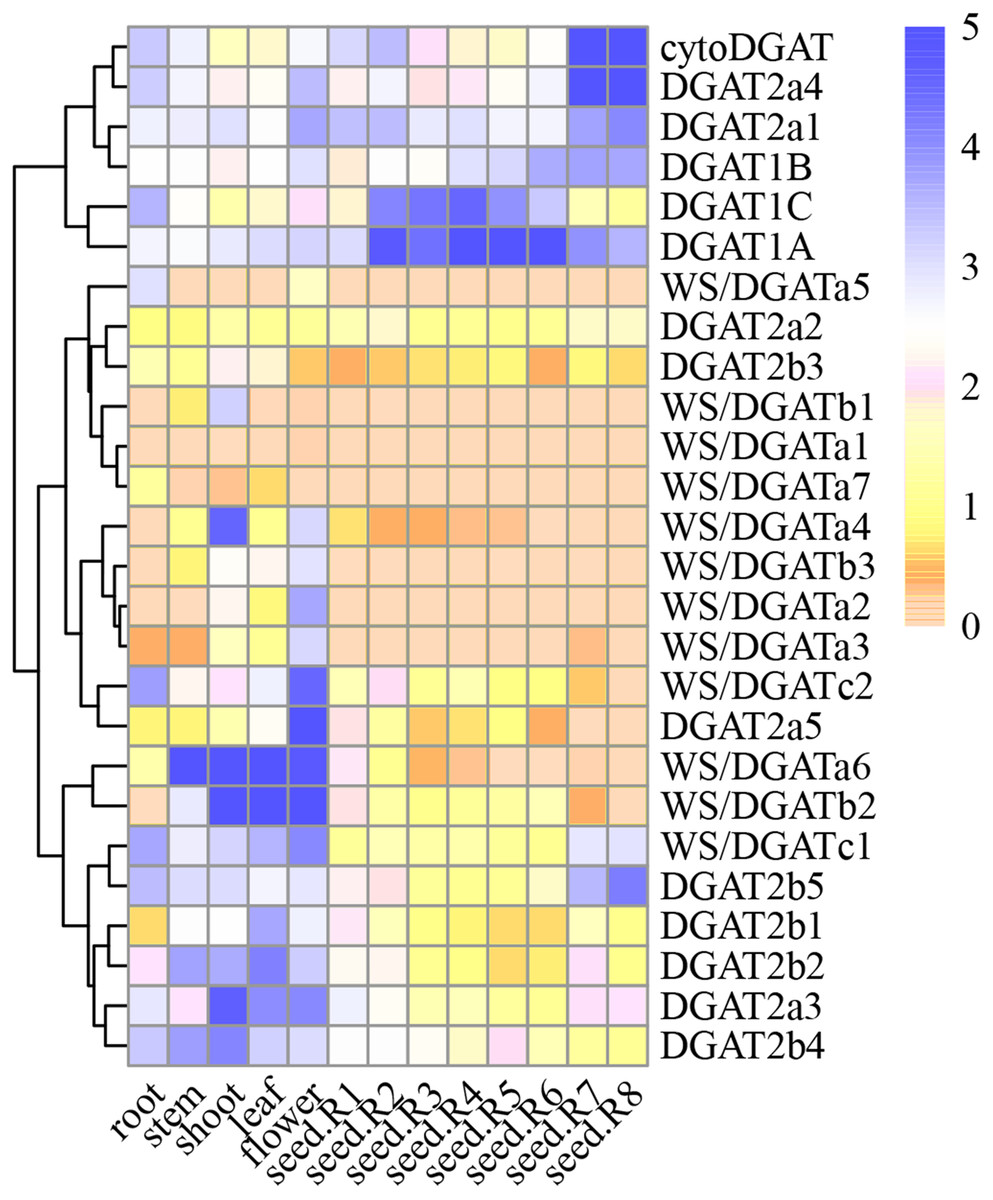
Figure 4: GmDGAT expression pattern analysis.
Expression analysis of GmDGAT genes in different tissues (roots, stems, leaves, flowers, seeds R-stages 1–8 i.e., reproductive stages from R1 to R8, from flowering to full maturity, and shoots). The data was collected from the data was collected from public repositories, and standardized using a Log2 method. The color depth in the figure represents the amount of gene expression in the sample.
In the DGAT1 gene subfamily, DGAT1a showed higher expression than DGAT1b or DGAT1c, and was expressed in most tissues. The expression of DGAT1b, similar to that of DGAT1c, was very low in most tissues, suggesting that DGAT1a is the most active gene of the DGAT1 subfamily. Meanwhile, in the DGAT2 subfamily, DGAT2a1, DGAT2a3, and DGAT2a4 showed high expression levels in the roots, stems, and flowers, respectively. In turn, DGAT2a1 showed high expression in the early stage of seed formation, whereas DGAT2a4 showed high expression in the late stage of seed formation. DGAT2b2, DGAT2b4, and DGAT2b5 were highly expressed in various tissues. According to the correlation between DGAT2b1 and DGAT2b2, the latter was considered the most important gene among them. As for DGAT2b3, DGAT2b4, and DGAT2b5, the highest level of expression was observed in the mature stage of seed formation; hence, the important gene in this cluster could not be inferred. The expression of WS/DGATa1, WS/DGATa2, WS/DGATa3, WS/DGATa4, WS/DGATa5, and DGAT2a7 in various tissues was very low, whereas that of WS/DGATa6 was very high in stems and leaves.
Considering that a waxy layer covers the outermost surface of the primary aerial plant tissues to reduce water loss, WS/DGATa6 was inferred to be the important gene in this cluster. WS/DGATb2 was highly expressed in the stems, leaves, and flowers, and it was the most highly expressed of the three genes in the WS/DGAT b cluster. Expression of WS/DGATc1 in all tissues analyzed was higher than that of WS/DGATc2. The 12 genes of the WS/DGAT subfamily were highly expressed in stems, leaves, and flowers, suggesting the involvement of this family in the increased production of wax esters in these tissues. Furthermore, the cytoDGAT gene showed a very high level of expression in the mature stage of seed formation and the highest expression level among all gene families during seed formation at stages R7 and R8. Finally, the expression of WS/DGATA1, WS/DGATA2, and WS/DGATB1 in various tissues was very low; therefore, we speculate that these may be pseudo or redundant genes.
Expression of DGAT genes
To further investigate the possible functions of GmDGATs, qRT-PCR was used to measure the expression patterns of nine genes highly expressed in subfamilies, in four tissues (root, leaf, stem, and flower), and six stages of soybean embryo (Fig. 5). Nine GmDGATs were expressed in the ten tissues, with strong tissue-specific expression patterns. Expression analysis of the GmDGAT gene family (Fig. 5) showed that the GmDGAT1 subfamily members are gradually expressed in maturing pods; in turn, CtyoDGAT subfamily members are mainly expressed in the stem meristems, leaves, and mature pods, while GmDGAT2a1 is expressed in leaves, 10 days after flowering (DAF) pods, and 20 DAF pods. As for GmDGAT2b1, this gene is expressed in flowers, stems, and leaves, and the GmWS-DGAT subfamily members are expressed in roots, flowers, stems, and leaves.
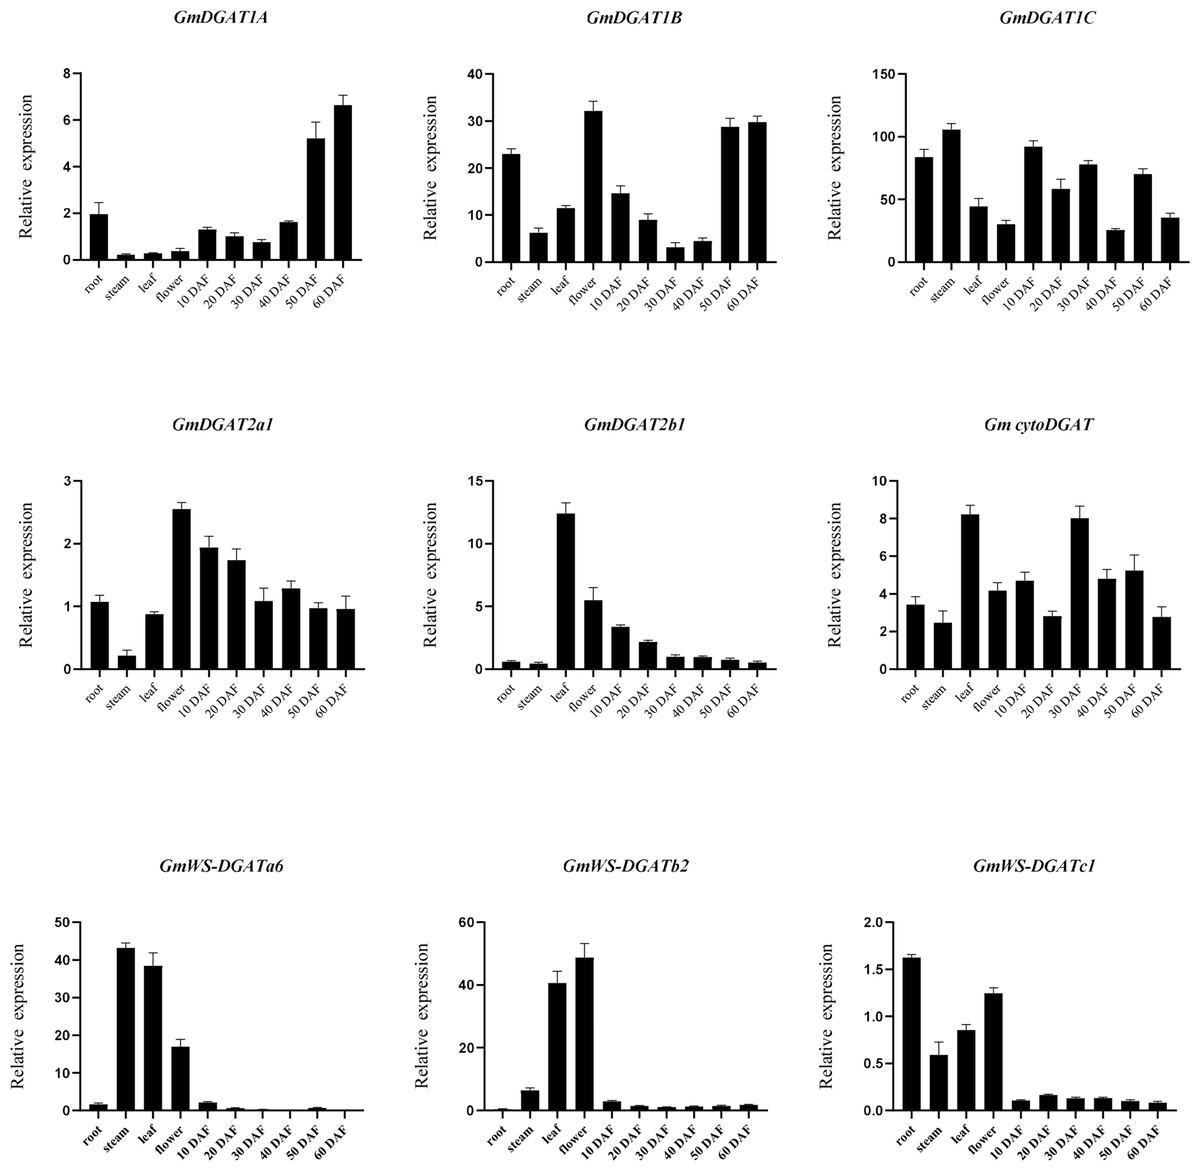
Figure 5: RT-PCR analysis of GmDGAT genes.
RT-PCR analysis was performed based on the tissue/organ-specific expression pattern of GmDGAT (root, stem, leaf, flower, and developing grain at 10, 20, 30, and 40 days after flowering (DAF)). The transcript levels were normalized and expressed relative to the reference GmAction gene. Three biological and three technical replications were analyzed using RT-qPCR. Data are the mean ± standard error of three independent replicates.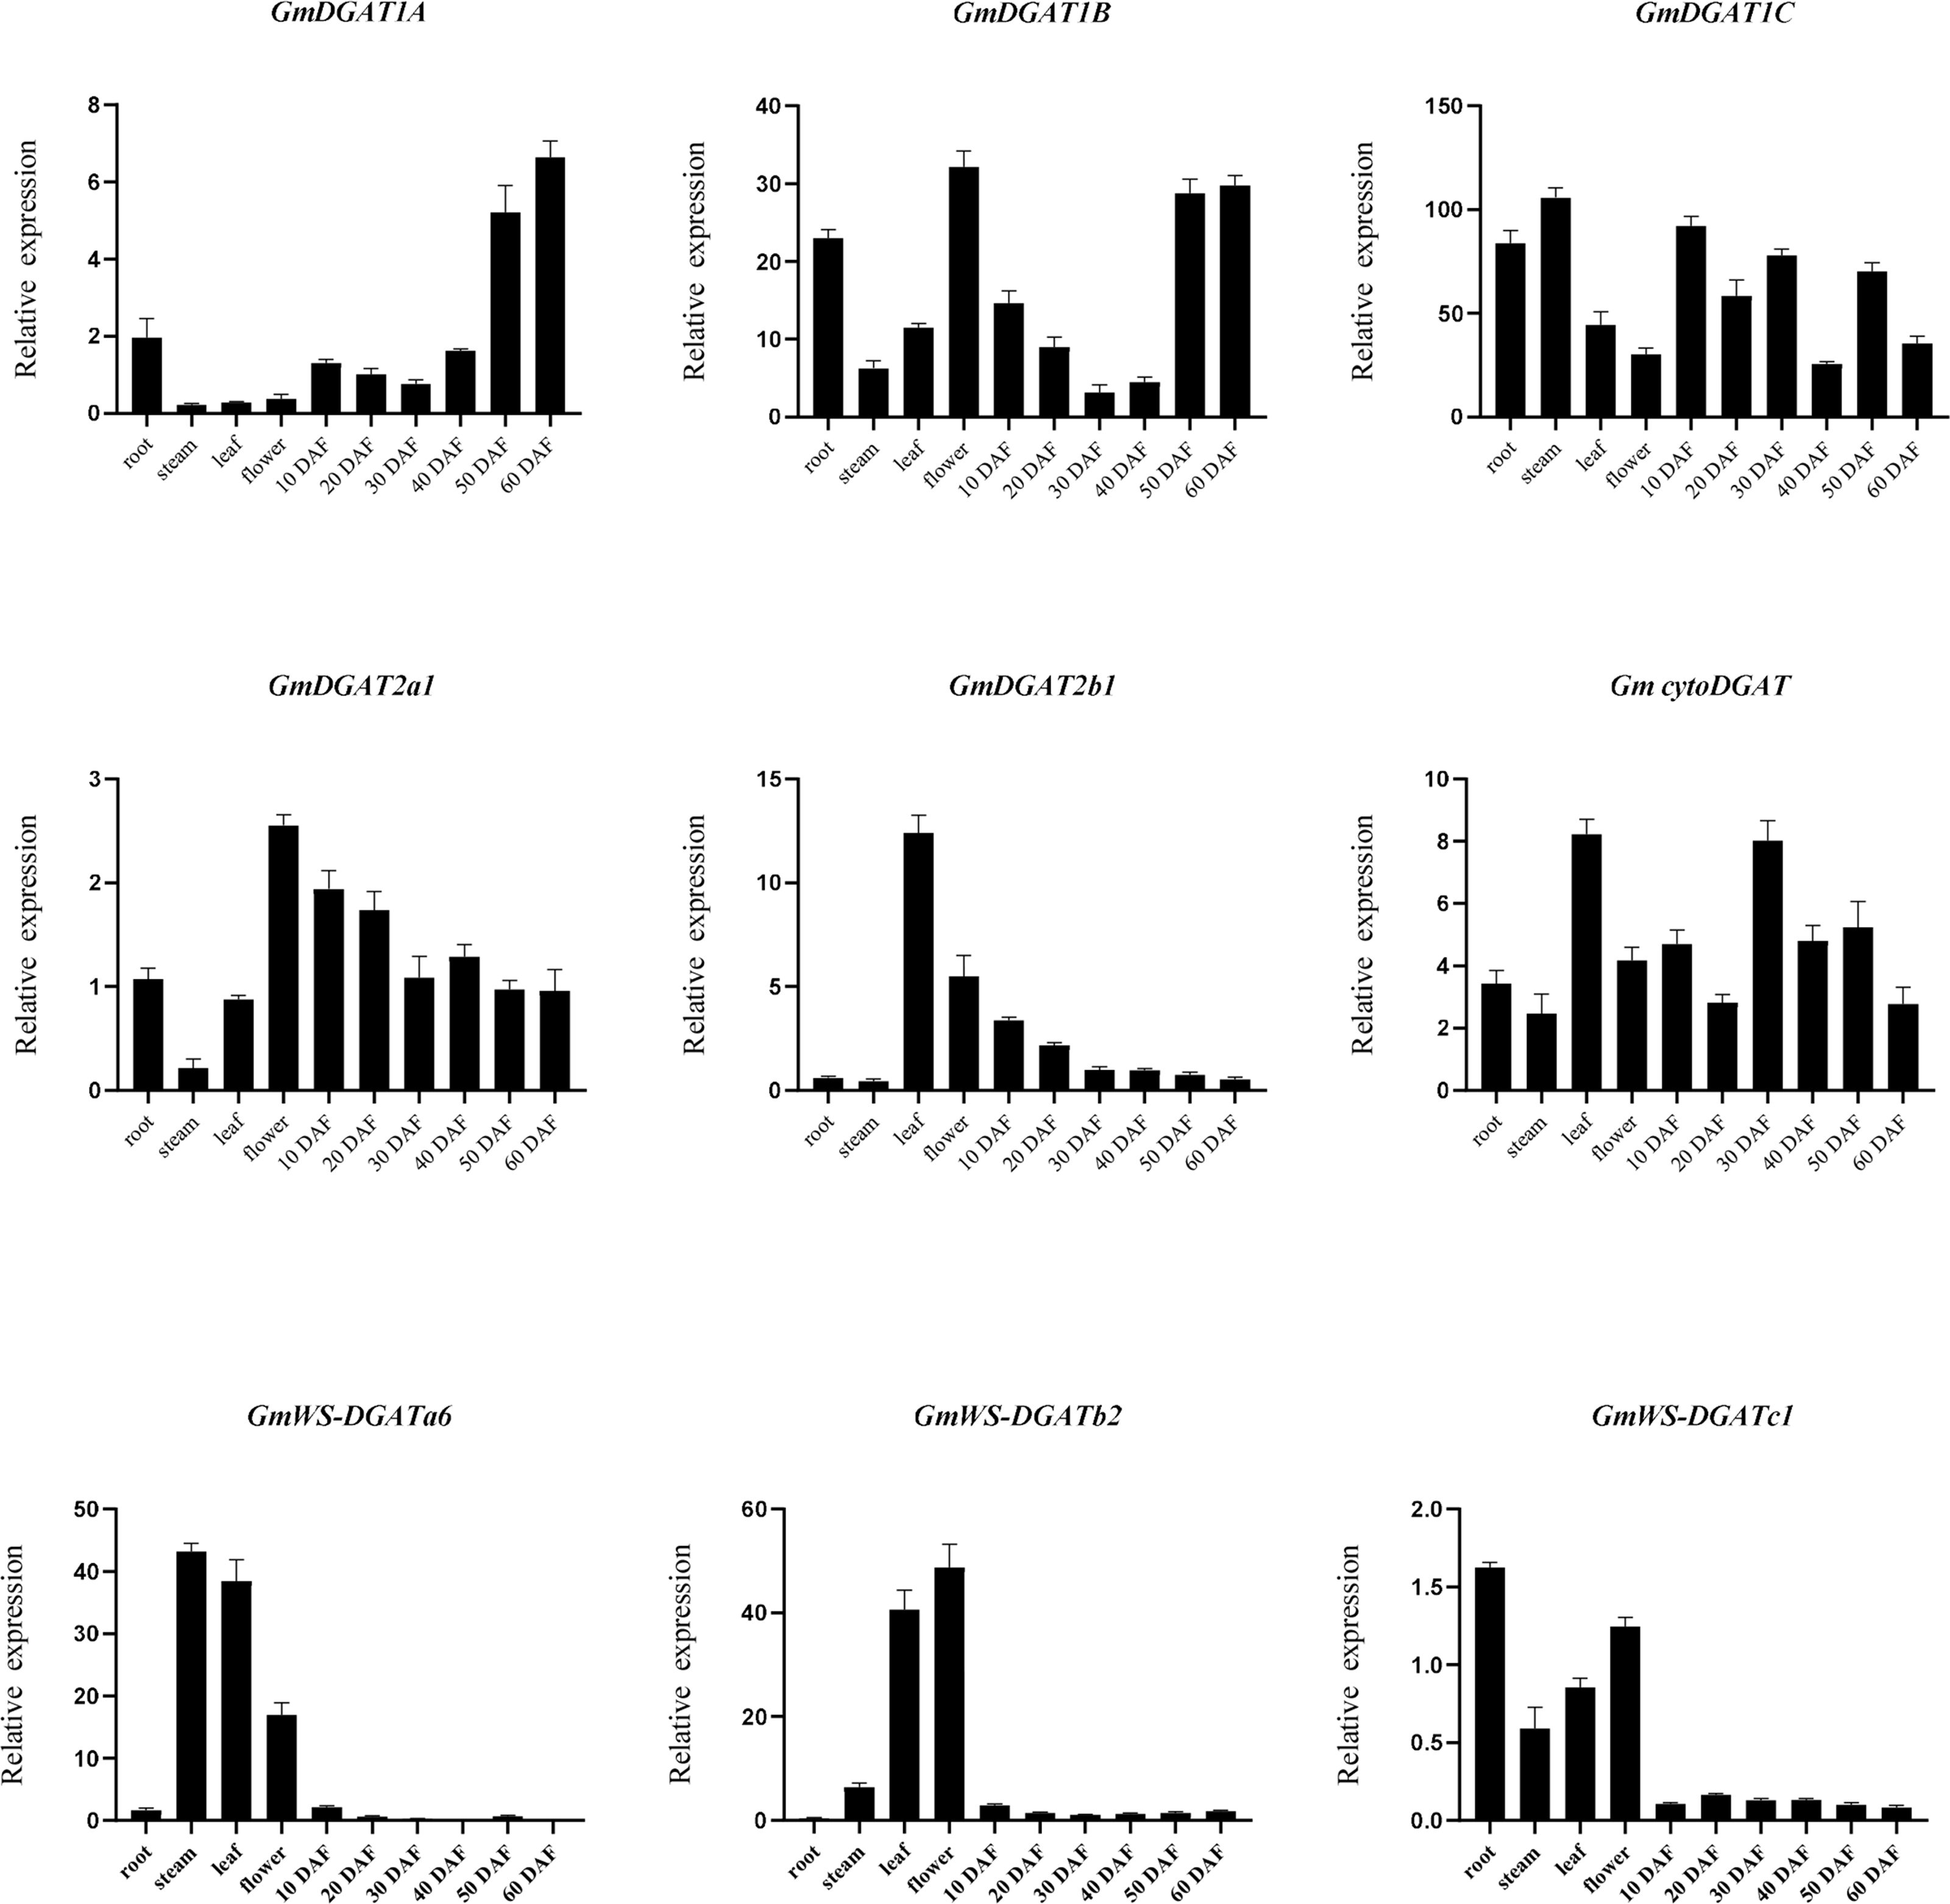
Discussion
An accurate analysis of gene family members can contribute to the scientific literature by improving the annotation of genomes. The GmDGAT gene family plays important roles in biological processes such as growth and development, seed oil accumulation, and plant stress responses. Additionally, it plays a key role in the accumulation of oil and wax and participates in the anabolism of seed oil and the metabolic process related to stress resistance in plant leaves. However, our research on the GmDGAT gene family in soybean mainly focused on the role of the DGAT1 subfamily in the accumulation of soybean oil. The number of DGAT2 subfamilies and their relationships remain unclear, with only a few reports on the WS-DGAT family and limited research on cytoDGAT. In this study, we performed genome-wide detection and characterized 26 putative DGAT proteins within four subfamilies. Further, we identified the number of genes in each subfamily and found differential gene sequences, structures, and conserved variation themes.
GmDGAT2a2, G.max Wm82.a4.v1—Glyma.11G088800.1 CDS has an annotation that does not have a start codon and truncation at the 5′ end of the CDS, relative to other closely related genes. It is truncated by approximately 103 nt from the 5′ end of the CDS. This missing region of the CDS is present in the genomic sequence, but there is a 1-nt deletion that disrupts the reading frame, suggesting that it is a pseudo gene. GmDGAT2a4, G.max Wm82.a4.v1—Glyma.16G115700.1 CDS has an incorrect annotation. The CDS has an insertion of approximately 30 nt due to an incorrect intron junction in the annotation. The error is highlighted by alignment with two EST sequences (CA953238.1 and BQ299536.1) and by the fact that it has an insertion of approximately 10 amino acids that is not shared by the closely related genes in the gene family.
WS/DGATa1, G.max Wm82. a4. v1 — Glyma.12G114400.1. In this case, the transcription data annotation is incorrect. This CD has 1596 bases, and the transcribed protein with 478 amino acids is different from the transcriptome data of 750 bases and 249 amino acids.
WS/DGATa4, G.max Wm82.a4.v1—Glyma.12G114900.1 has a base deletion at 5′UTR. It may be an error of continuous base sequencing.
Some members of the gene family have unusually large introns >5,000 bp. Thus, for example, GmDGAT1C, G.max Wm82.a4.v1— Glyma.09G065300.1 CDS has a 13,525-bp intron between introns 9 and 10. GmDGAT2a4, G.max Wm82.a4.v1— Glyma.16G115700.1 CDS has a 7971-bp intron between introns 5 and 6. GmDGAT2b1, and G.max Wm82.a4.v1— Glyma.03G243700.1 CDS has a 8480-bp intron between introns 9 and 10.
Arabidopsis contains one DGAT1 (AT2G19450) gene (Bouvier-Nave et al., 2000; Jako et al., 2001), one DGAT2 (AT3G51520) gene (Aymé et al., 2014), one cytoDGAT (At1g48300) gene (Aymé et al., 2018) and no fewer than 11 WS-DGAT gene copies (Li et al., 2017). According to Rozana’s research report (Rozana et al., 2018), the oil palm genome contains three, two, two, and two distinctly expressed functional copies of the DGAT1, DGAT2, DGAT3, and WS/DGAT genes, respectively. Compared with these two plants, the soybean genome contains three, ten, one, and twelve distinctly expressed functional copies of the DGAT1, DGAT2, DGAT3, and WS/DGAT putative genes, respectively. Although DGAT1 and DGAT2 are functionally convergent as they acquired similar types of acyltransferase activity involving diacylglycerol substrates, they are otherwise structurally very distinct from each other. It therefore seems likely that these two enzymes originally evolved separately (Turchetto-Zolet et al., 2011). DGAT3 and WS/DGAT have very different evolutionary paths from DGAT1 and DGAT2 and seem to originate independently of each other (Turchetto-Zolet et al., 2016). As the main oil crop, to improve the oil yield and quality, it is necessary to perform identification and expression analysis of GmDGAT gene family in soybean.
The heatmap analysis shows the expression pattern for the GmDGAT families within transcriptome libraries, loaded from the public library. Genes with high expression in each family were selected for RT-PCR verification. Expression data and cis-regulatory element prediction revealed the biological function of GmDGAT in regulating plant development and resistance. Specific gene expression patterns in different tissues of each subfamily were consistent with the corresponding protein function. Genome-wide identification and analysis of the GmDGAT gene family in the soybean (G. max) genome provided novel insights into the potential functions of GmDGAT genes.
In this study, a total of 26 DGAT putative genes were identified, and they were divided into four gene subfamilies (Table 1). Each subfamily showed similar exon and intron numbers, conserved motifs, and gene structure, but the conserved motifs differed among subfamilies, indicating that the same subfamily plays a similar role in biological functions (Fig. 1). Chromosome localization and collinearity analysis showed that the generation of gene subfamilies was associated with chromosome replication (Fig. 3), which may be due to whole genome duplication during evolution (Schlueter et al., 2007). In the process of biological evolution, gene replication events and functional differentiation are relatively important forces driving genome and species evolution. The results of selection pressure show that most DGAT genes have resulted from positive selection pressure (Table 2) and have been relatively conserved through evolution, most likely owing to the need to maintain their functional stability as enzyme proteins. Promoter analysis (Fig. 3) showed that subfamilies DGAT1 and DGAT2 contained light-responsive elements, which was related to their participation in seed oil accumulation (Chattopadhyay et al., 1998). In turn, WS-DGAT contained anaerobic-inducing elements, which are related to the formation of stress-related plant lipid membranes. The expression of GmDGAT genes showed clear tissue specificity. Further, the DGAT1 subfamily was mainly expressed in the middle stage of grain development (Figs. 4 and 5), and the DGAT2 subfamily was mainly expressed in late grain development, with the progress of vegetative growth, while WS/DGAT was expressed in flowers, leaves, and stems. The expression of each subfamily member in different tissues also reflects its corresponding biological functions in plant growth and development. Such a large number of DGAT-related genes may be due to their functional redundancy and functional differentiation in soybean during evolution to adapt to the environment, thus showing functional diversity. This phenomenon is also related to the characteristic chromosome- and genome-doubling of soybean. Our qPCR results verified the specific expression profile, and the highly expressed genes in each subfamily were closely related to their biological functions.
Conclusions
Here, for the first time, we comprehensively analyzed the soybean DGAT gene family members. In total, 26 DGAT genes were identified and found to be unevenly distributed across the soybean genome. Furthermore, these genes were categorized into four groups through phylogenetic analysis, the results of which were supported by exon–intron structure, motif composition, and conserved domain analysis. We identified 25 cis-elements in the DGAT promoter regions, all of which were associated with responses to plant hormones and light, resistance, seed development, and common elements. The Ka/Ks ratio of most GmDGAT genes was estimated as >1, indicating that they are under significant positive selection pressure. Gene expression analysis revealed that the DGAT family exhibits tissue-specific characteristic expression patterns, with DGAT2a4 and cytoDGAT being primarily expressed in the late stage of seed maturity and probably involved in oil accumulation in late-maturing seeds. Meanwhile, WS/DGATa6 expression in the stems and leaves was very high, probably due to the epidermal waxy layer. These findings provide important information for research on the soybean fatty acid metabolism pathways.