
APPINetwork: an R package for building and computational analysis of protein–protein interaction networks
- Published
- Accepted
- Received
- Academic Editor
- Kenta Nakai
- Subject Areas
- Bioinformatics, Molecular Biology
- Keywords
- Network clustering, Protein–protein interaction, Network, Protein complex intermediaries
- Copyright
- © 2022 Gosset et al.
- Licence
- This is an open access article distributed under the terms of the Creative Commons Attribution License, which permits using, remixing, and building upon the work non-commercially, as long as it is properly attributed. For attribution, the original author(s), title, publication source (PeerJ) and either DOI or URL of the article must be cited.
- Cite this article
- 2022. APPINetwork: an R package for building and computational analysis of protein–protein interaction networks. PeerJ 10:e14204 https://doi.org/10.7717/peerj.14204
Abstract
Background
Protein–protein interactions (PPIs) are essential to almost every process in a cell. Analysis of PPI networks gives insights into the functional relationships among proteins and may reveal important hub proteins and sub-networks corresponding to functional modules. Several good tools have been developed for PPI network analysis but they have certain limitations. Most tools are suited for studying PPI in only a small number of model species, and do not allow second-order networks to be built, or offer relevant functions for their analysis. To overcome these limitations, we have developed APPINetwork (Analysis of Protein–protein Interaction Networks). The aim was to produce a generic and user-friendly package for building and analyzing a PPI network involving proteins of interest from any species as long they are stored in a database.
Methods
APPINetwork is an open-source R package. It can be downloaded and installed on the collaborative development platform GitLab (https://forgemia.inra.fr/GNet/appinetwork). A graphical user interface facilitates its use. Graphical windows, buttons, and scroll bars allow the user to select or enter an organism name, choose data files and network parameters or methods dedicated to network analysis. All functions are implemented in R, except for the script identifying all proteins involved in the same biological process (developed in C) and the scripts formatting the BioGRID data file and generating the IDs correspondence file (implemented in Python 3). PPI information comes from private resources or different public databases (such as IntAct, BioGRID, and iRefIndex). The package can be deployed on Linux and macOS operating systems (OS). Deployment on Windows is possible but it requires the prior installation of Rtools and Python 3.
Results
APPINetwork allows the user to build a PPI network from selected public databases and add their own PPI data. In this network, the proteins have unique identifiers resulting from the standardization of the different identifiers specific to each database. In addition to the construction of the first-order network, APPINetwork offers the possibility of building a second-order network centered on the proteins of interest (proteins known for their role in the biological process studied or subunits of a complex protein) and provides the number and type of experiments that have highlighted each PPI, as well as references to articles containing experimental evidence.
Conclusion
More than a tool for PPI network building, APPINetwork enables the analysis of the resultant network, by searching either for the community of proteins involved in the same biological process or for the assembly intermediates of a protein complex. Results of these analyses are provided in easily exportable files. Examples files and a user manual describing each step of the process come with the package.
Introduction
Protein–protein interactions (PPIs) are central to many cellular processes. PPIs are identified and characterized experimentally by different methods which determine whether two proteins make physical contact or if they belong to a transient or permanent complex. There are advantages and limitations to any method of identifying and measuring PPIs, reviewed by Snider et al., 2015. Well-known drawbacks of some methods are the identification of proteins that interact in the experimental conditions but not in a biological context (false positives) or failing to identify known or probable interactions that are biologically significant (false negatives). To fully appreciate the range of PPIs that are possible within the predicted proteomes of several model organisms (Tran, Hamp & Rost, 2018), it is of interest to supplement the information on experimentally identified PPIs with PPI predictions (Humphreys et al., 2021).
PPI data is stored in repositories of various formats. The experimental results or computing methods used to identify or predict PPIs are diverse. In addition, the IDs and descriptions are not comparable from one database to another. To ensure easy access to the data and reliable outputs, the Human Proteome Organization (HUPO) initiative (Orchard & Hermjakob, 2008) and the International Molecular Consortium (IMEx) (Porras et al., 2020) have defined guidelines including accepted terminology and standardized data formats that should be used by authors reporting PPIs. Many curators have already adopted these principles for handling the data which is greatly facilitating exchanges and comparisons, although some disharmony still exists.
The Universal Protein Resource UniProt (Apweiler et al., 2004; The UniProt Consortium, 2018) is a collection of sequences with functional annotations and diverse information about each protein. The nomenclature and vocabulary are standardized, and various formats are available. This rich and user-friendly resource provides the reference proteome of species and several feature viewers that summarize and give access to data on localization, interactions, and molecular structures.
There is a large variety of biomolecular interaction databases. Some are specific to a particular type of interaction, others focus on a given organism type (fly, yeast, bacteria), or disease (Miryala, Anbarasu & Ramaiah, 2018). In this article, we will only consider some of the most frequently used PPI databases. The BioGRID database of physical, genetic, and chemical interactions reported in various organisms is updated monthly (Oughtred et al., 2019; Oughtred et al., 2021). The data can be downloaded in multiple formats, and more tools and resources are provided for analysis. The iRefIndex database (Razick, Magklaras & Donaldson, 2008) is a secondary database that collates non-redundant data on interactions from freely available sources. A confidence score is calculated for each accession. The open-source IntAct database provides interaction data derived from literature curation or direct submission as well as interactomes from different species or datasets. APID (Alonso-López et al., 2019) provides curated interactomes of 400 organisms based on PPI information from six primary databases of molecular interactions and experimentally resolved 3D structures. APID also includes a data visualization tool. APID’s user-friendly and intuitive interface can be used to look for physical, genetic, or predicted interactions alongside expression or localization data from an input set of genes of interest. The Proteomics Standard Initiative Common QUery InterfaCe (PSICQUIC) (Aranda et al., 2011) aggregates molecular interaction data from 23 servers. In the first PSICQUIC version, each PPI was described by 15 fields corresponding to PSI-MITAB2.5 format. Since this first version, other file formats give more information about the reported interactions and more facilities to the users. STRING, one of the most popular tools for representing PPI networks (Szklarczyk et al., 2019), aggregates details of experimental or predicted physical and functional interactions from other databases. In total, STRING provides protein interaction data with associated confidence scores from 5090 organisms. The network resulting from the user’s request can be easily exported in different formats of text and image files.
The analysis of protein interaction networks (PIN) is of great interest when studying biological activities, pathways, or drug targeting and is the reason why many web tools or plugins for visualization and analysis of protein interaction networks have been developed. For example, Pathguide (Bader, Cary & Sander, 2006) provides a list and brief description of 702 pathways and molecular interaction resources.
Cytoscape (Shannon et al., 2003) plugins have been developed to export PPI data and visualize PPI networks (Martin et al., 2010; Doncheva et al., 2019; Holmås et al., 2019; Legeay et al., 2020). Here, we will only present three of them because their functionalities are close to those of the package we developed. GeneMANIA (Warde-Farley et al., 2010) imports an interaction network from a list of genes with their annotations and putative functions. The interactions of the network are associations, i.e., the most closely related genes to a query gene set are identified using guilt-by-association. With this approach, new members of a pathway or a complex are found and weights are assigned to the interactions. From a combination of the most trusted datasets from UniProt, Intact, and other curated sources, BioGateway (Antezana et al., 2009) provides a network of interactions of different types, among which are PPIs annotated with GO terms. The interactome browser mentha (Calderone, Castagnoli & Cesareni, 2013) provides interactomes of eight model species based on PPI data from databases set up by the IMEx consortium.
Other related tools have been developed in the R programming language (Ihaka & Gentleman, 1996) to display the shortest paths of functional interaction between proteins and are provided by Bioconductor (Gentleman et al., 2004). The package Path2PPI (Philipp, Osiewacz & Koch, 2016) helps researchers find proteins and interactions of pathways or biological processes in fully sequenced organisms for which virtually no PPI is known. With the cisPath package (Wang et al., 2015), cloud users can integrate downloaded functional information on PPI from different online databases or private data to construct, visualize, manage, and share functional protein interaction networks.
In developing these tools, the respective authors carefully considered how to benefit the most from existing data when seeking to answer different biological questions. Depending on the topic, one tool may be better than another. In their article from 2016, Pan et al. reviewed the computational approaches to analyze PINs. While the above mentioned tools successfully integrate information on first-order neighbors in the network, they do not readily deal with all the experimental second-order PPIs involved in the biological process of interest. However, to find clusters in a PPI network, it is necessary to account for the second-order PPIs.
In the present article, we describe APPINetwork, an R package for constructing PPI networks to search for (1) sets of proteins involved in the same biological process and (2) proteins or protein sub-complexes that play a role in the assembly of a protein complex (Glatigny et al., 2017). Starting from an input set of proteins, APPINetwork builds the PPI networks of the first or second-order, by using PPIs derived from all the available PPI databases and potentially any privately held data. APPINetwork thus provides the most exhaustive possible network of PPIs, whether experimental or predicted. The fact that this network integrates public and private data, makes the package particularly useful for all research teams who have identified new PPIs, and for proteomics platform groups that have accumulated large datasets of unpublished PPIs. Through a user-friendly interface, APPINetwork allows users (1) to choose the specie the user is studying from among hundred species currently included, (2) to select the queried PPI databases including any proprietary data files, (3) to select the order of network desired (first or second order), and (4) select the analysis to perform. We first present how the package is implemented and then discuss the advantages of similar tools.
Materials and Methods
Implementation
All functions of the package APPINetwork are implemented in R except for the script to search for all proteins involved in a biological process (see Fig. 1) which was developed in C (Gambette & Guénoche, 2011), and the scripts that format the BioGRID data file (see Fig. 1) and generate the ID correspondence file (see Fig. 1) which were implemented in Python. Indeed, the use of Python is optimal for writing functions for text mining large text files such as BioGRID files (Oughtred et al., 2021).

Figure 1: Overview of the APPINetwork package.
Illustration of requirements R packages (blue section), inputs (orange section): databases, UniProt file text of the studied organism and lists of proteins of interest, workflow (green section) and outputs (yellow section): all files that APPINetwork provides to the user. The “new proteins” in the green section are proteins newly identified by APPINetwork as playing a role in the biological process of interest. The “lists of proteins” in the yellow section are the lists of all proteins that make up each sub-network potentially associated with a biological process.
Minimal configuration and dependencies
The APPINetwork package can be deployed on Linux and macOS operating systems (OS). It can also be deployed on Windows with prior installation of Rtools and Python 3 (see the “readme” file). Minimal requirements are 64 bits Unix-based OS (Linux/macOS) or the 64-bit version of Windows.
Installation
APPINetwork is an R package and requires R version 3.2.0 or later versions. The package can be downloaded and installed from GitLab, directly from the R console using the R command devtools::install_gitlab(“Gnet/appinetwork”, host = “https://forgemia.inra.fr”). Its installation thus requires the devtools package (Wickham, Hester & Chang, 2019). An installation tutorial can be found in the project repository (https://forgemia.inra.fr/GNet/appinetwork). All the R packages required in APPINetwork are automatically installed.
Graphical interface
APPINetwork has a graphical user interface for users who are less familiar with using command lines. This graphical interface is based on the gwidgets package (Verzani, 2019. Graphical windows, buttons, and scroll bars allow the user to select or enter an organism name, select files, and choose network parameters or specific methods for network analysis.
Required data files
To create a network of PPIs involving proteins known for their role in the biological process of interest, APPINetwork requires different flat files. These must be prepared or downloaded beforehand.
The first file (named “input list”) contains different names or IDs (Name, UniProtID, UniProtName, alias, and Systematic Name) of the proteins involved in the biological process. To prepare this file, the user must adhere to the format presented in the user guide that comes with the APPINetwork package, available in the GitLab repository. The second file required by APPINetwork to standardize protein IDs between PPI databases is the UniProt file (in .txt format) of the proteome of the organism to study. It can be downloaded from the UniProt website (https://www.uniprot.org/, see section “Download the UniProt file” of the user guide).
The other files to download are PPI files from the databases iRefIndex, IntAct, BioGRID, and any other private or public databases chosen by the user. The package enables automatic formatting and updating of the IrefIndex, IntAct, and BioGRID databases. If the user wants to integrate other databases or personal data into the network, the files must be formatted independently before use. The PPI files should contain 15 columns as follows: UniProt identifiers for each protein (uid and alias), identification method, author of the publication, PubMed IDs, taxon name, interaction type (physical or genetic), name of the databases, and the name of the gene encoding each protein. The format is described in the user guide.
The user guide describes all the formats of the different files needed at each step. By way of illustration, some example files are provided with the user guide. The user can use them to practice using APPINetwork.
Parameters of PPI Network
Different types of networks should be built, depending on the kind of analysis to be performed. For example, to search for all proteins involved in the same biological process, the user should search for dense clusters in a network with second-order PPIs determined by physical or genetic methods ensuring there are no self-loops that may impact the clustering (see Discussion). On the contrary, if searching for assembly intermediates of a protein complex, the PPI network should be of the first-order and composed of PPIs determined by physical experiments or predicted from structural information with self-loops to account for any dimers.
APPINetwork thus offers different options to build the network before analyzing it. These options are (i) the physical or genetic experimental method used for detecting the PPIs, first or second-order PPIs, (ii) the removal of all proteins involved in only one PPI or not, (iii) the removal of proteins involved in only one second-order PPI or not, (iv) the removal of self-loops or not. Our second-order PPIs are particular because they involve two proteins that interact by two different pathways with the proteins of the input list. They thus facilitate the search for small clusters (Glatigny et al., 2011. Even with this method of constructing second-order interactions, there may be many proteins in the second-order network that are not specific to the biological system under study. This is the case when a protein in the first-order network interacts with more than a hundred proteins. To work around this issue, once the choice is made to build a second-order network, APPINetwork offers an option that filters out proteins if they interact with a number of proteins that exceeds a threshold fixed by the user.
APPINetwork analysis tools
The APPINetwork package offers two very different analysis tools. (1) The first tool can be used to search for assembly intermediates of a protein complex (Glatigny et al., 2017). The underlying hypothesis is that proteins belonging to an assembly intermediates interact with the same proteins and thus have more common partners than the other subunits of the complex. Consequently, the subunits of a protein complex (the proteins constituting the final complex) are aggregated according to the number of partners they have in common. The resulting clusters are assembly intermediates. (2) The second tool is designed to search for all the proteins involved in the biological process of interest, by searching for clusters of proteins that are strongly interconnected but weakly connected to the rest of the network (Gambette & Guénoche, 2011).
Results
To start with APPINetwork
The graphical interface of the APPINetwork menu offers the choice between five actions: (i) construct a correspondence file between different IDs; (ii) format iRefIndex, IntAct, or BioGRID PPI files; (iii) build a network; (iv) identify proteins involved in a biological process, and (v) identify the assembly intermediates of a protein complex (see Fig. 2 and the user guide). When using APPINetwork for the first time, actions (i), (ii), and (iii) must be executed successively. Indeed, formatted PPI files are required to build the network for which a correspondence file with the different identifiers is necessary. On the second use, if the user is continuing to work on the same organism, it is not necessary to execute steps 1 and 2 again. Another network can be built from another input list or from the same input list but with different parameters. In the same way, any network built with another tool, if formatted as described in the user guide, can be analyzed with APPINetwork using actions (iv) or (v).

Figure 2: Outline of analysis types of networks obtained with APPINetwork for the ELP complex of Saccharomyces cerevisiae.
With a list of the six proteins of the elongation factor of Saccharomyces cerevisiae (yellow box), the user can either build a first order network to search for assembly intermediaries (upper part), or a second order network to search for all the proteins interacting with the six proteins. To do this, he/she can use the TFit clustering algorithm.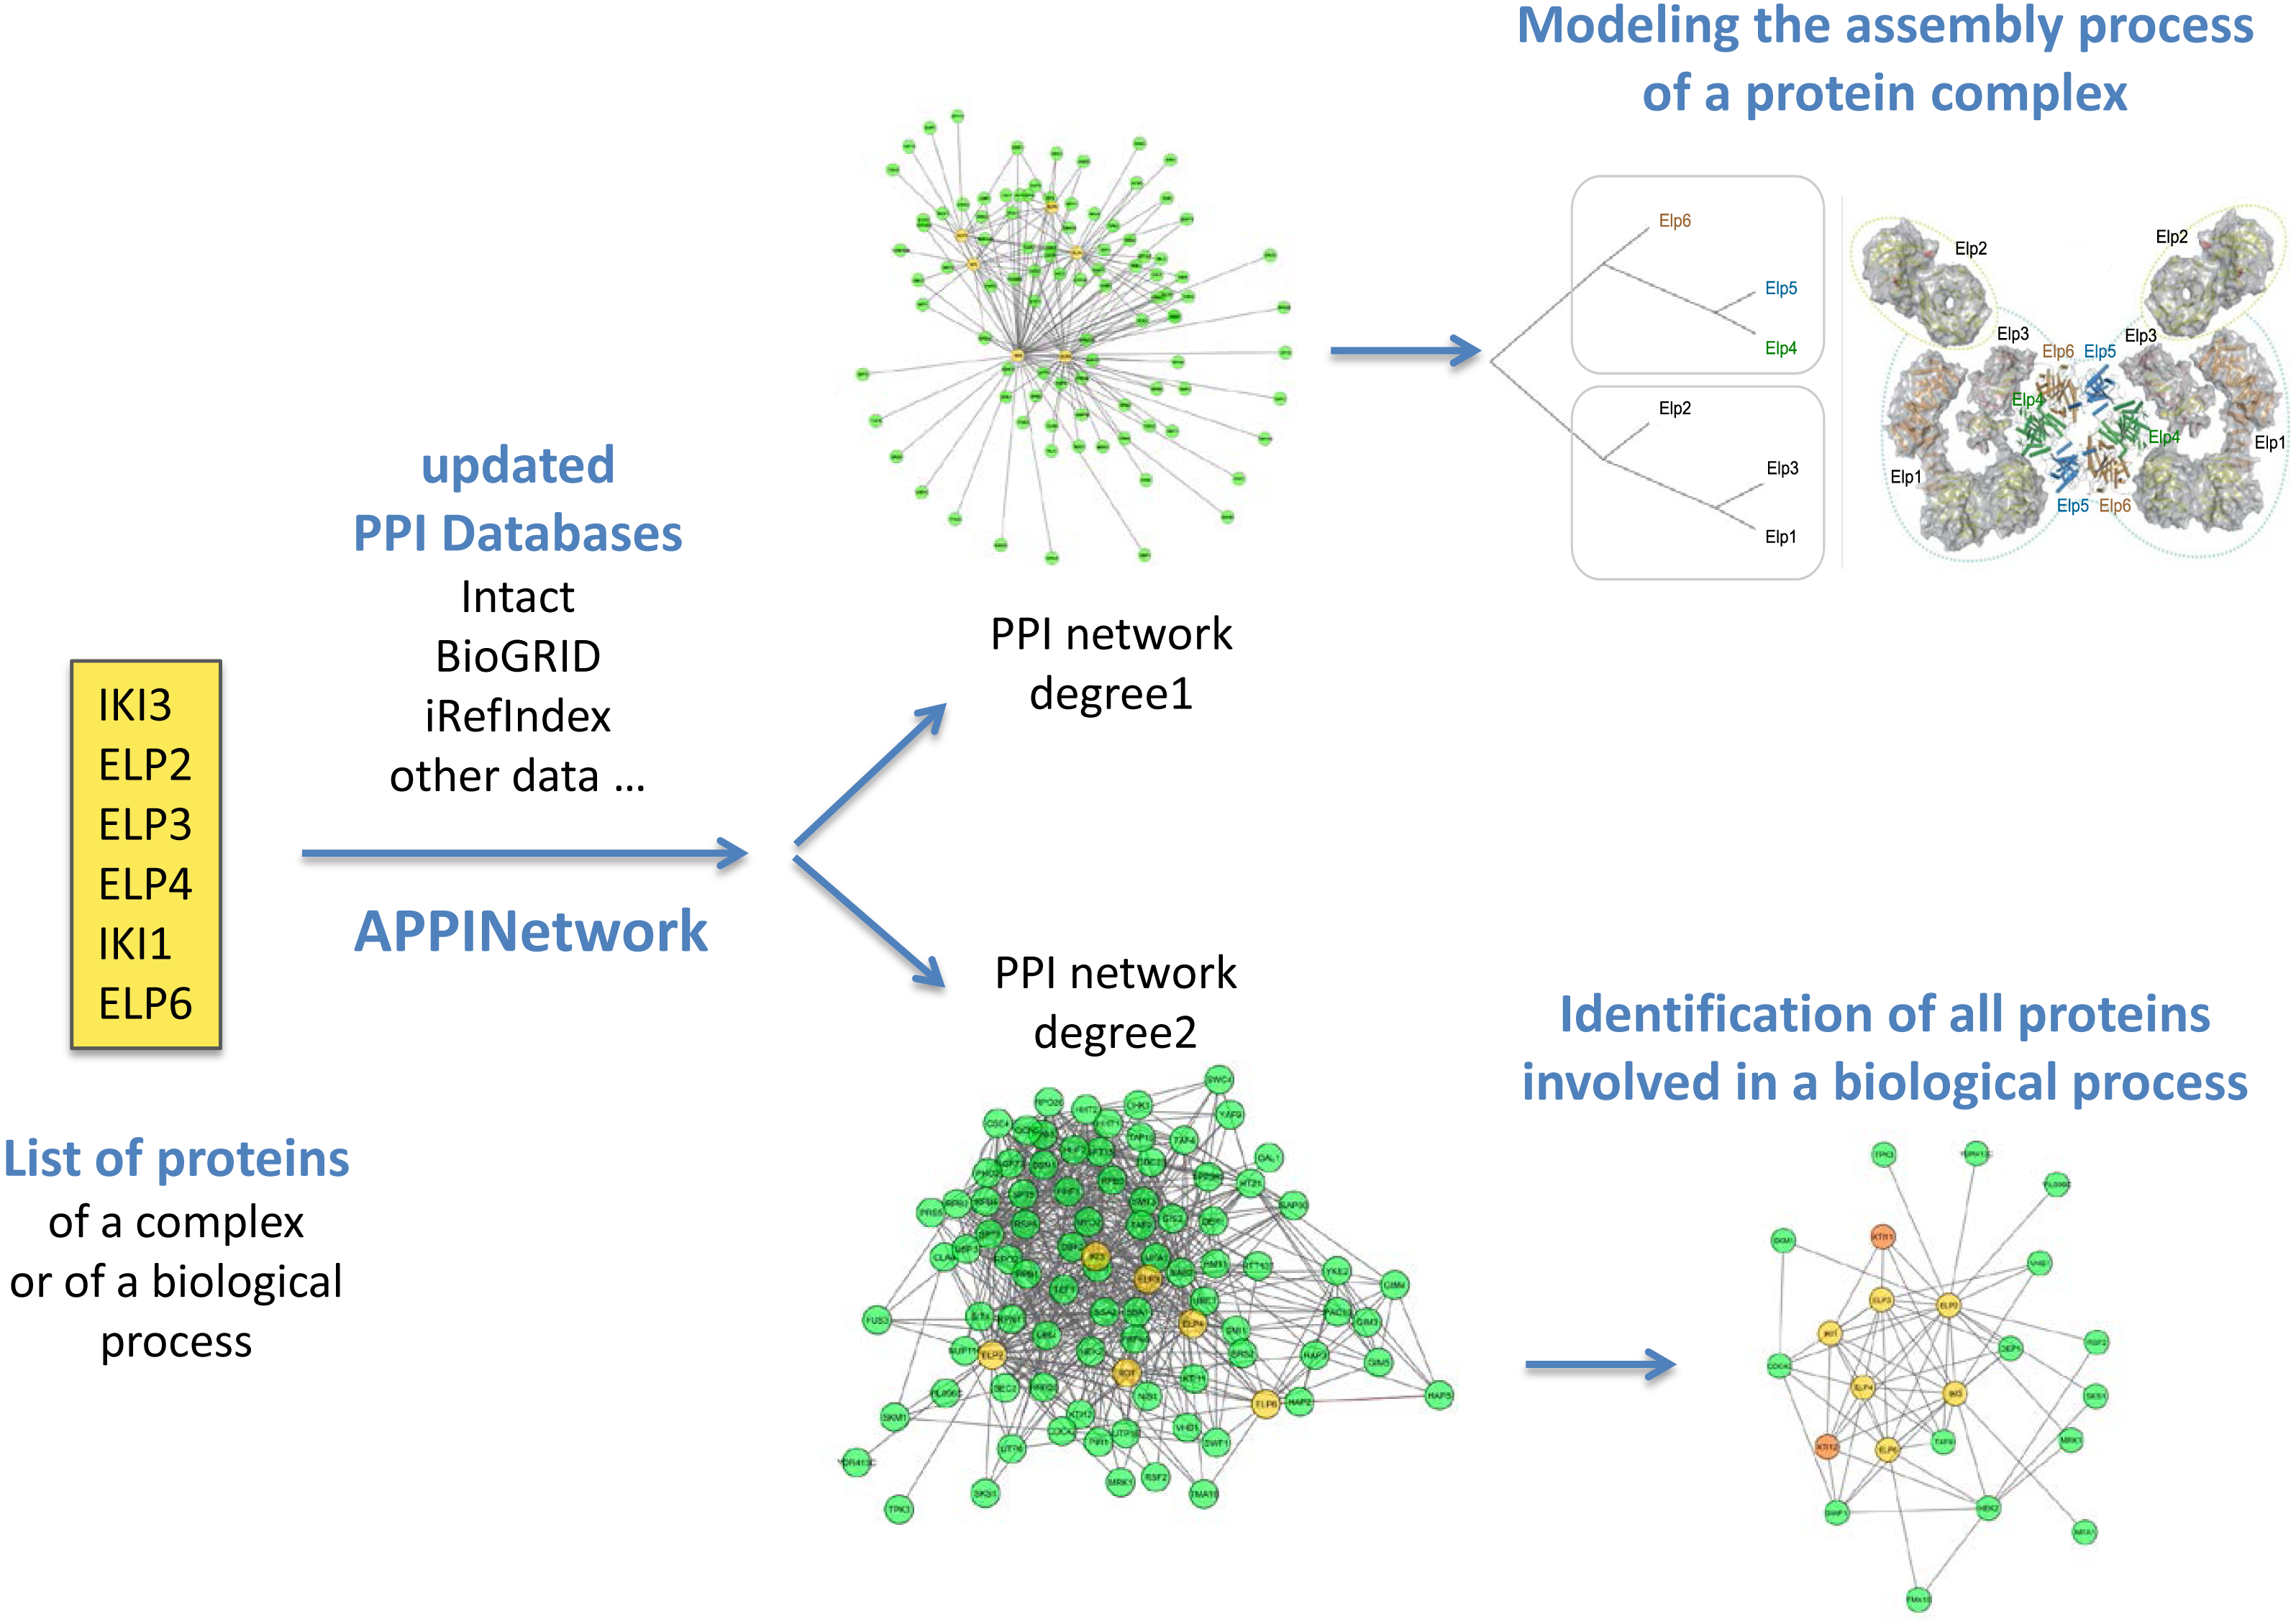
Package functionalities
Making up the correspondence file of IDs
To build a correspondence file of IDs, the user must choose one of eight organisms from the drop-down menu. Selecting the “other” option opens a second window where the name of the organism of interest can be typed in. Then, the user must select the UniProt file of the species previously saved on the computer (see Fig. 2 and the user guide). The result of this action is a correspondence file of IDs that stores all names and IDs (Gene Name, RefSeq number, Protein Name, Gene ID, BioGRID ID, UniProt IDs) of each protein of the studied proteome.
Updating and formatting of the databases
To format the PPI files previously downloaded from iRefIndex (Razick, Magklaras & Donaldson, 2008), IntAct (Orchard et al., 2014; Del Toro et al., 2022) and BioGRID (Oughtred et al., 2021) databases, the user must choose the name of the database. A window corresponding to his/her choice is then displayed, allowing the user to choose the name of the organism and the file to format. The iRefIndex file (Razick, Magklaras & Donaldson, 2008) is split into different files, each containing PPIs from a single initial database. To format a BioGRID file, the user must choose whether to keep the PPIs of putative proteins and then select the UniProt file of the organism of interest (see Fig. 2 and the user guide). The resulting formatted files have 15 columns (see the user guide). They contain only interactions between two proteins of the same strain of the studied species.
Building of the network
To build a network (see Fig. 3), the user must select the “input list” file that has been prepared in advance (see section “required files” in the section “Material and Methods”). Then the formatted PPI files are selected by clicking the “select database” button. The user must also select an ID correspondence file by clicking on the “ID correspondence file” button and choosing the organism. Finally, the user must decide whether the network should contain (a) PPIs determined experimentally by physical or genetic methods or both, (b) PPIs of the first or second order, (c) proteins interacting (whether first or second order PPI) with a single protein of the input list (termed “unique link”), (d) interactions of a protein with itself (see Fig. 2 and the user guide), and if necessary (e) indicate a maximum number of first-order protein partners.

Figure 3: Procedure to use APPINetwork.
Graphical interfaces allow the user to build and analyze a network. With APPINetwork the user can construct an ID correspondence file (green arrow); can format databases of his/her choice (red arrows); can build a network (light blue arrow). The user has to choose the parameters he/she wants to use by clicking on the interface, then he/she can analyze the network. To study the assembly process from a first order network, he/she has to choose one the six similarity scores ; from a second-order network and to study functional interactions (dark blue arrow) he/she can use TFit.
The script looks for all the PPIs involving proteins of the input list (first-order PPI) inside the formatted files of PPIs. In case of discrepancy between gene names or protein IDs, the program sends a warning to the user, who can then manually correct them. It removes redundant PPIs and records the IDs of publications mentioning each PPI. It calculates the number of these publications and records it in the file because it is an index of the reliability of the interaction. Other information related to each PPI, such as the type of experiment, the biological function of each network protein the name of the organism is also stored in the file. The network of order one or two is saved as a flat file with 13 columns containing all PPIs of order one or two and related information (see Materials and Methods), that can be exported to other analysis tools.
APPINetwork thus gives a lot of information on PPIs and offers to build a particular second-order network, which other software does not offer. The downside is that it takes time. As an example of the time required, on a laptop computer with 32 GB of memory and an Intel Core I7, the computation time was about 7 min for a network built from a database of 683,389 PPIs, with a threshold of 300 for the maximum number of partners of each protein.
Analysis of the network
To identify proteins involved in a biological process, the user has only to choose a second-order PPI network (see Fig. 2 and the user guide). The clustering method TFit then identifies small clusters of highly interconnected proteins containing proteins from the input list and other proteins potentially involved in the biological process of interest that are good candidates for validation. Results of the clustering with TFit are provided in a flat file (with the extension .clas), where clusters are numbered and are provided as a list of proteins separated by semicolons.
To identify assembly intermediates of a protein complex, the user should select a first-order network, the input list and to click on “modeling” to build the assembly model. Finally, the user should choose the metric used to model the assembly of the complex that is described in (Glatigny et al., 2017) (see Fig. 2 and the user guide). Results are provided in different files: (1) a text file (“score_distance_matrix.txt”) with a matrix of the distance values between the subunits; (2) a text file (“hc.txt”) showing how the subunits are aggregated; (3) a jpeg picture of the hierarchical tree (“tree.jpeg”); and (4) text files for each subcomplex (“Proteins_subcomplex_name.txt”), containing all proteins interacting with proteins of the subcomplex.
The computation time for both TFit and the identification of assembly intermediates is instantaneous.
Discussion
APPINetwork is more than a PPI network building tool since it also offers two clustering methods to analyze the resulting PIN. It can therefore be used to search for proteins involved in a biological process of interest or to model the assembly of protein complexes by looking for clusters in PPI networks centered on the studied process. Second-order networks can be built and analyzed as well as first-order networks. APPINetwork provides information on PPIs in a large number of species or strains while other tools or databases are focused on a limited number of model species. Biologists working on lesser studied species or strains will therefore gain from using APPINetwork.
To remove protein data that may bias the clustering of a network, APPINetwork provides filtering options that are not offered by existing tools for building and analysis of PPI networks. Indeed, many proteins that are not specific to the biological process of interest are represented in second-order networks, while they interact with only one protein in the first-order network. If such proteins are not eliminated, the analysis tends to erroneously cluster proteins that have no biological relationship. Similarly, when looking for assembly intermediates of a protein complex, it can be useful to remove self-loops, because they are penalizing for the Jaccard index of dimeric proteins, which leads to assembly models where the monomeric proteins are assembled first.
APPINetwork removes inter species PPIs, which differentiates it from APID, PSICQUIC and mentha. This can be illustrated using the Elongator (Elp) complex of S. cerevisiae as an example. In the first-order networks built from the six subunits of the Elp complex with APID, PSICQUIC or mentha, one PPI is identified involving a human protein, namely the interaction between the protein ELP3 and the human histone H3.3. Notably, APPINetwork does not take interactions between a protein and another macromolecule into account. For example, according to the PSICQUIC network, the proteins ELP3 and IKI3 interact with the tRNA Glu UUC, but APPINetwork discounts these interactions.
APPINetwork merges all provided PPIs present in public and private PPI databases, so it builds a more complete network than other available tools. For example, by querying the BioGRID database, APPINetwork built a first-order PPI network of the ELP complex with more proteins related to the studied biological process than did APID, PSICQUIC or mentha. The additional identified proteins belong to transcription complexes TFIID, TFIIIB, SPT4-SPT5 and Facilitator of Chromatin Transcription (FACT) complex as well as the ribosome. None of these proteins are represented in the very small network obtained with STRING. Even when the STRING network is extended, it includes additional proteins with functions that do not seem to be coherent with those of the ELP complex proteins.
Using APPINetwork to integrate laboratory PPI data and PPI from public databases into the same network is particularly useful for analyzing the numerous PPIs identified by interatomic platforms. It will result in a more comprehensive network. An additional feature of APPINetwork is that the output contains information on the interactions of the network and the associated publication(s) describing them. This file is convenient for users because all known information on PPIs involving the proteins of interest is easily accessible.
An advantage of APPINetwork is that the user can build a PPI network with particular second-order PPIs, excluding more proteins that are unrelated to the biological process of interest. Moreover, as some proteins have a very many partners (several hundred), there is an option to filter out these partners which tend to strongly bias the clustering of the graph. The resulting clusters will thus be more relevant than when starting from a classical second-order network.
Finally, the first and second-order networks obtained with APPINetwork are provided in files that can be easily exported in other software like Cytoscape (Shannon et al., 2003) allowing them to be visualized and analyzed through other applications.
Conclusion
The APPINetwork package is a tool for PPI network building and analysis involving proteins from numerous biological processes in numerous species or strains. It offers users the choice of using public (experimental or predicted) PPI databases to build the PPI network and to add unpublished PPI data.
It has a user-friendly graphical interface allowing access to the different options for building a network suited to the type of analysis to be carried out. For example, a network built with genetic or predicted interactions, as well as unpublished interactions, could identify more PPIs involved in the studied biological process. A first-order network without self-loops could improve the likelihood of identifying assembly intermediates of a protein complex while a second-order network would identify sets of proteins involved in the same biological process. Other options of the interface allow to choose between the two types of analysis and modify their parameters.
APPINetwork provides the PPI network as a flat file containing the list of PPIs with various information about the interaction and the interacting proteins (PubMed IDs, experimental methods, all identifiers of involved proteins) that can be a very useful resource for biologists. It also provides a text file containing all proteins of each cluster identified by TFit and additional files containing results of the hierarchical clustering modeling the assembly of a complex.
Finally, the APPINetwork package can be freely downloaded from the GitHub repository and comes with a user guide and examples that facilitate its use.